Article

The Effect of Targeted Field Investigation on the Reliability of Axially Loaded Piles: A Random Field Approach

by
Panagiotis Christodoulou
1,
Lysandros Pantelidis
1,* and
Elias Gravanis
1,2
1
Department of Civil Engineering and Geomatics, Cyprus University of Technology, PO Box 50329, Limassol 3603, Cyprus
2
EratosthenesCentre of Excellence, Cyprus University of Technology, PO Box 50329, Limassol 3603, Cyprus
*
Author to whom correspondence should be addressed.
Geosciences 2020, 10(5), 160; https://doi.org/10.3390/geosciences10050160
Submission received: 1 April 2020 / Revised: 26 April 2020 / Accepted: 27 April 2020 / Published: 29 April 2020

Abstract

:
This work deals with the effect of targeted field investigation on the reliability of axially loaded piles, aiming at an optimal serviceability and ultimate limit state design. This is done in a Random Finite Element Method (RFEM) framework properly considering sampling in the analysis; the RFEM method combines finite element analysis with the random field theory. In this respect, the freely available program called RPILE1D has been modified by the authors as to consider sampling of both soil and pile properties. In each RFEM realization, failure is considered to have occurred when the calculated shaft resistance of pile considering spatially uniform properties (average of sampled values from the soil and pile random fields) is greater than the respective “actual” one considering spatially random properties for both soil and pile. The necessary numerical demonstration of the proposed methodology is done by considering two sampling strategies: a) sampling from a single point and b) sampling from a domain, both along the pile, whilst the various parameters governing the statistical uncertainty of the problem are examined; 5383 different cases were considered in total. As shown, a targeted field investigation may minimize or even eliminate the statistical error inserted in the design. The error is quantified by the difference in the probability of failure comparing different sampling scenarios. Another main finding is that the optimal horizontal sampling location occurs where the pile is going to be constructed. In addition, it is shown that the benefit of a targeted field investigation is much greater than the benefit gained using characteristic soil property values.

1. Introduction

Soil media, even the seemingly homogenous ones, exhibit variability by nature; this is known as inherent variability. Soil heterogeneity is an important component in designing geotechnical engineering structures, where the proper soil parameter values need to be determined directly in the laboratory based on undisturbed samples or indirectly based on in-situ tests (usually continuous probing tests such as, the Cone Penetration Test (CPT) or the Standard Penetration Test (SPT)). Recent studies have shown that that the reliability of geotechnical engineering structures is greatly affected by the location and the number of sampling points [1,2,3,4,5,6,7,8,9,10,11,12,13,14,15,16]. This sampling-related uncertainty is commonly known as statistical uncertainty.
Regarding field investigation for designing deep foundations, the current design codes are limited to some general recommendations. For example, EN 1997-2:2007 [17] recommends two to six investigation points per foundation with a minimum depth of investigation below the pile(s) tip z a max { b g , 5   m , 3 D F } . American Association of State Highway Transportation Officials (AASHTO) [18], in turn, refers to Geotechnical Engineering Circular #5 - Evaluation of Soil and Rock Properties [19]. The latter suggests one or two investigation points for substructure widths ≤30 m and 30 m, respectively, and z a max { 6   m , 2 D F } .
The present paper deals with the effect of targeted field investigation on the reliability of axially loaded piles. This is done through an extensive parametric analysis involving 5383 different cases using the Random Finite Element Method (RFEM) [20], properly considering soil sampling in the analysis. The RFEM method combines finite element analysis with the random field theory. The random field analysis that follows deals only with the shaft resistance of piles for the obvious reason that for the effective calculation of the tip resistance of a pile, soil property values referring to the very limited area affected by the tip must be used. The sampling strategy from a single point is first investigated, examining the effect of the spatial correlation length, the maximum allowable settlement, the pile stiffness, the soil stiffness and strength, and the coefficient of variation (COV) of these parameters. The sampling from a domain strategy is then investigated in an analogous manner. The importance of the findings in practice are highlighted in Section 4 and Section 5.

2. Brief Description of the Procedure Followed

The freely available RFEM program RPILE1D (http://www.engmath.dal.ca/rfem) has been extended as to consider sampling of soil and pile property values. The original RPILE1D program is described in detail in Fenton and Griffiths [21], so only a brief description is given here. In this respect, the pile is divided into a series of elements with cross-sectional area, A , and modulus of elasticity, E p . The axial stiffness assigned to the i-th element is the geometric average of the product S p = A E p over the element domain. Also, the soil spring elements, which are attached to the nodes, are characterised by the initial stiffness, S s , and the ultimate strength, U s (bilinear relationship; see [20]). The initial stiffness is a function of soil’s modulus of elasticity, E s , while the ultimate strength is given by the following formula:
U ( z ) = p [ a c u ( z ) + K σ n ( z ) tan ψ ( z ) ]
The ultimate strength is simulated as a single random process due to the uncertainty associated with both empirical coefficients a and K [21]. In the same manner, the soil and pile stiffness ( S s and S p , respectively) are also simulated as random processes. Pile stiffness is considered a random field in the present analysis because although a manmade material, according to experimental studies (e.g., [22,23,24]), the COV of concrete stiffness is as high as 0.1 (a value of 0.3 has also been reported in the literature, e.g., [25]). The COV of timber stiffness is typically in the order of 0.2 (e.g., [26]), timber piles are mentioned here because driven timber piles for foundation purposes are considered in the AASHTO LRFD Bridge Design Specifications [18].
Therefore, the RFEM model consists of pile elements joined by nodes, a sequence of spring elements attached to the nodes (see Figure 1), and three independent 1-D random processes, described as follows:
  • S s ( z ) and U s ( z ) are the spring stiffness and strength contributions from the soil per unit length along the pile respectively, and
  • S p ( z ) is the stiffness of the pile.
The above one-dimensional random fields are assumed to be lognormally distributed [21] having the same spatial correlation length ( θ ) and the same type of correlation function, in this respect, Markovian.
Eventually, the analysis results in the calculation of the load beyond which the given maximum settlement ( δ m a x ) becomes intolerable or the ultimate load that the pile can carry just prior to failure. These two loads correspond to the serviceability and ultimate limit state, respectively (SLS and ULS). The ULS state is defined by the sum of the ultimate strength ( U s ) over all the springs, whilst the calculation of the SLS state is determined by imposing a displacement δ m a x at the top of the pile. In general, the finite element analysis involves the computation of the spring force which yields the prescribed δ m a x .
The RPILE1D program was modified as to:
  • have the function to virtually sample soil stiffness ( S s ) , soil strength ( U s ) , and pile stiffness ( S p ) values from specific points or domains (it is noted that the soil consists of a single material, i.e., there is no stratification; the same for the pile),
  • calculate the average of the sampled values (when the sampling points are greater than one),
  • calculate the resistance of the pile in both the SLS and ULS states, using the sampled value(s) and
  • calculate the failure probability of the pile in either the SLS or the ULS state.
In addition to the above modifications, the base spring has been modified to have the same properties as the lateral ones, meaning that the pile does not rest on firm stratum. The actions referring to the added features 1 to 3 are performed in each RFEM realization.
The validation of the modified program was done as follows. First a given pile was solved with the original RPILE1D program using deterministic property values for all materials. Then, the same pile was solved with the modified program using values sampled from various places along the pile (since the problem is deterministic, all sampled values had the same value). The two programs gave exactly the same results for both the SLS and the ULS states, indicating that the function of sampling was embedded correctly into the original program.
The following definitions are given:
  • the “optimal sampling strategy” refers to the number of sampling points and their location resulting in an optimal design. In an “optimal design” the error due to a non-effective sampling strategy is the minimum possible (i.e., the statistical uncertainty is minimized). The error is quantified comparing the probability of failure ( p f ) obtained by different sampling scenarios. The term “sampling” may refer to undisturbed specimens or to continuous probing test data (e.g., CPT, SPT).
  • In each RFEM realization, “failure” is considered to have occurred when the calculated shaft resistance of the pile considering spatially uniform properties sampled from the soil and pile random fields (average values) is greater than that considering spatially random properties for both the soil and pile.
  • The “probability of failure” is defined by the fraction of the realizations resulting in failure relative to the total number of realizations.

3. Parametric Study for Determining the Optimal Sampling Strategy

In the parametric study that follows, the input data used in the example presented in Fenton and Griffiths [21] are used herein as reference values (see Table 1). The reference pile length ( L ) here is 15 m. It is noted that when no values are mentioned in the text below, the reference values are used.
The influence of the following parameters on the failure probability of the pile has been investigated: the sampling depth ( d p ) referring to a single sampling point or the sampling domain length ( d d ) , both measured from the surface (i.e., the uppermost point of the pile), the pile length ( L ) , the spatial correlation length ( θ ) , the maximum allowable settlement ( δ m a x ) of the pile, as well as the pile stiffness ( S p ) , soil stiffness ( S s ) , and soil strength ( U s ) . The number of realizations for each RFEM model was set to 20,000 because this paper deals with small differences in p f values (this is further discussed in Appendix A). The optimal sampling strategy, which could be a single point or a domain along the pile, is indicated by the minimum failure probability in the p f vs. depth charts.

3.1. Sampling Soil and Pile Properties from a Single Point

3.1.1. Effect of Spatial Correlation Length and Pile Length

The following spatial correlation lengths and pile lengths were considered: θ = 0.1, 0.2, 0.5, 1, 2, 5, 10, and 100 m and L = 10, 15, and 20 m, respectively. It is noted that the number of pile elements considered was always 100 for effectively finding the optimal sampling location; for comparison purposes, in their example, Fenton and Griffiths [21], considered 30 elements for a 10-meter-long pile.
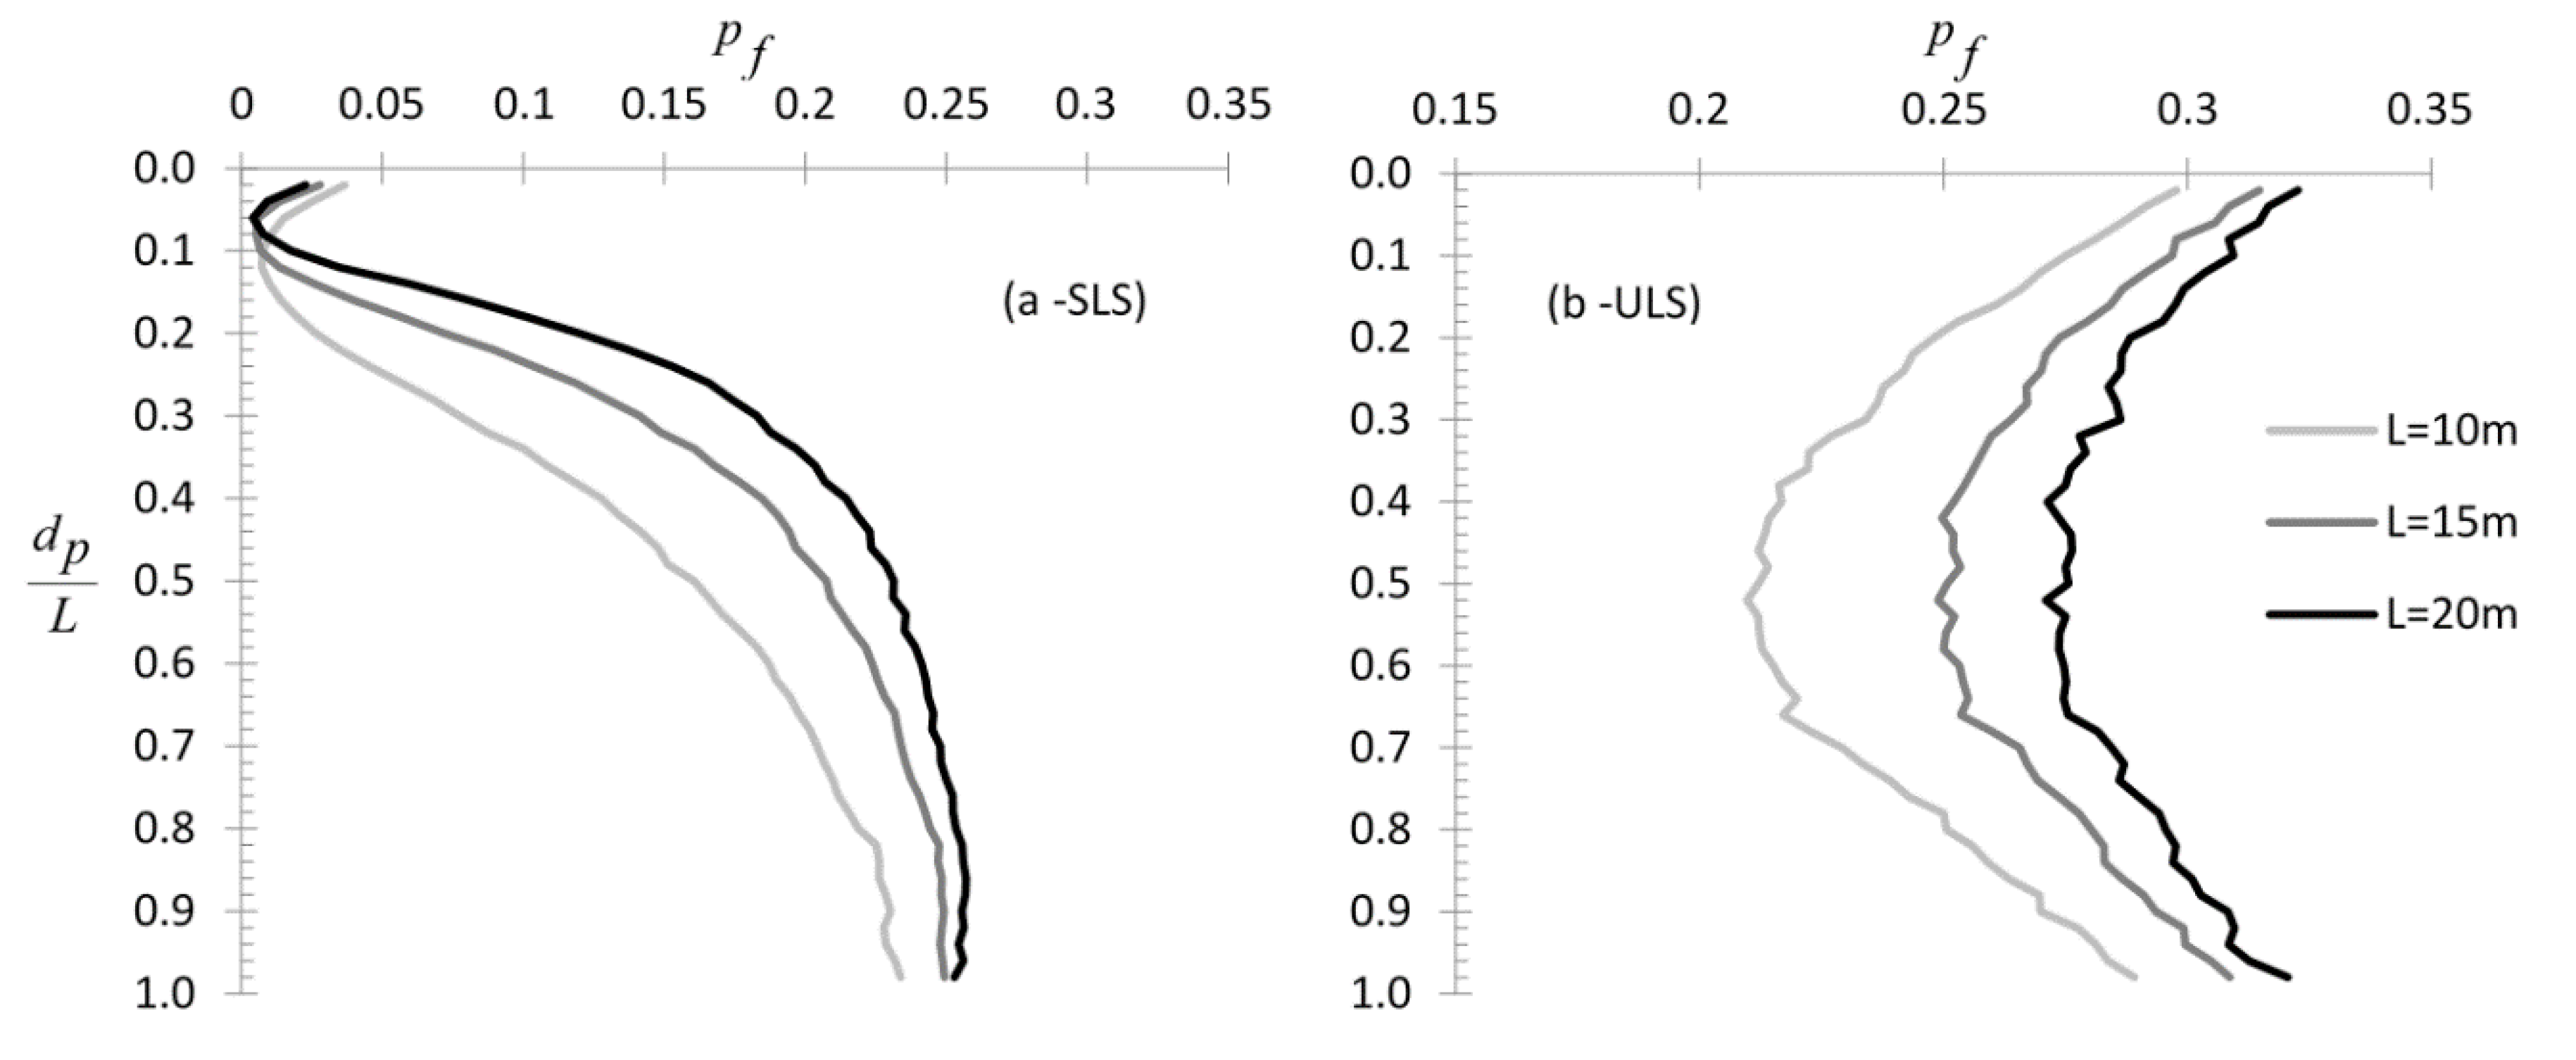
The variation of p f with respect of the scaled sampling depth ( d p / L ) for the various θ and L values is shown in Figure 2. In this paragraph, the pile and soil properties are sampled from the same depth, although the authors admit that sampling from a specific depth of a pile is unrealistic for cast in situ piles.
As shown in Figure 2, the minimum p f value was found near the top of the pile in the SLS state (Figure 2a,c,e) and at the centre in the ULS state (Figure 2b,d,f). It is interesting that there is a worst-case θ value ( θ giving the maximum statistical error), which is different for the two failure states. In addition, in the SLS state, the worst-case θ depends also on the location of the (single) sampling point. For the ULS state, it is observed that for θ ≤ 1, p f is independent of the d p / L ratio (i.e., p f is constant along the pile length). Moreover, in the SLS state, for the high θ values considered in the analysis, the p f vs. d p / L curves present a characteristic minimum near the top. These behaviors are very interesting, and they are further discussed below.
The effect of pile length on p f is shown in Figure 3 for both the SLS and the ULS state. From Figure 3 it is inferred that as L increases, p f also increases (recall the definition of p f in Section 2). Moreover, although for the ULS the minimum p f is always found at the mid-height of pile (Figure 3b), for the SLS, the characteristic minimum in p f is shifted slightly to smaller d p / L ratios as L increases (Figure 3a). Probably the increase in p f with pile length is because the pile is affected by a longer random field. The fact that this increase appears to be smaller and smaller as the pile length increases is attributed to the fact that a long pile (as compared to θ ) meets a repeating pattern for each property.
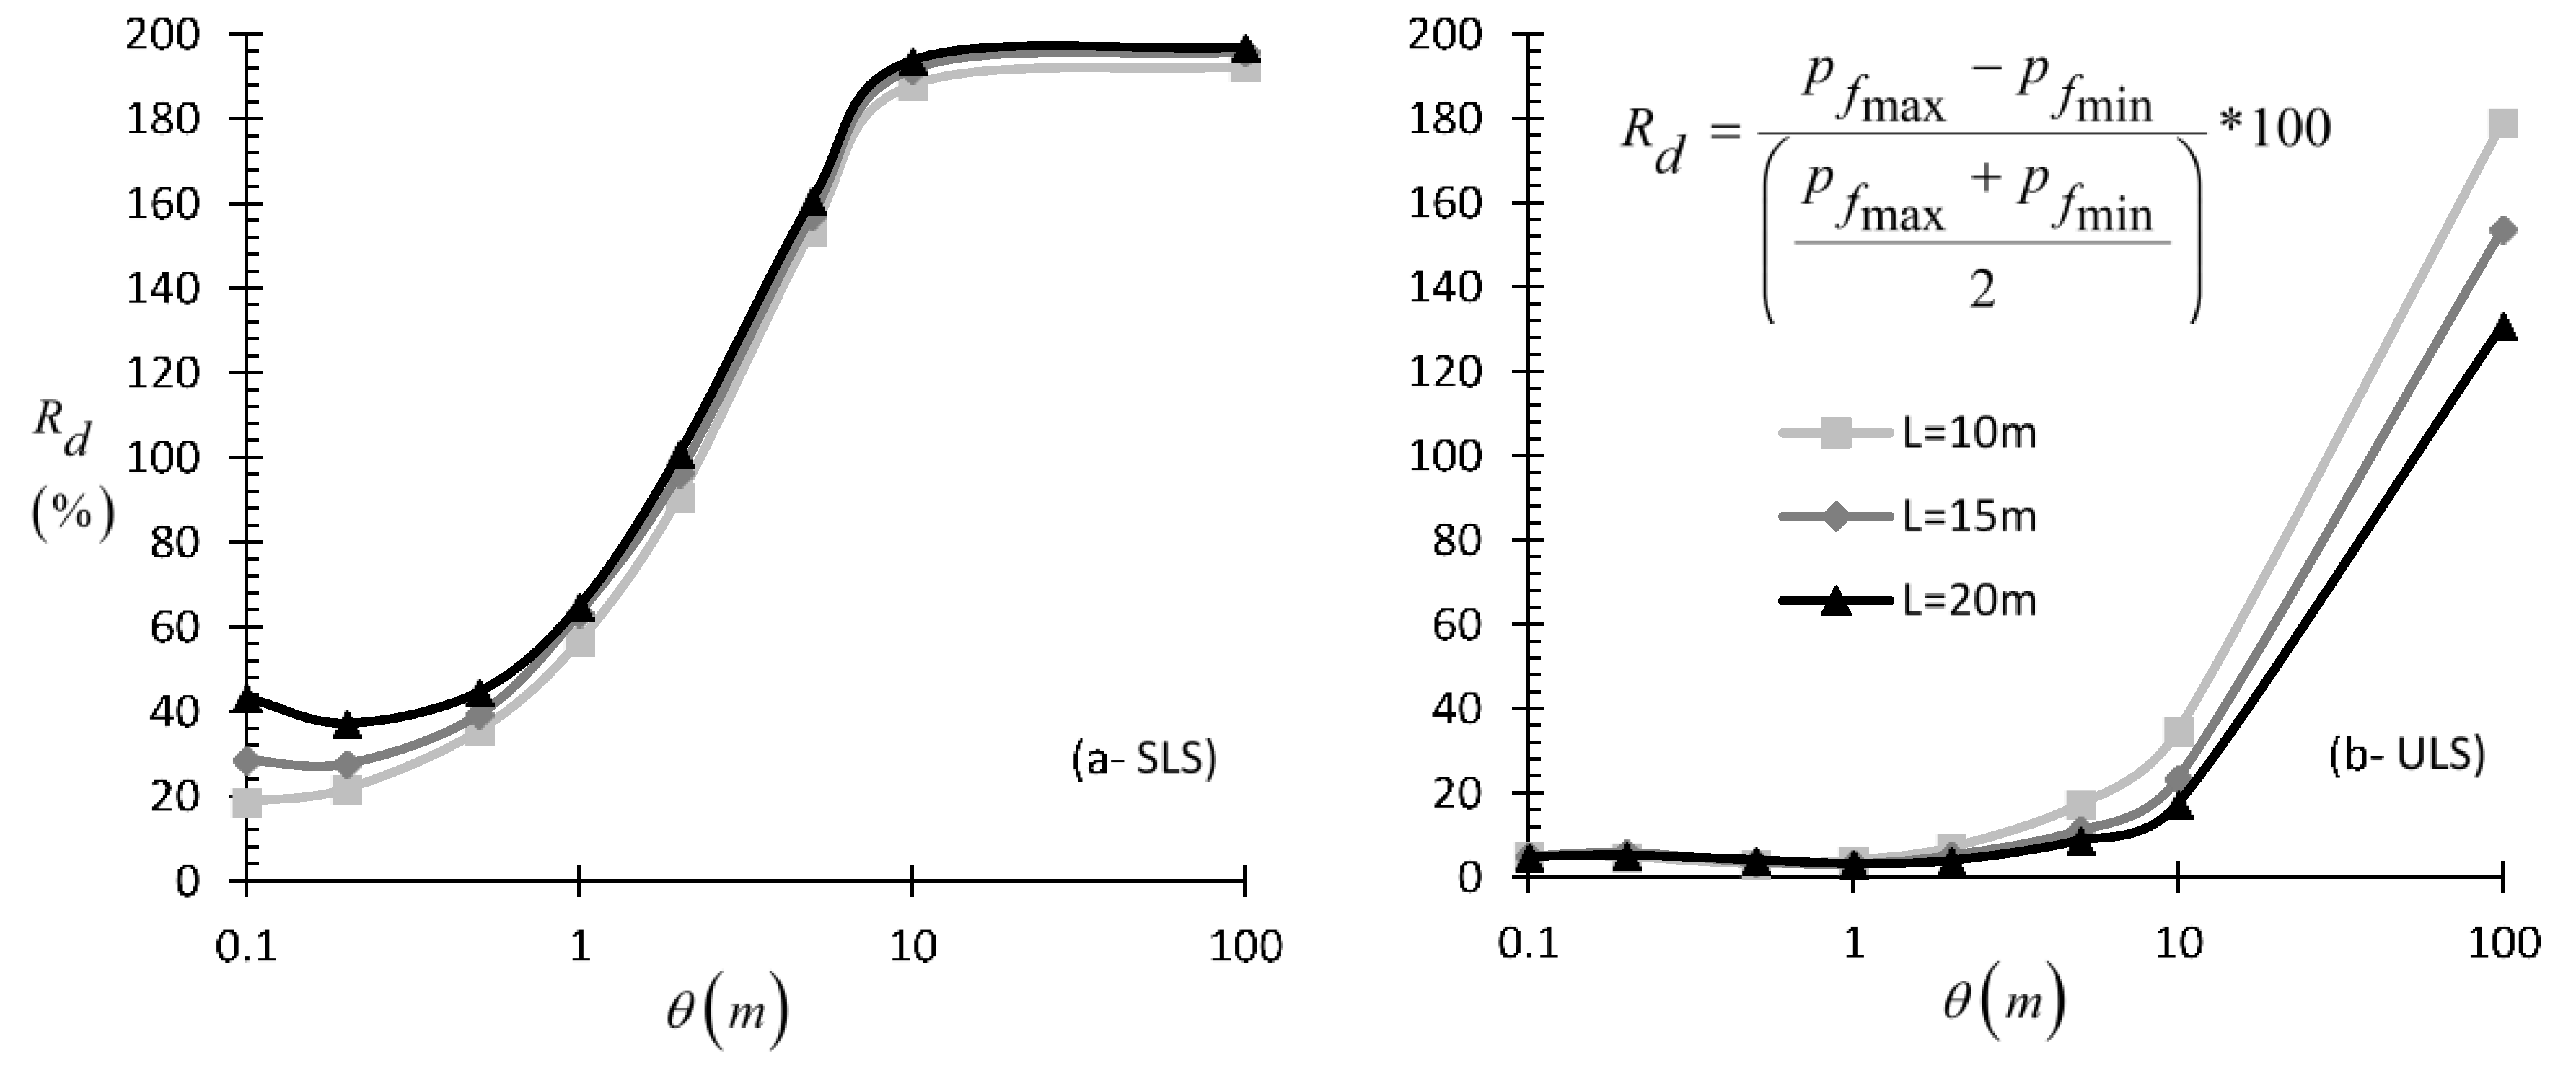
From Figure 2 and Figure 3 it is inferred that for the same pile and soil, the statistical error (expressed by the p f ) may vary significantly when the analysis is based on a single sample taken from different depths. The same is illustrated for both states in Figure 4, using as an index the relative percentage difference ( R d ) between the minimum and maximum p f value; as shown, R d depends strongly on θ .

3.1.2. Effect of δ m a x

The effect of the maximum allowable settlement ( δ m a x ) on the optimal sampling location is examined in a similar way; apparently, this case is relevant only to the SLS state. Different δ m a x values were considered, i.e., δ m a x = 0.025, 0.075, 0.100, 0.150, and 0.250 m. The results are presented in Figure 5a. The analysis was carried out for all input value combinations shown above; however, only the scaled correlation length θ / L = 2/3 case is illustrated here. In brief, it seems that the δ m a x value plays a minor role in the location of the optimal sampling point. Moreover, the fact that the optimal sampling point is near the top is because the pile stiffness considered is relatively small. The authors add that stronger piles (i.e., S p >> S s ) call for sampling from the mid-height of the pile.

3.1.3. Effect of Pile Stiffness ( S p )

The effect of pile stiffness on the sampling strategy is illustrated in the p f vs. d p chart of Figure 5b referring to the S L S state. Various S p values ranging from 103 to 106 kN have been considered, whilst for all p f d p curves, the θ / L ratio was equal to 2/3. From the figure in question it is inferred that the pile stiffness plays a significant role in the selection of the optimal sampling location in the SLS state. More specifically, as S p increases, the p f vs. d p relationship tends to be symmetrical as for the mid-height of the pile; subsequently, the minimum p f tends also to be in the mid-height of the pile as S p increases. On the other hand, as S p decreases, the minimum p f appears to be at shallower depths. This is attributed to the fact that the axially loaded piles of low stiffness (or better, of low S p / S s ratio) deform more near the top, while in very stiff piles, the strain is distributed more evenly along their length. One should bear in mind that excessive deformation near the top may cause either the pile or the soil to fail without influencing the underlain pile–soil system. Thus, the fact that the case of weak piles results to very low p f values in the SLS state is only fictitious. In reality, piles have much greater stiffness than the surrounding soil, and thus, a failure of this kind is not possible. For the ULS state the optimal sampling location always lies at the mid-height of pile, exhibiting, in general, behaviour such as the respective one observed in Figure 2.

3.1.4. Effect of Soil Stiffness ( S s )

The effect of soil stiffness ( S s ) on the optimal sampling location has also been examined. In this respect, a number of p f vs. d p curves for the SLS state were drawn for various S s values ranging from 10 to 500 kN/m/m (Figure 5c). Generally, it can be said that the soil stiffness affects the sampling location in a way similar to pile stiffness (see the previous paragraph), apparently because it is the relative difference between S s and S p that controls the behavior of the soil–pile system and not their absolute values.

3.1.5. Effect of Soil Strength ( U s )

The parametric study on the effect of soil strength on the optimal sampling point for both SLS and ULS states revealed that the U s value does not affect the sampling strategy; U s values ranging from 5 to 150 kN/m were examined. Although the findings indicate that the soil strength from the parametric analysis point of view considering different mean U s values (while all other parameters were kept constant) does not affect the optimal sampling location, this is not absolutely true. The effect of soil strength on the sampling strategy should be better interpreted in relation to the effect of soil stiffness (see Section 3.1.4), because as known, soils of high strength present high stiffness and vice versa.

3.1.6. Effect of COV of Pile Stiffness ( S p ) , Soil Stiffness ( S s ) , and Soil Strength ( U s )

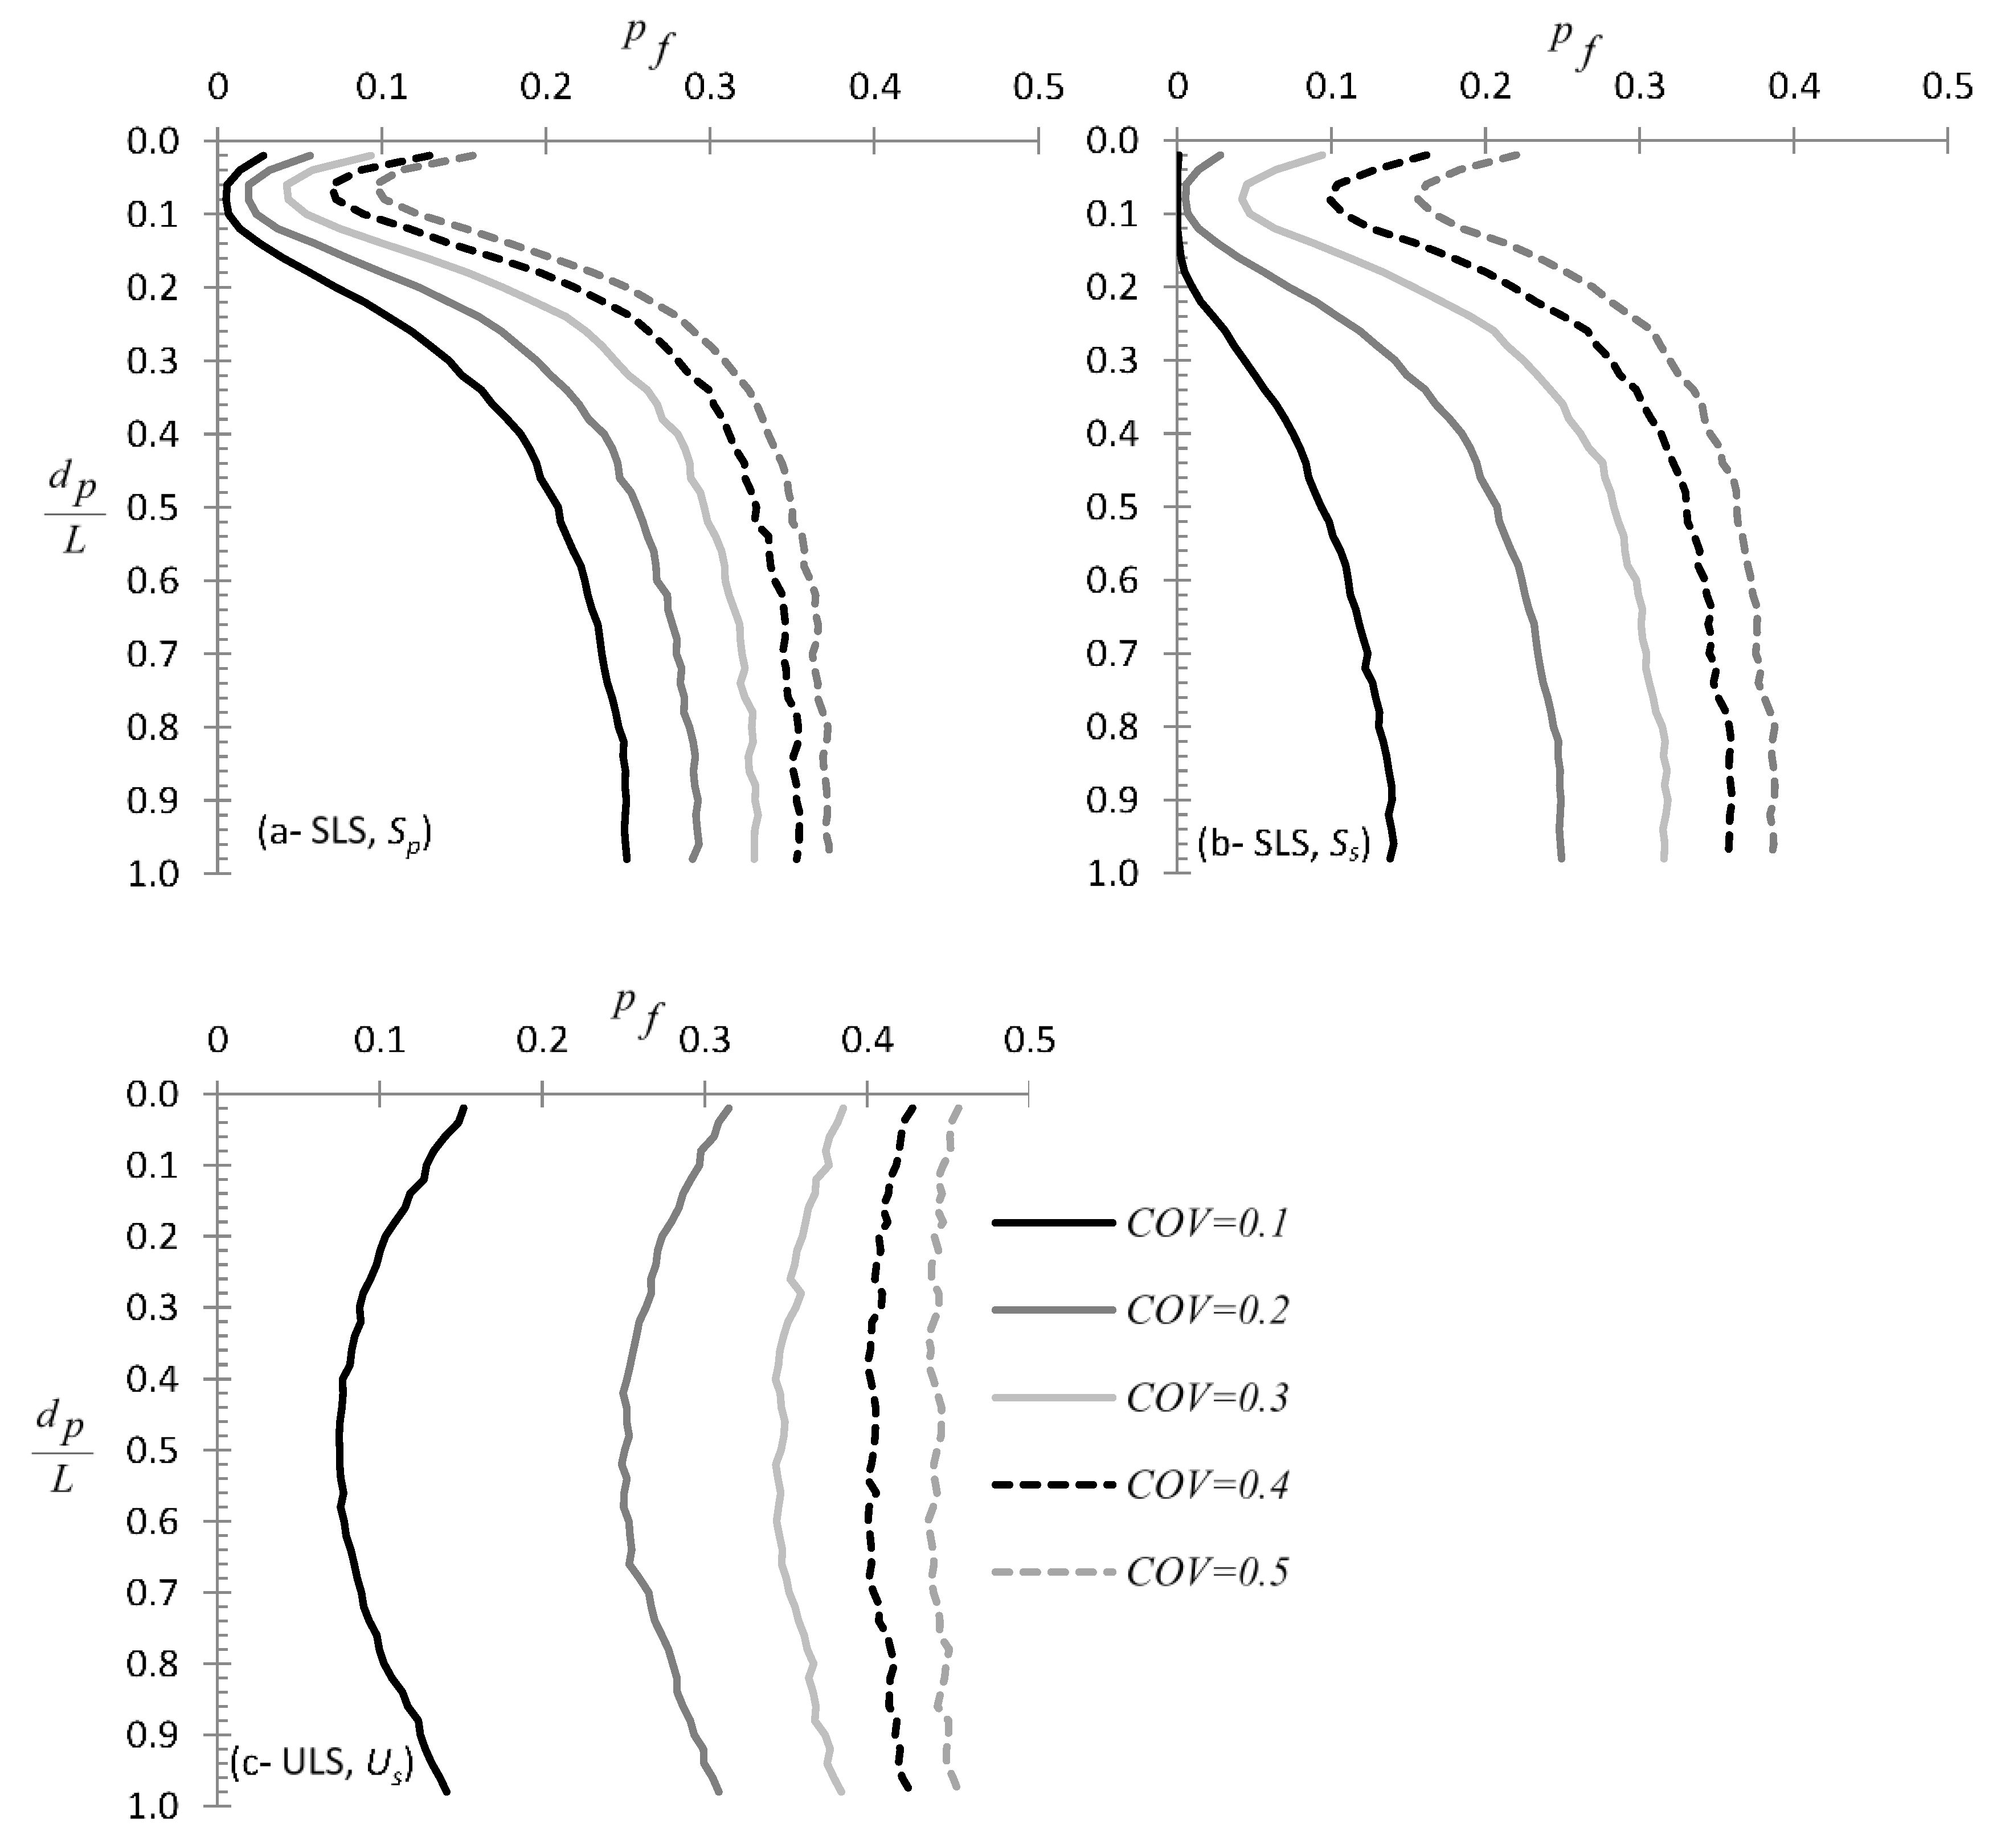
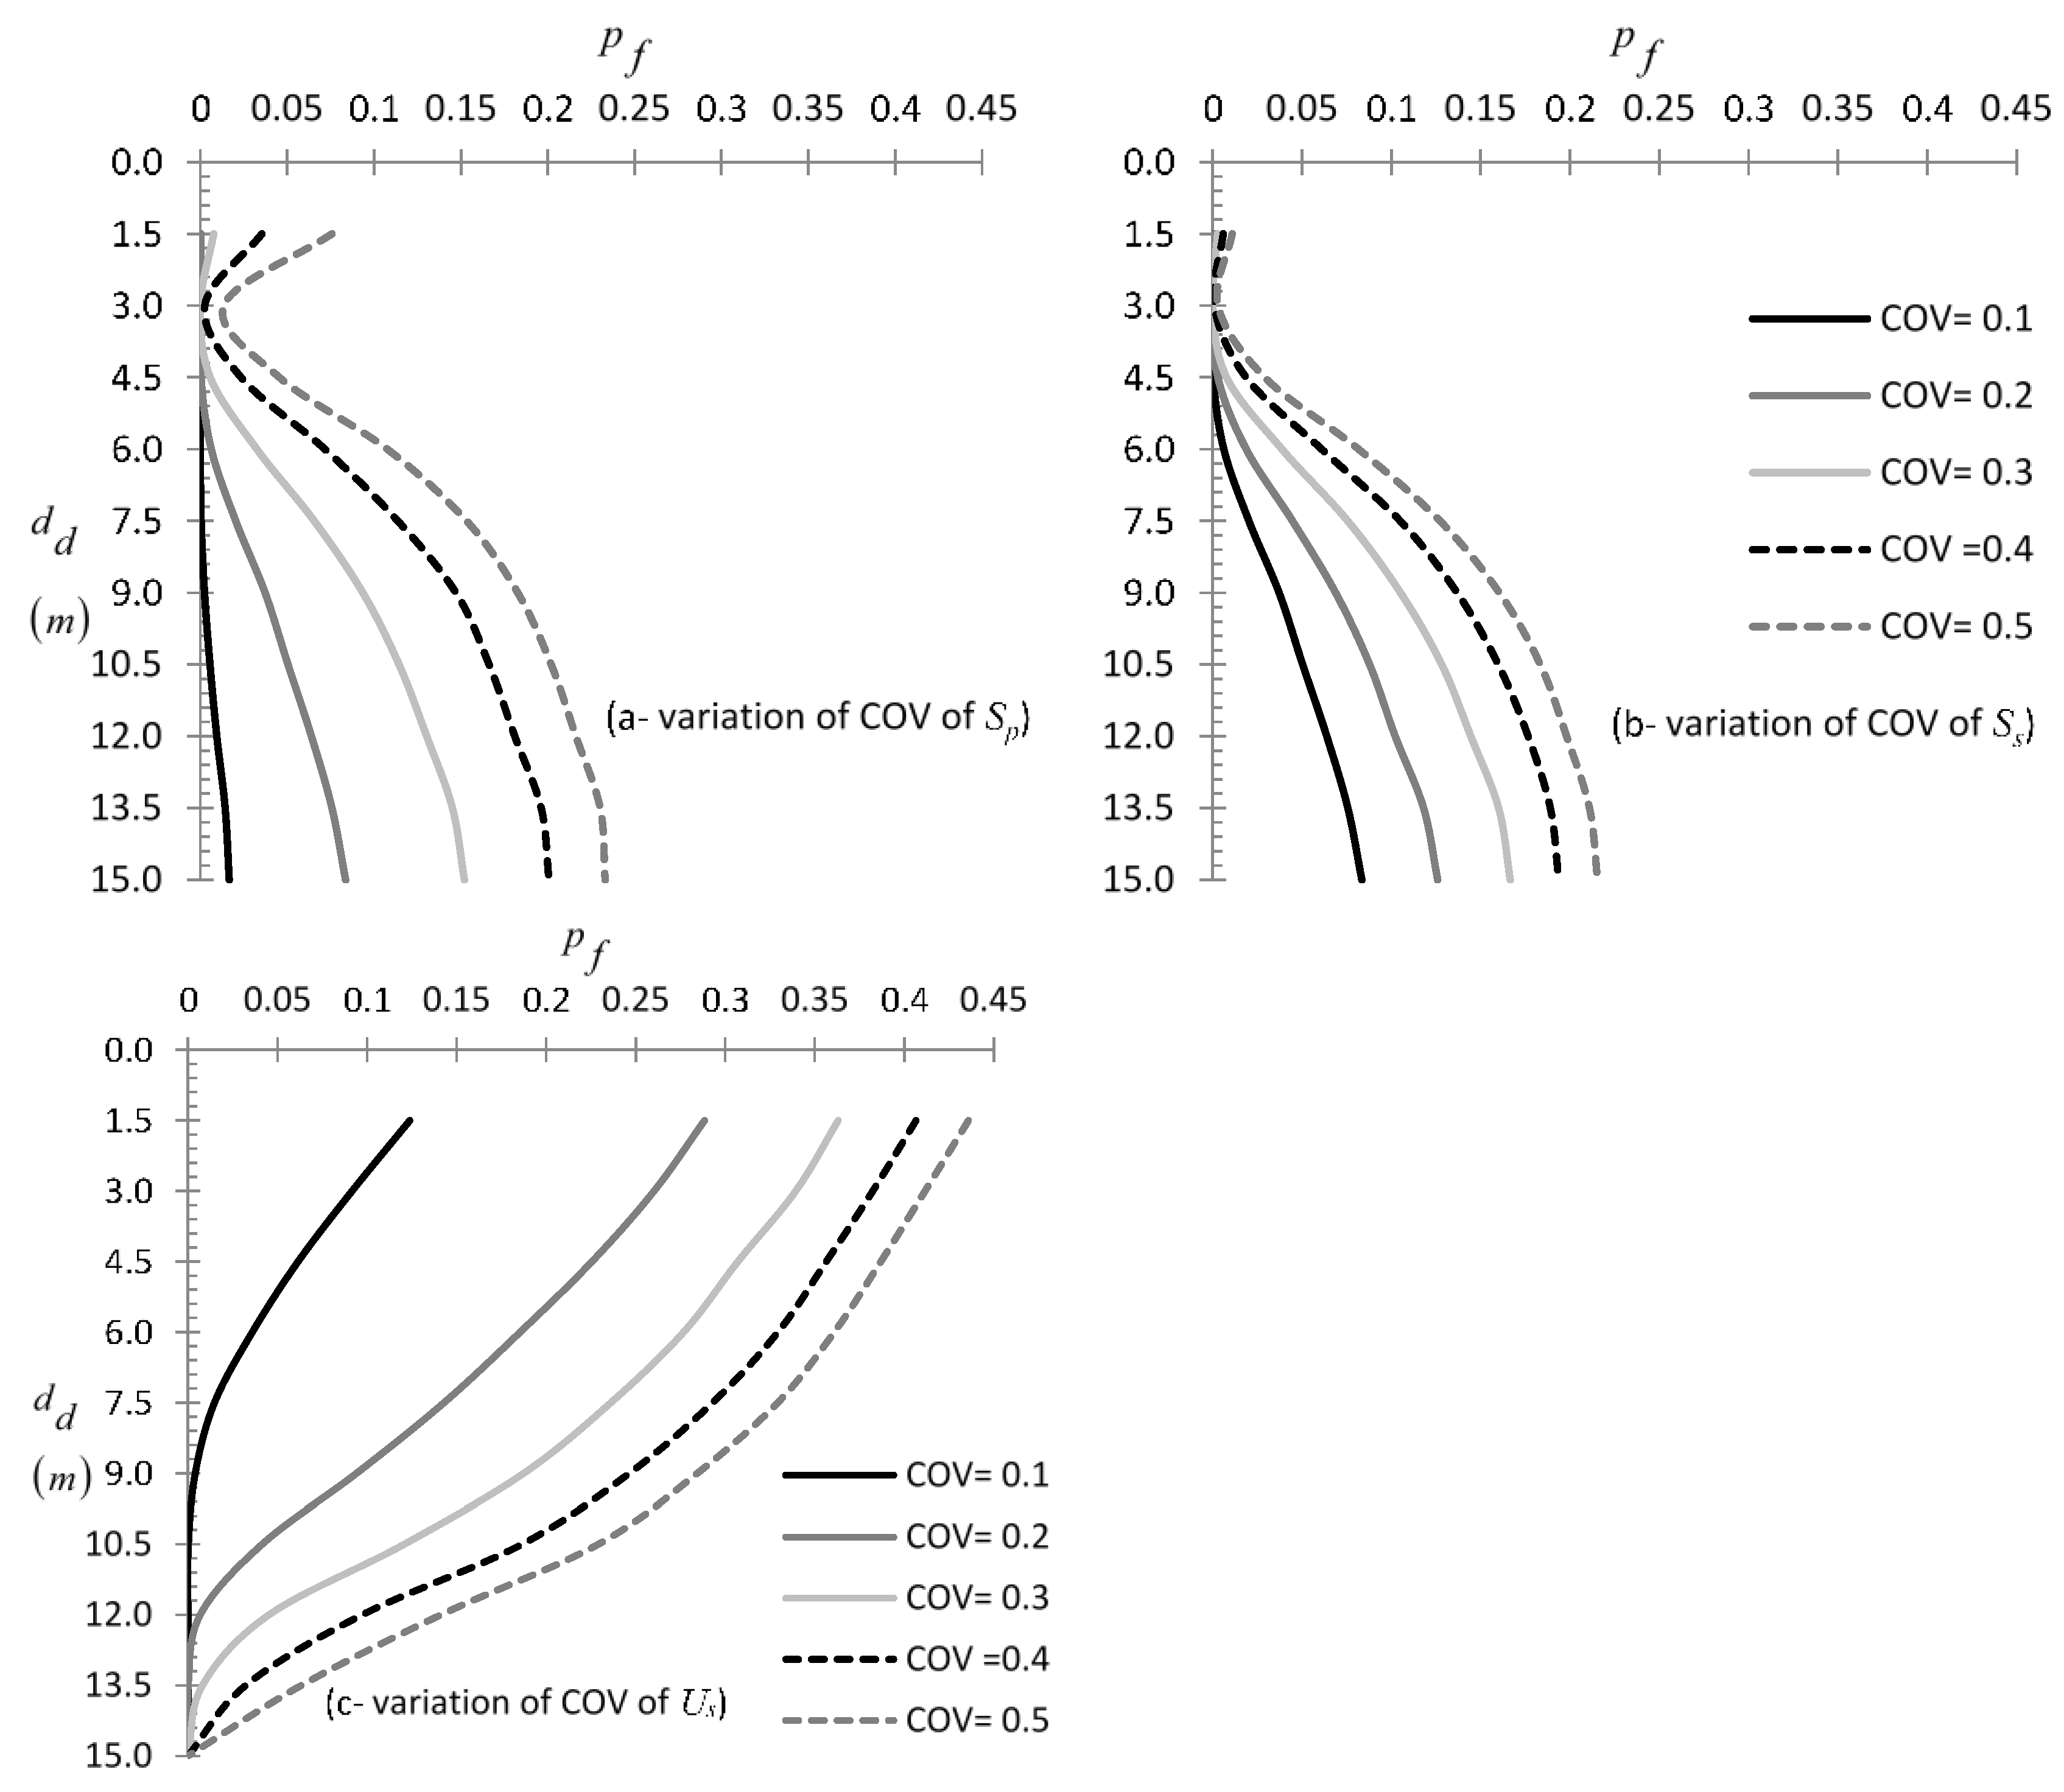
In this paragraph, the effect of COV of S p , S s , and U s on the optimal sampling location was examined for different COV values, i.e., COV= 0.1, 0.2, 0.3, 0.4, and 0.5 with θ / L being equal to 2/3. The results are presented in Figure 6. From the figure in question it is inferred that the statistical error is largely affected by the coefficient of variation of the various parameters. However, there is no influence on the location of the optimal sampling point.

3.2. Sampling Soil and Pile Properties from a Domain

In this sampling strategy, sampling domains are chosen as fractions of the total pile length, L . All sampling domains are extended from the uppermost point of the pile to a certain depth; thus, the maximum sampling domain is equal to the total length of the pile. An incremental domain length of 0.1 L was chosen in the analysis. The effect of pile stiffness ( S p ) , soil stiffness ( S s ) , and soil strength ( U s ) on p f of pile is examined separately below.

3.2.1. Effect of Pile Stiffness ( S p )

The effect of pile stiffness on the sampling strategy for the SLS state is shown in the p f vs. ‘sampling domain length’ ( d d ) charts of Figure 7a. Generally, from this figure it is inferred that for the usual case where S p >> S s , the longer the sampling domain, the smaller the statistical error. Indeed, this error can be reduced to zero by exploiting the probing test data (e.g., CPT or SPT) along the entire pile length. The same conclusion stands for any θ value (e.g., see Figure 7b).
Regarding the ULS state, it was found that the optimal sampling domain length is independent of the pile stiffness, since for any S p value, the same p f d d curves shown in Figure 7e are obtained. By considering, however, the entire pile length, the statistical error is reduced to zero.

3.2.2. Effect of Soil Stiffness ( S s )

Generally, it stands what has been written for the case of S p (Section 3.2.1)). The effect of S s on the sampling strategy is shown in Figure 7c,d,f. Regarding the SLS state, from Figure 7c,d it is inferred that for the usual case of S p >> S s , the longer the sampling domain, the smaller the statistical error. For small S p / S s ratios, that is, for relatively weak piles, the optimal sampling domain length is very short, indicating a possible failure near the surface. Regarding the ULS state, it was found that the optimal sampling domain length is independent of S s ; indeed, for any S s value, the same p f d d curves shown in Figure 7f are obtained.

3.2.3. Effect of Soil Strength ( U s )

The parametric study on the effect of soil strength on the optimal sampling domain length for both SLS and ULS states revealed that the U s value does not affect the sampling strategy (see also Section 3.1.5)).

3.2.4. Effect of δ m a x

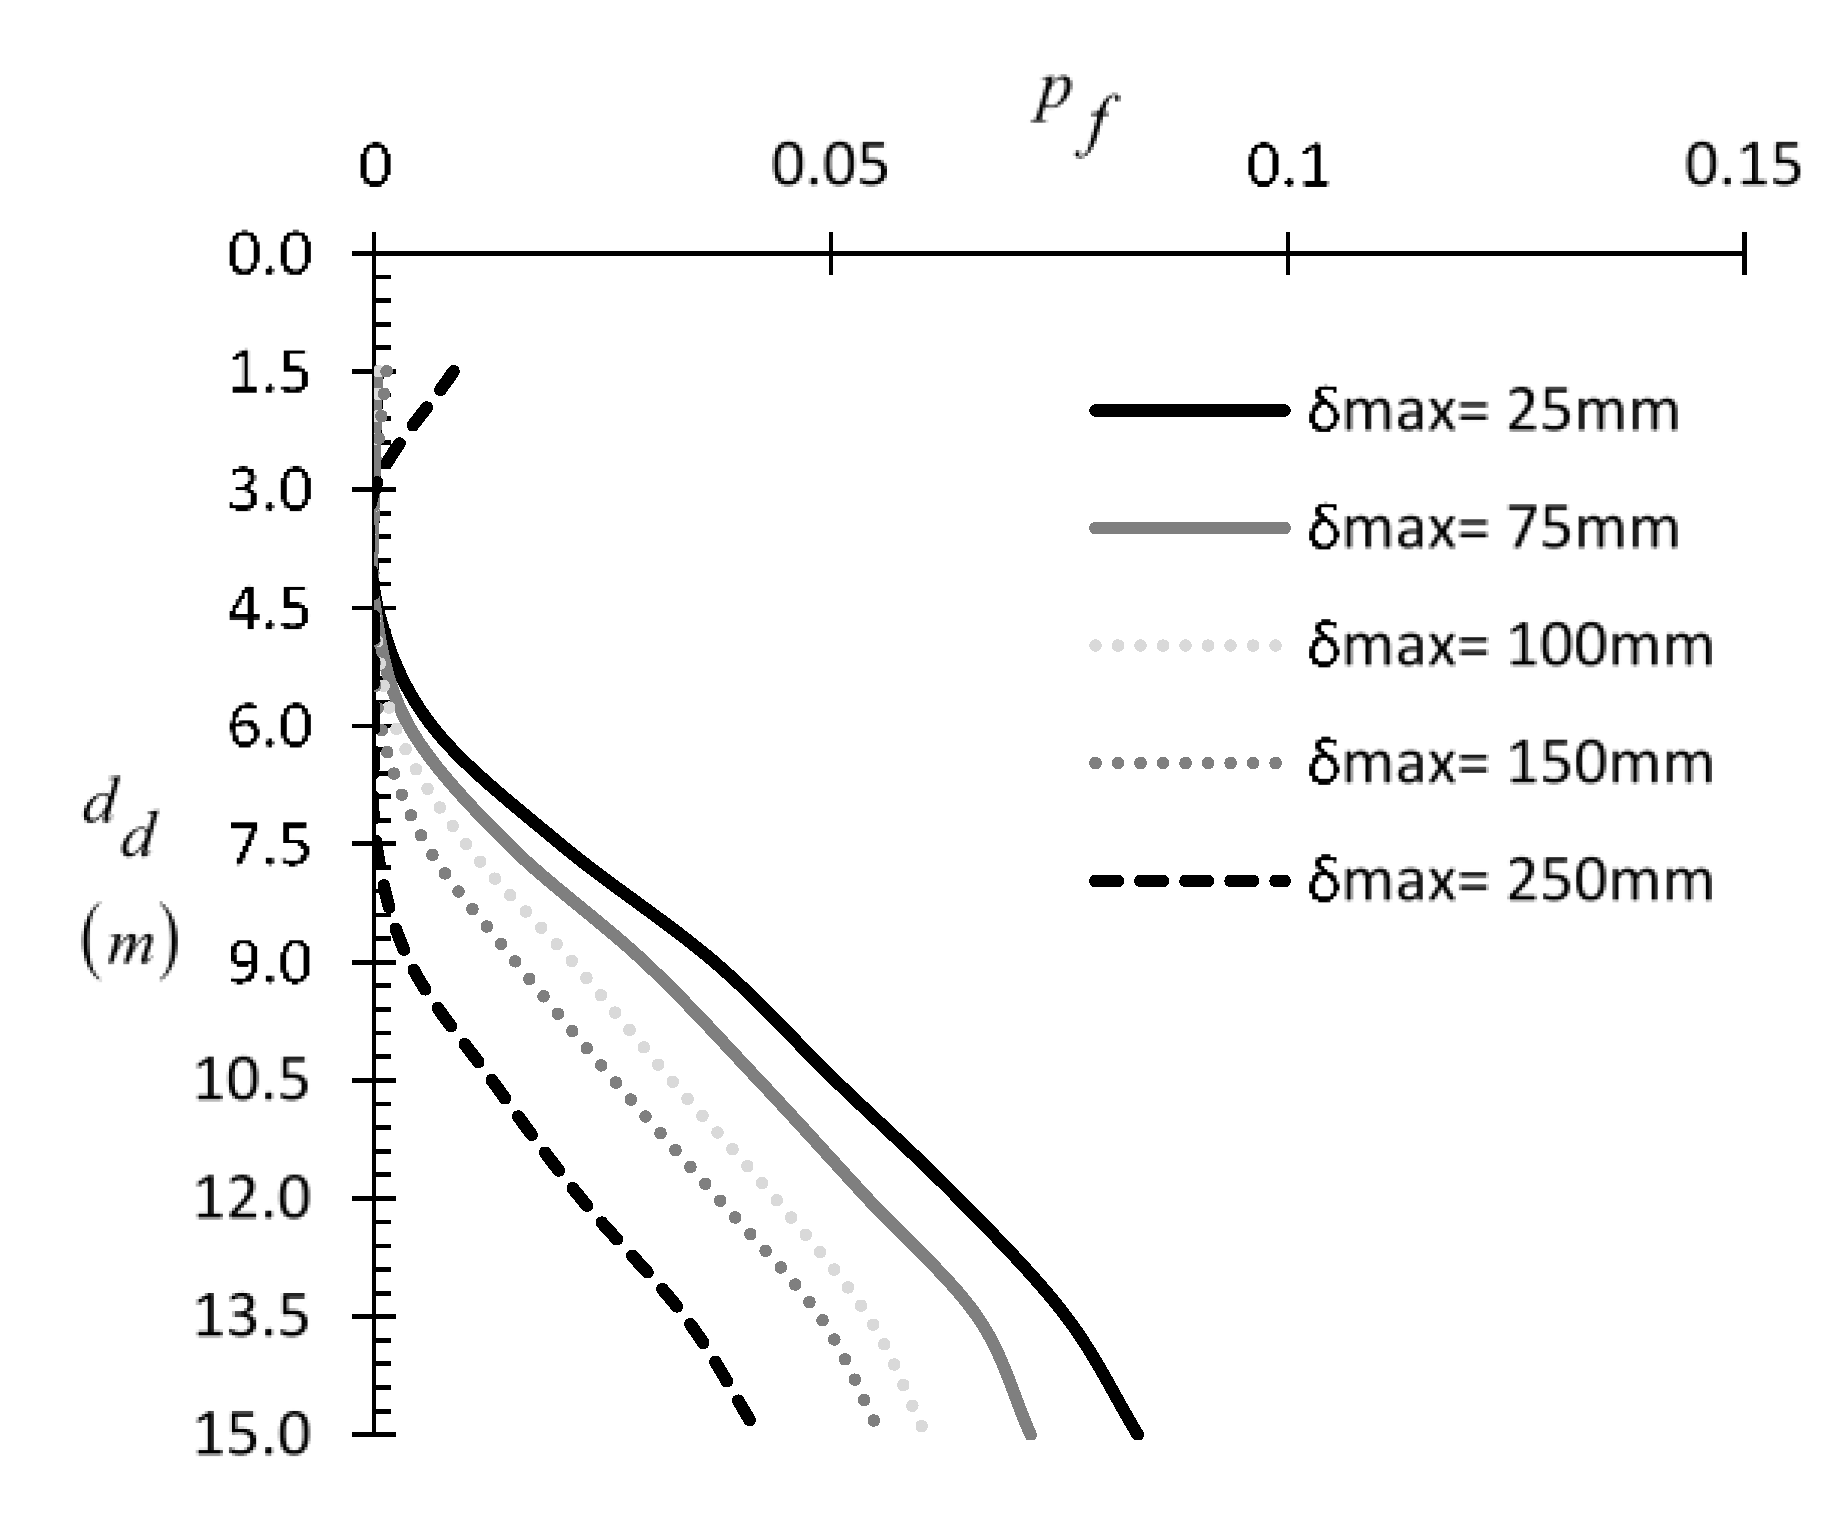
The effect of the maximum allowable settlement ( δ m a x ) on the optimal sampling domain is shown in Figure 8; for the obvious reason, this case is relevant only to the SLS state. Different δ m a x values were considered, i.e., δ m a x = 0.025, 0.075, 0.100, 0.150, and 0.250 m, while the curves in Figure 8 refer to θ / L = 2/3. In brief, it seems that the δ m a x value plays a rather minor role in the location of the optimal sampling point. Moreover, the fact that the optimal domain length ranges between L / 5 and L / 3 is because the pile stiffness considered is relatively small. Stronger piles with S p >> S s call for d d values equal to the entire pile length.

3.2.5. Effect of COV of Pile Stiffness ( S p ) , Soil Stiffness ( S s ) , and Soil Strength ( U s )

In this paragraph the effect of COV of S p , S s , and U s on the optimal sampling domain length was examined for different COV values, i.e., COV = 0.1, 0.2, 0.3, 0.4, and 0.5 with θ / L being equal to 2/3. The results are presented in Figure 9. From the figure in question it is inferred that the statistical error is largely affected by the coefficient of variation of the various parameters. However, the influence on the optimal sampling domain length is rather minor.

4. The Importance of Targeted Field Investigation in Practice

A random material field referring to a specific RFEM realization, such the two realizations presented in Figure 10 (light areas correspond to lower friction angles and vice versa), convincingly represents a real field. For the two examples presented here, the various values for the parameters used are summarised in Table 2; both soil materials are assumed cohesionless, whilst the unit weight of soil is considered constant throughout the soil mass.
As known, the shaft resistance of piles is given by the following equation:
Q s = ( 2 π R ) L ( K σ ¯ ο tan δ )
where, R and L are the radius and length of the pile, respectively, σ ¯ ο is the average effective overburden pressure, K is the coefficient of earth pressure, and δ is the soil–pile friction angle. For bored, cast in-situ piles, K = Ko= 1 sin ϕ [27] and δ / ϕ = 0.98 [28]. Rearranging the terms in Equation (2), after making the relevant substitutions:
Q s ( 2 π R ) L σ ¯ ο = ( 1 sin ϕ ¯ ) tan ( 0.98 ϕ ¯ ) = Λ
Thus, for a given bored pile (expressed by the dimensions L and R) and deterministic unit weight of soil, the shaft resistance of pile is directly analogous to the term shown on the right-hand side of Equation (3). ϕ ¯ is the mean of the values sampled (values derived from an empirical correlation with CPT tip resistance data).
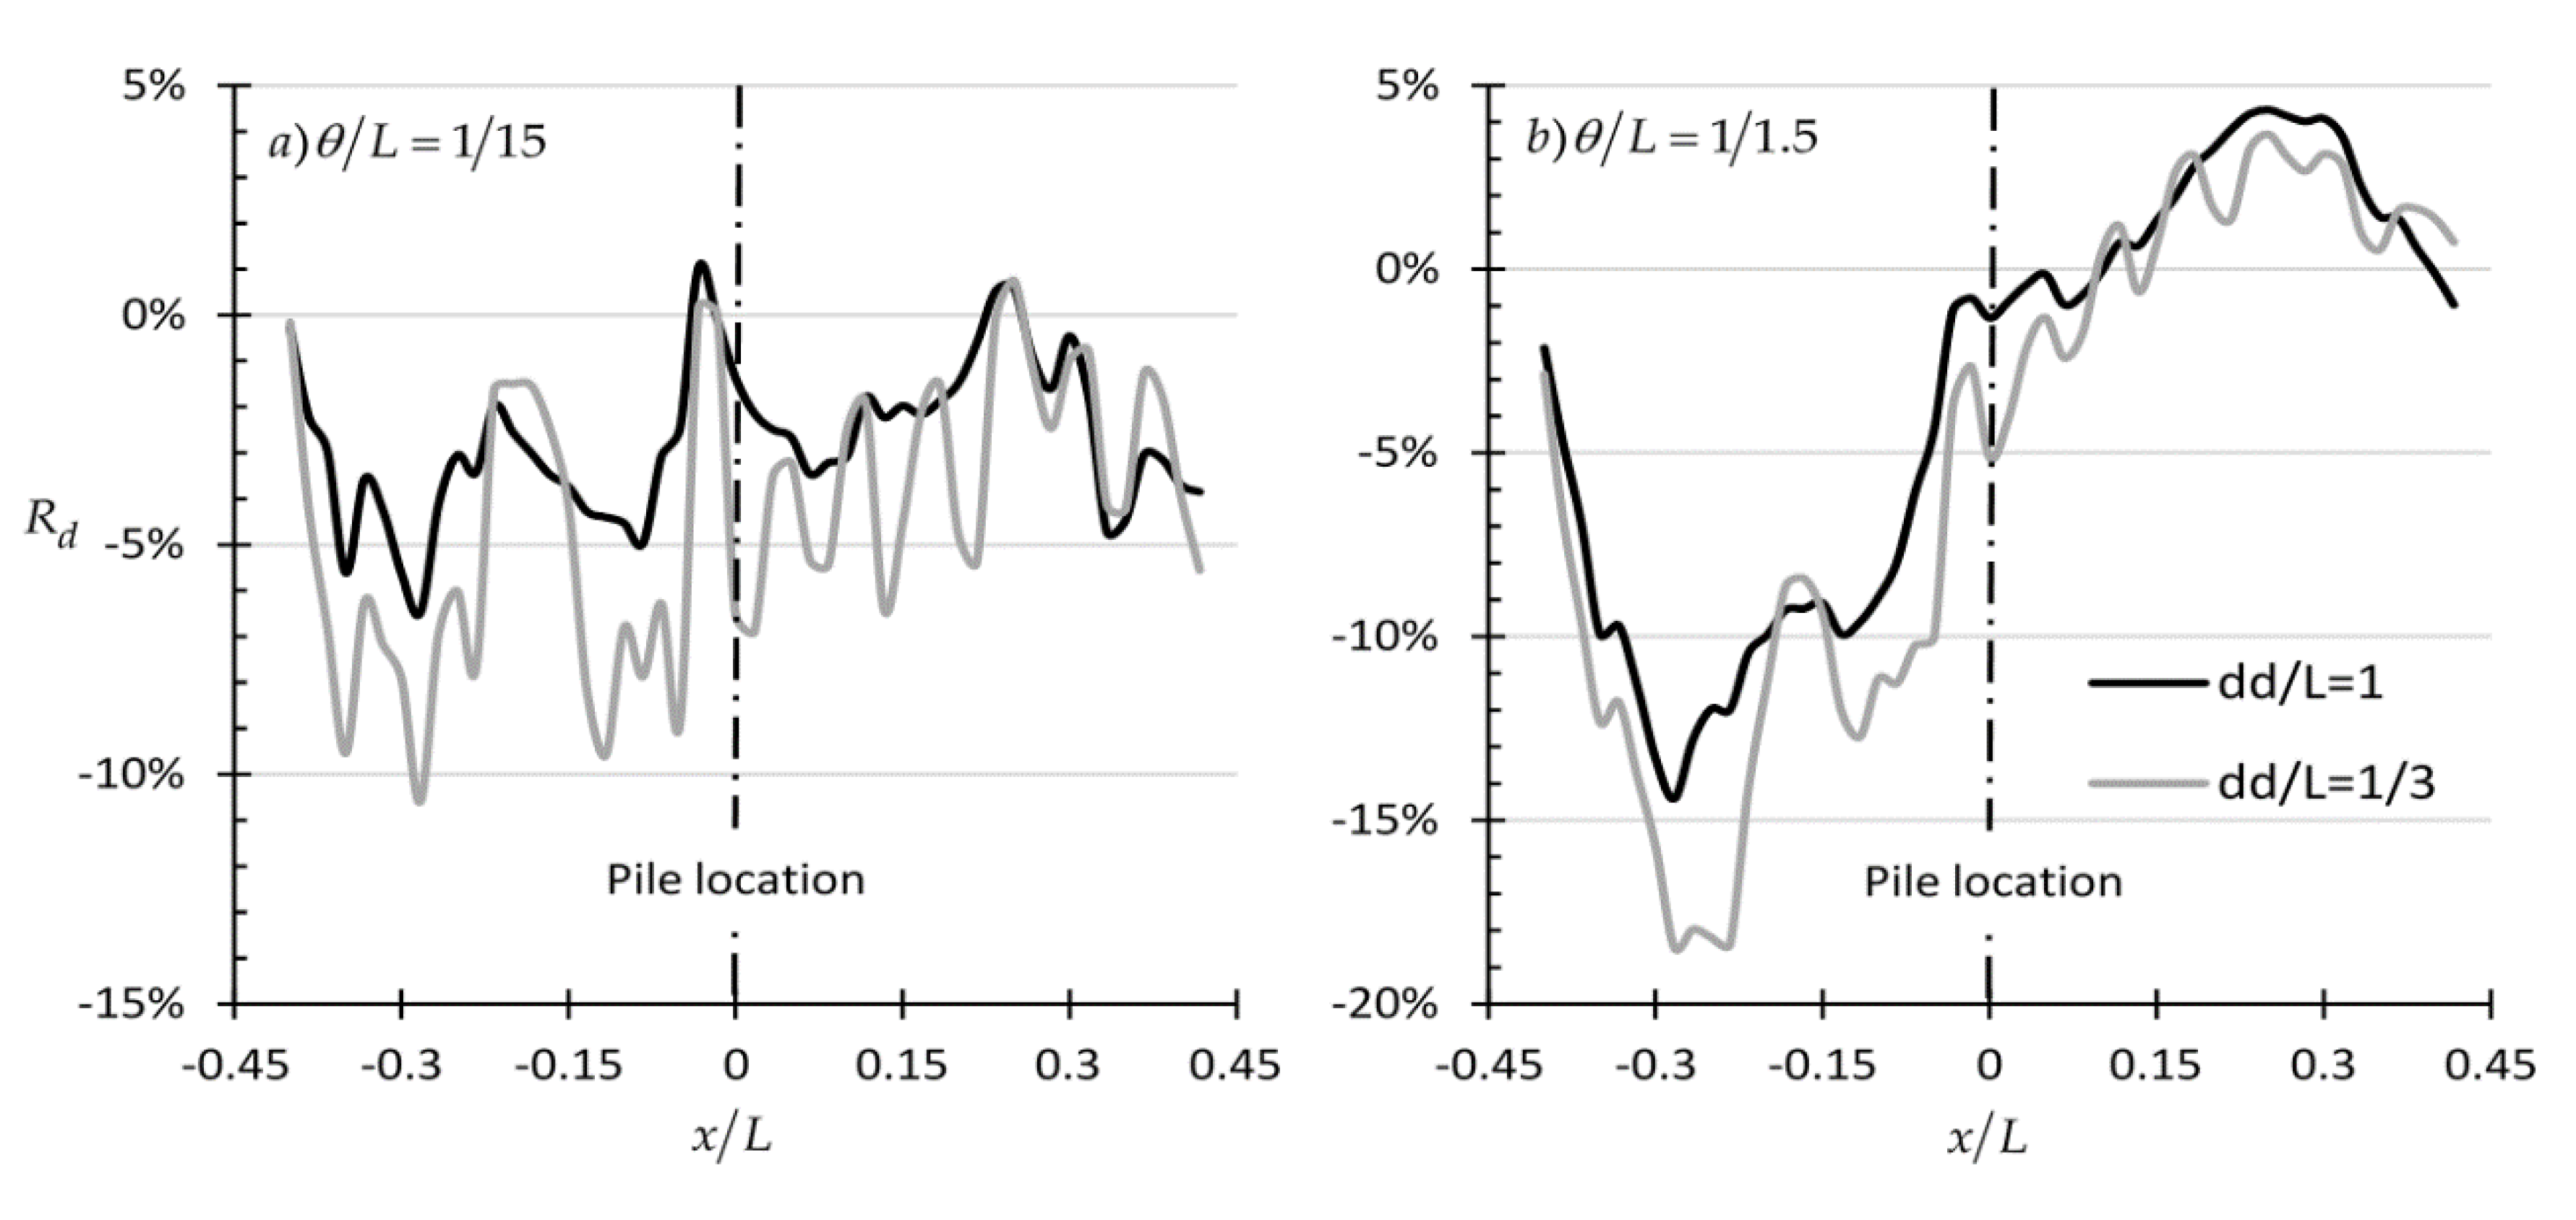
Using for reference ϕ ¯ value, the value corresponding to the entire length of the pile at the location where the pile is going to be constructed (x/L = 0), the relative difference Rd ( = Λ/Λref-1) versus x/L charts of Figure 11 were drawn. These figures refer to the specific realizations given in Figure 10, which have been randomly chosen.
From Figure 11 it is inferred that not only does the sampling domain length strongly affect the statistical error but also the location (in plan-view) of sampling. Also, it is mentioned that the decrease and increase of the Rd values in Figure 11b around x/L= −0.25 and 0.25, respectively, are due to the existence of a weak (elements) and a strong area (light and dark elements, respectively) at these locations (see Figure 10b).

5. Designing with the Limit State Method

While North America [18,29,30,31] uses the mean of the measured values for each soil property, Eurocode 7 [32] relies on “characteristic” values. For Eurocode 7, the characteristic value of a geotechnical parameter is “a cautious estimate of … the mean of a range of values covering a large surface or volume of the ground”; “if statistical methods are used, the characteristic values should be derived such that the calculated probability of a worse value governing the occurrence of the limit state under consideration is not greater than 5%.” In this respect, the following statistical equation is often used for the calculation of the characteristic value [33,34]:
X k = X m t a ; v s S d n
The effectiveness of the “characteristic value” concept in designing an axially loaded pile is illustrated in the two example charts of Figure 12 (same as Figure 11 but with characteristic values). From Figure 12 it is clear that the benefit of a targeted field investigation is much greater as compared to the benefit gained using characteristic values. Moreover, despite the conservatism which is inserted in the analysis using the characteristic value concept, the characteristic values alone, as shown, cannot guaranty a sufficiently conservative engineering study [3].

6. Summary and Conclusions

This work deals with the practical problem of the effect of targeted field investigation on the reliability of axially loaded piles, aiming at an optimal design. In this respect, the freely available Random Finite Element Method (RFEM) program called RPILE1D has been modified by the authors as to consider the sampling of both soil and pile properties. Two sampling strategies were considered, namely, sampling from a single point and sampling from a domain, both along the pile, whilst the various parameters governing the statistical uncertainty of the problem were examined.
The analysis showed that statistical uncertainty in designing axially loaded piles can be very high and that statistical error is not necessarily reduced by increasing the number of sampling points considered. Indeed, the opposite may happen. As shown, the statistical error can be minimized or even eliminated by adopting the proper sampling strategy (defined by the number and location of sampling points along the pile). Even the characteristic values of materials when designing in a limited state analysis framework (e.g., Eurocode 7) cannot guaranty a sufficiently conservative engineering study. Indeed, the benefit from a targeted field investigation is much greater.
Based on the results of the extensive parametric analysis carried out, the following conclusions are drawn:
  • When continuous probing test data are used and the pile stiffness is much greater than the stiffness of the surrounding soil, the entire pile length is advised to be taken into account both in the S L S and the U L S state, as shorter sampling domain lengths may result in high statistical error.
  • Weak piles, such as timber piles, require much shorter domain lengths (measured from the top), as longer sampling domains may increase the error.
  • When the design is based on sampling points and not on continuous probing test data, the best practice for minimizing the statistical error is sampling from the mid-height of the pile in both S L S and U L S states.
  • When the pile is relatively weak, the optimal sampling point for the S L S state lies near the top of the pile. For the U L S state, the optimal sampling point lies at the mid-height of pile, for any pile stiffness.
  • The optimal sampling location in plan-view is the actual location of each pile; by sampling away from this location, high statistical error may be introduced in the analysis.
Finally, it is important to be mentioned that the present research refers to a pile surrounded by soil of the same material (layer). In the case of stratified media (currently under investigation by the authors), the findings must be interpreted according to the needs of the project. Moreover, it is assumed that the piles do not interact with adjacent piles. (i.e., “group efficiency” of pile [28] equal to 1). The authors believe that any loading transferred by the surrounding soil due to downdrag upgrades the role of the lowermost parts of soil around the pile. Of course, this depends on the number of piles, the space between the piles, and the type of soil (clay or sand). Also, in projects involving a great number of piles, exploring each and every pile location is probably not a realistic practice. The present analysis could be applied to the most unfavorable locations identified on geotechnical cross-sections. For effectively drawing such cross-sections capturing the randomness of soil, the spacing between the exploration points should be carefully determined. This depends on the spatial correlation length of soil; roughly, the correlation length of soil in the vertical direction is 10 times smaller than the respective correlation length in the horizontal direction [35,36,37,38,39]. In this respect, the authors [40] have recently offered a comparative assessment of the effectiveness of eight methods-of-moments for estimating the correlation length.

Author Contributions

Conceptualization, L.P.; methodology, P.C. and L.P.; software, P.C.; validation, E.G.; formal analysis, P.C.; writing—original draft preparation, P.C.; writing—review and editing, P.C., L.P., and E.G.; visualization, P.C.; supervision, L.P. and E.G. All authors have read and agreed to the published version of the manuscript.

Funding

This research was funded by the Cyprus University of Technology, grant number EX-20081.

Acknowledgments

This work was supported by the Cyprus University of Technology [grant number EX 20081].

Conflicts of Interest

The authors declare no conflict of interest.

Notation List

Apile cross-sectional area
b g smaller side of the rectangle circumscribing the group of piles forming the foundation at the level of the pile base
COVcoefficient of variation
D f pile base diameter
d d sampling domain length measured from the uppermost point of the pile
d p depth of the sampling point
E p modulus of elasticity of the pile
E s soil’s modulus of elasticity
K earth pressure coefficient
K 0 coefficient of earth pressure at rest
L pile length
n number of samples
p perimeter of the pile
p f probability of failure of the pile
p f max maximum probability of failure of the pile
p f min minimum probability of failure of the pile
Q s shaft resistance of the pile
Rpile radius
R d relative percentage difference
S L S serviceability limit state
S p pile stiffness
S s soil stiffness
S d sample standard deviation
t a ; v s Student’s t factor for a confidence level of α% in the case of v s degrees of freedom
U L S ultimate limit state
U s soil strength
x location where the pile is going to be constructed
X k characteristic value
X m sample mean
Z a depth of investigation below the ground level
α empirical adhesion factor
a c u ( z ) adhesion at depth z
δ soil–pile friction angle
δ m a x maximum allowable settlement of the pile
θ spatial correlation length; it refers to both soil and pile properties
μ S p mean pile stiffness
μ S s mean soil stiffness
μ U s mean soil strength
σ n ( z ) normal effective stress at depth z
σ ¯ ο average effective overburden pressure
ϕ drained friction angle
ϕ ¯ mean of the sampled drained friction angle
ψ ( z ) interface friction angle at depth z

Appendix A. Stability of Numerical Results (Number of Realizations Considered in the RFEM Models)

The parametric analysis carried out is, in essence, a comparison study between different scenarios for determining the optimal sampling location or domain length for effectively designing axially loaded piles. When dealing with small differences in p f , the need for statistically stable results is even greater. In this respect, 20,000 realizations were considered. As shown in the example curves of Figure A1, this number of realizations is adequate.
Figure A1. p f vs. number of realizations for different values of (a) pile stiffness ( S p ), (b) soil stiffness ( S s ) , (c) soil strength ( U s ) and spatial correlation length ( θ ) for (d) the SLS state and (e) the ULS state.
Geosciences 10 00160 g0a1

References

  1. Griffiths, D.V.; Fenton, G.A.; Ziemann, H.R. Reliability of passive earth pressure. Georisk 2008, 2, 113–121. [Google Scholar] [CrossRef]
  2. Gong, W.; Luo, Z.; Juang, C.H.; Huang, H.; Zhang, J.; Wang, L. Optimization of site exploration program for improved prediction of tunneling-induced ground settlement in clays. Comput. Geotech. 2014, 56, 69–79. [Google Scholar] [CrossRef]
  3. Christodoulou, P.; Pantelidis, L.; Gravanis, E. The Effect of Targeted Field Investigation on the Reliability of Earth-Retaining Structures in Active State. Appl. Sci. 2019, 9, 4953. [Google Scholar] [CrossRef] [Green Version]
  4. Christodoulou, P.; Pantelidis, L.; Gravanis, E. The Effect of Targeted Field Investigation on the Reliability of Earth-Retaining Structures in Passive State: A Random Field Approach. Geosciences 2020, 10, 110. [Google Scholar] [CrossRef] [Green Version]
  5. Christodoulou, P.; Pantelidis, L. Reducing Statistical Uncertainty in Elastic Settlement Analysis of Shallow Foundations Relying on Targeted Field Investigation: A Random Field Approach. Geosciences 2020, 10, 20. [Google Scholar] [CrossRef] [Green Version]
  6. Crisp, M.; Jaksa, M.; Kuo, Y.; Fenton, G.A.; Griffiths, V. Characterising Site Investigation Performance in a Two Layer Soil Profile. Can. J. Civ. Eng. 2020. [Google Scholar] [CrossRef]
  7. Goldsworthy, J.S.; Jaksa, M.B.; Fenton, G.A.; Kaggwa, W.S.; Griffiths, V.; Poulos, H.G. Effect of sample location on the reliability based design of pad foundations. Georisk 2007, 1, 155–166. [Google Scholar] [CrossRef]
  8. Loehr, J.E.; Ding, D.; Likos, W.J. Effect of number of soil strength measurements on reliability of spread footing designs. Transp. Res. Rec. 2015, 2511, 37–44. [Google Scholar] [CrossRef]
  9. Jaksa, M.B.; Goldsworthy, J.S.; Fenton, G.A.; Kaggwa, W.S.; Griffiths, D.V.; Kuo, Y.L.; Poulos, H.G. Towards reliable and effective site investigations. Géotechnique 2005, 55, 109–121. [Google Scholar] [CrossRef]
  10. Mašín, D. The influence of experimental and sampling uncertainties on the probability of unsatisfactory performance in geotechnical applications. Géotechnique 2015, 65, 897–910. [Google Scholar] [CrossRef]
  11. Li, Y.J.J.; Hicks, M.A.A.; Vardon, P.J.J. Uncertainty reduction and sampling efficiency in slope designs using 3D conditional random fields. Comput. Geotech. 2016, 79, 159–172. [Google Scholar] [CrossRef] [Green Version]
  12. Yang, R.; Huang, J.; Griffiths, D.V.; Sheng, D. Probabilistic Stability Analysis of Slopes by Conditional Random Fields. Geo-Risk 2017, 2017, 450–459. [Google Scholar]
  13. Ching, J.; Phoon, K.-K. Characterizing uncertain site-specific trend function by sparse Bayesian learning. J. Eng. Mech. 2017, 143, 4017028. [Google Scholar] [CrossRef]
  14. Fenton, G.A.; Naghibi, F.; Hicks, M.A. Effect of sampling plan and trend removal on residual uncertainty. Georisk Assess. Manag. Risk Eng. Syst. Geohazards 2018, 12, 253–264. [Google Scholar] [CrossRef]
  15. Lo, M.K.; Leung, Y.F. Reliability Assessment of Slopes Considering Sampling Influence and Spatial Variability by Sobol’Sensitivity Index. J. Geotech. Geoenviron. Eng. 2018, 144, 4018010. [Google Scholar] [CrossRef]
  16. Yang, R.; Huang, J.; Griffiths, D.V.; Li, J.; Sheng, D. Importance of soil property sampling location in slope stability assessment. Can. Geotech. J. 2019, 56, 335–346. [Google Scholar] [CrossRef]
  17. EN. 1997-2 Eurocode 7-Geotechnical Design-Part 2: Ground Investigation and Testing; CEN (European Committee for Standardization): Brussels, Belgium, 2007. [Google Scholar]
  18. AASHTO. AASHTO LRFD Bridge. Design Specifications; American Association of State Highway and Transportation Officials: Washington, DC, USA, 2010; ISBN 9781560514510. [Google Scholar]
  19. Sabatini, P.J.; Bachus, R.C.; Mayne, P.W.; Schneider, J.A.; Zettler, T.E. Geotechnical Engineering Circular 5 (GEC5)-Evaluation of Soil and Rock Properties; Report No. FHWA-IF-02-034; Federal Highway Administration, US Department of of Transportation: Washington, DC, USA, 2002.
  20. Fenton, G.; Griffiths, D.V. Risk Assessment in Geotechnical Engineering; Wiley: Hoboken, NJ, USA, 2008; ISBN 9780470178201. [Google Scholar]
  21. Fenton, G.A.; Griffiths, D.V. Reliability-based deep foundation design. In Probabilistic Applications in Geotechnical Engineering; Springer Science & Business Media: Berlin/Heidelberg, Germany, 2007; pp. 1–12. [Google Scholar]
  22. Pacheco, J.; de Brito, J.; Chastre, C.; Evangelista, L. Experimental investigation on the variability of the main mechanical properties of concrete produced with coarse recycled concrete aggregates. Constr. Build. Mater. 2019, 201, 110–120. [Google Scholar] [CrossRef]
  23. Aït-Mokhtar, A.; Belarbi, R.; Benboudjema, F.; Burlion, N.; Capra, B.; Carcasses, M.; Colliat, J.-B.; Cussigh, F.; Deby, F.; Jacquemot, F. Experimental investigation of the variability of concrete durability properties. Cem. Concr. Res. 2013, 45, 21–36. [Google Scholar] [CrossRef] [Green Version]
  24. Christou, G.; Tantele, E.A.; Votsis, R.A. Effect of environmental deterioration on buildings: A condition assessment case study. In Proceedings of the RSCy2014, Paphos, Cyprus, 7–10 April 2014; International Society for Optics and Photonics: Bellingham, WA, USA, 2014; Volume 9229, p. 92290. [Google Scholar]
  25. Masi, A.; Chiauzzi, L. An experimental study on the within-member variability of in situ concrete strength in RC building structures. Constr. Build. Mater. 2013, 47, 951–961. [Google Scholar] [CrossRef]
  26. Wood, L.W. Variation of Strength Properties in Woods Used for Structural Purposes; USDA Forest Service: Washington, DC, USA, 1960.
  27. Das, B.M. Principle of Geotechnical Engineering, 7th ed.; Cengage Learning: Stamford, CT, USA, 2010; ISBN 9780495668121. [Google Scholar]
  28. Venkatramaiah, C. Geotechnical Engineering; New Age International: New Delhi, India, 2006; ISBN 812240829X. [Google Scholar]
  29. Canadian Standards Association Canadian Highway Bridge. Design Code. CAN/CSA-S6-14; Canadian Standards Association: Mississauga, ON, Canada, 2014. [Google Scholar]
  30. Kok-Kwang, P.; Kulhawy, F.H.; Grigoriu, M.D. Development of a Reliability-Based Design Framework for Transmission Line Structure Foundations. J. Geotech. Geoenvironm. Eng. 2003, 129, 798–806. [Google Scholar]
  31. Fenton, G.A.; Naghibi, F.; Dundas, D.; Bathurst, R.J.; Griffiths, D.V. Reliability-based geotechnical design in 2014 Canadian Highway Bridge Design Code. Can. Geotech. J. 2015, 53, 236–251. [Google Scholar] [CrossRef]
  32. EN. 1997-1 Eurocode 7 Geotechnical Design—Part 1: General Rules; CEN (European Committee for Standardization): Brussels, Belgium, 2004. [Google Scholar]
  33. JGS Principles for Foundation Design Grounded on a Performance-Based Design Concept (GeoGuide); Japanese Geotechnical Society: Tokyo, Japan, 2004.
  34. Orr, T.L.L. Defining and selecting characteristic values of geotechnical parameters for designs to Eurocode 7. Georisk Assess. Manag. Risk Eng. Syst. Geohazards 2016, 11, 103–115. [Google Scholar] [CrossRef]
  35. Vanmarcke, E.H. Reliability of earth slopes. J. Geotech. Eng. Div. 1977, 103, 1247–1265. [Google Scholar]
  36. Soulie, M.; Montes, P.; Silvestri, V. Modelling spatial variability of soil parameters. Can. Geotech. J. 1990, 27, 617–630. [Google Scholar] [CrossRef]
  37. Cherubini, C. Data and considerations on the variability of geotechnical properties of soils. In Proceedings of the International Conference on Safety and Reliability, ESREL, Lisbon, Portugal, 17–20 June 1997; Volume 97, pp. 1583–1591. [Google Scholar]
  38. Popescu, R.; Prévost, J.H.; Deodatis, G. Effects of spatial variability on soil liquefaction: Some design recommendations. Geotechnique 1997, 47, 1019–1036. [Google Scholar] [CrossRef]
  39. Phoon, K.; Kulhawy, F. Characterization of geotechnical variability. Can. Geotech. J. 1999, 36, 612–624. [Google Scholar] [CrossRef]
  40. Christodoulou, P.; Pantelidis, L.; Gravanis, E. A Comparative Assessment of the Methods-of-Moments for Estimating the Correlation Length of One-Dimensional Random Fields. Arch. Comput. Methods Eng. 2020. [Google Scholar] [CrossRef]
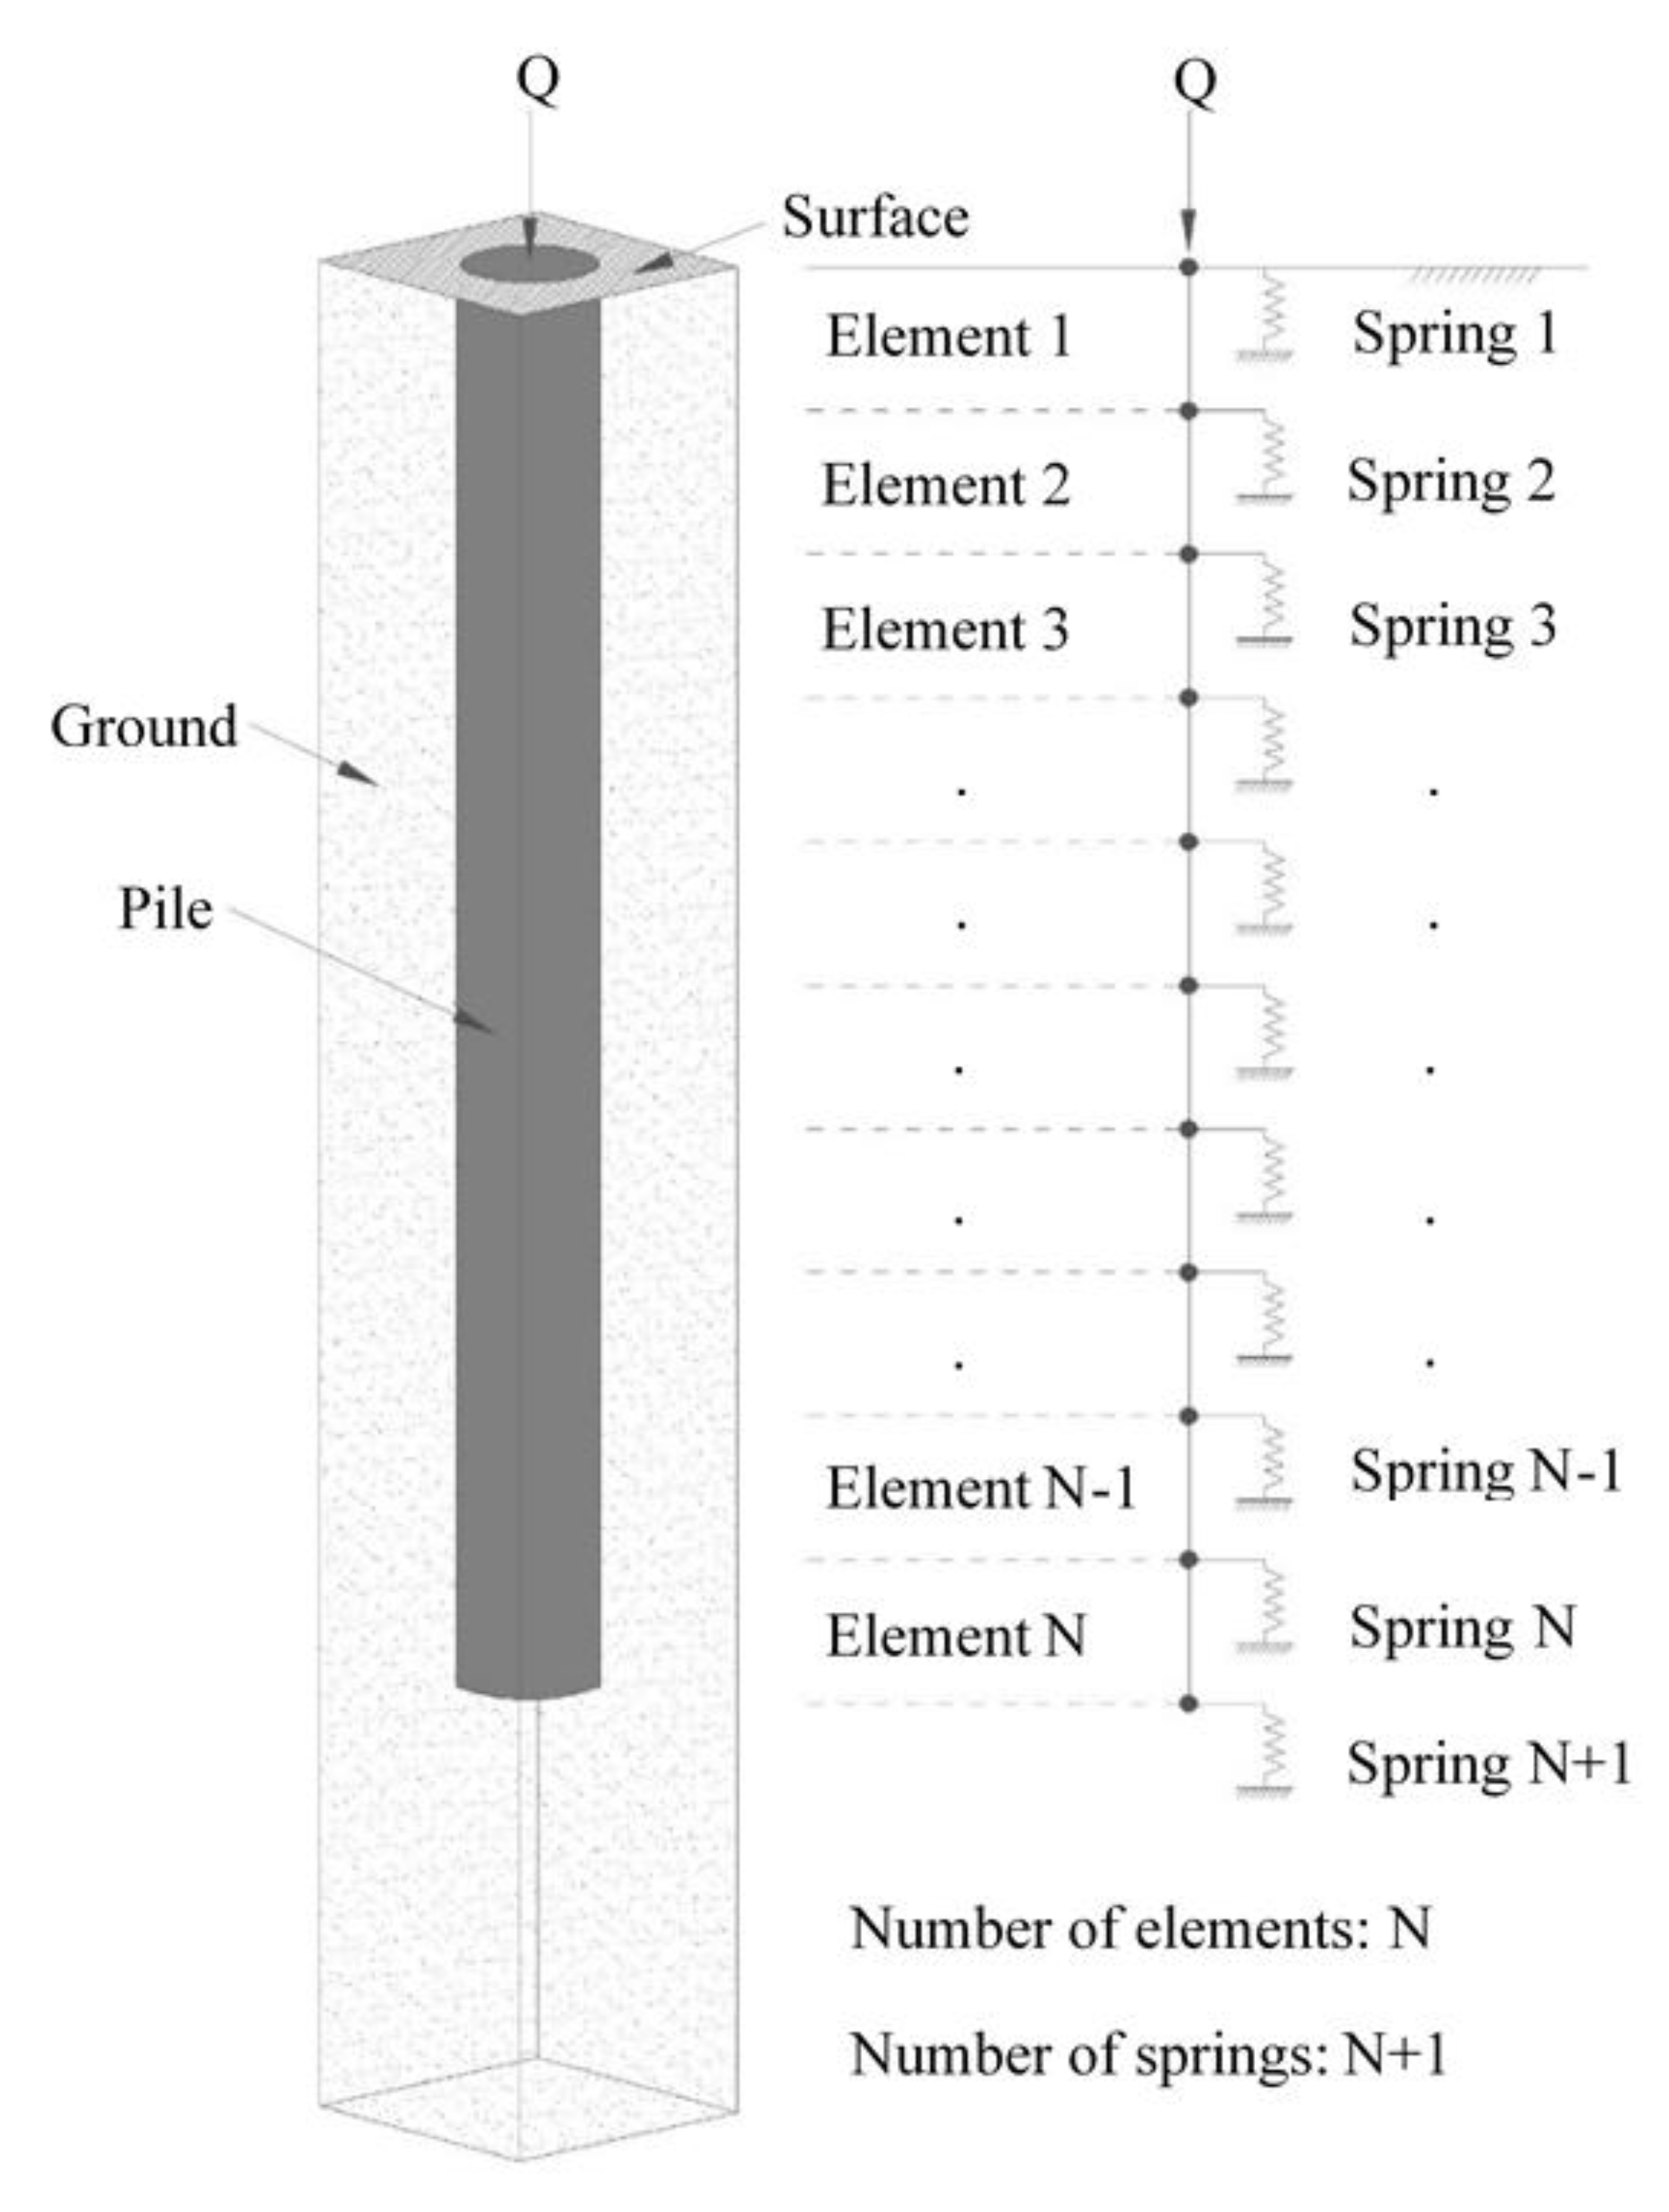
Figure 1. Pile (left) and finite element representation of the pile–soil system (right).
Geosciences 10 00160 g001
Figure 2. p f vs. d p / L curves for various θ values and for three different pile lengths. Figures (a), (c), and (e) refer to SLS state for L = 10, 15 and 20 m respectively and figures (b), (d), and (f) to the ULS state also for L = 10, 15 and 20 m respectively.
Geosciences 10 00160 g002
Figure 3. pf vs. d p / L curves for (a) the SLS and (b) the ULS for three different pile lengths
Geosciences 10 00160 g003
Figure 4. Chart indicating the relative percentage difference R d between the minimum and maximum p f value for θ values ranging from 0.1 to 100 m and pile length L = 10, 15, and 20 m for (a) the SLS and (b) the U L S .
Geosciences 10 00160 g004
Figure 5. (a) p f vs. d p / L curves for the SLS state by considering different δ m a x values, (b) p f vs. d p curves for different mean pile stiffness ( S p ) values for the SLS state, and (c) p f vs. d p curves for different soil stiffness ( S s ) values for the SLS state; figures refer to scaled correlation length θ / L = 2/3.
Geosciences 10 00160 g005
Figure 6. p f vs. d p / L curves for different values of COV of (a) S p (SLS state), (b) S s (SLS state), and (c) U s (ULS state) for θ / L = 2/3.
Geosciences 10 00160 g006
Figure 7. pf vs. dd curves for different values of (a) pile stiffness (Sp) and θ=1.0 m, (b) spatial correlation length (θ) and Sp = 106 kN, (c) soil stiffness (Ss) and θ = 1.0 m, (d) spatial correlation length (θ) and Ss = 100 kN/m/m, (e) spatial correlation length (θ) (chart standing for any Sp value), and (f) spatial correlation length (θ) (chart standing for any Ss value). Figures (a) to (d) refer to the SLS state, whilst figures (e) and (f) to the ULS state.
Geosciences 10 00160 g007
Figure 8. p f vs. d d curves for various δ max values; chart referring to the SLS state.
Geosciences 10 00160 g008
Figure 9. p f vs. d d curves for different values of COV values of (a) S p , (b) S s , and (c) U s Figures (a) and (b) refer to the SLS state, whilst figure (c) refers to the ULS state; θ / L = 2/3 in all figures.
Geosciences 10 00160 g009
Figure 10. Graphical representation of the two example random fields of the friction angle of soil (recall Table 2). (a) θ / L = 1 / 15 and (b) θ / L = 1 / 1.5 . Light areas correspond to lower friction angles and vice versa. The pile is located at x / L = 0 .
Geosciences 10 00160 g010
Figure 11. Relative difference Rd (=Λ/Λref-1; recall Equation (3)) versus x/L (relative distance from the pile location) for (a) θ / L = 1 / 15 and (b) θ / L = 1 / 1.5 . Charts drawn using mean friction angle values.
Geosciences 10 00160 g011
Figure 12. Relative difference Rd (=Λ/Λref-1; recall Equation (3)) versus x/L (relative distance from the pile location) for (a) θ / L = 1 / 15 and (b) θ / L = 1 / 1.5 . Charts drawn using characteristic friction angle values.
Geosciences 10 00160 g012
Table 1. Input data abstracted by Fenton and Griffiths [21], referred to as “reference data”.
δ m a x Pile   Stiffness   ( S p ) Soil   Stiffness   ( S s ) Soil   Strength   ( U s )
μ S p COV μ S s COV μ U s COV
25 mm1000 kN0.1100 kN/m/m0.210 kN/m0.2
Table 2. Summary of the values of parameters defining the two examples.
ExampleRandom FieldDistribution μ ϕ C O V ϕ L θ / L Figure
#1 ϕ Log-normal30°0.2151/1510a
#2 ϕ Log-normal30°0.2151/1.510b