Near-Real-Time Loss Estimates for Future Italian Earthquakes Based on the M6.9 Irpinia Example


Abstract
1. Introduction
2. Building Stock Used
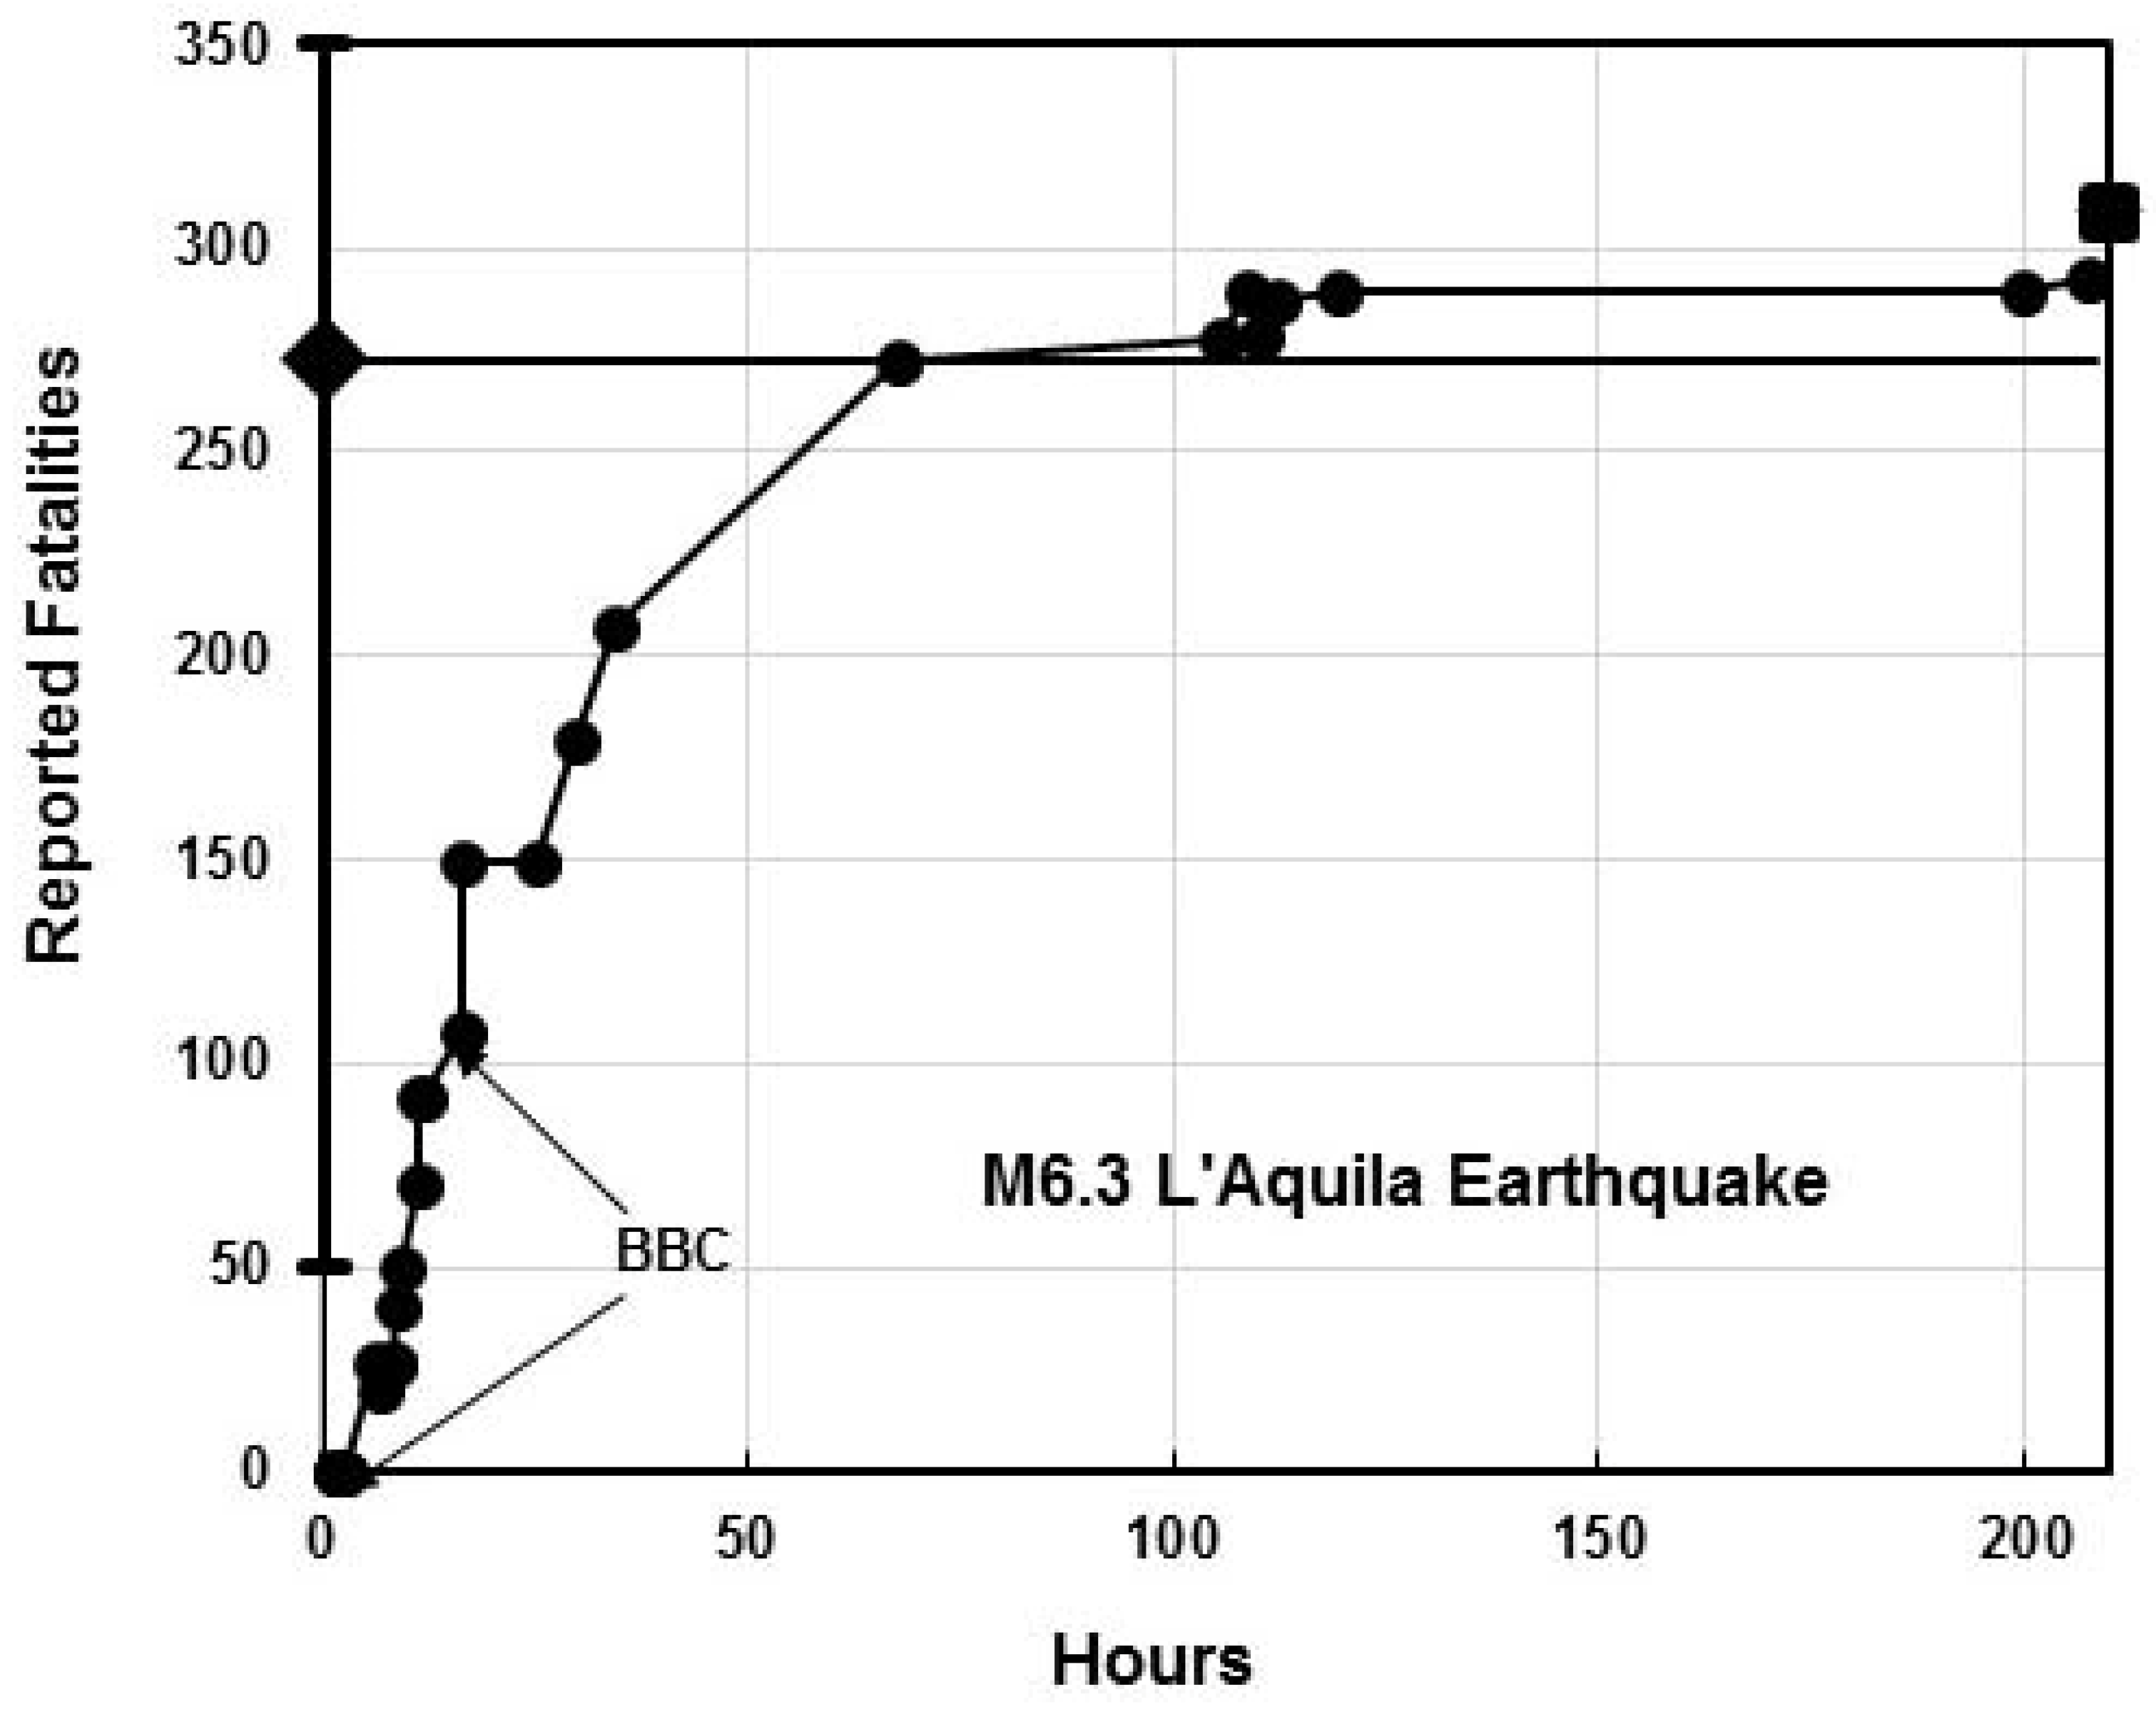
3. The M6.3 L’Aquila Earthquake
4. Loss Estimates for the M6.9 Irpinia Earthquake
5. Discussion
6. Conclusions
Author Contributions
Funding
Acknowledgments
Conflicts of Interest
References
- Wyss, M. Ten years of real-time earthquake loss alerts. In Earthquake Hazard, Risk, and Disasters; Wyss, M., Ed.; Elsevier: Waltham, MA, USA, 2014; pp. 143–165. [Google Scholar]
- Trendafiloski, G.; Wyss, M.; Rosset, P. Loss estimation module in the second generation software QLARM. In Human Casualties in Earthquakes: Progress in Modeling and Mitigation; Spence, R., So, E., Scawthorn, C., Eds.; Springer: Dordrecht, The Netherland, 2011; pp. 381–391. [Google Scholar]
- Rosset, P.; Bonjour, C.; Wyss, M. QLARM, un outil d’aide à la gestion du risque sismique à échelle variable. In Plans communaux de sauvegarde et outils de gestion de crise. In Collection «Géorisques»; Leone, F., Vinet, F., Eds.; Presses Universitaires de la Méditerranée: Montpellier, France, 2015; pp. 91–98. [Google Scholar]
- Rosset, P.; Wyss, M. Seismic Loss Assessment in Algeria Using the Tool QLARM. Civ. Eng. Res. J. 2017, 2, 1–3. [Google Scholar] [CrossRef]
- Wyss, M.; Wu, Z.L. How Many Lives Were Saved by the Evacuation Before the M7.3 Haicheng Earthquake of 1975? Seismol. Res. Lett. 2014, 85, 126–129. [Google Scholar] [CrossRef]
- Wyss, M.; Gupta, S.; Rosset, P. Casualty estimates in repeat Himalayan earthquakes in India. Bull. Seismol. Soc. Am. 2018, 108, 2877–2893. [Google Scholar] [CrossRef]
- Wyss, M.; Elashvili, M.; Jorjiashvili, N.; Javakhishvili, Z. Uncertainties in teleseismic epicenter estimates: Implications for real-time loss estimates. Bull. Seismol. Soc. Am. 2011, 101, 1152–1161. [Google Scholar] [CrossRef]
- Rosset, P.; Tolis, S.; Speiser, M.; Wyss, M. QLARM, un outil au service de la gestion du risque sismique et des crises; Étude de cas au Kirghizstan. Georisque 2020. In Review. [Google Scholar]
- Gruenthal, G. European Macroseismic Scale 1998; Conseil de l’Europe: Luxembourg, 1998. [Google Scholar]
- Wyss, M.; Chamlagain, D. Estimated Casualties in Possible Future Earthquakes South and West of the M7.8 Gorkha earthquake of 2015. Acta Geophys. 2019, 67, 423–429. [Google Scholar] [CrossRef]
- Wells, D.L.; Coppersmith, K.J. New empirical relationships among magnitude, rupture length, rupture width, rupture area and surface displacement. Bull. Seismol. Soc. Am. 1994, 84, 974–1002. [Google Scholar]
- Wyss, M. Estimating expectable maximum magnitude of earthquakes from fault dimensions. Geology 1979, 7, 336–340. [Google Scholar] [CrossRef]
- Deschamps, A.; King, G.C.P. Aftershocks of the Campania-Lucania (Italy) earthquake of 23 November 1980. Bull. Seismol. Soc. Am. 1984, 74, 2483–2517. [Google Scholar]
- Bernard, P.; Zollo, A. The Irpinia (Italy) 1980 earthquake: Detailed analysis of a complex normal faulting. J. Geophys. Res. 1989, 94, 1631–1647. [Google Scholar] [CrossRef]
- Pantosti, D.; Schwartz, D.P.; Valensise, G. Paleoseismology along the 1980 surface rupture of the Irpinia Fault: Implications for Earthquake recurrence in the Southern Apennines, Italy. J. Geophys. Res. 1993, 98, 6561–6577. [Google Scholar] [CrossRef]
- Wyss, M. Report estimated quake death tolls to save lives. Nature 2017, 545, 151–153. [Google Scholar] [CrossRef] [PubMed]
- Wang, D.; Kawakatsu, H.; Zhuang, J.; Mori, J.; Maeda, T.; Tsuruoka, H.; Zhao, X. Automated determination of magnitude and source length of large earthquakes using backprojection and P wave amplitudes. Geophys. Res. Lett. 2017, 44, 5447–5456. [Google Scholar] [CrossRef]
- Li, J.; Böse, M.; Wyss, M.; Wald, D.J.; Hutchison, A.; Clinton, J.F.; Wu, Z.; Jiang, C.; Zhou, S. Estimating rupture dimensions of three major earthquakes in Sichuan, China, for early warning and rapid loss estimates. Bull. Seismol. Soc. Am. 2020, 110, 920–936. [Google Scholar] [CrossRef]
- Wyss, M.; Brune, J.N. The Alaska earthquake of 28 March 1964: A complex multiple rupture. Bull. Seismol. Soc. Am. 1967, 57, 1017–1023. [Google Scholar]
- Harvey, D.; Wyss, M. Comparison of a complex rupture model with the precursor asperities of the 1975 Hawaii Ms = 7.2 earthquake. Pure Appl. Geophys. 1986, 124, 957–973. [Google Scholar] [CrossRef]
- Wyss, M.; Wang, R.; Zschau, J.; Xia, Y. Earthquake loss estimates in near real-time. EOS Trans. Am. Geophys. Union 2006, 87, 477–479. [Google Scholar] [CrossRef]


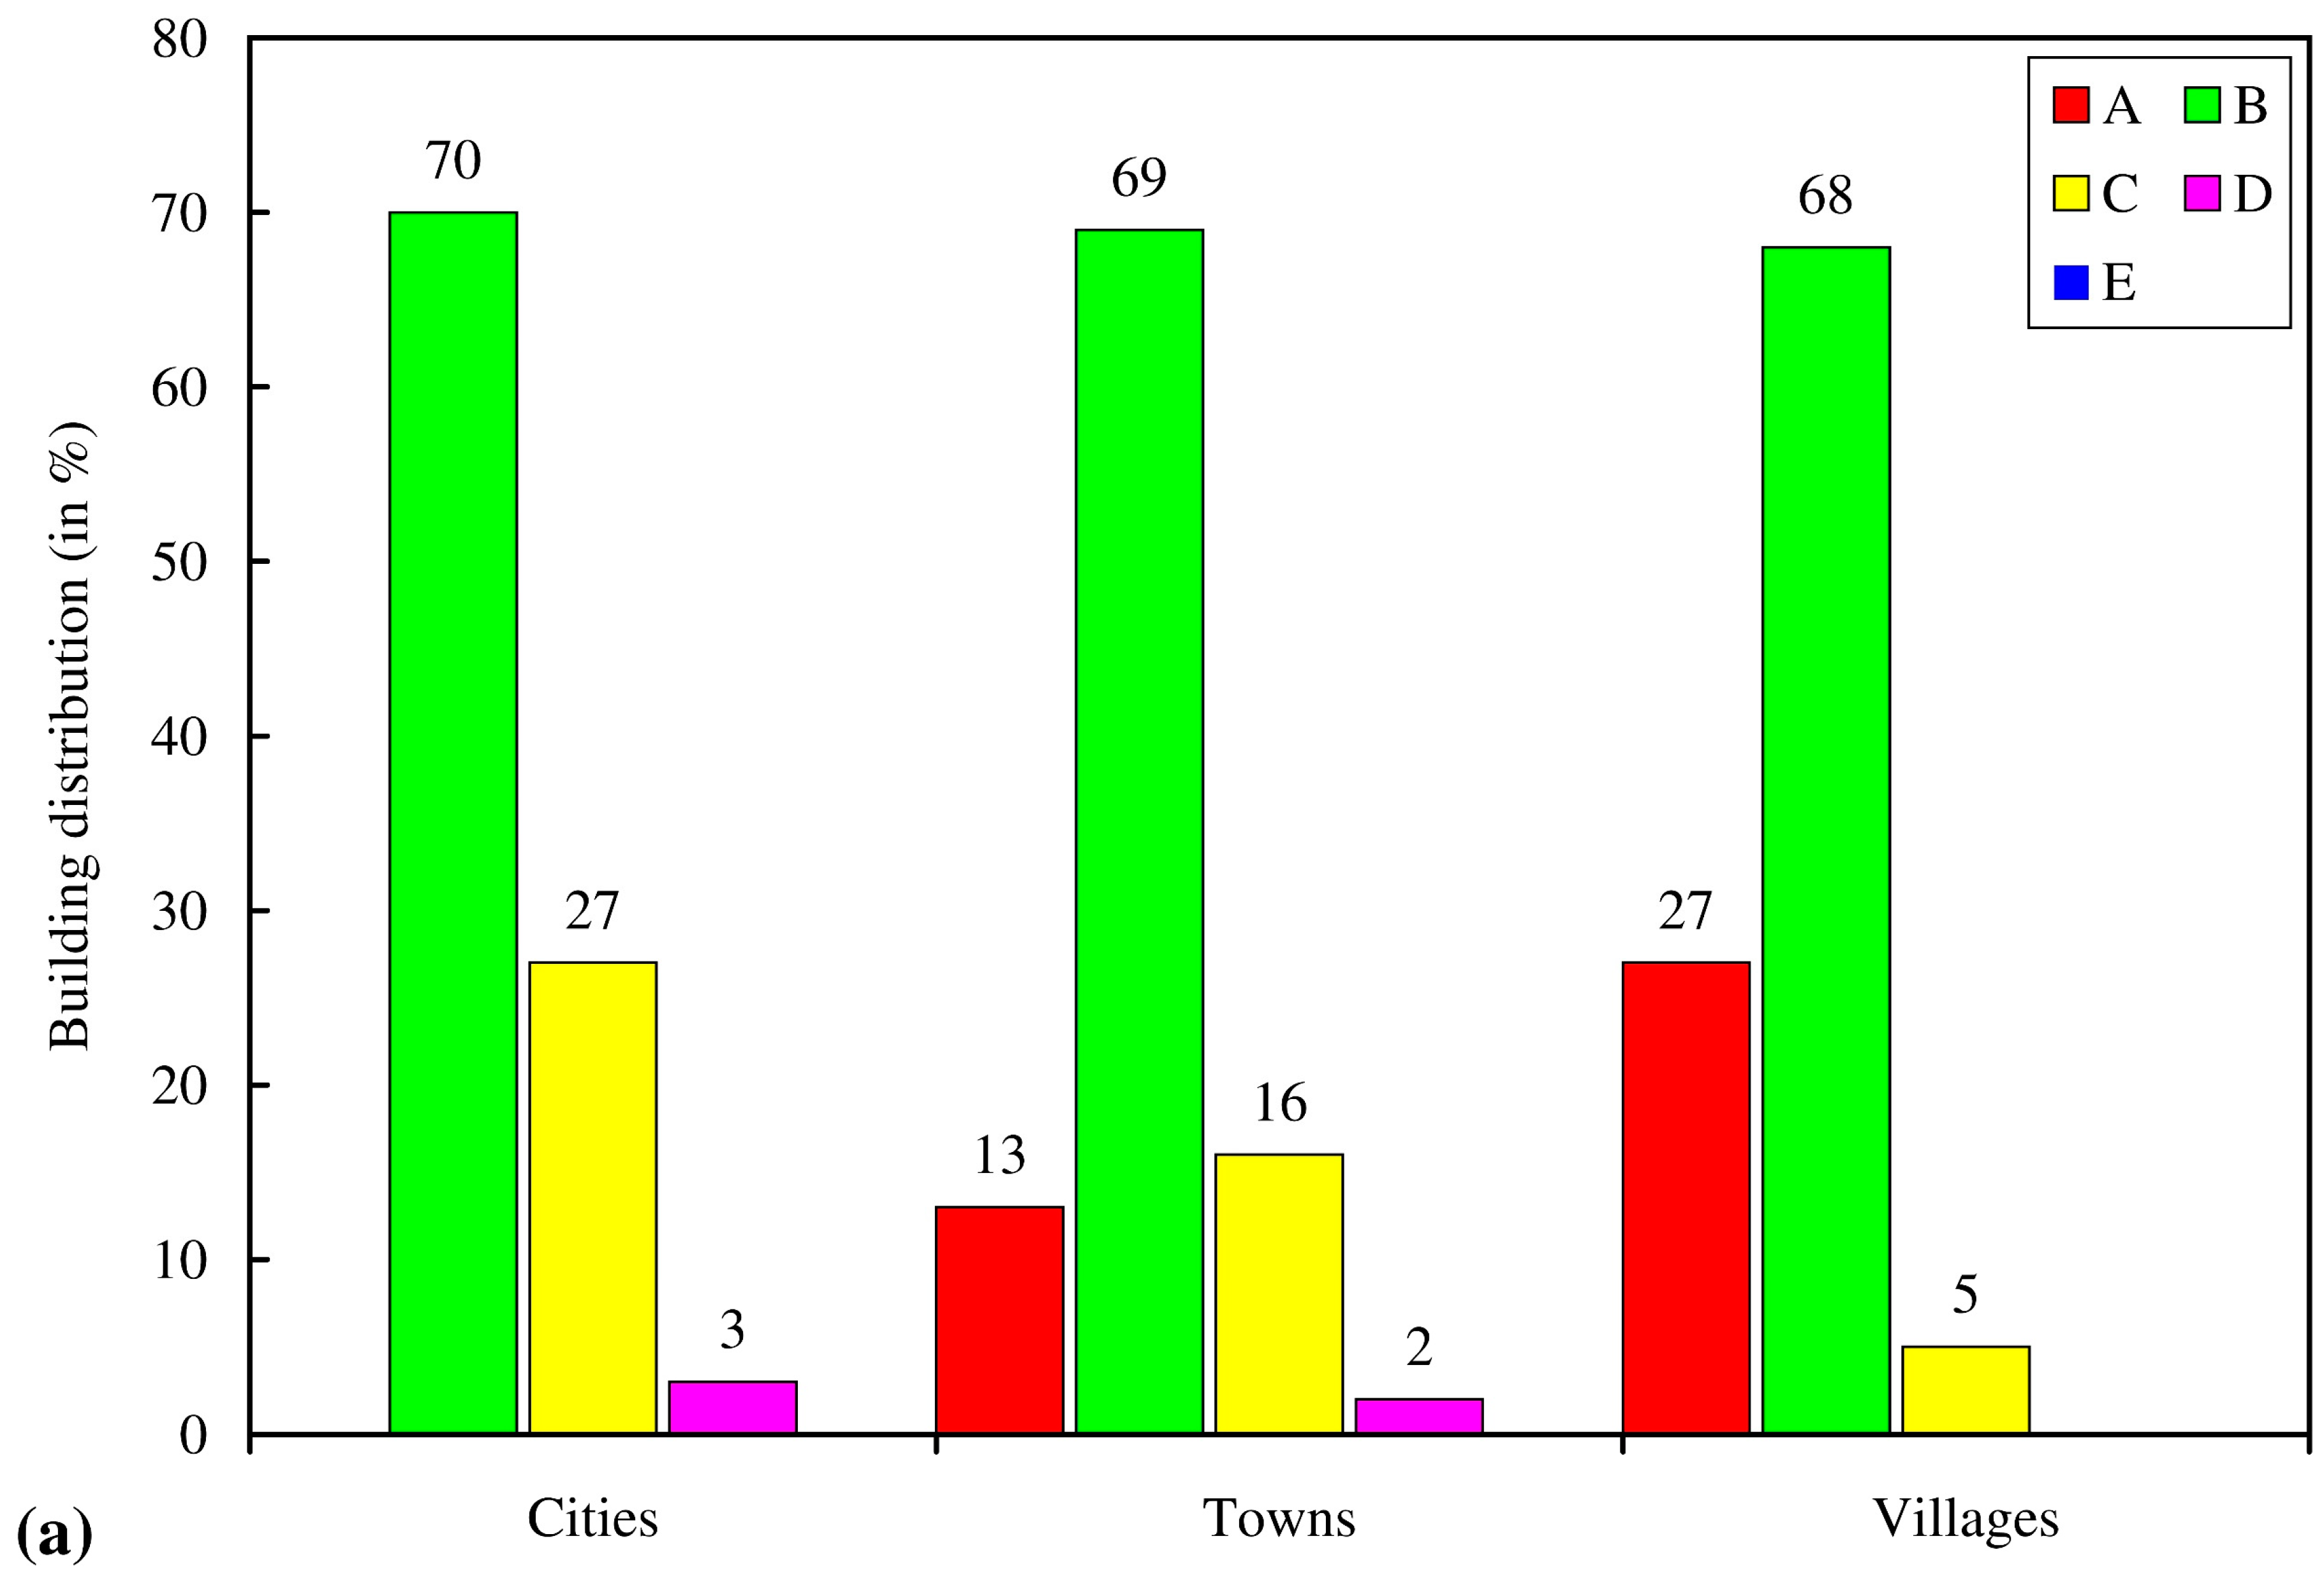
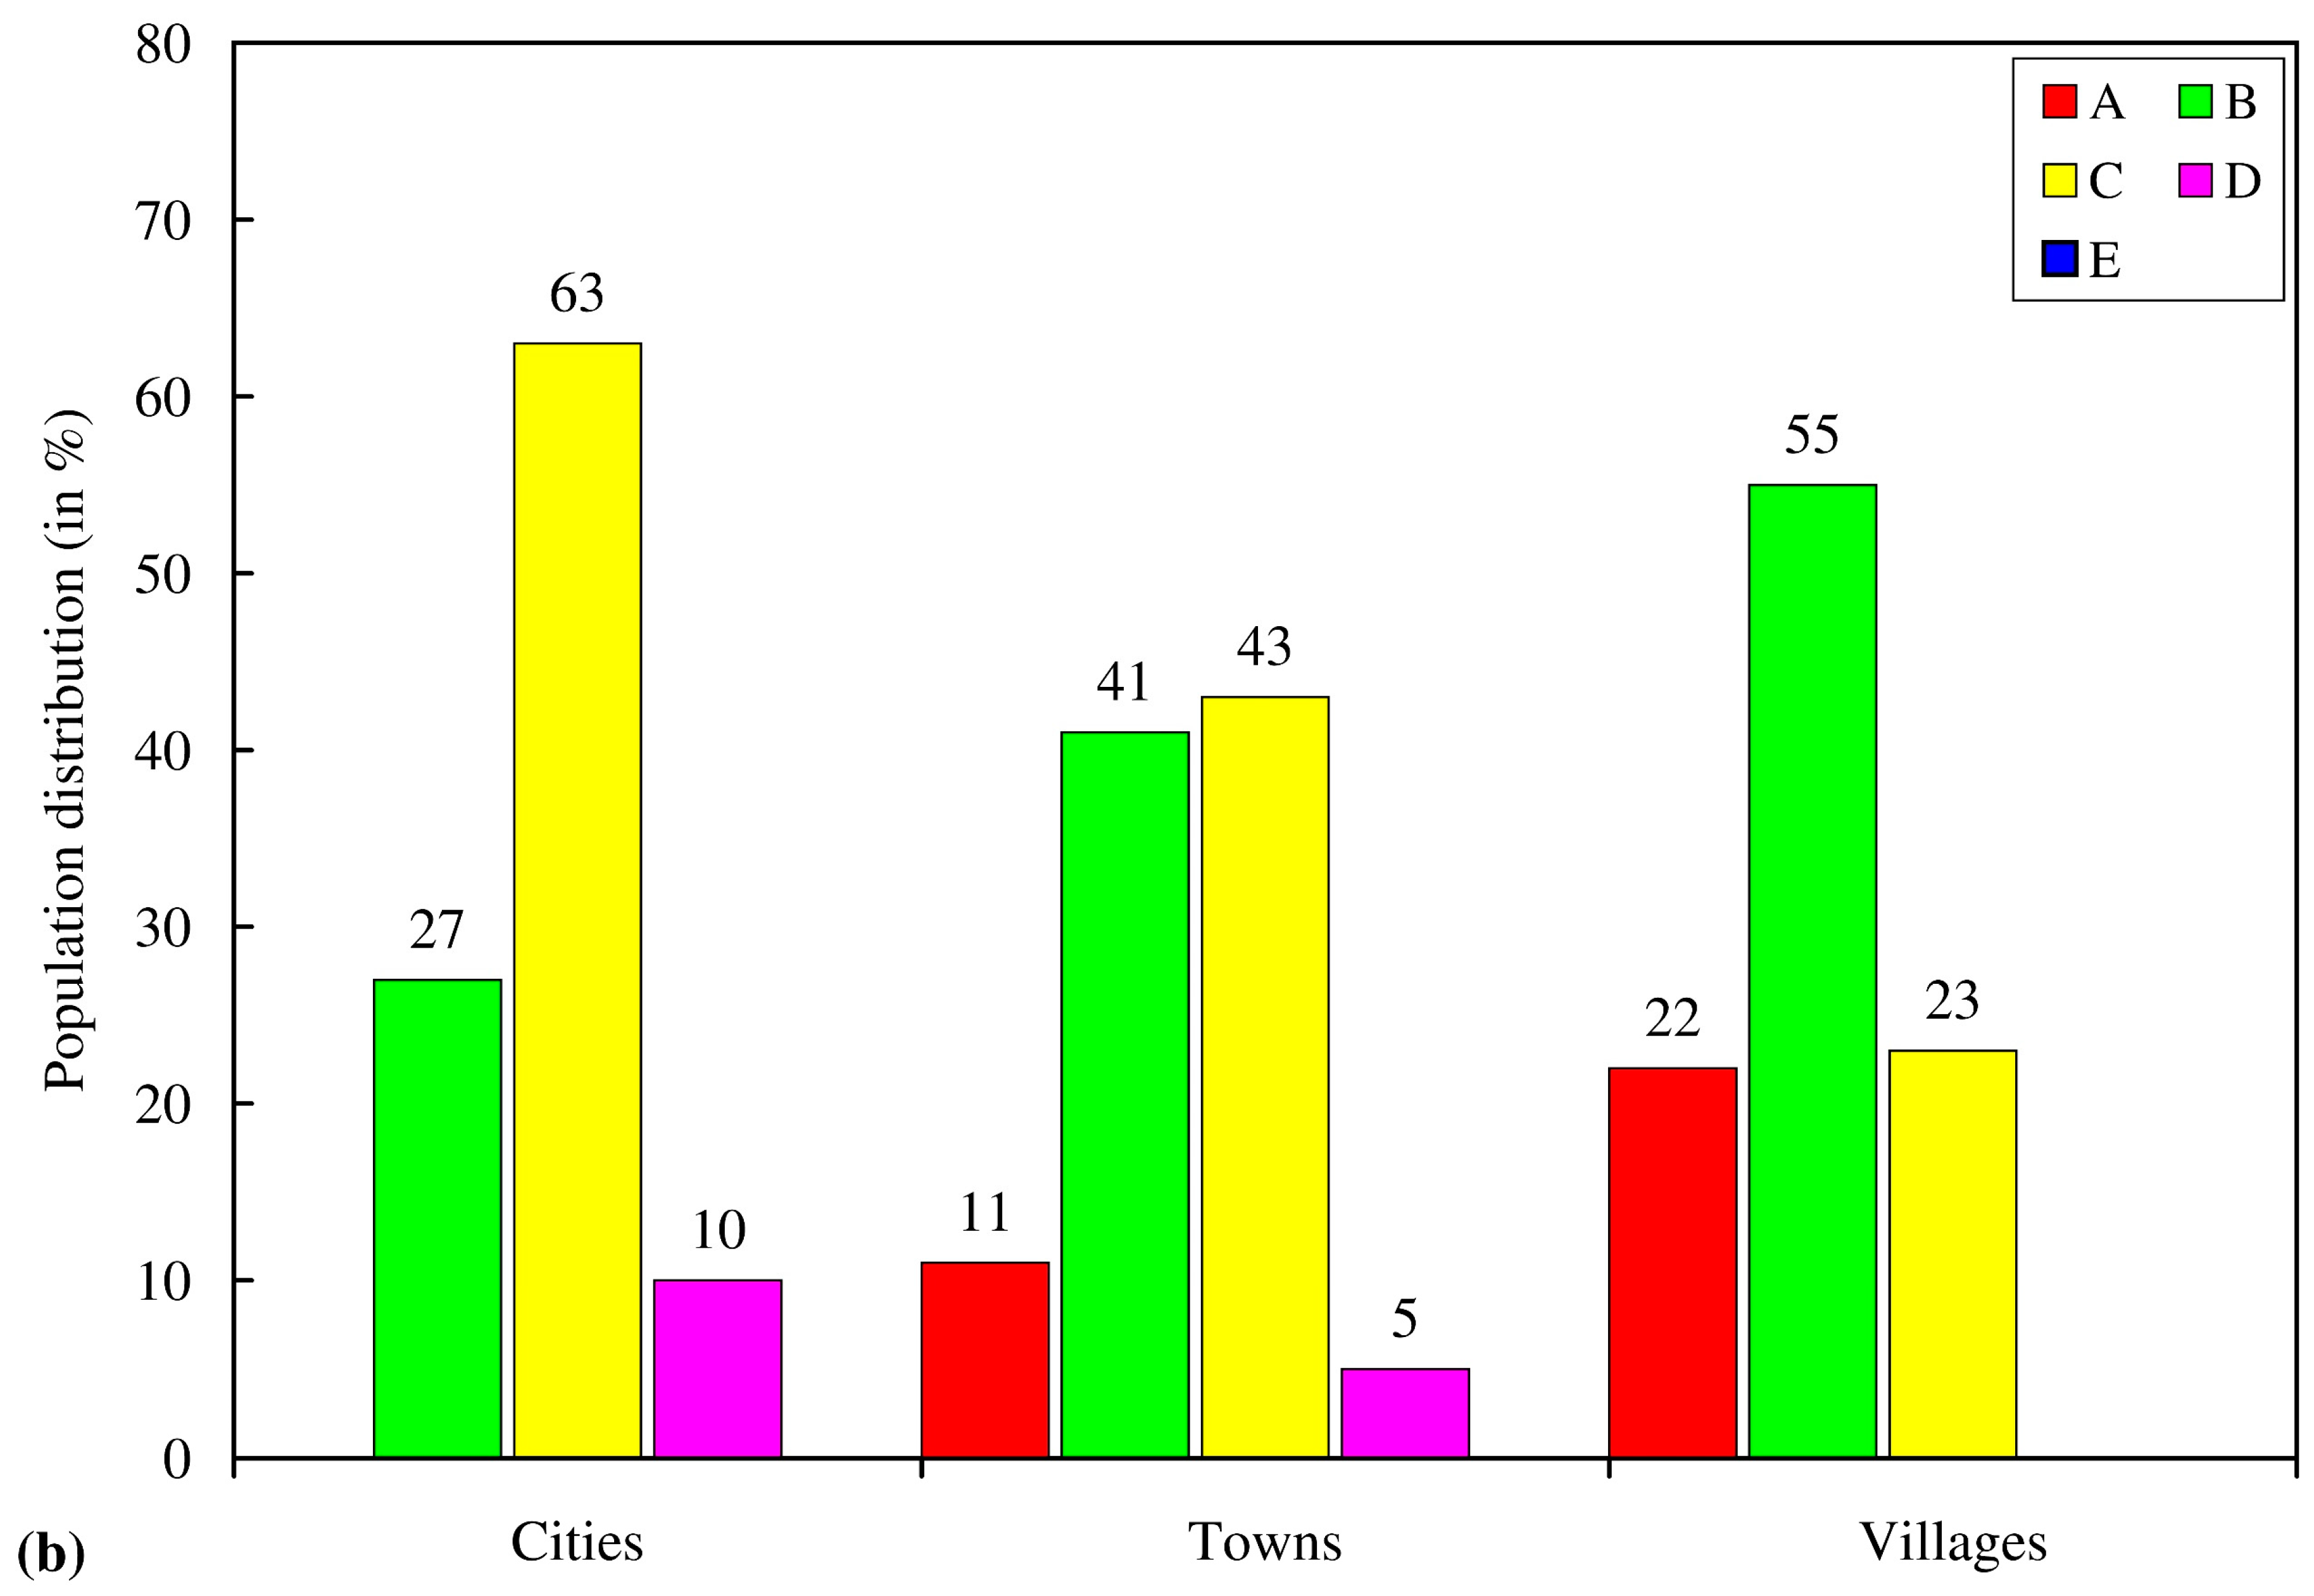
| Cities Above 20,000 Inhabitants | Towns | Villages Below 2000 Inhabitants | ||||||
|---|---|---|---|---|---|---|---|---|
| Type | Buildings (%) | People (%) | Type | Buildings (%) | People (%) | Type | Buildings (%) | People (%) |
| A | 0 | 0 | A | 13 | 11 | A | 27 | 22 |
| B | 70 | 27 | B | 69 | 41 | B | 68 | 55 |
| C | 27 | 63 | C | 16 | 43 | C | 5 | 23 |
| D | 3 | 10 | D | 2 | 5 | D | 0 | 0 |
| E | 0 | 0 | E | 0 | 0 | E | 0 | 0 |
| From | wapmerr@sed.ethz.ch |
| To | wapmerr@sed.ethz.ch |
| Date | Monday, April 06, 2009 03:54 am |
| Subject | Earthquake in Italy |
| The Following Earthquake has been Reported: Date: 2009/04/04 01:31:57.6 Region: Italy Magnitude: M 6.3 Latitude: 42.42 N Longitude: 13.39 E Depth (km): 5.0 Source: GHZ Injured Exp. min/max: 100/1300 Fatalities Exp. min/max: 50/500 L’Aquila is the nearest town at 5 km distance |
| Delay (Minute) | Longitude (Degree) | Latitude (Degree) | Source Model | Depth (km) | Magnitude | Fatalities (Calculated) | Fatalities (Reported) | Injured (Calculated) | Injured (Reported) | ||
|---|---|---|---|---|---|---|---|---|---|---|---|
| Min. | Max. | Min. | Max. | ||||||||
| 30 | 15.37 | 40.91 | Point | 10 | 6.9 | 300 | 1840 | 2483 | 1480 | 9’064 | 7700 |
| 60 | 15.28 | 41.11 | Line end N | 15 | 6.9 | 410 | 3120 | 2483 | 2110 | 14’790 | 7700 |
| 15.61 | 40.67 | Line end S | |||||||||
| Ultimate | 15.00 | 41.00 | Line end N | 15 | 6.9 | 780 | 5840 | 2483 | 3860 | 26’660 | 7700 |
| 15.515 | 40.355 | Line end S | |||||||||
| Year | Month | Day | Hour | Minute | Second. | Latitude | Longitude | Depth | Magnitude | Time Difference | Distance | Length Estimate |
|---|---|---|---|---|---|---|---|---|---|---|---|---|
| 1980 | 11 | 23 | 18 | 34 | 53 | 40.91 | 15.37 | 10 | 6.9 | (Min.) | (km) | (km) |
| 1980 | 11 | 23 | 18 | 52 | 6.3 | 41.11 | 15.28 | 10 | 4.6 | 17 | 24 | |
| 1980 | 11 | 23 | 19 | 4 | 2.7 | 40.67 | 15.61 | 10 | 4.5 | 29 | 37 | 61 |
| 1980 | 11 | 23 | 19 | 6 | 45 | 40.72 | 15.59 | 10 | 4.4 | 32 | 32 |
| Delay | Source Model | Magnitude | Intensities VI + VII | Intensities VIII + IX | Total Affected VI+ |
|---|---|---|---|---|---|
| Min. | Million | Million | Million | ||
| 30 | Point | 7 | 2.2 | 0.1 | 2.3 |
| 60 | Approximate line | 7 | 2.4 | 0.3 | 2.7 |
| Ultimate | Final line | 7 | 5.4 | 0.6 | 6.0 |
© 2020 by the authors. Licensee MDPI, Basel, Switzerland. This article is an open access article distributed under the terms and conditions of the Creative Commons Attribution (CC BY) license (http://creativecommons.org/licenses/by/4.0/).
Share and Cite
Wyss, M.; Rosset, P. Near-Real-Time Loss Estimates for Future Italian Earthquakes Based on the M6.9 Irpinia Example. Geosciences 2020, 10, 165. https://doi.org/10.3390/geosciences10050165
Wyss M, Rosset P. Near-Real-Time Loss Estimates for Future Italian Earthquakes Based on the M6.9 Irpinia Example. Geosciences. 2020; 10(5):165. https://doi.org/10.3390/geosciences10050165
Chicago/Turabian StyleWyss, Max, and Philippe Rosset. 2020. "Near-Real-Time Loss Estimates for Future Italian Earthquakes Based on the M6.9 Irpinia Example" Geosciences 10, no. 5: 165. https://doi.org/10.3390/geosciences10050165
APA StyleWyss, M., & Rosset, P. (2020). Near-Real-Time Loss Estimates for Future Italian Earthquakes Based on the M6.9 Irpinia Example. Geosciences, 10(5), 165. https://doi.org/10.3390/geosciences10050165