1. Introduction
A rockfall is a rapid mass movement generated by the detachment of a rock volume from a slope that falls, bounces, and rolls during its propagation downhill [
1,
2]. Rockfalls often threaten civil infrastructures, buildings and transportation networks in mountainous regions [
3,
4,
5,
6,
7,
8,
9,
10]. These phenomena have great destructive potential due to the high speed and, consequently, the high kinetic energy the rockfall can reach during its propagation [
11].
In a rockfall, the initial mobilized mass can be either a single massive block or a set of blocks defined by the joint system in the massif. The concept of in situ block size distribution (IBSD) was introduced to describe the initial distribution of block sizes within the rock mass [
12,
13,
14]. During propagation, the block or blocks that originally form the IBSD may break on collision with the ground to produce fragments that are smaller than the original ones. The term fragmental rockfall is used to refer to this phenomenon [
15,
16] and the final distribution of the fragments is called the rockfall block size distribution (RBSD).
In recent years, significant improvements have been made in rockfall risk analysis methodologies [
17,
18], particularly for transportation infrastructures [
19,
20,
21,
22] and urban areas [
23,
24,
25]. The design and implementation of risk mitigation structures such as dynamic barriers, embankments and galleries has also been improved by increasing the energy absorption and the diversion capacity [
26,
27,
28]. Knowledge of the expected kinematic conditions of a rockfall at a certain point, such as the impact energy and bouncing height, is required for risk assessment and the proper design of risk mitigation structures. The impact energy depends on many variables like the initial volume, release height, path topography, and the geomechanical properties of the slope. Rockfall propagation models have been developed to determine the trajectories, the potential runout, and impact energies. Some of these models are based on empirical observations [
29,
30] and others are processes that are based on and simulate the physics of the phenomenon with approaches of varying detail [
31,
32,
33,
34,
35,
36,
37,
38]. However, fragmentation is rarely considered in these analyses [
39,
40].
Real-scale tests [
5,
33,
35,
38,
41,
42,
43,
44,
45,
46] and laboratory tests [
47,
48] have been performed for a better understanding of the rockfall phenomenon and proper calibration of the existing rockfall simulation models. Some of these tests focused on calibrating the rock–slope interaction models (rebound) to match different criteria: maximum runout, runout distribution, divergence trajectories, passing height and passing velocity in control points. Only a few of the cited studies focused on the analysis of fragmentation [
5,
46]. The latter is critical to determine trajectories and impact energy and has a significant effect on the resulting risk [
49].
The mining industry has historically been the most interested in fragmentation to assess the efficiency of blasting operations [
50,
51]. However, many researchers have paid attention to fragmentation recently, as an important factor in the study of rockfalls [
37,
52,
53,
54,
55] and rock avalanches [
56,
57,
58,
59,
60]. In rockfall events, three main consequences are observed when a block fragments:
Reduction in the initial block size. This can range from six to nine orders of magnitude in single isolated blocks from 1 to 2 m
3 [
46], and 15 to 18 orders of magnitude in events that mobilize over 20,000 m
3 [
61]. Macciotta et al [
62] showed the influence of the structure of the rock mass at the detachment location on the block size reduction. To study the block size distributions, Ruiz-Carulla et al. [
14] proposed a fractal approach in which a finite number of iterations was adopted, based on Mandelbrot [
63] and Turcotte [
64], who had already developed fractal theory to deal with complex natural phenomena. This type of approach has been used to derive the RBSD from the ISBD of past rockfall events [
14,
65]. Recently, a continuous approach using fractal theory and the scale-variant fractal probability model has been proposed for rockfalls [
66];
Divergence of trajectories. After breakage, fragments adopt fan-like diverging trajectories from the collision point [
56,
61,
67,
68,
69]. Few studies have targeted the evaluation of trajectory divergence after fragmentation in rockfalls, including numerical modeling [
70] and field experiments [
5,
46];
Momentum boost effect. After fragmentation, small fragments may reach velocities higher than big ones [
61,
70,
71,
72]. The distribution of energy after breakage is still unknown and, in some numerical investigations, no correlation has been found between the fragment size and fragment kinetic energy for a given impact velocity [
72]. To our knowledge, only a few studies have attempted to measure the energy distribution after fragmentation in rockfalls [
69], which, under the current state of the knowledge, is still highly uncertain.
The combination of these three effects can produce a range of scenarios. Although the fragment size is reduced, the potential increment in velocity due to the momentum boost effect may lead to high energies concentrated in a small area. It has been observed that in this scenario blocks with significantly less energy than the design value can punch out dynamic rockfall barriers [
44]. This is called the “bullet effect”. Moreover, trajectory divergence, combined with size reduction, may have opposite effects depending on the topography. In scenarios where propagation takes place on gentle slopes, the overall runout of the fragments may decrease when compared to the unbroken blocks. This effect disappears on steep slopes [
49].
This paper presents the performance of the RockGIS code for simulating fragmentation in rockfalls [
40], which has been upgraded for this study. The code was calibrated and validated with a set of full-scale rockfall tests, performed in a quarry to provide quality and reliable data. The results of the experiments were used to calibrate the model focusing on the volume distribution of the fragments after breakage, the distances traveled, and the trajectories. The paper is organized as follows. Firstly, we present the RockGIS code that accounts for fragmentation in the stochastic simulation of rockfalls. The model has been upgraded by adding scale-variant laws and adaptable model parameters for the analysis of fragmentation [
66]. Secondly, we describe the experimental setup of the quarry, the test equipment, and the data gathering procedures of the real-scale tests. These tests were carried out in the framework of the national research project RockModels, an important part of which has been dedicated to determining the fragmentation of rock masses and its application in fragmentation and propagation models. Thirdly, we calibrate the model and discuss the results of the simulations. Finally, we describe the parametric analysis.
2. Code Description
The rockfall code used for this study is RockGIS [
40], which takes a lumped-mass approach and allows for the fragmentation of blocks during their propagation. The code requires the following input data: the digital elevation model (DEM) of the study area, the land use map to define the spatially distributed parameters involved in the impact and the rebound parameter, the location of the source of detachable blocks, their volumes, and their initial kinematic conditions. The trajectory of the blocks is computed by integrating movement equations that result in ballistic trajectories. A contact algorithm is used to determine when the flying particles impact the ground surface. This algorithm uses a bisection approach once the trajectory has intersected the ground surface to determine, with accuracy, the impact point. When the impact is detected, the rebound conditions are evaluated, and the new trajectory is defined. In case of fragmentation, the impacting rock mass is distributed among the fragments, which are treated as new blocks with their kinematic conditions.
The most recent version of RockGIS used in this study includes the following updates regarding the first version described in [
40]: the code base was moved from python to c++ to improve performance, the kinematics of the blocks are described as in [
37], and rotational velocity is also considered. The contact detection algorithm was modified to increase performance and the fractal fragmentation model was improved and completed [
66]. This code has been developed within the frame of the Rockmodels research project as part of the PhD thesis of the leading (first) author. The code runs in Linux and will be made available on an open source basis at
https://rockmodels.upc.edu/en once the research project is closed. The following sections describe the details of the main improvements in the RockGIS model.
2.1. Topographic Model
A high-resolution digital elevation model (DEM) is used. This consists of a grid containing information on the height of the surface in each cell. It is a simplification of the slope’s topographical surface that has some limitations. For example, overhangs cannot be considered in this approach, since only one Z value can be assigned to a single pair of planimetric X,Y coordinates. Some authors have prepared models that can work with point clouds [
38]. These can use extremely detailed models obtained from laser scanning or aerial photogrammetry, which overcome the DEM limitations. However, the use of a regular DEM to describe the topography makes it easier and faster to numerically account for the interaction between particles and the ground surface.
The Z-value of the terrain at certain X,Y coordinates is calculated using a bilinear interpolation between the four nearest neighboring cells. This approach gives a continuous interpolation of the surface based on the digital elevation model cells. In the code, a function called height to ground (H2G) gives the height of the block with respect to the slope surface. This function is used to detect contact between a flying block and the terrain.
2.2. Block Kinematics
Blocks are considered as points in space with all the mass concentrated (lumped mass approach) and they have, as state variables, a position , linear velocity , rotational velocity and volume. This approach does not explicitly account for the shape of the blocks except for the rebound model in which the blocks are assumed to be spheres (hybrid approach). Due to this simplification, some kinematic behaviors conditioned by the shape of the blocks may not be represented in a fully accurate way and may affect the result of the simulations. This deficiency is overcome by a thorough calibration process. Other variables, such as information regarding the parent fragment or the current motion state in the simulation algorithm are stored for numerical purposes. Blocks are subject to the gravity acceleration and by integrating the movement equations with a certain time discretization, , the parabolic trajectories are obtained. Considering an initial position, the linear and rotational velocity of a block in each time step of the simulation keeps producing a parabolic flight until contact with the terrain, mitigation structures, or virtual control sections are detected. During the interaction of the terrain, the rebound and fragmentation modules are applied and the resulting fragments and their reflected velocities are determined. Then, each fragment is treated as a new individual block and the flying phase is restarted.
2.3. Contact Detection
The contact detection between blocks and the terrain is computed by the bisection method, which is frequently used in photogrammetry [
73]. At every time step, the block moves according to its velocity and the value of H2G is checked. If the value is less than zero, it means that the block is located under the ground surface. Then, an iterative process, using the bisection method, determines the exact time step that makes the block intersect with the slope surface with a certain tolerance. This tolerance is always on the positive side of H2G to ensure that (numerically) the block never penetrates the ground.
2.4. Rebound Model
Once impact with the terrain is detected, a rebound algorithm is applied to compute the reflected velocity of the block. The first version of RockGIS used the model described in [
34]. The version presented in this study implements the approach proposed by [
37]. To determine the reflected velocity, this approach considers the incidence velocity with respect to the normal vector of the surface, its rotational velocity and restitution coefficients. It also considers a stochastic perturbation of the impact surface to account for the variability of the process. The restitution coefficients can be estimated using different approaches. In this study, the normal and tangential restitution coefficients are computed at each impact using Wyllie [
74] and Gischig et al’s [
37] equations, respectively. After each rebound, the amount of remaining normal kinetic energy is evaluated to determine whether the block fragments or not.
2.5. The Fragmentation Model
RockGIS can be used to consider both the disaggregation of the initial rock mass and the breakage of the blocks during propagation. The disaggregation of the IBSD is assumed in all cases and the trajectory of each of the blocks that is involved is modelled individually. A specific module is called every time a block hits the ground to check for the breakage criterion. This module decides whether the block remains intact or breaks. In the case of breakage, the module generates the new fragment size distribution based on the Rockfall Fractal Fragmentation Model [
66].
The previous version of the code [
40] considered invariable power law parameters at each impact for the entire simulation. In the upgraded version, the power law parameters depend on impact conditions and are specific for each impacting rock block. Thus, the way mass is distributed after the breakage is specific according to the kinematic conditions of the impacting block [
66].
The fragment volume distribution after breakage is generated by Equation (1). The fragment generation process ends when one of these two conditions are satisfied: (1) the last generated fragment is smaller than a user-defined minimum volume. In this study, this value was set to the minimum fragment volume measured in the field. This avoids a mathematically infinite loop reaching senselessly small fragment sizes, or (2) the sum of all generated fragments reaching the initial block volume. In this case, the last fragment is the difference between the sum of all previous generated fragments and the initial block volume.
where:
Vn volume of the fragment “n”;
V0 initial block volume;
n number of fragments, running from 1 to infinite;
Lmax largest generated fragment;
Df the fractal dimension.
Df controls the shape of the fragment distribution. Both
Lmax and the
Df depend on the model parameters
b and
q, as defined in Equations (2) and (3) (Perfect, 1997).
where:
b the proportion between the fragment size generated and the initial volume;
q the probability of survival, expressed as the proportion of the block that breaks to create new fragments.
These two model parameters,
b and
q, vary at each impact depending on the kinematic conditions. At each impact, the new surface area generated by breakage is estimated as a function of the normal impacting kinetic energy (Equation (4)).
where:
Na new generated surface area [m2];
Ekn kinetic energy in normal impact direction [J];
a1, a2 model parameters to calibrate.
This equation involves the impacting angle and block dimensions. The parameters a1, a2 can be estimated from the potential energy of first impacts of the inventoried rockfall. Ruiz-Carulla and Corominas [
66] found a relation between the new generated surface area and the initial area for each impact (Equation (5)), which can be related to the power law parameters (
b and
q) that control fragment distribution (Equations (6) and (7)).
where:
Na new generated surface area [m2];
Ta total surface area [m2];
Ia initial surface area [m2];
b1, b2 linear model parameters controlling ; must be calibrated;
q1, q2 linear model parameters controlling ; must be calibrated.
2.6. Energy Transfer to the Fragments
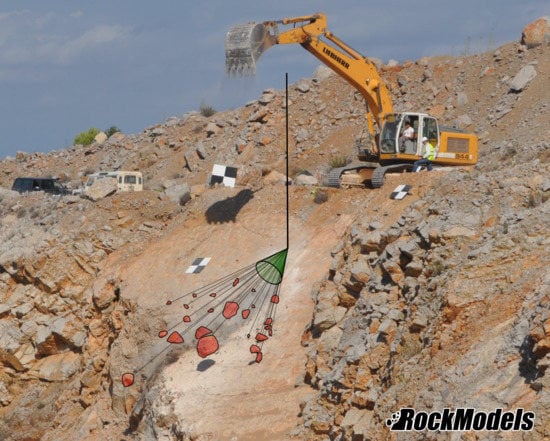
Finally, by adding a certain degree of stochasticity, the simulator defines the trajectories of the new fragments that are generated. The fragments are distributed within a cone of a given angle around the expected trajectory of the unbroken block. This approach is based on field observations (
Figure 1).
Once the list of generated fragments has been computed, linear and rotational velocities must be assigned to each fragment. The values estimated for energy loss during the fragmentation process in Giacomini et al. [
5] are used. The knowledge on energy transferred between fragments is still in its early stages and for simplicity, in this study, it is assumed that the energy is distributed throughout fragments proportionally to mass, which leads to the equal post-fragmentation velocity of all fragments. These velocities are assumed to remain within a cone whose revolution axis is on the outcome velocity computed by the rebound model. The aperture of the cone is defined by the angle θ. Normal unitary vectors are randomly computed inside the cone, following Hall’s [
75] method. These unitary vectors are multiplied by the outcome velocity and assigned to each of the generated fragments. From this point, each fragment is treated as a new block with its own state variables.
3. Experimental Testing
3.1. Experimental Site
To verify the performance of the code and validate the results, a set of real-scale rockfall fragmentation tests were carried out in a quarry in Vallirana municipality (41.3635 N, 1.9067 E), Barcelona, Spain. The lithology of the rock blocks is massive limestone. Six samples were extracted and tested in the laboratory resulting in an average density of 2650 kg/m3 and uniaxial compressive and tensile strengths of 103 MPa and 4.1 MPa, respectively.
The testing profile was selected inside the quarry in a zone of the steep slope bench where the rock was barely fractured, to ensure enough stiffness to break the blocks. The selected profile consists of a 42.4° inclined plane, which coincides with a natural discontinuity surface of the rock mass and where the first impacts after releasing the blocks were expected. An almost horizontal platform extends at the foot of the slope. The difference in height between the foot of the slope and the crown is 19 m (
Figure 2). The impact surface in the inclined plane is high resistance rock, and no main discontinuities were observed. In the horizontal platform at the foot of the slope, a thin layer of fine-grained soil (a few centimeters thick) overlays the rock mass.
3.2. Testing Set Up
A total of 21 massive limestone rock blocks were selected for this experiment and the methodology proposed in Gili et al. [
46] was followed. During the preparation of the test, three ellipses following the major axis of each block were painted to improve their visibility in the videos. All blocks were hand-measured using a tape measure to obtain an initial estimation of their volumes, which ranged between 0.5 and 2.25 cubic meters. To allow easier visual identification of the fragments that were generated, the fragments were removed after each release, so that the accumulation area was clear for the next release.
A backhoe was used to release the blocks from the top of the slope. Two marks painted on the edge defined the space in which blocks had to be released by the engine. The height at which each block was released depended on the operator’s criterion, for stability reasons. It ranged between 8 and 10 meters with respect the first impact point. Once the security protocol had been checked, the blocks were released (
Figure 3).
For georeferencing purposes, a total of 29 ground control points (GCP, targets and crosses painted on rock outcrops) were distributed throughout the scene. They were surveyed using GNSS technology to provide scale and georeference photographs and video images.
Photogrammetric techniques using drones were applied to obtain a 3D geometric reconstruction of the test scenario. The drone device used was a DJI Inspire 2 with a X5S camera (5280 × 3956 pixels sensors). About 150 pictures in zenithal and oblique orientations were taken at a distance of 30 meters from the ground, obtaining a resolution or Ground Sample Distance (GSD) of 7 mm/px. The GCP surveyed were used to georeference the model as well as to optimize the alignment of the cameras. The error in the control points was between 1.2 cm and 1.6 cm in planimetry and under 3 cm in altimetry. For the photogrammetric reconstruction, the software Agisoft Photoscan was used to obtain a dense point cloud of 74 × 10
6 points and the derived products, like a 3D mesh (
Figure 4), the Digital Elevation Model (DEM) of 20 cm/px and the orthophoto of 7 mm/px resolution.
Each test was recorded using three high-speed video cameras recording at 400 fps in full-HD definition (1920 × 1080 pixel) placed at about 60 m from the base of the slope and distributed so that they formed approximately a 40° angle. Since it was technically unfeasible to directly synchronize the cameras, a flashlight was placed at the bottom of the slope pointing to a reflective surface so that it was seen in the frame of the three cameras. The flash was fired several times during each release, to allow frame synchronization during the post-processing of the footage with a minimal error of 1/400 seconds. The tests were also recorded from a drone at 24 fps in 4K definition (3840 × 2160 pixel) flying above the scene, and once all the fragments had stopped, the drone was used to capture a set of photographs of the fragments scattered across the platform in order to build a 3D photogrammetric model of each deposit.
The next section describes the post-processing that was used to extract additional data from the field experiments that were required to calibrate the model. Finally, the calibration procedure for the multiple parameters controlling the simulation is explained.
3.3. Data Acquisition
After the photogrammetric flight and when the conditions were safe again, all the fragments were hand-measured using a tape measure to check the 3D model obtained by photogrammetry.
The data that were directly collected during the experimental campaign include: the volume of each block prior to release, measured with a tape measure; the height of the release point for each test using a total station; and three lengths defining the volume of the fragments generated by the impact and subsequent breakage. The latter will provide the RBSD for each test and the relation between the area and volume of the fragment (Equation (8)). This procedure is similar to that followed by Su and Yan [
76] to estimate the 3D sizes of particles from projected 2D images.
Manual georeferencing of the location of each fragment in the field was not possible since it would have been extremely time-consuming, considering that the volume of 1242 fragments was measured. The runout of each fragment was measured in the orthophoto provided by the UAV flights. The minimum fragment size measured was 8 × 10
−6 m
3, which corresponds to a 2 × 2 × 2 cm fragment. The location and the projected area of each block in the orthophoto was measured and then the volume of each fragment was calculated from Equation (8).
where:
The distances traveled by fragments were calculated on the orthophotos as the distance between the average release point and the centroids of the polygons that represent the fragments.
Once this correlation had been applied, a volume (Vfrag) could be assigned to each fragment drawn on the orthophoto to obtain the cumulative volume distribution as a function of the runout.
Figure 5a shows the polygons of the fragments produced by tested block #10 measured on the orthophoto and the estimated volume for each fragment. After estimating each fragment volume, the RBSD of block #10 can be obtained (
Figure 5b).
The aperture of the cone (θ) must be set in the fragmentation model. To estimate the ranges for this parameter, we measured, using video triangulation, the aperture of the most divergent fragments for each test [
69]. The values of the aperture ranged between 25° and 145°, with an average value of 75°. Note that these measurements were made in the three-dimensional space, not using a 2D projection of the cone on the orthophoto.
4. Calibration Procedure
The calibration phase of the model was challenging in this study, since several parameters concerning the rebound and fragmentation models had to be adjusted to make the results match the field observations. The selected goodness of fit indicators were the similarities of the simulation results to the field experiments for three criteria: (1) the RBSD obtained for all blocks, (2) the runout distribution, and (3) the cumulative spatial distribution of the volume of the fragments as a function of distance from the release point. When these three criteria had been obtained from the field experiments, the calibration process consisted of a trial and error iterative process.
Just one seeder was considered in the average position of the release position of the blocks during the experiments. A horizontal velocity of 0.2 m/s was imposed to consider the initial momentum given to the blocks due to the movement of the backhoe shovel during the release. The digital elevation model used in this study was obtained from a UAV flight prior to the execution of the tests performed on the slope with a resolution of 0.2 × 0.2 meters. Just one material was considered on the entire slope, since the fine layer over the bedrock at the base of the slope, which was used to make the surface even, was estimated to be around 2–5-cm thick. One simulation event consists of the release of the 21 tested blocks along with their respective fragment volumes measured in place. Note that, in the simulation, the rock fragments do not interact during propagation. Having set these initial conditions, the calibration procedure could begin.
First, a list of parameter combinations was generated using combinatorics. To achieve this, testing value ranges obtained from an iterative heuristic trial and error process were imposed for each parameter. The combination of all possible parameter values gives a total
cases to be tested, where
ni is the number of intervals of each parameter and
i is the number of considered parameters. Considering 10 parameters (
Table 1) and 20 intervals for each one, a total of 2.56 × 10
10 possible cases had to be simulated.
For each set of parameters, 1000 rockfall propagation simulations were run, varying the stochastic seed. The seed determines the random numbers used during the stochastic processes in the simulation and may change the results of a single simulation if modified. The results of the simulations are averaged to obtain a mean behavior representative of the parameter set that is independent of the initial randomness seed. If just one simulation is performed, the calibration would only be meaningful for a specific seed. Once averaged, the resultant distributions were compared against the experimental data.
The goodness of the optimization for each one of the three calibration criteria is evaluated as a function of the residuals. The statistic ε (Equation (9)) computes a mean error between two discrete distributions by considering the squared distance between simulation and measurement results and dividing by the total number of checkpoints.
where:
n total number of checkpoints;
Ei expected value on the checkpoint (field data);
Oi observed value on the checkpoint (simulation result).
To evaluate the experimental and simulated distributions at the same points, n = 1000 samples were examined between the maximum and minimum range of both distributions using linear interpolation between points.
The optimization of the calibration consists of finding the combination of parameters that minimizes the value of ε for the three considered criteria. To achieve this, both the product and the sum of the resulting ε were compared between parameter sets and the lowest value was selected.
Figure 6 shows the workflow for the entire calibration process.
To perform the huge amount of simulations, a parallelization script has been written so that a full simulation can be run in the RockGIS program for the 21 blocks, considering a specific parameter set in multiple CPU cores at a time. Each thread stored the ε values and, when all sets were tested, the best fitting ones were chosen. This entire process was run on an HPC using 24 cores. It took about 24 h.
5. Results and Discussion
After the calibration process, a set of parameters minimizing ε was obtained for each of the criteria.
Figure 7,
Figure 8 and
Figure 9 show the resultant volume, runout and cumulative volume distributions of the 1000 simulations performed with the optimized parameter set and using different seeds. The average curve of all simulations (blue) adjusted with values of ε of 0.028, 0.0015 and 0.4 for the three criteria, respectively. The values of the parameters resulting from the calibration are: na1 = 0.0031, na2 = 0.7562, b1 =−1.6125, b2 = 2.4875, q1 = −0.5125, q2 = 1.0, Kna = 19.54, Knb = −1.03, Kta = 22.6 and cone = 83°.
The average volume distribution fits well with the field measurements (
Figure 7). The least accurate part of the distribution is the tail, corresponding to the biggest blocks. The biggest fragment measured in the tests corresponded to a block that nearly did not break and measured 2.03 m
3, while the biggest fragment obtained in the simulations measured 1.53 m
3. The average volume of the maximum fragment produced in the simulations was 1.28 m
3. Each of the volume distributions produced by a single simulation remained within the average curve, which means that the volume distribution showed little sensitivity to seed changes. Fragmentation parameters depended on kinematic incident conditions and seed changes only affected the small stochastic perturbations applied to the terrain to account for the variability of the phenomena.
Regarding the runout distribution, the average curve of all simulations also matched the measured distribution well, although the maximum runout was slightly overestimated (
Figure 8). In the tests, the maximum measured runout distance was 35.2 m, while the average obtained in the simulations was 38.9 m. This distribution is more sensitive to the seed, as shown in
Figure 8, where simulations resulted in distributions that differed from the average curve. The variability of ejecting velocities after fragmentation, which were randomly assigned inside a cone, made some blocks follow high parabolic trajectories, while others were ejected almost tangentially to the surface. This variability explains why, in some simulations, the blocks may travel significantly long distances.
The cumulative volume curve (
Figure 9) shows that the model tends to accumulate more volume at the bottom of the slope than that observed in the tests. Furthermore, some big blocks traveled longer distances than in the simulations. After analyzing in depth the videos of all fragments greater than 0.3 m
3 that traveled a runout distance of more than 20 m, we qualitatively observed that they acquired high rotational speeds and ended their propagation by a rolling motion. Although our model accounts for rolling in a simplified way by small jumps, and considering its rotational motion on the rebound algorithm, the shape effect seems to allow some of the blocks to travel a few more meters.
The trajectory divergence of the simulations corresponded with that observed in the tests. The velocity of each 3D trajectory obtained from one simulation of the entire test with 21 blocks is shown in
Figure 10 on the 3D photogrammetric model. Deposited fragment size and projected trajectories of the same example of simulation are shown in
Figure 11.
Field and simulation fragment deposit density was analyzed by computing closed contours containing a defined percentage of fragments. From these contours, a map containing a specific percentage of blocks was obtained by iteratively counting the number of blocks inside each successive contour line. The resulting sets of lines for field data and simulations are shown in
Figure 12. As in the cumulative volume curve, the simulation tended to accumulate more fragments in the base of the slope, but the overall shape of the curves was qualitatively similar. Note that test results show more dispersion, for example on contours of 60%, where the width of the test polygon is 50% greater than the simulation width. This higher dispersion may be explained by the variability of the backhoe when blocks were released, since there was between 1–2 m of margin in the release operation.
All measured fragments in the field are shown classified by volumes in
Figure 13. The contours containing a defined percentage of total cumulative volume are also plotted. Note that a large fragment traveled a very long runout distance (the blue block shown on the left of
Figure 13). This corresponds to an initial released block of 1.8 m
3 that, after fragmenting on the first impact, projected the 0.9 m
3 fragment at an almost horizontal angle and with significant rotational velocity. This fragment travelled the last 6–8 m of its trajectory by rolling. However, most of the fragments remained within the 95% volume contour.
6. Sensitivity Analysis
A set of simulations was performed to assess the sensitivity of results in relation to the variability of the model parameters. Only one parameter was modified within a testing range for each simulation, while all the others were fixed.
The parameter set considered as a reference was the result of the calibration process. Each plot in
Figure 14 a–j shows the values of the three
ε statistics of each one of the calibration criteria (
Figure 7,
Figure 8 and
Figure 9), as a function of the tested parameter. The simulations showed high sensitivity to the pairs of parameters controlling fragmentation: na1, na2; b1, b2; and q1, q2 (
Figure 14a–f). Each pair displayed similar behavior within the testing range, as expected. Slight variations in the shape of these pairs of curves was due to discretization of the evaluation interval in each case. Note that b1, b2 and q1, q2 define a line, so the shape of the distributions must be very similar regardless of the parameter that varies (but with its corresponding value interval). In the case of
b, with a focus on runout only, two minimums could be found in the optimization curve but the volume curve showed a clear minimum around b1 = −1.6 and b2 = 2.49. The same occurred with
q where the optimum value was found to be around q1 = −0.54 and q2 = 1. A focus on the interval of values that give, for example, a value of the indicator
ε smaller than one in the case of runouts reveals that the range of acceptance of na1, b1 and q1 represents respectively 29%, 8% and 7% variation with respect to the optimum value, while for parameters na2, b2 and q2, the values are, respectively, 5%, 2% and 1.3%. As expected, slight changes in the exponent of the potential function controlling the new generated area and the slopes of the lines controlling b and q were found to have more influence on the final result.
Parameters that mostly control runout yield clear minima regarding the runout optimization curve. The optimum for
Kna is 19.5 on the runout curve and 19.3 on the volume one.
Knb (
Figure 14g,h), which is the exponent of the function, is extremely sensitive and departs from the minimum found at −1.03, affecting the results significantly.
Despite showing a clear minimum, the parameter
Kta, controlling the hyperbolic curve of the tangential restitution factor, was found to be more robust than those controlling normal restitution (
Figure 14i). The optimum value is around 23 in the case of the runout criterion and did not have a significant influence on the volume or cumulative volume criteria.
Finally, the aperture angle of the cone when a block fragment showed an optimum value around 95°, which is inside the range measured in the field (25°–145°), but differs a little from the average measured (75°). However, the values of the cone were found to be robust in relation to slight changes.
7. Conclusions
In this study, a rockfall simulation model including fragmentation RockGIS was calibrated to numerically reproduce real-scale rockfall fragmentation tests performed in a limestone quarry. A new continuous approach was implemented in the RockGIS trajectories simulator to account for rock fragmentation upon impact, which depends on the impact conditions (based on fractal theory).
The results of 21 real-scale rockfall tests provided the data to calibrate the model. The initial block volumes and the final distribution of fragments after their breakage were measured with a combination of techniques including a tape measure, photogrammetry from a UAV platform and video triangulation. Data collection was a slow process due to the large number of fragments, which easily exceeded 50 fragments on a single block release.
A statistical approach was considered for the calibration, as each set of parameters could give different results depending on the initial stochastic seeds. The calibration was performed with the mean behavior of a parameter set, considering 1000 simulations with random seeds. The calibration criteria considered the runout distance and the size distributions of all generated fragments and was performed stochastically. Both runout and volume experimental cumulative curves were properly reproduced using these approaches. The parametric analysis showed that the model is very sensitive to parameters that control the fragmentation process. The parameters that most affect the volume criterion are b1, b2, q1 and q2, which control the fractal laws applied for mass distribution after breakage. In the case of runout criteria, the parameters that most affect this are na1 and na2, controlling the new generated area after fragmentation, and kta and ktb, controlling the normal restitution coefficient after rebound. The cumulative volume versus runout criteria turned out not to be very sensitive to parameter variations. Finally, we should keep in mind that rockfalls, as well as fragmentation, are stochastic phenomena. To use our approach for risk analysis and the design of protective measures, a precise calibration is required to ensure the parameters are appropriate for the case study considered.
Author Contributions
Conceptualization, G.M., N.L., J.C., J.G. and R.R.-C.; data curation, G.M., N.L., J.C., J.G. and R.R.-C.; Formal analysis, G.M., R.R.-C. and A.P.; funding acquisition, N.L. and J.C.; investigation, G.M., N.L., J.C., J.G., R.R.-C. and A.P.; methodology; G.M., N.L., J.C., J.G. and R.R.-C.; project administration, N.L. and J.C.; Software, G.M. and A.P.; supervision, N.L., J.C. and J.G.; validation, N.L. and J.C.; visualization, G.M.; writing—original draf, G.M., N.L. and J.C.; writing—review & editing, G.M., N.L., J.C. and J.G. All authors have read and agreed to the published version of the manuscript.
Funding
This research was funded by the Spanish Ministry of Economy and Competitiveness and co-funded by the Agencia Estatal de Investigación (AEI) and The European Regional Development Fund (ERDF/FEDER, UE), grant number BIA2016- 75668-P, AEI/FEDER, UE.
Acknowledgments
This work has been carried out with the support of the Spanish Ministry of Economy and Competitiveness thanks to a fellowship to the first author (BES-2014-069795) and in the framework of the research project RockModels (Ref. BIA2016-75668-P, AEI/FEDER, UE). The collaboration of Canteras Hermanos Foj (Barcelona metropolitan area, Spain) is gratefully acknowledged.
Conflicts of Interest
The authors declare no conflict of interest.
References
- Varnes, D. Slope movement types and processes. In Landslides, Analysis and Control; Schuster, R.L., Krizek, R.J., Eds.; Transportation Research Board, Special Report No. 176; National Academy of Sciences: Washington, DC, USA, 1978; pp. 11–33. [Google Scholar]
- Hungr, O.; Leroueil, S.; Picarelli, L. The Varnes classification of landslide types, an update. Landslides 2014, 11, 167–194. [Google Scholar] [CrossRef]
- Chau, K.T.; Wong, R.H.C.; Liu, J.; Lee, C.F. Rockfall Hazard Analysis for Hong Kong Based on Rockfall Inventory. Rock Mech. Rock Eng. 2003, 36, 383–408. [Google Scholar] [CrossRef]
- Guzzetti, F.; Reichenbach, P.; Wieczorek, G.F. Rockfall hazard and risk assessment in the Yosemite Valley, California, USA. Nat. Hazards Earth Syst. Sci. 2003, 3, 491–503. [Google Scholar] [CrossRef]
- Giacomini, A.; Buzzi, O.; Renard, B.; Giani, G.P. Experimental studies on fragmentation of rock falls on impact with rock surfaces. Int. J. Rock Mech. Min. Sci. 2009, 46, 708–715. [Google Scholar] [CrossRef]
- Thoeni, K.; Giacomini, A.; Lambert, C.; Sloan, S.W.; Carter, J.P. A 3D discrete element modelling approach for rockfall analysis with drapery systems. Int. J. Rock Mech. Min. Sci. 2014, 68, 107–119. [Google Scholar] [CrossRef]
- Crosta, G.B.; Agliardi, F.; Frattini, P.; Lari, S. Key issues in rock fall modeling, hazard and risk assessment for rockfall protection. In Engineering Geology for Society and Territory—Volume 2: Landslide Processes; Lollino, G., Giordan, D., Crosta, G.B., Corominas, J., Azzam, R., Wasowski, J., Sciarra, N., Eds.; Springer International Publishing: Cham, Switzerland, 2015; pp. 43–58. [Google Scholar]
- Mitchell, A.; Hungr, O. Theory and calibration of the pierre 2 stochastic rock fall dynamics simulation program. Can. Geotech. J. 2017, 54, 18–30. [Google Scholar] [CrossRef]
- Asteriou, P.; Tsiambaos, G. Empirical Model for Predicting Rockfall Trajectory Direction. Rock Mech. Rock Eng. 2016, 49, 927–941. [Google Scholar] [CrossRef]
- Mavrouli, O.; Corominas, J.; Ibarbia, I.; Alonso, N.; Jugo, I.; Ruiz, J.; Luzuriaga, S.; Navarro, J.A. Integrated risk assessment due to slope instabilities in the roadway network of Gipuzkoa, Basque Country. Nat. Hazards Earth Syst. Sci. 2019, 19, 399–419. [Google Scholar] [CrossRef]
- Hoek, E. Analysis of rockfall hazards. In Practical Rock Engineering; Hoek, E., Ed.; 2000; pp. 141–165. Available online: https://www.rocscience.com/assets/resources/learning/hoek/Practical-Rock-Engineering-Full-Text.pdf (accessed on 7 May 2020).
- Lu, P.; Latham, J.-P. Developments in the Assessment of In-situ Block Size Distributions of Rock Masses. Rock Mech. Rock Eng. 1999, 32, 29–49. [Google Scholar] [CrossRef]
- Elmouttie, M.K.; Poropat, G.V. A Method to Estimate in Situ Block Size Distribution. Rock Mech. Rock Eng. 2012, 45, 401–407. [Google Scholar] [CrossRef]
- Ruiz-Carulla, R.; Corominas, J.; Mavrouli, O. A fractal fragmentation model for rockfalls. Landslides 2017, 14, 875–889. [Google Scholar] [CrossRef]
- Evans, S.G.; Hungr, O. The assessment of rockfall hazard at the base of talus slopes. Can. Geotech. J. 1993, 30, 620–636. [Google Scholar] [CrossRef]
- Corominas, J.; Mavrouli, O.; Ruiz-Carulla, R. Rockfall Occurrence and Fragmentation. In Advancing Culture of Living with Landslides; Sassa, K., Mikoš, M., Yin, Y., Eds.; Springer International Publishing: Cham, Switzerland, 2017; pp. 75–97. [Google Scholar]
- Jaboyedoff, M.; Dudt, J.P.; Labiouse, V. An attempt to refine rockfall hazard zoning based on the kinetic energy, frequency and fragmentation degree. Nat. Hazards Earth Syst. Sci. 2005, 5, 621–632. [Google Scholar] [CrossRef]
- Hantz, D. Quantitative assessment of diffuse rock fall hazard along a cliff foot. Nat. Hazards Earth Syst. Sci. 2011, 11, 1303–1309. [Google Scholar] [CrossRef]
- Bunce, C.M.; Cruden, D.M.; Morgenstern, N.R. Assessment of the hazard from rock fall on a highway. Can. Geotech. J. 1997, 34, 344–356. [Google Scholar] [CrossRef]
- Hungr, O.; Evans, S.G.; Hazzard, J. Magnitude and frequency of rock falls and rock slides along the main transportation corridors of southwestern British Columbia. Can. Geotech. J. 1999, 36, 224–238. [Google Scholar] [CrossRef]
- Ferlisi, S.; Cascini, L.; Corominas, J.; Matano, F. Rockfall risk assessment to persons travelling in vehicles along a road: The case study of the Amalfi coastal road (southern Italy). Nat. Hazards 2012, 62, 691–721. [Google Scholar] [CrossRef]
- Macciotta, R.; Martin, C.D.; Morgenstern, N.R.; Cruden, D.M. Quantitative risk assessment of slope hazards along a section of railway in the Canadian Cordillera—A methodology considering the uncertainty in the results. Landslides 2016, 13, 115–127. [Google Scholar] [CrossRef]
- Corominas, J.; Copons, R.; Moya, J.; Vilaplana, J.M.; Altimir, J.; Amigó, J. Quantitative assessment of the residual risk in a rockfall protected area. Landslides 2005, 2, 343–357. [Google Scholar] [CrossRef]
- Agliardi, F.; Crosta, G.B.; Frattini, P. Integrating rockfall risk assessment and countermeasure design by 3D modelling techniques. Nat. Hazards Earth Syst. Sci. 2009, 9, 1059–1073. [Google Scholar] [CrossRef]
- Mavrouli, O.; Corominas, J. Vulnerability of simple reinforced concrete buildings to damage by rockfalls. Landslides 2010, 7, 169–180. [Google Scholar] [CrossRef]
- Ferrero, A.M.; Migliazza, M. Landslide Transportation Network and Lifelines: Rockfall and Debris Flow BT—Landslide Science and Practice: Volume 6: Risk Assessment, Management and Mitigation; Margottini, C., Canuti, P., Sassa, K., Eds.; Springer Berlin Heidelberg: Berlin/Heidelberg, Germany, 2013; pp. 161–170. ISBN 978-3-642-31319-6. [Google Scholar]
- Volkwein, A.; Schellenberg, K.; Labiouse, V.; Agliardi, F.; Berger, F.; Bourrier, F.; Dorren, L.K.A.; Gerber, W.; Jaboyedoff, M. Rockfall characterisation and structural protection—A review. Nat. Hazards Earth Syst. Sci. 2011, 11, 2617–2651. [Google Scholar] [CrossRef]
- Lambert, S.; Bourrier, F.; Toe, D. Improving three-dimensional rockfall trajectory simulation codes for assessing the efficiency of protective embankments. Int. J. Rock Mech. Min. Sci. 2013, 60, 26–36. [Google Scholar] [CrossRef]
- Copons, R.; Vilaplana, J.M.; Linares, R. Rockfall travel distance analysis by using empirical models (Solà d’Andorra la Vella, Central Pyrenees). Nat. Hazards Earth Syst. Sci. 2009, 9, 2107–2118. [Google Scholar] [CrossRef]
- Jaboyedoff, M.; Labiouse, V. Technical Note: Preliminary estimation of rockfall runout zones. Nat. Hazards Earth Syst. Sci. 2011, 11, 819–828. [Google Scholar] [CrossRef]
- Guzzetti, F.; Crosta, G.; Detti, R.; Agliardi, F. STONE: A computer program for the three-dimensional simulation of rock-falls. Comput. Geosci. 2002, 28, 1079–1093. [Google Scholar] [CrossRef]
- Crosta, G.B.; Agliardi, F. A methodology for physically based rockfall hazard assessment. Nat. Hazards Earth Syst. Sci. 2003, 3, 407–422. [Google Scholar] [CrossRef]
- Dorren, L.K.A.; Berger, F.; Putters, U.S. Real-size experiments and 3-D simulation of rockfall on forested and non-forested slopes. Nat. Hazards Earth Syst. Sci. 2006, 6, 145–153. [Google Scholar] [CrossRef]
- Lan, H.; Derek Martin, C.; Lim, C.H. RockFall analyst: A GIS extension for three-dimensional and spatially distributed rockfall hazard modeling. Comput. Geosci. 2007, 33, 262–279. [Google Scholar] [CrossRef]
- Bourrier, F.; Dorren, L.; Nicot, F.; Berger, F.; Darve, F. Toward objective rockfall trajectory simulation using a stochastic impact model. Geomorphology 2009, 110, 68–79. [Google Scholar] [CrossRef]
- Leine, R.I.; Schweizer, A.; Christen, M.; Glover, J.; Bartelt, P.; Gerber, W. Simulation of rockfall trajectories with consideration of rock shape. Multibody Syst. Dyn. 2014, 32, 241–271. [Google Scholar] [CrossRef]
- Gischig, V.S.; Hungr, O.; Mitchell, A.; Bourrier, F. Pierre3D: A 3D stochastic rockfall simulator based on random ground roughness and hyperbolic restitution factors. Can. Geotech. J. 2015, 52, 1360–1373. [Google Scholar] [CrossRef]
- Noël, F.; Cloutier, C.; Turmel, D.; Locat, J. Using point clouds as topography input for 3D rockfall modeling. In Landslides and Engineered Slopes. Experience, Theory and Practice; CRC Press: Boca Raton, FL, USA, 2018; pp. 1531–1535. ISBN 9781315375007. [Google Scholar]
- Li, L.; Lan, H. Probabilistic modeling of rockfall trajectories: A review. Bull. Eng. Geol. Environ. 2015, 74, 1163–1176. [Google Scholar] [CrossRef]
- Matas, G.; Lantada, N.; Corominas, J.; Gili, J.A.; Ruiz-Carulla, R.; Prades, A. RockGIS: A GIS-based model for the analysis of fragmentation in rockfalls. Landslides 2017, 14, 1565–1578. [Google Scholar] [CrossRef]
- Ritchie, A.M. Evaluation of rockfall and its control. Highw. Res. Rec. 1963, 17, 13–28. [Google Scholar]
- Chau, K.T.; Wong, R.H.C.; Wu, J.J. Coefficient of restitution and rotational motions of rockfall impacts. Int. J. Rock Mech. Min. Sci. 2002, 39, 69–77. [Google Scholar] [CrossRef]
- Labiouse, V.; Heidenreich, B. Half-scale experimental study of rockfall impacts on sandy slopes. Nat. Hazards Earth Syst. Sci. 2009, 9, 1981–1993. [Google Scholar] [CrossRef]
- Spadari, M.; Giacomini, A.; Buzzi, O.; Fityus, S.; Giani, G.P. In situ rockfall testing in New South Wales, Australia. Int. J. Rock Mech. Min. Sci. 2012, 49, 84–93. [Google Scholar] [CrossRef]
- Volkwein, A.; Klette, J. Semi-automatic determination of rockfall trajectories. Sensors (Switzerland) 2014, 14, 18187–18210. [Google Scholar] [CrossRef]
- Gili, J.A.; Ruiz, R.; Matas, G.; Corominas, J.; Lantada, N.; Núñez, M.A.; Mavrouli, O.; Buill, F.; Moya, J.; Prades, A.; et al. Experimental study on rockfall fragmentation: In situ test design and first results. In Landslides and Engineered Slopes: Experience, Theory and Practice: Proceedings of the 12th International Symposium on Landslides, Napoli, Italy, 12–19 June 2016; CRC Press: Boca Raton, FL, USA, 2016; Volume 2, pp. 983–990. ISBN 9781138029880. [Google Scholar]
- Asteriou, P.; Saroglou, H.; Tsiambaos, G. Geotechnical and kinematic parameters affecting the coefficients of restitution for rock fall analysis. Int. J. Rock Mech. Min. Sci. 2012, 54, 103–113. [Google Scholar] [CrossRef]
- Asteriou, P.; Tsiambaos, G. Effect of impact velocity, block mass and hardness on the coefficients of restitution for rockfall analysis. Int. J. Rock Mech. Min. Sci. 2018, 106, 41–50. [Google Scholar] [CrossRef]
- Corominas, J.; Matas, G.; Ruiz-Carulla, R. Quantitative analysis of risk from fragmental rockfalls. Landslides 2019, 16, 5–21. [Google Scholar] [CrossRef]
- Lilly, P. An Empirical Method of Assessing Rockmass blastability. In Proceedings of the Large Open Pit Mine Conference, Queensland, Australia, October 1986; pp. 89–92. [Google Scholar]
- Hudaverdi, T.; Kuzu, C.; Fisne, A. Investigation of the blast fragmentation using the mean fragment size and fragmentation index. Int. J. Rock Mech. Min. Sci. 2012, 56, 136–145. [Google Scholar] [CrossRef]
- Wang, Y.; Tonon, F. Discrete element modeling of rock fragmentation upon impact in rock fall analysis. Rock Mech. Rock Eng. 2011, 44, 23–35. [Google Scholar] [CrossRef]
- Bourrier, F.; Hungr, O. Rockfall Dynamics: A Critical Review of Collision and Rebound Models. In Rockfall Engineering; John Wiley & Sons, Inc.: Hoboken, NJ, USA, 2013; pp. 175–209. ISBN 9781848212565. [Google Scholar]
- Sala, Z.; Jean Hutchinson, D.; Harrap, R. Simulation of fragmental rockfalls detected using terrestrial laser scans from rock slopes in south-central British Columbia, Canada. Nat. Hazards Earth Syst. Sci. 2019, 19, 2385–2404. [Google Scholar] [CrossRef]
- Luo, G.; Xiewen, H.; Yingjin, D.; Jiankang, F.; Xuefeng, M. A collision fragmentation model for predicting the distal reach of brittle fragmentable rock initiated from a cliff. Bull. Eng. Geol. Environ. 2019, 78, 579–592. [Google Scholar] [CrossRef]
- Davies, T.R.; McSaveney, M.J.; Hodgson, K.A. A fragmentation-spreading model for long-runout rock avalanches. Can. Geotech. J. 1999, 36, 1096–1110. [Google Scholar] [CrossRef]
- Davies, T.R.; McSaveney, M.J. Dynamic simulation of the motion of fragmenting rock avalanches. Can. Geotech. J. 2002, 39, 789–798. [Google Scholar] [CrossRef]
- Crosta, G.B.; Frattini, P.; Fusi, N. Fragmentation in the Val Pola rock avalanche, Italian Alps. J. Geophys. Res. Earth Surf. 2007, 112. [Google Scholar] [CrossRef]
- De Blasio, F.V.; Crosta, G.B. Extremely Energetic Rockfalls: Some preliminary estimates. In Landslides and Engineered Slopes. Experience, Theory and Practice; CRC Press: Boca Raton, FL, USA, 2016; Volume 2, pp. 759–764. ISBN 9781138029880. [Google Scholar]
- De Blasio, F.V.; Crosta, G.B. Simple physical model for the fragmentation of rock avalanches. Acta Mech. 2014, 225, 243–252. [Google Scholar] [CrossRef]
- De Blasio, F.V.; Dattola, G.; Crosta, G.B. Extremely Energetic Rockfalls. J. Geophys. Res. Earth Surf. 2018, 123, 2392–2421. [Google Scholar] [CrossRef]
- Macciotta, R.; Martin, C.D. Remote structural mapping and discrete fracture networks to calculate rock fall volumes at Tornado Mountain, British Columbia. In Proceedings of the 49th US Rock Mechanics/Geomechanics Symposium, San Francisco, CA, USA, 28 June–1 July 2015. [Google Scholar]
- Mandelbrot, B.B. The Fractal Geometry of Nature; W. H. Freeman: New York, NY, USA, 1982. [Google Scholar]
- Turcotte, D.L. Fractals and fragmentation. J. Geophys. Res. 1986, 91, 1921–1926. [Google Scholar] [CrossRef]
- Marchelli, M.; De Biagi, V. Optimization methods for the evaluation of the parameters of a rockfall fractal fragmentation model. Landslides 2019, 16, 1385–1396. [Google Scholar] [CrossRef]
- Ruiz-Carulla, R.; Corominas, J. Analysis of Rockfalls by Means of a Fractal Fragmentation Model. Rock Mech. Rock Eng. 2019, 1–23. [Google Scholar] [CrossRef]
- Ruiz-Carulla, R.; Corominas, J.; Mavrouli, O. A methodology to obtain the block size distribution of fragmental rockfall deposits. Landslides 2015, 12, 815–825. [Google Scholar] [CrossRef]
- Mavrouli, O.; Corominas, J. Comparing rockfall scar volumes and kinematically detachable rock masses. Eng. Geol. 2017, 219, 64–73. [Google Scholar] [CrossRef]
- Prades, A.; Matas, G.; Núñez-Andrés, A.; Buill, F.; Nieves, N.; Corominas, J. Determinación de trayectorias de bloques rocosos en ensayos mediante videogrametría. In Proceedings of the Primer Congreso en Ingeniería Geomática, Valencia, España, 5–6 July 2017; pp. 34–40. [Google Scholar]
- Zhao, T.; Crosta, G.B.; Dattola, G.; Utili, S. Dynamic Fragmentation of Jointed Rock Blocks During Rockslide-Avalanches: Insights from Discrete Element Analyses. J. Geophys. Res. Solid Earth 2018, 123, 3250–3269. [Google Scholar] [CrossRef]
- Ye, Y.; Thoeni, K.; Zeng, Y.; Buzzi, O.; Giacomini, A. A novel 3D clumped particle method to simulate the complex mechanical behavior of rock. Int. J. Rock Mech. Min. Sci. 2019, 120, 1–16. [Google Scholar] [CrossRef]
- Ye, Y.; Thoeni, K.; Zeng, Y.; Buzzi, O.; Giacomini, A. Numerical Investigation of the Fragmentation Process in Marble Spheres Upon Dynamic Impact. Rock Mech. Rock Eng. 2019, 53, 1287–1304. [Google Scholar] [CrossRef]
- Sheng, Y. Theoretical Analysis of the Iterative Photogrammetric Method to Determining Ground Coordinates from Photo Coordinates and a DEM. Photogramm. Eng. Remote Sens. 2005, 71, 863–871. [Google Scholar] [CrossRef]
- Wyllie, D.C. Calibration of rock fall modeling parameters. Int. J. Rock Mech. Min. Sci. 2014, 67, 170–180. [Google Scholar] [CrossRef]
- Hall, D.C. Sampling random directions within an elliptical cone. Comput. Phys. Commun. 2017, 219, 87–90. [Google Scholar] [CrossRef]
- Su, D.; Yan, W.M. Prediction of 3D size and shape descriptors of irregular granular particles from projected 2D images. Acta Geotech. 2019. [Google Scholar] [CrossRef]
Figure 1.
Example of a cone-shaped distribution of fragments produced after the impact of a block against a 42.4° inclined slope surface during a real-scale test performed in this study.
Figure 1.
Example of a cone-shaped distribution of fragments produced after the impact of a block against a 42.4° inclined slope surface during a real-scale test performed in this study.
Figure 2.
Testing profile.
Figure 2.
Testing profile.
Figure 3.
Example of the release of a block. The time step between selected frames is 0.33 s.
Figure 3.
Example of the release of a block. The time step between selected frames is 0.33 s.
Figure 4.
Photogrammetric model with the position of some of the targets used as ground control points and the positions of the high-speed video cameras recording the scene.
Figure 4.
Photogrammetric model with the position of some of the targets used as ground control points and the positions of the high-speed video cameras recording the scene.
Figure 5.
This figure shows an example of the data obtained in tested block #10: (a) fragments generated by breakage. The area of the projected fragment was measured on the orthophoto was measured. The volumes were estimated from the correlation equation (Equation (8)); (b) fragment volume distribution produced. The fractal behavior is described by the power law that is drawn.
Figure 6.
Workflow of the calibration process used to adjust the volume, runout and cumulative volume distributions of the field tests.
Figure 6.
Workflow of the calibration process used to adjust the volume, runout and cumulative volume distributions of the field tests.
Figure 7.
Comparison of rockfall block size distribution measured in real-scale tests with the average of the simulation results. Results of each individual simulation are shown in gray, while the average behavior is in blue.
Figure 7.
Comparison of rockfall block size distribution measured in real-scale tests with the average of the simulation results. Results of each individual simulation are shown in gray, while the average behavior is in blue.
Figure 8.
Comparison of rockfall runout distribution measured in real-scale tests with the average of the simulation results. Results of each individual simulation are shown in gray, while the average behavior is in blue.
Figure 8.
Comparison of rockfall runout distribution measured in real-scale tests with the average of the simulation results. Results of each individual simulation are shown in gray, while the average behavior is in blue.
Figure 9.
Deposited cumulative volume as a function of the runout distance from the release point. The results of each individual simulation are shown in gray, while the average behavior is in blue.
Figure 9.
Deposited cumulative volume as a function of the runout distance from the release point. The results of each individual simulation are shown in gray, while the average behavior is in blue.
Figure 10.
Trajectories of all fragments produced during one simulation of the entire test (21 blocks released).
Figure 10.
Trajectories of all fragments produced during one simulation of the entire test (21 blocks released).
Figure 11.
Fragment stopping points and trajectories of one run of the test (21 blocks simulated).
Figure 11.
Fragment stopping points and trajectories of one run of the test (21 blocks simulated).
Figure 12.
Contours containing a certain percentage of stopped fragments for both field measurements and simulation results.
Figure 12.
Contours containing a certain percentage of stopped fragments for both field measurements and simulation results.
Figure 13.
Contours containing a certain percentage of deposited volume and measured fragments on the orthophoto obtained from the simulations.
Figure 13.
Contours containing a certain percentage of deposited volume and measured fragments on the orthophoto obtained from the simulations.
Figure 14.
Results of the sensitivity analysis. Each plot shows the evolution of the three calibration criteria (volumes, runout and cumulative volume versus runout) within the testing range for each one of the tested parameters. The dashed vertical lines mark the optimal value of the parameter. (a–f): fragmentation law parameters; (g–h): parameters controlling normal restitution coefficients; (i): tangential restitution coefficient parameter and (j) cone aperture when fragmentation occurs.
Table 1.
List of parameters considered for the model calibration.
Table 1.
List of parameters considered for the model calibration.
| Parameter | Description |
|---|
| Kna | Multiplier of the power law relating the normal impact velocity with the normal restitution coefficient [75]. |
| Knb | Exponent of the power law relating the normal impact velocity with the normal restitution coefficient [75]. |
| Kta | Parameter that controls the hyperbolic curve of the tangential restitution coefficient with the tangential impact velocity [37]. |
| a1 | Multiplier of the power law relating the normal impact remaining energy and the new area (Equation (4)). |
| a2 | Multiplier of the power law relating the normal impact remaining energy and the new area (Equation (4)). |
| b1 | Multiplier of the power law relating the fractal dimension and the new area (Equation (6)). |
| b2 | Exponent of the power law relating the fractal dimension and the new area (Equation (6)). |
| q1 | Multiplier of the power law relating the probability of survival with the new area (Equation (7)). |
| q2 | Multiplier of the power law relating the probability of survival with the new area (Equation (7)). |
| cone | Angle defining the cone in which fragments may propagate after breakage (in degrees) |
© 2020 by the authors. Licensee MDPI, Basel, Switzerland. This article is an open access article distributed under the terms and conditions of the Creative Commons Attribution (CC BY) license (http://creativecommons.org/licenses/by/4.0/).

 ,
, 


