Viticulture in the Laetanian Region (Spain) during the Roman Period: Predictive Modelling and Geomatic Analysis
Abstract
:1. Introduction
2. Materials and Methods
2.1. Research Area
2.2. Romanization and Viticulture
2.3. Dataset
2.3.1. Archaeological Dataset
2.3.2. Topographic Dataset and Socio-Economic Dataset
2.4. Predictive Modelling
2.4.1. Modelling Modules and Automatization Procedure
2.4.2. Variable Selection by Expert Knowledge
2.4.3. Automated Variable Selection by Statistical Dispersion
2.5. Visualization of Results in an Interactive Web Map
3. Results
3.1. Spatial Distribution of Archaeological Sites
3.2. Predictive Modelling
3.2.1. Variable Selection by Expert Knowledge
3.2.2. Automated Variable Selection by Statistical Dispersion
- The two described methods for variable importance ranking.
- Different thresholds for inter-variable correlations.
- Different numbers of predictor variables.
- Different buffer area sizes of 50, 100 and 150 m.
- Variable importance-based weighting or no variable weighting.
3.3. Interactive Web Map
4. Discussion
5. Conclusions
Author Contributions
Funding
Conflicts of Interest
Appendix A
| 1 | 2 | 3 | 4 | 5 | 6 | 7 | 8 | 9 |
|---|---|---|---|---|---|---|---|---|
| all | 100 | - | 5 | 0.75 | 62.2 | 0.76018 | 0.89358 | wE |
| all | 100 | - | 6 | 0.75 | 60.98 | 0.76649 | 0.88189 | wE |
| all | 100 | - | 5 | 0.6 | 59.76 | 0.75384 | 0.83667 | wE |
| all | 100 | - | 4 | 0.75 | 64.63 | 0.77161 | 0.82079 | wE |
| all | 100 | - | 4 | 0.6 | 59.76 | 0.75805 | 0.78433 | wE |
| all | 100 | - | 5 | 0.9 | 57.32 | 0.77141 | 0.77412 | wE |
| all | 100 | - | 4 | 0.9 | 47.56 | 0.73512 | 0.75365 | wE |
| all | 100 | - | 6 | 0.9 | 59.76 | 0.76349 | 0.72244 | wE |
| all | 100 | - | 6 | 0.6 | 56.1 | 0.74898 | 0.67689 | wE |
| all | 100 | - | 4 | 0.75 | 63.41 | 0.78526 | 0.81762 | IQRnorm |
| all | 100 | - | 4 | 0.6 | 63.41 | 0.78526 | 0.81762 | IQRnorm |
| all | 100 | - | 4 | 0.9 | 53.66 | 0.78484 | 0.79106 | IQRnorm |
| all | 100 | - | 5 | 0.75 | 65.85 | 0.7893 | 0.88384 | IQRnorm |
| all | 100 | - | 5 | 0.6 | 65.85 | 0.7893 | 0.88384 | IQRnorm |
| all | 100 | - | 5 | 0.9 | 53.66 | 0.77443 | 0.76765 | IQRnorm |
| all | 100 | - | 6 | 0.75 | 68.29 | 0.78024 | 0.8724 | IQRnorm |
| all | 100 | - | 6 | 0.6 | 62.2 | 0.78863 | 0.87908 | IQRnorm |
| all | 100 | - | 6 | 0.9 | 57.32 | 0.78219 | 0.81731 | IQRnorm |
| 1 | 2 | 3 | 4 | 5 | 6 | 7 | 8 | 9 |
|---|---|---|---|---|---|---|---|---|
| all | 100 | - | 5 | 0.75 | 62.2 | 0.76018 | 0.89358 | wE |
| Without hill | 100 | - | 5 | 0.75 | 62.2 | 0.76018 | 0.89358 | wE |
| all | 100 | wE | 5 | 0.75 | 67.07 | 0.75477 | 0.87128 | wE |
| Without hill | 100 | wE | 5 | 0.75 | 67.07 | 0.75477 | 0.87128 | wE |
| Without coast | 100 | - | 5 | 0.75 | 60.98 | 0.7386 | 0.82593 | wE |
| Without coast | 100 | wE | 5 | 0.75 | 63.41 | 0.73364 | 0.82593 | wE |
| all | 250 | - | 5 | 0.75 | 48.78 | 0.78253 | 0.80205 | wE |
| Without hill | 250 | - | 5 | 0.75 | 48.78 | 0.78253 | 0.80205 | wE |
| all | 250 | wE | 5 | 0.75 | 48.78 | 0.75639 | 0.7659 | wE |
| Without hill | 250 | wE | 5 | 0.75 | 48.78 | 0.75639 | 0.7659 | wE |
| Without coast | 50 | wE | 5 | 0.75 | 68.29 | 0.74044 | 0.74508 | wE |
| all | 50 | wE | 5 | 0.75 | 70.73 | 0.75838 | 0.73115 | wE |
| Without hill | 50 | wE | 5 | 0.75 | 70.73 | 0.75838 | 0.73115 | wE |
| Without coast | 50 | - | 5 | 0.75 | 68.29 | 0.7525 | 0.71854 | wE |
| all | 50 | - | 5 | 0.75 | 69.51 | 0.77474 | 0.71303 | wE |
| Without hill | 50 | - | 5 | 0.75 | 69.51 | 0.77474 | 0.71303 | wE |
| Without coast | 250 | wE | 5 | 0.75 | 45.12 | 0.72785 | 0.69494 | wE |
| Without coast | 250 | - | 5 | 0.75 | 45.12 | 0.74555 | 0.69358 | wE |
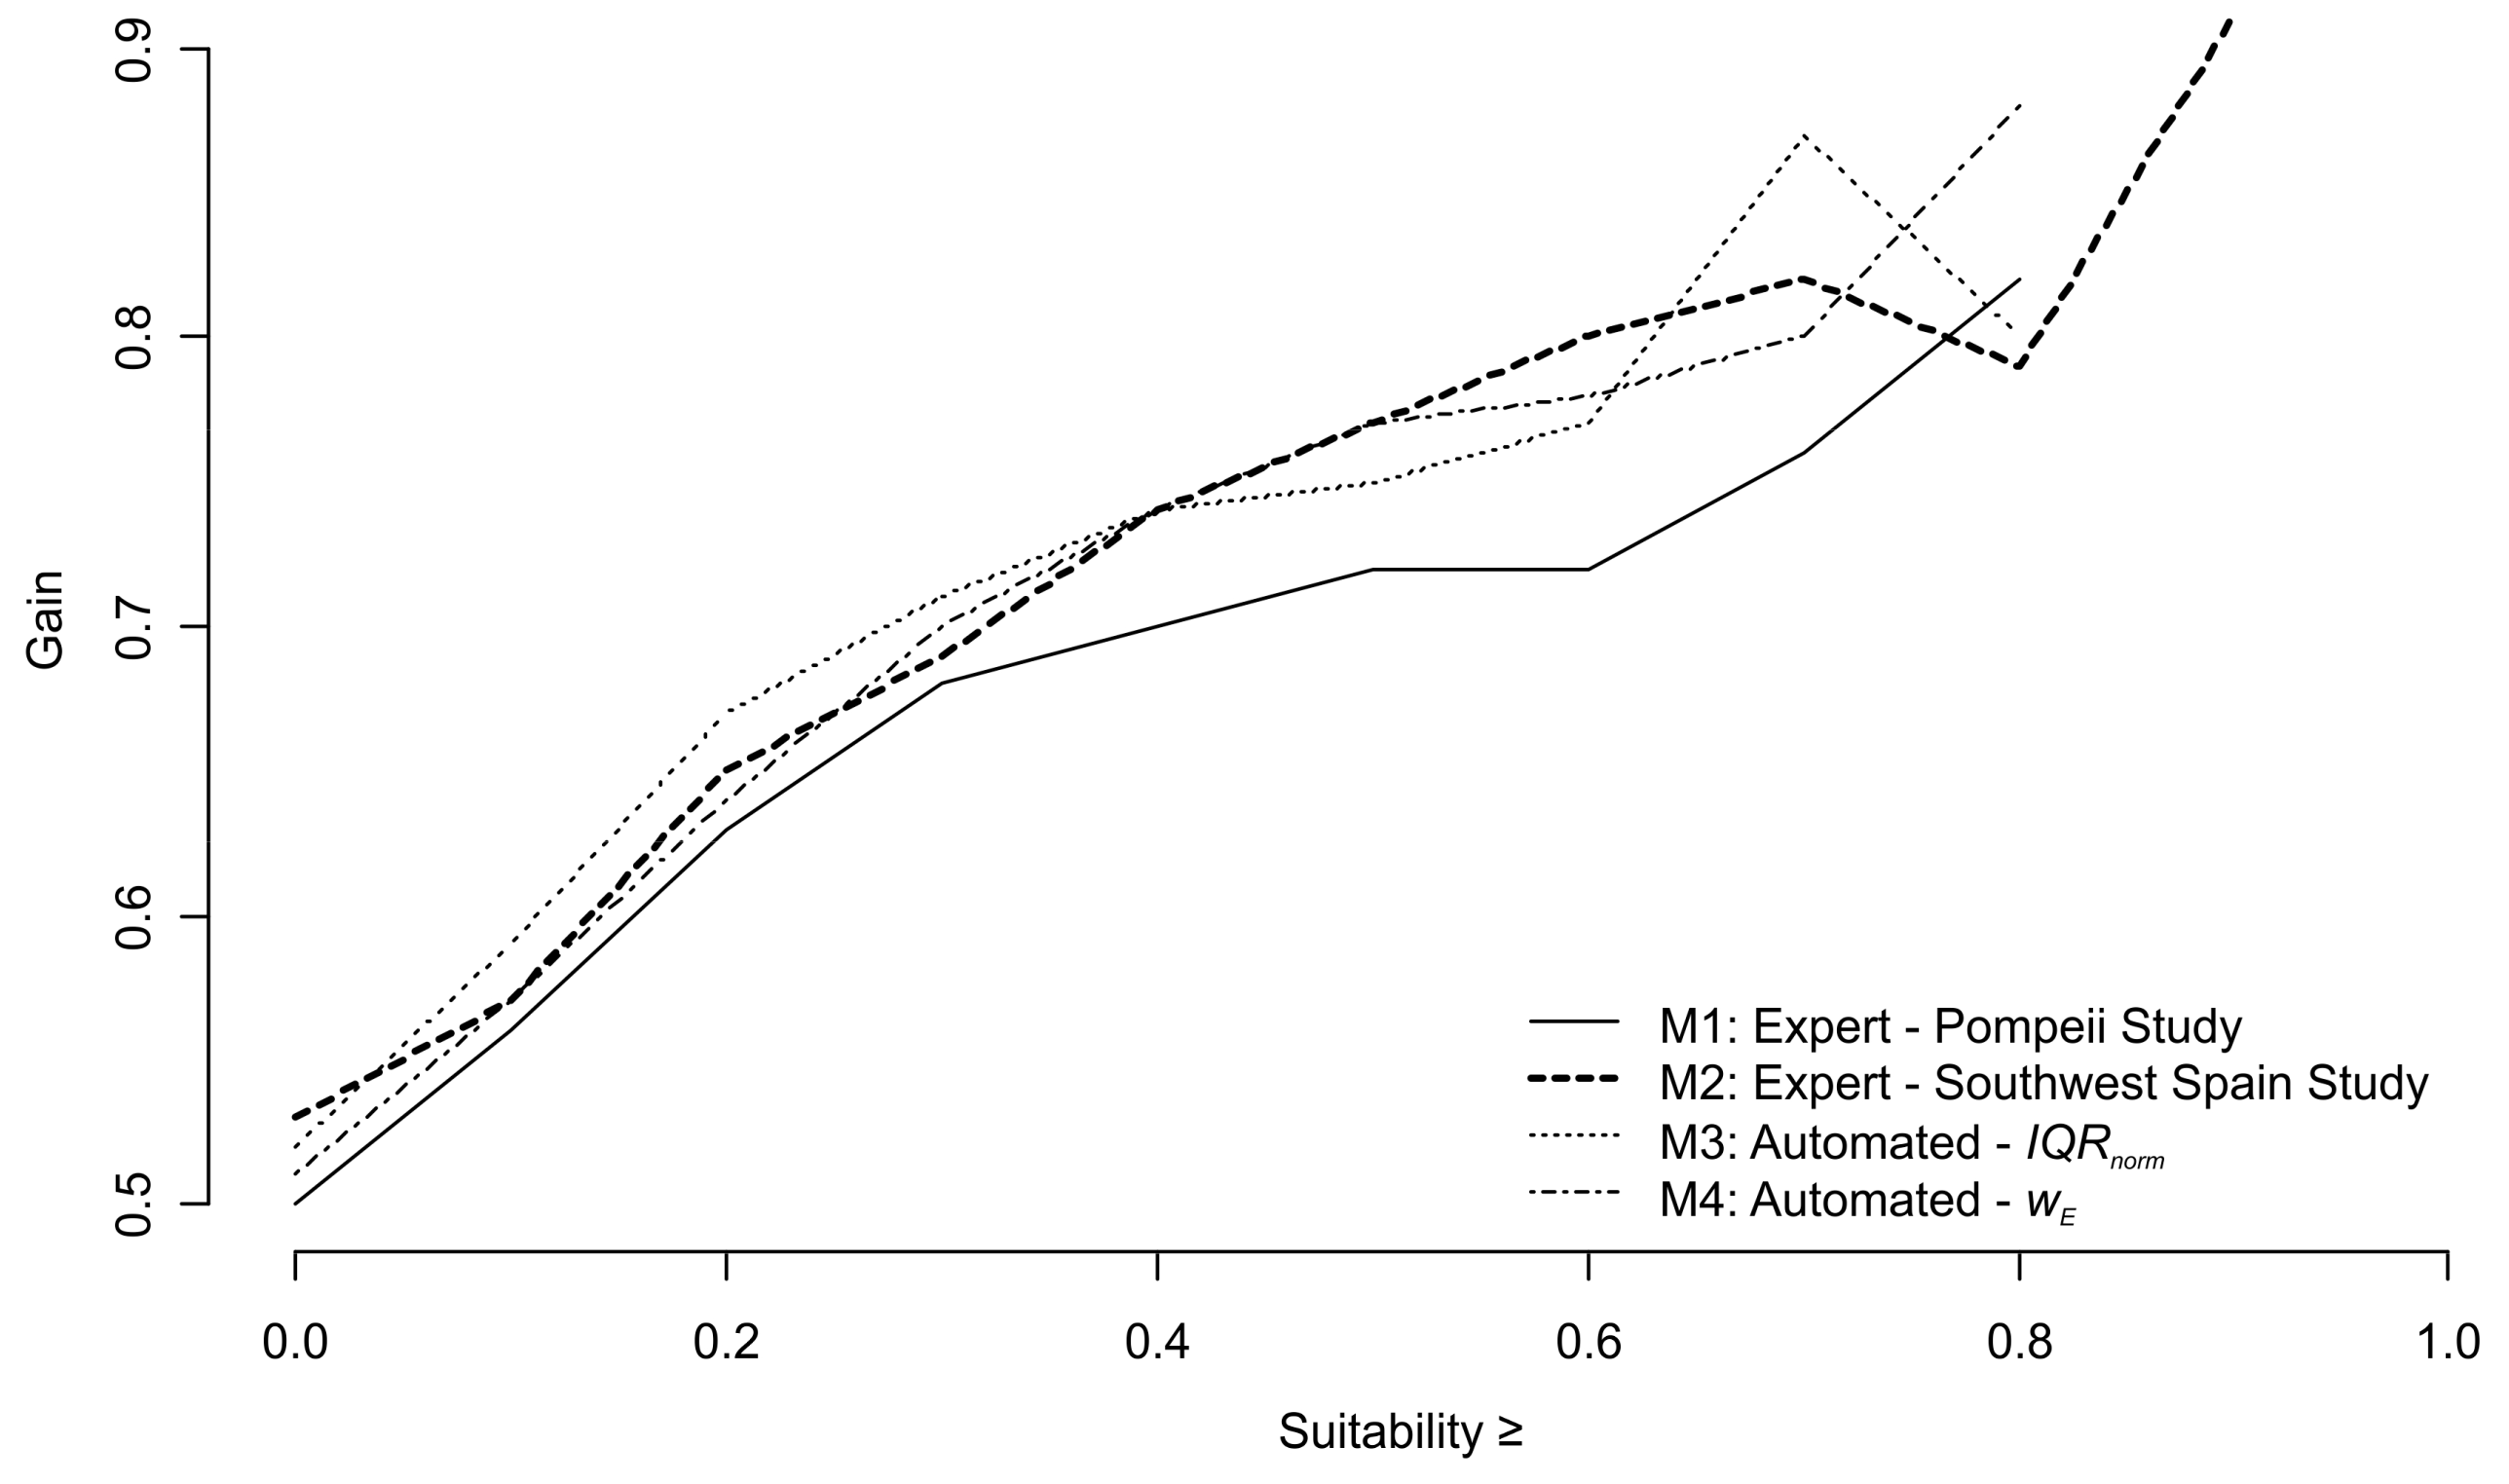
| Suitability ≥ | Gain | % Area | % Sites |
|---|---|---|---|
| M1—Expert: Pompeii Study | |||
| 0.00 | 0.50 | 49.31 | 100.00 |
| 0.10 | 0.56 | 43.90 | 100.00 |
| 0.20 | 0.63 | 36.58 | 98.78 |
| 0.30 | 0.68 | 29.42 | 91.46 |
| 0.40 | 0.70 | 21.56 | 70.73 |
| 0.50 | 0.72 | 13.17 | 46.34 |
| 0.60 | 0.72 | 6.44 | 23.17 |
| 0.70 | 0.76 | 2.32 | 9.76 |
| 0.75 | 0.78 | 1.31 | 6.10 |
| 0.80 | 0.82 | 0.66 | 3.66 |
| 0.90 | 0.10 | 0.00 | |
| M2—Expert: Southwest Spain Study | |||
| 0.00 | 0.53 | 47.37 | 100.00 |
| 0.10 | 0.57 | 43.31 | 100.00 |
| 0.20 | 0.65 | 34.50 | 98.78 |
| 0.30 | 0.69 | 29.15 | 95.12 |
| 0.40 | 0.74 | 22.97 | 87.80 |
| 0.50 | 0.77 | 17.58 | 76.83 |
| 0.60 | 0.80 | 10.59 | 53.66 |
| 0.70 | 0.82 | 5.08 | 28.05 |
| 0.75 | 0.83 | 3.76 | 21.95 |
| 0.80 | 0.79 | 2.06 | 9.76 |
| 0.90 | 0.91 | 0.22 | 2.44 |
| M3—Automated: IQRnorm | |||
| 0.10 | 0.57 | 43.44 | 100.00 |
| 0.20 | 0.64 | 35.10 | 98.78 |
| 0.30 | 0.70 | 28.14 | 95.12 |
| 0.40 | 0.74 | 22.15 | 84.15 |
| 0.50 | 0.77 | 16.00 | 68.29 |
| 0.60 | 0.78 | 9.21 | 42.68 |
| 0.70 | 0.81 | 3.49 | 18.29 |
| 0.75 | 0.84 | 1.76 | 10.98 |
| 0.80 | 0.88 | 0.75 | 6.10 |
| 0.90 | 0.08 | 0.00 | |
| M4—Automated: wE | |||
| 0.10 | 0.59 | 41.49 | 100.00 |
| 0.20 | 0.67 | 33.29 | 100.00 |
| 0.30 | 0.71 | 26.75 | 92.68 |
| 0.40 | 0.74 | 21.52 | 81.71 |
| 0.50 | 0.75 | 16.45 | 67.07 |
| 0.60 | 0.77 | 10.32 | 43.90 |
| 0.70 | 0.76 | 4.04 | 17.07 |
| 0.75 | 0.87 | 1.88 | 14.63 |
| 0.80 | 0.80 | 0.73 | 3.66 |
| 0.90 | 0.05 | 0.00 | |
References
- Waters, N.M. History of GIS. In International Encyclopedia of Geography: People, the Earth, Environment, and Technology; Richardson, D., Castree, N., Goodchild, M.F., Kobayashi, A., Liu, W., Marston, R., Eds.; Wiley: Hoboken, NJ, USA, 2017; pp. 1–12. [Google Scholar]
- Verhagen, P. Case Studies in Archaeological Predictive Modelling; Amsterdam University Press: Amsterdam, The Netherlands, 2007. [Google Scholar]
- Kvamme, K.L. Development and testing of quantitative models. In Quantify the Present and Predicting the Past; Judge, W.J., Sebastian, L., Eds.; US Department of the Interior, Bureau of Land Management: Denver, CO, USA, 1988; pp. 325–428. [Google Scholar]
- Kohler, T.A.; Parker, S.C. Predictive Models for Archaeological Resource Location. In Advances in Archaeological Method and Theory; Elsevier BV: Amsterdam, The Netherlands, 1986; pp. 397–452. [Google Scholar]
- Duncan, R.; Beckman, K.; Wescott, K.; Brandon, R. The Application of GIS Predictive Site Location Models within Pennsylvania and West Virginia. In Practical Applications of GIS for Archaeologists; Informa UK Limited: Colchester, UK, 1999; pp. 33–58. [Google Scholar]
- Freimark, H. Geovisualisierung Im Rahmen Eines Warnsystems Für Vulkane—Entwicklung Eines Interaktiven, Kartographischen Internetwerkzeugs Für Die Analyse Seismisch-Tomographischer Daten am Beispiel der Vulkaninsel Nisyros. Master’s Thesis, University of Stuttgart, Stuttgart, Germany, March 2002. [Google Scholar]
- Goodchild, H. Modelling Roman agricultural production in the Middle Tiber Valley, Central Italy. Ph.D. Thesis, The University of Birmingham, Birmingham, UK, April 2007. [Google Scholar]
- Vogel, S.; Maerker, M.; Esposito, D.; Seiler, F. The Ancient Rural Settlement Structure in the Hinterland of Pompeii Inferred from Spatial Analysis and Predictive Modeling of Villae Rusticae. Geoarchaeology 2016, 31, 121–139. [Google Scholar] [CrossRef]
- Casarotto, A.; Pelgrom, J.; Stek, T.D. A systematic GIS-based analysis of settlement developments in the landscape of Venusia in the Hellenistic-Roman period. Archaeol. Anthr. Sci. 2017, 11, 735–753. [Google Scholar] [CrossRef] [Green Version]
- Trapero Fernández, P. Roman viticulture analysis based on Latin agronomists and the application of a geographic information system in lower Guadalquivir. Virtual Archaeol. Rev. 2016, 7, 53. [Google Scholar] [CrossRef] [Green Version]
- Revert, N. Building new explanations about Roman settlement patterns: Predictive modelling in Northern Gaul. Inter Sect. J. 2018, 4, 9–21. [Google Scholar]
- Franconi, T.; Green, C. Broad and Coarse: Modelling Demography, Subsistence and Transportation in Roman England. In Finding the Limits of the Limes: Modelling Demography, Economy and Transport on the Edge of the Roman Empire; Verhagen, P., Joyce, J., Groenhuijzen, M.R., Eds.; Springer International Publishing: Berlin/Heidelberg, Germany, 2019; pp. 61–75. [Google Scholar]
- Oliveras, M.; Revilla, V. The Economy of Laetanian Wine: A Conceptual Framework to Analyse an Intensive/Specialized Winegrowing Production System and Trade (First Century BC to Third Century AD). In Finding the Limits of the Limes: Modelling Demography, Economy and Transport on the Edge of the Roman Empire; Verhagen, P., Joyce, J., Groenhuijzen, M.R., Eds.; Springer International Publishing: Berlin/Heidelberg, Germany, 2019; pp. 129–164. [Google Scholar]
- Alber, N. Zur Besiedlungsentwicklung der zentralen katalanischen Küste im 2. und 1. Jh. v.Chr. Master’s Thesis, University of Vienna, Vienna, Austria, 2003. [Google Scholar]
- Palet, J.M.; Brugués, R.J.; Riera, S.; Orengo, H.A.; Picornell, L.; Llergo, Y. The role of the Montjuïc promontory (Barcelona) in landscape change: Human impact during roman times. In Variabilites Environnementales, Mutations Sociales. Nature, Intensités, Échelles et Temporalités des Changements. XXXIIe Rencontres Internationales D’archéologie et D’histoire D’antibes; Bertoncello, F., Braemer, F., Eds.; Éditions APDCA: Antibes, France, 2012; pp. 341–352. [Google Scholar]
- De Soto, P. Network Analysis to Model and Analyse Roman Transport and Mobility; Springer Science and Business Media: Berlin/Heidelberg, Germany, 2019; pp. 271–289. [Google Scholar]
- Martín i Oliveras, A.; Revilla, V.; Remesal, J. The Economy of Roman Wine: A Proposal for Analyse an Intensive Wine Production System and Trade. Case Study Research: Regio Laeetana (Hispania Citerior Tarraconensis) from 1st century BC to 3rd century AD. In Productive Landscapes and Trade Networks in the Roman Empire. Col. Instrumenta 65. Universitat de Barcelona Edicions; Remesal, J., Revilla, V., Martín-Arroyo Sánchez, D., Martín i Oliveras, A., Eds.; Universitat de Barcelona: Barcelona, Spain, 2019; pp. 41–72. [Google Scholar]
- Revilla, V. Viticultura, territorio y hábitat en el litoral nororiental de Hispania Citerior durante el Alto Imperio. In De Vino et Oleo Hispaniae, Áreas de Producción y Procesos Tecnológicos Del Vino y el Aceite en la Hispania Romana. Coloquio Internacional, Anales de Prehistoria y Arqueologia 27-28; Noguera, J., Antolinos, J., Eds.; Universidad de Murcia: Murcia, Spain, 2012; pp. 67–83. [Google Scholar]
- Tremoleda i Trilla, J. Les instal•lacions productives d’àmfores tarraconenses. In La Producció i el Comerç de les Àmfores de la Provincia Hispania Tarraconensis. Homenatge a Ricard Pascual i Guasch; López Mullor, A., Aquilué Abadías, J., Eds.; Museu d’Arqueologia de Catalunya: Barcelona, Spain, 2007; pp. 113–150. [Google Scholar]
- Martín i Oliveras, A.; Revilla, V. Quantifying Laetanian Roman Wine Production Function (1st century BC-3rd century). A microeconomic approach for calculate vineyard’s crop and winemaking processing facilities yields. In Villas, Peasant Agriculture, and the Roman rural economy, Proceedings of AIAC-ICCA 19th International Congress of Classical Archaeology, Cologne/Bonn, Germany, 22–26 May 2018; Marzano, A., Ed.; Propylaeum: Heidelberg, Germany, 2020; in press. [Google Scholar]
- Wilson, J.; Gallant, J. Terrain Analysis: Principles and Applications; John Wiley & Sons: Hoboken, NJ, USA, 2000. [Google Scholar]
- Moreira, L.M. Recueil des Plans du Roussilon, de Catalogne: Des Chasteaux, Villages, Eglises, Chapelles & Maisons qui peuvent servir de Postes en temps de guerre; et de Quelques Endroits de France & dʼEspagne. Par le Sr. Pennier Ingenieur et Geographe du Roy. by the Institut Cartogràfic i Geològic de Catalunya. Imago Mundi 2019, 71, 212–213. [Google Scholar] [CrossRef]
- Hutton, J. Concerning the System of the Earth. In Proceedings of the Royal Society of Edinburgh, Edinburgh, UK, 4 July 1785. printed and circulated privately. [Google Scholar]
- Lyell, C.; Clowes, W.; Deshayes, G.P.; Murray, J. Principles of Geology; Smithsonian Institution: Washington, DC, USA, 1830; Volume 1. [Google Scholar]
- Riera, S.; Palet Martínez, J.M.; Orengo, H.A. Centuriación del territorio y modelación del paisaje en los llanos litorales de Barcino (Barcelona) y Tarraco (Tarragona): Una investigación interdisciplinar a través de la integración de datos arqueomorfológicos y paleoambientales. Agri Centuriati. Int. J. Landsc. Archaeol. 2010, 7, 113–129. [Google Scholar]
- Institut Cartogràfic i Geològic de Catalunya. The last 18 000 years. Visualization from 2010. Available online: https://www.icgc.cat/en/Citizens/Explore-Catalonia/Atlases/Geological-atlas-of-Catalonia/Geological-history-of-Catalonia/The-last-18-000-years (accessed on 5 May 2019).
- Conrad, O.; Bechtel, B.; Bock, M.; Dietrich, H.; Fischer, E.; Gerlitz, L.; Wehberg, J.; Wichmann, V.; Böhner, J. System for Automated Geoscientific Analyses (SAGA) v. 2.1.4. Geosci. Model Dev. 2015, 8, 1991–2007. [Google Scholar] [CrossRef] [Green Version]
- Zevenbergen, L.W.; Thorne, C. Quantitative analysis of land surface topography. Earth Surf. Process. Landf. 1987, 12, 47–56. [Google Scholar] [CrossRef]
- Desmet, P.; Govers, G. A GIS procedure for automatically calculating the USLE LS factor on topographically complex landscape units. J.Soil Water Conserv. 1996, 51, 427–433. [Google Scholar]
- Moore, I.D.; Grayson, R.B.; Ladson, A. Digital terrain modelling: A review of hydrological, geomorphological, and biological applications. Hydrol. Process. 1991, 5, 3–30. [Google Scholar] [CrossRef]
- Iwahashi, J.; Pike, R.J. Automated classifications of topography from DEMs by an unsupervised nested-means algorithm and a three-part geometric signature. Geomorphology 2007, 86, 409–440. [Google Scholar] [CrossRef]
- Weiss, A. Topographic Position and Landforms Analysis. 2000. Available online: http://www.jennessent.com/downloads/tpi-poster-tnc_18x22.pdf (accessed on 10 September 2019).
- Watkins, R.L. Terrain Metrics and Landscape Characterization from Bathymetric Data: SAGA GIS Methods and Command Sequences. Report Prepared for the Ecospatial Information Team, Coral Reef Ecosystem Division, Pacific Islands Fisheries Science Scenter: Honolulu, HI, under NOAA Contract Number WE-133F-15-SE-0518. Available online: Ftp://ftp.soest.hawaii.edu/pibhmc/website/webdocs/documentation/linkages_project_methods_final.pdf (accessed on 20 September 2019).
- Böhner, J.; Antonić, O. Chapter 8 Land-Surface Parameters Specific to Topo-Climatology; Elsevier BV: Amsterdam, The Netherlands, 2009; Volume 33, pp. 195–226. [Google Scholar]
- Cristea, N.; Breckheimer, I.; Raleigh, M.S.; HilleRisLambers, J.; Lundquist, J. An evaluation of terrain-based downscaling of fractional snow covered area data sets based on LiDAR-derived snow data and orthoimagery. Water Resour. Res. 2017, 53, 6802–6820. [Google Scholar] [CrossRef]
- Pleiades: A Gazetteer of Past Places 2019. Available online: https://pleiades.stoa.org/places (accessed on 30 August 2019).
- Oliveras, E.; Kasperskaya, Y. Reporting intellectual capital in Spain. Pers. Commun. 2008, 13, 168–181. [Google Scholar] [CrossRef] [Green Version]
- Izquierdo, P. Barcino i el seu litoral una aproximació a les comunicacions marítimes d’època antiga a la Laietània; BCN Biblioteca Històrica: Barcelona, Spain, 1997; Volume 1, pp. 13–21. [Google Scholar]
- de Graauw, A. Ancient Ports and Harbours—The Catalogue. 2017. Available online: http://www.ancientportsantiques.com/docs-pdf/ (accessed on 20 August 2019).
- Fernández, P.T. Perspectives about the analysis of roman viticulture in guadalquivir estuary. Riparia 2016, 2, 55–74. [Google Scholar] [CrossRef]
- Herzog, I. Theory and practice of cost functions. In CAA2010: Fusion of cultures. Proceedings of the 38th Annual Conference on Computer Applications and Quantitative Methods in Archaeology (CAA); Contreras, F., Farjas, M., Melero, F.J., Eds.; Archaeopress: Oxford, UK, 2010; pp. 375–382. [Google Scholar]
- Whitley, T.; Burns, G. Conditional GIS surfaces and their potential for archaeological predictive modelling. In Layers of Perception, Proceedings of the 35th International Conference on Computer Applications and Quantitative Methods in Archaeology (CAA), Berlin, Germany, 2–6 April 2007; Posluschny, A., Lambers, K., Herzog, I., Eds.; Dr. Rudolf Habelt GmbH: Bonn, Germany, 2008; pp. 292–298. [Google Scholar]
- Parcero-Oubiña, C.; Güimil-Fariña, A.; Fonte, J.; Costa-García, J.M. Footprints and Cartwheels on a Pixel Road: On the Applicability of GIS for the Modelling of Ancient (Roman) Routes. In Finding the Limits of the Limes: Modelling Demography, Economy and Transport on the Edge of the Roman Empire; Verhagen, P., Joyce, J., Groenhuijzen, M.R., Eds.; Springer International Publishing: Berlin/Heidelberg, Germany, 2019; pp. 291–311. [Google Scholar] [CrossRef]
- Llobera, M.; Sluckin, T.J. Zigzagging: Theoretical insights on climbing strategies. J. Boil. 2007, 249, 206–217. [Google Scholar] [CrossRef] [PubMed]
- Fonte, J.; Parcero-Oubiña, C.; Costa-García, J.M. A GIS-based Analysis of the rationale behind Roman roads. The case of the so-called via XVII (NW Iberian Peninsula). Mediterr. Archaeol. Archaeom. 2017, 17, 163–189. [Google Scholar]
- Vaughn, S.; Crawford, T. A predictive model of archaeological potential: An example from northwestern Belize. Appl. Geogr. 2009, 29, 542–555. [Google Scholar] [CrossRef]
- Flat vs. Sloping Vineyards. Article from 03 June 2013. Available online: https://www.wineguy.co.nz/index.php/glossary-articles-hidden/862-flat-slope (accessed on 10 July 2019).
- Riegler, D. Klima, Hydro-, Morpho- und Pedotop beim Weinanbau. Article from 22 February 2003. Available online: https://homepage.univie.ac.at/dieter.riegler/loek/htm/grundlagen.htm (accessed on 10 July 2019).
- Python Software Foundation. Python Language Reference, Version 3.6.7. Available online: http://www.python.org (accessed on 20 September 2019).
- Tukey, J. Exploratory Data Analysis. Addison-Wesley Series in Behavioral Science, 18th ed.; Addison-Wesley Publishing Company: Boston, MA, USA, 1977. [Google Scholar]
- Seiler, F.; Vogel, S.; Esposito, D. Ancient rural settlement and land use in the Sarno River plain (Campania, Italy): Predictive models and quantitative analyses. In Productive Landscapes and Trade Networks in the Roman Empire. Col•lecció Instrumenta 65. Universitat de Barcelona Edicions; Remesal Rodríguez, J., Revilla Calvo, V., Martín-Arroyo Sánchez, D.J., Martín i Oliveras, A., Eds.; Universitat de Barcelona: Barcelona, Spain, 2017; pp. 179–199. [Google Scholar]
- Ejstrud, B. Indicative models in archaeology: Testing the methods. In Symposium The Archaelogy of Landscapes and Geographic Information Systems: Predictive Maps, Settlement Dynamics and Space and Territory in Prehistory. Forschungen zur Archäologie im Land Brandenburg, 8. Archäoprognose Brandenburg I; Kunow, J., Müller, J., Eds.; Brandenburgisches Landesamt für Denkmalpflege und Archäologisches Landesmuseum: Wünsdorf, Germany, 2003; pp. 119–134. [Google Scholar]
- Verhagen, P. Testing archaeological predictive models: A rough guide. In Layers of Perception, Proceedings of the 35th International Conference on Computer Applications and Quantitative Methods in Archaeology (CAA), Berlin, Germany, 2–6 April 2007; Posluschny, A., Lambers, K., Herzog, I., Eds.; Dr. Rudolf Habelt GmbH: Bonn, Germany, 2008; pp. 285–290. [Google Scholar]
- Hastie, T.; Tibshirani, R.; Friedman, J. The Elements of Statistical Learning: Data Mining, Inference and Prediction, 2nd ed.; Springer: Berlin/Heidelberg, Germany, 2009; pp. 241–249. [Google Scholar]
- Columella. De re Rustica; Harvard University Press: London/Cambridge, UK, 1977; Volume 1–3. [Google Scholar]
- Madadizadeh, F.; Asar, M.E.; Hosseini, M. Common Statistical Mistakes in Descriptive Statistics Reports of Normal and Non-Normal Variables in Biomedical Sciences Research. Iran. J. Public Health 2015, 44, 1557–1558. [Google Scholar] [PubMed]
- Purcell, N. Wine and Wealth in Ancient Italy. J. Rom. Stud. 1985, 75, 1–19. [Google Scholar] [CrossRef]
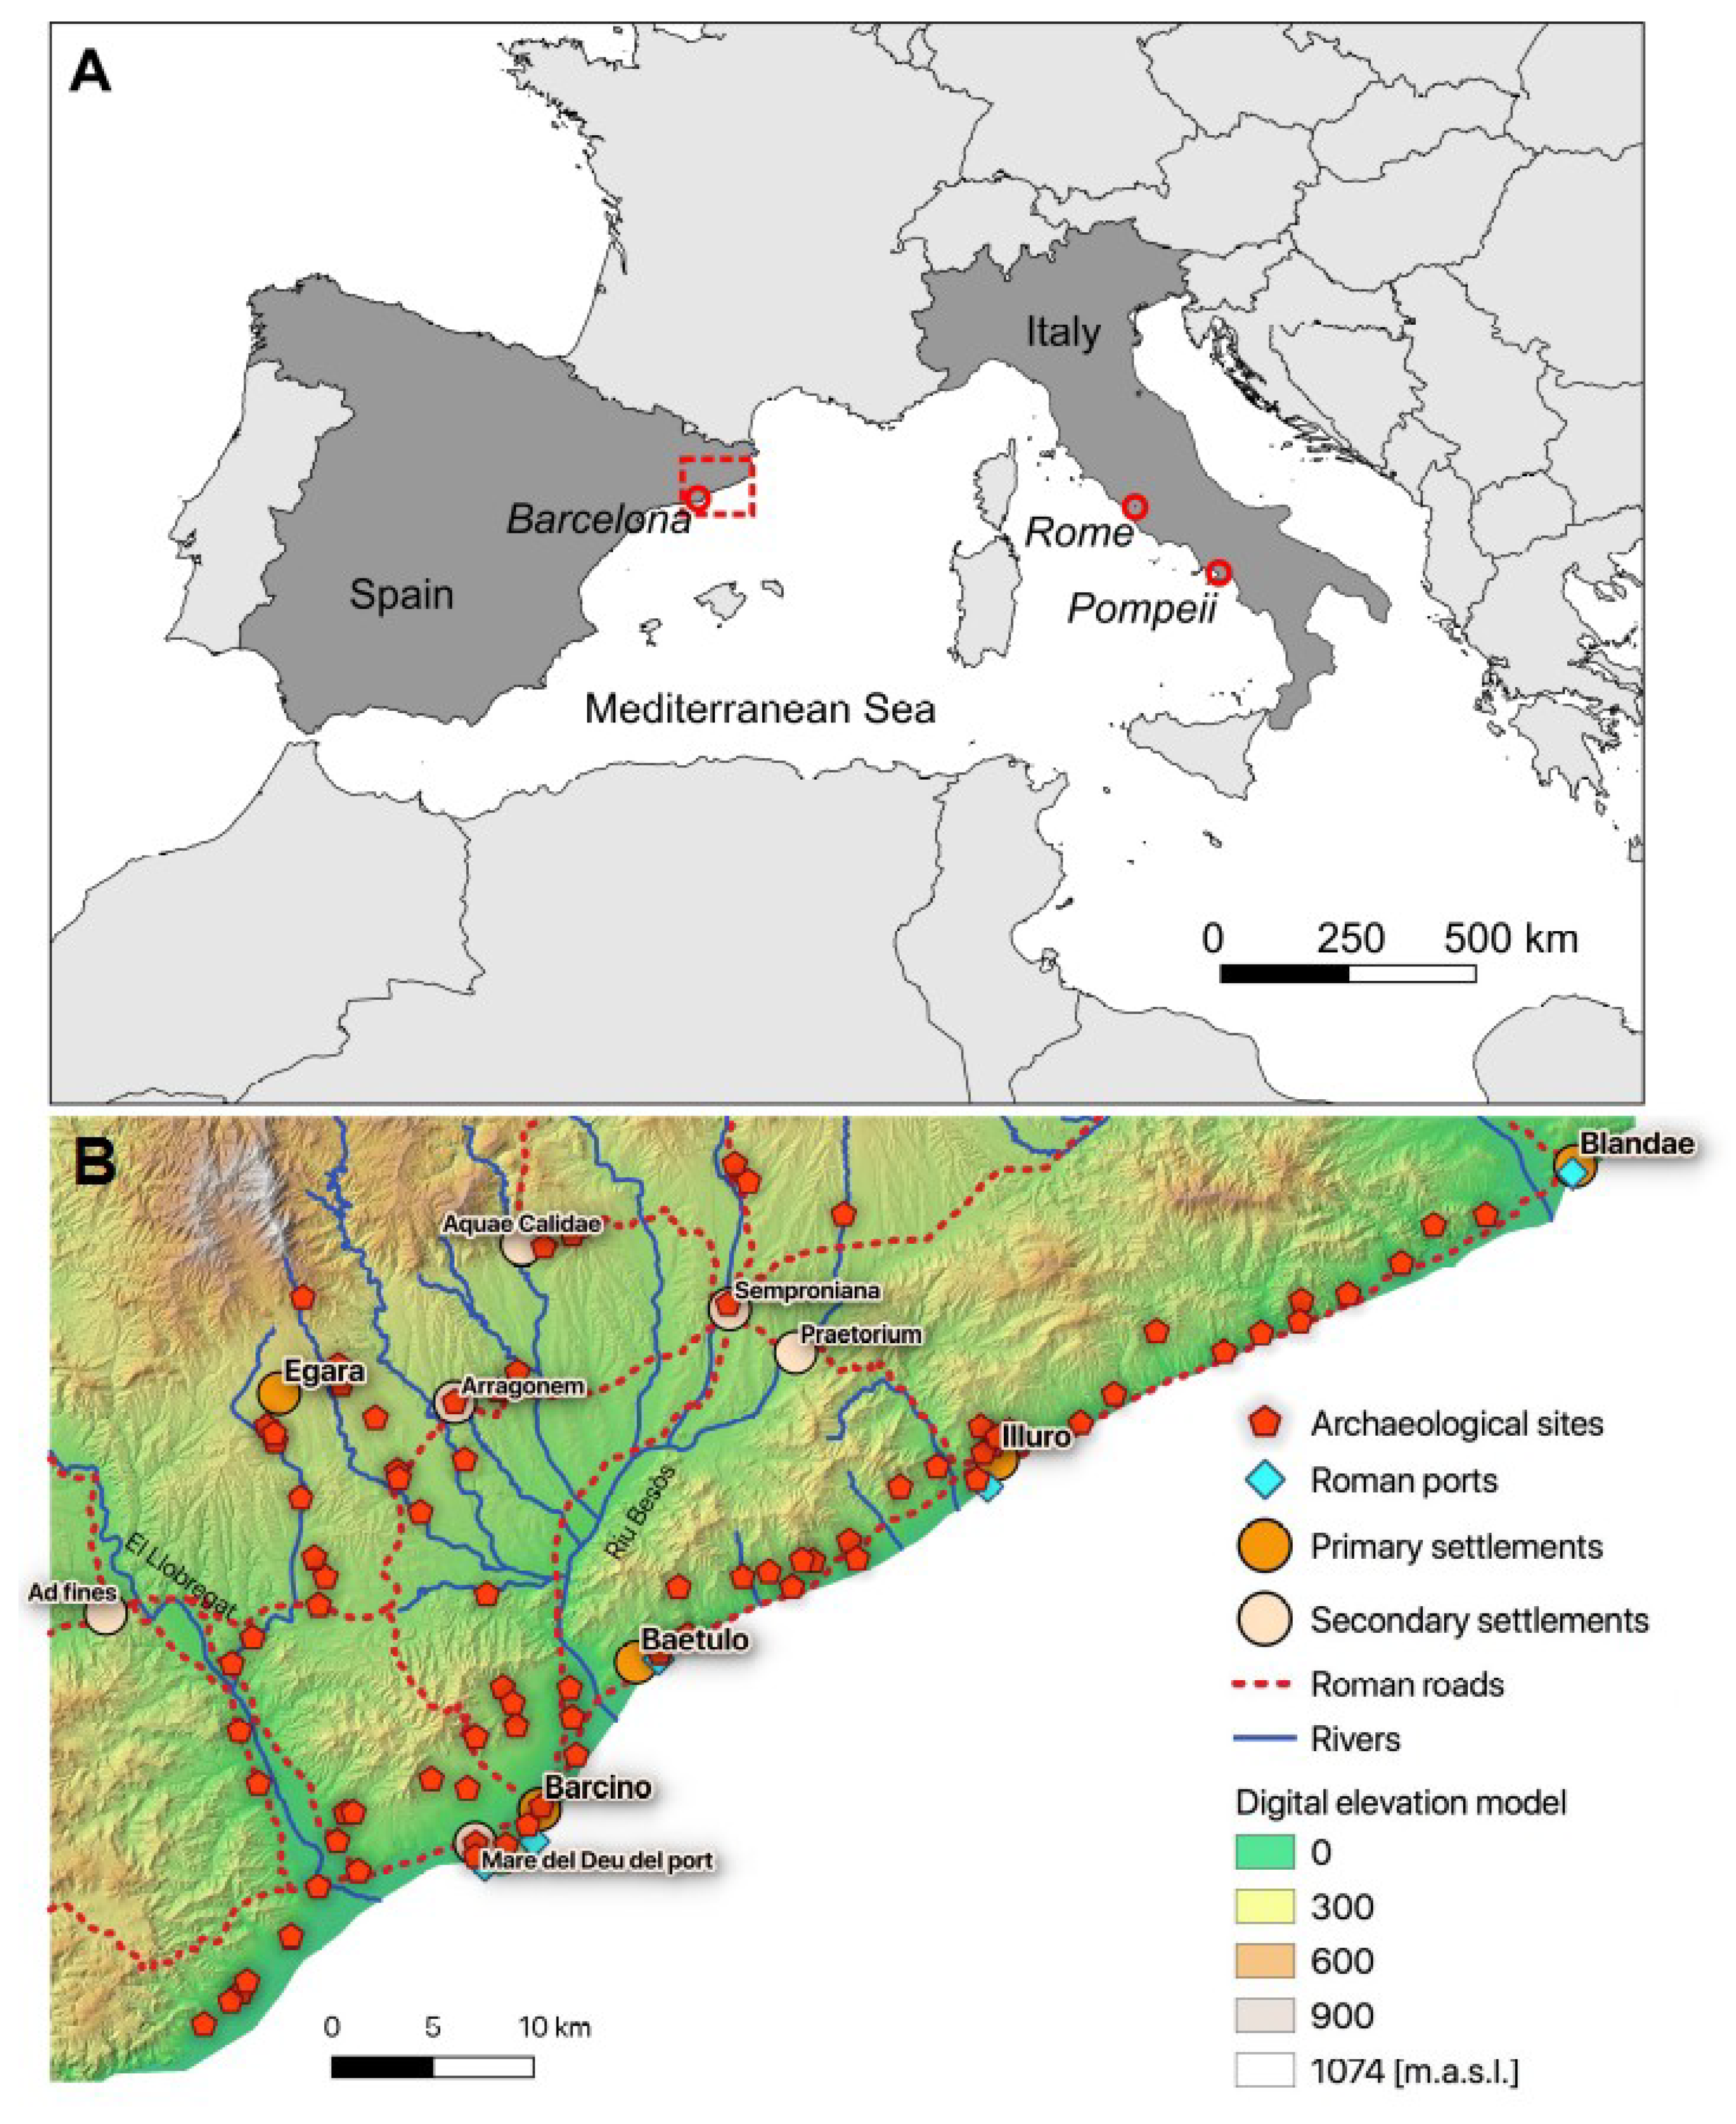


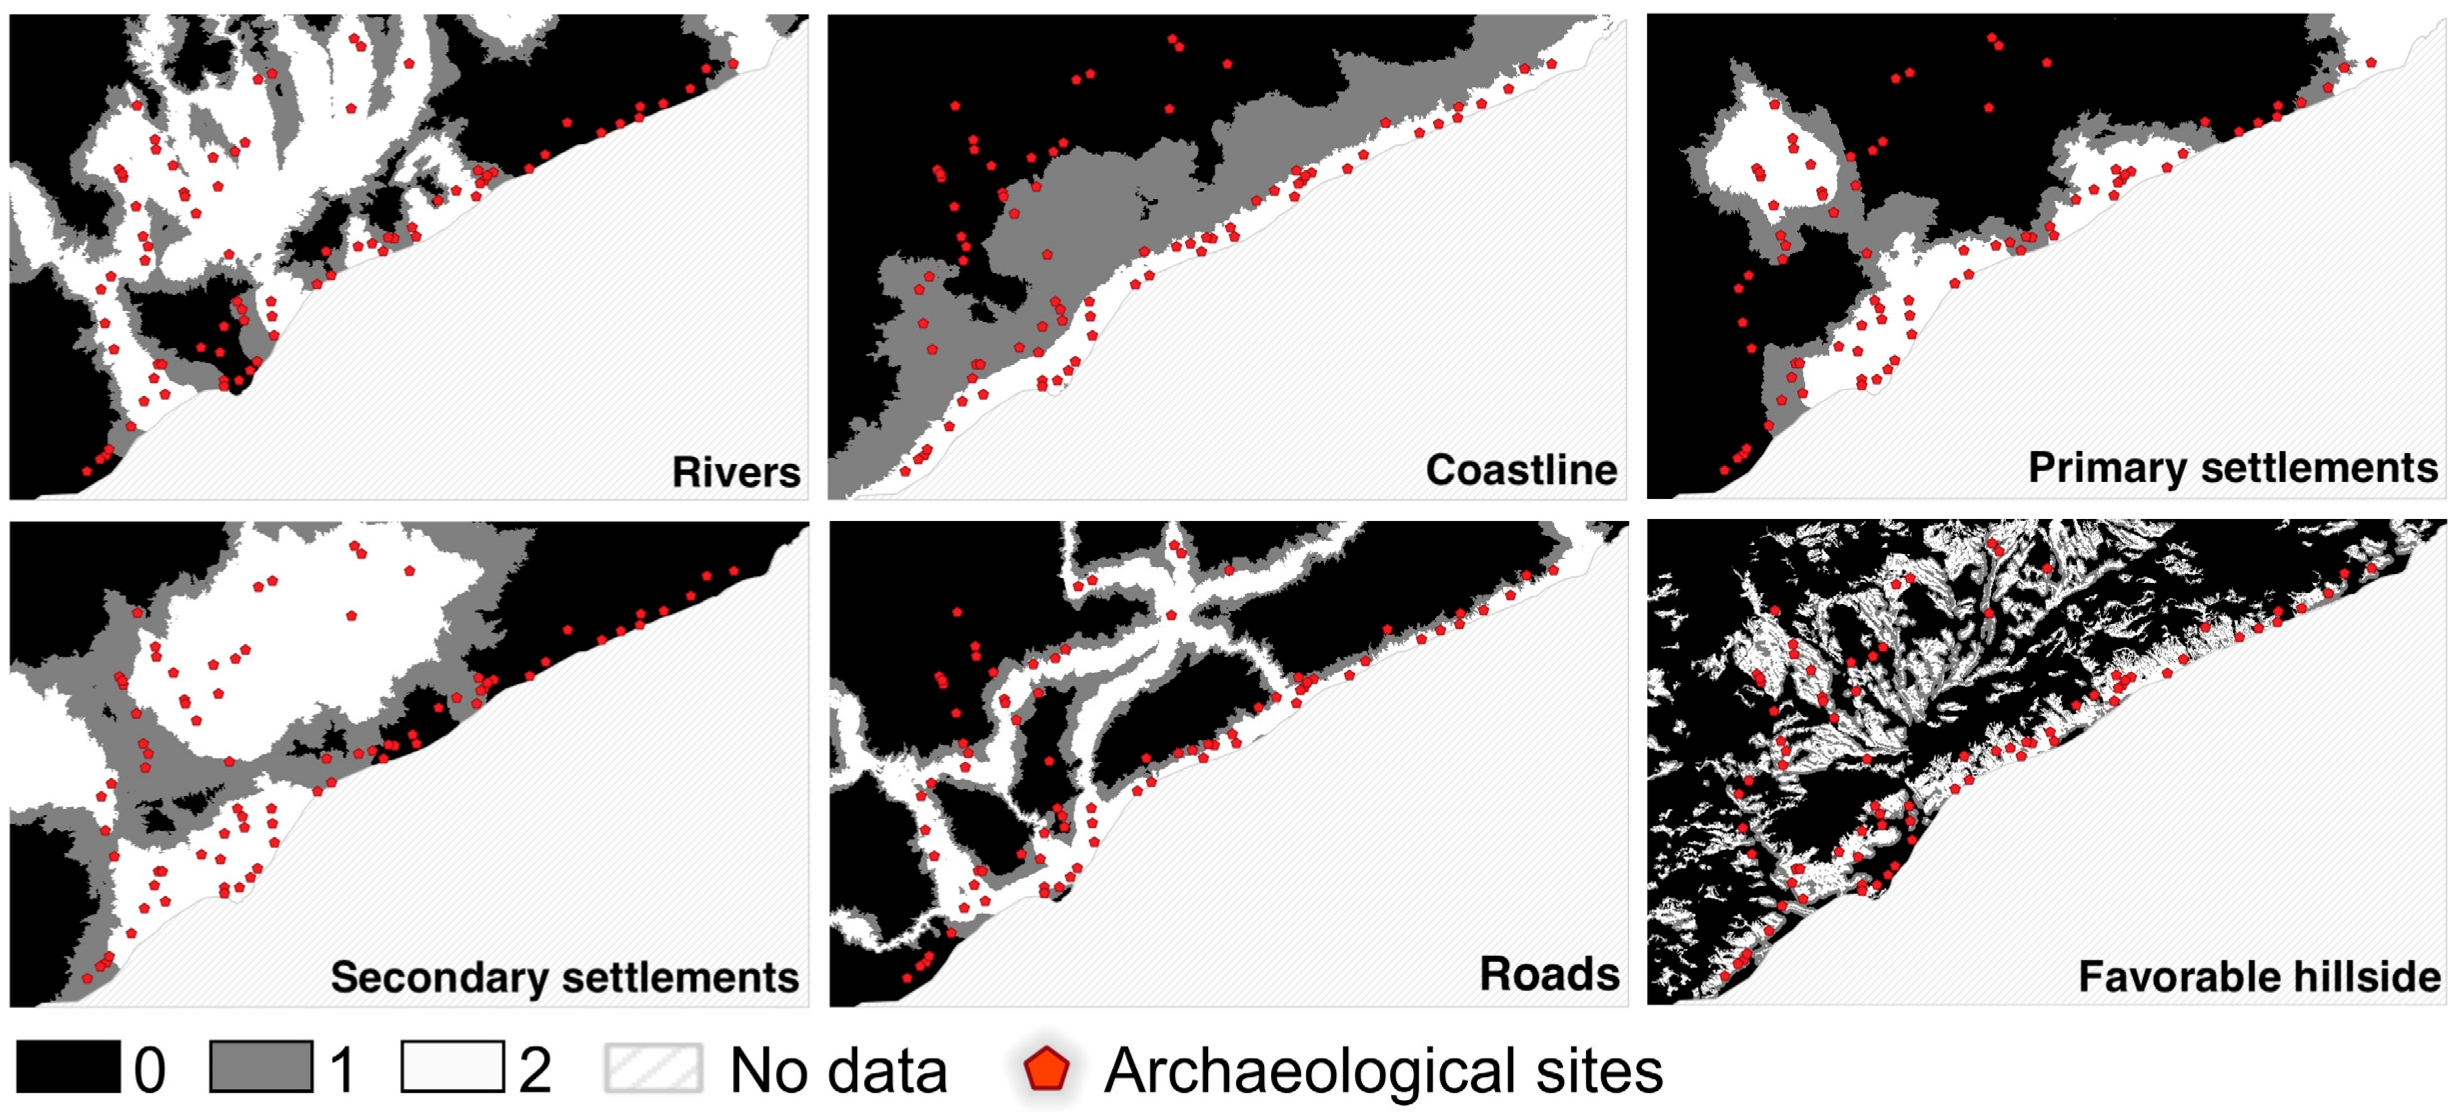
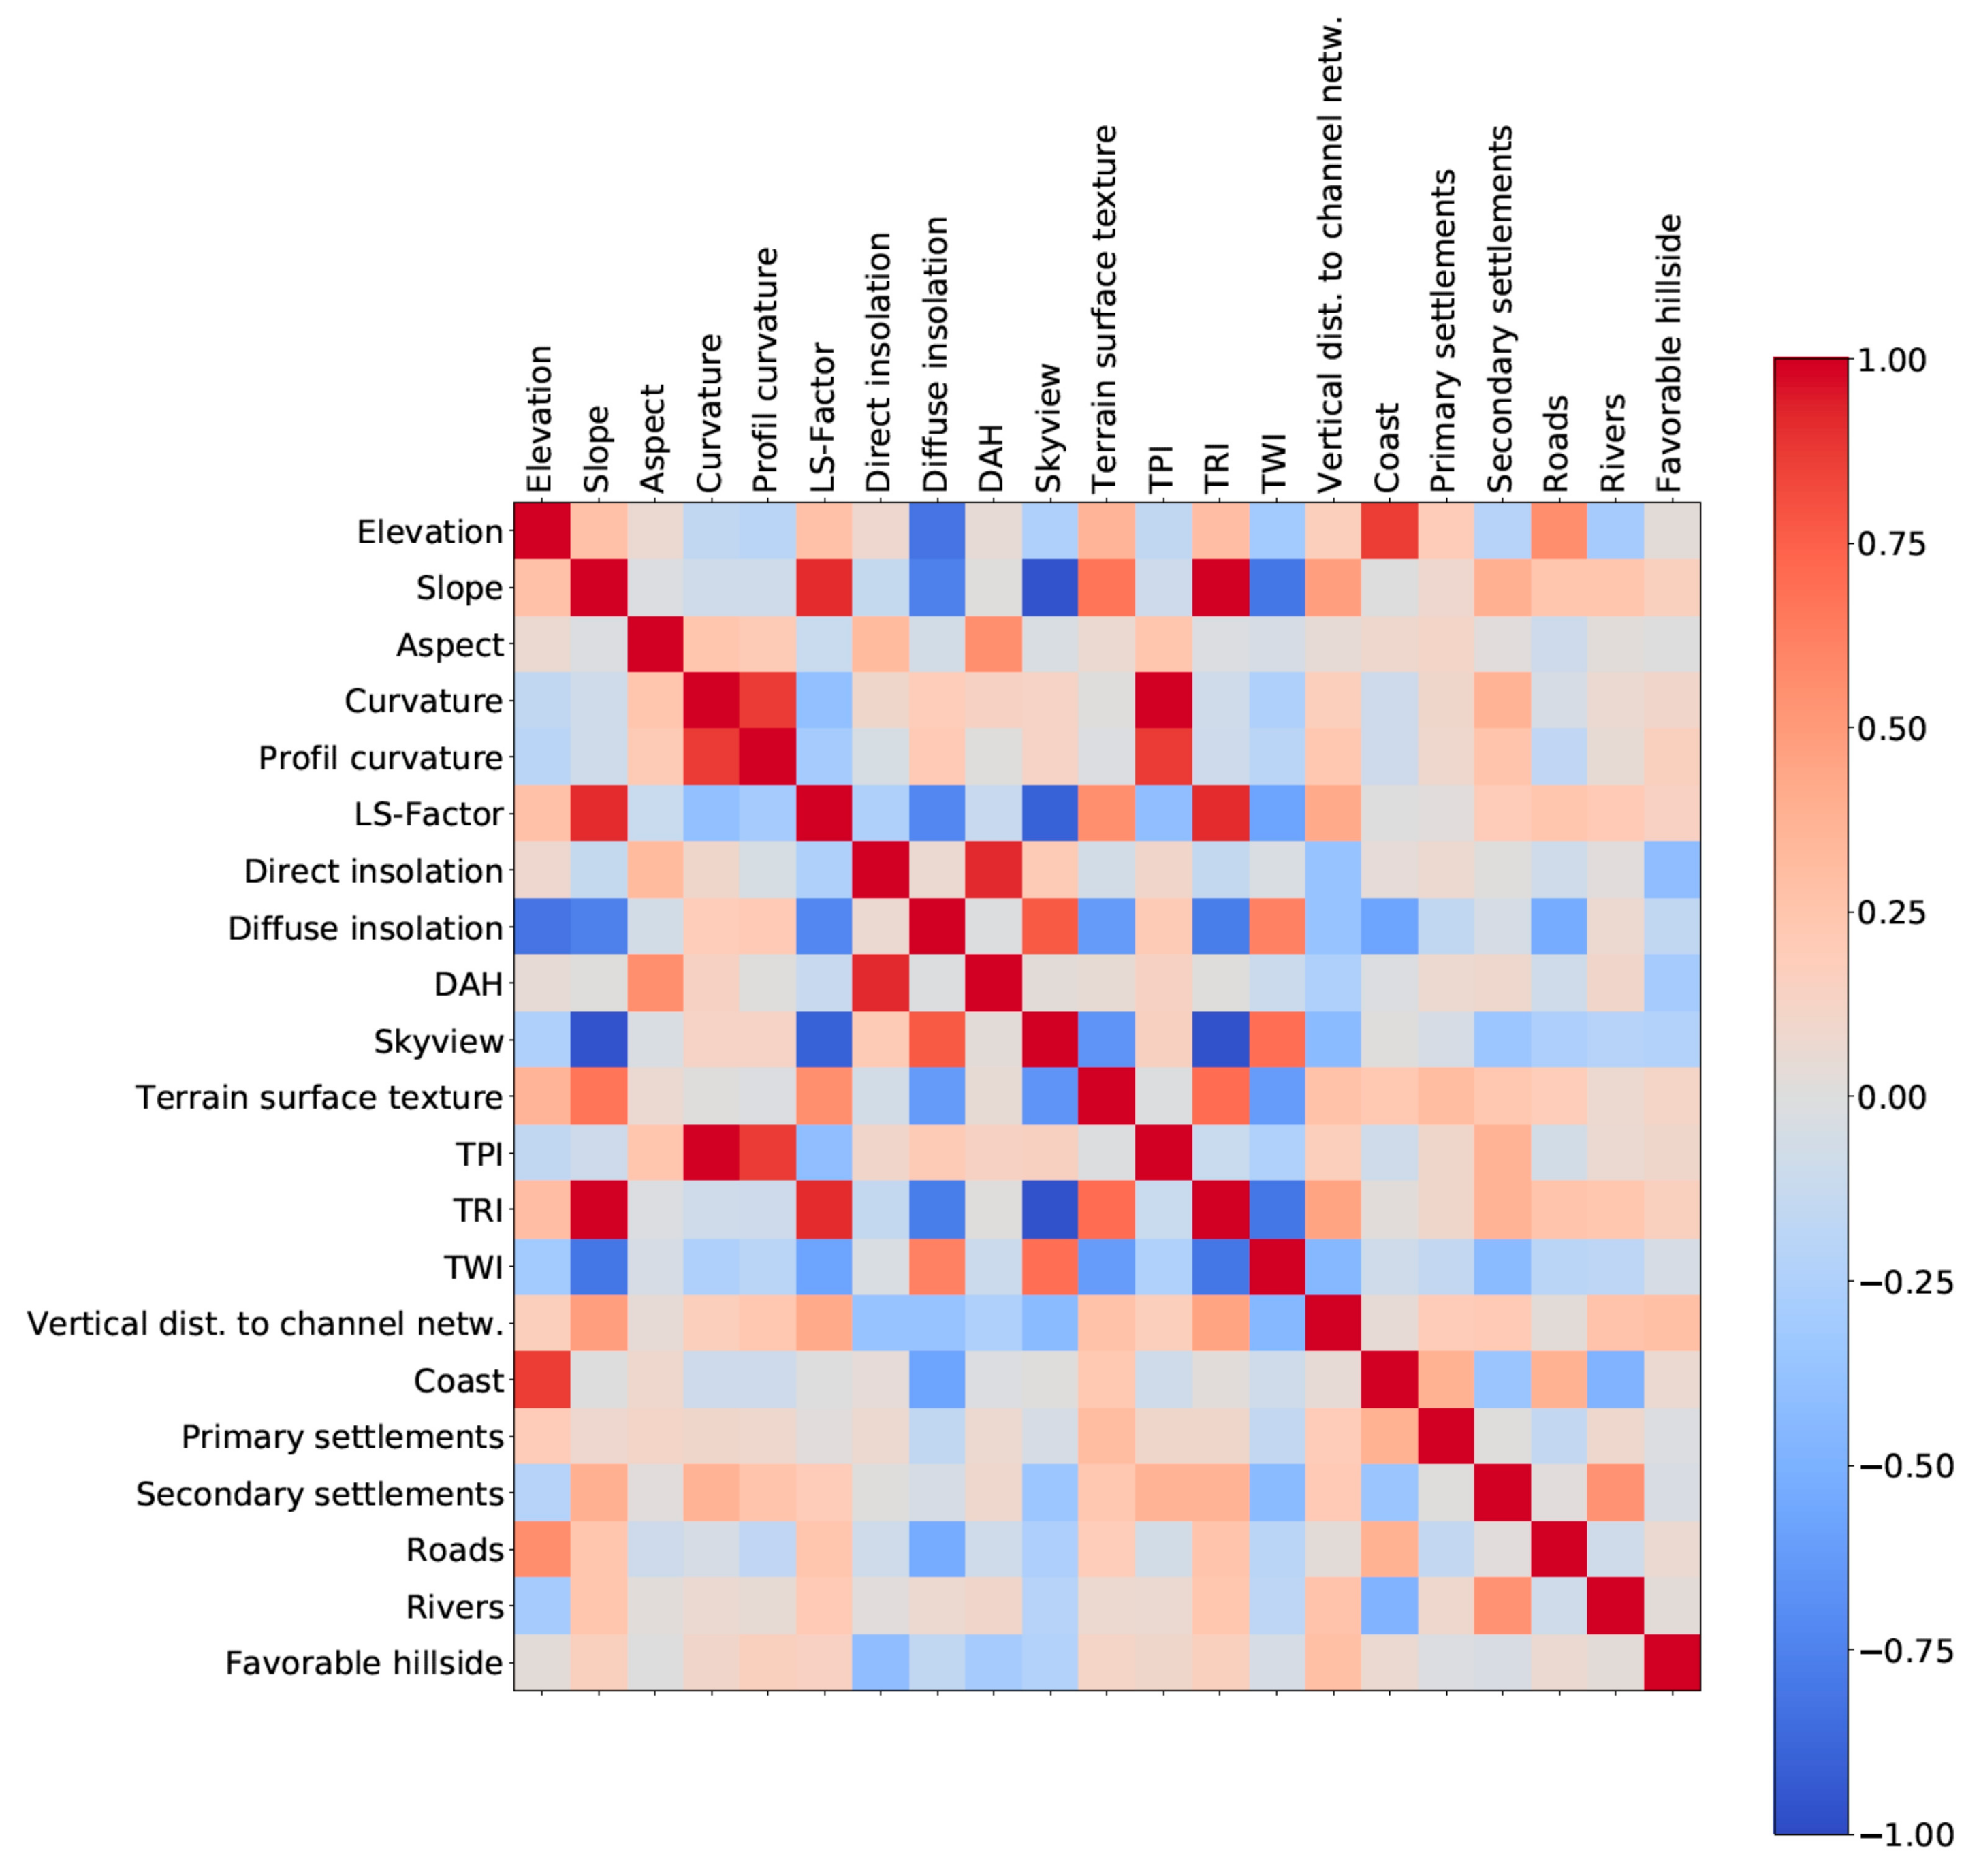
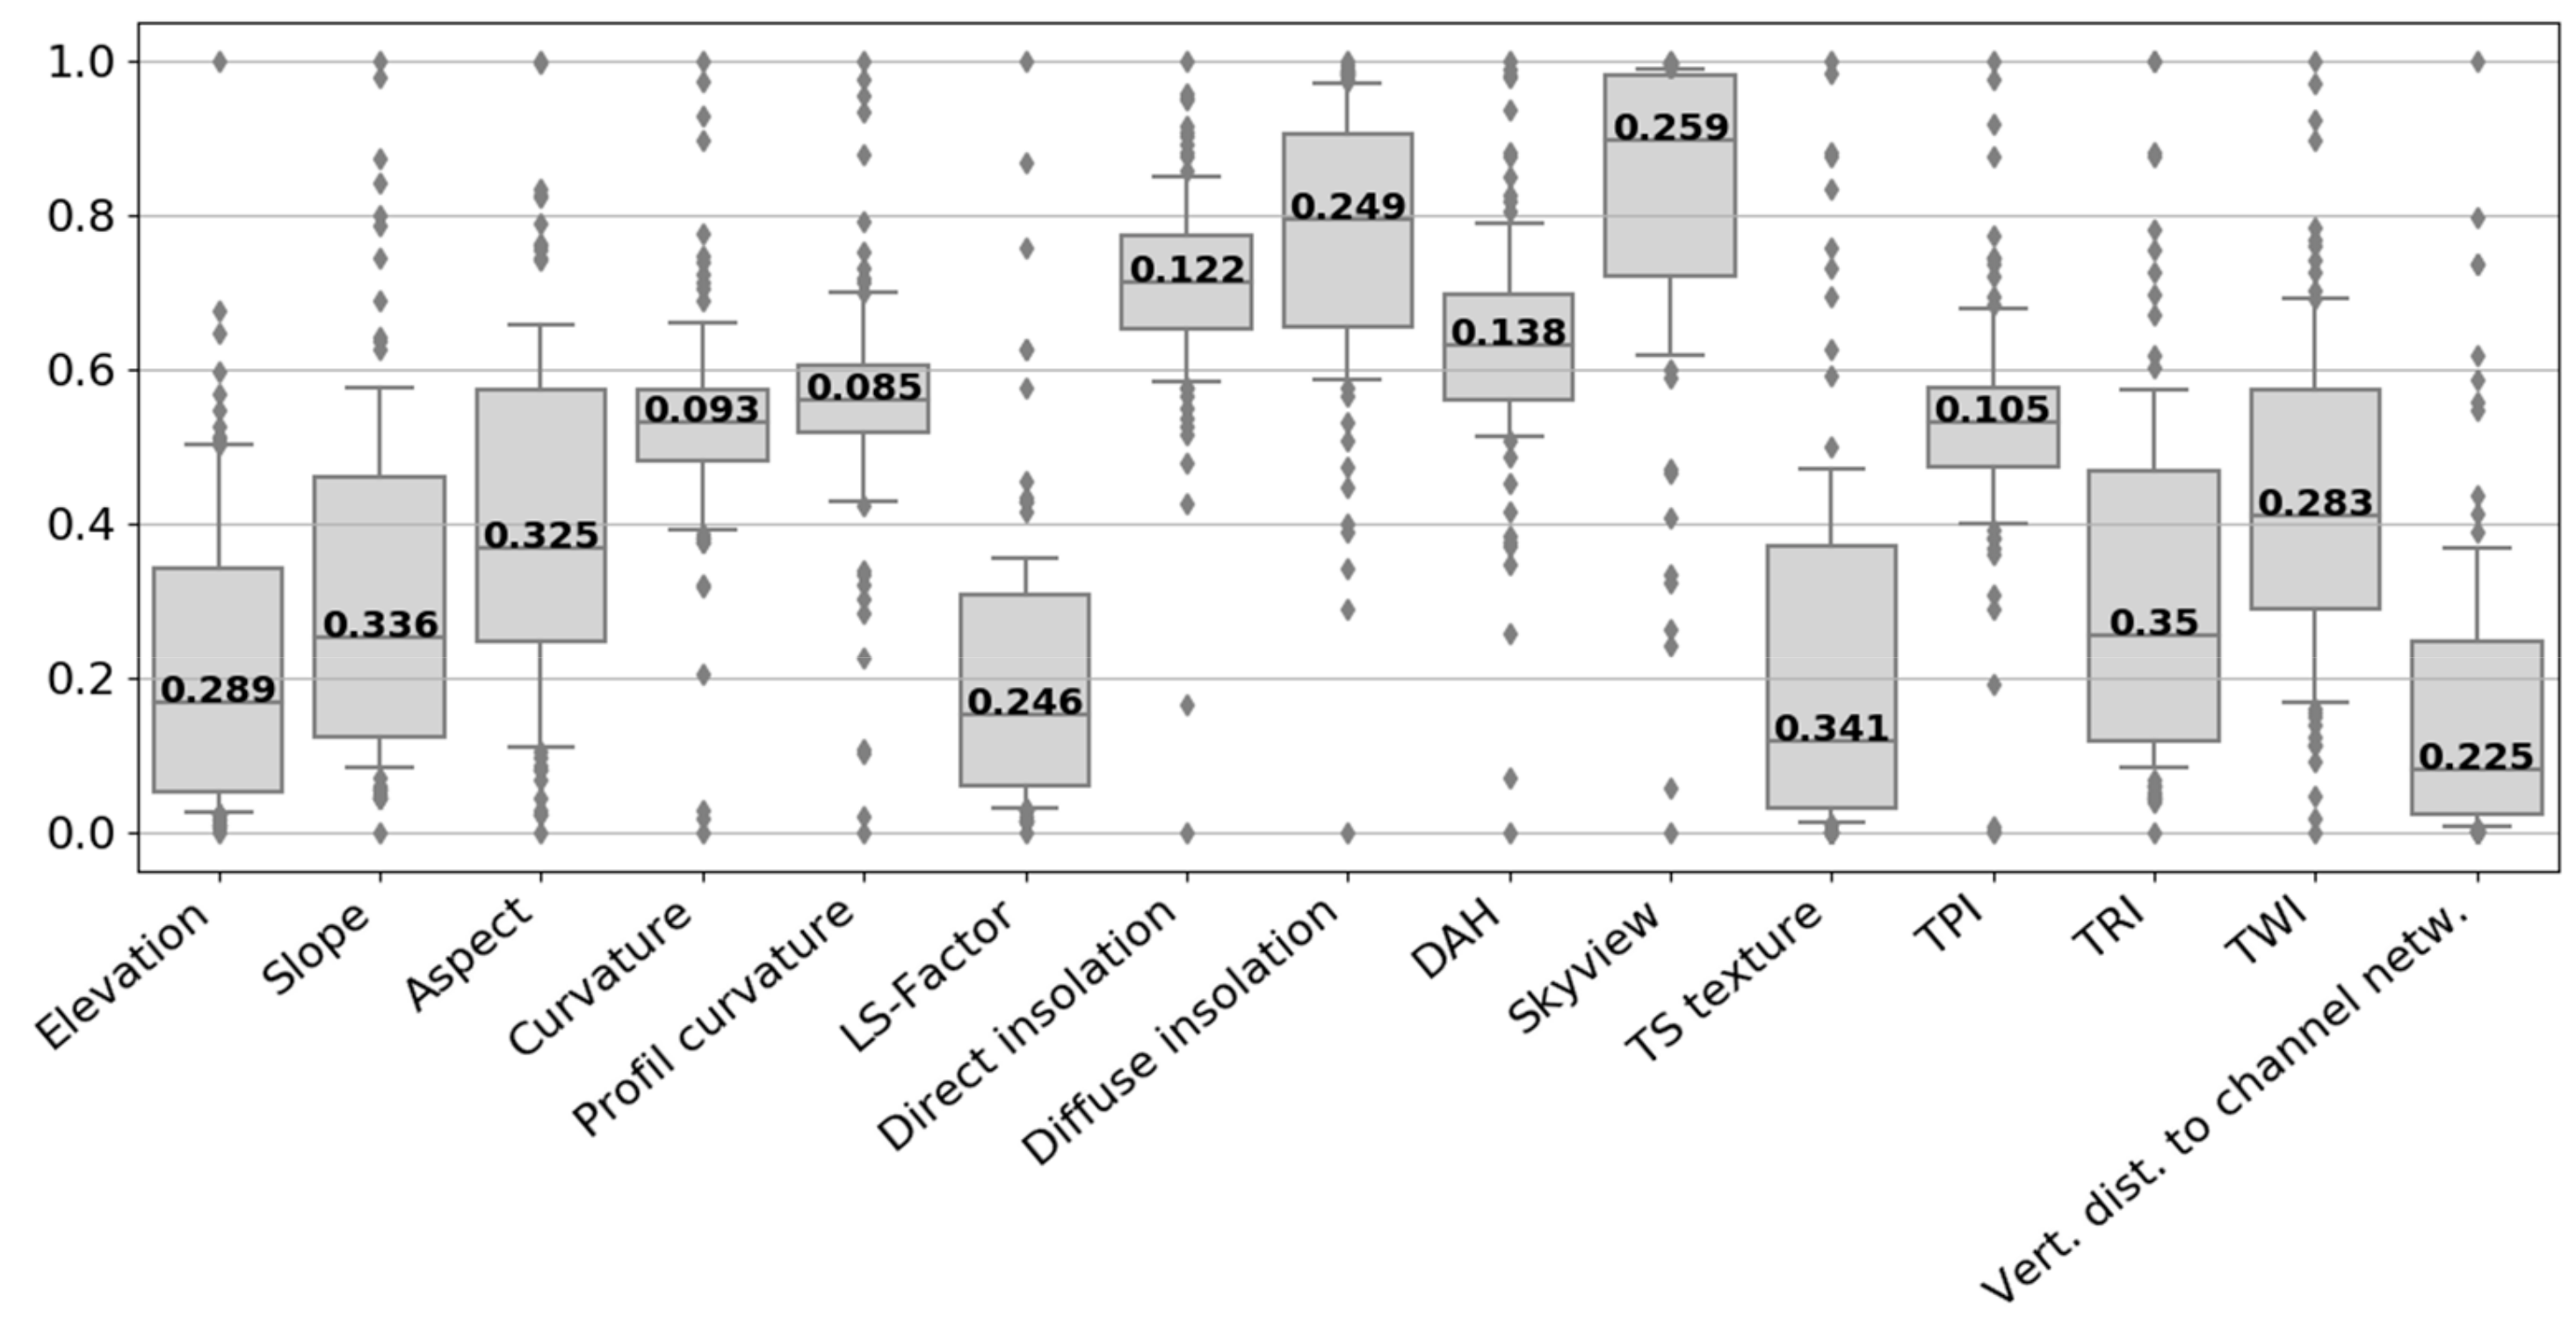



| Variable | Description |
|---|---|
| Slope | The rate of change of elevation in the direction of steepest descent [21]. Method used: Zevenbergen and Thorne [28]. |
| Aspect | Orientation of the line of steepest descent [21]. Method used: Zevenbergen and Thorne [28]. |
| Curvature | Measures the change of slope as a degree of concavity and convexity. This determines flow velocity and erosion rate. Method used: Zevenbergen and Thorne [28]. |
| Profile curvature | Measures the rate of change of slope only along a flow line. This indicates acceleration or deceleration of flow [21]. Method used: Zevenbergen and Thorne [28]. |
| LS-factor | The S-factor is the slope steepness, the L-factor the slope length. In relation they determine soil erosion [29]. Method used: Moore [30]. |
| Terrain surface texture (TS texture) | Measures the ‘grain’ of terrain. Each raster cell value represents the relative frequency of pits and peaks within a radius of ten cells [31]. |
| Topographic position index (TPI) | Comparison of the elevation of each cell to the mean elevation of a specified neighborhood around that cell [32]. |
| Terrain ruggedness index (TRI) | Measure of topographic heterogeneity. Each cell is the sum change in elevation between itself and its eight neighboring cells [33]. |
| Topographic wetness index (TWI) | Describes the spatial distribution and extent of zones of water saturation and therefore the runoff generation [33]. |
| Skyview | Fraction of the sky that can be seen from the soil surface, given by an index between 0 (plain or peaks) and 1 (completely obstructed). It indirectly indicates the exposure to the wind [21,34]. |
| Direct insolation | Intensity of potential direct solar irradiation, assuming clear-sky conditions. It is affected by topographic shading (shading by nearby hills) [21,34]. |
| Diffuse insolation | Intensity of potential diffuse solar irradiation, assuming clear-sky conditions. It increases with decreasing altitudes, because of aerosol, water droplets and water vapor scattering the solar radiation [34]. |
| Diurnal anisotropic heating (DAH) | Combination of the effects of slope and aspect. Indicates temperature and topographic solar radiation at the soil surface [34,35]. |
| Vertical distance to channel network | Elevation of a cell that was calculated from the difference between the original elevation and the elevation of the closest channel. The channels were calculated from the catchment area. |
| Rank | Predictor Variable | Statistical Importance [%] | |
|---|---|---|---|
| M1 - Expert: Pompeii Study | |||
| 1 | Curvature | 100 | |||||||||||||||||||||||||||||||||||||||||||||||||| |
| 2 | TPI | 99.3 | ||||||||||||||||||||||||||||||||||||||||||||||||| |
| 3 | LS-factor | 92.1 | |||||||||||||||||||||||||||||||||||||||||||||| |
| 4 | Elevation | 91.8 | |||||||||||||||||||||||||||||||||||||||||||||| |
| 5 | Vertical distance to channel network | 89.4 | ||||||||||||||||||||||||||||||||||||||||||||| |
| 6 | Cost distance to rivers | 87.4 | |||||||||||||||||||||||||||||||||||||||||||| |
| 7 | TWI | 86.7 | ||||||||||||||||||||||||||||||||||||||||||| |
| 8 | Cost distance to settlements | 86.5 | ||||||||||||||||||||||||||||||||||||||||||| |
| 9 | Aspect | 83.7 | |||||||||||||||||||||||||||||||||||||||||| |
| 10 | Slope | 83.2 | |||||||||||||||||||||||||||||||||||||||||| |
| M2 - Expert: Southwest Spain Study | |||
| 1 | Direct insolation | 100 | |||||||||||||||||||||||||||||||||||||||||||||||||| |
| 2 | Cost distance to roads | 90.4 | ||||||||||||||||||||||||||||||||||||||||||||| |
| 3 | Cost distance to rivers | 82.7 | ||||||||||||||||||||||||||||||||||||||||| |
| 4 | Cost distance to secondary settlements | 81.7 | ||||||||||||||||||||||||||||||||||||||||| |
| 5 | Wind | 80.6 | |||||||||||||||||||||||||||||||||||||||| |
| 6 | Cost distance to primary settlements | 80.4 | |||||||||||||||||||||||||||||||||||||||| |
| 7 | Slope | 78.6 | ||||||||||||||||||||||||||||||||||||||| |
| 8 | Cost distance to coast | 68.9 | |||||||||||||||||||||||||||||||||| |
| M3 - Automated: IQRnorm | |||
| 1 | Profile curvature | 100 | |||||||||||||||||||||||||||||||||||||||||||||||||| |
| 2 | Direct insolation | 96.0 | |||||||||||||||||||||||||||||||||||||||||||||||| |
| 3 | Cost distance to favorable hillsides | 91.0 | |||||||||||||||||||||||||||||||||||||||||||||| |
| 4 | Cost distance to roads | 88.0 | |||||||||||||||||||||||||||||||||||||||||||| |
| 5 | Cost distance to secondary settlements | 84.9 | |||||||||||||||||||||||||||||||||||||||||| |
| 6 | Vertical distance to channel network | 84.8 | |||||||||||||||||||||||||||||||||||||||||| |
| 7 | Cost distance to rivers | 82.7 | ||||||||||||||||||||||||||||||||||||||||| |
| 8 | LS-factor | 82.4 | ||||||||||||||||||||||||||||||||||||||||| |
| 9 | Cost distance to primary settlements | 77.3 | ||||||||||||||||||||||||||||||||||||||| |
| 10 | Cost distance to coast | 49.1 | ||||||||||||||||||||||||| |
| M4 - Automated: wE | |||
| 1 | Direct insolation | 100 | |||||||||||||||||||||||||||||||||||||||||||||||||| |
| 2 | Curvature | 94.4 | ||||||||||||||||||||||||||||||||||||||||||||||| |
| 3 | Cost distance to roads | 90.4 | ||||||||||||||||||||||||||||||||||||||||||||| |
| 4 | Diffuse insolation | 88.8 | |||||||||||||||||||||||||||||||||||||||||||| |
| 5 | LS-factor | 86.9 | ||||||||||||||||||||||||||||||||||||||||||| |
| 6 | Vertical distance to channel network | 84.4 | |||||||||||||||||||||||||||||||||||||||||| |
| 7 | Cost distance to rivers | 82.7 | ||||||||||||||||||||||||||||||||||||||||| |
| 8 | Cost distance to secondary settlements | 81.6 | ||||||||||||||||||||||||||||||||||||||||| |
| 9 | Cost distance to primary settlements | 80.3 | |||||||||||||||||||||||||||||||||||||||| |
| 10 | Cost distance to coast | 68.9 | |||||||||||||||||||||||||||||||||| |
| Predictor Variable | Min. | Mean | Max. | Std.Dev. | wE |
|---|---|---|---|---|---|
| Direct insolation | 1.81 | 3.26 | 3.85 | 0.31 | 2.58 |
| Curvature | −0.02 | 0.00 | 0.02 | 0.00 | 2.44 |
| TPI | −0.33 | −0.01 | 0.28 | 0.10 | 2.42 |
| DAH | −0.28 | 0.01 | 0.18 | 0.08 | 2.41 |
| Profile curvature | −0.01 | 0.00 | 0.00 | 0.00 | 2.37 |
| Cost distance to roads | 14.00 | 434.00 | 3962.00 | 724.63 | 2.33 |
| Diffuse insolation | 0.83 | 0.88 | 0.89 | 0.01 | 2.29 |
| LS-factor | 0.09 | 2.74 | 17.50 | 3.46 | 2.24 |
| Elevation | 0.22 | 77.31 | 460.72 | 91.78 | 2.24 |
| Vertical distance to channel network | 0.07 | 4.46 | 53.79 | 11.31 | 2.18 |
| Cost distance to rivers | 22.00 | 887.00 | 6261.00 | 1364.46 | 2.14 |
| TWI | 3.00 | 7.30 | 11.10 | 0.97 | 2.12 |
| Cost distance to secondary settlements | 9.00 | 4070.00 | 17,881.00 | 4017.31 | 2.11 |
| Skyview | 0.97 | 1.00 | 1.00 | 0.01 | 2.11 |
| Cost distance to primary settlements | 42.00 | 2998.00 | 9995.00 | 2311.47 | 2.08 |
| Aspect | 59.07 | 146.09 | 295.74 | 56.72 | 2.04 |
| TRI | 0.06 | 0.78 | 2.88 | 0.68 | 2.03 |
| Slope | 0.42 | 5.23 | 19.54 | 4.65 | 2.03 |
| Cost distance to favorable hillsides | 0.00 | 22.00 | 763.00 | 191.70 | 2.00 |
| TS texture | 0.00 | 1.31 | 11.02 | 2.86 | 1.96 |
| Cost distance to coast | 77.00 | 1043.00 | 10,012.00 | 3137.40 | 1.78 |
© 2020 by the authors. Licensee MDPI, Basel, Switzerland. This article is an open access article distributed under the terms and conditions of the Creative Commons Attribution (CC BY) license (http://creativecommons.org/licenses/by/4.0/).
Share and Cite
Stubert, L.; Martín i Oliveras, A.; Märker, M.; Schernthanner, H.; Vogel, S. Viticulture in the Laetanian Region (Spain) during the Roman Period: Predictive Modelling and Geomatic Analysis. Geosciences 2020, 10, 206. https://doi.org/10.3390/geosciences10060206
Stubert L, Martín i Oliveras A, Märker M, Schernthanner H, Vogel S. Viticulture in the Laetanian Region (Spain) during the Roman Period: Predictive Modelling and Geomatic Analysis. Geosciences. 2020; 10(6):206. https://doi.org/10.3390/geosciences10060206
Chicago/Turabian StyleStubert, Lisa, Antoni Martín i Oliveras, Michael Märker, Harald Schernthanner, and Sebastian Vogel. 2020. "Viticulture in the Laetanian Region (Spain) during the Roman Period: Predictive Modelling and Geomatic Analysis" Geosciences 10, no. 6: 206. https://doi.org/10.3390/geosciences10060206
APA StyleStubert, L., Martín i Oliveras, A., Märker, M., Schernthanner, H., & Vogel, S. (2020). Viticulture in the Laetanian Region (Spain) during the Roman Period: Predictive Modelling and Geomatic Analysis. Geosciences, 10(6), 206. https://doi.org/10.3390/geosciences10060206


