Rockfall Hazard Assessment in Volcanic Regions Based on ISVS and IRVS Geomechanical Indices

 ,
,
Abstract
:1. Introduction
2. Estimating Rockfall Susceptibility: The ISVS Index
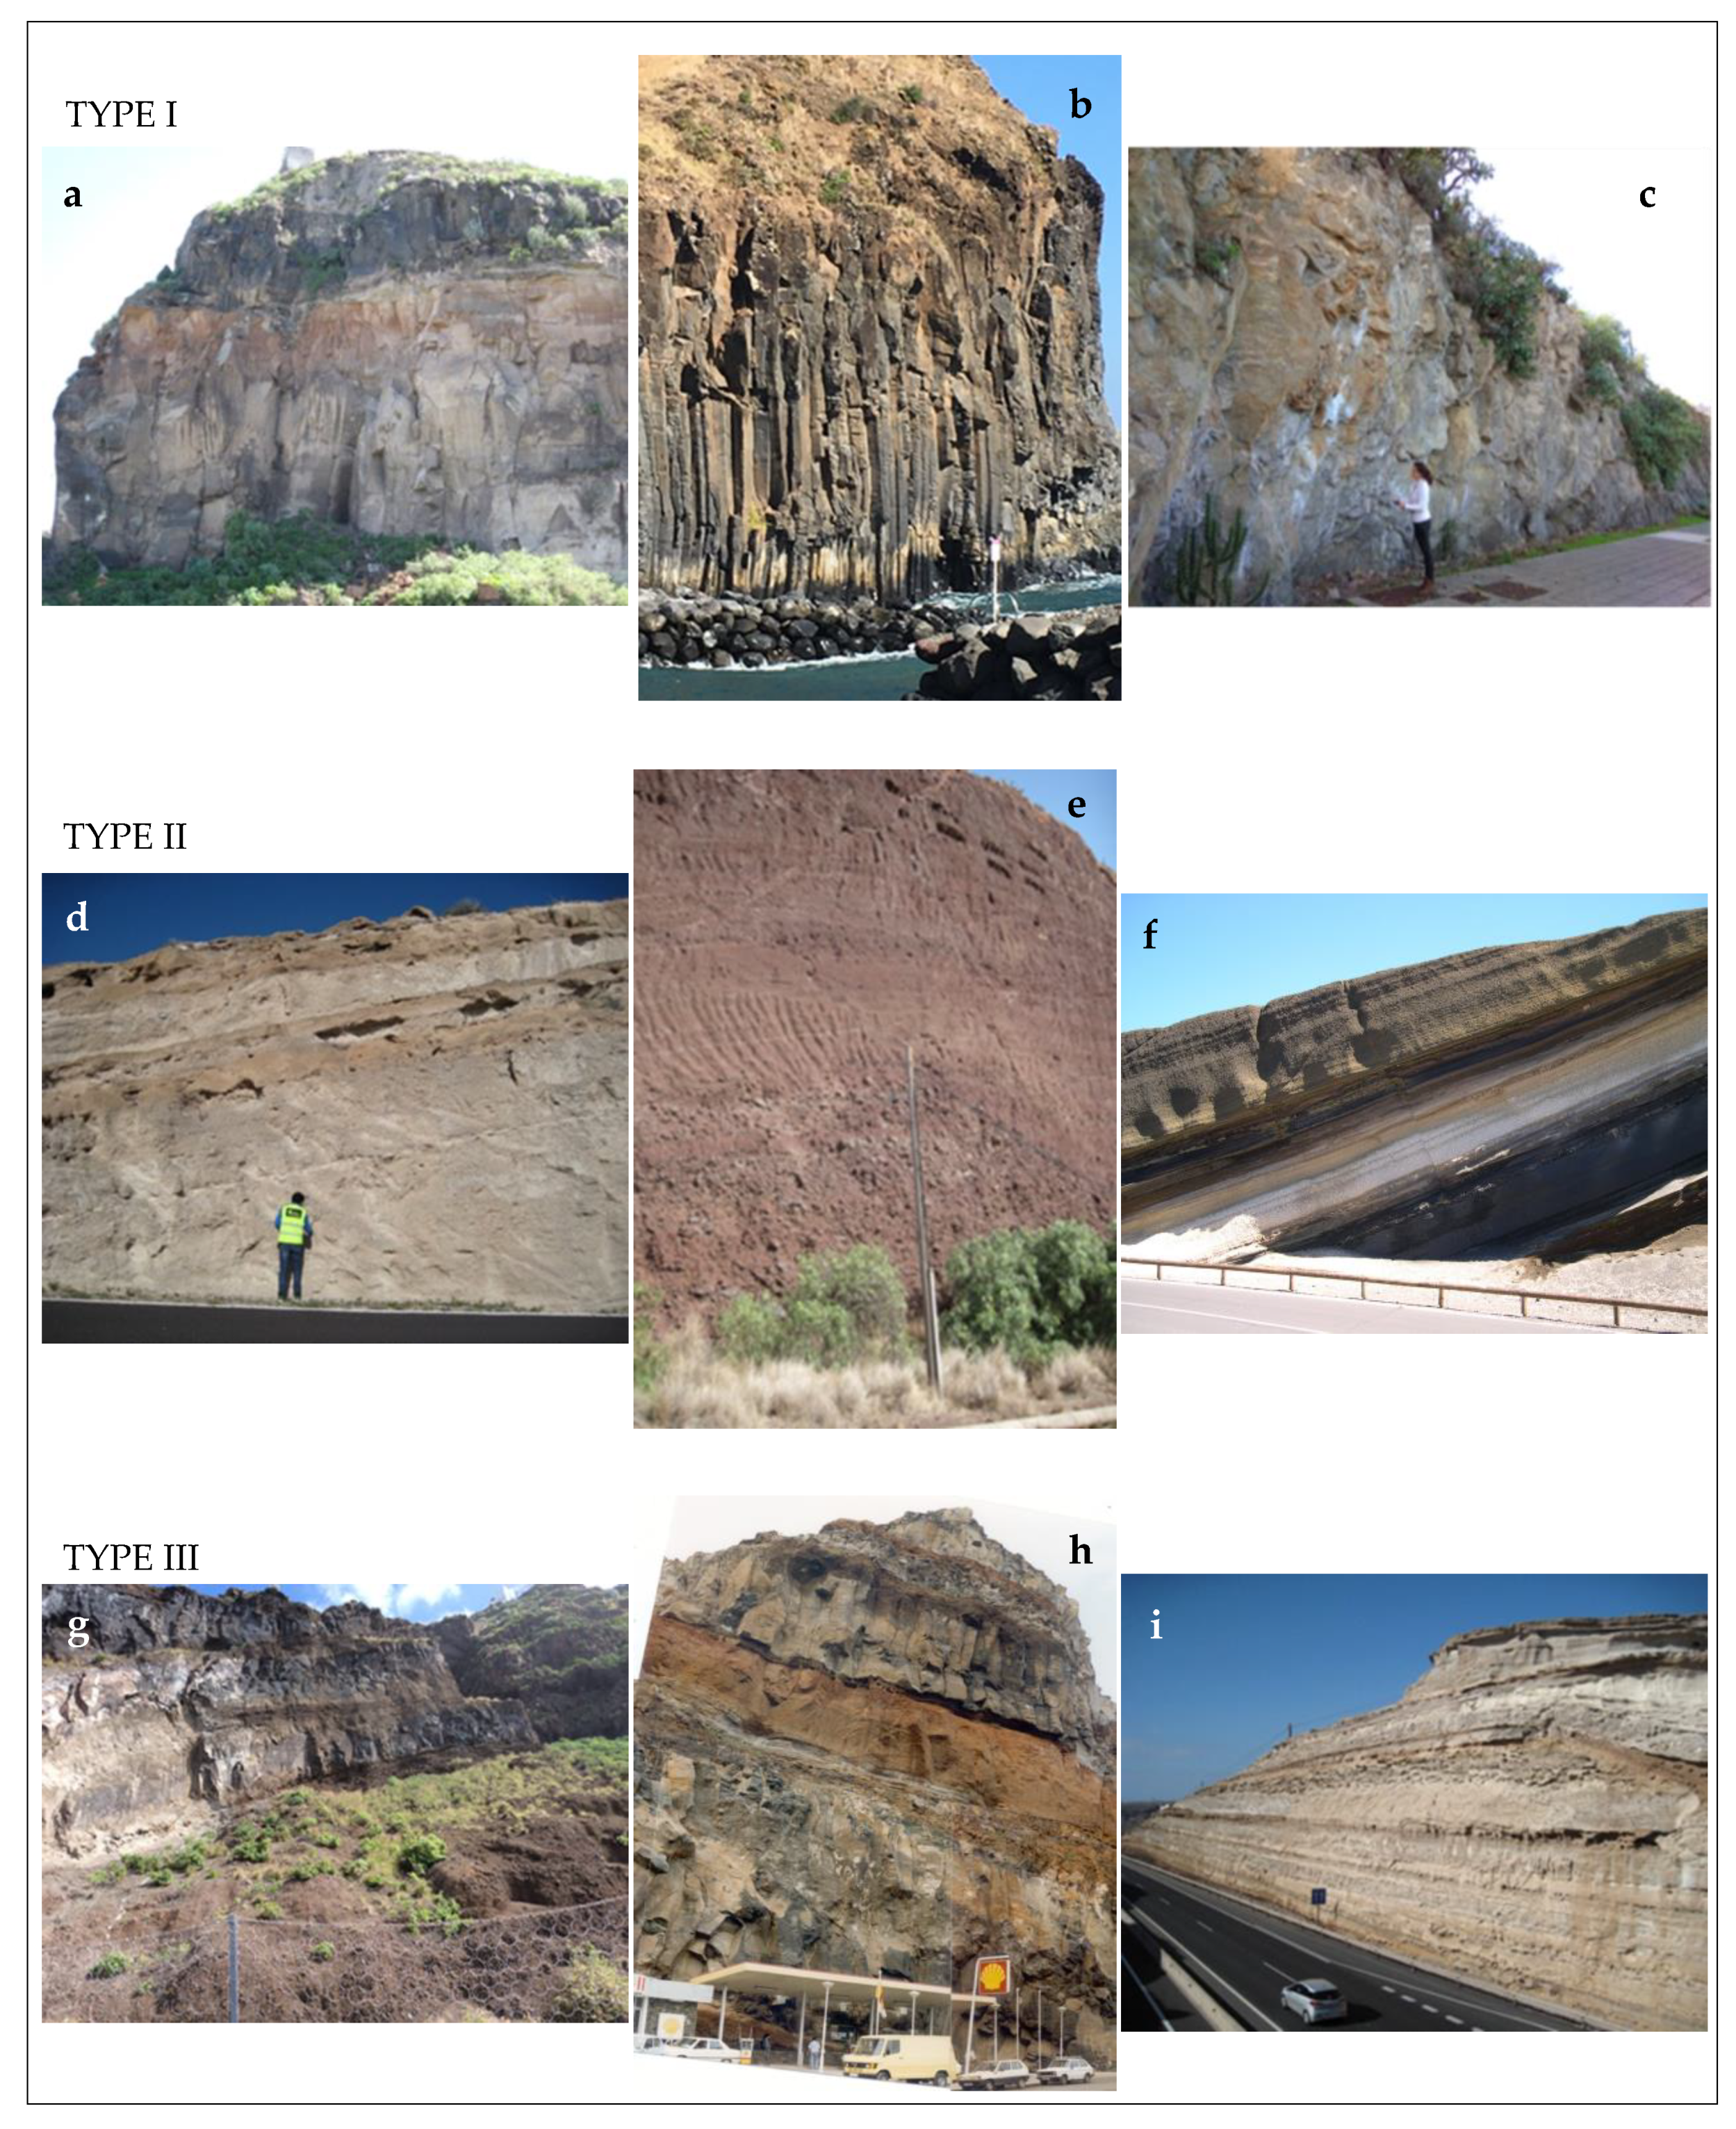
- Type of rock mass, which includes the following lithological groups:
- -
- Type I: rock masses formed by hard rock (>20 MPa) such as basalt, trachyte, phonolite, rhyolite and ignimbrite, together with highly compacted or welded tuffs and breccias. The factors influencing stability in this type of rock mass are the degree of fracturing and dip of the geological structure and the main discontinuity surfaces, where these are parallel to the slope direction. The most frequent instabilities are rockfalls caused by wedge failures, whether along planar surfaces or by toppling.
- -
- Type II: deposits of pyroclastic origin that are poorly compacted, loose or weakly welded. The main factor influencing stability is the degree of compaction or welding of pyroclastic particles. The most frequent instabilities are falls of loose materials or large blocks such as volcanic bombs.
- -
- Type III: rock masses formed by alternations or sequences of materials presenting different strengths. Weaker layers are more susceptible to erosive processes, undermining the base of harder layers and causing rocks or blocks to fall. For example, on slopes with basalt flows, scoria and pyroclastic layers, erosion of the latter causes blocks of the stronger materials to fall. The factors influencing instability are the degree of differential erosion between materials of different strengths and the formation of rock overhangs in hard layers.
- Sea or gully erosion. Slope proximity to the coast or gullies constitutes a decisive factor for instability. We established a distance of up to 50 m from the sea at high tide, or a gully, as the reference value for applying this penalty factor (Table 1).
- Instability indicators. The existence of fallen blocks, cracks, escarpments, etc., on a slope, and damage to nearby buildings or roads, are indicators of active instability processes and were included in the ISVS as a penalty factor. This factor is estimated according to the number of indicators observed, both on the ground and in nearby structures (Table 1).
3. Estimating Rockfall Hazard
4. Estimating Rockfall Risk: The IRVS Index
- The vulnerability of exposed elements (V) that may be affected by the rockfall and the degree of loss that such elements may experience due to a hazard of a given intensity. Vulnerability varies depending on the characteristics of an element and the magnitude or intensity of the event, and is expressed according to the percentage that may be affected, either in percent or on a scale of 0–1.
- The energy increment coefficient (EC) is related to the height from which a block on a slope falls. This was estimated by simulating rockfalls at different heights and slope angles, for blocks weighing 0.5, 1 and 2 t, and slope heights measuring between 10 and 90 m (Figure 6). Rockfall simulations were carried out using Rockfall 6.011.2008 program from Rockscience Inc. Coefficients of restitution Rn = 0.53 and Rt = 0.95 were applied according to the experience on basaltic rock masses from the Canary Islands [26].
- The cost coefficient (CC) refers to the economic losses of an exposed element affected by rockfalls.
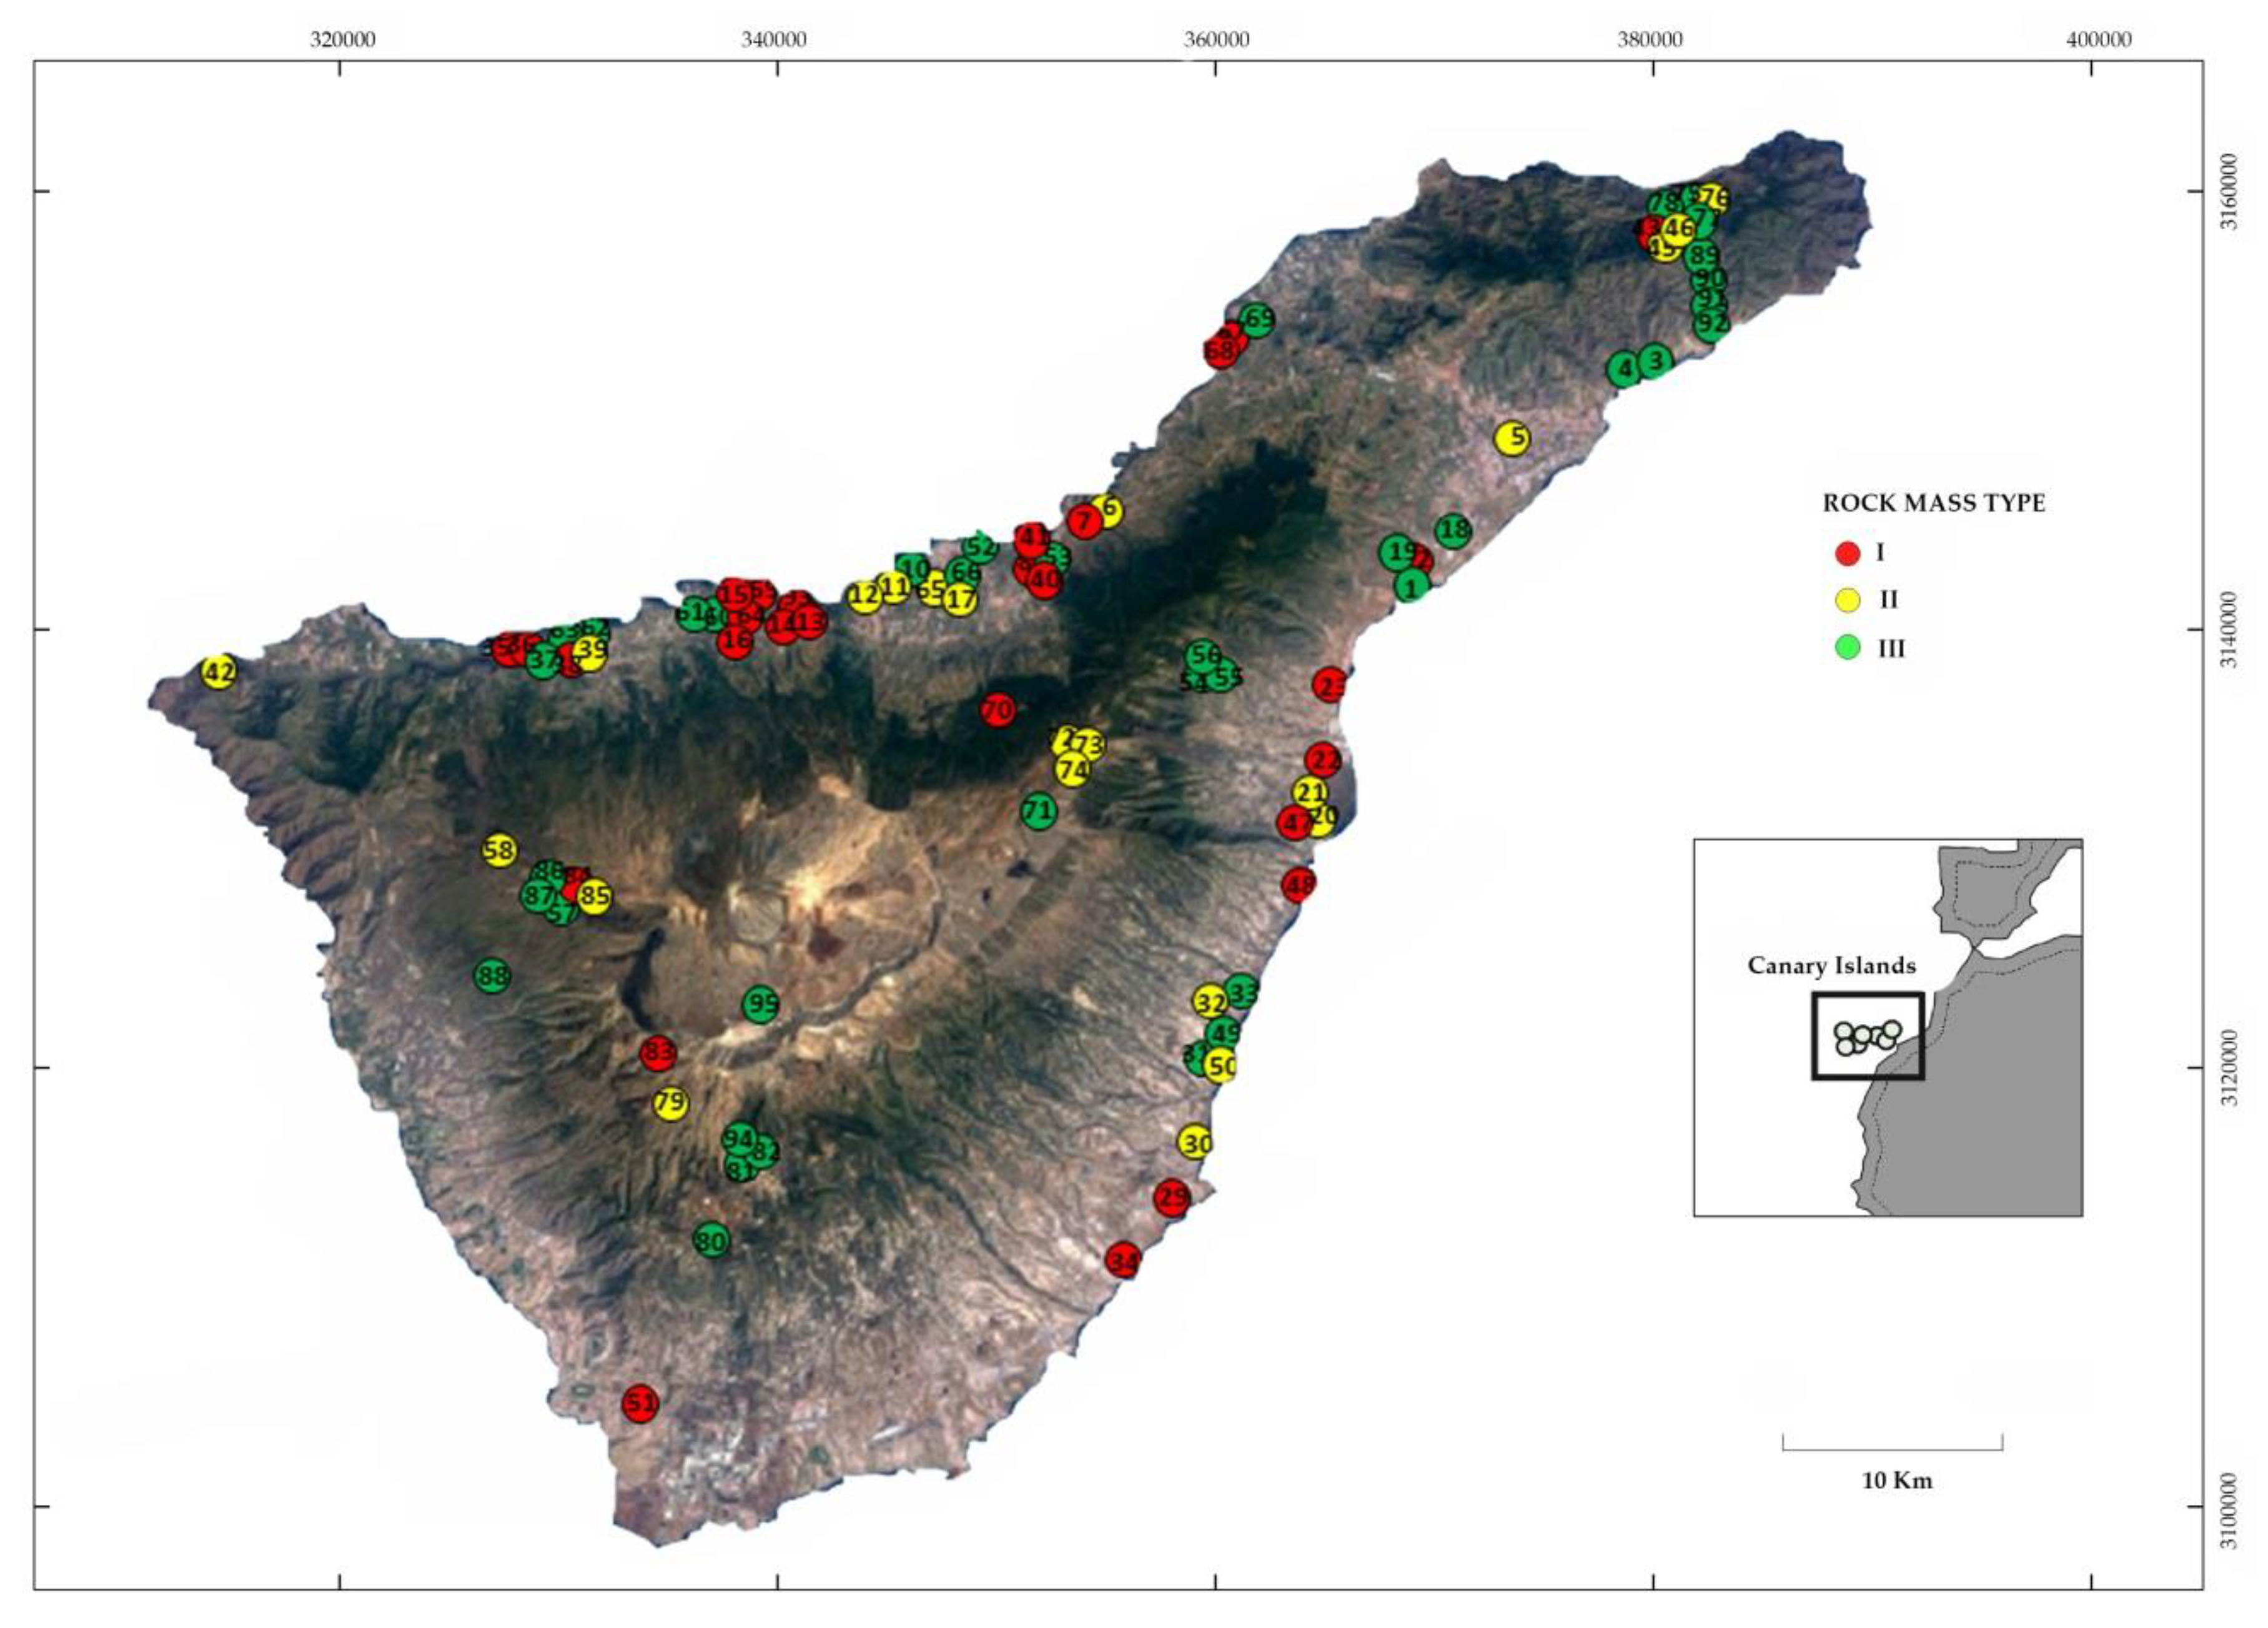
5. Application of the ISVS in Tenerife and Discussion of the Results
6. Conclusions
Author Contributions
Funding
Acknowledgments
Conflicts of Interest
Appendix A

| N° Slope | Coordinates (N/W) | Type of Rock Mass (*) | ISVS (**) | |||
|---|---|---|---|---|---|---|
| In Situ | Assigned | Susceptibility | ||||
| 1 | 2.840.269.444 | −163.391.389 | III | 42 | 40 | Moderate |
| 2 | 2.840.269.444 | −163.391.389 | I | 30 | 30 | Low |
| 3 | 2.849.227.778 | −162.198.889 | III | 72 | 70 | High |
| 4 | 2.848.719.444 | −162.349.167 | III | 60 | 65 | High |
| 5 | 2.845.958.333 | −162.908.889 | II | 30 | 31 | Low |
| 6 | 2.842.444.444 | −164.797.222 | II | 30 | 30 | Low |
| 7 | 28.43 | −16.49 | I | 50 | 50 | Moderate |
| 8 | 284.035 | −165.136.944 | I | 35 | 30 | Low |
| 10 | 2.840.083.333 | −165.686.111 | III | 60 | 62 | High |
| 11 | 283.975 | −165.788.889 | II | 25 | 25 | Low |
| 12 | 2.839.472.222 | −165.933.333 | II | 54 | 54 | Moderate |
| 13 | 2.839.277.778 | −166.155.556 | I | 60 | 63 | High |
| 14 | 2.839.166.667 | −166.252.778 | I | 24 | 25 | Low |
| 15 | 2.839.555.556 | −166.413.889 | I | 60 | 66 | High |
| 16 | 2.839.333.333 | −166.530.556 | I | 62 | 62 | High |
| 17 | 2.839.888.889 | −165.441.667 | II | 48 | 60 | High |
| 18 | 2.842.055.556 | −163.161.111 | III | 72 | 71 | High |
| 19 | 2.840.638.889 | −163.322.222 | III | 42 | 41 | Moderate |
| 20 | 2.830.083.333 | −163.777.778 | II | 54 | 54 | Moderate |
| 21 | 2.830.944.444 | −163.822.222 | II | 60 | 67 | High |
| 22 | 28.33 | −163.730.556 | I | 60 | 61 | High |
| 23 | 283.575 | −163.725 | I | 60 | 58 | Moderate |
| 24 | 2.865.833.333 | −178.736.111 | III | 42 | 55 | Moderate |
| 25 | 2.857.083.333 | −178.730.556 | III | 30 | 41 | Moderate |
| 26 | 2.854.138.889 | −178.669.444 | III | 60 | 61 | High |
| 27 | 2.853.083.333 | −178.636.111 | III | 60 | 71 | High |
| 28 | 2.849.916.667 | −178.538.889 | II | 61 | 70 | High |
| 29 | 2.814.694.444 | −164.527.778 | I | 30 | 31 | Low |
| 31 | 2.820.055.556 | −164.263.889 | III | 42 | 42 | Moderate |
| 32 | 2.822.527.778 | −164.294.444 | II | 30 | 32 | Low |
| 34 | 2.811.555.556 | −164.730.556 | I | 36 | 35 | Low |
| 35 | 2.837.138.889 | −167.533.333 | I | 60 | 64 | High |
| 36 | 2.837.138.889 | −167.533.333 | I | 72 | 72 | High |
| 37 | 28.37 | −167.319.444 | III | 35 | 36 | Moderate |
| 38 | 2.837.295.833 | −167.329.361 | I | 60 | 60 | High |
| 39 | 2.837.295.833 | −167.329.361 | II | 25 | 26 | Low |
| 40 | 284.035 | −165.136.944 | I | 24 | 24 | Low |
| 41 | 2.841.805.556 | −165.136.944 | I | 40 | 42 | Moderate |
| 43 | 2.854.016.944 | −162.281.722 | I | 50 | 51 | Moderate |
| 45 | 2.853.901.667 | -162.192.278 | II | 30 | 32 | Low |
| 46 | 28.547.125 | −162.124.139 | II | 25 | 26 | Low |
| 47 | 2.829.935 | −163.848.222 | I | 60 | 64 | High |
| 48 | 2.827.305.556 | −163.849.306 | I | 54 | 54 | Moderate |
| 49 | 2.821.230.278 | −164.233.528 | III | 36 | 35 | Low |
| 50 | 2.819.723.056 | -164.263.194 | II | 25 | 27 | Low |
| 51 | 2.805.953.056 | −166.905.194 | I | 20 | 20 | Low |
| 52 | 2.841.638.889 | −165.399 | III | 100 | 100 | Very High |
| 53 | 28.403.525 | −165.063.639 | III | 85 | 80 | Very High |
| 54 | 28.359.596 | −16.427.687 | III | 100 | 78 | High |
| 55 | 28.359.596 | −16.427.687 | III | 100 | 78 | High |
| 56 | 2.836.523.333 | −164.317.694 | III | 78 | 78 | High |
| 57 | 28.262.699 | −16.721.826 | III | 78 | 78 | High |
| 58 | 28.282.291 | −16.759.929 | II | 54 | 54 | Moderate |
| 59 | 28.395.447 | −16.641.457 | I | 60 | 60 | High |
| 60 | 28.384.465 | −16.661.344 | III | 96 | 96 | Very High |
| 61 | 28.384.465 | −16.661.344 | III | 96 | 96 | Very High |
| 62 | 2.837.784 | −16.721.676 | III | 90 | 72 | High |
| 63 | 2.837.636 | −16.728.338 | III | 100 | 100 | Very High |
| 64 | 2.839.211 | −16.652.258 | I | 42 | 60 | High |
| 65 | 28.392.749 | −16.560.064 | II | 54 | 66 | High |
| 66 | 28.403.227 | −16.538.762 | III | 100 | 100 | Very High |
| 67 | 28.501.822 | −16.424.532 | I | 60 | 60 | High |
| 68 | 28.501.822 | −16.424.532 | I | 60 | 60 | High |
| 69 | 28.501.164 | −16.422.387 | III | 54 | 54 | Moderate |
| 70 | 28.340.758 | −16.525.257 | I | 60 | 60 | High |
| 71 | 28.304.984 | −16.507.708 | III | 96 | 96 | Very High |
| 72 | 28.334.471 | −16.489.994 | II | 54 | 54 | Moderate |
| 73 | 28.334.471 | −16.489.994 | II | 54 | 54 | Moderate |
| 74 | 28.334.932 | −16.491.067 | II | 54 | 54 | Moderate |
| 75 | 28.558.409 | −16.205.669 | III | 36 | 36 | Moderate |
| 76 | 28.558.409 | −16.205.669 | II | 54 | 54 | Moderate |
| 77 | 28.553.838 | −16.208.707 | III | 78 | 78 | High |
| 78 | 28.559.011 | −16.216.629 | III | 100 | 100 | Very High |
| 79 | 28.177.603 | −16.673.352 | II | 54 | 54 | Moderate |
| 80 | 28.125.951 | −16.660.136 | III | 78 | 78 | High |
| 81 | 28.159.374 | −16.638.348 | III | 78 | 78 | High |
| 82 | 28.164.092 | −16.638.387 | III | 42 | 100 | Very High |
| 83 | 28.208.221 | −16.679.319 | I | 60 | 60 | High |
| 84 | 28.274.098 | −16.728.251 | I | 72 | 72 | High |
| 85 | 28.274.095 | −16.728.251 | II | 66 | 54 | Moderate |
| 86 | 28.266.742 | −16.736.684 | III | 72 | 72 | High |
| 87 | 28.263.197 | −16.737.592 | III | 100 | 78 | High |
| 88 | 28.231.522 | −16.760.112 | III | 100 | 78 | High |
| 89 | 28.535 | −16.198.333 | III | 90 | 78 | High |
| 90 | 28.526.389 | −16.195.278 | III | 78 | 36 | Moderate |
| 91 | 28.517.444 | −16.193.722 | III | 54 | 54 | Moderate |
| 92 | 28.511.389 | −161.925 | III | 90 | 90 | Very High |
| 93 | 2.839.152.778 | −166.252.472 | I | 42 | 42 | Moderate |
| 94 | 28.165.375 | −166.365.306 | III | 90 | 90 | Very High |
| 95 | 28.224.167 | −16.631.111 | III | 100 | 100 | Very High |
References
- Budetta, P. Asessment of rockfalls risk along roads. Nat. Hazards Earth Syst. Sci. 2004, 4, 71–81. [Google Scholar] [CrossRef] [Green Version]
- Michoud, C.; Derron, M.-H.; Horton, P.; Guerin, A.; Baillifard, F.-J.; Loye, A.; Nicolet, P.; Pedrazzini, A.; Queyrel, A. Rockfall hazard and risk assessments along roads at a regional scale: Example in Swiss Alps. Nat. Hazards Earth Syst. Sci. 2012, 12, 615–629. [Google Scholar] [CrossRef] [Green Version]
- Argyroudis, S.A.; Mitoulis, S.; Winter, M.; Kayna, A. Fragility of transport assets exposed to multiple hazards: State-of-the-art review toward infrastructural resilience. Reliab. Eng. Syst. Safe 2019, 199. [Google Scholar] [CrossRef]
- Martino, S.; Bozzano, F.; Caporossi, P.; D’Angiò, D.; Della Seta, M.; Esposito, C.; Fantini, A.; Fiorucci, M.; Giannini, L.M.; Iannucci, R.; et al. Impact of landslides on transportation routes during the 2016–2017 Central Italy seismic sequence. Landslides 2019, 16, 1221–1241. [Google Scholar] [CrossRef]
- González de Vallejo, L.I.; Hijazo, R.T.; Ferrer, G.M. Engineering geological properties of the volcanic rocks and soils of the Canary Islands. Soils Rocks 2008, 31, 3–13. [Google Scholar]
- Hernández-Gutierrez, L.E. Geomechanical Characterization of the Volcanic Rocks of Canary Islands. Ph.D. Thesis, Universidad de La Laguna, Tenerife, Spain, 2015. [Google Scholar]
- Malone, A.W. Risk management and slope failure in Hong Kong. Trans. Hong Kong Inst. Eng. 1997, 4, 12–21. [Google Scholar]
- Fepuleai, A.; Németh, K. Volcanic Geoheritage of landslides and rockfalls on a tropical ocean island of Western Samoa, SW Pacific. Geoheritage. 2019, 11, 577–596. [Google Scholar] [CrossRef]
- Dinis da Gama, C.; Ribeiro e Sousa, L. (Eds.) Volcanic Rocks and Soils. In Proceedings of the International Workshop on Volcanic Rocks. EUROCK 2002, ISRM, Madeira, Portugal, 23–28 November 2002. [Google Scholar]
- Malheiro, A.M.; Nunes, J.C. (Eds.) Volcanic Rocks. Volcanic Rocks and Soils. In Proceedings of the International Workshop on Volcanic Rocks. ISRM, Azores, Portugal, 14–17 July 2007; Taylor & Francis: London, UK, 2007. [Google Scholar]
- Olalla, C.; Hernández, L.E.; Rodríguez Losada, J.A.; Perucho, A.; González-Gallego, J. (Eds.) Rock Mechanics and Geo-Engineering in Volcanic Environments. In Proceedings of the International Workshop on Volcanic Rocks, ISRM, Tenerife, Spain, 31 May–1 June 2010; CRC Press: Leiden, The Netherland, 2010. [Google Scholar]
- Rotonda, T.; Cecconi, M.; Silvestri, F.; Tommasi, P. (Eds.) Volcanic Rocks and Soils. In Proceedings of the International Workshop on Volcanic Rocks, ISRM, Ischia, Italy, 24–25 September 2016; CRC Press: Leiden, The Netherland, 2016. [Google Scholar]
- Bieniawski, Z.T. Engineering Classification of Jointed Rock Masses. Trans. S. Afr. Inst. Civ. Eng. 1973, 15, 333–343. [Google Scholar]
- Barton, N.; Lien, R.; Lunde, J. Engineering classification of rock masses for the design of rock support. Rock Mech. 1974, 6, 189–236. [Google Scholar] [CrossRef]
- Hoek, E. Strength of rocks and rock masses. Int. Soc. Rock Mech. 1994, 2, 4–16. [Google Scholar]
- Hoek, E.; Marinos, P.; Benissi, M. Applicability of the Geological Strength Index (GSI) classification for very weak and sheared rock masses. The case of the Athens Schist Formation. Bull. Eng. Geol. Environ. 1998, 57, 151–160. [Google Scholar] [CrossRef]
- Singh, A.; Connolly, M.J. VRFSR: An empirical method for determining volcanic rock excavation safety on construction sites. J. Inst. Eng. (India) 2003, 84, 176–191. [Google Scholar]
- Miranda, T.; Sousa, L.R.; Gomes, A.T.; Tinoco, J.; Ferreira, C. Geomechanical characterization of volcanic rocks using empirical systems and data mining techniques. J. Rock Mech. Geotech. Eng. 2018, 10, 138–150. [Google Scholar] [CrossRef]
- Muñiz, M.; Gonzalez-Gallego, F.J. A Simple Methodology for Hazard Assessment of Slopes in Volcanic Rocks from Canary Islands: First steps. MACASTAB Project. In Geomechanical and Geodynamics of Rock Masses, Vol. 2, Proceedings of the EUROCK, ISRM Symposium, Saint Petersburg, Russia, 22–26 May 2018; Litvinenko, V., Ed.; CRC Press: London, UK, 2018. [Google Scholar]
- González de Vallejo, L.I.; Nestares, E.; Ferrer, M.; Andreotti, P. Slope Engineering in the Last 50 years in Spain. Ingeniería Civil. 2017, 187, 85–101. (In Spanish) [Google Scholar]
- González de Vallejo, L.I. Geological Engineering of Slopes: Experiences in Spain and Slope Stability in Volcanic Rocks; Special Lecture; Especialidad Ingeniería Geológica, Academia de Ingeniería de México: Mexico City, Mexico, 2019. (In Spanish) [Google Scholar]
- Fenton, G.A.; Griffiths, D.V. Risk Assessment in Geotechnical Engineering; John Wiley and Sons: Hoboken, NJ, USA, 2008; pp. 3–69, 239–241. [Google Scholar]
- Varnes, D.J. Landslide Hazard Zonation: A Review of Principles and Practice; United Nations Educational: Paris, France, 1884; 63p. [Google Scholar]
- Cabildo de Tenerife. Geotecnical Hazard Studies in Tenerife Road Network; Unpublished; Servicio Técnico de Carreteras y Paisaje. Dirección Insular de Carreteras: Tenerife, Spain, 1998. (In Spanish) [Google Scholar]
- Cabildo de Tenerife. Integral Road Maintenance Data and Management; Unpublished; Servicio Técnico de Carreteras y Paisaje, GCC-2. Dirección Insular de Carreteras: Tenerife, Spain, 2016. (In Spanish) [Google Scholar]
- MACASTAB. Bases for the Development of A Methodological Guide to Manage Natural Risks Due to Instability of Volcanic Slopes in the Macaronesian Region, MAC/3.5b/027; INTERREG V-A 2014–2020 European Project; Special Report; Gobierno de Canarias, Tenerife, Spain, 2018. Available online: www.macastab.com (accessed on 3 March 2020).
- González-Díaz, E. Study on the Relationship between Precipitation and Rockfalls in Tenerife; Unpublished; Departamento de Técnicas y Proyectos en Ingeniería y Arquitectura. Universidad de La Laguna: Tenerife, Spain, 2018. (In Spanish) [Google Scholar]
- Fell, R.; Corominas, J.; Bonnard, C.; Savage, W. Guidelines for landslide susceptibility, hazard and risk zoning for land use planning. Eng. Geol. 2008, 102, 85–98. [Google Scholar] [CrossRef] [Green Version]
- Corominas, J.; Van Westen, C.; Frattini, P.; Cascini, L.; Malet, J.-P.; Fotopoulou, S.; Catani, F.; Eeckhaut, M.V.D.; Mavrouli, O.; Agliardi, F.; et al. Recommendations for the quantitative analysis of landslide risk. Eng. Geol. 2014, 73, 209–264. [Google Scholar] [CrossRef]
- AGS. (Australian Geomechanics Society). Guidelines for Landslide Susceptibility Hazard and Risk Zoning for Land Use Planning. J. News Aust. Geomech. Soc. 2007, 42, 13–36. [Google Scholar]
- Whipple, C. Approaches to Acceptable Risks. In Proceedings of the Engineering Conference Risk-Based Decision Making in Water Resources; Haimes, Y.Y., Stakhiv, E.Z., Eds.; Amer Society of Civil Engineers: Santa Bárbara, CA, USA, 1986; pp. 30–45. [Google Scholar]
- Gobierno de Canarias. Climatic Characterization of the Canary Islands and Its Application to the Building Technical Code. CLIMCAN-010. 2010. Available online: https://www.gobiernodecanarias.org/optv/doc/labobras/descargas/CLIMCAN_010.pdf (accessed on 3 March 2020). (In Spanish).
- Rollino, M. Stability Analysis of Volcanic Rock Slopes Based on Geomechanical Classifications; Tesi di Laurea Magistrale. Dipartamento di Scienze della Terra. Universitá degli Studi di Torino: Turin, Italy, 2019; 115p. [Google Scholar]
- de la LLata, R.; (Academia de Ingeniería de México, Ciudad de México, Mexico). Personal communication, 2019.


| A. ROCK MASS TYPE | |||||||
|---|---|---|---|---|---|---|---|
| Type I: Hard rocks | Type II: Pyroclastic deposits | Type III: Sequence of layers with different strengths | |||||
| 1. Degree of fracture | Pt | 1. Degree of compaction/ welding (*) | Pt | 1. Degree of differential erosion (*) | Pt | ||
| Massive: <1 joint/m3 | 0 | High | 0 | Low | 0 | ||
| Low: 1–3 joints/m3 | 5 | Medium | 5 | Medium | 15 | ||
| Moderate: 3–10/m3 | 20 | Low | 25 | High | 30 | ||
| High: >10 joints/m3 | 30 | Very Low | 35 | ||||
| 2. Dip of geological structure or main discontinuity surfaces dipping to slope face | Pt | 2. Overhang formation (*) | Pt | ||||
| Very small blocks | 0 | ||||||
| <20° | 0 | Small blocks | 10 | ||||
| 20–40° | 5 | Medium blocks | 30 | ||||
| >40° | 10 | Large blocks | 40 | ||||
| B. SLOPE ANGLE | C. PROXIMITY TO COAST OR GULLIES | D. INSTABILITY INDICATORS | |||||
| Average slope angle | Pt | Slopes <50 m from high tides or gullies | Pt | Number of indicators | F | ||
| <45° | Moderate | 0 | 10 | 0 | 1 | ||
| 45–75° | High | 10 | 1 to 3 | 1.2 | |||
| >75° | Very High | 20 | >3 | 1.35 | |||
| INSTABILITY INDICATORS | ISVS ESTIMATION | ||||||
| Scarps and cracks | ISVS basic = [AI(1+2) or AII(1) or AIII(1+2)] + B + C | ||||||
| Ground bulges and deformations | |||||||
| Fallen blocks or recent signs of failure surfaces | |||||||
| Diversion of channels | ISVS = ISVS basic · D | ||||||
| Accumulation of deposits at the foot of slopes | |||||||
| Ponding | ISVS | ||||||
| Water surges and changes in water sources | Score | SUSCEPTIBILITY | |||||
| Tree tilting | <35 | Low | |||||
| Cracks in walls, foundations or other structural elements | 35–59 | Moderate | |||||
| Tilt and collapse of walls | 60–79 | High | |||||
| Broken pipes | ≥80 | Very High | |||||
| NOTES: (*) See Table 2. Maximum ISVS score: 100. Not applicable to soils, colluvial deposits or highly weathered rocks. Susceptibility indicates possibility of occurrence. Only one of the options for type of rock mass can be selected: I, II or III. For type III rock mass without differential erosion, types I or II will be selected. Only one option is selected for each parameter in the score assignment. | |||||||
| Parameter | Degree | Description | ISVS Rating | |
|---|---|---|---|---|
| II.1. Degree of compaction/welding | Medium | Difficult to break with geological hammer | 5 | |
| Low | Easily broken with geological hammer | 25 | ||
| Very low | Easily broken with hand | 35 | ||
| III.1. Differential erosion | Low | C < 15 cm | 0 | |
| Medium | Small concavities in the weathered materials C < 50 cm | 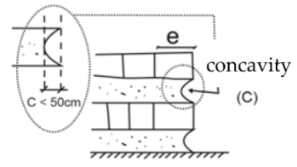 | 15 | |
| High | Large concavities C ≥ 50 cm | 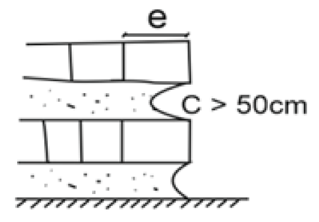 | 30 | |
| III.2. Overhang formation | Small blocks C < 25 cm and e/C < 2 | 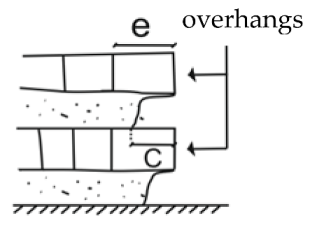 | 10 | |
| Medium blocks 25 ≤ C < 50 cm and e/C < 2 | 30 | |||
| Large blocks C ≥ 50 cm and e/C < 2 | 40 | |||
| ISVS | Rockfall Frequency | ||||
|---|---|---|---|---|---|
| Score | Susceptibility | Field Observations (1) | Rockfall Event History (2) | T (Years) (3) | |
| <35 | Low | No fallen blocks | No record of rockfall in the area | ≥100 | |
| 35–59 | Moderate | Some fallen blocks of small or medium size | No record of rockfall in the area | ≥50 | |
| 60–79 | High | Several fallen blocks of different sizes | Some record of rockfalls in the last 50 years | ≥25 | |
| ≥80 | Very High | Numerous fallen blocks of different sizes | Several records of rockfalls in the last 25 years | <25 | |
| Probability (P) | Precipitation Factor (PF) | Hazard (HA) | |||||||
|---|---|---|---|---|---|---|---|---|---|
| Susceptibility ISVS | Return Period T (Years) | Py (1) | Pn (2) | Precipitation (mm/Day) | PF (3) | HA = Pn · PF | Degree | ||
| <35 Low | ≥100 | <0.01 | <0.5 | Low Moderate | <30 | 1 | <0.25 | Low | |
| 35–59 Moderate | ≥50 | ≥0.01 <0.02 | ≥0.5 <0.75 | High | <50 | 1.7 | ≥0.25 <0.5 | Mode rate | |
| 60–79 High | ≥25 | ≥0.02 <0.04 | ≥0.7 <0.94 | Very High | ≥50 | 2 | ≥0.5 <0.75 | High | |
| ≥80 Very High | <25 | ≥0.04 | ≥0.94 | Very High | ≥ 0.75 | Very High | |||
| Vulnerability (V) | Energy Increment Coefficient (EC *) | Cost Coefficient (CC) | Loss Index (LI) LI = V·EC·CC | ||||||
|---|---|---|---|---|---|---|---|---|---|
| Type of Element | Frequent Vulnerability Values | Slope Height (m) (*) | Impact Energy | EC | Cost (€ × 103) | CC | LI | Degree of Loss | |
| Households | 0.2–0.8 | ≤10 | Low | 1 | <50 | 1 | ≤2 | Low | |
| Urban centres | 0.1–0.2 | ≤20 | Moderate | 1.5 | <200 | 3 | ≤4 | Moderate | |
| Industrial facilities | 0.1–0.2 | ≤30 | High | 2.5 | <1000 | 8 | ≤8 | High | |
| Recreational areas | 0.1–0.3 | >30 | Very High | 3.5 | ≥1000 | 15–20 | >8 | Very High | |
| IRVS | Risk Level | Preventive Measures | Priority of Action |
|---|---|---|---|
| <1 | Low | None | Not required |
| 1–3 | Moderate | Site evaluation | In the medium term |
| 3–6 | High | Detailed survey | Short to very short term |
| >6 | Very High |
© 2020 by the authors. Licensee MDPI, Basel, Switzerland. This article is an open access article distributed under the terms and conditions of the Creative Commons Attribution (CC BY) license (http://creativecommons.org/licenses/by/4.0/).
Share and Cite
González de Vallejo, L.I.; Hernández-Gutiérrez, L.E.; Miranda, A.; Ferrer, M. Rockfall Hazard Assessment in Volcanic Regions Based on ISVS and IRVS Geomechanical Indices. Geosciences 2020, 10, 220. https://doi.org/10.3390/geosciences10060220
González de Vallejo LI, Hernández-Gutiérrez LE, Miranda A, Ferrer M. Rockfall Hazard Assessment in Volcanic Regions Based on ISVS and IRVS Geomechanical Indices. Geosciences. 2020; 10(6):220. https://doi.org/10.3390/geosciences10060220
Chicago/Turabian StyleGonzález de Vallejo, Luis I., Luis E. Hernández-Gutiérrez, Ana Miranda, and Mercedes Ferrer. 2020. "Rockfall Hazard Assessment in Volcanic Regions Based on ISVS and IRVS Geomechanical Indices" Geosciences 10, no. 6: 220. https://doi.org/10.3390/geosciences10060220