Article

Geochemical Characterization and Thermal Maturation of Cerrejón Formation: Implications for the Petroleum System in the Ranchería Sub-Basin, Colombia

by
Luis Felipe Cruz-Ceballos
1,2,*,
Mario García-González
1,3,
Luis Enrique Cruz-Guevara
1,3 and
Gladys Marcela Avendaño-Sánchez
1,2
1
Geology School, Universidad Industrial de Santander (UIS), Carrera 27 Calle 9 Ciudad Universitaria, Bucaramanga 680002, Colombia
2
Grupo de Investigación en Geología Básica y Aplicada (GIGBA), UIS Guatiguará, Piedecuesta 681011, Colombia
3
Energy and Other Non-Renewable Resources Research Group (EONr3g), UIS Guatiguará, Piedecuesta 681011, Colombia
*
Author to whom correspondence should be addressed.
Geosciences 2020, 10(7), 258; https://doi.org/10.3390/geosciences10070258
Submission received: 17 April 2020 / Revised: 17 June 2020 / Accepted: 19 June 2020 / Published: 4 July 2020
(This article belongs to the Special Issue Tectono-Sedimentary Evolution of Cenozoic Basins)

Abstract

:
The Upper Paleocene Cerrejón Formation is a great source of coal in Colombia. The northeastern part of the Ranchería Sub-Basin sees the most intense mining activity. As a consequence, all geological studies have been concentrated on this region. Consequently, neither the distribution of the Cerrejón Formation, nor the quality and quantity of organic matter in the rest of the sub-basin is clear. In this study, we analyzed new geochemical data from Rock–Eval pyrolysis analyses and vitrinite reflectance using core samples from the ANH-CAÑABOBA-1 and ANH-CARRETALITO-1 wells. Based on this information, it was possible to classify the geochemical characteristics of the Cerrejón Formation as a source rock, particularly in the central area of the sub-basin, which had not been extensively studied before. Additionally, based on the interpretation of seismic reflection data, the numerical burial history models were reconstructed using PetroMod software, in order to understand the evolution of the petroleum system in the sub-basin. The models were calibrated with the data of maximum pyrolysis temperature (Tmax), vitrinite reflectance (%Ro), and bottom hole temperature (BHT). We infer the potential times of the generation and expulsion of hydrocarbon from the source rock.

1. Introduction

Geochemical studies have been insufficient in relation to the Ranchería Sub-Basin [1]. Previous works have focused on data acquired in the northern part of the sub-basin, where the Cerrejón Mine is located (Figure 1). However, the southern part has only one well drilled and there are little data regarding it [2], and the central part has not been explored/studied at all. This study provides new geochemical data for the central part of the sub-basin. The Cerrejón Formation is an excellent source of coal in Colombia, with a potential 3000 million tons [3]. The Cerrejón Formation in the Ranchería Sub-Basin has an area distribution of 2500 km2 [4], with a net thickness of 360 ft (109.7 m) of coal, ranging from bituminous to sub-bituminous, with a variation in vitrinite reflectance (%Ro) from 0.4 to 0.8, which could potentially generate on-site gas reserves associated with more than six trillion cubic feet (TCF) of coal. The study of the evolution of the oil system in this sub-basin is under discussion due to its high structural complexity [5] and the lack of data from paleo geothermometers (%Ro and maximum pyrolysis temperature (Tmax)). This is proven by the results obtained by [6,7], whose proposals regarding the basin’s evolution are radically contrasting. The National Hydrocarbon Agency (ANH), a public institution which oversees the economic activity of hydrocarbons in Colombia, is interested in investigating this sub-basin in the short and long term in order to increase knowledge about its hydrocarbon production potential.
This study presents new geochemical data, including the Rock–Eval pyrolysis of 127 samples, the total organic carbon (TOC) of 58 samples, and the vitrinite reflectance (%Ro) of 58 samples. The core samples were acquired from the ANH-CAÑABOBA-1 and ANH-CARRETALITO-1 wells (Figure 1 and Figure 2). This study aims to establish the current maturity state and the potential for hydrocarbon generation (quality and quantity) of the rocks in the Cerrejón Formation. Furthermore, we would like to recreate the burial history scenario through numerical modeling with the PetroMod software. The modeling is based on geochemical data, the stratigraphic/structural architecture as interpreted by 2D seismic reflection data, and the several uplift events of the Perijá Range (PR) that affected the burial history. It also provides insights which may help to understand the current state of maturity, as well as the organic transformation ratios (TR) of the cretaceous formations underneath the Cerrejón Formation, which is fundamental for any understanding of the organic geochemical characteristics of the Cerrejón Formation, as well as how the basin was filled with sediments. It has direct implications regarding the maturation of organic matter of the units as well as the generation of hydrocarbons.

2. Study Area

The Cerrejón Formation belongs to the stratigraphic section of the Ranchería Sub-Basin [8]. Based on palynological analysis, it is dated to the Late Paleocene, which formed in a period of 2 million years (my) [9]. The progression of the depositional system to the east during the Late Paleocene was suggested by Bayona et al. [10]. Furthermore, Morón et al. [11] stated that the Cerrejón Formation was deposited in tectonic subsidence with constant sedimentation rates and a rhythmic variation in the base level of erosion, which generated repetitive and monotonous sedimentation patterns. The Cerrejón Formation was described by Ingeominas [12] as a sequence with a predominance of mudstones with some quartz-feldspar sandstones. Numerous coal layers distributed regularly throughout the entire stratigraphic column. The Cerrejón Formation was deposited in a fluvial–estuarine environment [13]. It was in a tropical lowland coastal humid forest based on fossil megaflora [14], which had characteristics of a multi-layered tropical forest environment in the Neotropics [15], with a mean annual temperature (MAT) of 32 to 33 °C estimated from the 13-m size snake, Titanoboa cerrejonensis, recovered from the Cerrejón Mine [16]. Regarding the Cerrejón Formation, Wilf et al. [17] calculated the mean annual precipitation (MAP) as around 3240 mm (ranging from 2260 to 4640 mm) using correlations of the paleo-leaf size and the precipitation observed in live vegetation. The Cerrejón Formation presents 1000 m in total thickness and contains 80 layers of coal [11].
Bayona et al. [10] proposed that the presence of intercalation of siliciclastic materials in the Cerrejón Formation, not only in the Maracaibo Basin (Diablo Mine), but also in the Ranchería Sub-Basin (Cerrejón Mine), may have been due to significant uplift from the Perijá Range (PR) in the late Paleocene to Middle Eocene, between 66 to 41 million years ago (mya). This fact is consistent with the lack of stratigraphic records in the Eocene–Oligocene in the Ranchería Sub-Basin as mentioned by Mesa and Rengifo [1], indicating several tectonic pulses during the Andean Orogeny. Some sediments assigned to this period in the supergiant Maracaibo Basin were from alluvial fan and fluvial deposits (conglomerates and sandstones) [18]. Hernandez and Jaramillo [19] studied the Apatite Fission-Track (AFT) on the Lower Cretaceous rocks present in the PR, asserting that the last uplift event began in the Late Miocene (11 mya). These data were consistent with the studies carried out by Bermudez [20]: AFT established the orogeny of the Andes de Mérida, which had a rapid cooling in the Miocene–Pliocene, indicating its exhumation. This orogeny also occurred in the Merida Block which includes the PR [21].
Previous studies have determined the characteristics of the coal from the Cerrejón Mine to the north of the Ranchería Sub-Basin. They established that the coal is bituminous, high in volatiles A and B [22]. From the analysis of 196 samples of Cerrejón coals, Departamento Nacional de Planeacion [22] obtained an average of 31.19 MJ/kg of calorific value and 37% volatile materials. The analysis by Piñeres et al. [23] of the coal from the mine showed a calorific value of 23.75 MJ/kg with an average of 1.41% sulfur, and were high in volatiles, which were classified as a sub-bituminous B coal [24]. Rincon et al. [25] presented data of 34% volatile material with values of 0.66% sulfur in the coal of the Cerrejón Central Mine and 33.4% volatile material with 0.7% in the coal of the Cerrejón Norte Mine. According to Henao [26], coals of the WRV-04752 and WRV-04774 wells were high in volatiles as well, between 34.09 to 37.2%, with sulfur values from 0.22 to 0.41%. Layton [27] analyzed 25 coal samples from the WRV-04752 Well, establishing an average of 34.91% volatile material with an average of 0.56% sulfur content. Layton [27] also analyzed 28 coal samples from the WRV-04774 Well, determining that volatile material was on average 34.479%, with an average of 0.81% sulfur content.

3. Data and Methods

Geochemical analysis was used to establish the type and quality of organic carbon and other geochemical properties of rocks, which contributed to evaluating the potential production of conventional or unconventional hydrocarbons in a prospective play. Geochemical data were obtained using core samples from the Cerrejón Formation of two wells, ANH-CARRETALITO-1 and ANH-CAÑABOBA-1. Vertical sampling was not performed with symmetrical length values (Figure 3). The selection criterion was based on the visible presence of organic matter using an ultraviolet lamp. Geochemical analysis of Rock–Eval pyrolysis, TOC, and total sulfur (TS) were carried out for 108 samples of the ANH-CARRETALITO-1 Well and 19 samples of the ANH-CAÑABOBA-1 Well. Vitrinite reflectance analyses on 58 samples were obtained through organic petrography. Additional geochemical data used in this study were obtained from [2,28,29], and corresponded to 356 samples of the hydrogen index (HI) and oxygen index (OI), and 332 samples of TOC belonging to lithological formation where geochemical analyses were performed. The TOC analysis was carried out with the intention of quantifying the amount of organic matter present in the sample using the Leco SC-144DR automated analyzer. It also allowed us to calculate the TS as well as the carbonate content. Likewise, to evaluate the quality of this organic matter, a Rock–Eval pyrolysis analysis was performed in each of the samples with Rock–Eval 6 technology equipment. This technique presented by Barker [30] and Behar [31] uses programmed heating of a small amount of rock (70 mg) or coal (30–50 mg) in an inert atmosphere (helium or nitrogen) in order to determine the quantity of free hydrocarbons present in the sample (S1 peak), as well as those that potentially can be released after maturation (S2 peak). This procedure permitted us to know the Tmax and the current state of thermal maturation. The TOC had to be determined along with the mineral carbon content (MinC), the volume of free hydrocarbon generated before pyrolysis (S1), the amount of hydrocarbon generated during pyrolysis (S2), the amount of emitted carbon dioxide (S3), the hydrogen index (HI = S2/TOC × 100), the index of oxygen (OI = S3/TOC × 100), the production yield (PY = S1 + S2), and the production index (PI = S1/(S1 + S2).
The vitrinite reflectance (%Ro) was measured using Zeiss imager microscopy. Sample chips or sidewall core samples were cleaned to remove drilling mud or mud cake and then crushed using a mortar and pestle to a grain-size of less than 3 mm. These samples were mounted in cold-setting resin and polished “as received”, so that whole-rock samples were examined, excluding concentrates of organic matter. The core samples were mounted and sectioned perpendicularly to the bedding. Vitrinite reflectance measurements were made using immersion oil of refractive index 1.518 at 546 nm at 23 °C and at spinel and garnet standards of 0.42, 0.917, as well as 1.726% reflectance for calibration. Fluorescence-mode observations were made on all samples, providing supplementary evidence concerning organic matter type, exinite abundance, and maturity. For fluorescence-mode, a 3-mm BG-3 excitation filter was used with a TK400 dichroic mirror and a K490 barrier filter.
Geochemical information was plotted to visualize its distribution on profiles using free software PanPlot2 as described by Sieger and Grobe [32]. The 2D seismic lines in two-way time (TWT) used in this research were CV-1989–2200, CV-1989–1885, and CV-1959–1100; the interpretation of the lines was used for the purpose of defining the cutting relationships between lithological units present in the basin. Additionally, they had the geographic and stratigraphic positions of the wells used for this study.
One-dimensional modeling was carried out with the PetroMod software (2012 version) in order to reconstruct the burial history and thermal maturation of the geological units present in the wells. This modeling used the vitrinite thermal maturation model (EASY %Ro) proposed by Sweeney and Burnham [33], based on the Arrhenius first-order parallel-reaction approach with a distribution of activation energies. EASY %Ro were calibrated to a more rigorous model of vitrinite maturation based on the chemical properties of coal vitrinite. Previous studies such as Mesa and Rengifo [1] were also considered, which provided the deposition ages of each unit, and the maximum and minimum thicknesses of those units. The eroded thickness input for the modeling was inferred by the relation to the maximum thickness reported plus those found in the wells. The heat flow evolution was established by Petromod software using the Mackenzie method, and based on the sub-basin evolution proposed by Mesa and Rengifo [1]. Paleo-water depths were estimated with biostratigraphic studies (e.g., [34]). Sediment water interface temperatures (SWIT) were estimated using PetroMod software (e.g., [35]), which assumed that the current position of the study area is 11 degrees north latitude in the northernmost part of South America. To determine the evolution of the source rock units, the multiple kinetics were used; IES_TII_Toarcian_Shale_2C, IES_TIII_Tertiary_Coal_2C, and IES_TII_Brown_Limestone_2C, based on lithologies.

4. Results and Discussion

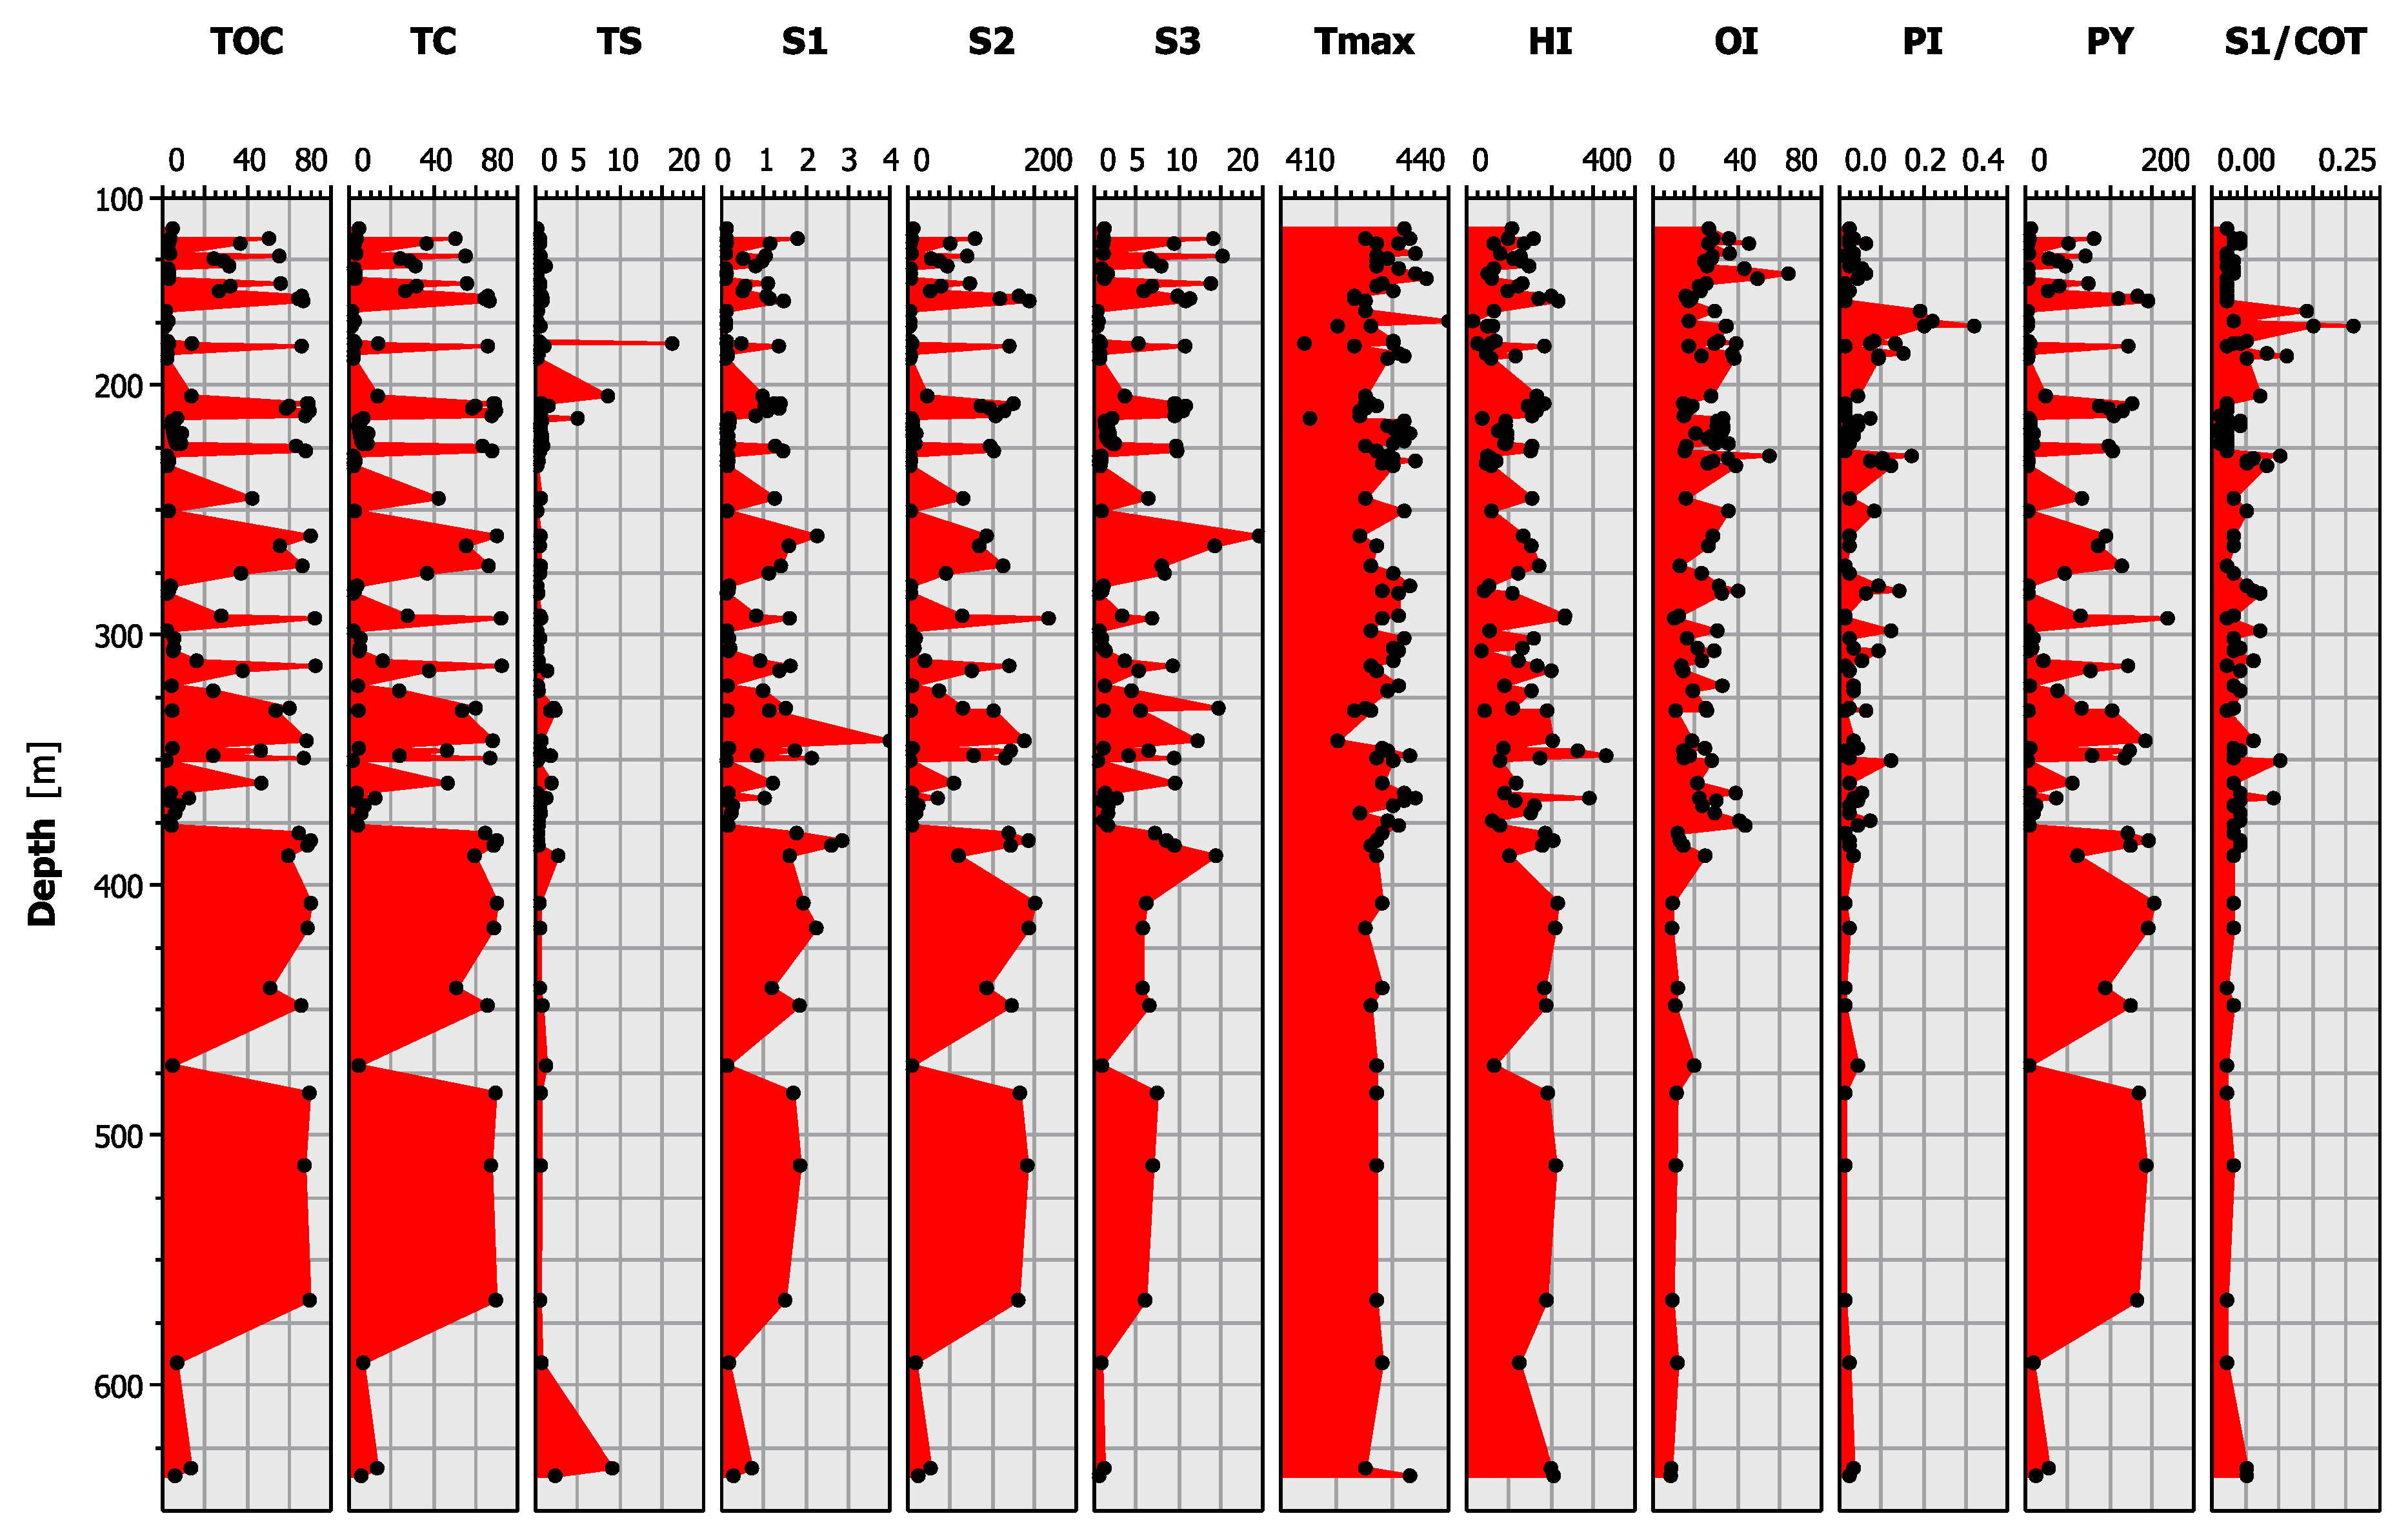
4.1. TOC and Rock Eval Pyrolysis Results

The values of the S1 peak indicated the volume of hydrocarbon generated before the pyrolysis. In this study, S1 values from the ANH-CARRETALITO-1 Well and ANH-CAÑABOBA-1 Well samples varied from 0.05 to 4 and from 0.05 to 1.36 mg HC/g rock, respectively. S2 values, indicating the amount of hydrocarbon generated during pyrolysis, showed variations from 0.13 to 166.96 and from 0.50 to 124.02 mg HC/g rock, respectively, and the S3 peak of the amount of carbon dioxide emission showed variations from 0.10 to 19.61 and from 0.32 to 17.93 mg CO2/g rock, respectively.
The accumulated thickness of coals in the Cerrejón Formation were: 63.94 m in the ANH-CARRETALITO-1 Well samples and 9.63 m in the ANH-CAÑABOBA-1 Well samples. The accumulated thicknesses of the mudstone were 291.19 and 107.60 m, respectively. The organic richness of the Cerrejón Formation ranged from poor to excellent, according to Lewan [36]. The Cerrejón Formation rocks (Paleocene age) showed variations in TOC from 0.3 to 72.5%, and from 0.74 to 65.46%, respectively.
The OI and HI were the most important parameters, of which the correlation indicated the kerogen type of source rocks. The OI value, as calculated, varied from 7.68 to 64.18 mg CO2/g TOC in the ANH-CARRETALITO-1 Well, and from 19.59 to 52.22 in ANH-CAÑABOBA-1 Well. The HI value, as calculated, varied from 10.53 to 330.64 and from 67.40 to 215.96 mg HC/g TOC, respectively.
Total sulfur (TS) is an important consideration in coal utilization. The TS obtained varied from 0.001 to 16.233% w/w of the coal in the ANH-CARRETALITO-1 Well samples (the last value being the only one higher than 10%), and from 0.29 to 0.37% w/w of the coal in ANH-CAÑABOBA-1 Well samples.
The PY was the total amount of hydrocarbon generated/liberated under the pyrolysis S1 and S2 curves [37]. This index helped to categorize the target horizon in terms of total petroleum-generation potential [38]. The PY values, as calculated, varied from 0.2 to 168.6 mg HC/g rock and from 0.6 to 124.9 mg HC/g rock in the ANH-CARRETALITO-1 and ANH-CAÑABOBA-1 wells, respectively.
The PI value was taken from a ratio between S1 and S2, which indicated the relationship between the amounts of free hydrocarbon before pyrolysis with respect to the amount of hydrocarbon generated during pyrolysis, similar to Rock–Eval and Tmax. PI was used as a maturity proxy [38]. The PI values, calculated in ANH-CARRETALITO-1 Well, varied from 0.01 to 0.32 TOC. Only 13 data were higher than 0.1 and had an average of 1.1% TOC, indicating that the value could have been affected; while in the ANH-CAÑABOBA-1 Well, the calculated values ranged from 0.01 to 0.09 TOC. According to Peters [39], source rocks with PI values of less than 0.1 are considered thermally immature, while those from 0.1 to 0.4 are considered thermally mature. According to Nuñez and Baceta [40], there is no depletion in the values of these two pyrolysis peaks since the samples were taken from the core and had not been exposed to weathering.
The Tmax values correspond to the maximum hydrocarbon generation point during the pyrolysis (S2), which is widely used as a thermal maturity indicator [38]. According to Peters and Cassa [41], any value of Tmax that is less than 435 °C is considered thermally immature. The Tmax values obtained ranged from 414 to 440 °C in the ANH-CARRETALITO-1 Well, with only two samples higher than 435 °C (Figure 4). Likewise, in the ANH-CAÑABOBA-1 Well, the values ranged from 414 to 433 °C (Figure 5). Thus, it can be concluded that the data showed the Cerrejón Formation in the wells is thermally immature, bordering on the limit of 435 °C.
Finally, %Ro analysis functioned as an indicator of level of organic maturity (LOM). Jarvie and Pollastro [42] provided the thermal maturity-profiling states: Immature, oil-window mature, condensate wet-gas mature, dry-gas mature shales, with %Ro values of <0.55, 0.55–1.15, 1.15–1.40, and >1.40, respectively. The average of %Ro values were from 0.45 to 0.57 in the ANH-CARRETALITO-1 Well, with a mean of 33.55 measurements per analysis (Figure 6), and from 0.37 to 0.43 in the ANH-CAÑABOBA-1 Well, with a mean of 40.32 measurements per analysis (Figure 7). Vitrinite reflectance could also be plotted with Tmax to identify the state of thermal maturity for the organic matter [43]. The data correlation of the average %Ro versus Tmax is presented in Figure 8 to show the change in thermal maturity of the Cerrejón Formation in the ANH-CARRETALITO-1 and ANH-CAÑABOBA-1 wells.

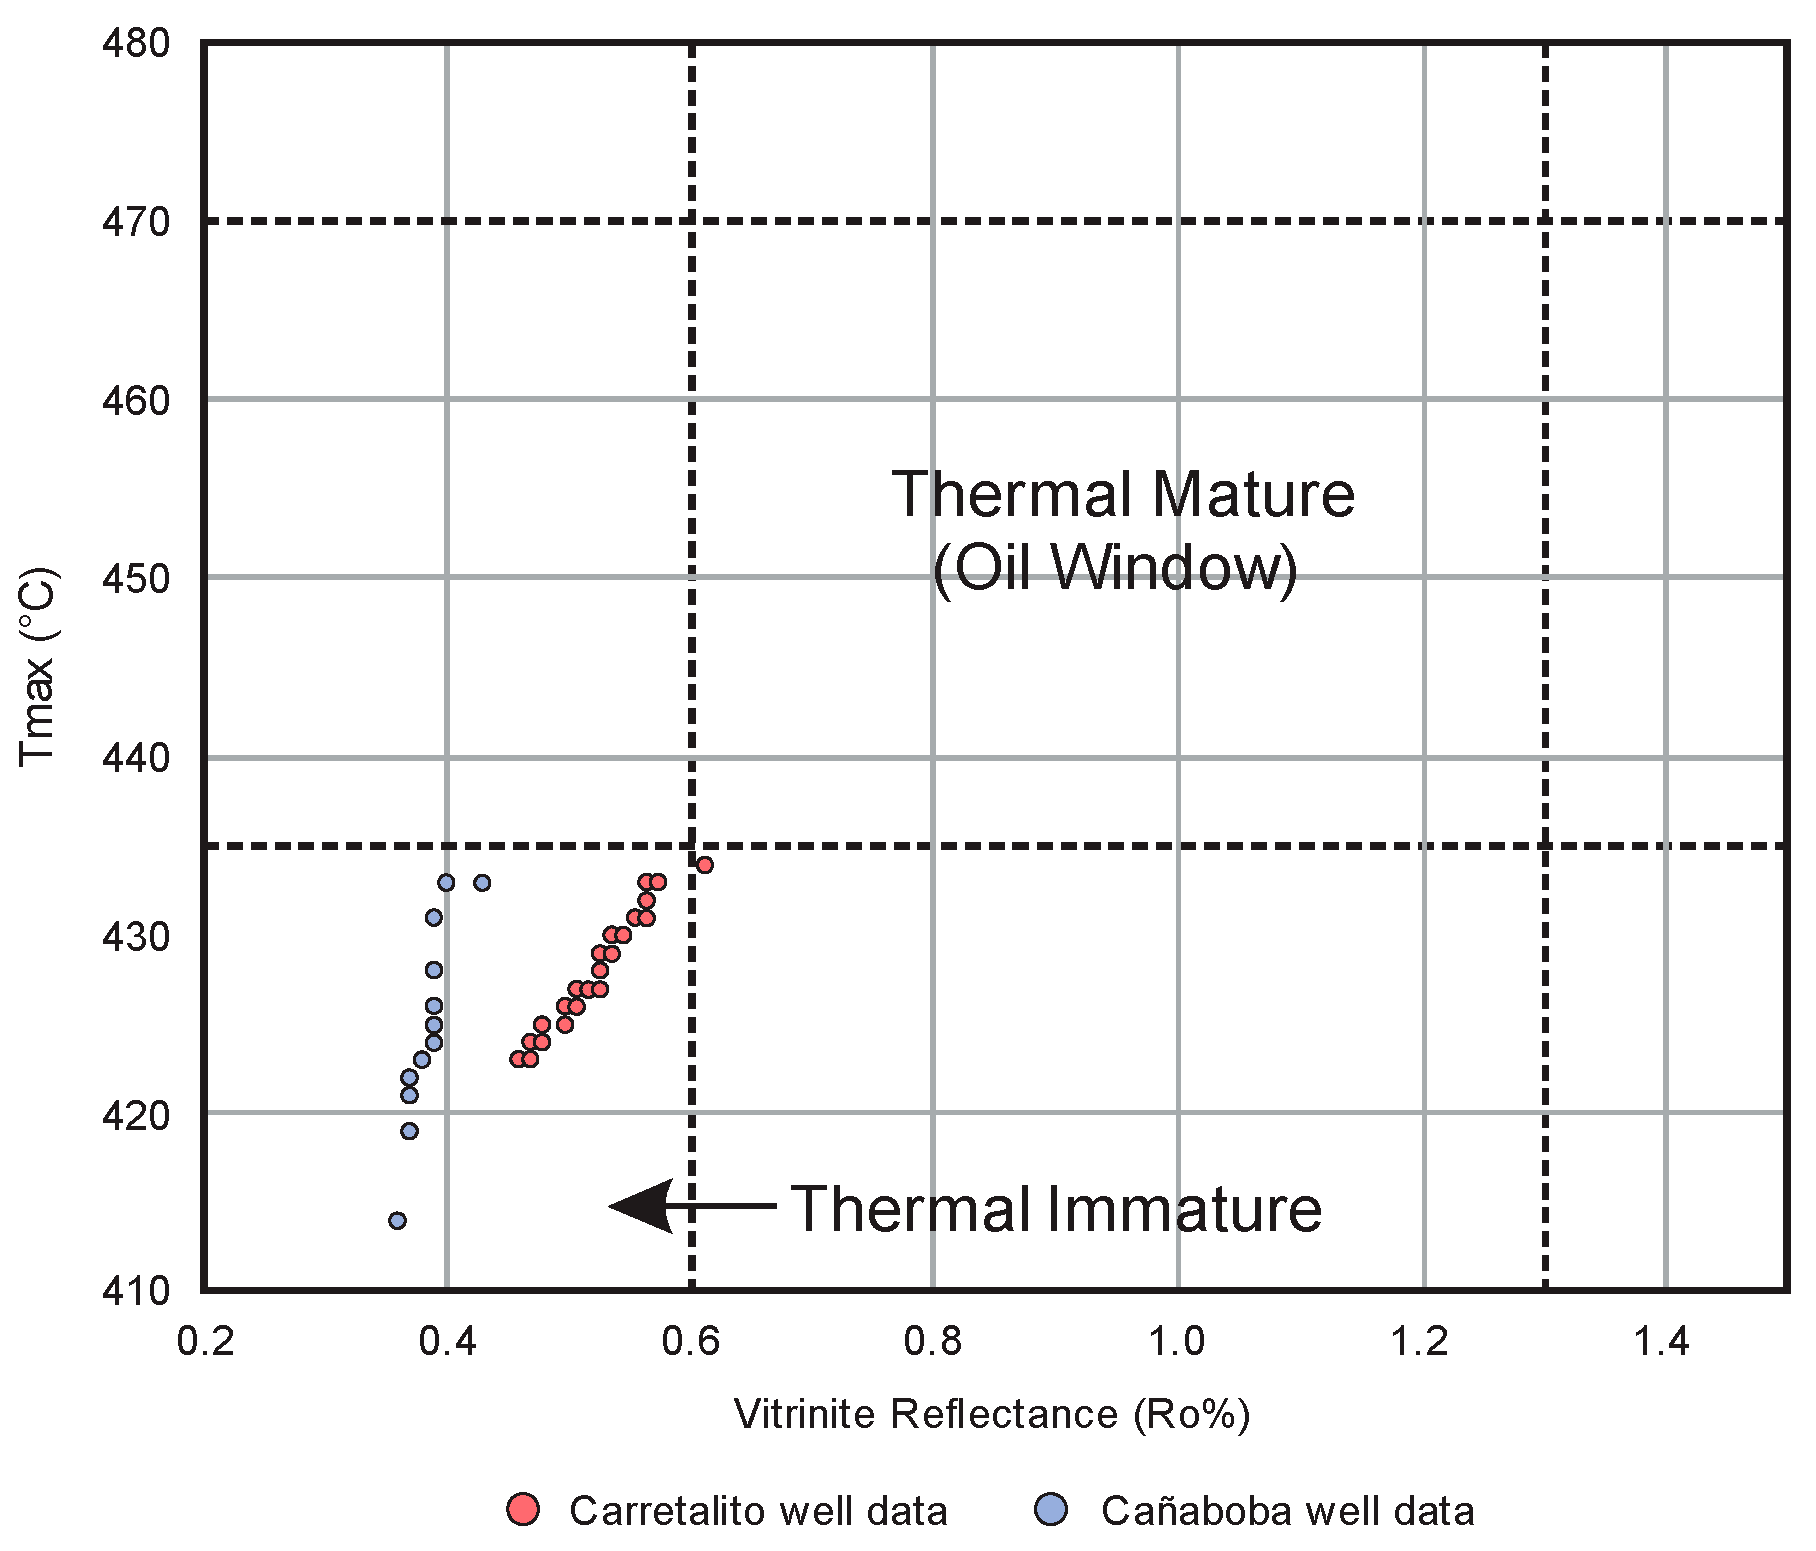
4.2. Quality of Organic Matter

The cross plot of S1 versus TOC (Figure 9) was used to evaluate the origin of the hydrocarbons in the Cerrejón Formation at the Ranchería Sub-Basin, using samples of the ANH-CARRETALITO-1 and ANH-CAÑABOBA-1 wells, based on the methodology of Fakhri et al. [44]. It was established that the Cerrejón Formation was not contaminated with migrated hydrocarbon. The hydrocarbon generation potential was proven using the cross plot of PY versus TOC (Figure 10), based on the proposition by Ghori and Haines [45]. It concludes that the coals of this formation had excellent potential, while the mudstones had a wide spectrum of potential that ranged from poor to excellent.
The diagram of S2 versus TOC proposed by Langford and Blanc [46] was used to classify the type of organic matter (Figure 11). It was established that the hydrocarbons of the Cerrejón Formation were mainly the type III kerogen, which is conducive to gas generation. However, they were present in small quantities, showing that this formation also contained type II/III kerogen, which can produce a mixture of oil and gas.
To assess the maturity and kerogen type, the obtained data were plotted on an HI versus Tmax diagram (e.g., [41,47,48]) (Figure 12). This concluded that the Cerrejón Formation in the central area of the Ranchería Sub-Basin has not reached the oil generation window, but it would have the capacity to generate mainly gas-type hydrocarbons due to its organic matter type III kerogen. Additionally, it may also have the capacity to generate oil-type hydrocarbons to a lesser quantity due to its organic matter type II/III kerogen.
The organic matter values from the mudstones and the coals were fairly high. They did not present an HI higher than 300, and the characterization of the kerogen was mainly type III, which is closely related to terrestrial plant remains, with average TS values for coals of 0.60% in the ANH-CARRETALITO-1 Well and 1.11% in ANH-CAÑABOBA-1 Well. These findings correlate with the paleontological findings of [14,16,49], and with the analysis of organic geochemistry carried out in the Cerrejón Formation at the Cerrejón Mine, similar to Piñeres et al. [23], which presents a distribution of 77.3% vitrinite, 15.7% inertinite, and 6.9% liptinite on average for the different sizes of particles percentages, using a petrographic analysis free of mineral material. This study concurs with those by Layton [27], giving the distribution as 80% vitrinite, 12.5% inertinite, 7.5% liptinite for the WRV-04752 Well, and 77% vitrinite for the WRV-04774 Well, as well as 15% inertinite and 8% liptinite.
The diagram cross plot of Tmax (°C) with respect to the PI proposed by Katz [3] was used to assess the maturation condition of the Cerrejón Formation (Figure 13). It can be seen that the mudstone and coal samples occupy the immature area, which reinforce the immaturity of the rocks of the basin; a condition also found when comparing Tmax versus %Ro. Three examples of mudstone did not fall in the immaturity area, one of them was in the area of inert coal, the other in the area of indigenous hydrocarbon generation, and the last one in the migrated hydrocarbon field. These three data were inconclusive and corresponded to samples with low TOC values.
Tmax data versus depth (Figure 14) as done by Peters and Cassa [41], showed that there was no repetition of the sedimentary sequences in the wells and that there was no presence of displacement due to geological faults; a situation confirmed with the information obtained from the seismic interpretation, as well as from the drilling report.
Based on the data, the Cerrejón formation is immature in the central zone of the Ranchería Sub-Basin. However, as determined by organic petrography [50], the thermal maturation of the coals and shales of the Cerrejón Formation in the Cerrejón Mine established that the Cerrejón Formation is in the oil generation window. Arango and Blandon [51] also established that the appearance of different forms of inertinite present in these coals may be due to hydrocarbon expulsion processes at moderate pressures and temperatures. This information coincides with the study carried out by Martinez [52], which determined by chromatography the existence of gases such as methane, hexane, and heptane, associated with coal mantles in the Cerrejón mine area.

4.3. Geochemical Modeling

A one-dimensional model of burial history was performed in the location of the ANH-CARRETALITO-1 and ANH-CAÑABOBA-1 wells, using the information obtained from the interpretation of the seismic lines in time, the boundary conditions heat flow, the paleo-water depth, the SWIT (Figure 15), and the bottom hole temperature (BHT) of the wells (Figure 16, right side). The heat flow, considering the sin-rift stage and the post-rift stage in this sub-basin, was established from 200 to 116 mya and from 116 to 20 mya, respectively. The paleo-water depth used for the simulation was proposed by [34], 50 m from 126 to 103 mya, subsequently, increasing to 200 m in 92 mya and gradually decreasing to 100 m in 79 mya, then 15 m in 70 mya, and, finally, 0 m to the present.
The model of burial history (Figure 16), with overlapping values and the different hydrocarbon generation windows were colored as proposed by Sweeney and Burnham [33]. The current temperature model was calibrated with BHT. Likewise, it was possible to calibrate the model of EASY %Ro with paleo-geothermometer data (%Ro) from samples from the Cerrejón Formation (Figure 17).
The resulting model predicts that the Upper Cretaceous formations, Molino and La Luna, entered in the early oil window at the Late Paleocene, before the Middle Eocene uplift event. Likewise, the Lower Cretaceous formations would be in the main oil window since the Late Paleocene; after this time, it is expected that its thermal maturation did not progress any further, and the Cerrejón Formation is immature in both wells. The higher maturation levels might have reached for the other source rock of Cretaceous formations in the ANH-CARRETALITO-1 Well.
The thermal stress can be measured by taking into account the Tmax and %Ro values, which is necessary to evaluate the amount of organic matter that has been transformed into hydrocarbon [53]. This is the reason for the variation in the transformation rates (TR) in Figure 18. As a result, TR was not expected in the study area for Cenozoic formations. The TR estimated for the Cretaceous Lagunitas, Aguas Blancas, La Luna, and Molino formations in the ANH-CARRETALITO-1 Well had values of 90, 85, 67, and 29%, respectively. The TR expected for the Cretaceous Lagunitas, Aguas Blancas, La Luna, and Molino formations in the ANH-CAÑABOBA-1 Well did not seem to be of greater importance, as evidenced in Figure 18B. The TR occurred mainly in the Paleocene and Early Eocene, with values of 70, 45, 26, and 8%, respectively. It should be noted that the Cretaceous units reached their maximum TR value in the Middle Eocene. However, only in the ANH-CARRETALITO-1 Well did the Lower Cretaceous formations have a greater advance in their TR at the end of the Paleocene, while the Upper Cretaceous units had almost all their increase in their TR during the Eocene. This establishes two pulses of hydrocarbon generation in the Paleocene and the Eocene, respectively.
This shows that the Cerrejón Formation in the study area is not in the oil window. A trend of higher levels of thermal maturation towards the north of the Ranchería Sub-Basin is expected, as corroborated by Sanchez and Mann [6], who proposed that in general the thermal maturation of the generating units is increasing towards the northeast of the sub-basin. This is caused by the increase in sedimentary coverage and does not coincide with the study by Martinez et al. [7], which suggested that there are thermal maturation bands generated by the uplift of PR. These bands are oriented in parallel to the reverse fault trace of Cerrejón-Villanueva, where the displacement of the PR developed, whereas the areas of greater maturation are those close to the PR.

5. Conclusions

  • The mudstones of the Cerrejón Formation showed 10.68% TOC value on average, which indicated the presence of organic matter consisting of mixed type II/III kerogen. It supported a good source rock potential to produce oil/gas type hydrocarbons.
  • The coals of the Cerrejón Formation presented ~64% TOC value and the presence of organic matter consisting of mixed type III kerogen. Evidence of excellent gas-generating hydrocarbon were indicated in the intervals.
  • The Cerrejón Formation in the central area of the Ranchería Sub-Basin is in the immature stage, but close to the oil window.
  • The high values of Tmax and %Ro obtained in the rocks of the Cerrejón Formation revealed a possible great tectonic event in the Middle Eocene as the cause of the highest loss of the stratigraphic record in the Ranchería Sub-Basin.
  • Based on the burial history diagrams calibrated with %Ro data, the loss of sedimentary coverage in the Middle Eocene was estimated as 2600 m in the ANH-CARRETALITO-1 Well and 500 m in the ANH-CAÑABOBA-1 Well.
  • Two peaks of increase in the organic matter transformation were recognized in the Paleocene and Middle Eocene intervals. They showed distinct characteristics in hydrocarbon generation and migration patterns. This corresponded better to the northern part of the sub-basin.

Supplementary Materials

The following are available online at https://www.mdpi.com/2076-3263/10/7/258/s1, Table S1: ANH-Carretalito-1 Well, Rock Eval pyrolysis data. Table S2: ANH-Cañaboba-1 Well, Rock Eval pyrolysis data. Table S3: ANH-Carretalito-1 Well, vitrinite reflectance data. Table S4: ANH-Cañaboba-1 Well, vitrinite reflectance data.

Author Contributions

Conceptualization, L.F.C.-C., M.G.-G., L.E.C.-G., G.M.A.-S.; investigation, L.F.C.-C., G.M.A.-S.; writing—original draft preparation, L.F.C.-C., G.M.A.-S.; writing—review and editing, L.F.C.-C., M.G.-G., L.E.C.-G., G.M.A.-S.; visualization, L.F.C.-C.; supervision, M.G.-G., L.E.C.-G. All authors have read and agreed to the published version of the manuscript.

Funding

We would like to thank the Agencia Nacional de Hidrocarburos (ANH) for financing the project entitled: “Thermal and geochemical modeling under subsidence and thrust of the Perijá Range, Ranchería Sub-Basin, Colombia, South America” (project carried out under the contract No FP44842-454-2017). The Universidad Industrial de Santander (UIS) provided lab and computing facilities.

Acknowledgments

Special thanks to the Agencia Nacional de Hidrocarburos (ANH), and the Departamento Administrativo de Ciencia, Tecnología e Innovación (COLCIENCIAS), which allowed access to the information published in this article. The geochemical analysis was performed by personnel of the Laboratorio de Geología del Petróleo (LGP) at the headquarters of Guatiguará-UIS. Thanks to the style-writer corrector, German Morales. We thank the anonymous reviewers for their valuable contributions, allowing the document to improve substantially.

Conflicts of Interest

The authors declare no conflict of interest.

References

  1. Mesa, A.M.; Rengifo, S. Cesar-Ranchería Basin. Medellín, Colombia: ANH-University EAFIT. Dep. Geol. 2011, 6, 157. [Google Scholar]
  2. Aguilera, R.; Sotelo, V.; Burgos, C.; Arce, C.; Gómez, C.; Mojica, J.; Osorno, J. Organic Geochemistry Atlas of Colombia. Second Edition. Earth Sci. Res. J. 2010, 14, 164. Available online: https://www.anh.gov.co/Informacion-Geologica-y-Geofisica/Estudios-Integrados-yModelamientos/ATLAS_GEOQUIMICO/Atlas_Geoquimico_2010.pdf (accessed on 17 April 2019).
  3. Katz, B.J. The Green River Shale: An Eocene Carbonate Lacustrine Source Rock. In Petroleum Source Rocks; Katz, B.J., Ed.; Springer: Berlin/Heidelberg, Germany, 1995. [Google Scholar]
  4. ANH- GEMS. Caracterización geológica y geoquímica de las doce zonas carboníferas de Colombia con base en información existente y con adquisición de nuevos datos geoquímicos de los carbones colombianos para el diseño de áreas de exploración de CBM en Colombia. Contrato 2012, 304, 443. [Google Scholar]
  5. Patiño, M.A.; Parra, M.; Ramirez, J.C.; Sobel, E.R.; Glodny, A.A.; Echeverri, S. Thermochronological constraints on Cenozoic exhumation along the southern Caribbean: The Santa Marta range, northern Colombia. Andean Tecton. 2019, 103–132. [Google Scholar] [CrossRef]
  6. Sánchez, J.; Mann, P. Integrated Structural and Basinal Analysis of the Cesar–Rancheria Basin, Colombia: Implications for its Tectonic History and Petroleum Systems. In Petroleum geology and potential of the Colombian Caribbean Margin: AAPG Memoir; Bartolini, C., Mann, P., Eds.; AAPG: Tulsa, OK, USA, 2015; Volume 108, pp. 431–470. [Google Scholar]
  7. Martínez de Vivas, M.; Calderón, W.; Zamora, W.; Rodríguez, I.; López, E. Modelamientos Numéricos 3D de Sistemas Petrolíferos en la Cuenca Cesar – Ranchería: Nuevas Ideas Acerca de su Potencial Petrolífero. Proceeding of the Abstracts of the 11th Simposio Bolivariano - Exploración Petrolera en las Cuencas Subandinas, Cartagena, Colombia, 29 July 2012; p. 9. [Google Scholar]
  8. Barrero, D.; Pardo, A.; Vargas, C.A.; Martínez, J. Colombian Sedimentary Basins: Nomenclature, Boundaries and Petroleum Geology, a New Proposal; ANH: Bogotá, Colombia, 2007. [Google Scholar]
  9. Bayona, G.; Jaramillo, C.; Rueda, M.; Pardo, A.; Christie, A.; Hernández, G. Important Paleotectonics and chronostratigraphic considerations of the Late Paleocene in the northernmost Andes as constrained by Paleocene rocks in the Cerrejón coal mine, Guajira, Colombia; ACGGP: Bogotá, Colombia, 2004; p. 14. [Google Scholar]
  10. Bayona, G.; Lamus-Ochoa, F.; Cardona, A.; Jaramillo, C.; Montes, C.; Tchegliavoka, N. Procesos Orogénicos del Paleoceno para la Cuenca de Ranchería (Guajira, Colombia) y áreas Adyacentes definidos por Análisis de Proveniencia; Geología Colombiana: Bogotá, Colombia, 2007; Volume 32, pp. 21–46. [Google Scholar]
  11. Morón, S.; Montes, C.; Jaramillo, C.; Bayona, G.; Sánchez, C. Ciclicidad En La Formación Cerrejón. XI Congreso Colombiano de Geología. Boletín Geol. 2007, 29, 21–30. [Google Scholar]
  12. Instituto Colombiano de Geología y Minería (INGEOMINAS). El Carbón Colombiano: Recursos, Reservas y Calidad; República de Colombia, Ministerio de Minas y Energía: Bogotá, Colombia, 2004. [Google Scholar]
  13. Ayala, R. Análisis Tectonoestratigráfico y de Procedencia en la Subcuenca de Cesar: Relación con los Sistemas Petroleros (Trabajo de Grado MSc); Universidad Simón Bolívar: Caracas, Venezuela, 2009; p. 183. [Google Scholar]
  14. Herrera, F. Paleotemperatura y paleoprecipitación del paleoceno superior en zonas tropicales usando plantas mega-fósiles de la Formación Cerrejón, Mina de carbón El Cerrejón, Guajira. Bachelor’s Thesis, Escuela de Geología, Universidad Industrial de Santander, Bucaramanga, Colombia, 2004; p. 50. [Google Scholar]
  15. Doria, G.; Jaramillo, C.A.; Herrera, F. Menispermaceae from the Cerrejón Formation, Middle to Late Paleocene, Colombia. Am. J. Bot. 2008, 95, 954–973. [Google Scholar] [CrossRef] [Green Version]
  16. Head, J.; Bloch, J.; Hasting, A.; Bourque, J.; Cadena, E.; Herrera, F.; Polly, P.D.; Jaramillo, C. Giant Boine Snake from A Palaeocene Neotropical Rainforest Indicates Hotter Past Equatorial Temperatures. Nature 2009, 457, 715–718. [Google Scholar] [CrossRef]
  17. Wilf, P.; Wing, S.L.; Greenwood, D.R.; Greenwood, C.L. Using fossil leaves as paleoprecipitation indicators: An Eocene example. Geology 1998, 26, 203–206. [Google Scholar] [CrossRef] [Green Version]
  18. Mann, P.; Escalona, A.; Castillo, M.V. Regional geologic and tectonic setting of the Maracaibo supergiant basin, western Venezuela. Bull. Am. Assoc. Pet. Geol. 2006, 90, 443–444. [Google Scholar] [CrossRef]
  19. Hernández, O.; Jaramillo, J.M. Reconstrucción de la Historia Termal en los Sectores de Luruaco y Cerro Cansona-cuenca del Sinú-San Jacinto y el Piedemonte Occidental de la Serranía del Perijá entre Codazzi y la Jagua de Ibirico-cuenca Cesar-Ranchería; Agencia Nacional de Hidrocarburos: Bogotá, Colombia, 2009; p. 58. [Google Scholar]
  20. Bermudez, M.A. Cenozoic exhumation patterns across the Venezuelan Andes: Insights from fission-track thermochronology. Ph.D. Thesis, School of Geosciences, Université Joseph Fourier-Grenoble I, Grenoble, France, 2009. Available online: https://tel.archives-ouvertes.fr/tel-00450838 (accessed on 17 April 2019).
  21. Villagómez, D.; Spikings, R.; Mora, A.; Guzmán, G.; Ojeda, G.; Cortés, E.; van der Lelij, R. Vertical tectonics at a continental crust-oceanic plateau plateboundary zone: Fission track thermochronology of the Sierra Nevada de Santa Marta, Colombia. Tectonics 2020, 30, TC4004. [Google Scholar] [CrossRef]
  22. Proyecto de Carbón El Cerrejón; Departamento Nacional de Planeación: Bogotá, Colombia, 1976; pp. 1–49.
  23. Piñeres-Mendoza, J.; Barraza, J.; Blandón, A. Constantes cinéticas de flotación del grupo maceral vitrinita de dos carbones colombianos. Flotation kinetic constants of two Colombian coals’ vitrinite maceral. Rev. Ing. Investig. 2009, 29, 29–35. [Google Scholar]
  24. ASTM D388-15 (2015). Standard Classification of Coals by Rank; ASTM International: West Conshohocken, PA, USA, 2015; Available online: www.astm.org (accessed on 17 April 2019).
  25. Rincón, M.A.; Gómez, H.; Monroy, W. El Carbón: Muestreo, análisis y clasificación de recursos y reservas (Segunda). 2010. Available online: https://www2.sgc.gov.co/Publicaciones/Cientificas/NoSeriadas/Documents/El-carbon-Colombiano-muestreo-analisis.PDF (accessed on 17 April 2019).
  26. Henao-Restrepo, J. Identificación de elementos de tierras raras en carbones colombianos. Master’s Thesis, Departamento de Materiales y Minerales, Universidad Nacional de Colombia, Bogotá, Colombia, 2019. [Google Scholar]
  27. Layton, R. Petrografía y Geoquímica Orgánica y su aplicación en la Estratigrafía de secuencias en la Formación Cerrejón, Guajira. Bachelor’s Thesis, Escuela de Geología, Universidad Industrial de Santander, Bucaramanga, Colombia, 2006. [Google Scholar]
  28. García, M.; Mier, R.; Arias, A.; Cortés, Y.; Moreno, M.; Salazar, O.; Jiménez, M. Prospectividad de la Cuenca Cesar-Ranchería. Grupo de Investigación en Geología de Hidrocarburos y Carbones; Universidad Industrial de Santander (UIS): Bucaramanga, Colombia, 2008; Available online: http://oilproduction.net/files/cuencas%20petroleras%20de%20colombia-2009.pdf (accessed on 17 April 2019).
  29. Mora, C.; Parra, P.; Navas, G. Caracterización Geoquímica de rocas y crudos en las cuencas de Cesar -Ranchería, Sinú-San Jacinto, Chocó y área de Soapaga. (Cuenca Cordillera Oriental) Informe Final; Agencia Nacional De Hidrocarburos-ANH: Bogotá, Colombia, 2007; p. 407. [Google Scholar]
  30. Barker, C. Pyrolysis Techniques for source-Rock Evaluation. AAPG Bull. 1974, 58, 2349–2361. [Google Scholar] [CrossRef]
  31. Behar, F.; Beaumont, V.; De Penteado, B. Rock-Eval 6 Technology: Performances and Developments. Oil Gas Sci. Technol. 2001, 56, 111–134. [Google Scholar] [CrossRef]
  32. Sieger, R.; Grobe, H. PanPlot 2 - Software to Visualize Profiles and Time Series; Alfred Wegener Institute, Helmholtz Centre for Polar and Marine Research: Bremerhaven, Germany, 2013. [Google Scholar] [CrossRef]
  33. Sweeney, J.J.; Burnham, A.K. Evaluation of a Simple Model of Vitrinite Reflectance Based on Chemical Kinetics. Am. Assoc. Pet. Geol. Bull. 1990, 74, 1559–1570. Available online: https://www.osti.gov/biblio/5681562-evaluation-simple-model-vitrinite-reflectance-based-chemical-kinetics (accessed on 17 April 2019).
  34. Patarroyo, G.D.; Torres, G.A.; Rincón, D.A. Bioestratigrafía e Inferencias de Foraminíferos en las Formaciones Cretácicas La Luna-Colón (Cuenca del Catatumbo, Colombia). Boletín Geol. 2017, 39. [Google Scholar] [CrossRef]
  35. Wygrala, B.P. Integrated study of an oil field in the southern Po basin, Northern Italy. Ber. Kernforsch. Jülich 1989, 2313, 1–217. Available online: http://juser.fz-juelich.de/record/153416/files/FZJ-2014-03033.pdf (accessed on 17 April 2019).
  36. Lewan, M.D. Gas: Oil Ratios for Source Rocks Containing Type-I, II, IIS, and III Kerogens as Determined by Hydrous Pyrolysis; U.S. Geological Survey: Denver, CO, USA, 1996; pp. 99–327. [Google Scholar]
  37. Ghori, K.A.R. Petroleum Generation Potential and Thermal History of the Palaeozoic, Carnarvon Basin, Western Australia. In The Sedimentary Basins of Western Australia 2: Proceedings of the Petroleum Exploration Society of Australia; Purcell, P.G., Purcell, R.R., Eds.; Petroleum Exploration Society of Australia: Perth, Australia, 1998; pp. 553–568. [Google Scholar]
  38. Hazra, B.; Wood, D.A.; Mani, D.; Singh, P.K.; Singh, A.K. Evaluation of Shale Source Rocks and Reservoirs; Springer: Berlin/Heidelberg, Germany, 2019; p. 139. [Google Scholar]
  39. Peters, K.E. Guidelines for evaluating petroleum source rock using programmed pyrolysis. AAPG Bull. 1986, 70, 318–329. [Google Scholar]
  40. Nuñez-Betelu, L.; Baceta, J.I. Basics and Application of Rock-Eval/TOC Pyrolysis: An example from the uppermost Paleocene/lowermost Eocene in the Basque Basin, Western Pyrenees, Munibe. Cienc. Nat. 1994, 46, 43–62. [Google Scholar]
  41. Peters, K.E.; Cassa, M.R. Applied source rock geochemistry. In The Petroleum System -From Source to Trap; Magoon, L.B., Dow, W.G., Eds.; The American Association of Petroleum Geologists Memoir: Tulsa, OK, USA, 1994; Volume 60, pp. 93–120. [Google Scholar]
  42. Jarvie, D.M.; Hill, R.J.; Pollastro, R.M. Assessment of the gas potential and yields from shales: The Barnett Shale model. In Proceedings of the Unconventional Energy Resources in the Southern Midcontinent, 2004 Symposium; Cardott, B.J., Ed.; Oklahoma Geological Survey Circula: Norman, OK, USA, 2005; Volume 110, pp. 37–50. [Google Scholar]
  43. Osli, L.N.; Shalaby, M.R.; Islam, A. Hydrocarbon generation modeling and source rock characterization of the Cretaceous–Paleocene Taratu Formation, Great South Basin, New Zealand. J. Pet. Explor. Prod. Technol. 2018. [Google Scholar] [CrossRef] [Green Version]
  44. Fakhri, M.; Tabatabei, H.; Amiri, A. Comparing the potential of hydrocarbon generation of Kazhdomi and Pabdeh formations in Bangestan Anticline (Zagros Basin) according to Rock-Eval pyrolysis data. J. Earth Sci. Clim. Chang. 2013, 4, 157. [Google Scholar] [CrossRef]
  45. Ghori, K.A.R.; Haines, P.W. Paleozoic Petroleum Systems of the Canning Basin, Western Australia: A review. Search Discov. Artic. 2007, 10120, 5–8. [Google Scholar]
  46. Langford, F.F.; Blanc-Valleron, M. Interpreting rock-Eval pyrolysis data using graphs of pyrolyzable hydrocarbons vs. total organic carbon. AAPG Bull. 1990, 74, 799–804. [Google Scholar]
  47. Koeverden, J.H.; Karlsen, D.A.; Backer-Owe, K. Carboniferous non-marine source rocks from Spitsbergen and Bjørnøya: Comparison with the Western Arctic. J. Pet. Geol. 2011, 34, 53–66. [Google Scholar] [CrossRef]
  48. Farhaduzzaman, M.; Wan Hasiah, A.; Islam, M.A. Hydrocarbon source potential and depositional environment of the Surma Group shales of Bengal Basin, Bangladesh. J. Geol. Soc. India 2012, 83, 433–446. [Google Scholar] [CrossRef]
  49. Espitalié, J. Use of Tmax as a maturation index for different types of organic matter. Comparison with vitrinite reflectance. In Thermal Modelling in Sedimentary Basins; Burrus, J., Ed.; Editions Technip: Paris, France, 1986; pp. 475–496. [Google Scholar]
  50. Arango, F.; Blandón, A. Organic Petrology and Organic Geochemistry of Tertiary Coals in the Cesar-Rancheria Basin, Northern Colombia: Implications on Hydrocarbon Generation. In Proceedings of the Abstracts of the 23th Annual Meeting of the Society for Organic Petrology, Beijing, China, 15–22 September 2006. [Google Scholar]
  51. Arango, F.; Blandón, A. Carbones y Lutitas Carbonosas como rocas Fuentes de Hidrocarburos Terciarios en la Cuenca Cesar-Ranchería Colombia: Evidencias Petrológicas y Geoquímicas; IX Simposio Bolivariano de Cuencas Subandinas: Cartagena, Colombia, 2006. [Google Scholar]
  52. Martínez, Y. Determinación de la Composición de los Gases Asociados a Mantos de Carbón en las Áreas de Ubaté y el Cerrejón por medio de Cromatografía de Gases. Bachelor’s Thesis, Escuela de Química, Universidad Industrial de Santander, Bucaramanga, Colombia, 2009. [Google Scholar]
  53. Pepper, A.S.; Corvi, P.J. Simple kinetic models of petroleum formation 1. Oil Gas Gener. Kerogen Mar. Pet. Geol. 1995, 12, 291–319. [Google Scholar] [CrossRef]
Figure 1. (A) Map with the location of the Ranchería Basin, Colombia (yellow area). Locations of the Ranchería Sub-Basin (red bold lines), studied wells ANH-CARRETALITO-1 and ANH-CAÑABOBA-1 (red dots), and seismic lines (bold blue lines) are present, with the major fault system and the Cerrejón mining activity area. (B) The generalized stratigraphic column of the Ranchería Sub-Basin is taken from Mesa and Rengifo [1].
Geosciences 10 00258 g001
Figure 2. Interpreted 2D seismic lines in two-way time (TWT) with location of ANH-CARRETALITO-1 and ANH-CAÑABOBA-1 wells. Seismic lines (A) CV-1989–2200; (B) CV-1989–1885; and (C) CV-1959–1100. Line locations are shown in Figure 1A.
Geosciences 10 00258 g002
Figure 3. Lithologies, sample site (+), and variation of sulfur content and total organic carbon (TOC) of the rock samples of the Cerrejón Formation in the ANH-CARRETALITO-1 and ANH-CAÑABOBA-1 wells.
Geosciences 10 00258 g003
Figure 4. Results of the geochemical analyzes. Total organic carbon (TOC), total carbon (TC), total sulfur (TS), and Rock–Eval pyrolysis of the Cerrejón Formation rocks in the ANH-CARRETALITO-1 Well, see Supplementary Materials Table S1.
Geosciences 10 00258 g004
Figure 5. Results of geochemical analyses. Total organic carbon (TOC), total carbon (TC), total sulfur (TS), and Rock–Eval pyrolysis of the Cerrejón Formation rocks in the ANH-CAÑABOBA-1 Well, see Supplementary Materials Table S2.
Geosciences 10 00258 g005
Figure 6. Graphic distribution of vitrinite reflectance analysis (%Ro), total organic carbon (TOC), total sulfur (TS), and hydrogen index (HI) of the Cerrejón Formation in the ANH-CARRETALITO-1 Well, see Supplementary Materials Table S3.
Geosciences 10 00258 g006
Figure 7. Graphic distribution of vitrinite reflectance analysis (%Ro), total organic carbon (TOC), total sulfur (TS), and hydrogen index (HI) of the Cerrejón Formation in the ANH-CAÑABOBA-1 Well, see Supplementary Materials Table S4.
Geosciences 10 00258 g007
Figure 8. Data correlation of maximum pyrolysis temperature (Tmax) versus vitrinite reflectance (%Ro) average to indicate source rock thermal maturity in the Cerrejón Formation of the ANH-CARRETALITO-1 and ANH-CAÑABOBA-1 wells.
Geosciences 10 00258 g008
Figure 9. Cross plot of S1 versus TOC to indicate the origin of hydrocarbon in the Cerrejón Formation of the (A) ANH-CARRETALITO-1 and (B) ANH-CAÑABOBA-1 wells.
Geosciences 10 00258 g009
Figure 10. Cross plot of production yield versus TOC to exhibit the generating potential of the Cerrejón Formation in the (A) ANH-CARRETALITO-1 and (B) ANH-CAÑABOBA-1 wells.
Geosciences 10 00258 g010
Figure 11. Cross plot of S2 versus total organic carbon (TOC) to exhibit the generating potential of the Cerrejón Formation in the (A) ANH-CARRETALITO-1 and (B) ANH-CAÑABOBA-1 wells.
Geosciences 10 00258 g011
Figure 12. Cross plot between hydrogen index (HI) (mgHC/g TOC) versus maximum pyrolysis temperature (Tmax) to indicate source rock maturity in the Cerrejón Formation of the (A) ANH-CARRETALITO-1 and (B) ANH-CAÑABOBA-1 wells.
Geosciences 10 00258 g012
Figure 13. Cross plot of production index (PI) versus Tmax (℃) to identify source rock maturity in the Cerrejón Formation of the (A) ANH-CARRETALITO-1 and (B) ANH-CAÑABOBA-1 wells.
Geosciences 10 00258 g013
Figure 14. Cross plot of Tmax (℃) versus depths (m) to demonstrate the distribution of the parameter with increasing depth in the Cerrejón Formation of the (A) ANH-CARRETALITO-1 and (B) ANH-CAÑABOBA-1 wells.
Geosciences 10 00258 g014
Figure 15. Boundary conditions used for 1D modeling of burial history of the lithological units in the ANH-CARRETALITO-1 and ANH-CAÑABOBA-1 wells.
Geosciences 10 00258 g015
Figure 16. Burial history using modeled temperature variation for (A) ANH-CARRETALITO-1 and (B) ANH-CAÑABOBA-1 wells.
Geosciences 10 00258 g016
Figure 17. Calibration of vitrinite reflectance (%Ro) with depth for the (A) ANH-CARRETALITO-1 and (B) ANH-CAÑABOBA-1 wells.
Geosciences 10 00258 g017
Figure 18. Hydrocarbon middle-component and transformation ratios (TR) for the Cretaceous and Paleogene formations in the (A) ANH-CARRETALITO-1 and (B) ANH-CAÑABOBA-1 wells.
Geosciences 10 00258 g018

