2. Case Study—Kona Makhmūr
In recent years, archaeological landscape projects carried out in the Middle East have typically covered a range of several hundred to thousands of square kilometers. Among the most extensive projects are: EAMENA—Endangered Archeology in the Middle East and North Africa (
http://eamena.arch.ox.ac.uk); ASOR’s Cultural Heritage Initiative (
https://www.asor-syrianheritage.org/); and CAMEL—the Center for Ancient Middle Eastern Landscapes (
https://oi.uchicago.edu/research/camel/about-camel). These initiatives are mapping large areas of entire states, and their main aims are defined as the systematic localization of historical monuments and the evaluation of their state of preservation—with priority given to conflict areas. The documentation is primarily based on freely available remote sensing data. Due to the fairly good or favorable security situation there, most ongoing archaeological landscape projects focused on the mapping of sites within smaller-scale areas are located in the Kurdistan Region of northern Iraq. At present, there are about 10 ongoing landscape projects [
5], and most aim both to document individual archaeological sites and historical monuments of selected areas and to produce comprehensive databases. These types of landscape projects provide unprecedented amounts of data for the reconstruction of historical development and settlement structures and land use—and hugely more than was available for previous surveys (Atlas of the Archaeological Sites in Iraq) [
6]. The importance of remote sensing data (and, first and foremost, satellite images) as the most suitable technique for large-scale landscape prospection and feature detection in the Middle East has been described in studies by T. Wilkinson, R.H. Bewley, M.J. Fowler, D.L. Kennedy, S. Parcak, J. Ur, etc. [
7,
8,
9,
10,
11,
12,
13,
14,
15,
16]. The satellite images can be categorized, from a practical point of view, according to two basic criteria: Availability (commercial/freely available) and date of acquisition (archival/current). In most Middle East archaeological landscape projects, all four of the resulting categories of spaceborne imagery are applied.
A new approach to Middle East landscape documentation has evolved in recent years. With the wider availability of a variety of digital sources for landscape analysis, it has been possible to explore (in addition to the traditional documentation of sites and their surroundings) the more detailed morphological structure of sites. This high-definition approach has a firm place in urban settlement research (for example, in the ongoing project Medieval Urban Landscape in Northeastern Mesopotamia—MULINEM) [
17]. Detailed in-site mapping is now limited not by the quality of the datasets but, most of all, by the capacity of pre-processing to exploit their interconnections’.
For any given project, the methodology is, of course, influenced by the type of landscape being analyzed and the chronological period of interest. For earlier sites (e.g., prehistoric flat sites), it is possible to use techniques based on the detection of surface feature indicators (soil, vegetation). Soil marks (anthropogenically influenced soils, that are mostly lighter in color) on the surface are a very typical marker of these anthropogenic features. For the recognition and documentation of this type of archaeological site, the choice of one reliable, highly informative source of remote sensing data, together with tell archeology, is sufficient. For example, the archaeological landscape of the Kurdistan region of Iraq is reliably represented in one single set of images of the historical satellite spy system CORONA, taken on 27 February 1968 [
18].
The morphology of late sites (Sasanian or Islamic periods), on the other hand, can be characterized not only by the frequent preservation of above-ground relics of buildings, but also by a much more detailed distribution of soil, vegetation, and moisture characteristics than in the case of early flat settlements. For this reason, the researcher is often able to acquire a much deeper knowledge of the inner morphology of the settlement areas. In such situations, it is more efficient to search for and collect a wider range of remote sensing data, and thus obtain data that makes visible the whole spectrum of markers of anthropogenic features. In terms of the methodological approach, the main focus is to creatively exploit the diversity of remote sensing data and attempt to intensify their interconnections and general interpretation (something that cannot be done in projects that are based on the exploitation of a single data layer).
Satellite systems play a crucial role in the Middle East landscape archaeology. Site detection is only the first step. Depending on the type of archaeological project and the availability of data sources, researchers have to ask how deeply they want to analyze a site and how much information they want to obtain. In the past, Middle East landscape archeology was mainly tied to low-resolution satellite systems (CORONA, LANDSAT, etc.). Landscape archeology based on this type of data traditionally emphasized the basic mapping of individual sites in the form of known points or polygons on a map base and in the database system, without detailed documentation of individual features. In recent years, by incorporating historical data (high-resolution satellite images, aerial photographs, umanned aerial system (UAV) technology), landscape archeology has been able to offer a more detailed intra-site approach. Examining shadow and vegetation marks and the extent of anthrosols, which are detectable on data sources with a very high spatial resolution, alongside detailed elevation information, opens up new possibilities for detailed in-site documentation [
17] (pp. 13–17). Data sources which have made a significant contribution to this methodological approach are the satellite systems KH-9 Hexagon and Orbview-3 (whose images from the period of 2003–2007 have been made available through the American USGS) and, above all, historical aerial photographs, which have been collected in the Middle East since the first half of the 20th century [
19,
20,
21,
22].
The archived aerial images, which are traditionally used, are images of the American U2 spy system operating from the 1950s to the 1970s. Each U2 mission produced very clear, high-resolution images. They can be obtained through the National Archives and Records Administration (NARA). In 2018 a spatial index for the declassified Middle Eastern missions in NARA for the period 1958–1960 was published by Jason Ur and Emily Hammer. Geospatial data for the spatial index is downloadable from the Harvard Dataverse [
23]. As older sources, images from the GX Luftwaffe reconnaissance collection and collections of the British Royal Air Force and the US Air Force have been used. The resolution of those images is mostly under 1 m, and in most cases, in centimeters [
20]. Historical aerial photographs, together with satellite imagery, create a basic database of input source data for more detailed analyses of morphological aspects of archaeological sites, and their most significant application is in the area of research on deserted or still-occupied urban units (
Figure 1).
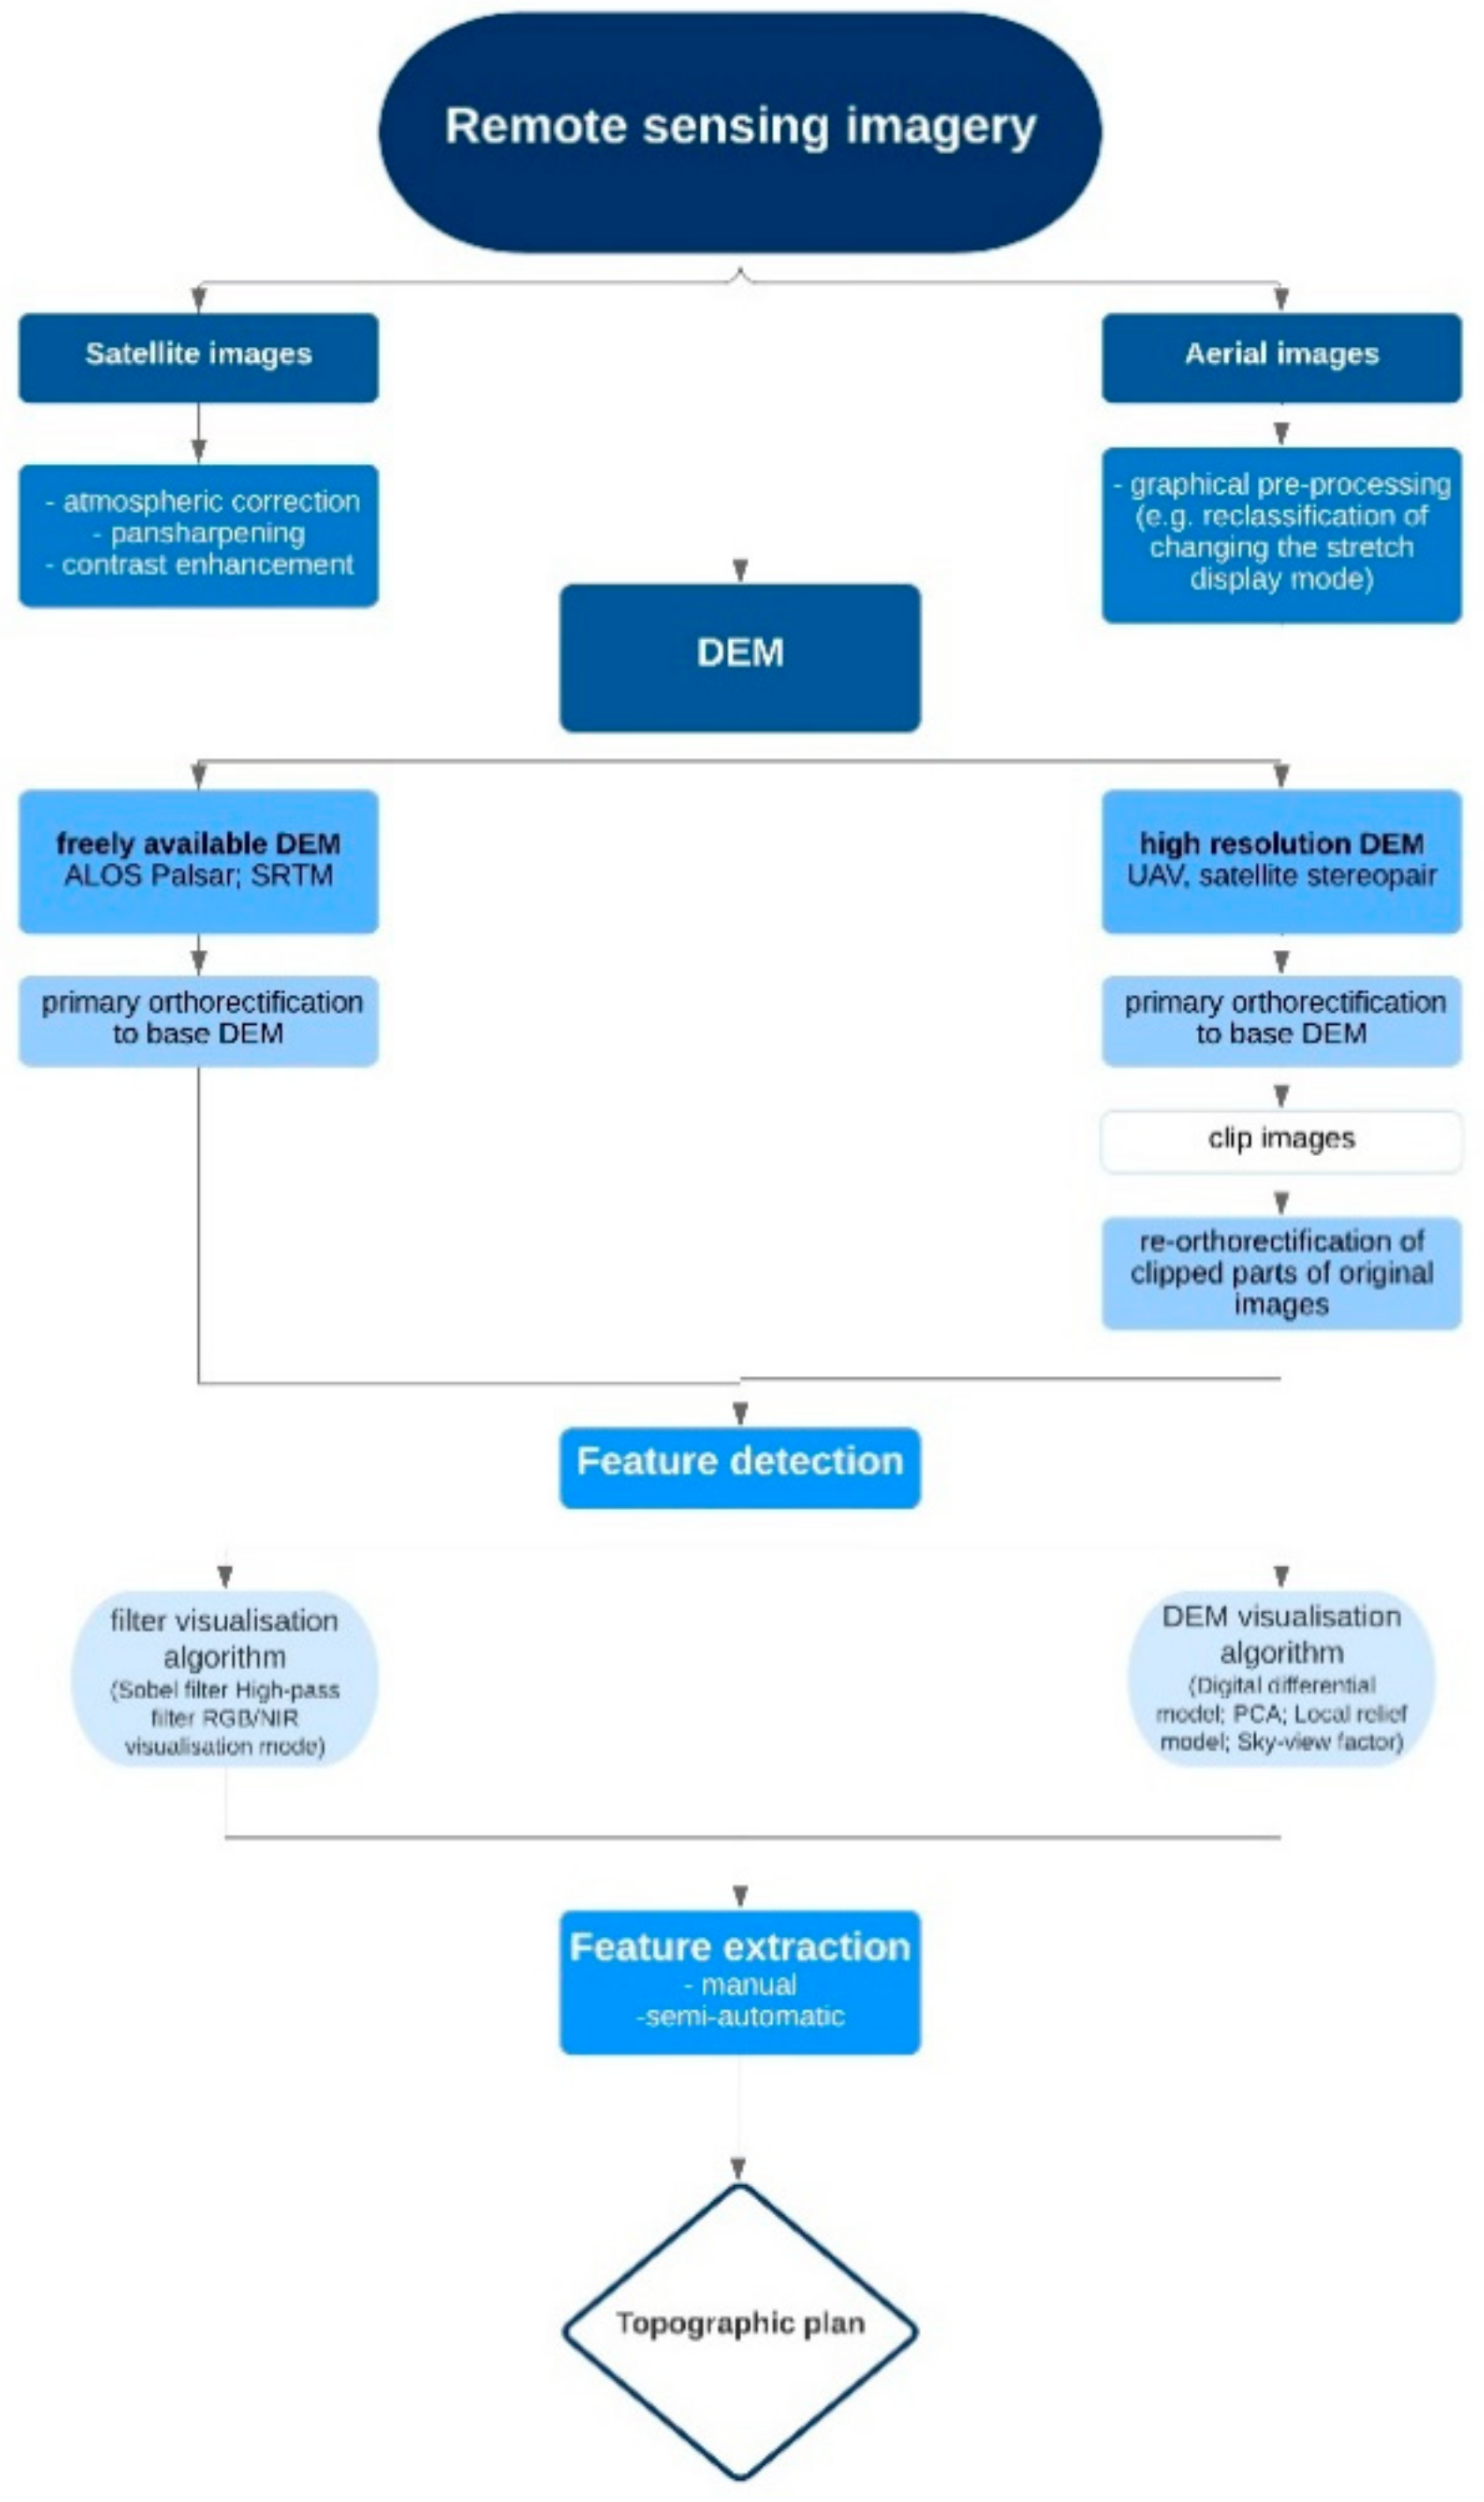
One crucial technique in the analysis of the detailed morphology of urban settlements is the use of elevation databases. In the Middle East region, the most common type of elevation datasets utilized during landscape research are digital elevation models (DEMs), extracted from freely available SRTM or ASTER data sources (
https://earthexplorer.usgs.gov/). These elevation models have a resolution of 30 m, which is suitable for visualizing the elevation of geographically larger-scale areas. The ALOS Palsar Global Radar System offers a 12.5 × 12.5 m cell elevation model (
https://www.asf.alaska.edu/sar-data/palsar/). The use of such models is insufficient in the case of detailed geomorphological analyses of intra-site features. Their usage as a base layer for the orthorectification of multi-temporal datasets is limited. As an alternative, digital elevation models extracted from stereo pairs of satellite imagery—and recently from the more and more frequent use of unmanned aerial systems (UAVs)—can be used. Such images can be used to create a highly accurate elevation model with a spatial resolution in centimeters. Over the past few years, this technique, which has become indispensable in archeology in general, has also been integrated into Middle Eastern archeology [
17] (pp. 20–22). Its outputs often serve as background data for the mapping of very precise and detailed morphologies. However, no current UAV image is able to provide a historical dimension, which can only be obtained through a continuous study of archival aerial and satellite photographs.
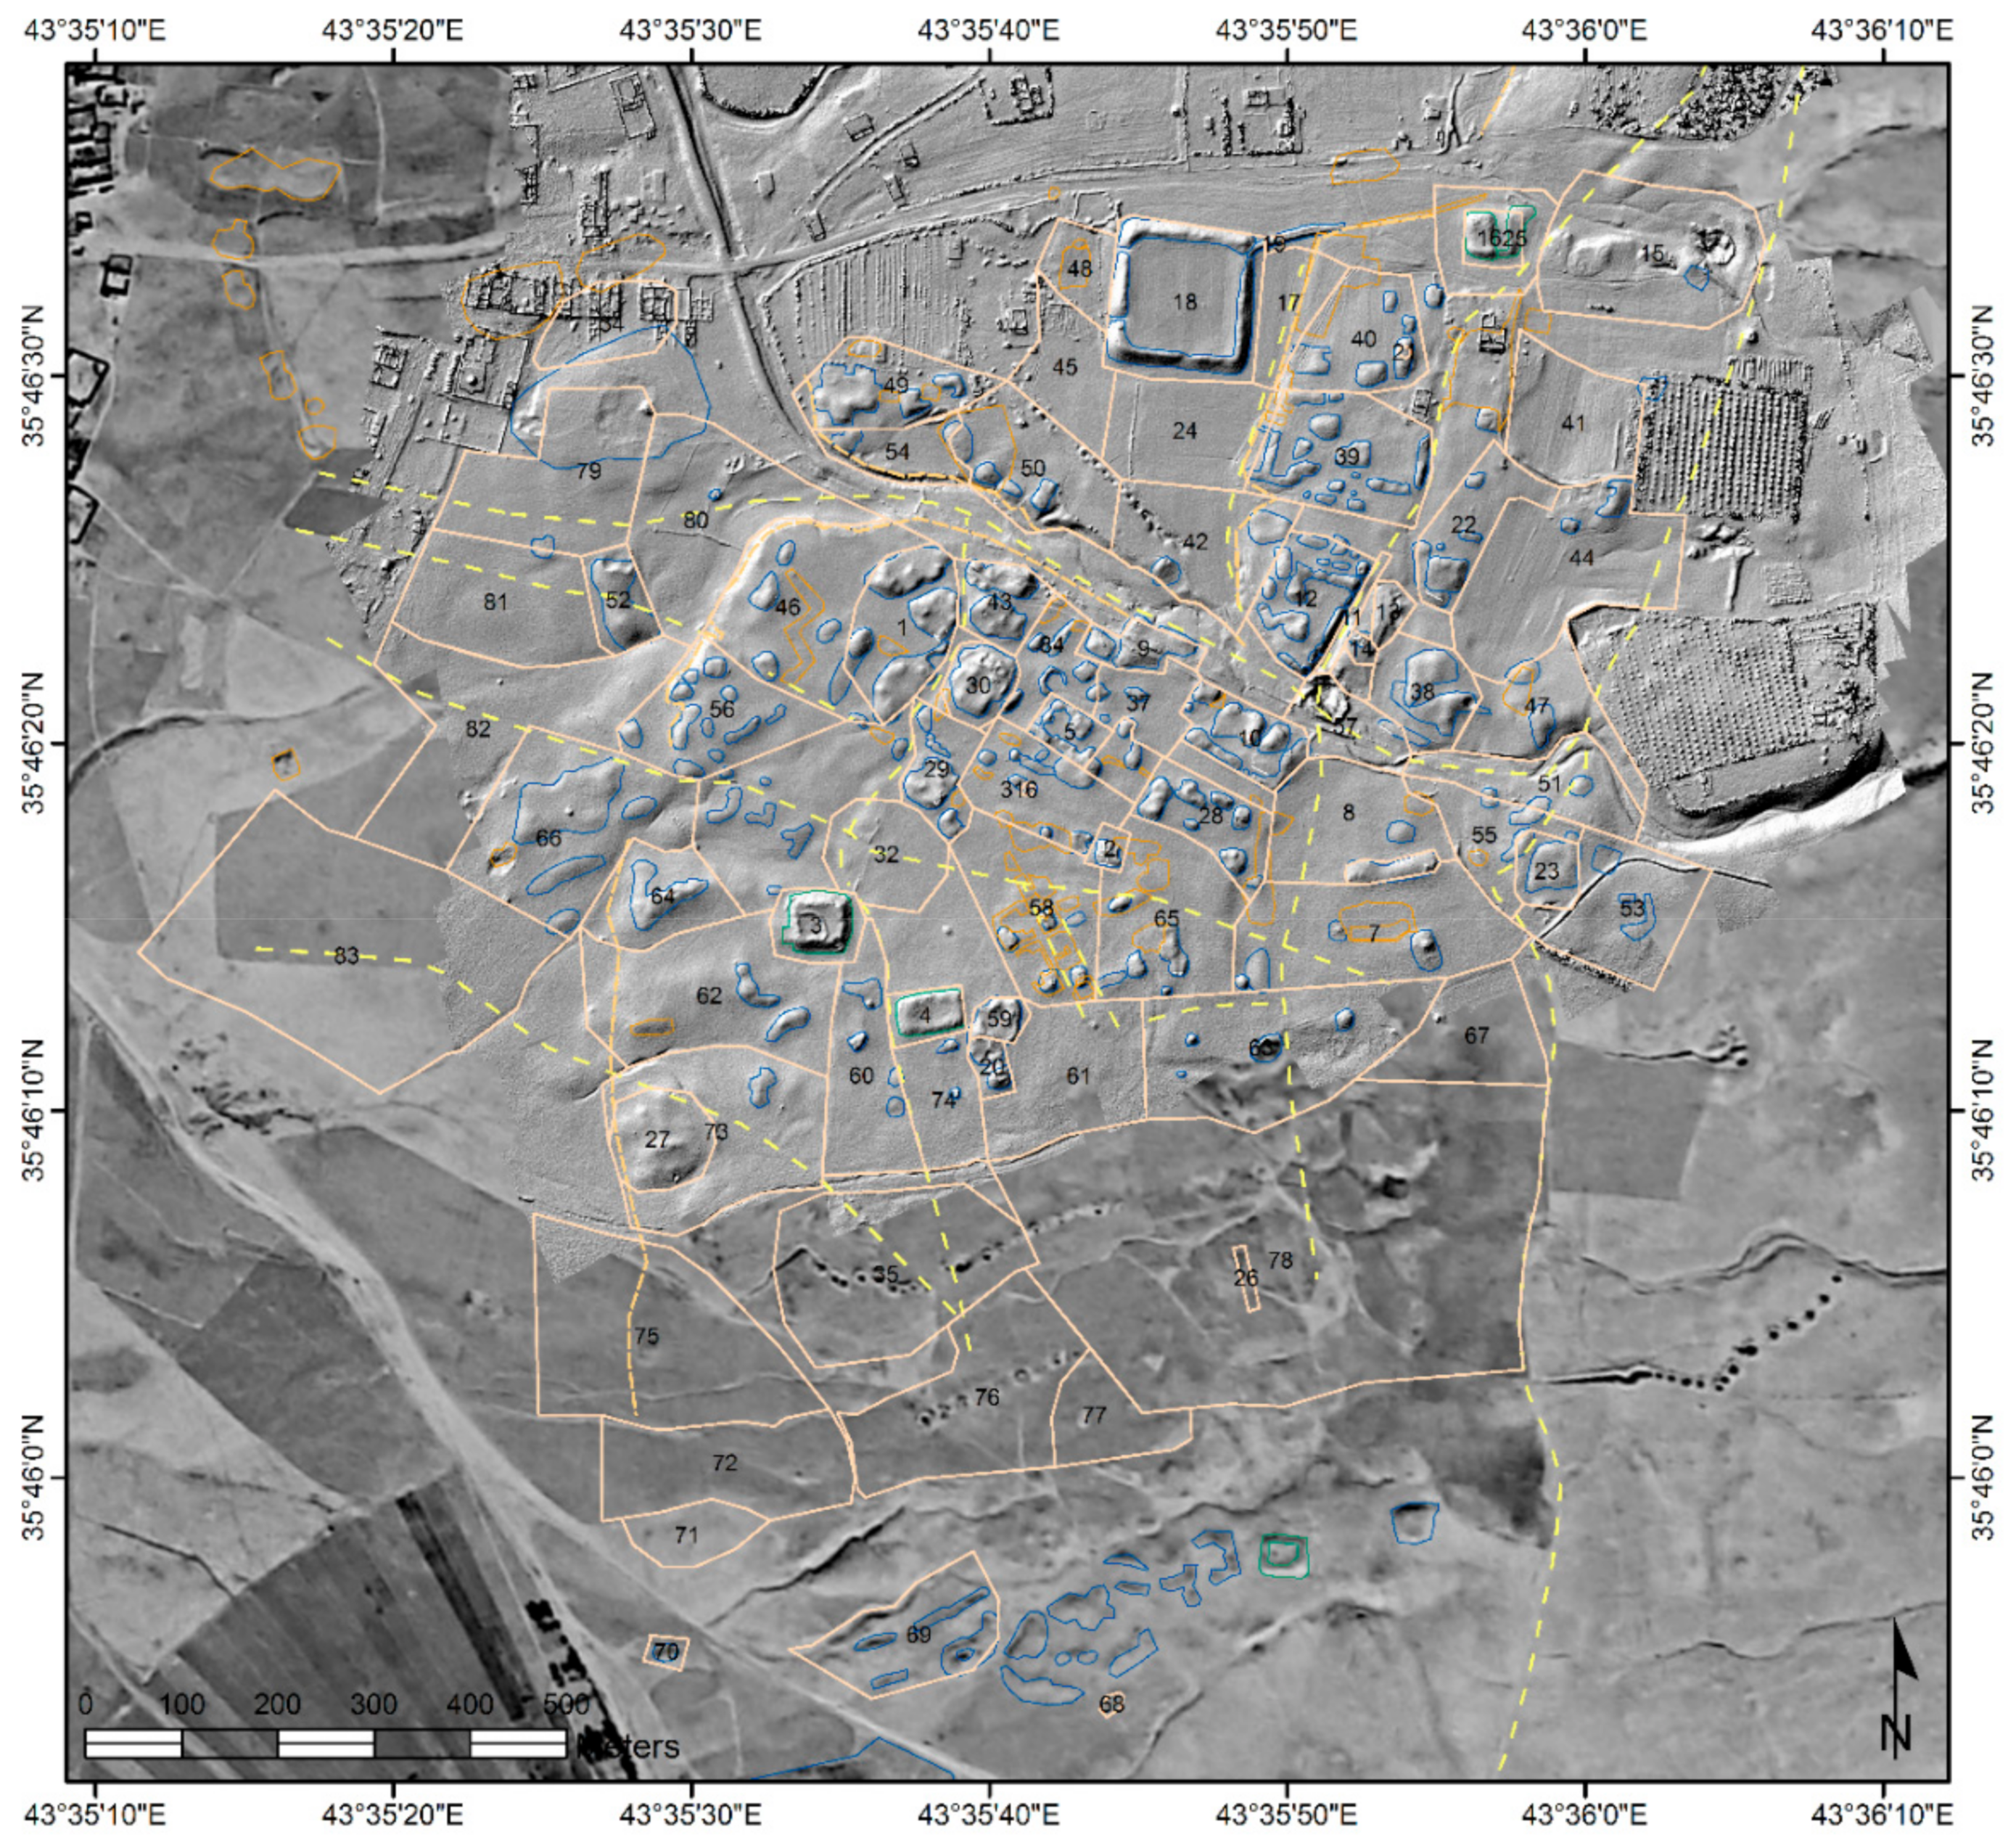
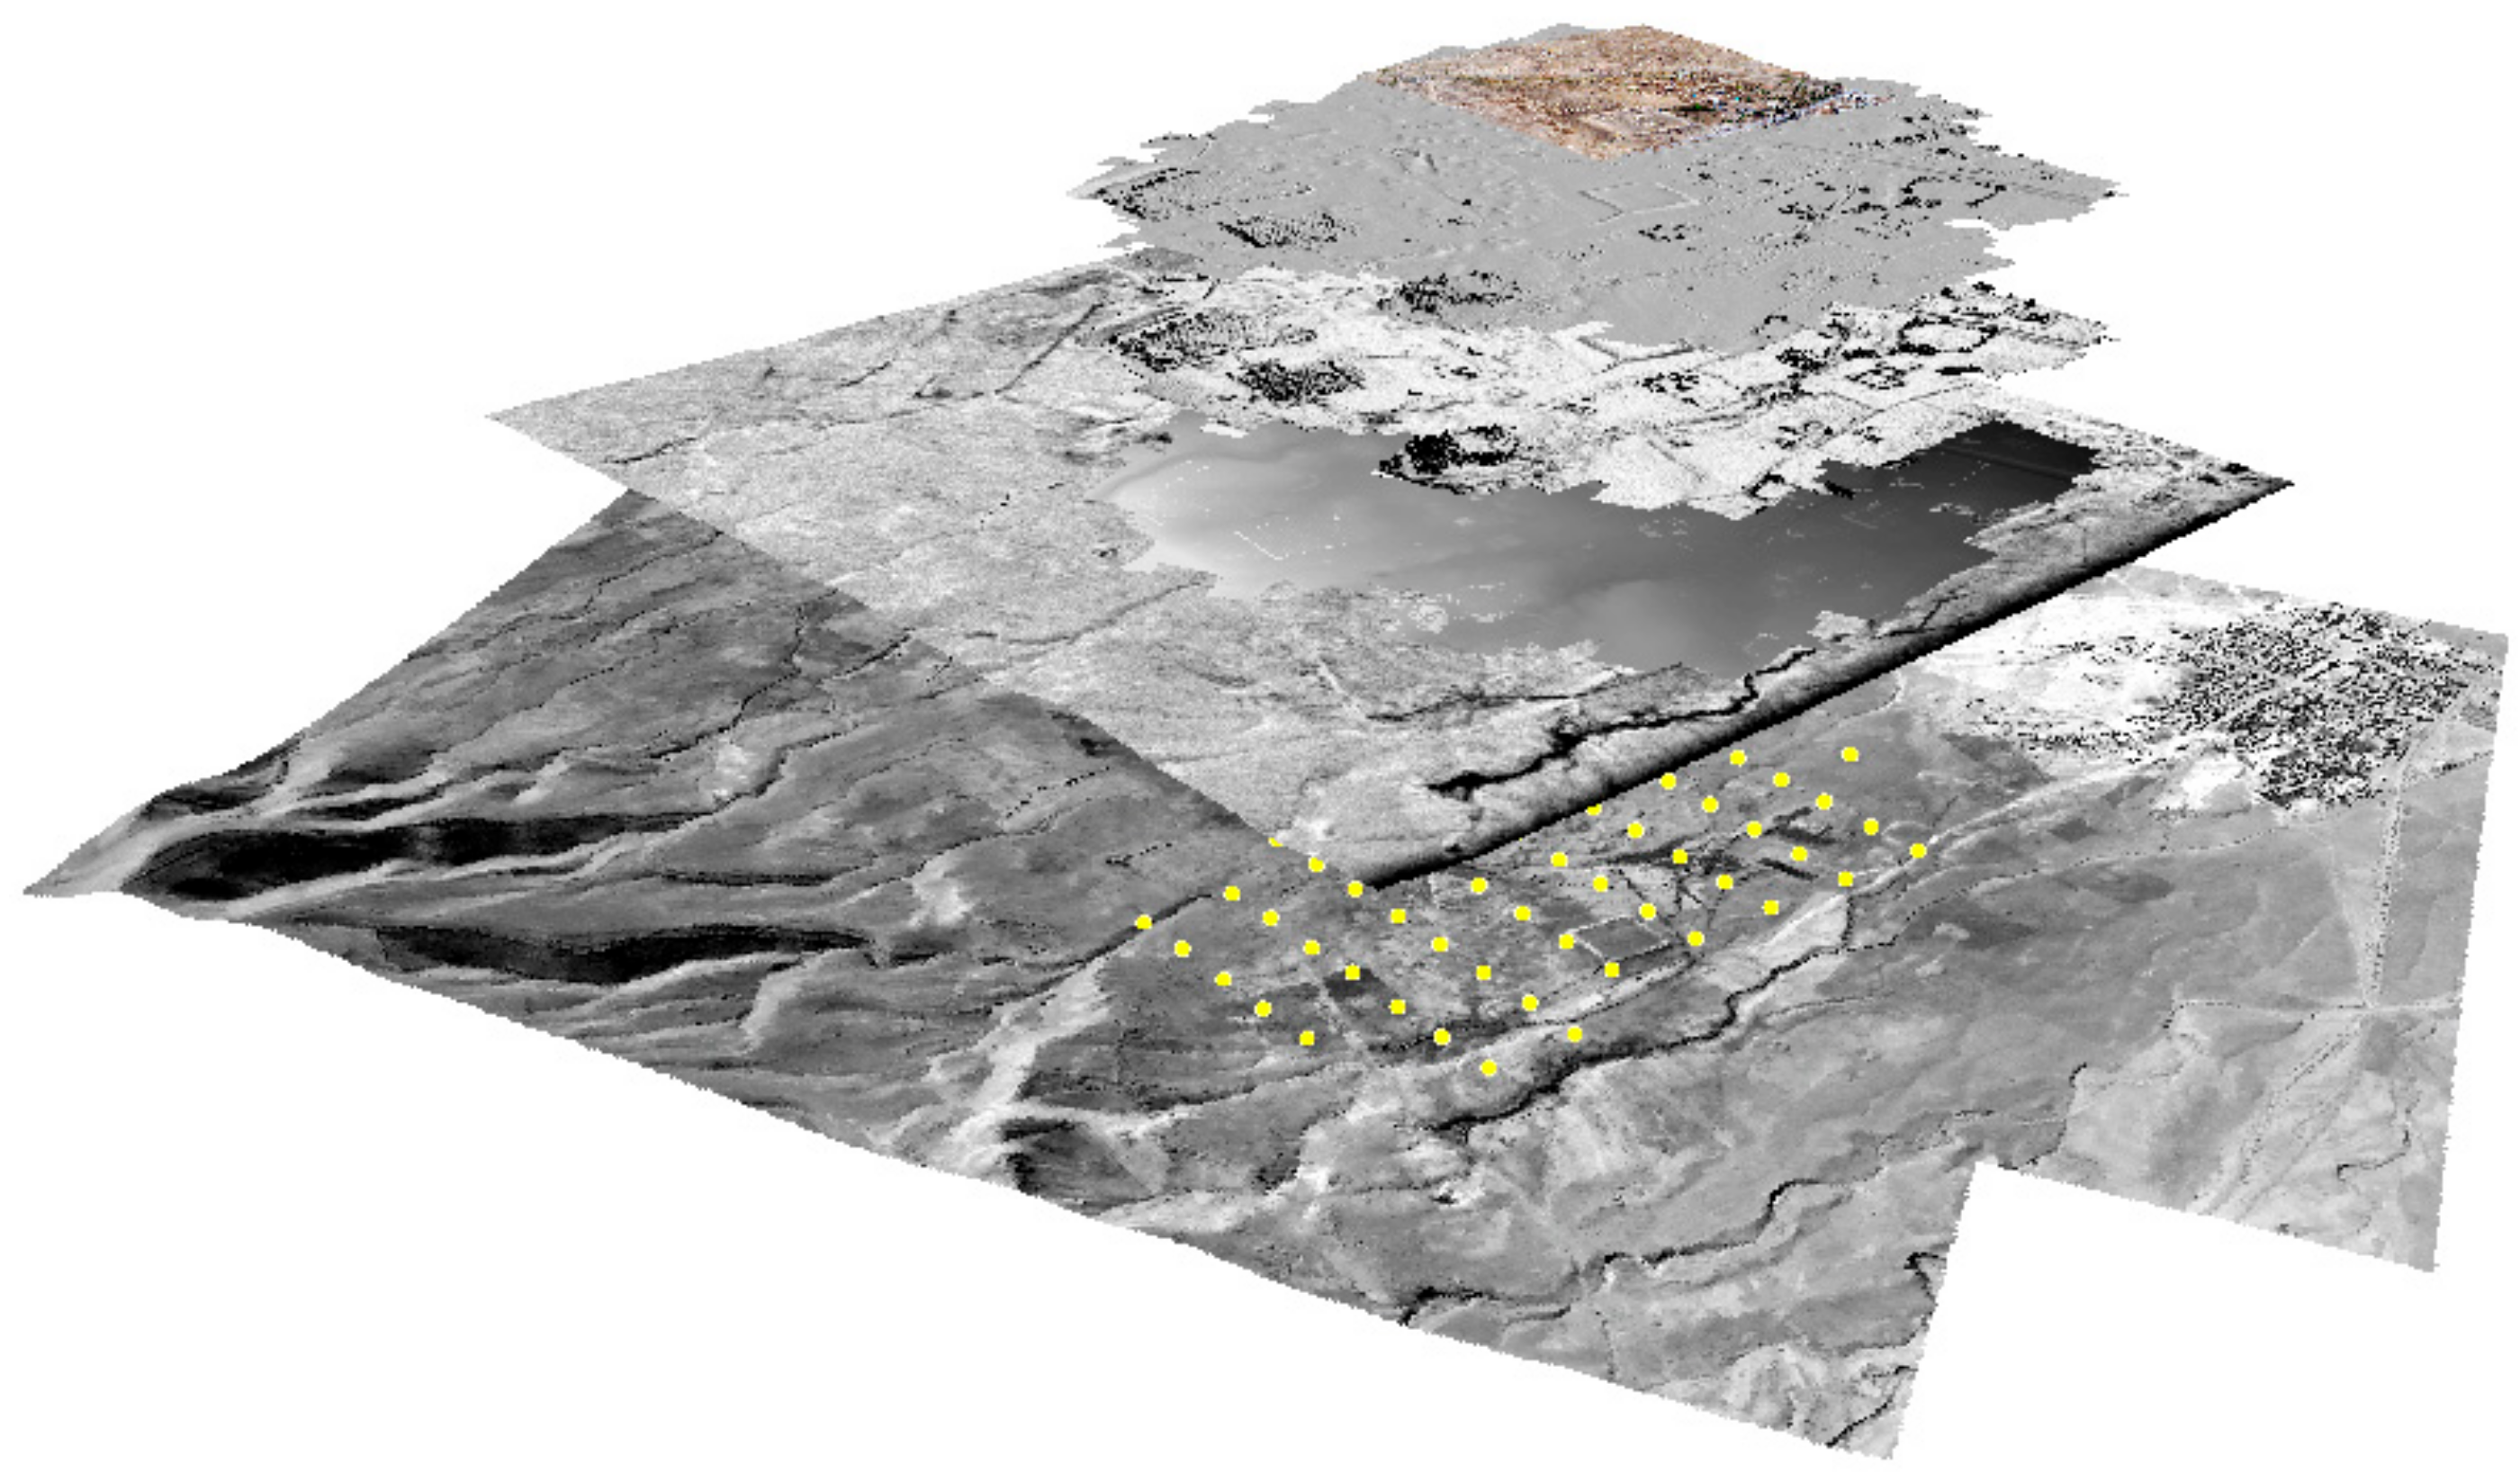
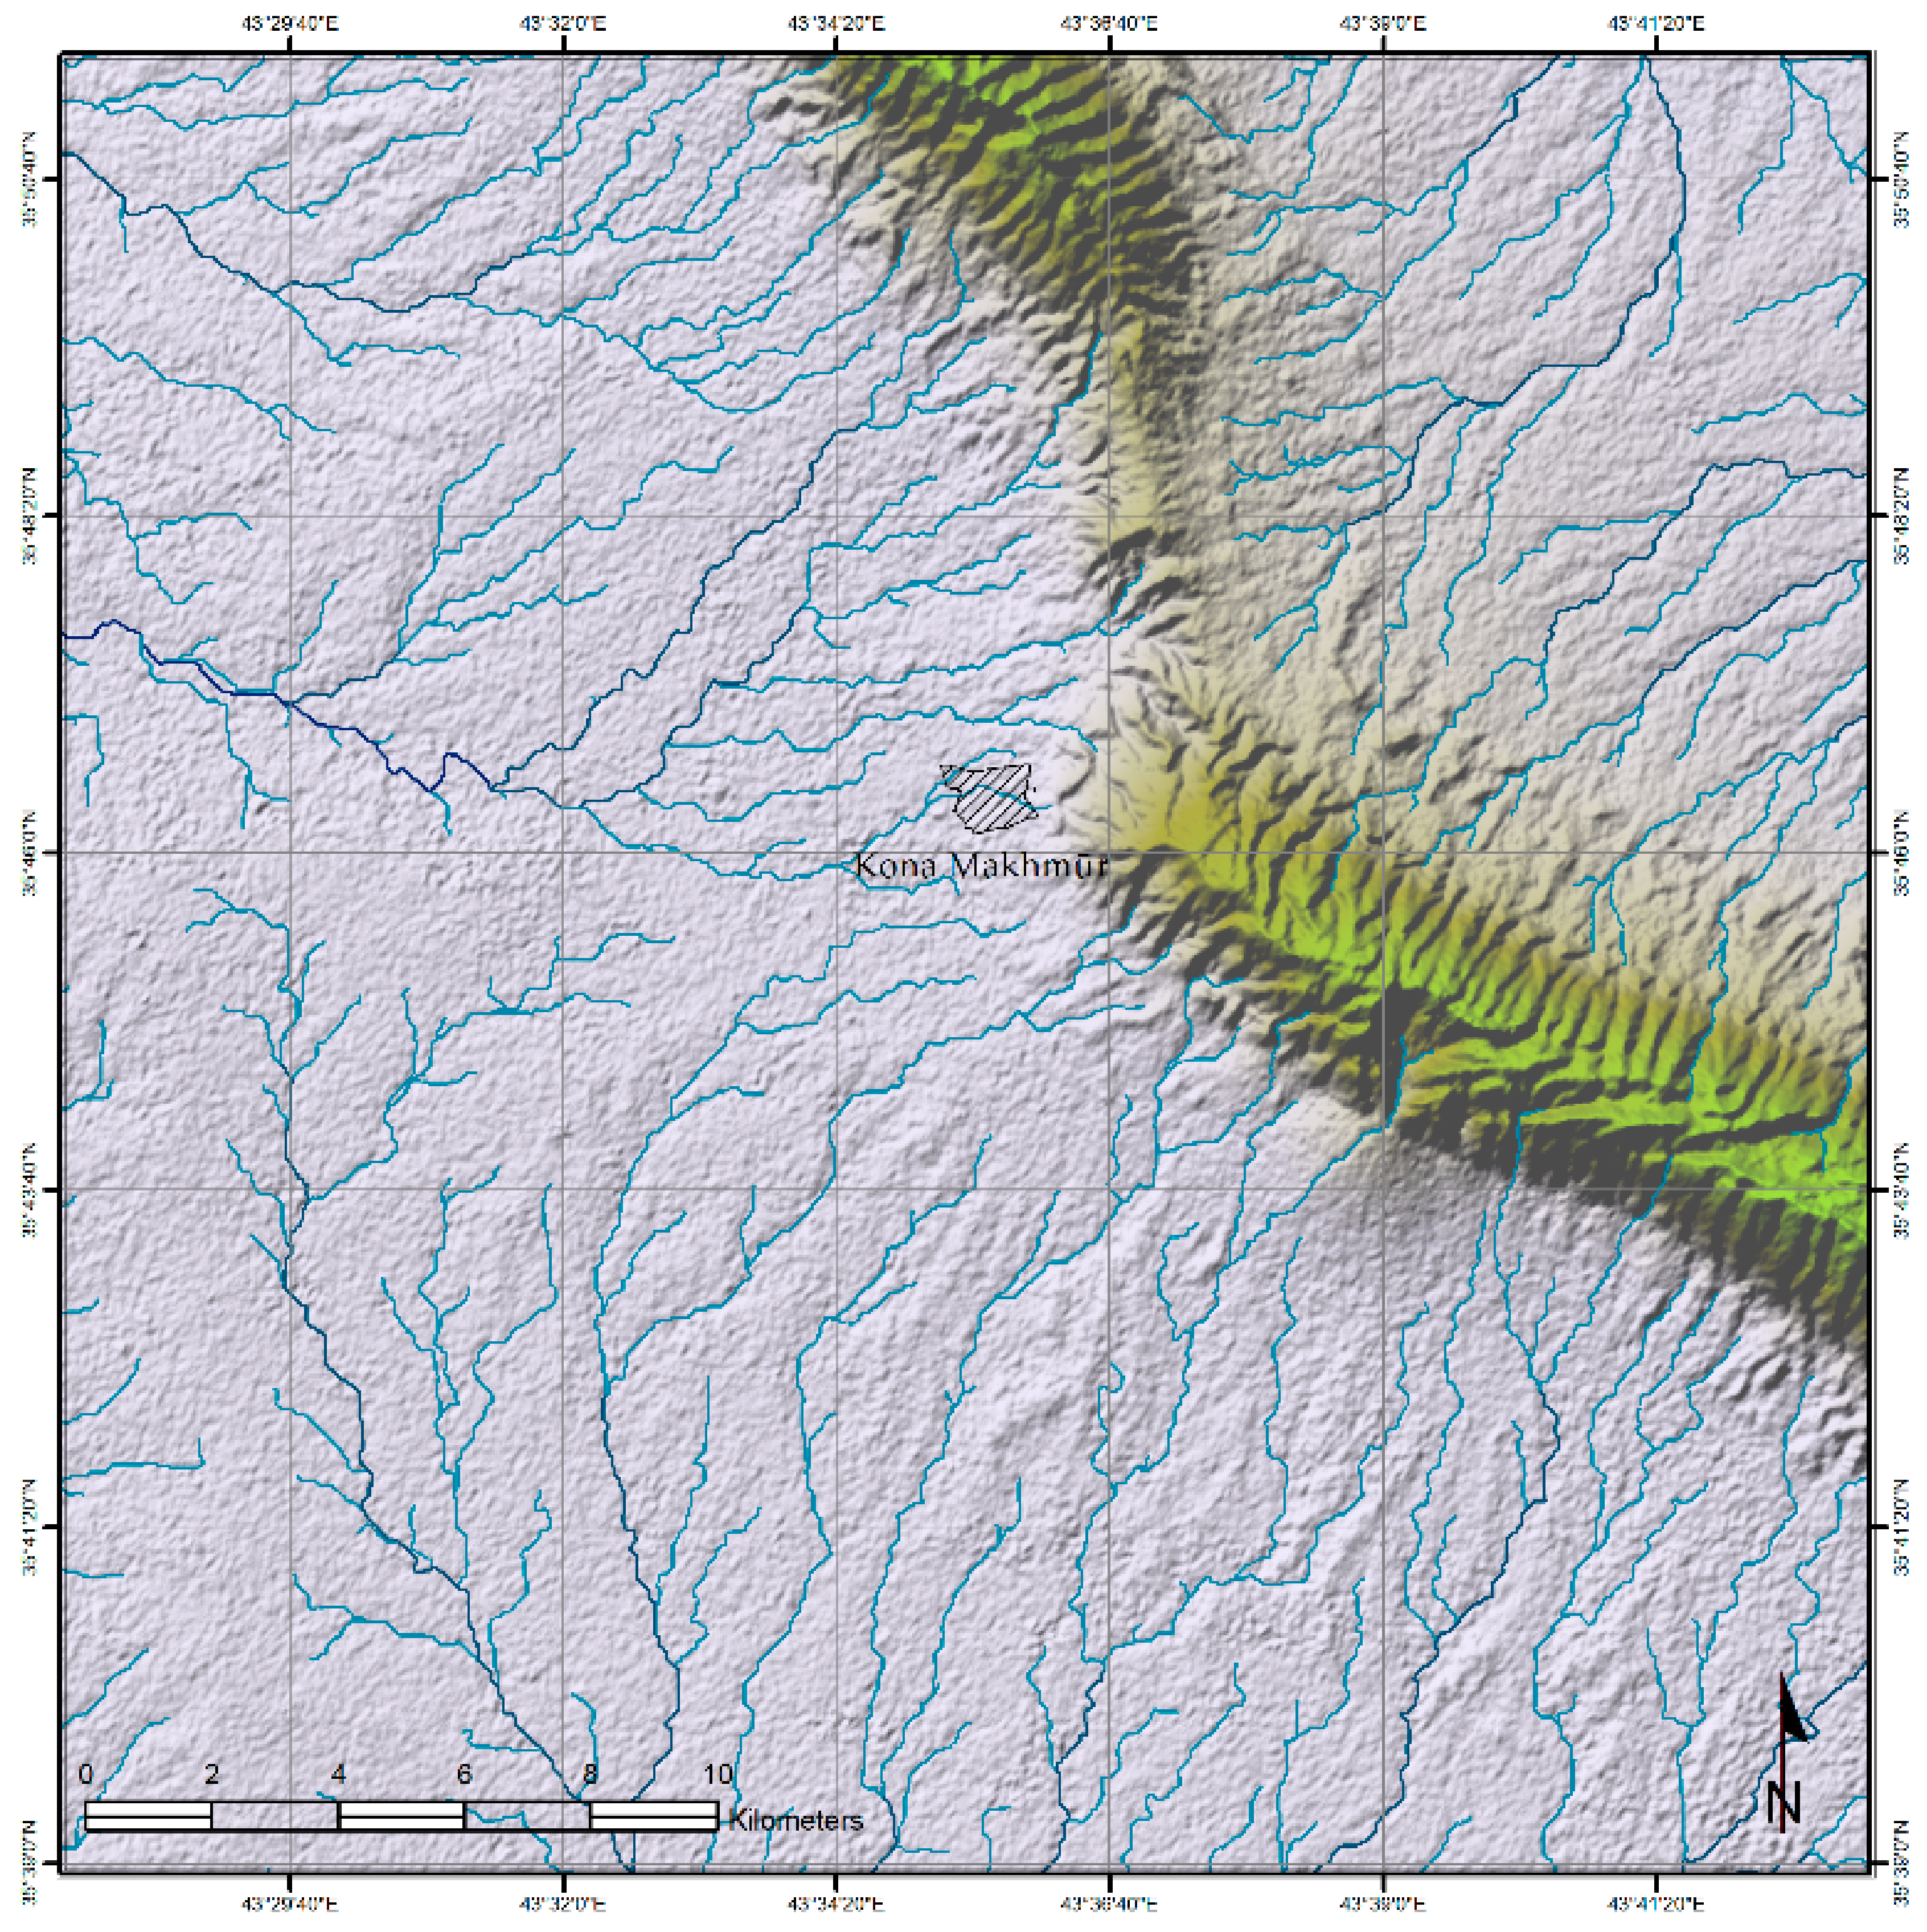
Kona Makhmūr is located next to the modern town of Makhmūr, 65 km southwest of the Iraqi Kurdistan capital city, Erbil (coordinates: 35°46′21.10″ N, 43°35′42.42″ E). Its unique placement in the center of the very fertile historical province of Adiabene (northeastern Mesopotamia) indicates its key strategic position as an agricultural and trade center. The site was discovered in 2012 [
24] and documented within the scope of the Medieval Urban Landscape in Northeastern Mesopotamia (MULINEM) research project during the years 2013–2015. It is characterized as a deserted medieval town dated to the 8th–9th century [
17] (pp. 102–160) (
Figure 2).
Within the MULINEM project, this site was subjected to a detailed, nondestructive archaeological survey, based primarily on the use of remote sensing data from historical aerial prospection. Its well-preserved anthropogenic microrelief is rather unique, as large parts of the site have not been used for agriculture. However, the site is currently endangered by the extensive development of the existing town of Makhmūr, which puts it into the category of immediately threatened sites. Before the arrival of archaeologists from the MULINEM project, the northwestern part of the site was destroyed by the construction of new buildings. Therefore, the analysis of this part was possible only on the basis of historical remote sensing data.
Within the processing of remote sensing data and geographical data, three main outputs were defined:
- (1)
A topographic plan of the site (current state x historical state);
- (2)
A digital elevation plan of the site in high resolution;
- (3)
Detailed plans of selected anthropogenic relics and their reconstruction.
4. Results
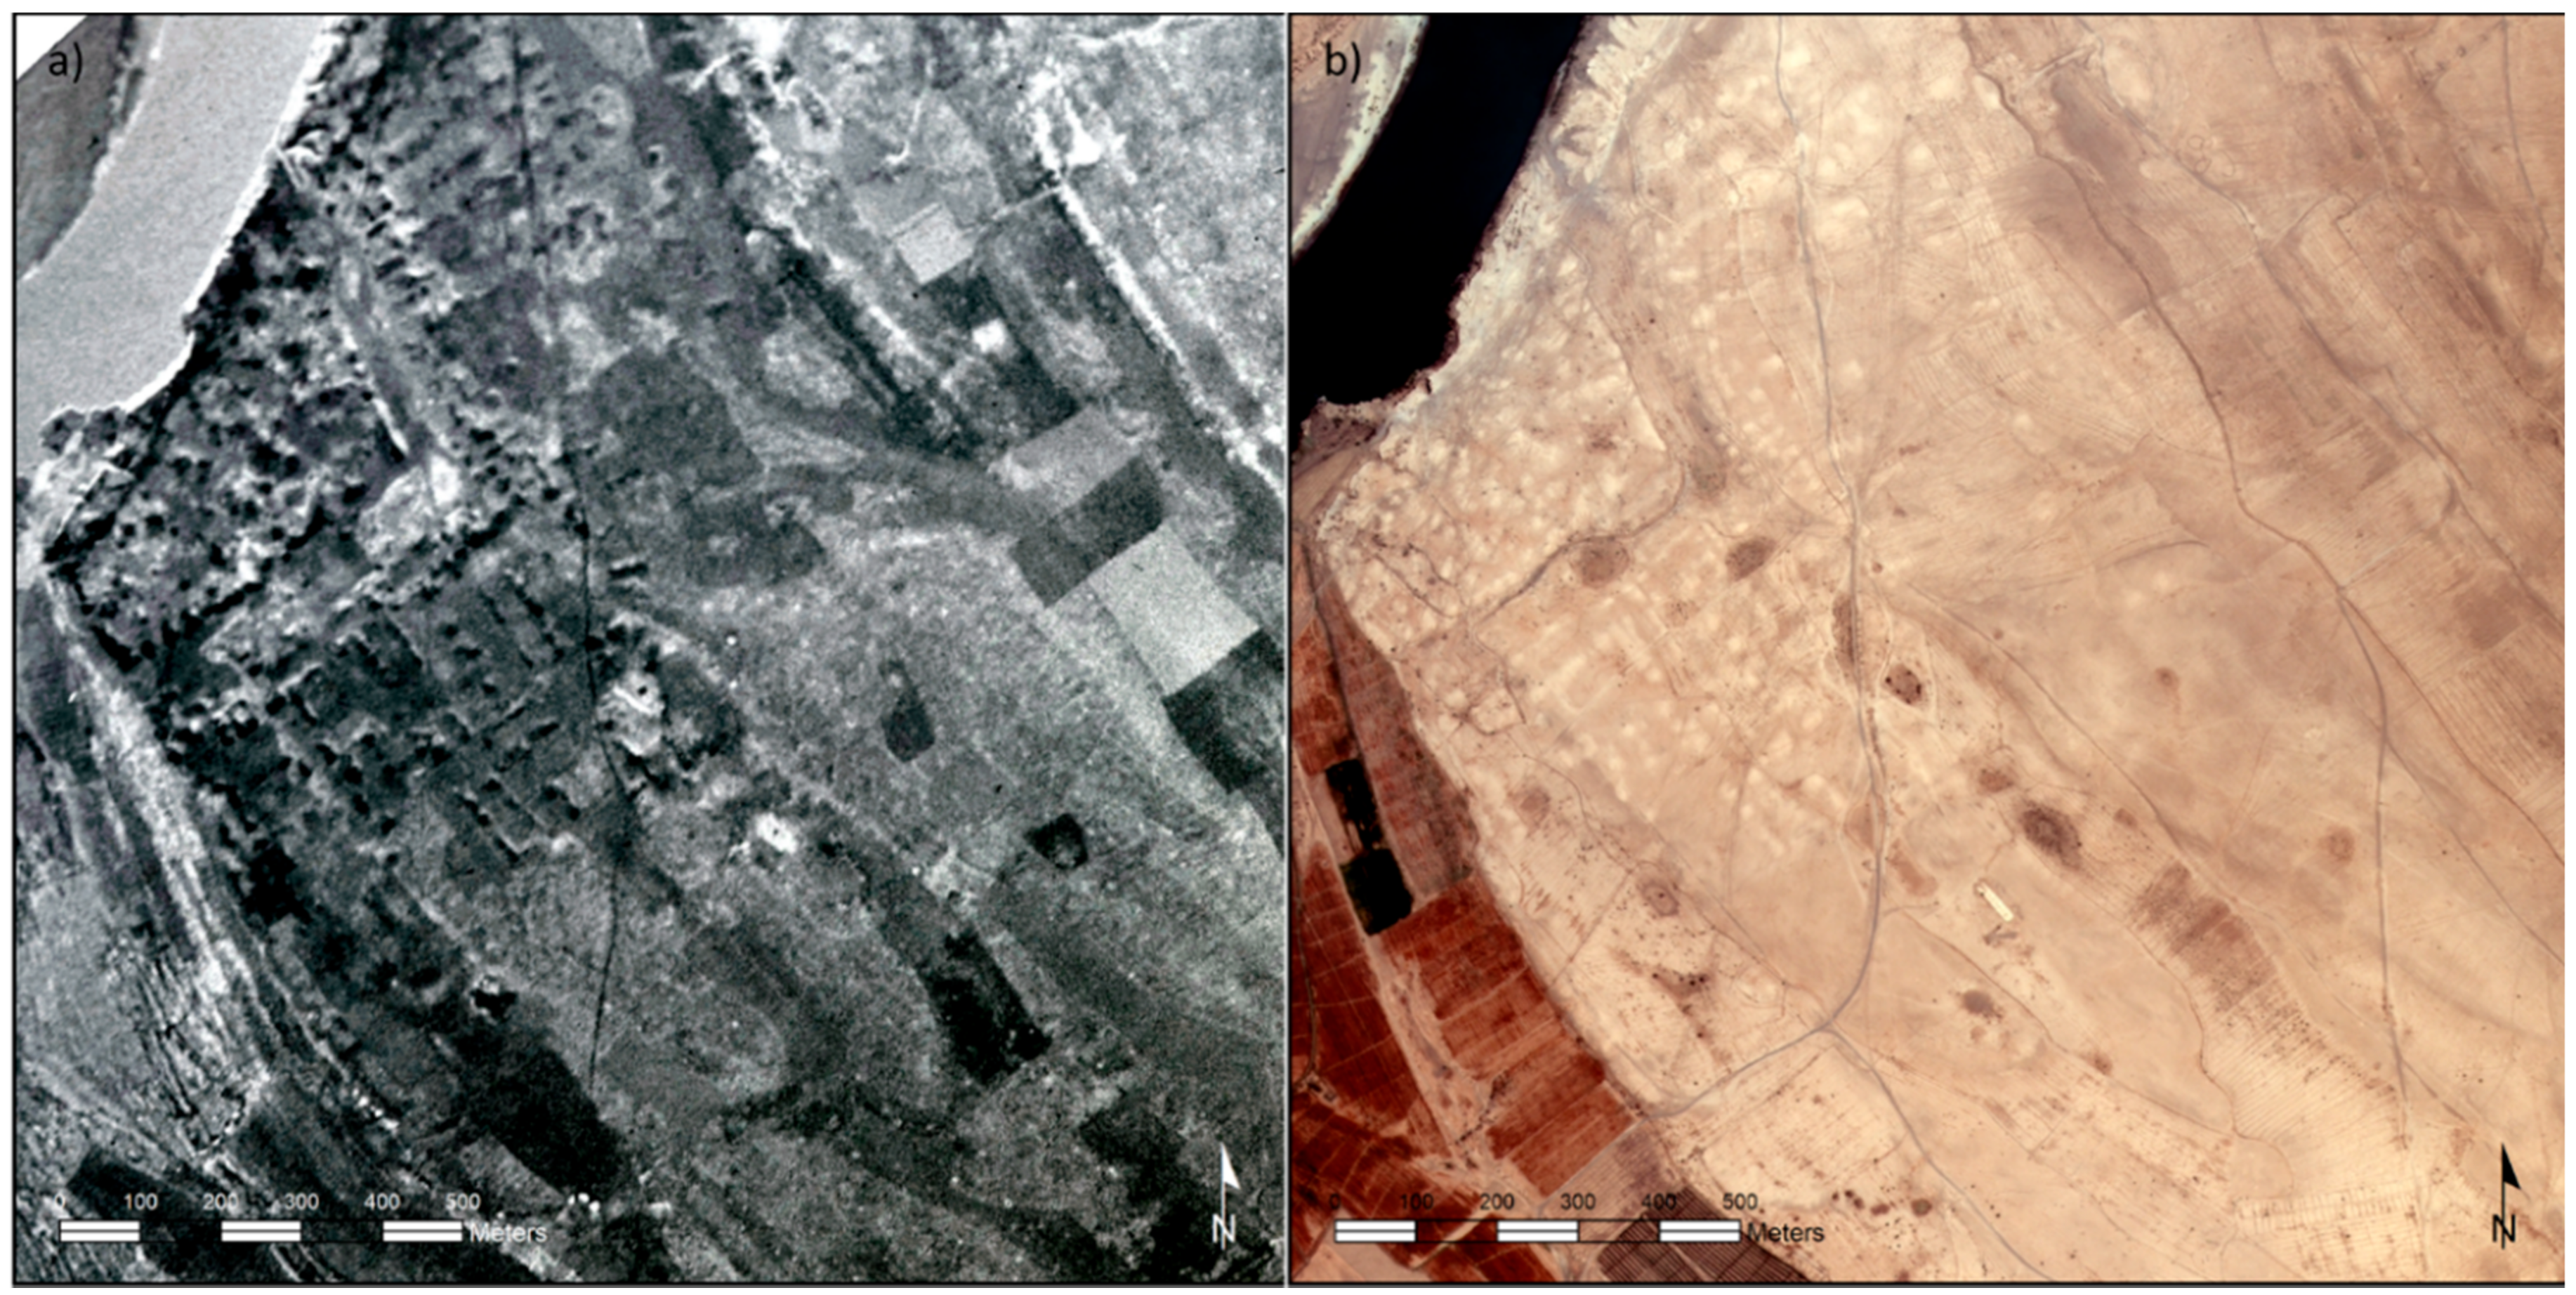
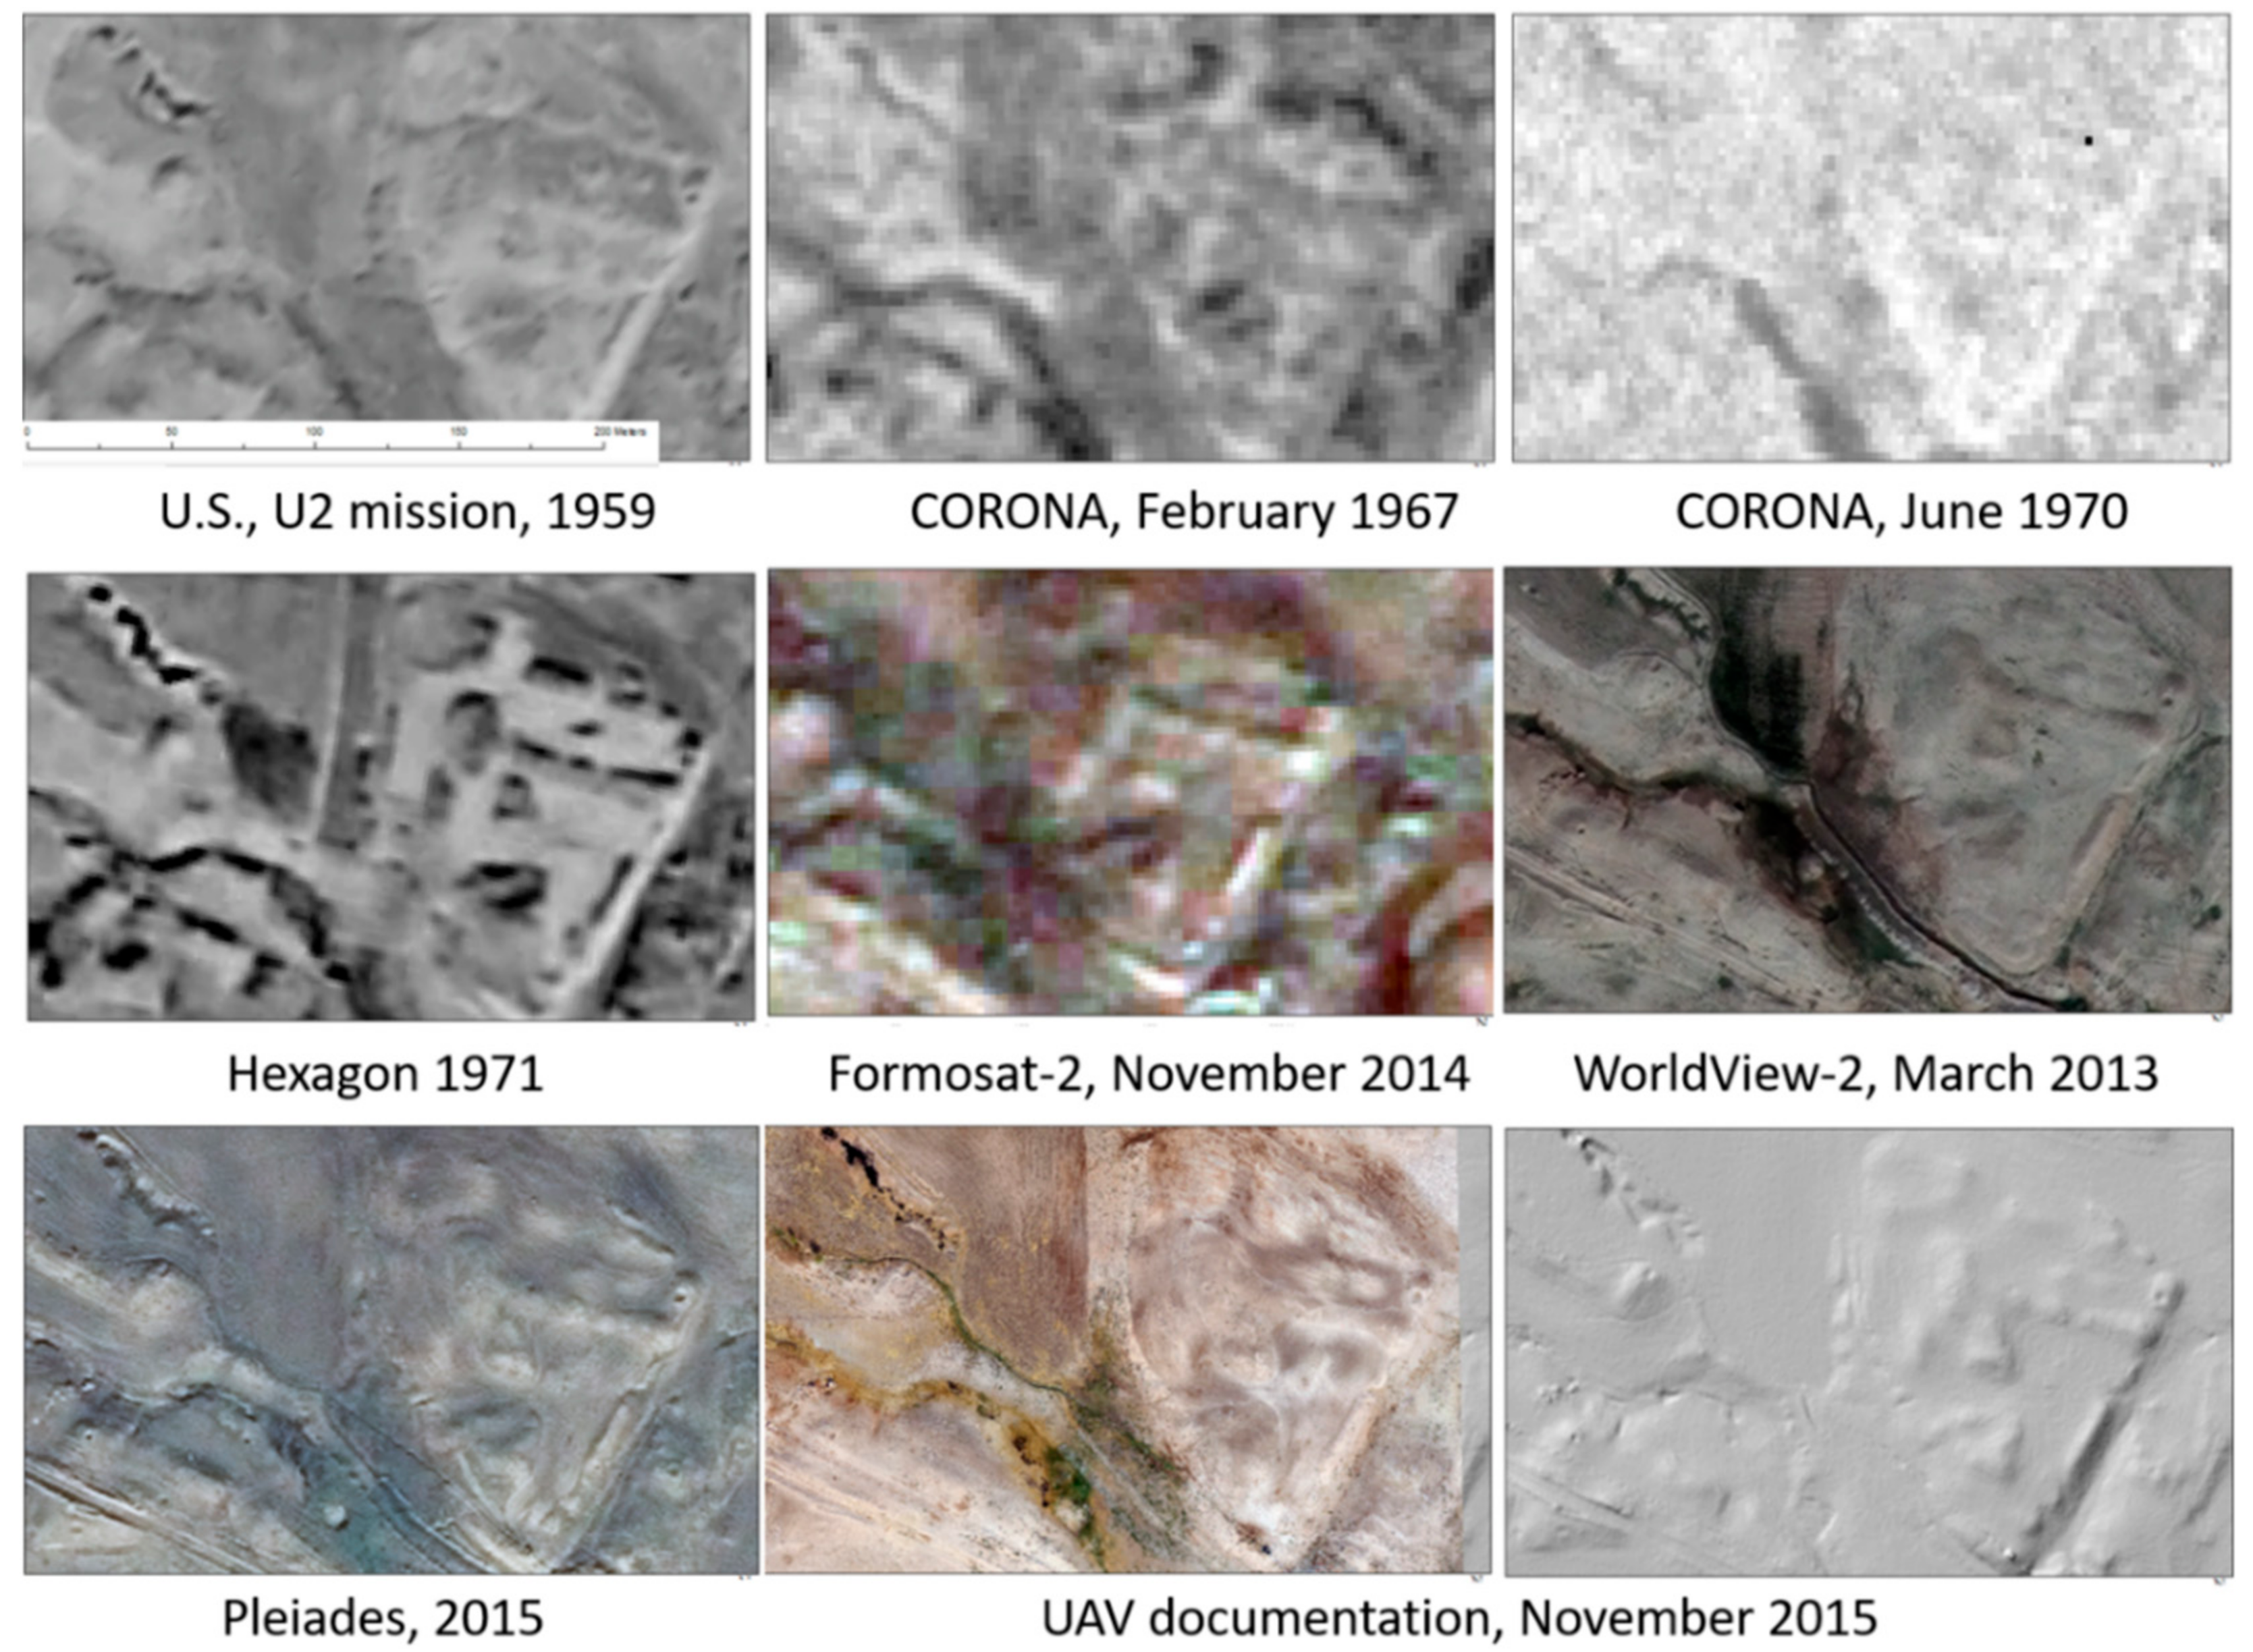
A preliminary assessment of the site (site borders and feature detection) was carried out using CORONA spy system images with a spatial resolution of 1.8–3.6 m. Detection of individual features based on this type of data was rather demanding, and the resulting site plan had significant deviations in edge detection and edge partitions. Comparison of the CORONA images with current satellite images, purchased from WorldView-2 (0.46 m resolution), enabled us to eliminate these errors, but only for features that have been preserved to the present (or until 2013, when the image was taken). As base data for the site analyses for earlier periods, historical aerial photographs were used to provide a record of features when they were better preserved. Geological and human processes—above all erosion and agricultural activity—have strongly influenced the site. By creating a chronological series of base data from the most recent to the oldest, it was possible to reconstruct the dynamics of feature preservation/degradation (
Figure 7).
By tracking the visibility and the degree of feature preservation, it is obvious that many features have now succumbed to partial or total destruction. To detect the original morphological aspects of individual features, filtering algorithms were applied to a complete archival dataset. This effectively facilitates the detection of edges and border contours.
We first attempted to carry out a spatial analysis of Kona Makhmūr using automatic or semi-automatic extraction of features on the basis of their classification (feature morphology and color spectrum are two basic criteria used in this process). A very useful application of this technique was the detection of features of a predefined category in a non-urban environment. Auto-detection processes have proven to be very effective in cases of recognition of morphologically similar features whose reflectivity characteristics do not show too much variability (optimally, each object is characterized by one spectral and one morphological classification class). Another positive application is the analysis of the numerical representation of morphologically identical or similar elements in the landscape. In Middle East landscape archeology, this technique has been used in recent years to investigate the impact of looting on individual sites or to detect morphologically well-defined types of archaeological monuments (tells, tombs, etc.) [
34,
35,
36,
37].
Those projects primarily perform a pixel-based analysis, using freely available elevation models (SRTM, ASTER) as the background. Pixel classification is based on spectral-radiometric information processing of individual pixels of the raster backgrounds, without evaluating their neighborhood and relationships. For the urban environment, so-called object-oriented image analysis (OBIA) is much more useful. This form of classification goes beyond the spectral analysis of raster pixels, as well as aspects of textures, the morphology of objects, and similar attributes of individual pixels within an object (with its shape, textural, or topological (contextual) properties) [
38,
39]. It simulates, in a certain sense, the visual classification and interpretation of images by the human visual system. When analyzing a raster with the human eye, one does not work with individual pixels but associates them into homogeneous entities to assign them a certain interpretive meaning.
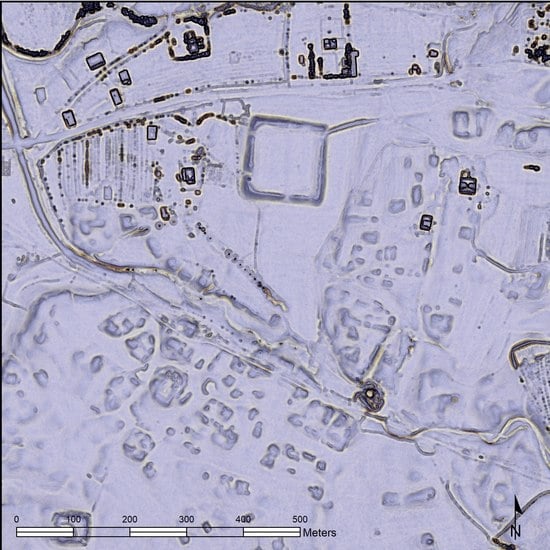
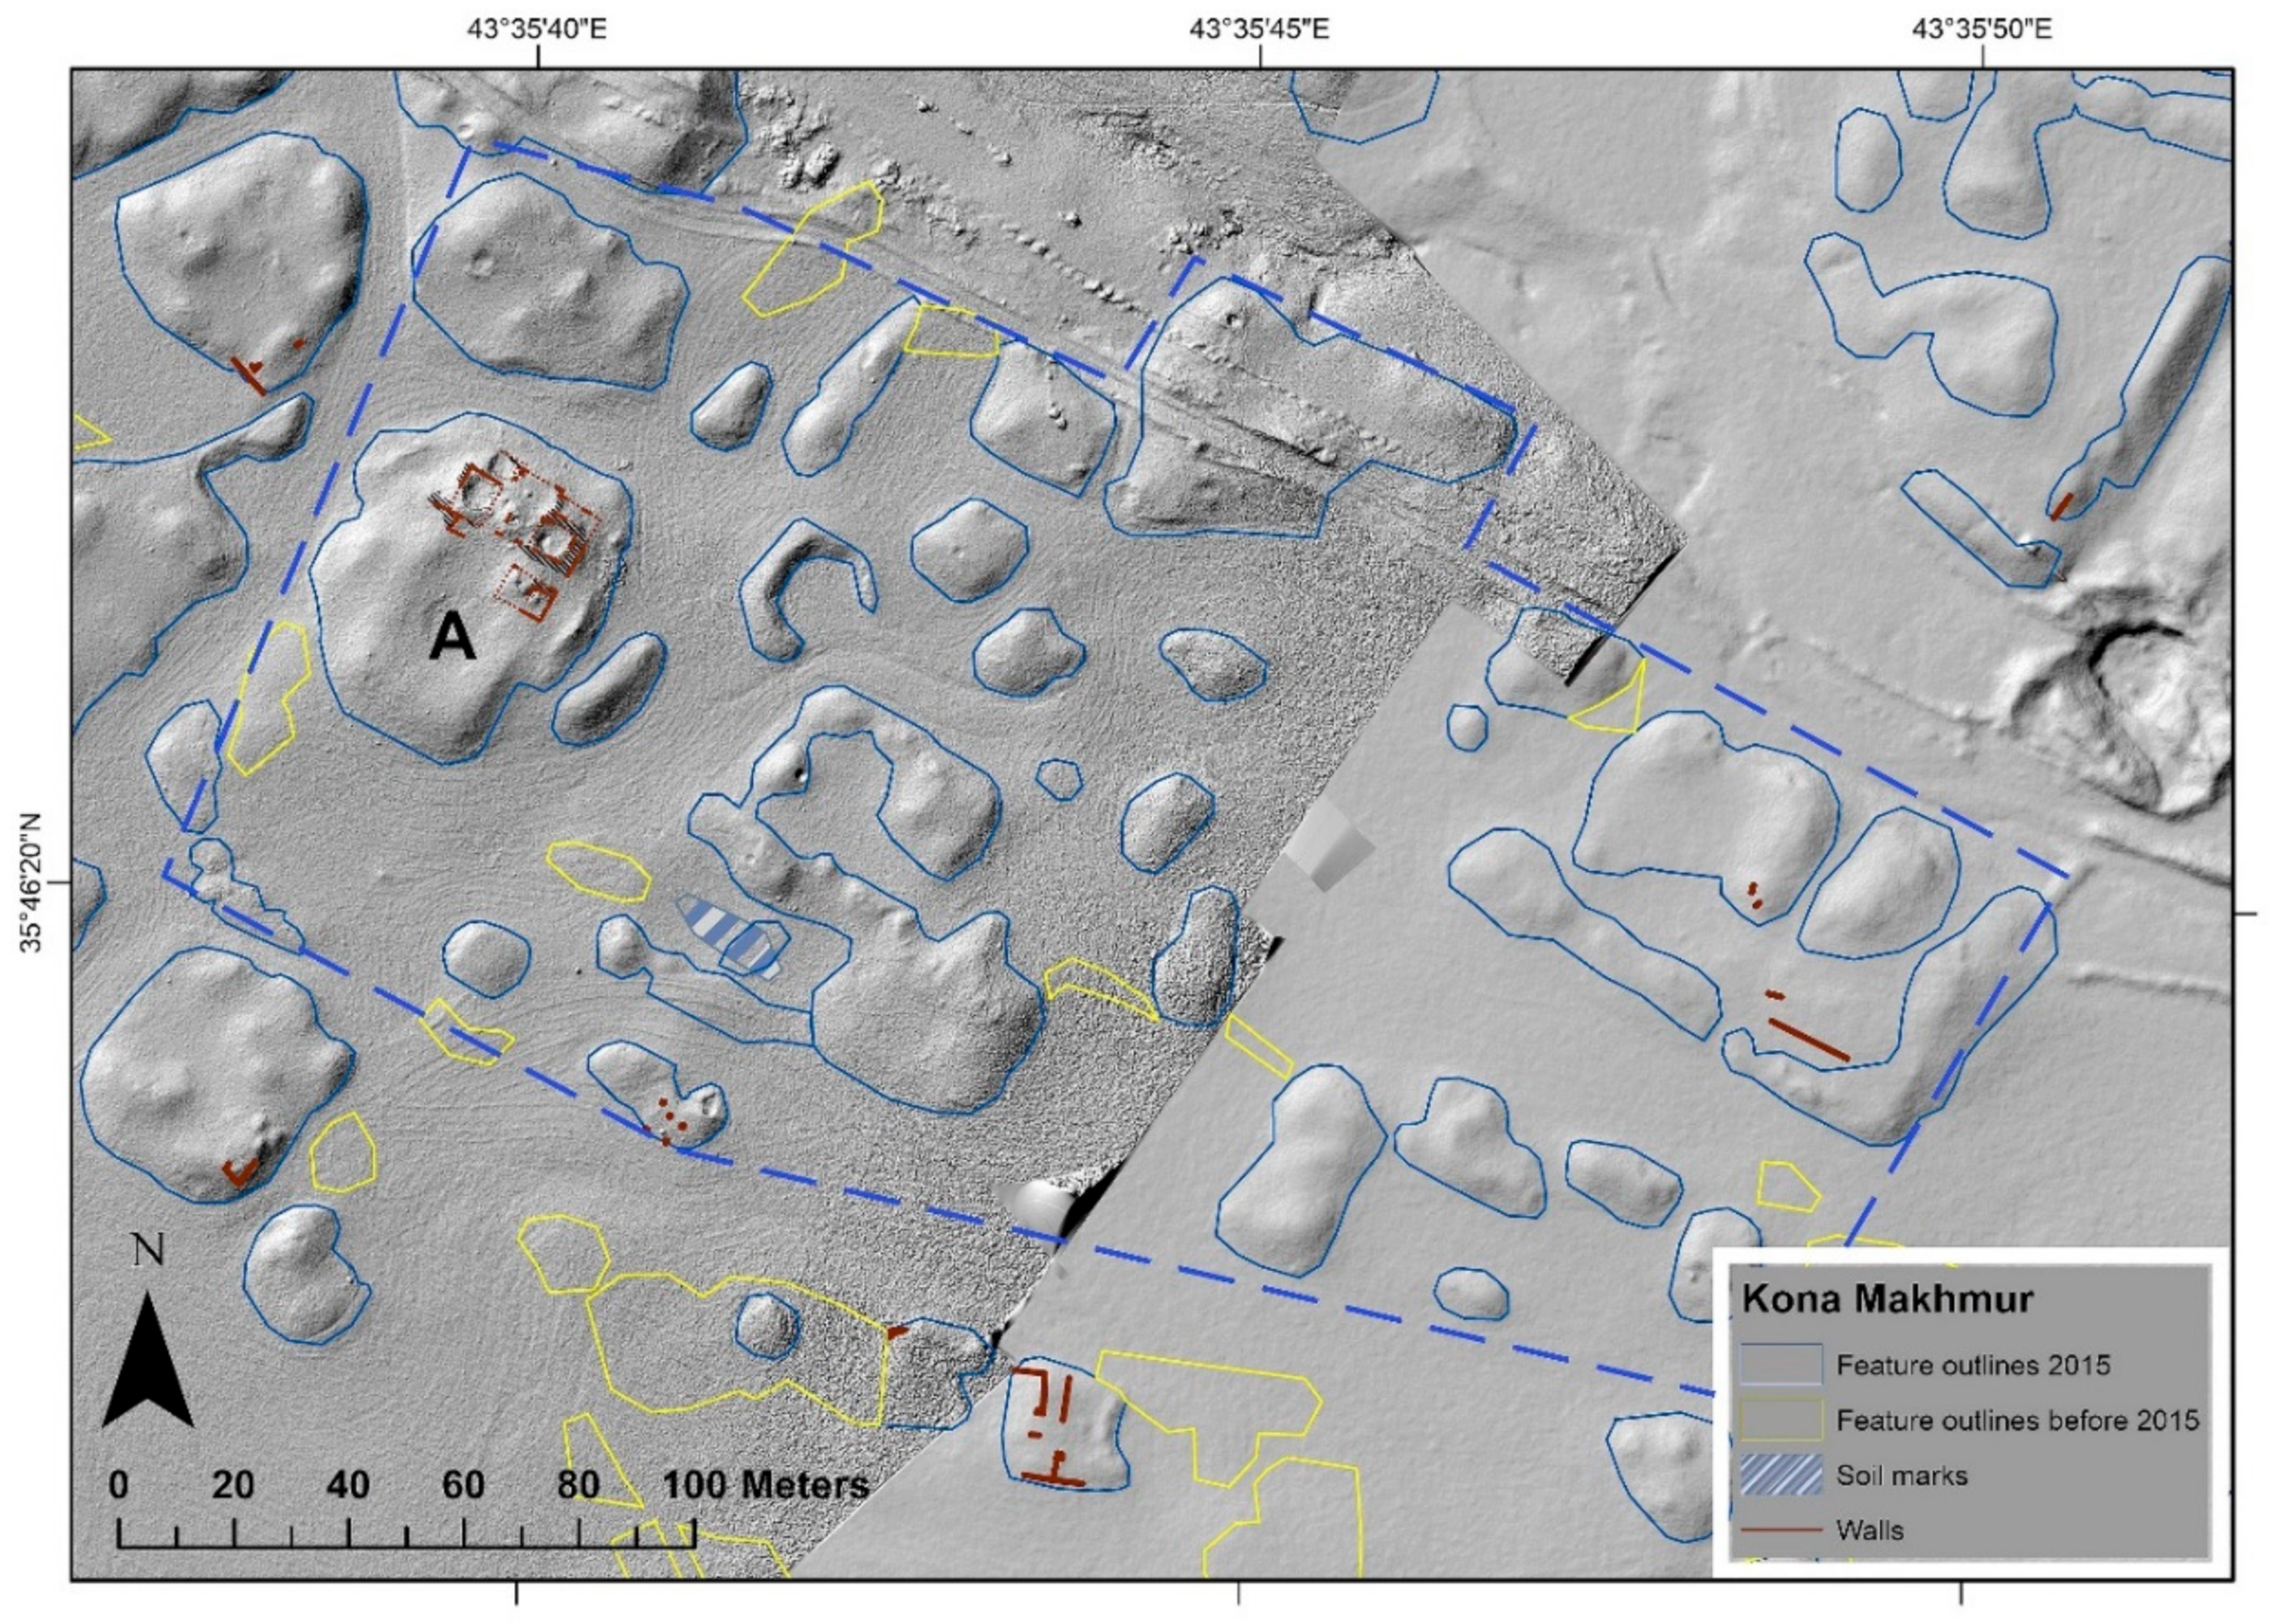
Within the Kona Makhmūr site, experiments with both types of automatic classification were applied but only detected around 20% of preserved above-ground relics. The rate of erroneous detection of non-anthropogenic features as parts of the site was very high. The dry steppe, where the various relics have a very similar spectral classification (based on the soil substrate, the spectrum is more or less at the level of a light brown shade), together with the high variability of the morphological categories of preserved relics placed quite close to each other, represents an inappropriate basis for automatic classification. All relics were, therefore, mapped, digitized, and interpreted manually (
Figure 8). Interpretation in the form of manual identification of feature outlines takes into account the current state of the site and its changes, as well as soil and humidity marks.
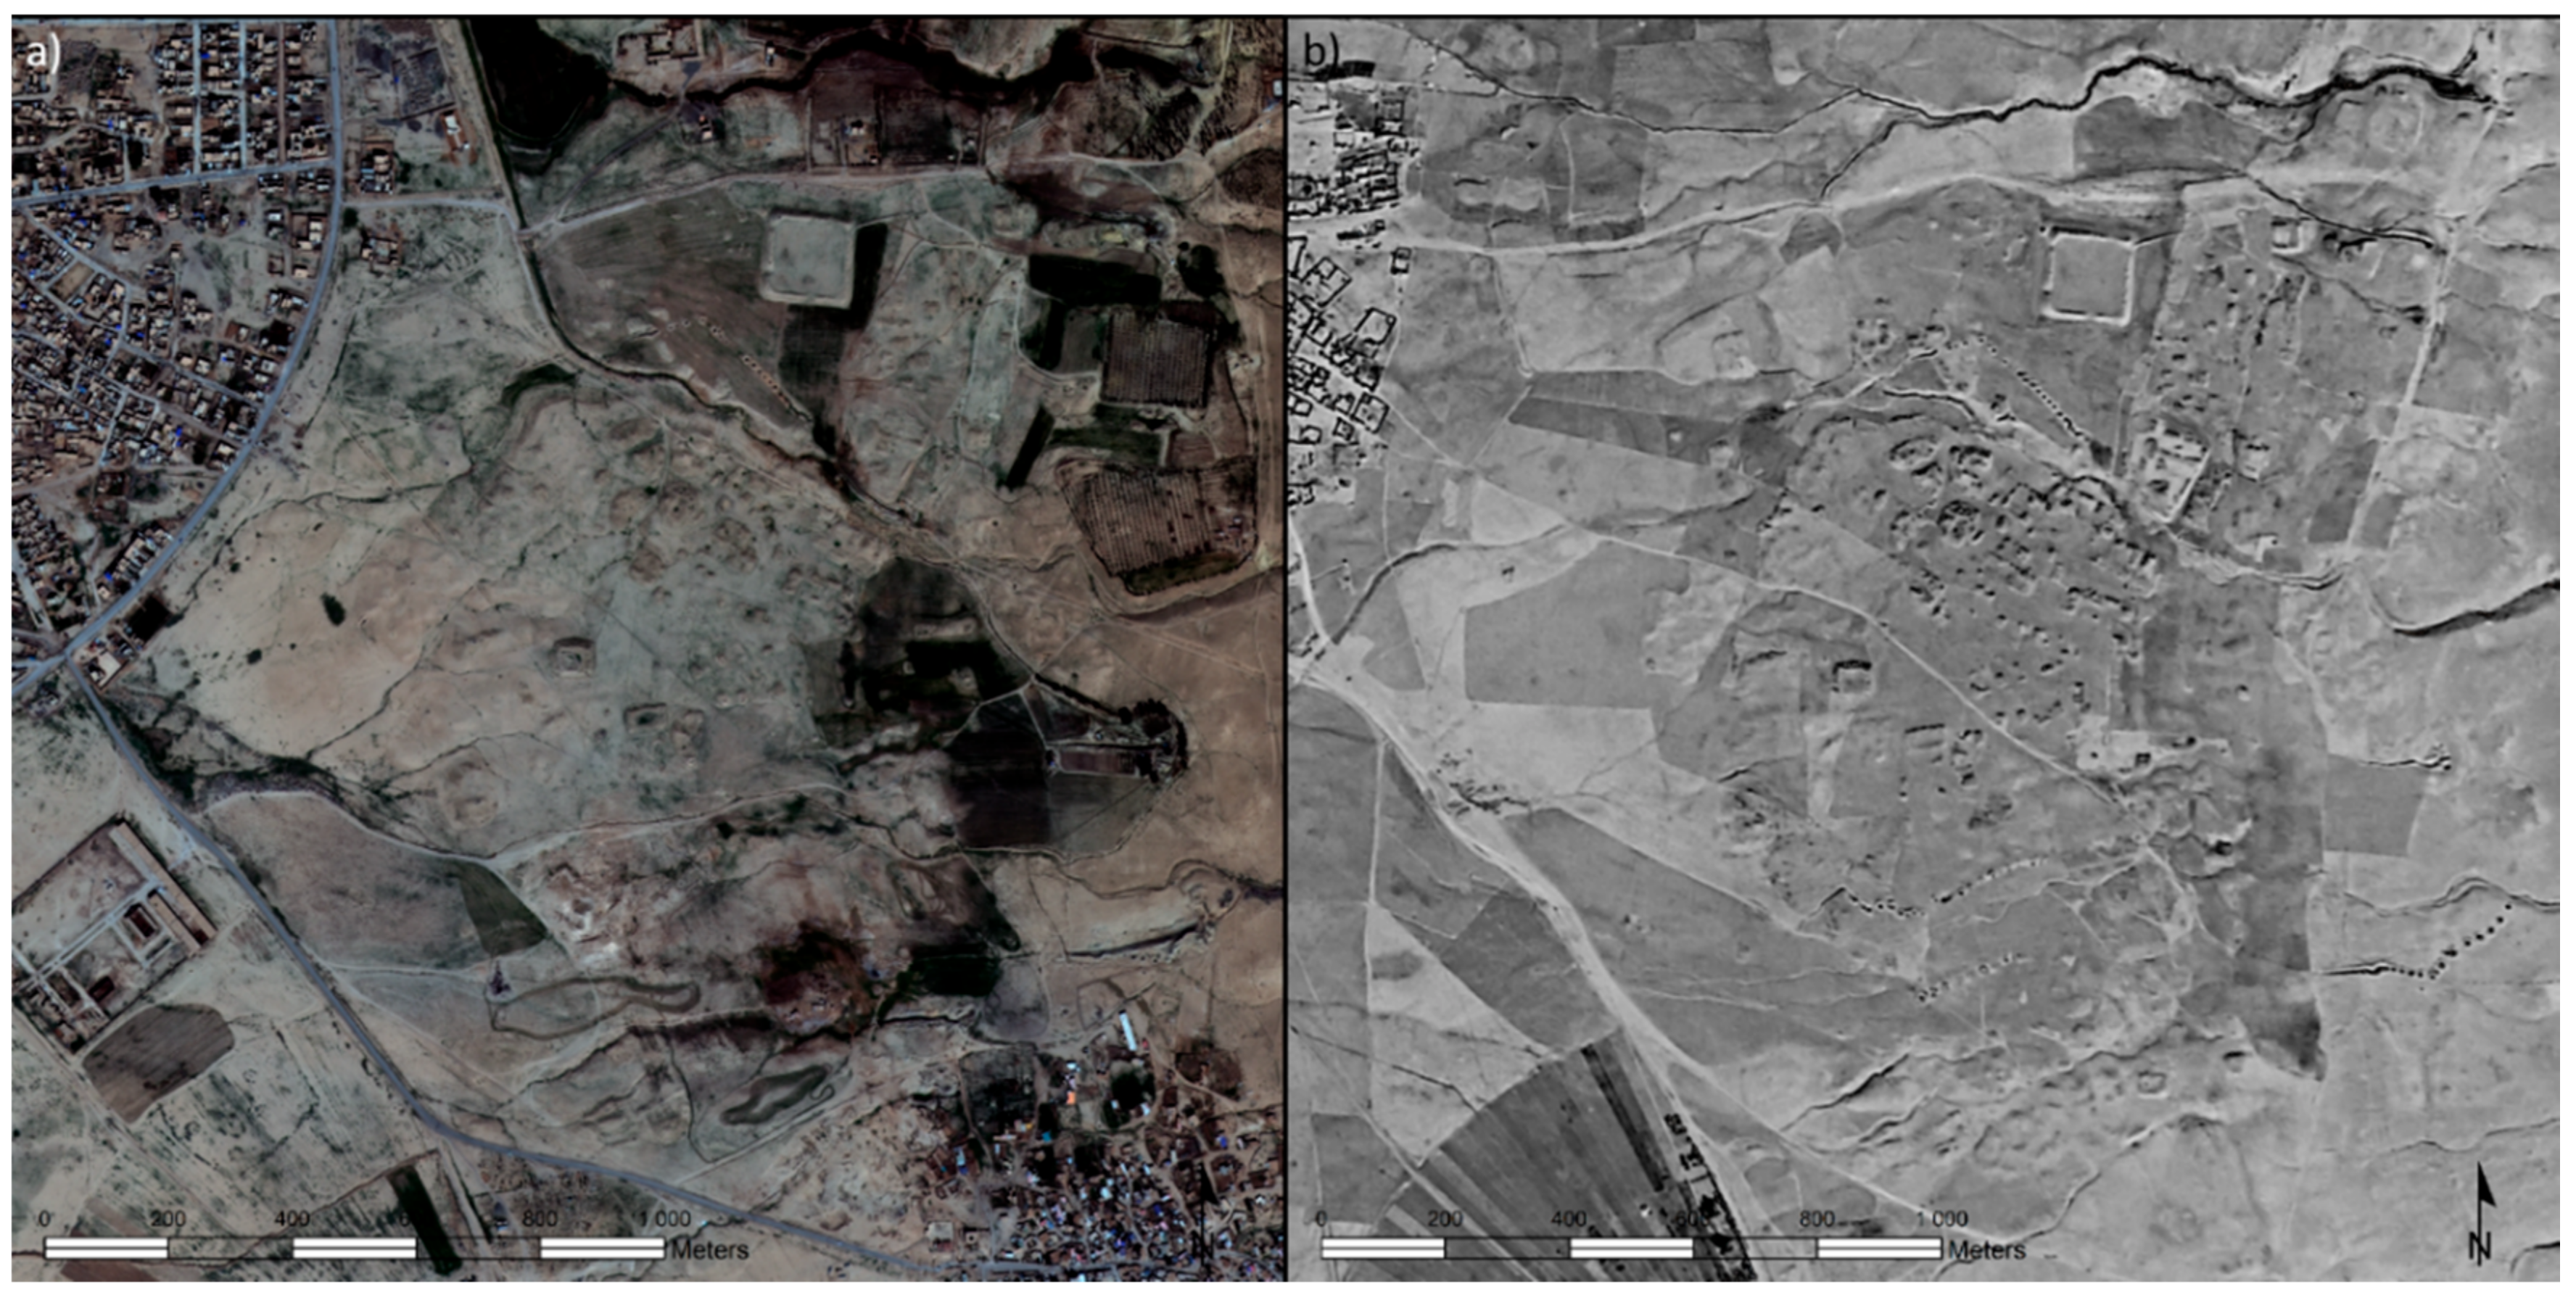
Documentation of Kona Makhmūr was carried out on two main levels: That of the current state of the site and that of the already extinct micro-relief. Historical aerial and archive satellite imagery enabled detailed documentation of complexes of subtle features that have already disappeared. Afterward, it was possible to create a site plan on a much more detailed scale and significantly extend the interpretation of features. Furthermore, it was possible to present the dynamics of the transformation process of the site, situated in typical natural conditions of the Middle East, by monitoring the gradual recession of relics (
Figure 9).
During manual classification, the layers containing elevation information were used as one of the most important bases for successful recognition and interpretation of features. Two types of DEM were created: One to be used as a base layer for orthorectification and the other to be used as an interpretative layer for feature detection and intra-site documentation. The first DEM was generated using a stereopair of Pleiades-2 satellite system; the second was generated from the UAV photographical dataset.
However, the digital elevation model extracted from the Pleiades-2 system proved to be insufficient for detailed in-situ feature detection. Above-ground relics, often preserved only as little elevations, ramparts, and thin lines of stone structures, required a more detailed and precise approach. The best way to obtain proper elevation data when dealing with this type of relic was to use UAV technology (
Figure 10).
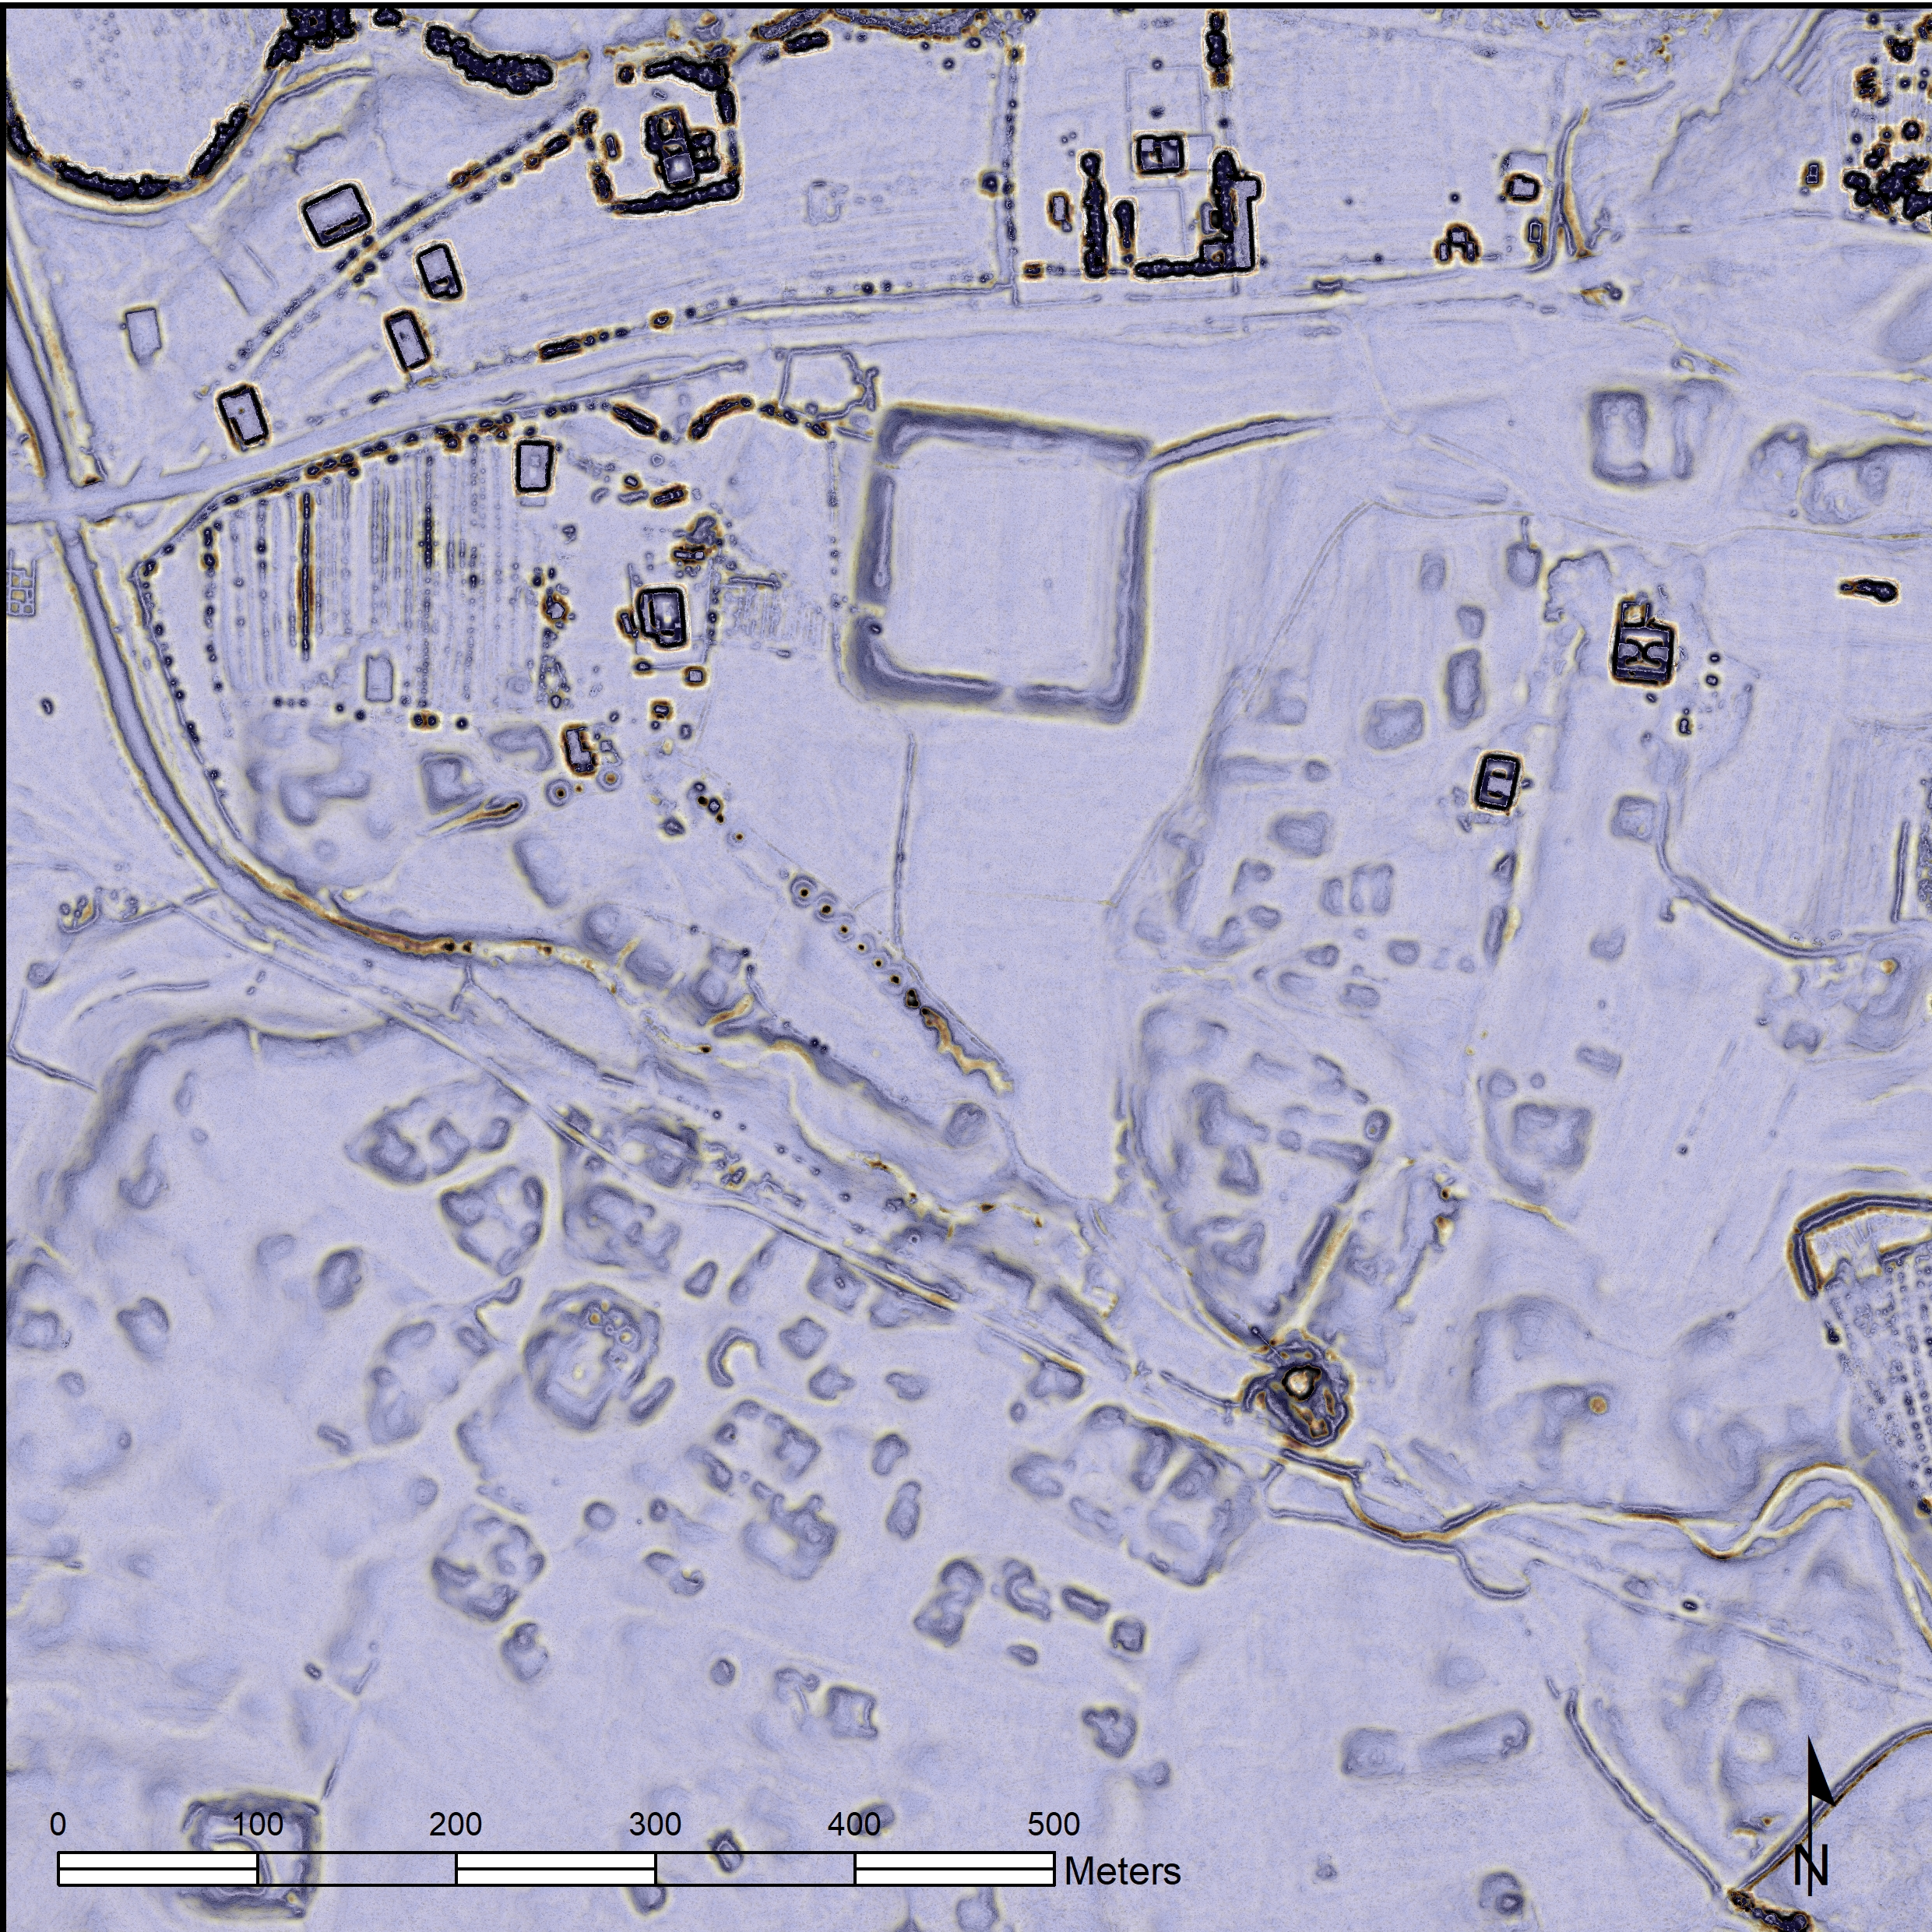
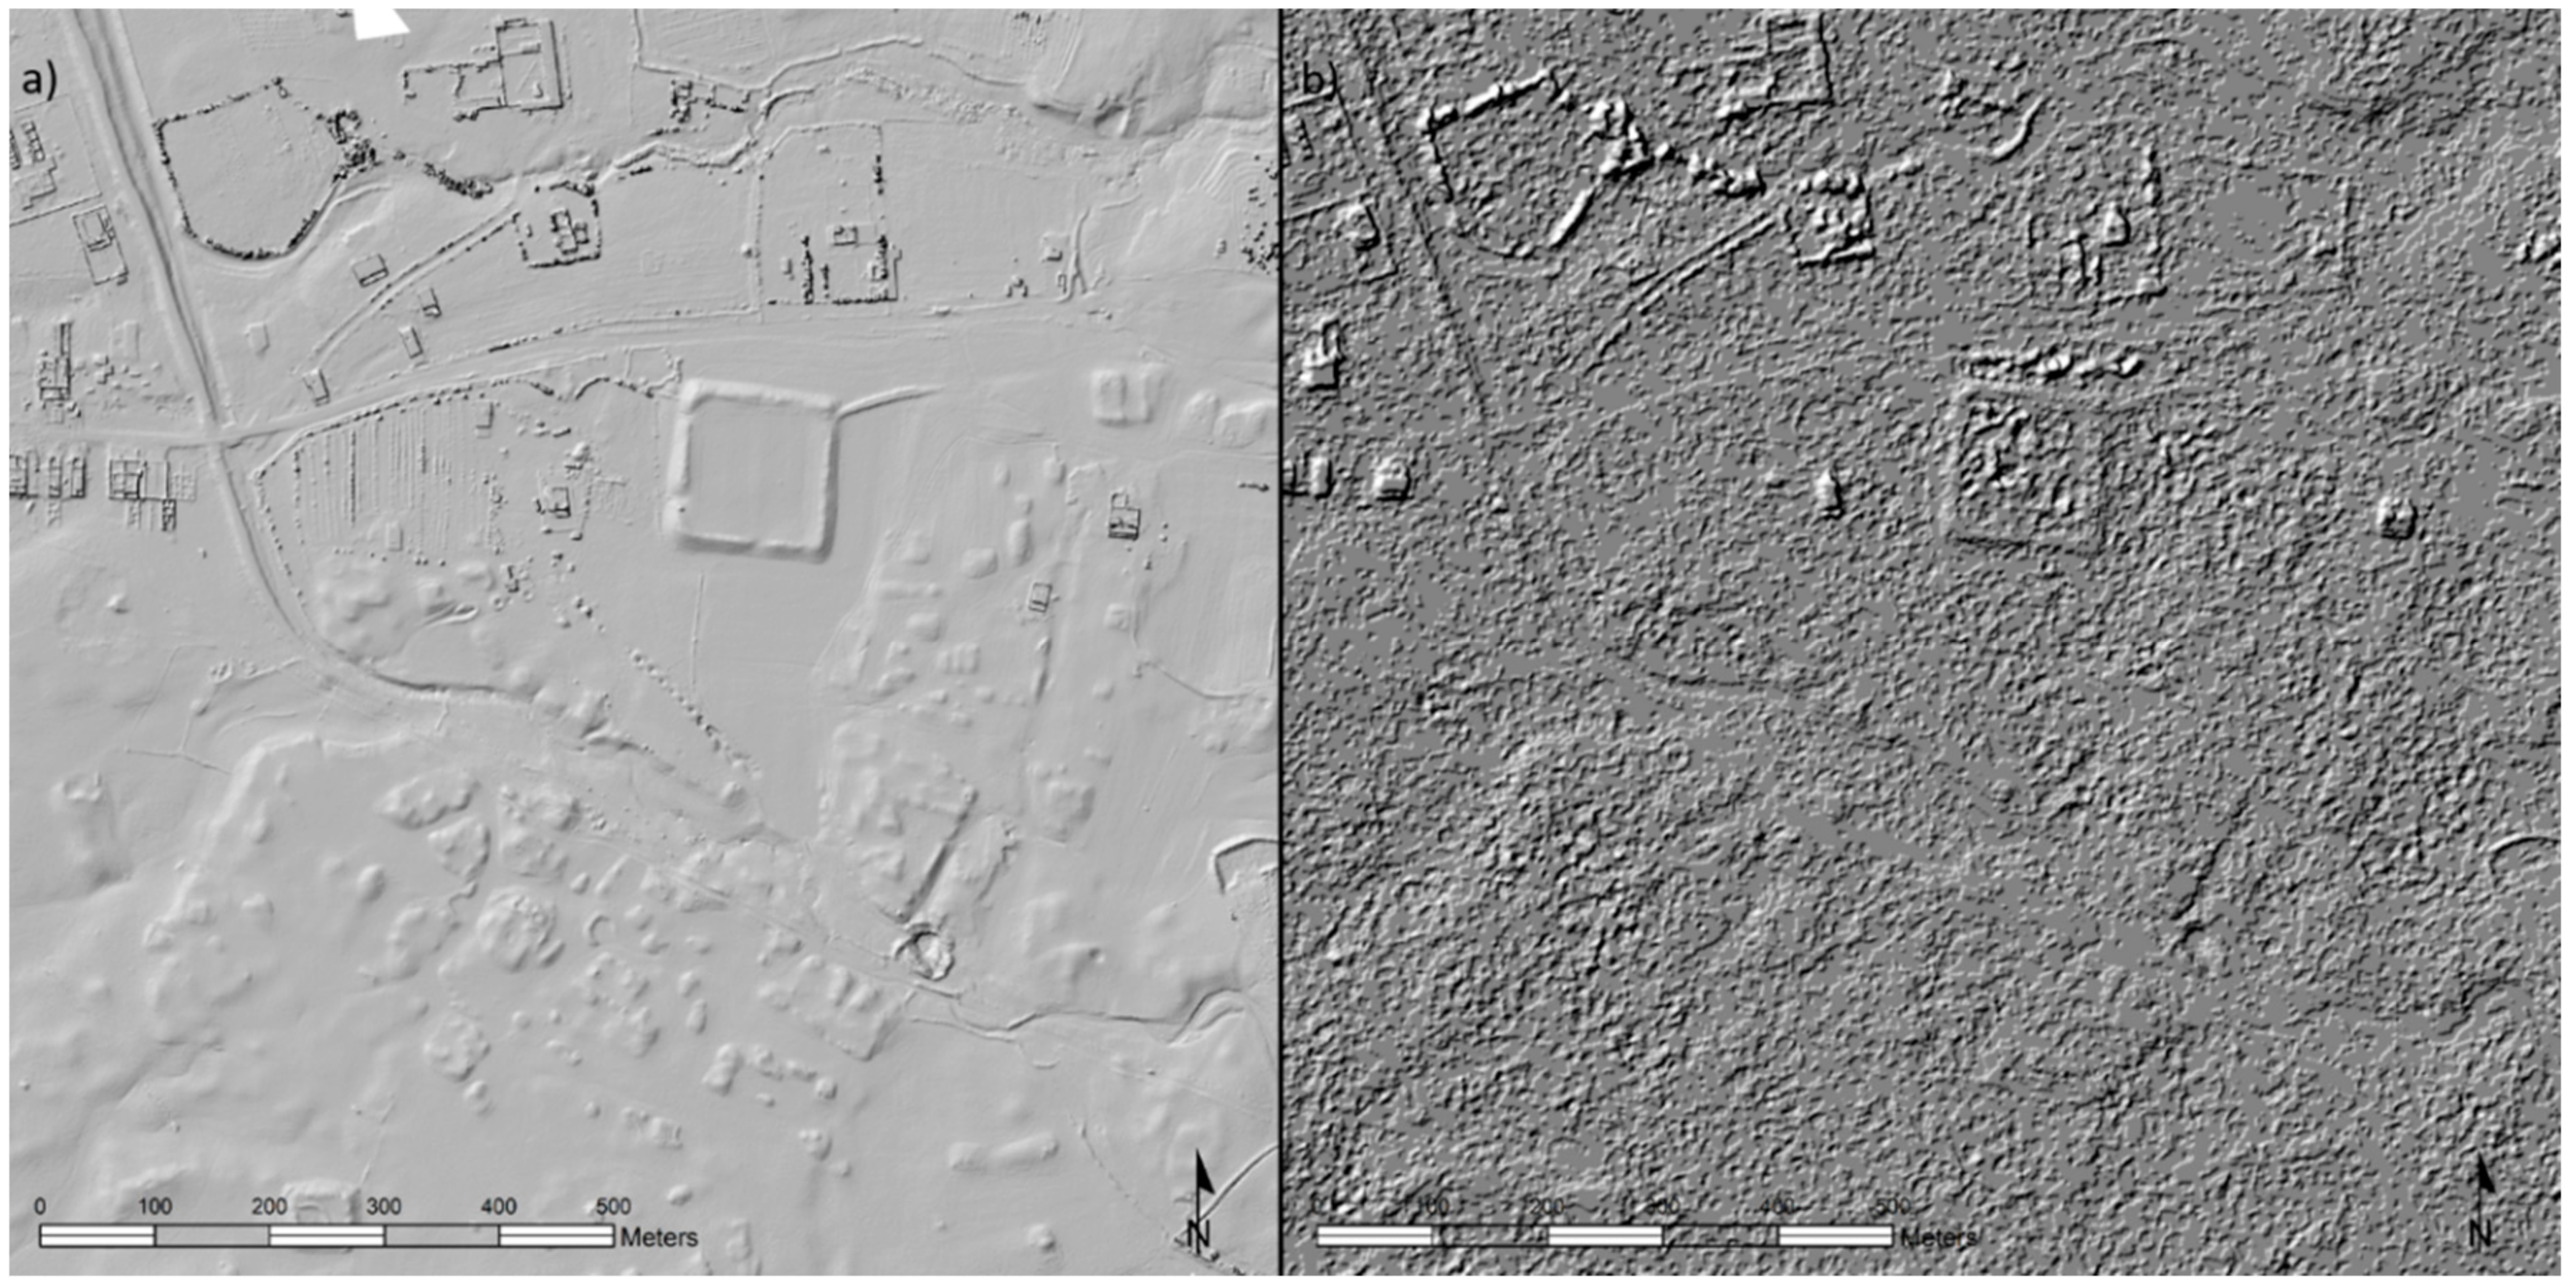
The usage of a DEM interpolated from the UAV photographic dataset greatly accelerated the identification of individual features and, above all, allowed us to identify the preserved parts of the above-ground relics throughout the whole site (
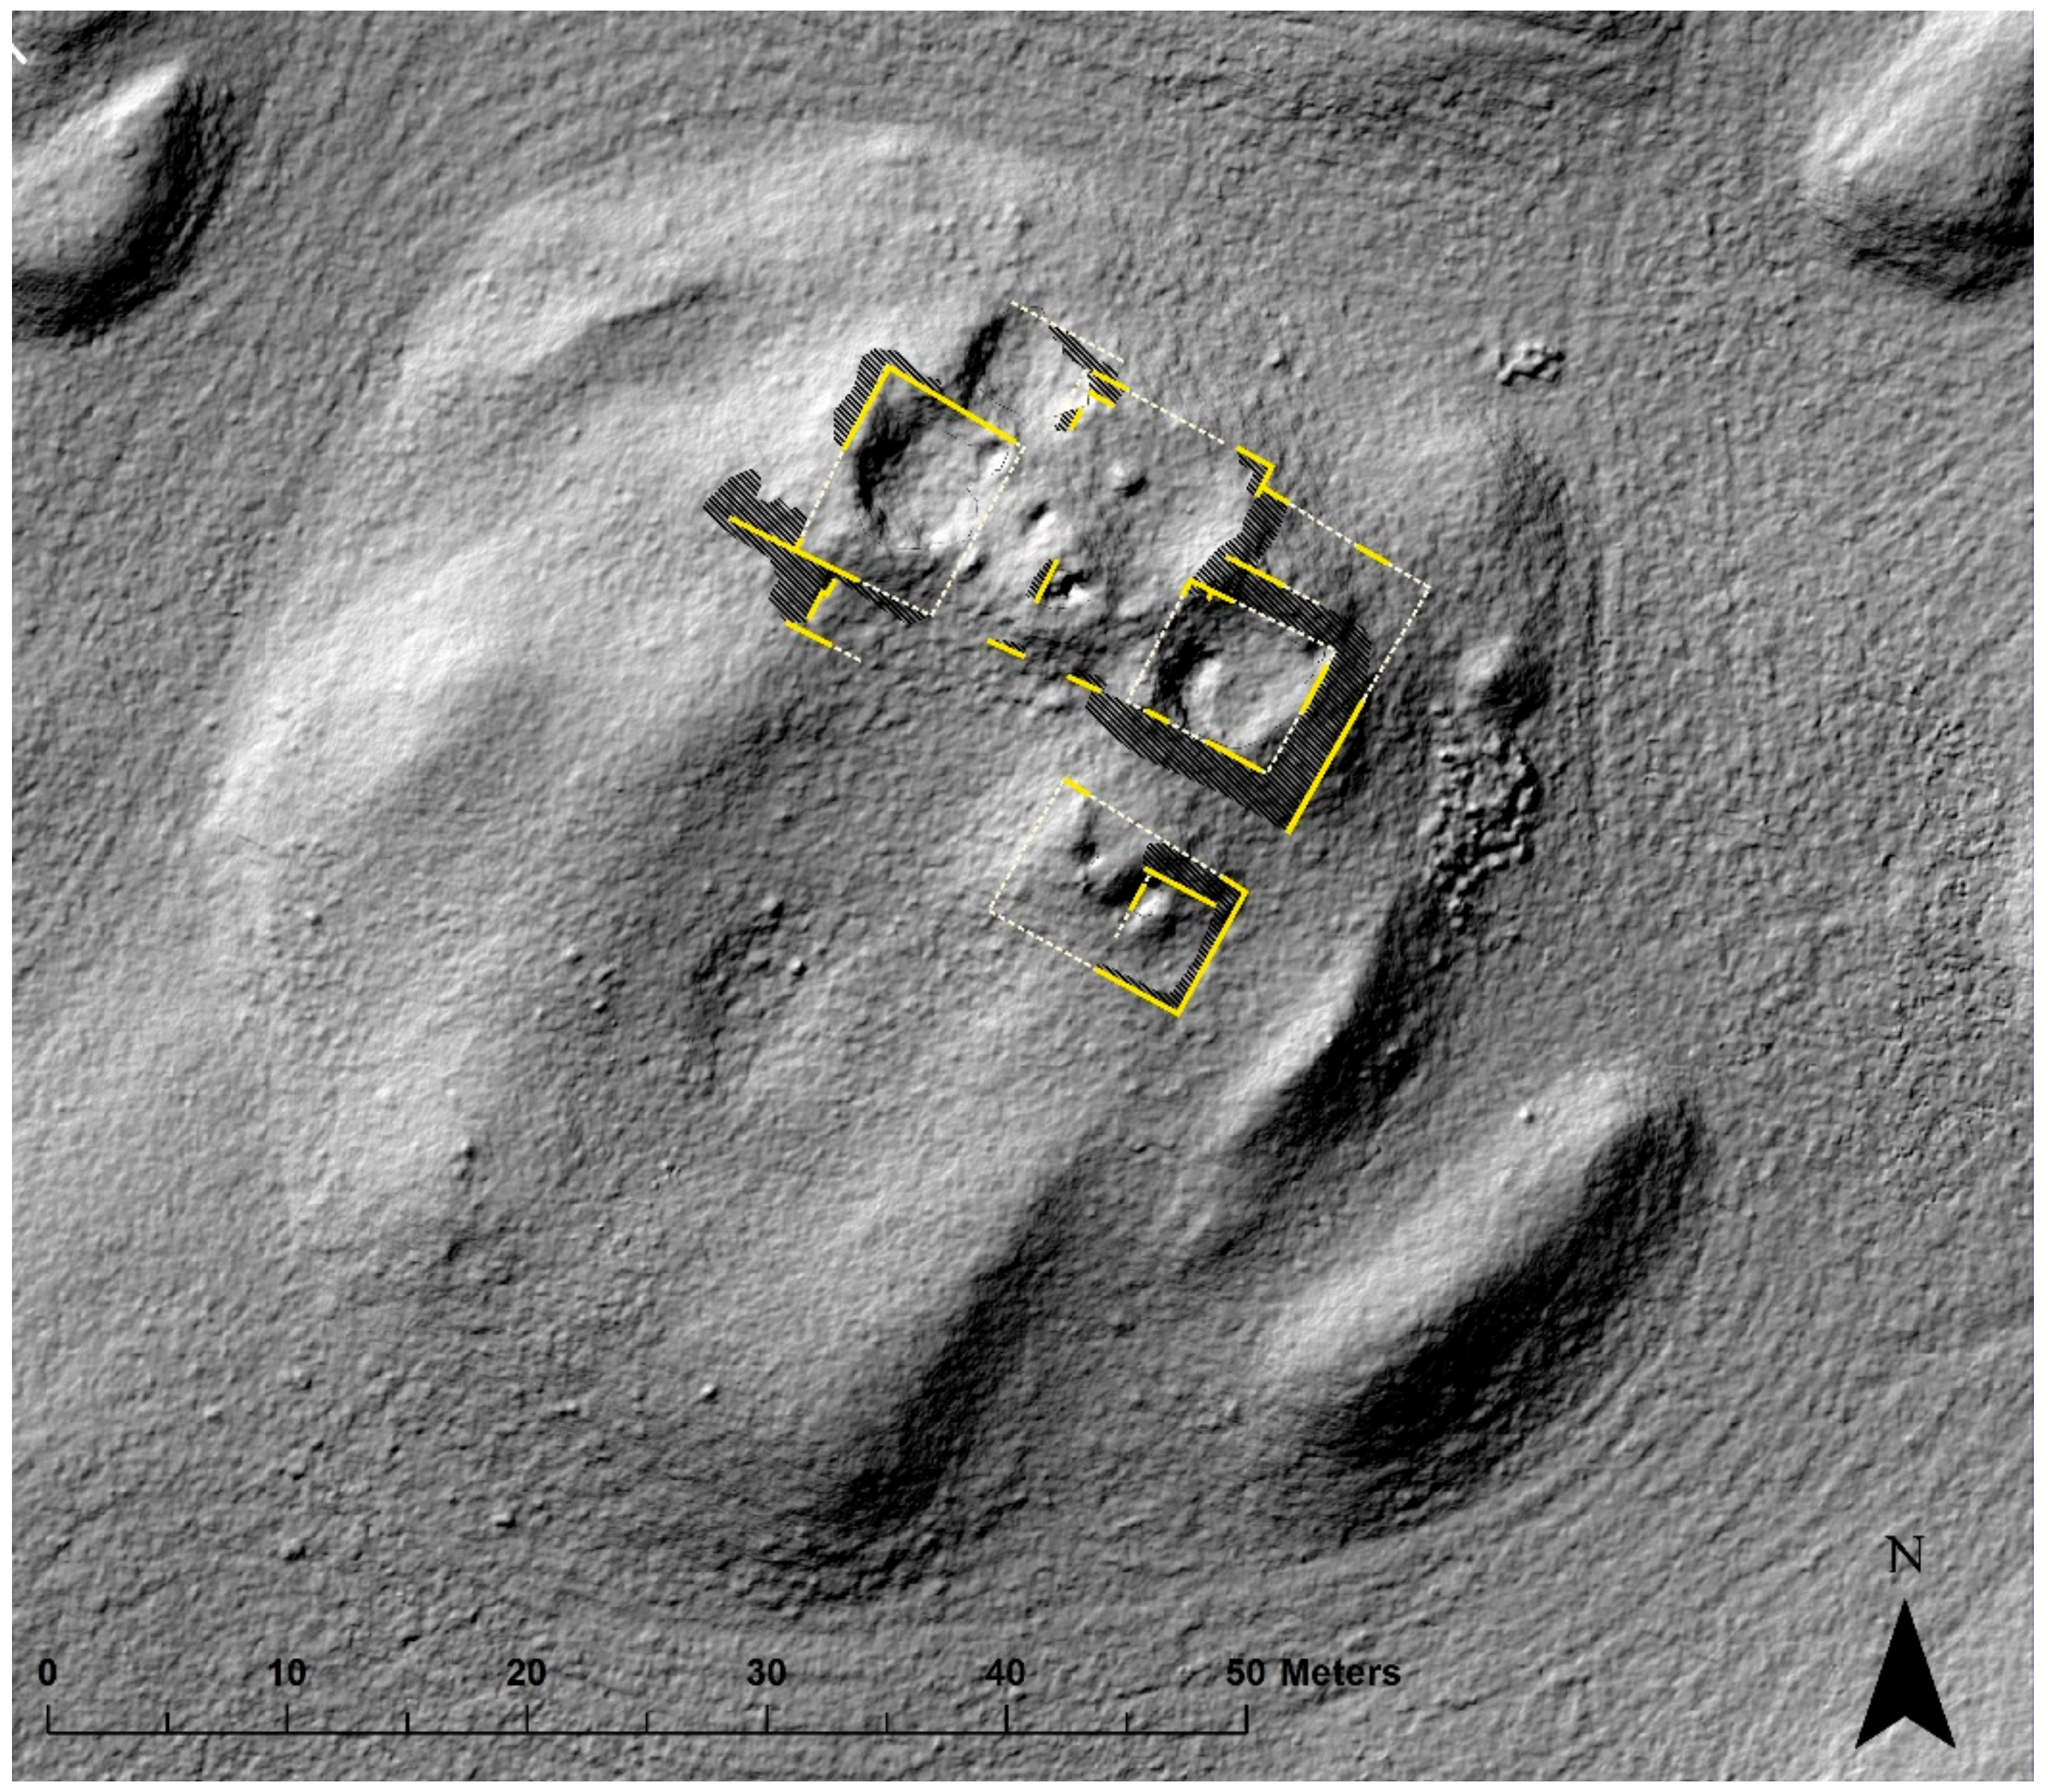
Figure 11). To make the visualization more efficient, the elevation model was generated as a 20 cm-difference digital elevation model for the entire site, with a resolution of 6 cm for selected sections. This resolution, along with the 3 cm resolution of the orthophotomaps, was the highest raster data resolution created within the project. Comparing interpretative knowledge about the site obtained before and after the use of digital elevation data files, it is clear what a significant role they now play in analyzing and mapping large-scale urban sites. The 3D view allowed us to detect over-ground relics, which are difficult to notice in the field and to map them directly into the GIS environment. The mapped line of preserved parts of the above-ground masonry very effectively allowed us to interpret individual parts of the site (in combination with field walking) through nondestructive intervention.
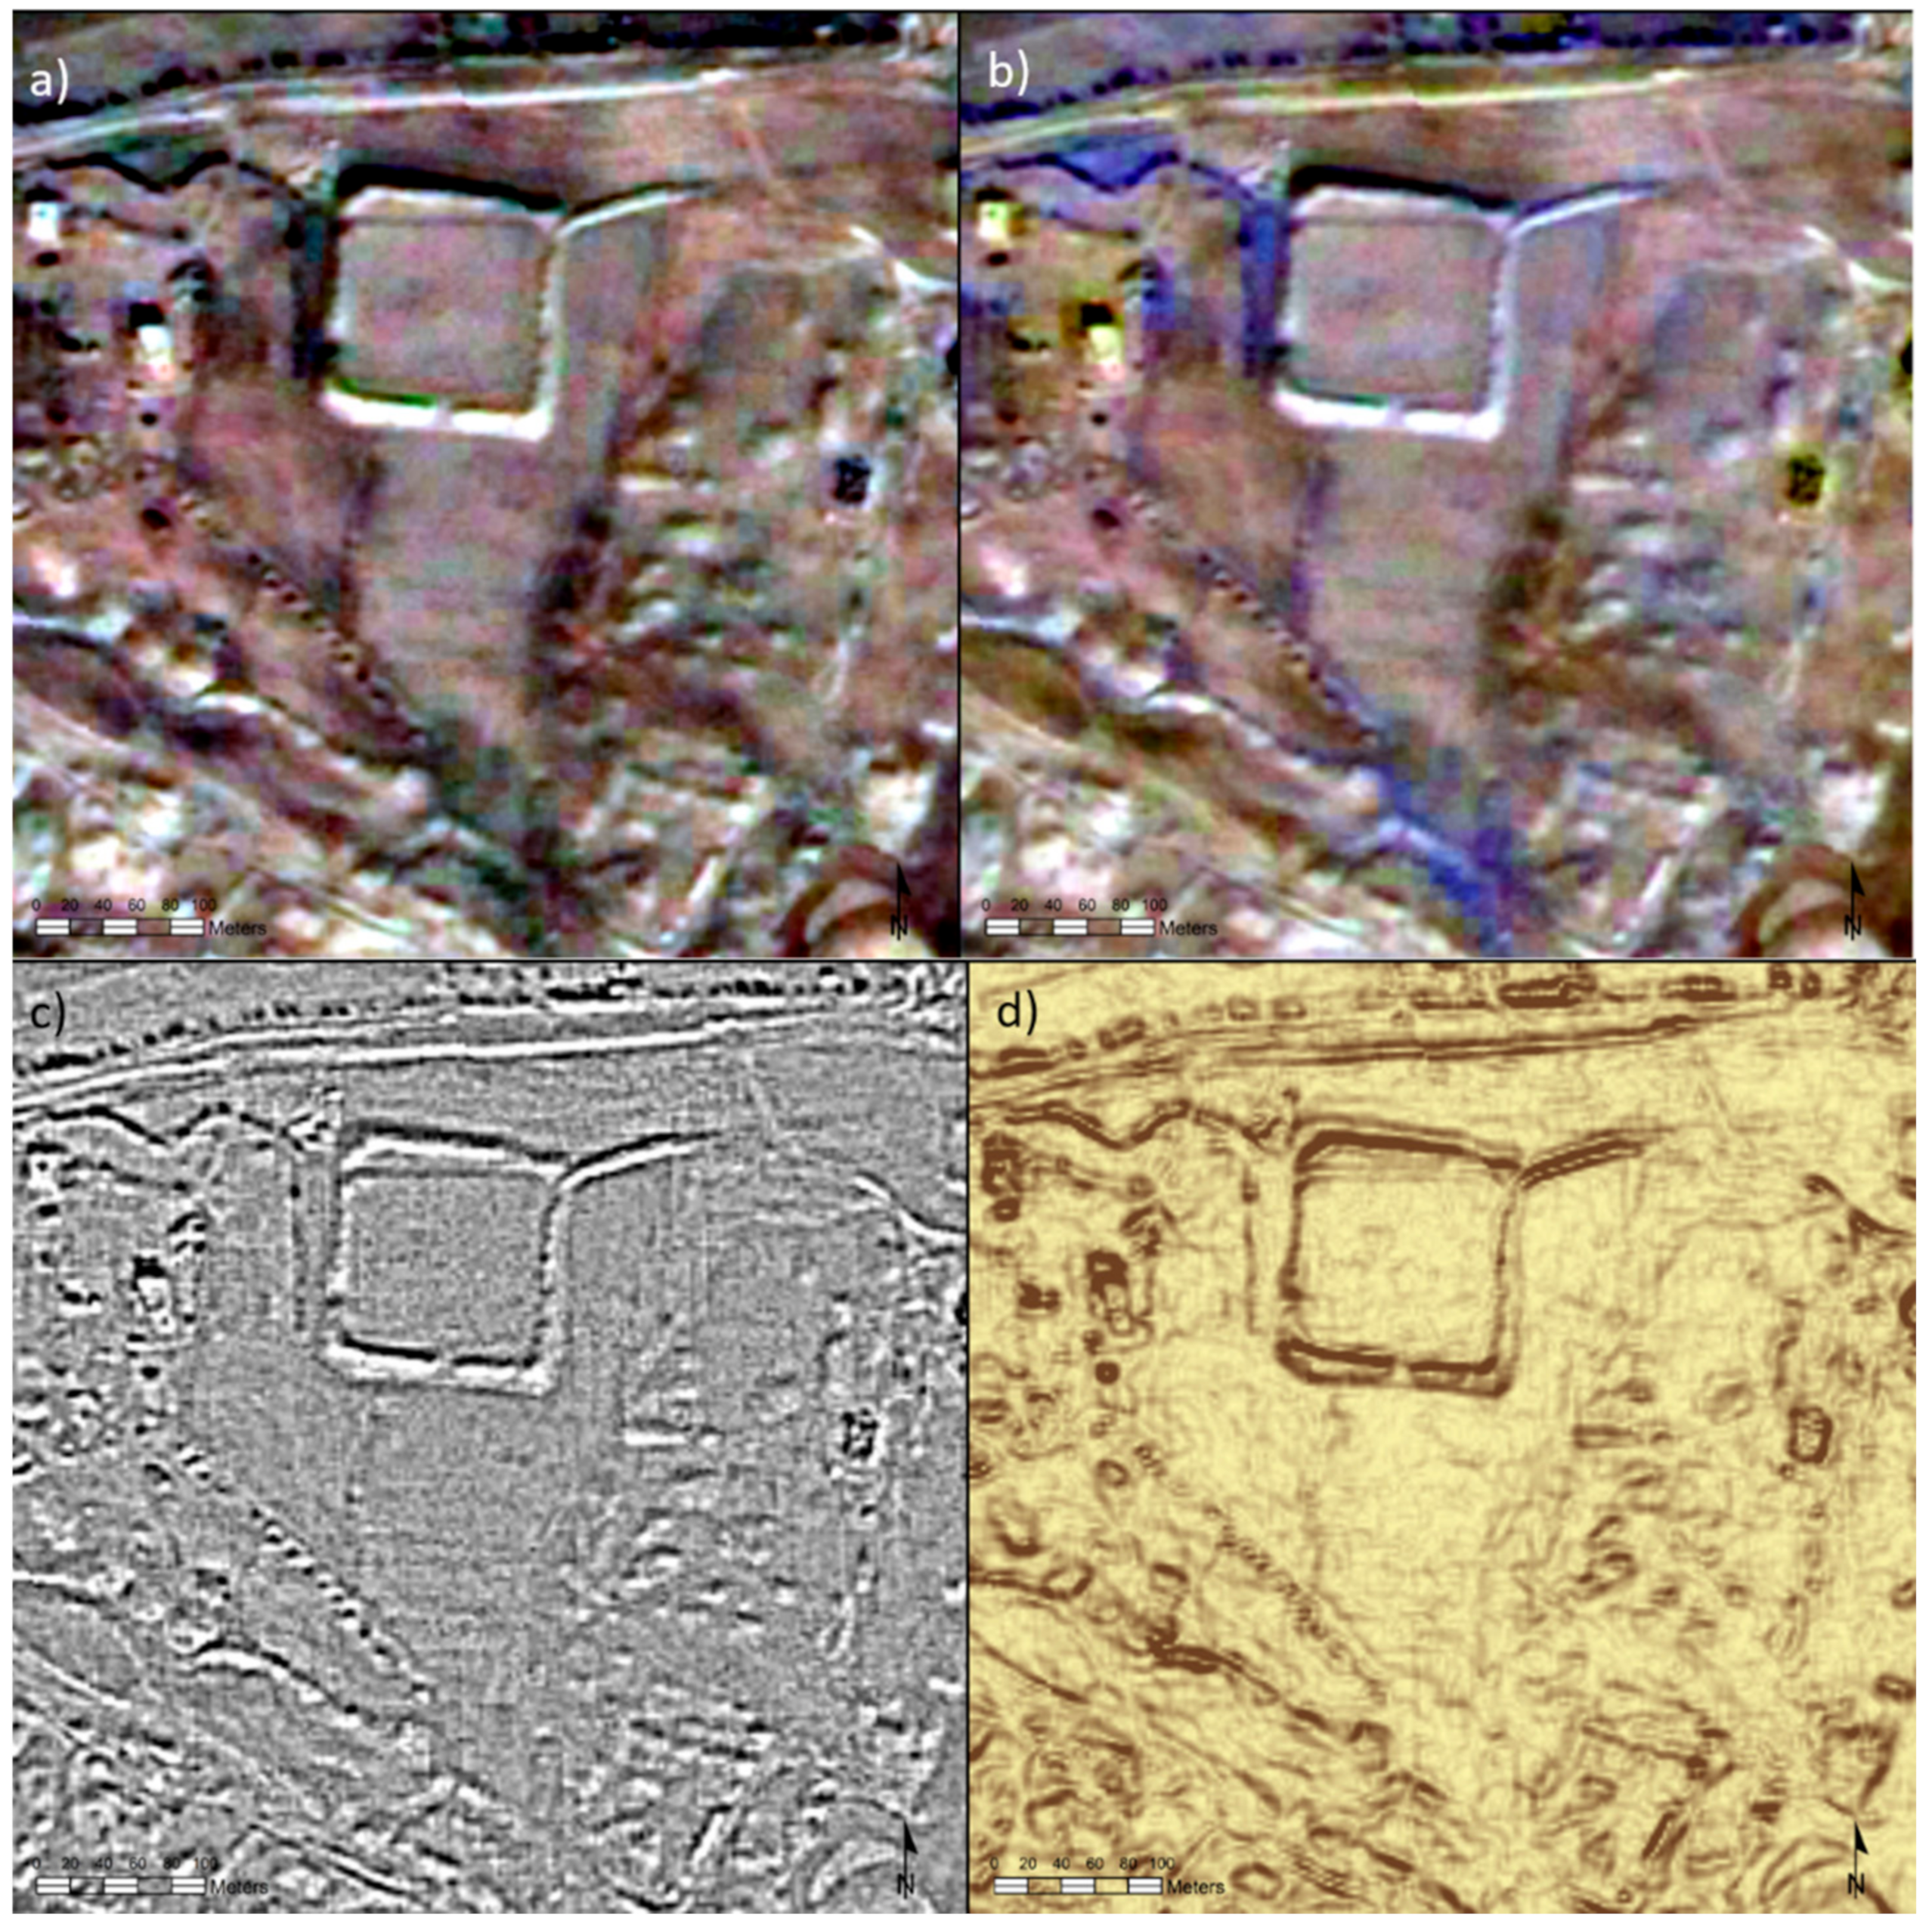
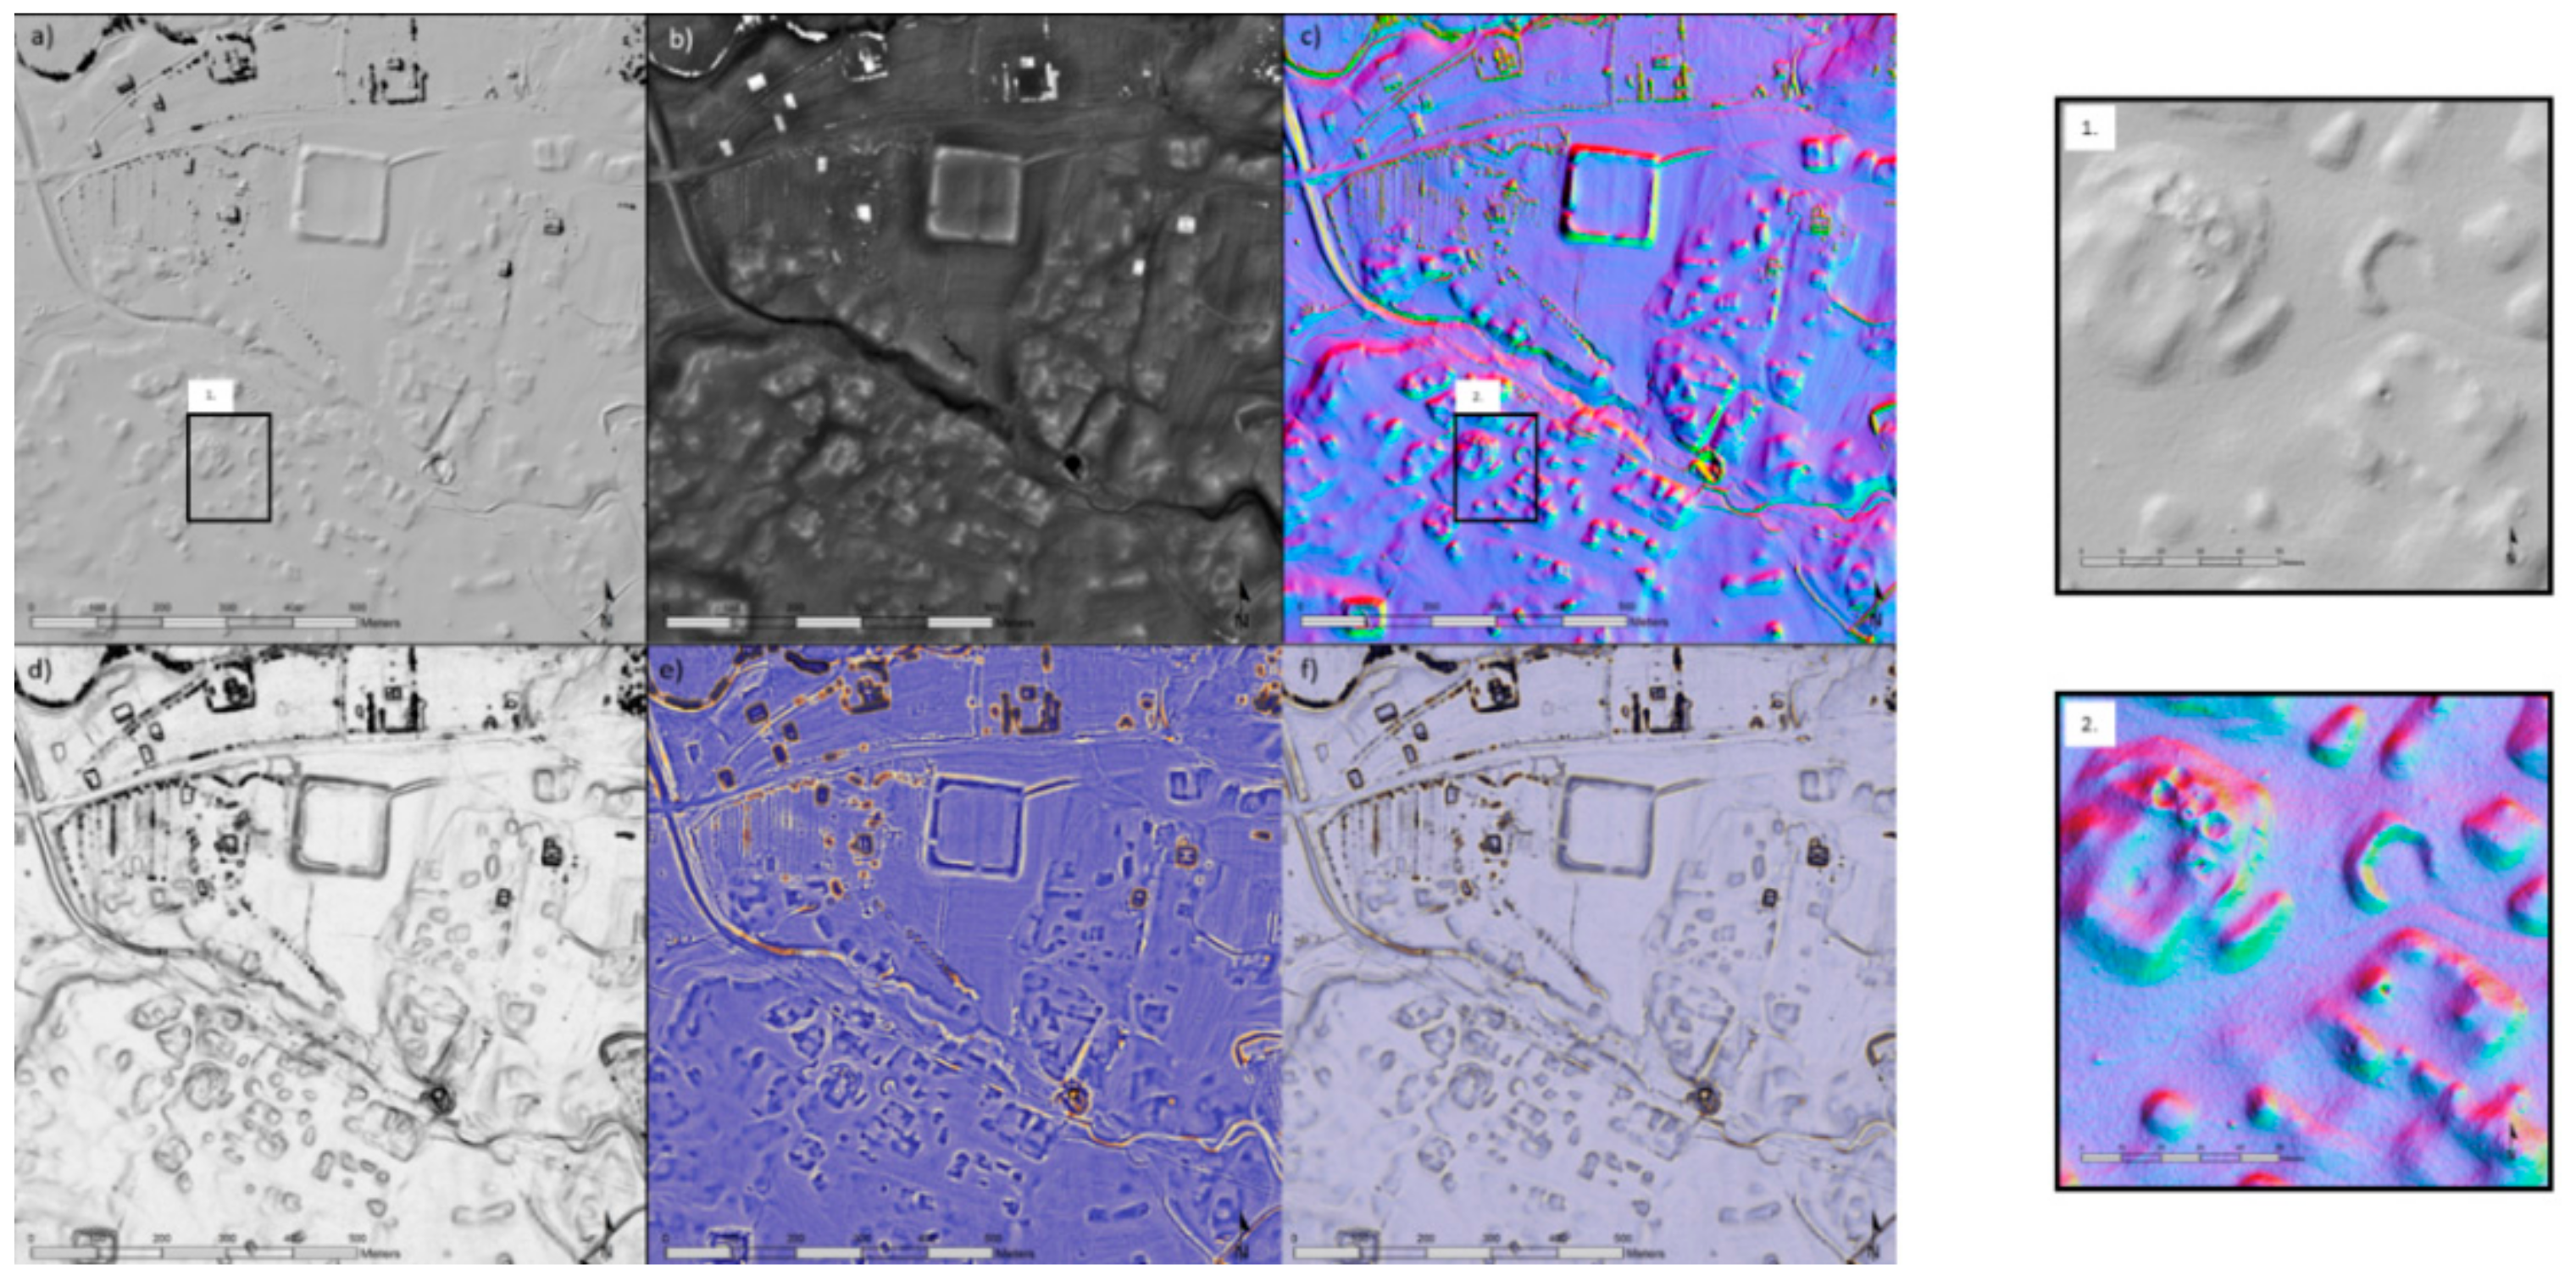
The final step in the high-definition approach was the use of a visualization algorithm to highlight feature visibility. Our evaluation of the use of DEM visualization algorithms clearly demonstrated an increase in the number of features detected (
Figure 12). All applied forms of visualization showed improved visibility of features by manual detection and classification. The total number of detected features increased by 34%, from 128 primarily detected features to a final count of 206 features.
5. Conclusions
The political and social turmoil of recent years is turning Middle Eastern archaeology into much more of a protective component of historical heritage than it has ever been before. Extensive conflicts very often preclude full-scale archeological research: In many cases the only way to document and analyze archeological landscapes is to take an indirect approach based on remote sensing data. To achieve optimal results, it is necessary to combine a larger spectrum of remote sensing datasets—a practice only rarely seen in present-day research [
40,
41,
42].
The use of contemporary remote sensing technologies in archeological research supports broader exploration of the Middle East landscape by focusing on detailed prospection and documentation of monuments on a large scale. In the past, landscape mapping through remote sensing primarily used freely available sources from historical satellite systems (CORONA). Over the last 10 years, the possibilities for site exploration based on remote data have multiplied. The use and availability of high-resolution data (both archive and current imagery) offers the possibility of thorough and detailed site mapping. With access to the archives of the KH-9 Hexagon and OrbView-3 systems, high-resolution historical aerial images from U2 spy planes, the Luftwaffe, the RAF, and the US Air Force, and, last but not least, with the use of UAV technology, the limits of the traditional methodological approach can be overcome and the landscape can be explored in much more detail than before (comp. A. Beck, 2013) [
43].
The Middle Eastern landscape, as a semi-arid type of land cover, offers very convenient conditions for the detection and mapping of archaeological sites through remote sensing data. However, with the development of a wider range of data sources, a more advanced approach to data processing needs to be developed. The use of basic visualization imaging techniques is in many cases insufficient and needs to be upgraded. Applying a wider range of visualization algorithms, together with a combination of the widest range of data and multiple image types, we can detect a notably higher number of features. The method, described here as a high-definition approach, represents a new direction in fine-grained mapping of intra-site morphology. At its core is a multi-temporal remote sensing dataset underlaid by an accurate elevation model, and further consisting of a basic reference layer and other orthorectified layers with minimal topographical and hypsographical deviation. One of the main criteria in this processing approach is the selection of the DEM base layer. The high-definition approach is closely associated with the use of high-resolution inputs as the base layers. The 12.5 m resolution of the 2008 DEM (Alos Palsar) is too low for the accurate processing of remote sensing data (orthorectification) following deep intra-site documentation. To obtain optimal results, it is necessary to implement a DEM with a resolution of under 1 m. Elimination of topographic and elevation deviation is an iterative process requiring repeated re-georeferencing, orthorectification, and adjustment of the metric parameters of layers. In this way, more accurate localization can be achieved; however, there admittedly remains some deviation between the layers, caused by the shadow deformation of the surface.
A multi-temporal remote sensing dataset is an ideal basis for subsequent analyses and the creation of a comprehensive, synthesizing plan of a site. The detailed mapping of intra-site features required to create such a plan is sometimes far from easy. In this case, the semi-automatic extraction method fails, and it is increasingly time-efficient to use manual digitization. During this process, the capture of morphological properties of features is limited by their visibility.
The application of visualization algorithms for 3D raster data of satellite and aerial imaging is an important method to enable a geomorphometric analysis of irregular anthropogenic relief shapes, which are very typical of the Middle East. In the field of remote sensing, visualization algorithms are often used for feature detection within the post-processing of aerial laser scanning data. These visualization algorithms, working on the basis of pixel analysis and segmentation, can be fully and effectively used in the field of satellite and UAV data units. The high-definition approach, working on the basis of a combination of variable databases and efforts to maximize database utilization, precisely includes the procedure of the necessary combination of visualization outputs to detect the highest possible percentage of difficult-to-detect features. The use of the Sky-view factor visualization algorithm, in conjunction with the Local Relief Model algorithm, proved to be the most effective. Through these analyses, it was possible to increase the number of visible objects significantly and significantly refine the morphological parameters of known features or their parts. The ideal output is achieved by combining the results of 3D visualization analyses and filter analyses (especially those involving the Sobel filter).
The high-definition approach, as described above, is one form of detailed in-site analysis. However, in the case of Middle East projects, extensive variability in the degree of feature preservation makes it very difficult to determine a uniform approach. In the case of preserved above-ground relics, fast and effective field documentation plays an important role because of frequent damage to the site due to erosion or human activity. Kona Makhmūr is exactly that type of endangered site. The effectiveness of the high-definition approach is evidenced by the marked increase in the number of detected anthropogenic relics and the refinement of the interpretation plans of the locality.
Given the dynamic development of agriculture, infrastructure, and construction activity in the Middle East over recent decades, as well as the presence of military operations, remote sensing data (especially archive satellite imagery) is one of the most important information sources for the detection of sites that have been partially or totally destroyed. Freely available datasets are most often the primary source base for Middle East archaeological landscape projects, both to provide a basic understanding of the study area and for the initial analysis of the landscape.
The use of remote sensing data is also very important in historical heritage protection. In recent years, the number of conflicts in the Middle East has increased substantially, and many archaeological and historical monuments have come into immediate danger or have already succumbed to acts of willful destruction. Many areas are still inaccessible or subject to limited access. High-definition remote sensing offers an alternative approach for the documentation and analysis of these sites.


