Extreme Rainfall over Complex Terrain: An Application of the Linear Model of Orographic Precipitation to a Case Study in the Italian Pre-Alps
Abstract
:1. Introduction
- ▪
- the rigorous but rather simple mathematical formulation that is inspired by the complex physics of meteorological models;
- ▪
- ▪
- the extreme event of orographic rainfall that was recorded in the case study area.
2. Materials and Methods
2.1. The Linear Upslope Model (LUM)
- An initial condition of WVF vector was defined to initialize the model at coordinate x = 0.
- Considering the local slope evaluated from the elevation profile and the WVF vector, P and E were estimated using Equations (6) and (7).
- The continuity equation (Equation (3)) was considered to retrieve the new value of the WVF vector at coordinate x > 0.
- The operation at points 2 and 3 was repeated until the end of the elevation profile.
2.2. The Case Study of 11–12 June 2019
3. Results
3.1. Convective Nature of the Rainfall Event
- ▪
- CAPE is the acronym of Convective Available Potential Energy, and it is an indicator of atmospheric instability, a necessary condition severe weather hazard.
- ▪
- CIN stands for Convective Inhibition and represents the amount of energy required to overcome the negatively buoyant energy that the environment exerts on an air parcel. The latter is not the opposite of CAPE, but the two indexes give complementary information: when CAPE is high, above 1000 J kg−1 and CIN is low, less −30 J kg−1, the probability of convective triggering is high.
- ▪
- LI (Lifted Index) is the temperature difference between the environment Te and air parcel lifted adiabatically Tp at a given pressure height, usually 500 hPa.
- ▪
- LCL is the Level of Condensation and represents the height where the cloud formation is started.
- ▪
- LFC (Level of Free Convection) is the height where the air parcel can rise-up without external forces and thunderstorms systems can form.
- ▪
- EL (Equilibrium Layer) is the height where vertical motion is stopped and generally corresponds to the thunderstorm cap or anvil.
3.2. The Initial Conditions and the Precipitation Efficiency Ratio
3.3. Linear Upslope Model Applied to the Case Study
4. Discussion
- ▪
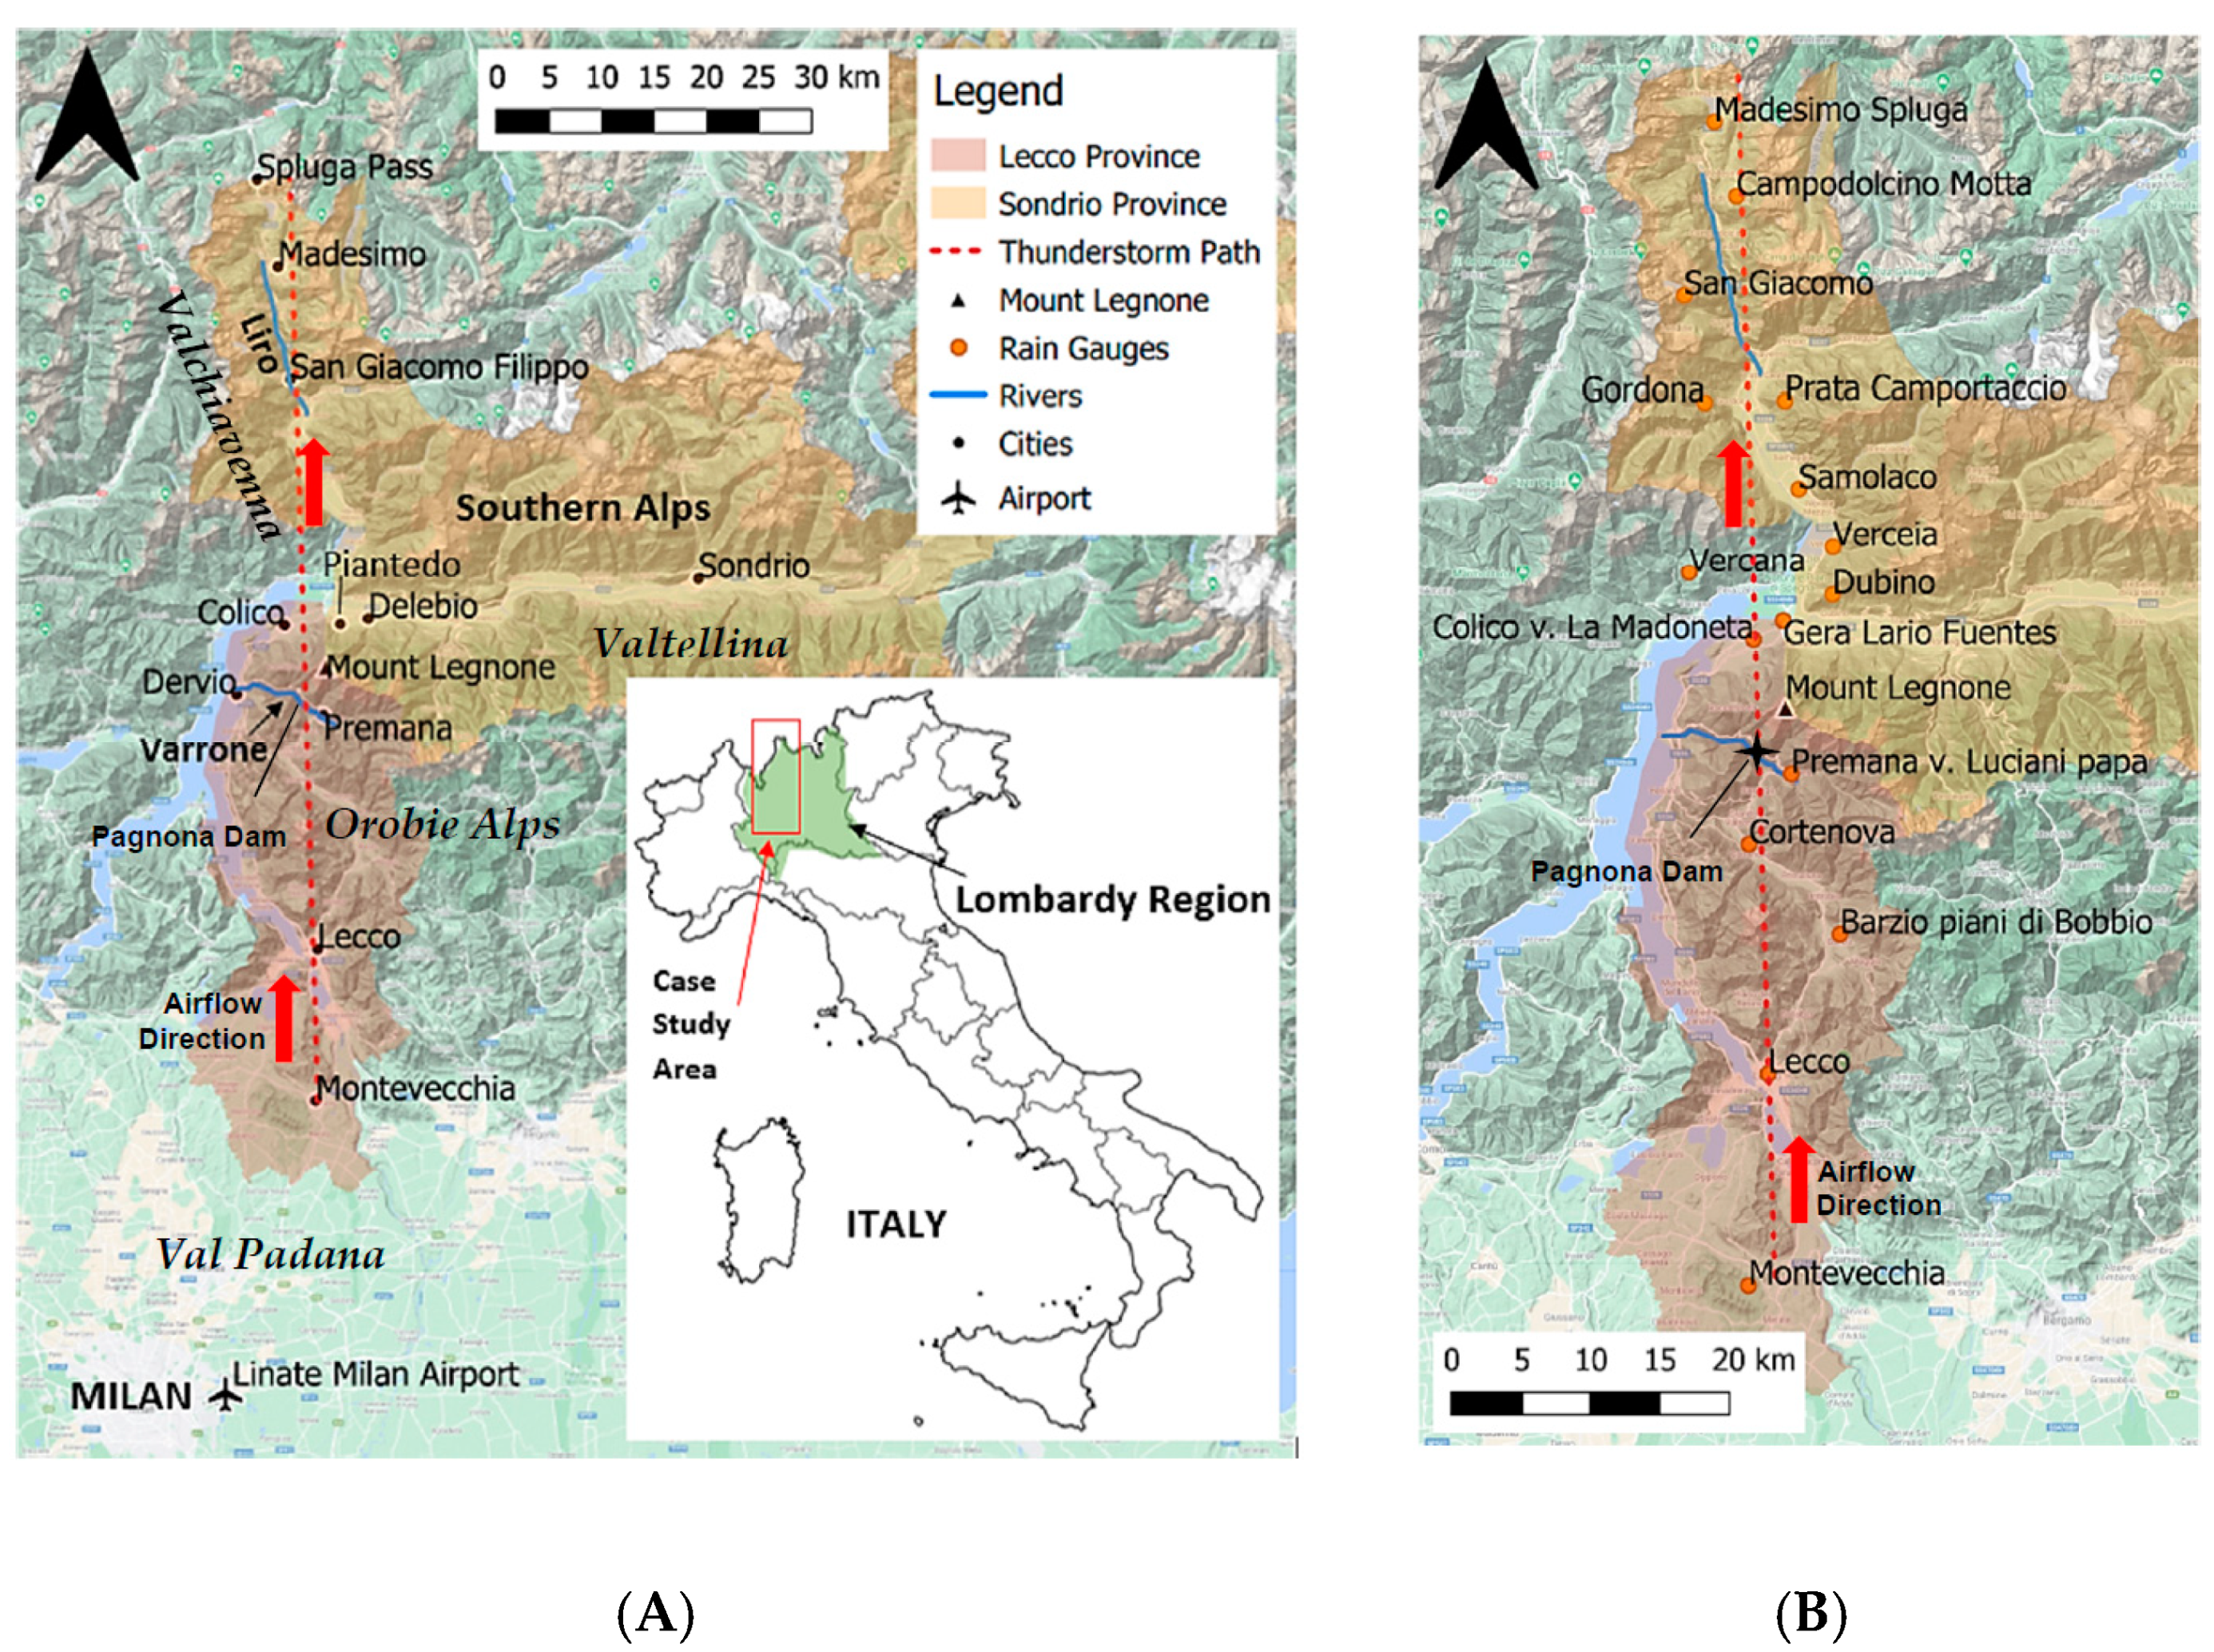
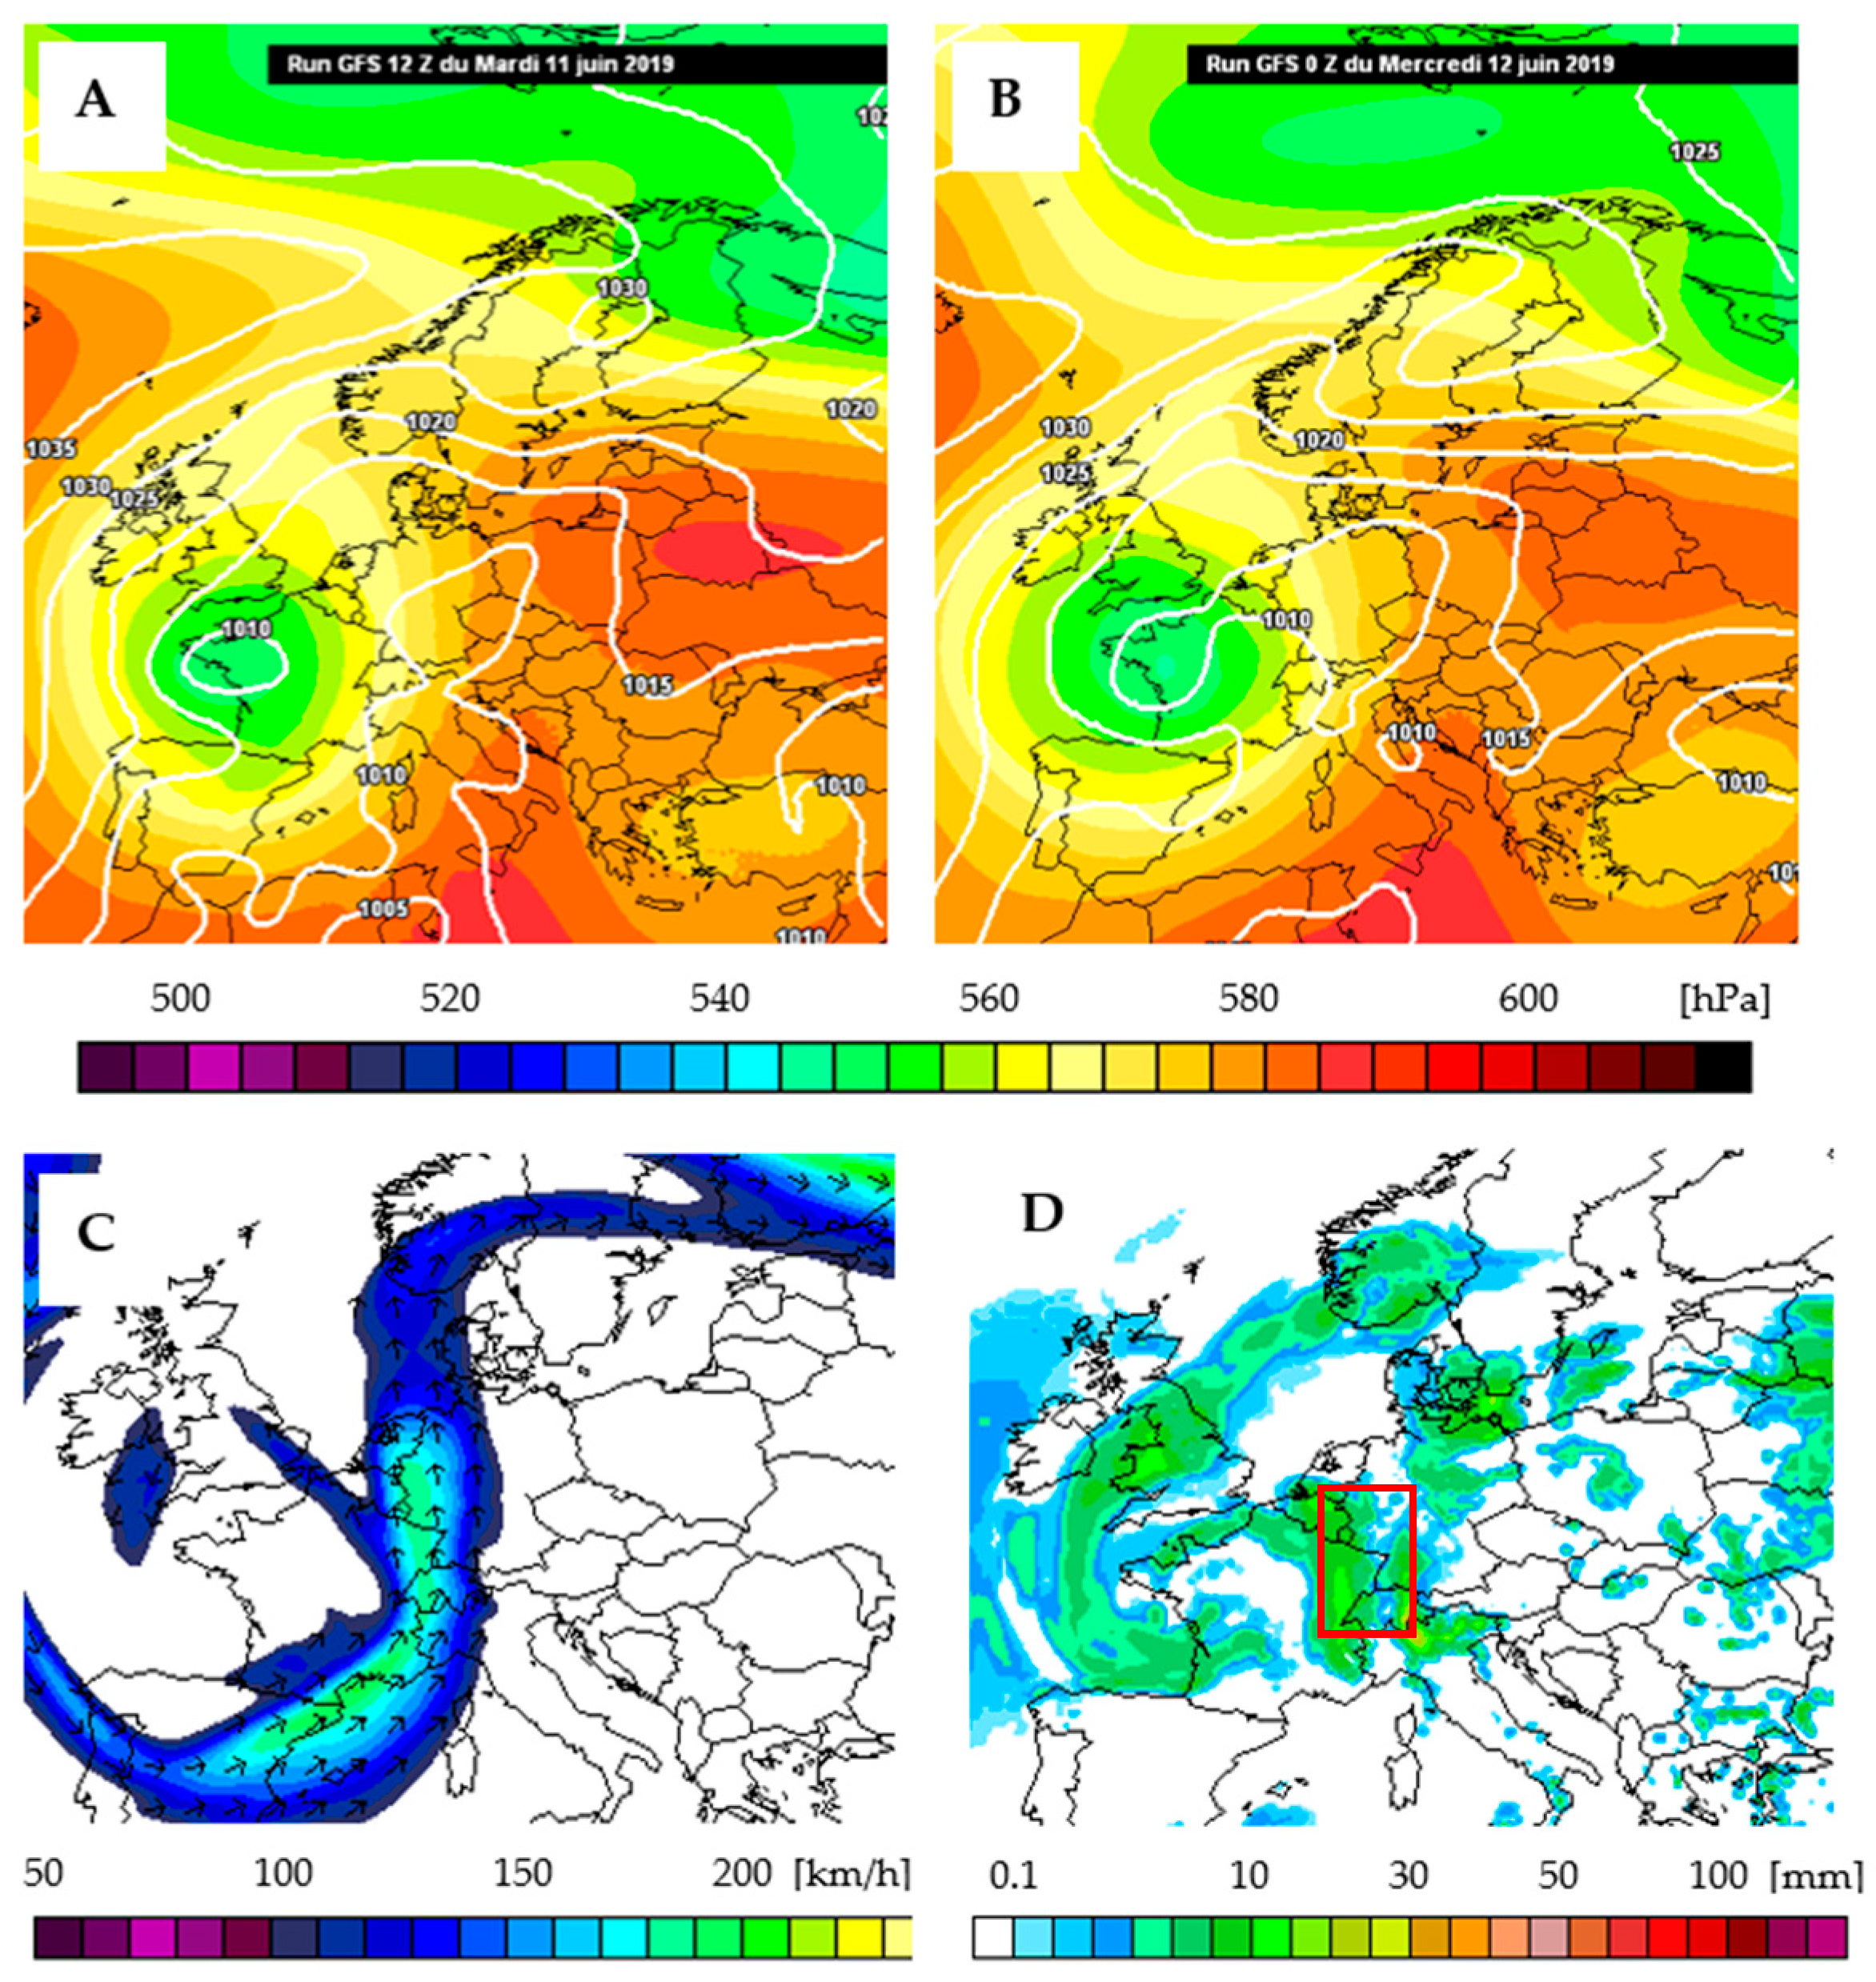
- The mono-dimensional domain is a strong idealization of the event that occurred. The sounding data compared to a local LAM depicted an event that developed northward following a narrow cone extension. The thunderstorm corridor had a clear starting point, an average width around 10–15 km but to an extent of 100 km. Therefore, also considering the low-level wind convergence (Figure 3), a mono-dimensional reduction was sufficiently realistic.
- ▪
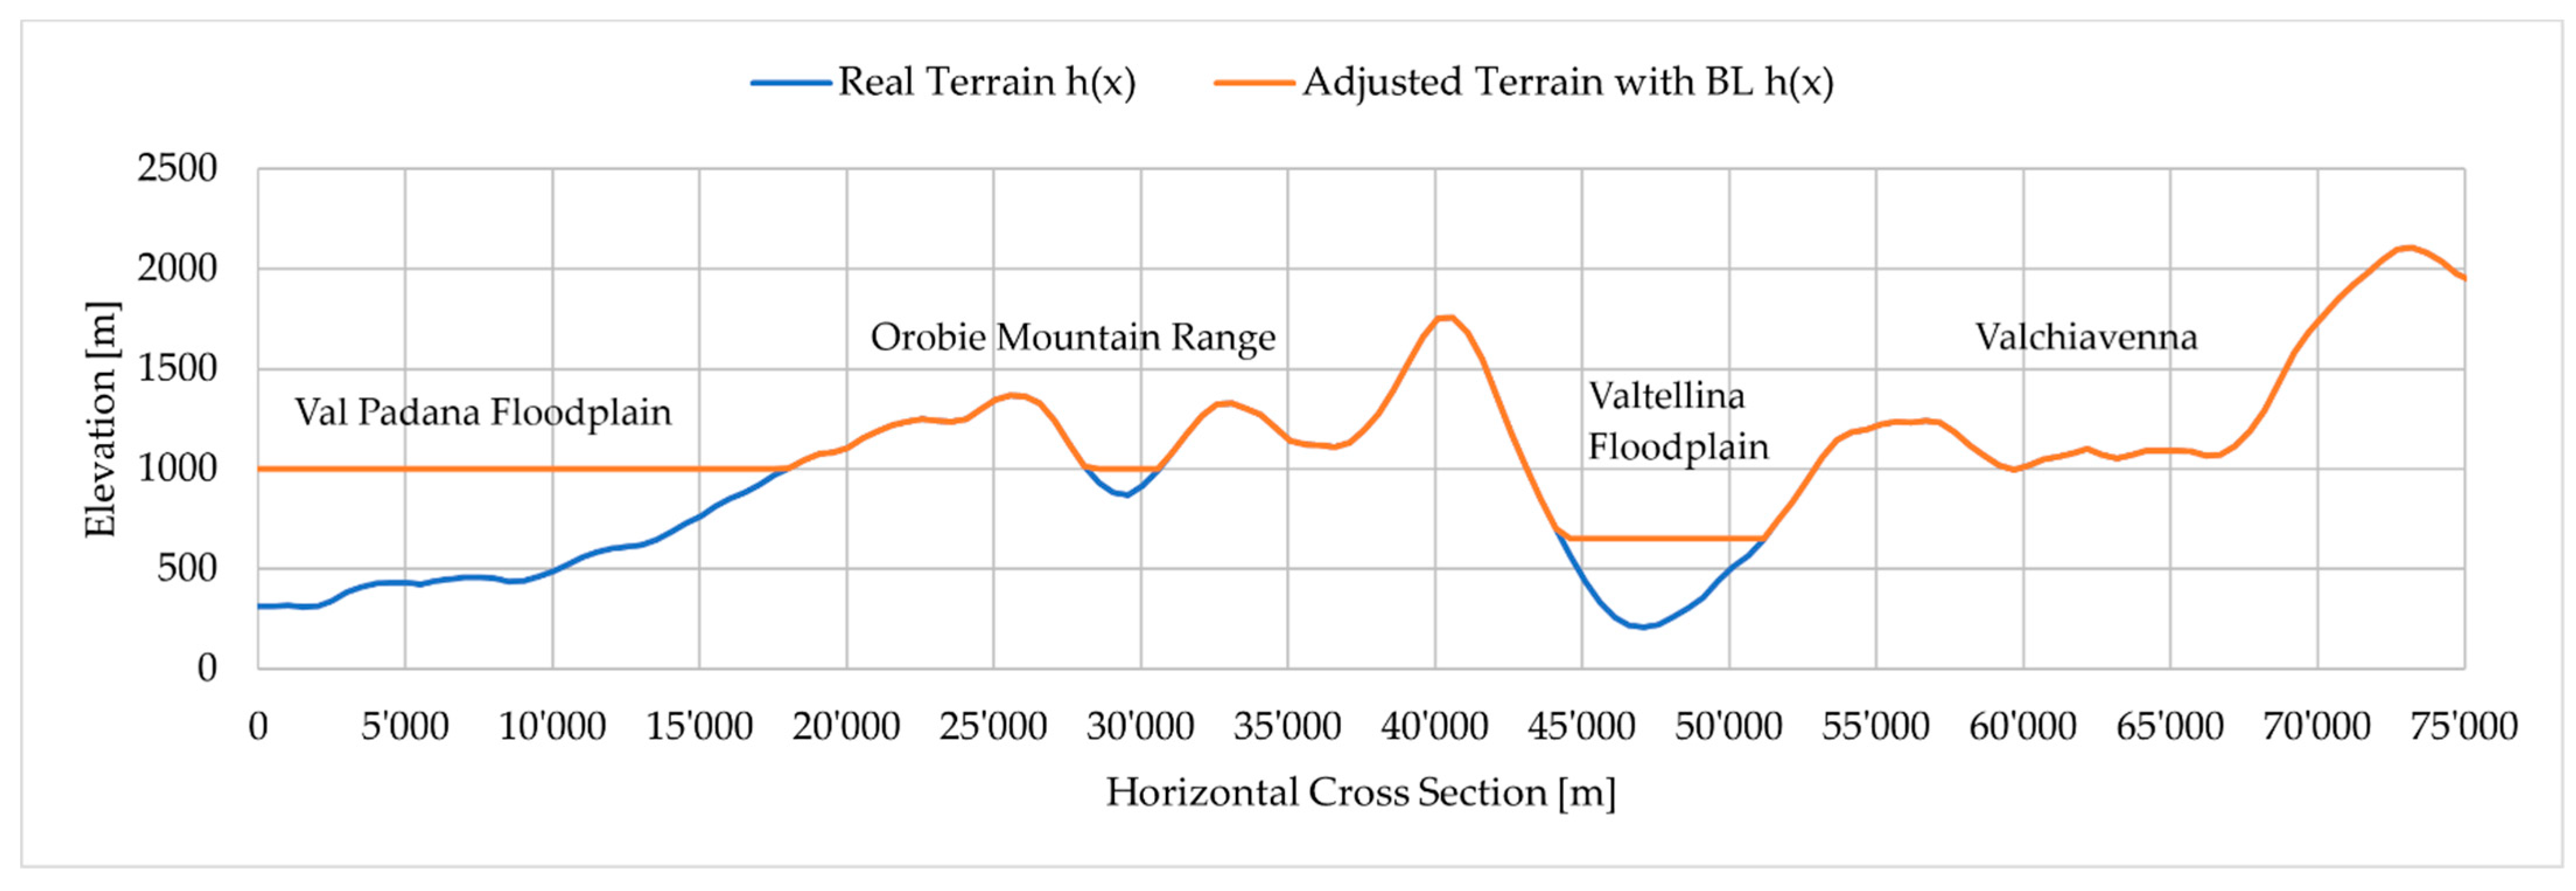
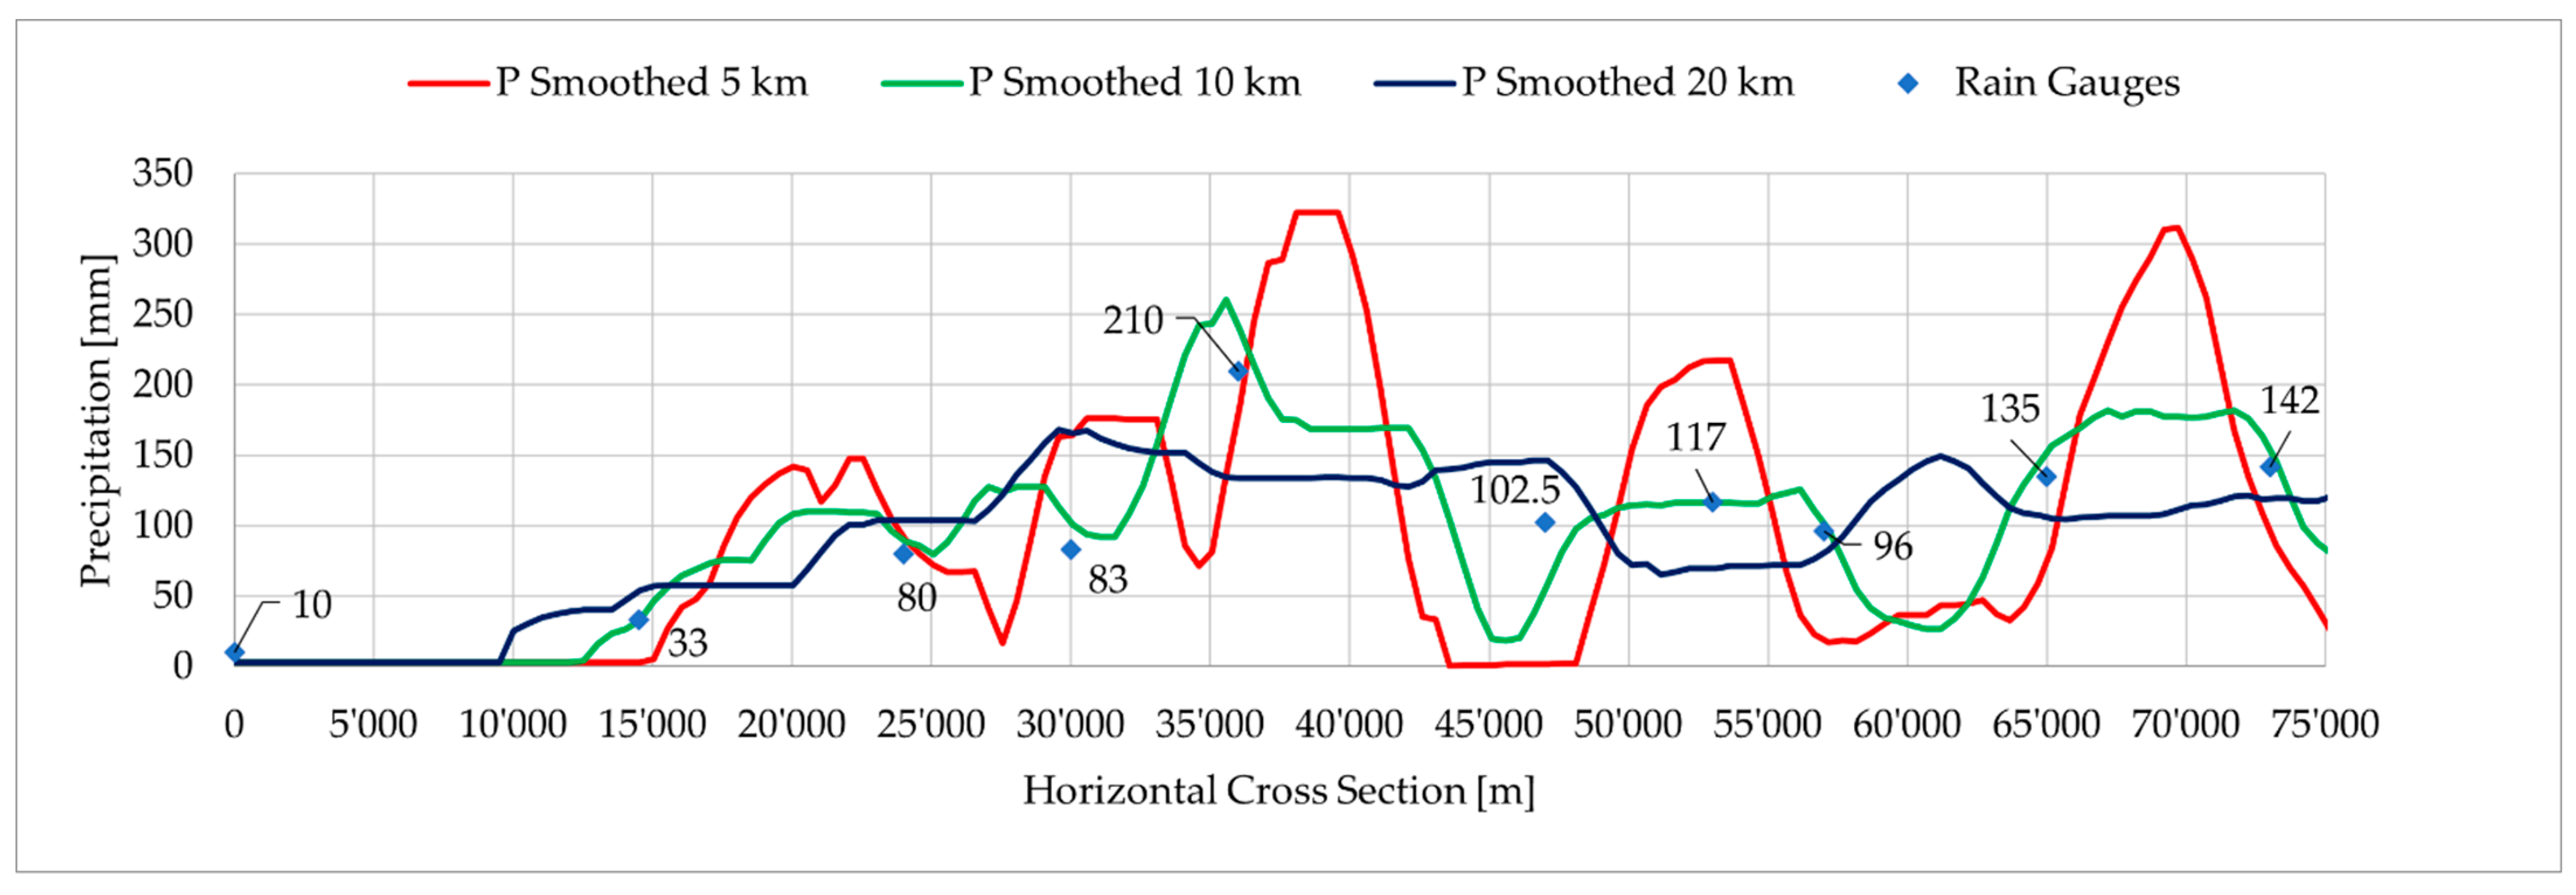
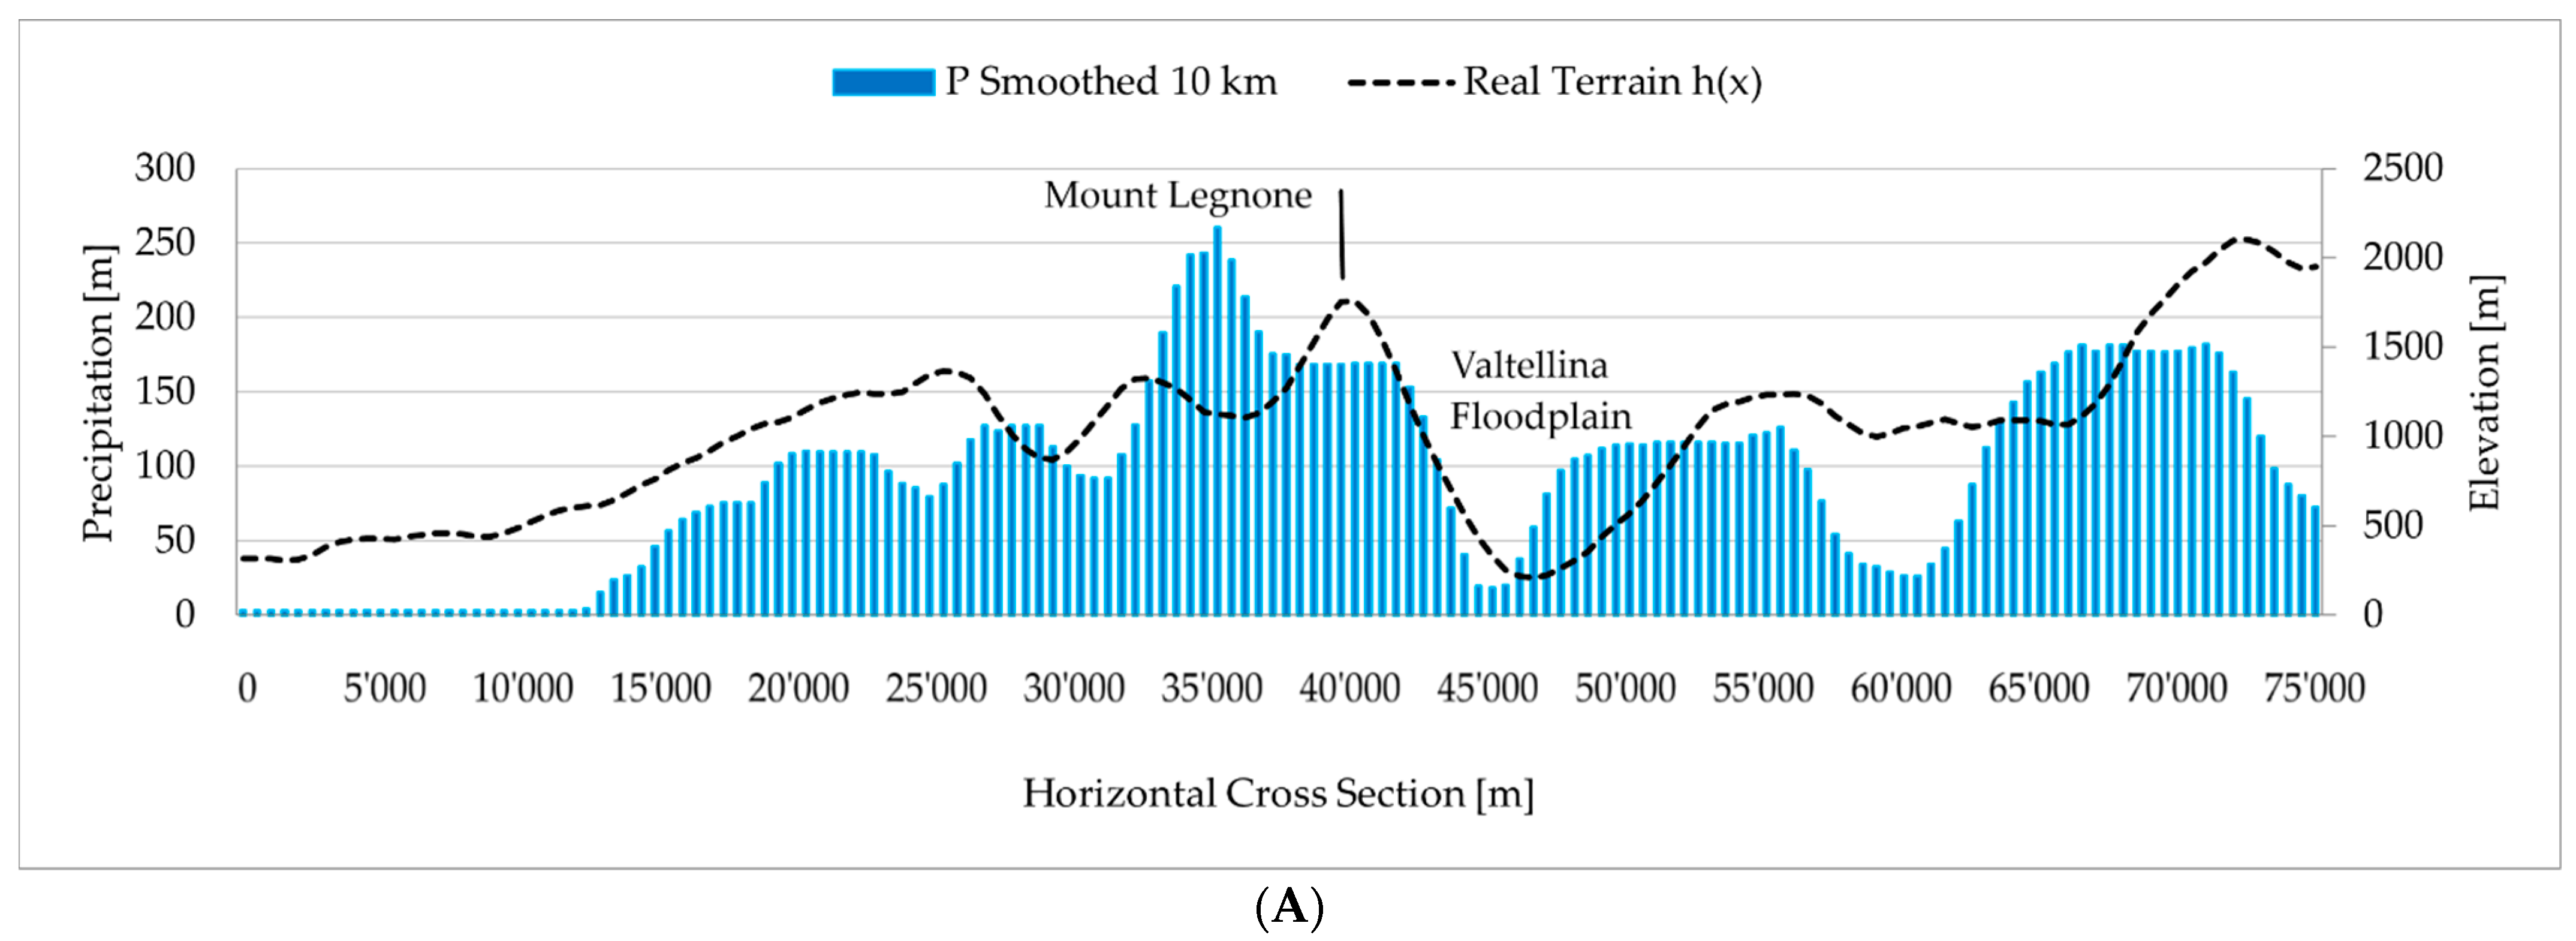
- The resampling of orography is an operation that is generally adopted in atmospheric models. For the Alps, a rectangular shape range with a 2000 m average slope was considered in the past as a sufficient representation of the morphology in regional atmospheric-dynamic models [6,32,34,50]. Currently, LAMs can assimilate orography at higher resolutions, but the smoothing operations are still necessary [58,59]. In our case, the high sensitivity of LUM to the terrain profile required that the local morphology be smoothed to obtain realistic simulations.
- ▪
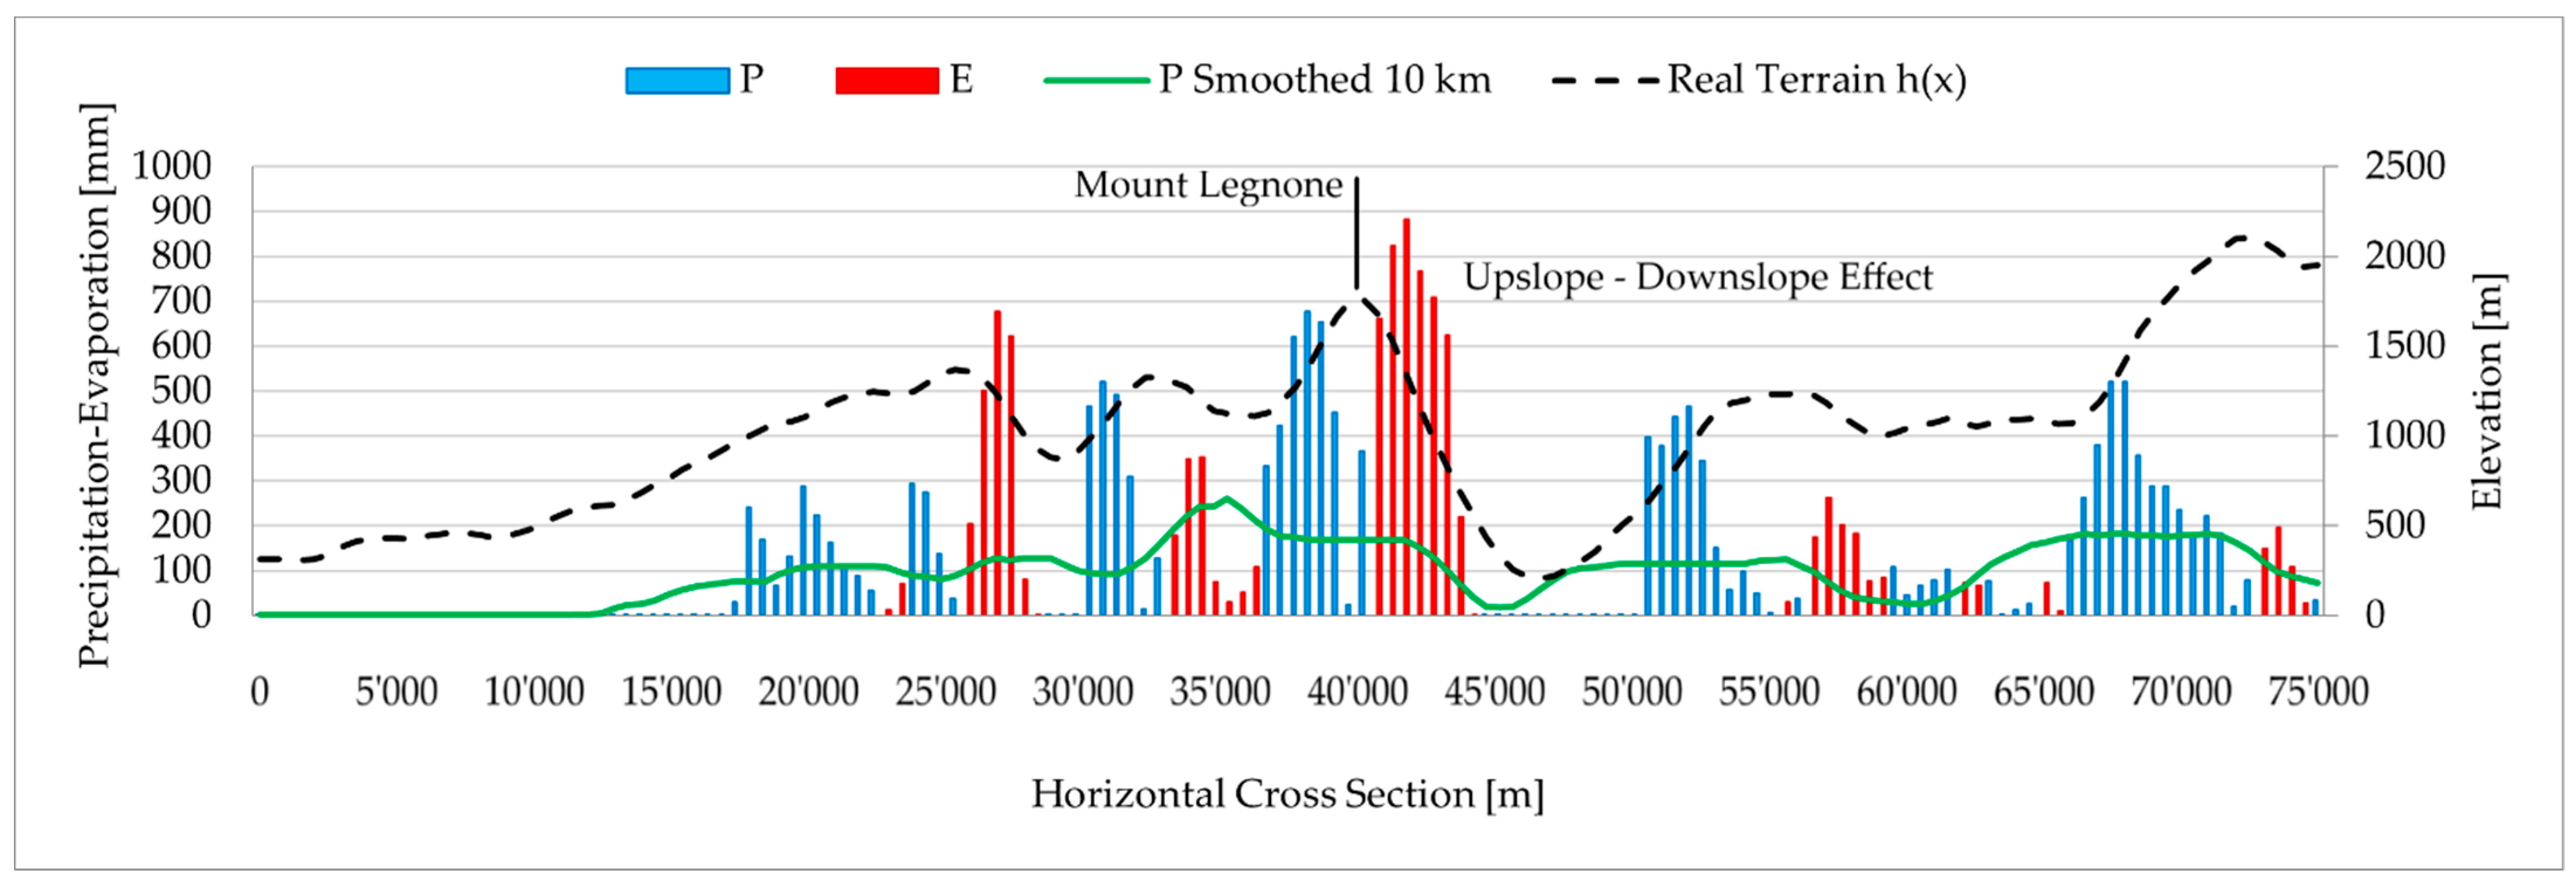
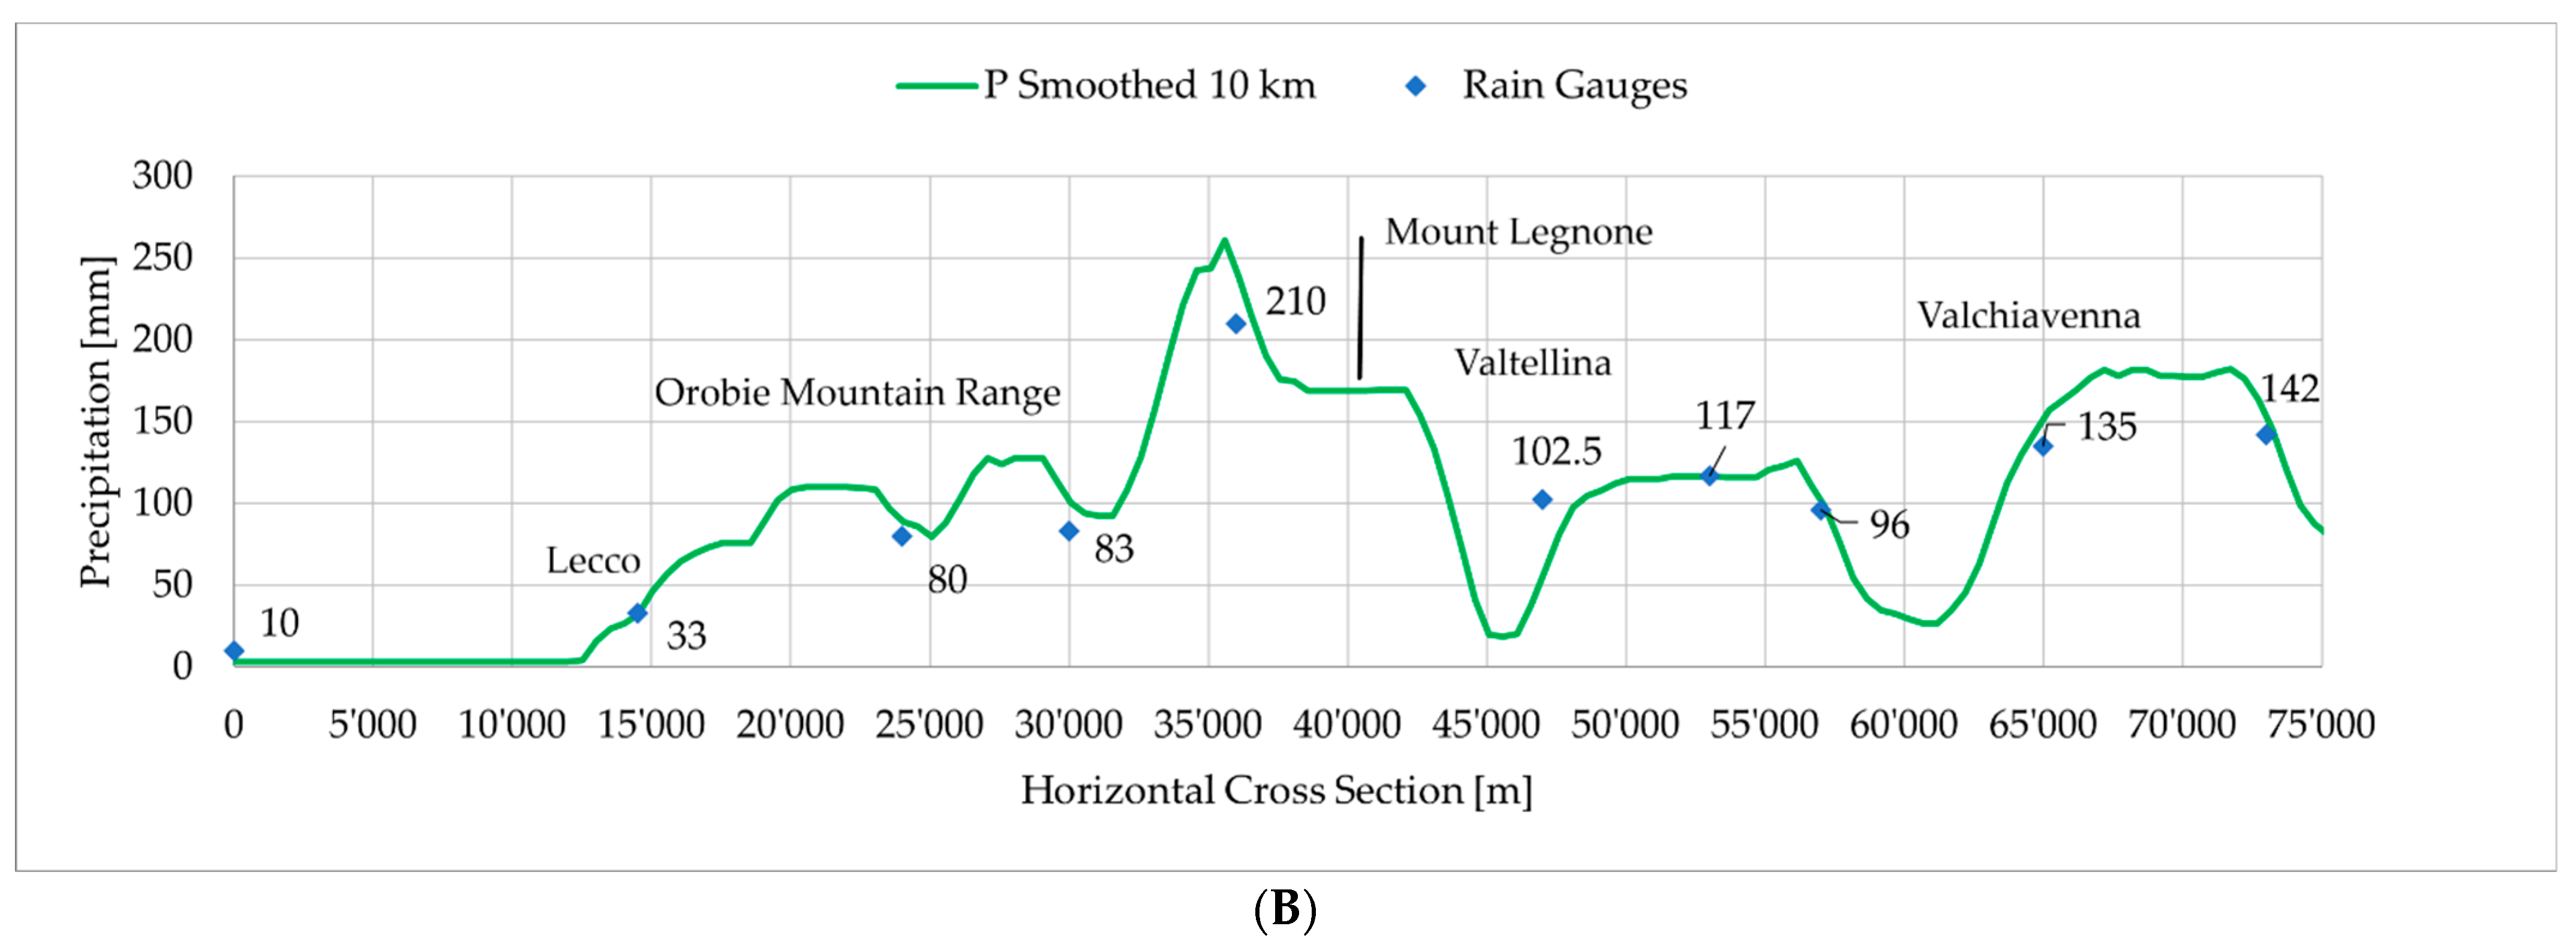
- The topographic influence on incoming airflow can generate gravity waves and turbulences that can also perturb the airflow dynamic along the vertical [5,34,60]. These secondary effects likely played a significant role in the spatial redistribution of the rainfall, especially behind the peak of Mount Legnone where the results showed the highest errors with underestimation of around 40 mm. Using the linear model, the airmass uplift triggered by orography was the predominantly simulated process, and the others were confined to the second order. For these reasons, the downslope dynamics are poorly described due to high non-linearities that may occur in these processes.
- ▪
- The estimation of the boundary layer height cannot be computed explicitly, and this represents a significant uncertainty that should be treated carefully. However, in our opinion, this quantity should be considered when LUM is adopted. As we determined for this case study, BL was essential to determine the portion of the atmosphere that can contribute to the effective rainfall generation. The motivation is the following: due to surface friction, low atmosphere layers are maintained at rest and do not experience any upslope motion until the BL is completely eroded. In our case study, the evidence was confirmed looking at three sounding data where, for layers comprised in BL, the wind velocities were sensibly reduced, and their directions were not aligned with the WFV airflow. If these layers are included in the computation of WFV0, they could lead to a sensible overestimation of the initial conditions due to their high concentration in water vapour. For these reasons, we tested this BL adjustment, and the results demonstrated good improvements in the LUM simulation.
5. Conclusions
Author Contributions
Funding
Informed Consent Statement
Data Availability Statement
Acknowledgments
Conflicts of Interest
References
- Longoni, L.; Ivanov, V.I.; Brambilla, D.; Radice, A.; Papini, M. Analysis of the temporal and spatial scales of soil erosion and transport in a Mountain Basin. Ital. J. Eng. Geol. Environ. 2016, 16, 17–30. [Google Scholar] [CrossRef]
- Gariano, S.L.; Guzzetti, F. Landslides in a changing climate. Earth Sci. Rev. 2016, 162, 227–252. [Google Scholar] [CrossRef] [Green Version]
- Papini, M.; Ivanov, V.; Brambilla, D.; Arosio, D.; Longoni, L. Monitoring bedload sediment transport in a pre-Alpine river: An experimental method. Rend. Online Della Soc. Geol. Ital. 2017, 43, 57–63. [Google Scholar] [CrossRef]
- Grazzini, F. Predictability of a large-scale flow conducive to extreme precipitation over the western Alps. Meteorol. Atmos. Phys. 2007, 95, 123–138. [Google Scholar] [CrossRef]
- Stull, R.B. Practical Meteorology: An Algebra-Based Survey of Atmospheric Science; University of British Columbia: Vancouver, BC, Canada, 2017. [Google Scholar]
- Rotunno, R.; Houze, R. Lessons on orographic precipitation for the Mesoscale Alpine Programme. Q. J. R. Meteorol. Soc. 2007, 133, 811–830. [Google Scholar] [CrossRef]
- Ozturk, U.; Tarakegn, Y.; Longoni, L.; Brambilla, D.; Papini, M.; Jensen, J. A simplified early-warning system for imminent landslide prediction based on failure index fragility curves developed through numerical analysis. Geomat. Nat. Hazards Risk 2015, 7, 1406–1425. [Google Scholar] [CrossRef] [Green Version]
- Albano, R.; Mancusi, L.; Abbate, A. Improving flood risk analysis for effectively supporting the implementation of flood risk management plans: The case study of “Serio” Valley. Environ. Sci. Policy 2017, 75, 158–172. [Google Scholar] [CrossRef]
- Guzzetti, F.; Peruccacci, S.; Rossi, M.; Stark, C.P. The rainfall intensity–duration control of shallow landslides and debris flows: An update. Landslides 2008, 5, 3–17. [Google Scholar] [CrossRef]
- Longoni, L.; Papini, M.; Arosio, D.; Zanzi, L. On the definition of rainfall thresholds for diffuse landslides. Trans. State Art Sci. Eng. 2011, 53, 27–41. [Google Scholar] [CrossRef] [Green Version]
- Ciccarese, G.; Mulas, M.; Alberoni, P.P.; Truffelli, G.; Corsini, A. Debris flows rainfall thresholds in the Apennines of Emilia-Romagna (Italy) derived by the analysis of recent severe rainstorms events and regional meteorological data. Geomorphology 2020, 358, 107097. [Google Scholar] [CrossRef]
- Caine, N. The Rainfall Intensity: Duration Control of Shallow Landslides and Debris Flows. Geogr. Ann. Ser. Phys. Geogr. 1980, 62, 23–27. [Google Scholar] [CrossRef]
- Ivanov, V.; Arosio, D.; Tresoldi, G.; Hojat, A.; Zanzi, L.; Papini, M.; Longoni, L. Investigation on the Role of Water for the Stability of Shallow Landslides-Insights from Experimental Tests. Water 2020, 12, 1203. [Google Scholar] [CrossRef] [Green Version]
- Martin, J.E. Mid-Latitude Atmosphere Dynamics; Wiley: Chichester, West Sussex, UK, 2006. [Google Scholar]
- Ivanov, V.; Radice, A.; Papini, M.; Longoni, L. Event-scale pebble mobility observed by RFID tracking in a pre-Alpine stream: A field laboratory. Earth Surf. Process. Landf. 2020, 45, 535–547. [Google Scholar] [CrossRef]
- Tao, T.; Chocat, B.; Liu, S.; Xin, K. Uncertainty Analysis of Interpolation Methods in Rainfall Spatial Distribution-A Case of Small Catchment in Lyon. J. Water Resour. Prot. 2009, 2, 136–144. [Google Scholar] [CrossRef] [Green Version]
- Chen, T.; Ren, L.; Yuan, F.; Yang, X.; Jiang, S.; Tang, T.; Liu, Y.; Zhao, C.; Zhang, L. Comparison of Spatial Interpolation Schemes for Rainfall Data and Application in Hydrological Modeling. Water 2017, 9, 342. [Google Scholar] [CrossRef] [Green Version]
- Ly, S.; Charles, C.; Degre, A. Different methods for spatial interpolation of rainfall data for operational hydrology and hydrological modeling at watershed scale. A review. Biotechnol. Agron. Soc. Environ. 2013, 17, 392–406. [Google Scholar]
- Jacquin, A.; Soto-Sandoval, J. Interpolation of monthly precipitation amounts in mountainous catchments with sparse precipitation networks. Chil. J. Agric. Res. 2013, 73, 406–413. [Google Scholar] [CrossRef] [Green Version]
- Di Piazza, A.; Conti, F.; Viola, F.; Eccel, E.; Noto, L. Comparative Analysis of Spatial Interpolation Methods in the Mediterranean Area: Application to Temperature in Sicily. Water 2015, 7, 1866–1888. [Google Scholar] [CrossRef] [Green Version]
- Hengl, T.; Heuvelink, G.; Stein, A. Comparison of Kriging with External Drift and Regression-Kriging; Tech. Note; ITC: Enschede, The Netherlands, 2003. [Google Scholar]
- Bourennane, H.; King, D.; Couturier, A. Comparison of kriging with external drift and simple linear regression for predicting soil horizon thickness with different sample densities. Geoderma 2000, 97, 255–271. [Google Scholar] [CrossRef]
- Hudson, G.; Wackernagel, H. Mapping temperature using kriging with external drift: Theory and an example from scotland. Int. J. Climatol. 1994, 14, 77–91. [Google Scholar] [CrossRef]
- Varentsov, M.; Esau, I.; Wolf, T. High-Resolution Temperature Mapping by Geostatistical Kriging with External Drift from Large-Eddy Simulations. Mon. Weather Rev. 2020, 148, 1029–1048. [Google Scholar] [CrossRef]
- Tian, Y.; Huffman, G.J.; Adler, R.F.; Tang, L.; Sapiano, M.; Maggioni, V.; Wu, H. Modeling errors in daily precipitation measurements: Additive or multiplicative? Geophys. Res. Lett. 2013, 40, 2060–2065. [Google Scholar] [CrossRef] [Green Version]
- Brownlees, C.; Cipollini, F.; Gallo, G. Multiplicative Error Models. In Handbook of Volatility Models and Their Applications; John Wiley & Sons: Hoboken, NJ, USA, 2011. [Google Scholar] [CrossRef] [Green Version]
- Daly, C.; Taylor, G.; Gibson, W. The PRISM Approach to Mapping Precipitation and Temperature. In Proceeding of the 10th AMS Conference Applied Climatology, Reno, NV, USA, 18–25 October 1997; pp. 20–23. [Google Scholar]
- Daly, C.; Slater, M.E.; Roberti, J.A.; Laseter, S.H.; Swift, L.W., Jr. High-resolution precipitation mapping in a mountainous watershed: Ground truth for evaluating uncertainty in a national precipitation dataset. Int. J. Climatol. 2017, 37, 124–137. [Google Scholar] [CrossRef] [Green Version]
- Jeong, H.-G.; Ahn, J.-B.; Lee, J.; Shim, K.-M.; Jung, M.-P. Improvement of daily precipitation estimations using PRISM with inverse-distance weighting. Theor. Appl. Climatol. 2020, 139, 923–934. [Google Scholar] [CrossRef] [Green Version]
- Chen, D.; Ou, T.; Gong, L.; Xu, C.-Y.; Li, W.; Ho, C.-H.; Qian, W. Spatial interpolation of daily precipitation in China: 1951–2005. Adv. Atmos. Sci. 2010, 27, 1221–1232. [Google Scholar] [CrossRef]
- Barry, R.G. Mountain Weater and Climate, 3rd ed.; Cambridge University Press: Cambridge, UK, 2008. [Google Scholar]
- Wallace, J.M.; Hobbs, P.V. Atmospheric Science: An Introductory Survey; Elsevier: Oxford, UK, 2006. [Google Scholar]
- Cotton, W.R.; Bryan, G.H.; Van Den Heever, S.C. Cumulonimbus Clouds and Severe Convective Storms. In Storm and Cloud Dynamics; Elsevier: London, UK, 2011. [Google Scholar]
- Kirshbaum, D.; Adler, B.; Kalthoff, N.; Barthlott, C.; Serafin, S. Moist Orographic Convection: Physical Mechanisms and Links to Surface-Exchange Processes. Atmosphere 2018, 9, 80. [Google Scholar] [CrossRef] [Green Version]
- Frogner, I.-L.; Singleton, A.T.; Køltzow, M.Ø.; Andrae, U. Convection-permitting ensembles: Challenges related to their design and use. Q. J. R. Meteorol. Soc. 2019, 145, 90–106. [Google Scholar] [CrossRef] [Green Version]
- Coppola, E.; Sobolowski, S.; Pichelli, E.; Raffaele, F.; Ahrens, B.; Anders, I.; Ban, N.; Bastin, S.; Belda, M.; Belusic, D.; et al. A first-of-its-kind multi-model convection permitting ensemble for investigating convective phenomena over Europe and the Mediterranean. Clim. Dyn. 2020, 55, 3–34. [Google Scholar] [CrossRef]
- Smith, R.B.; Barstad, I. A Linear Theory of Orographic Precipitation. J. Atmos. Sci. 2004, 61, 1377–1391. [Google Scholar] [CrossRef]
- Smith, R. A linear time-delay model of orographic precipitation. J. Hydrol. 2003, 282, 2–9. [Google Scholar] [CrossRef]
- Smith, R.B. The Influence of Mountains on the Atmosphere. In Advances in Geophysics; Saltzman, B., Ed.; Elsevier: Oxford, UK, 1979; Volume 21, pp. 87–230. ISBN 0065-2687. [Google Scholar]
- Smith, R.B. 100 Years of Progress on Mountain Meteorology Research. Meteorol. Monogr. 2018, 59, 20.1–20.73. [Google Scholar] [CrossRef]
- ARPA Lombardia Rete Monitoraggio Idro-Nivo-Meteorologico. Available online: www.arpalombardia.it/stiti/arpalombardia/meteo (accessed on 1 September 2020).
- Kalnay, E.; Kanamitsu, M.; Kistler, R.; Collins, W.; Deaven, D.; Gandin, L.; Iredell, M.; Saha, S.; White, G.; Woollen, J.; et al. The NCEP/NCAR 40-Year Reanalysis Project. Bull. Am. Meteorol. Soc. 1996, 77, 437–472. [Google Scholar] [CrossRef] [Green Version]
- Grazzini, F.; Vitart, F. Atmospheric predictability and Rossby wave packets. Q. J. R. Meteorol. Soc. 2015, 141, 2793–2802. [Google Scholar] [CrossRef]
- MeteoCiel Observations, Prévisions, Modèles en Temps Réel. Available online: www.meteociel.fr (accessed on 1 September 2020).
- Meteo Swiss Meteo Swiss Waether Overview. Available online: https://www.meteoswiss.admin.ch/home.html?tab=overview (accessed on 12 June 2019).
- University of Wayoming Upperair Air Data. Available online: http://weather.uwyo.edu/upperair/sounding.html (accessed on 1 September 2020).
- NOAA National Center for Environmental Information. Available online: https://www.ncei.noaa.gov/ (accessed on 1 September 2020).
- Marwitz, J.D. Precipitation efficiency of thunderstorms on the high plains. Pascal Fr. Bibliogr. Databases 1972, 6, 367–370. [Google Scholar]
- Regione Lombardia Geoportale Regione Lombardia. Available online: https://www.geoportale.regione.lombardia.it/ (accessed on 30 October 2020).
- Caroletti, G.; Barstad, I. An assessment of future extreme precipitation in western Norway using a linear model. Hydrol. Earth Syst. Sci. 2010, 14. [Google Scholar] [CrossRef] [Green Version]
- Haghighi, E.; Shahraeeni, E.; Lehmann, P.; Or, D. Evaporation rates across a convective air boundary layer are dominated by diffusion. Water Resour. Res. 2013, 49, 1602–1610. [Google Scholar] [CrossRef] [Green Version]
- Serafin, S.; Adler, B.; Cuxart, J.; De Wekker, S.; Gohm, A.; Grisogono, B.; Kalthoff, N.; Kirshbaum, D.; Rotach, M.; Schmidli, J.; et al. Exchange Processes in the Atmospheric Boundary Layer over Mountainous Terrain. Atmosphere 2018, 9, 102. [Google Scholar] [CrossRef] [Green Version]
- Kessler, E. On the continuity and distribution of water substance in atmospheric circulations. Atmos. Res. 1995, 38, 109–145. [Google Scholar] [CrossRef]
- Ćurić, M. Numerical modeling of thunderstorm. Theor. Appl. Climatol. 1989, 40, 227–235. [Google Scholar] [CrossRef]
- Serafin, S.; Zardi, D. Structure of the Atmospheric Boundary Layer in the Vicinity of a Developing Upslope Flow System: A Numerical Model Study. J. Atmos. Sci. 2010, 67, 1171–1185. [Google Scholar] [CrossRef]
- Ralph, F.M.; Neiman, P.J.; Wick, G.A. Satellite and CALJET Aircraft Observations of Atmospheric Rivers over the Eastern North Pacific Ocean during the Winter of 1997/98. Mon. Weather Rev. 2004, 132, 1721–1745. [Google Scholar] [CrossRef] [Green Version]
- Gimeno, L.; Nieto, R.; Vázquez, M.; Lavers, D. Atmospheric rivers: A mini-review. Front. Earth Sci. 2014, 2, 2. [Google Scholar] [CrossRef]
- Rontu, L. Studies on Orographic Effects in a Numerical Weather Prediction Model. Master’s Thesis, University of Helsinki, Helsinki, Finland, 2013. [Google Scholar]
- Elvidge, A.D.; Sandu, I.; Wedi, N.; Vosper, S.B.; Zadra, A.; Boussetta, S.; Bouyssel, F.; van Niekerk, A.; Tolstykh, M.A.; Ujiie, M. Uncertainty in the Representation of Orography in Weather and Climate Models and Implications for Parameterized Drag. J. Adv. Model. Earth Syst. 2019, 11, 2567–2585. [Google Scholar] [CrossRef] [Green Version]
- Vallis, G.K. Essentials of Atmospheric and Oceanic Dynamics; Cambridge University Press: Cambridge, UK, 2019; ISBN 978-1-107-69279-4. [Google Scholar]


| Rain Gauge Station | Rainfall Cumulated (mm) | Rain Gauge Station | Rainfall Cumulated (mm) |
|---|---|---|---|
| Montevecchia | 10 | Fuentes | 115 |
| Lecco | 33 | Vercana | 97 |
| Barzio | 80 | Samolaco | 96 |
| Cortenova | 83 | Prata | 123 |
| Premana | 210 | Gordona | 142 |
| Colico | 90 | San Giacomo | 107 |
| Dubino | 121 | Campodolcino | 160 |
| Verceia | 114 | Madesimo | 157 |
| 11 June 2019 12:00 UTC | 12 June 2019 00:00 UTC | |
|---|---|---|
| N2 (s−1) | −0.00027 | −0.00024 |
| Atmospheric Condition | unstable | unstable |
| CAPE (J kg−1) | 1371.38 | 386.24 |
| CIN (J kg−1) | −40.83 | −84.15 |
| LI (°C) | −4.52 | −2.78 |
| LCL (hPa) (m) | 873.49 hPa (1218 m) | 869.00 hPa (1262 m) |
| LFC (hPa) (m) | 790.35 hPa (2049 m) | 763.20 hPa (2336 m) |
| EL (hPa) (m) | 273.18 hPa (10,879 m) | 332.52 hPa (8605 m) |
| 11 June 2019 12:00 UTC | 12 June 2019 00:00 UTC | 12 June 2019 12:00 UTC | Average | |
|---|---|---|---|---|
| WFV0 [kg s−1 m−1] | 202 | 610 | 152 | 540 |
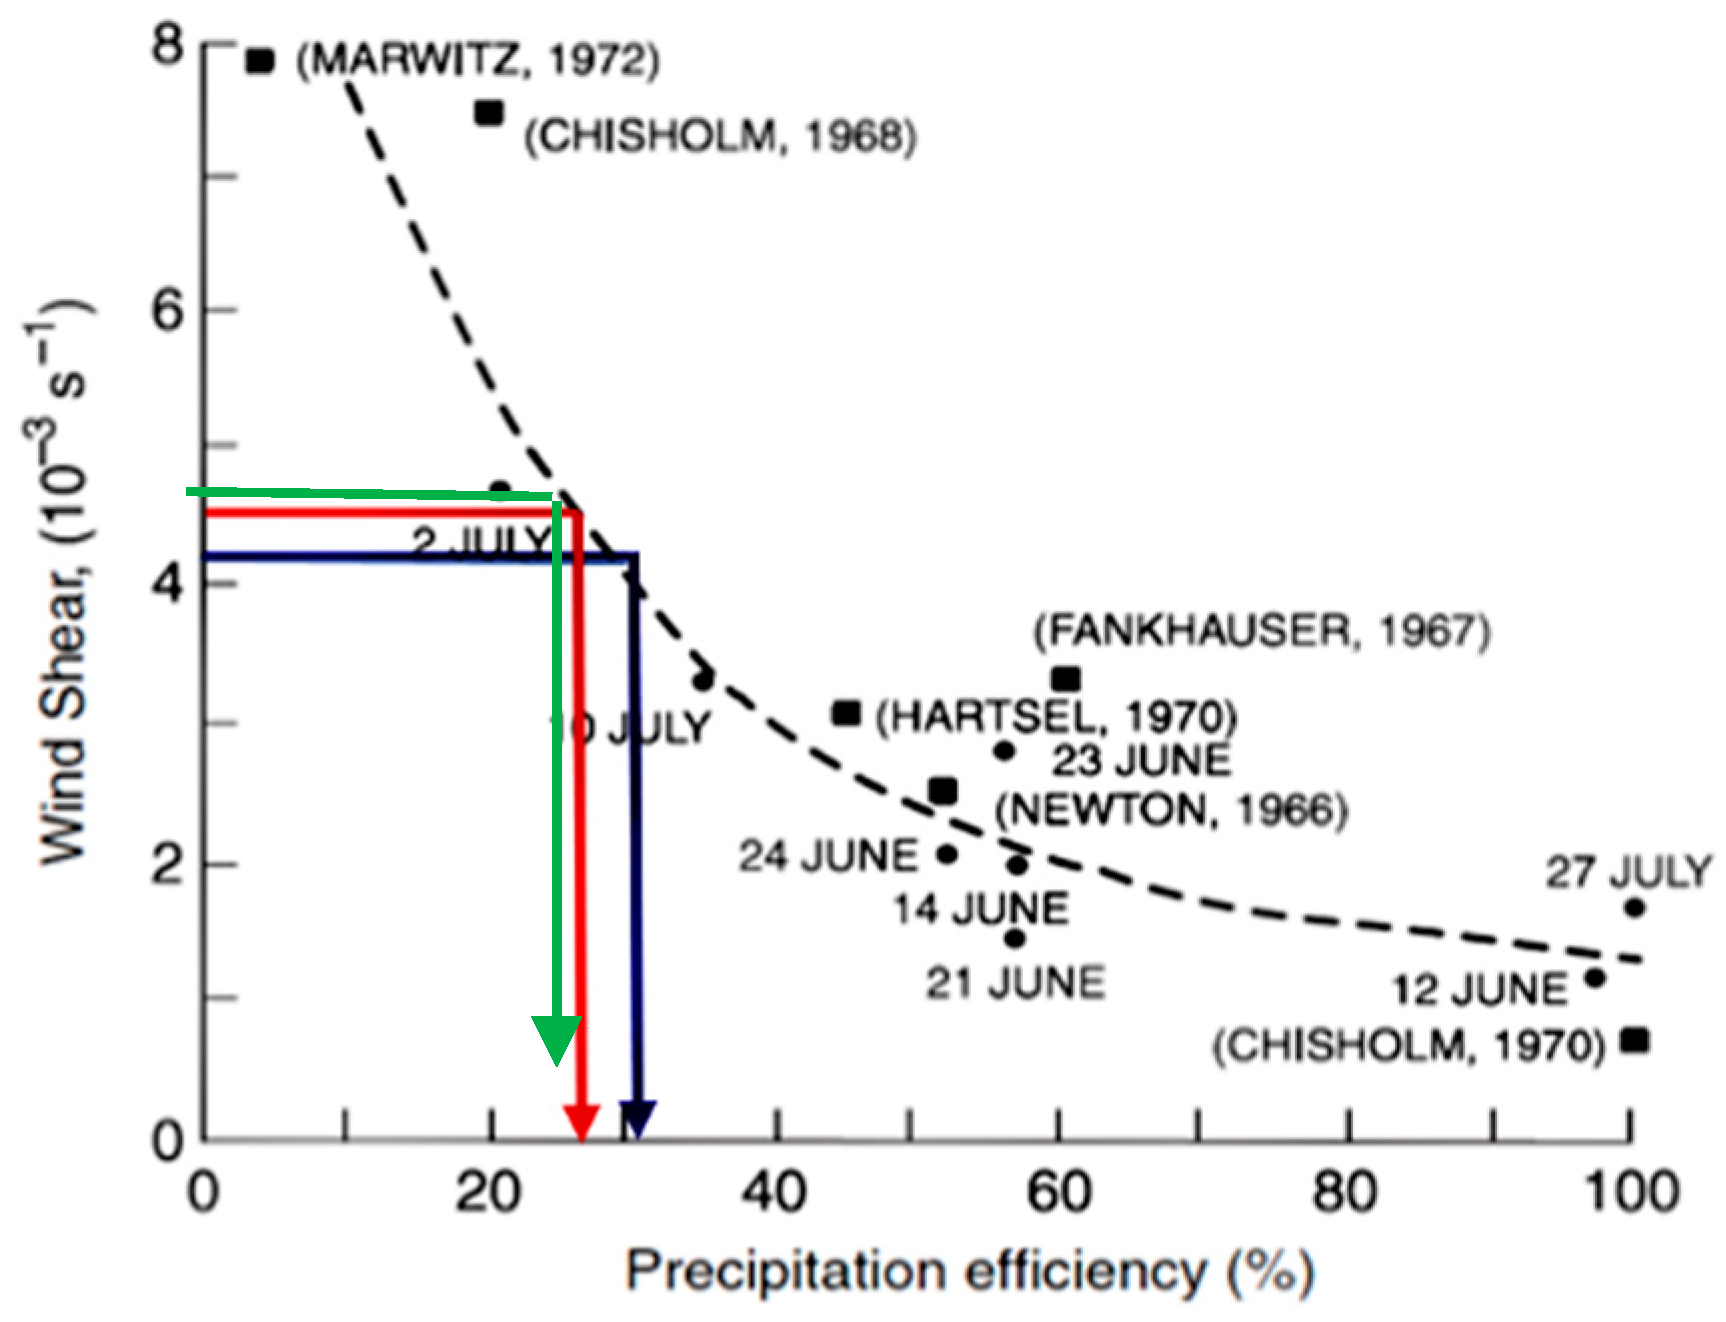
| 11 June 2019 12:00 UTC (Red) | 12 June 2019 00:00 UTC (Blue) | 12 June 2019 12:00 UTC (Green) | |
|---|---|---|---|
| Wind Shear (10−3 s−1) | 4.41 | 4.25 | 4.37 |
| Ep () | 0.27 | 0.32 | 0.29 |
| 11 June 2019 12 h UTC | 12 June 2019 00 h UTC | 12 June 2019 00 h UTC | |
|---|---|---|---|
| Boundary Layer Height [m] | 1500 | 400 | 1800 |
| Rain Gauge Station | x Terrain Coordinate (m) | P Rain Gauge (mm) | P Model (mm) |
|---|---|---|---|
| Montevecchia | 0 | 10 | 5.0 |
| Lecco | 14,500 | 33 | 32.8 |
| Barzio | 24,000 | 80 | 88.8 |
| Cortenova | 30,000 | 83 | 100.6 |
| Premana | 36,000 | 210 | 238.6 |
| Colico-Fuentes | 47,000 | 102 | 60.0 |
| Dubino-Verceia | 53,000 | 117 | 116.0 |
| Samolaco | 57,000 | 96 | 97.8 |
| Gordona-Prata | 65,000 | 135 | 157.2 |
| San Giacomo -Madesimo | 73,000 | 142 | 145.5 |
| Absolute Error (mm) | Relative Error (%) | Root Mean Square Error (mm) | |
| 14.02 | 19.78 | 12.17 | |
Publisher’s Note: MDPI stays neutral with regard to jurisdictional claims in published maps and institutional affiliations. |
© 2020 by the authors. Licensee MDPI, Basel, Switzerland. This article is an open access article distributed under the terms and conditions of the Creative Commons Attribution (CC BY) license (http://creativecommons.org/licenses/by/4.0/).
Share and Cite
Abbate, A.; Papini, M.; Longoni, L. Extreme Rainfall over Complex Terrain: An Application of the Linear Model of Orographic Precipitation to a Case Study in the Italian Pre-Alps. Geosciences 2021, 11, 18. https://doi.org/10.3390/geosciences11010018
Abbate A, Papini M, Longoni L. Extreme Rainfall over Complex Terrain: An Application of the Linear Model of Orographic Precipitation to a Case Study in the Italian Pre-Alps. Geosciences. 2021; 11(1):18. https://doi.org/10.3390/geosciences11010018
Chicago/Turabian StyleAbbate, Andrea, Monica Papini, and Laura Longoni. 2021. "Extreme Rainfall over Complex Terrain: An Application of the Linear Model of Orographic Precipitation to a Case Study in the Italian Pre-Alps" Geosciences 11, no. 1: 18. https://doi.org/10.3390/geosciences11010018
APA StyleAbbate, A., Papini, M., & Longoni, L. (2021). Extreme Rainfall over Complex Terrain: An Application of the Linear Model of Orographic Precipitation to a Case Study in the Italian Pre-Alps. Geosciences, 11(1), 18. https://doi.org/10.3390/geosciences11010018


