Article

The Yorktown Formation: Improved Stratigraphy, Chronology, and Paleoclimate Interpretations from the U.S. Mid-Atlantic Coastal Plain

1
U.S. Geological Survey, Florence Bascom Geoscience Center, Reston, VA 20192, USA
2
Earth, Environmental, and Planetary Sciences, Brown University, Providence, RI 02912, USA
*
Author to whom correspondence should be addressed.
Geosciences 2021, 11(12), 486; https://doi.org/10.3390/geosciences11120486
Submission received: 7 October 2021 / Revised: 16 November 2021 / Accepted: 19 November 2021 / Published: 24 November 2021
(This article belongs to the Section Sedimentology, Stratigraphy and Palaeontology)

Abstract

:
The Yorktown Formation records paleoclimate conditions along the mid-Atlantic Coastal Plain during the mid-Piacenzian Warm Period (3.264 to 3.025 Ma), a climate interval of the Pliocene in some ways analogous to near future climate projections. To gain insight into potential near future changes, we investigated Yorktown Formation outcrops and cores in southeastern Virginia, refining the stratigraphic framework. We analyzed 485 samples for alkenone-based sea surface temperature (SST) and productivity estimates from the Holland and Dory cores, an outcrop at Morgarts Beach, Virginia, and the lectostratotype of the Yorktown Formation at Rushmere, Virginia, and analyzed planktonic foraminferal assemblage data from the type section. Using the structure of the SST record, we improved the chronology of the Yorktown Formation by establishing the maximum age ranges of the Rushmere (3.3–3.2 Ma) and Morgarts Beach (3.2–3.15 Ma) Members. SST values for these members average ~26 °C, corroborating existing sclerochronological data. Increasing planktonic foraminifer abundance, productivity, and species diversity parallel increasing SST over the MIS M2/M1 transition. These records constitute the greatest temporal concentration of paleoecological estimates within the Yorktown Formation, aiding our understanding of western North Atlantic temperature patterns, seasonality and ocean circulation during this interval. We provide a chronologic framework for future studies analyzing ecological responses to profound climate change.

1. Introduction

The Earth’s changing climate is an existential threat to the environment, public health, and infrastructure, often dominating political, economic, and cultural dialogues. The latest climate models project conditions for the end of this century that are generally outside of the human experience [1,2,3]. Fortunately, deep-time records of paleoclimate provide insight into the climate system over millions of years, sampling conditions different from the present day, and in some cases similar to model projections for the future.
The Pliocene (5.33–2.59 Ma) has often been used to investigate how the climate system works under different boundary conditions and to gain insight into the potential magnitude of changes that might occur by the end of the 21st century [4]. One popular target for paleoclimate research within the Pliocene Epoch is the mid-Piacenzian Warm Period (MPWP), 3.264 to 3.025 Ma [5]. The MPWP is the most recent interval of the past with CO2 levels similar to present day [6] and a global mean annual temperature greater than today [7].
Excellent MPWP marine deposits are found in outcrop and shallow cores in southeastern Virginia, USA, along the mid-Atlantic Coastal Plain (MACP) (Figure 1). These sediments, belonging to the Yorktown Formation, are best exposed on the York-James Peninsula and on the banks of the York and James Rivers. The Yorktown Formation has played an important role in advancing our knowledge of Pliocene paleoclimate, illuminating our understanding of western North Atlantic biogeography, temperature patterns, seasonality, and ocean circulation during this warmer climate state (e.g., [8,9,10,11,12,13,14,15,16,17,18,19,20]). The Yorktown Formation, and correlatives to the south, are the youngest marine units deposited at the toe of the Orangeburg Scarp, delineating a major Pliocene transgression of ~25 m above modern sea level recorded from Florida to Virginia [21,22,23,24]. Thus, in addition to a regional paleoclimate signal contained within its sediments, the Yorktown Formation has played a pivotal role in understanding global sea-level change, putting constraints on global ice volume at that time [21].
Outcrops of the Yorktown Formation in southeastern Virginia have undergone considerable changes in the 40 years since a lectostratotype was designated [9]. Many of the sections have been lost to erosion or development. In this paper we identify and describe three outcrop sections that are still accessible along the James River and correlate them to two cores collected from southeastern Virginia. In doing so, we refine the stratigraphic framework of the Yorktown Formation. In addition, using alkenone time series data, we greatly improve the Yorktown Formation chronology and present new temperature and productivity estimates. Combined with foraminiferal assemblage data, these records constitute the greatest temporal concentration of paleoecological estimates of the MPWP in this region and provide a high-resolution chronologic framework for future studies.

2. Yorktown Formation Stratigraphy

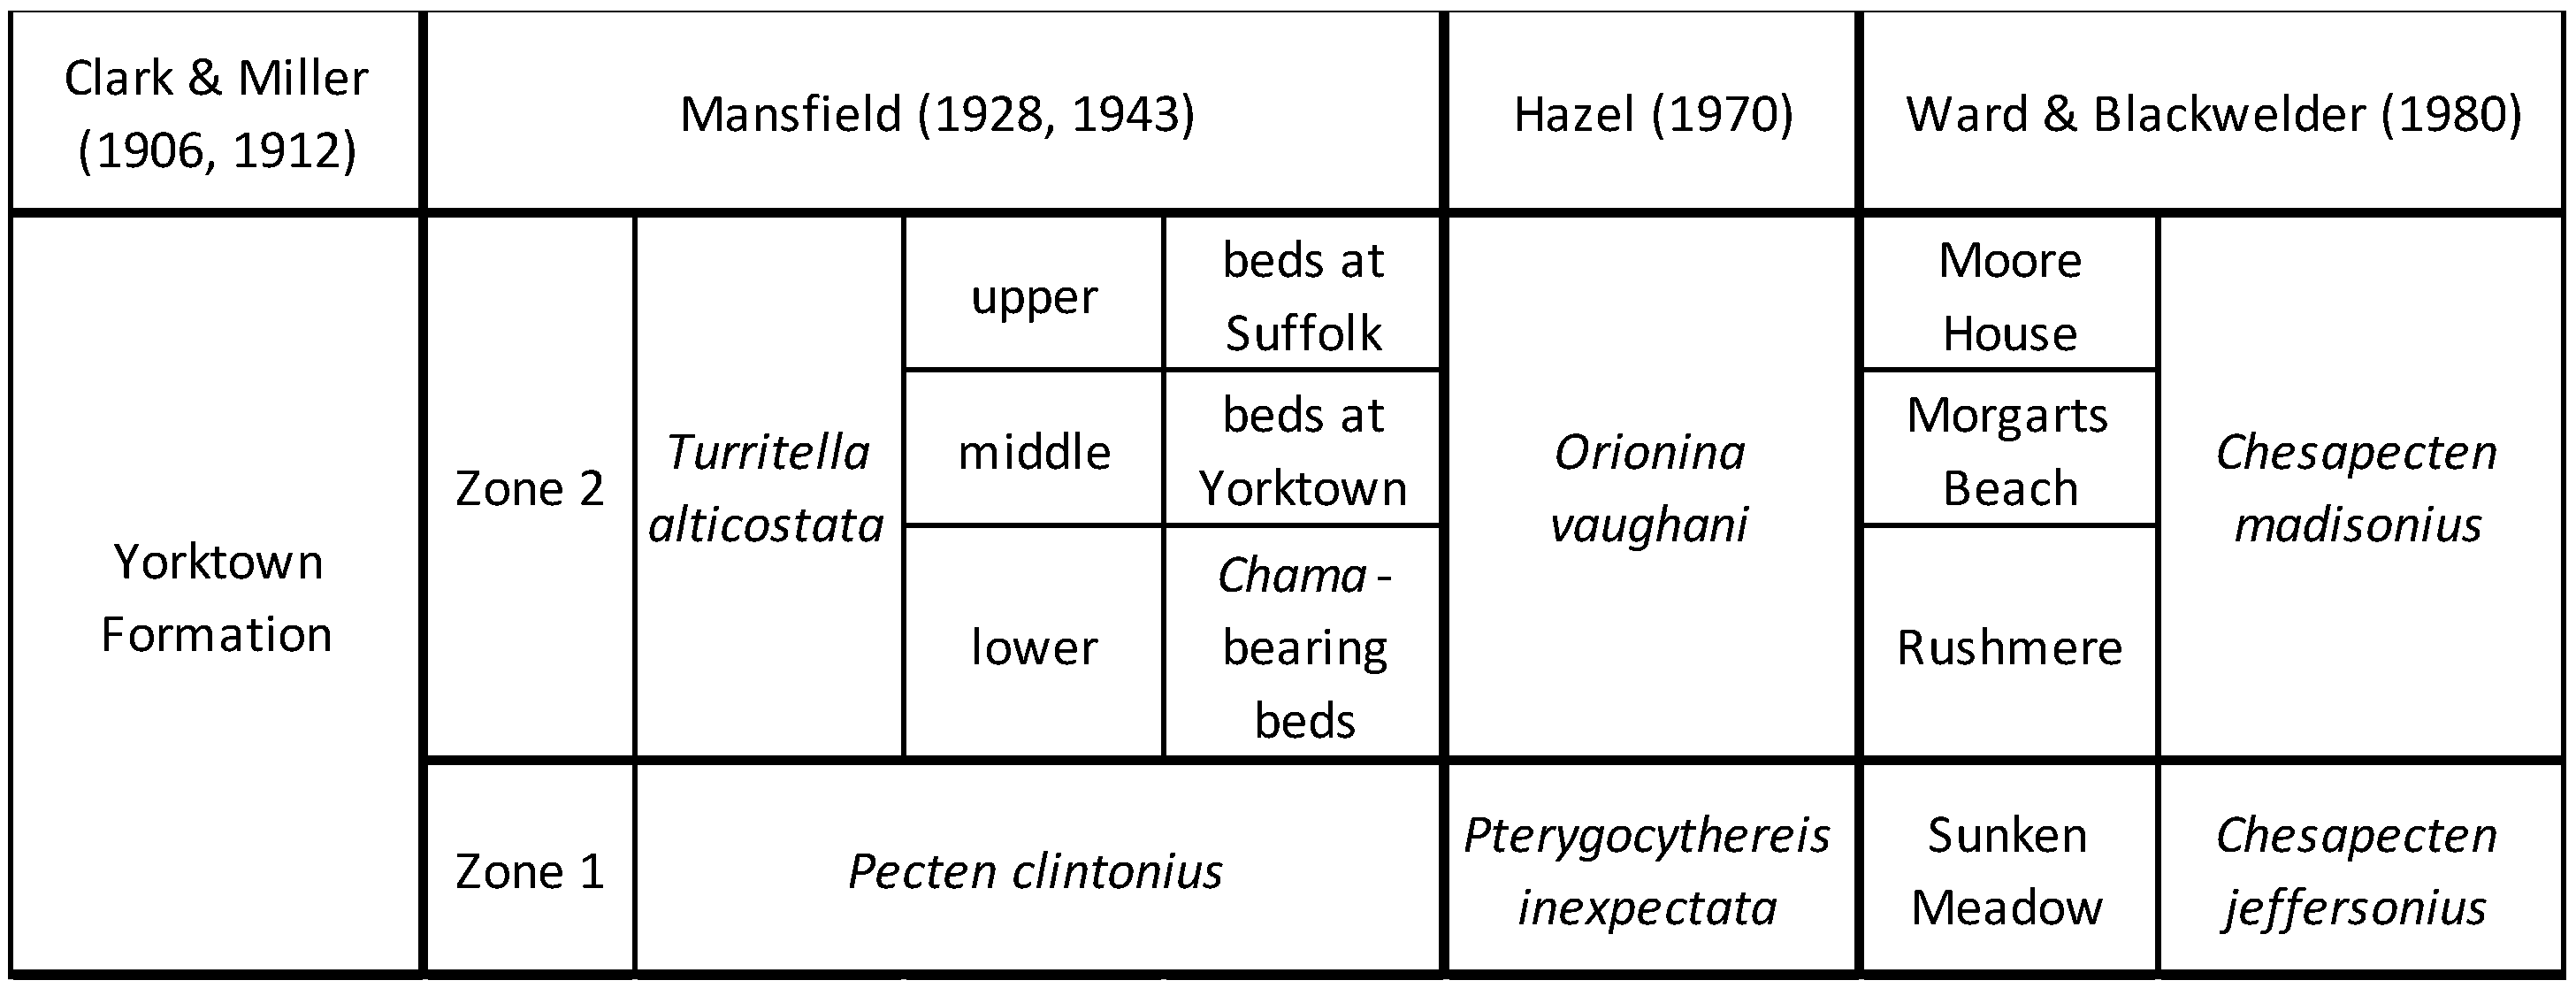
2.1. Previous Stratigraphic Work

The first written accounts of the geology and paleontology of the lower James River in the vicinity of Jamestown, Virginia, followed shortly after the John Smith expedition in 1607 [25]. The richly fossiliferous Neogene sediments have been recognized for the paleoclimatic signals they contain since the time of Lyell’s visit in 1845 [26]. The term “Yorktown,” referring to beds on both the York and James Rivers in Virginia, enjoys frequent use in the early literature including but not limited to Dana’s “Yorktown”, “Yorktown Period”, and “Yorktown Epoch” [27,28,29]. Dall and Harris [30] referenced “the Yorktown”, but the first reference to the “Yorktown Formation” was made by Clark and Miller in 1906 [31]. In 1912, Clark and Miller state “The Yorktown Formation has been so named because of the excellent exposure of the strata of this age in the prominent cliffs at Yorktown [32].” While this does not designate a specific section, they clearly refer to the sections along the York River, near Yorktown, composed of calcarenite and cemented shells. They indicated the lithology could be seen at other locations including along the James River. Their description of the Yorktown Formation also included beds of sand and blue sandy clay [32].
Mansfield provided a brief outline of the Chesapeake Group (Figure 2) in which he established two biostratigraphic units within the Yorktown Formation [33]. The lower unit (Zone 1) contained the bivalve Pecten clintonius. The upper unit (Zone 2) was distinguished by the presence of the gastropod Turritella alticostata and further subdivided into a lower, middle, and upper part. The middle part of Zone 2 referred to fragmental beds, the lower part to sediments under the fragmental beds, and the upper part to sediments resting on the fragmented beds and therefore representing the youngest Yorktown deposits in Virginia. These subzones, in ascending order, were later referred to as the Chama-bearing beds, the beds at Yorktown, and the beds at Suffolk (Figure 3) [34]. These subdivisions of Zone 2 were informal as they were not defined in terms of lithology or paleontology.
Hazel quantitatively analyzed occurrences of ostracods from Yorktown Formation samples and divided the formation into a lower Pterygocythereis inexpectata Zone, roughly equivalent to Mansfield’s Zone 1, and an Orionina vaughani Zone, which represented the middle and upper parts of the Yorktown Formation, equivalent to Mansfield’s Zone 2 (Figure 3) [36].
Ward and Blackwelder [9] revised the stratigraphy of the Upper Miocene and Lower Pliocene of the MACP. They formally described the Yorktown Formation (designated a lectotype section) and subdivided it into a lowermost coarse-grained sand (Sunken Meadow Member), a shelly fine-grained sand (Rushmere Member), a very fine grained sandy-clay unit (Morgarts Beach Member), and an uppermost shell hash (the Moore House Member) (Figure 3).
The Sunken Meadow Member, equivalent to Mansfield’s Zone 1 and Hazel’s Pterygocythereis inexpectata Zone, is separated from the underlying Miocene Eastover Formation by an erosional unconformity. The combined Rushmere, Morgarts Beach, and Moore House Members are equivalent to Mansfield’s Zone 2 and Hazel’s Orionina vaughani Zone. The Rushmere Member, which equates to the Chama-bearing beds, unconformably rests on the Sunken Meadow Member and grades into the overlying Morgarts Beach Member.
The silty and fine sandy clays of the Morgarts Beach Member are separated from the overlying Moore House Member by an unconformity representing a brief drop in relative sea level [37]. The Moore House, which corresponds to Mansfield’s middle part of Zone 2, is unconformably overlain by the Chowan River Formation and equivalents, which would most likely have been considered the “upper part” of Zone 2 by Mansfield [33] and included in his concept of the Yorktown (see Figure 3). The stratigraphy presented by Ward and Blackwelder [9] can be readily applied to the James River sections, but, in the absence of macrofossil data, subsurface units encountered in cores are not always lithologically distinctive, making member assignments problematic. It should also be noted that Campbell [15] advanced a multiple lithofacies model of deposition, in which he stressed the units exposed at the Yorktown lectostratotype section at Rushmere were facies repeated both spatially and temporally elsewhere in the region. The workable applied stratigraphic framework for our study area, confined to the James River in the southeastern Virginia part of the MACP, recognizes the Yorktown Formation as defined by Ward and Blackwelder [9], but at times defaults to the simple two-zone construct of Mansfield [33].

2.2. Chronology

The Pliocene age of the Yorktown Formation is well-established based upon mollusk, foraminifer, and ostracod faunas from localities in southeastern Virginia and northeastern North Carolina (e.g., [8,9,10,11,14,15,36,38]). Planktic foraminiferal data are consistent with a zonal assignment of N19 of Blow [39] or PLlb—PL4 of Berggren [40]. The presence of Globoconella puncticulata (first appearance in the northern mid-latitudes ~4.1–3.9 Ma) and Dentoglobigerina altispira (last appearance ~2.9 Ma) in some Yorktown samples was used to suggest an age range of 4.0–2.9 Ma for the Yorktown in the type area [14]. Revisions to the geomagnetic polarity time scale used to calibrate these events now places the last appearance of D. altispira at ~3.1 Ma [41]. Only the base of the Moore House Member was dated, thus the top of the Yorktown Formation may be younger than 3.1 Ma.
Dowsett et al. [18] correlated the Holland Core alkenone record to Integrated Ocean Drilling Program (IODP) Site U1313 in the North Atlantic, and ultimately to the LR04 timescale [42]. This correlation places the Marine Isotope Stage (MIS) M2/M1 transition (~3.30 Ma to ~3.24 Ma) as extending from the unconformity at the base of the transgressive Rushmere Member (45.9 m) up into the lower Morgarts Beach Member in the Holland core. The Rushmere Member therefore represents a rapid transgression following the global sea level lowstand associated with MIS M2 [18].The occurrence of the dinoflagellate species Invertocysta lacrymosa at 10.27 m (Edwards, unpublished data, 8 January 2018) suggests an age for the uppermost Morgarts Beach sediments of ~2.74 Ma [43].
In the study area, the marine regression corresponding to the MIS M2 glacial event removed part or all of Zone 1 Yorktown sediments. Within the Holland Core, this regression resulted in erosion of all of Zone 1 (Zanclean stage) as well as latest Messinian aged material. Immediately below the unconformity, sediments of the Eastover Formation are assigned to the Miocene dinoflagellate zone DN10 [43] (Edwards, unpublished data, 8 January 2018).

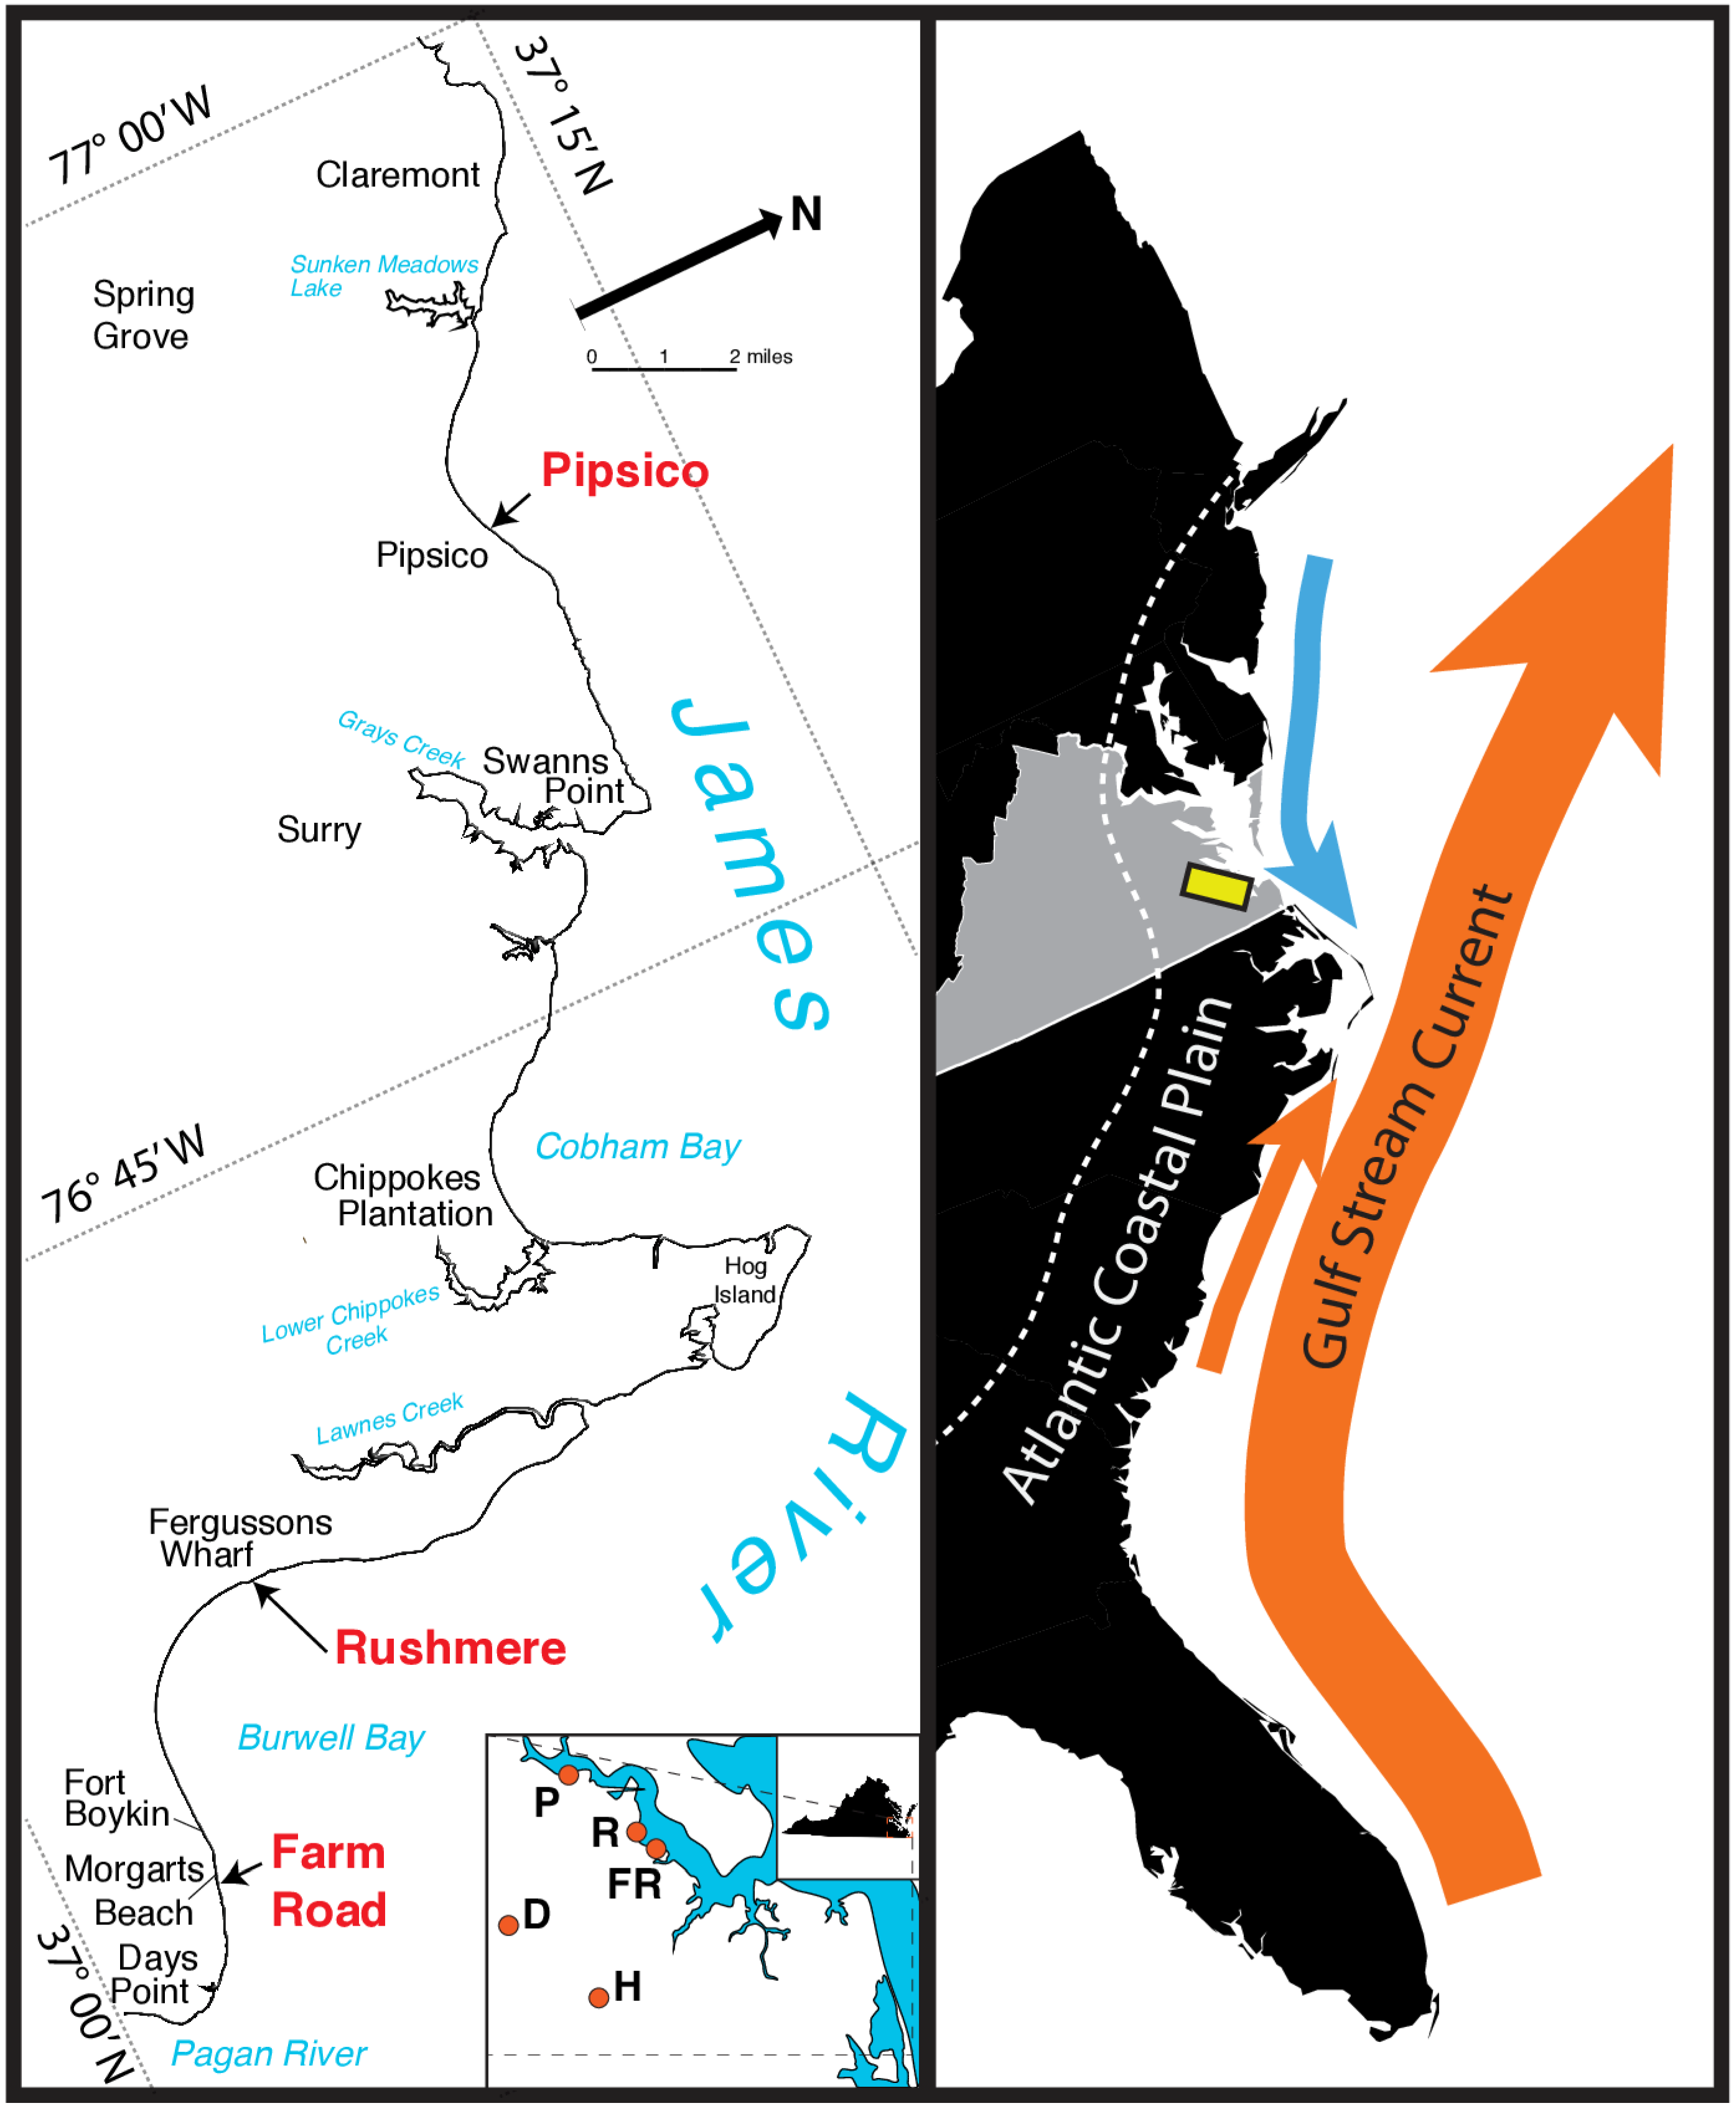
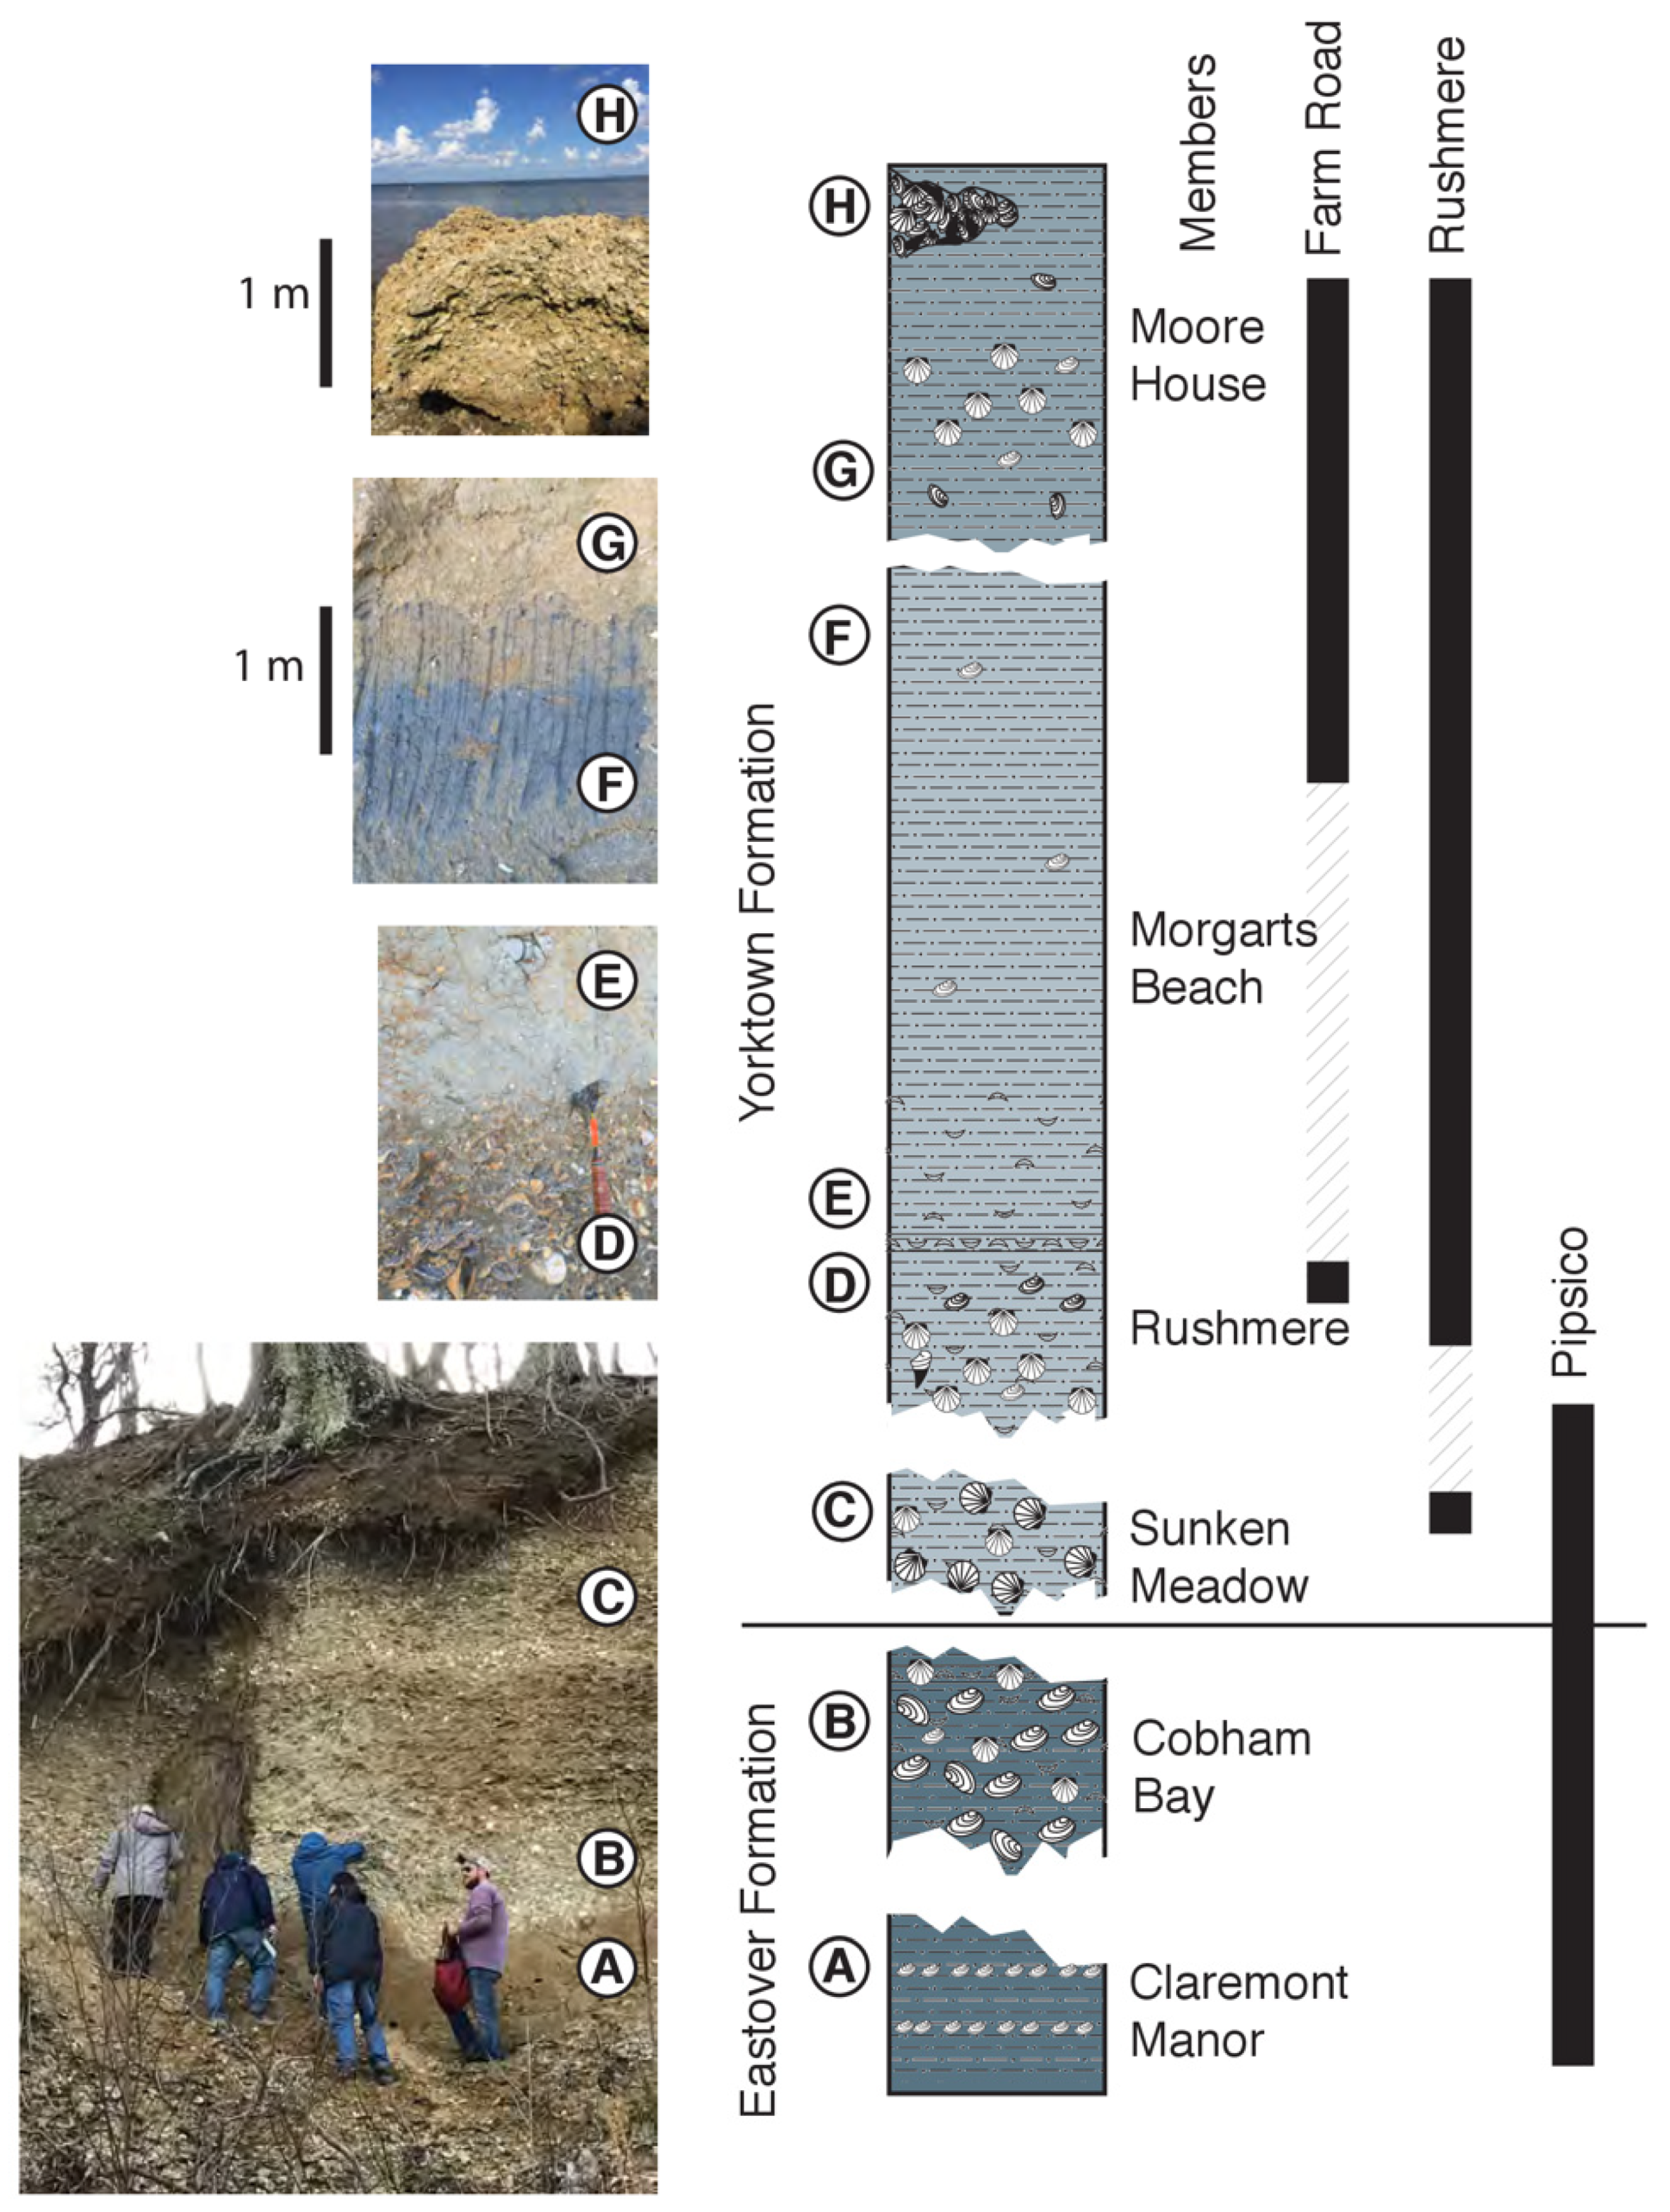
2.3. James River Composite Section

Ward and Blackwelder [9] chose a lectostratoype for the Yorktown Formation at Rushmere, Virginia, on the south bank of the James River, ~300 m down-river of the former Fergusson’s Wharf locality described by Clark and Miller [32] (Figure 1). The Rushmere locality exposes the Rushmere, Morgarts Beach, and Moore House Members, and is also designated as the stratotype for the Rushmere Member.
The basal unit at the Rushmere locality is ~1.4 m of blue–gray fine sandy clay with abundant shells, the Rushmere Member, which grades into the overlying Morgarts Beach Member. The Morgarts Beach Member is 5.5 m of blue-gray silty to fine sandy clay, which is in turn overlain by about 4 m of fragmental, often cemented bioclastic sand belonging to the Moore House Member of Ward and Blackwelder [9]. This can be found as large boulder-size pieces that have fallen to the beach (Figure 4).
At extreme low tide, Chesapecten valves, the majority of which are C. jeffersonius, an index fossil for Zone 1 Yorktown and the Sunken Meadow Member, are exposed along the outer beach at the Rushmere locality. Excavation at the base of the outcrop shows that C. jeffersonius is encountered ~1 m below the base of the section. Thus, while not noted by Ward and Blackwelder [9], their choice for the lectostratotype contains all four members (both Zone 1 and Zone 2) of the Yorktown Formation.
Clark and Miller also described a section downriver from Fergussons Bluff on the “south bank of James River at Morgarts, five miles north of Smithfield” [32]. At that time there were bluffs from Fort Boykins south to Days Point Farm at the intersection of the Pagan and James Rivers (Figure 1). Based upon their description, Clark and Miller were most likely describing a section near Fort Boykins, immediately north of the present day Morgarts Beach community. The term “Mogart” used on the USGS Mulberry Island 7 ½ min quadrangle for this location, and perpetuated on other documents, appears to be an error. A proposal to the U.S. Board on Geographic Names (BGN) to correct the name of Mogarts Beach in Isle of Wight County to Morgarts Beach, is under review. The now covered Fort Boykins section exposed Rushmere, Morgarts Beach, and Moore House lithologies, overlain by a Pleistocene unit [37]. The upper bed of the Yorktown Formation described by Clark and Miller [32] is equivalent to the Moore House while the lowest unit “bearing numerous fossils” would be equivalent to the Rushmere Member of Ward and Blackwelder [9]. The section between these upper and lower beds is referred to as the Morgarts Beach Member.
Ward and Blackwelder [9] chose a section closer to Days Point, about 1 km below the community of Morgarts Beach, as the stratotype for their Morgarts Beach Member. They describe the section as having Rushmere lithology at the base overlain by “gray fine slightly sandy clay (tan where weathered) containing abundant small shell (Mulinia) throughout.” Unfortunately, neither the Morgarts Beach type section, nor the section at Fort Boykin, are accessible, having been graded and rip-rapped to retard bluff retreat. Here, we propose the section at Rushmere as the neostratotype locality for the Morgarts Beach Member (Figure 1).
There is an outcrop along Morgarts Beach Road (0.25 km northwest of the intersection of Farm Road and Morgarts Beach Road) located south of Fort Boykins (Figure 1). To avoid confusion with the original Morgarts Beach type locality of Ward and Blackwelder [9], we refer to this as the Farm Road locality. The locality exposes 6.5 m of dark gray (weathers to tan) silty clay and clay-rich fine sand. The lowest ~2 m is more clayey with abundant Mulinia, similar to the Morgarts Beach Member at Rushmere. This basal clay-rich layer is separated from the overlying silt and fine sand by an irregular and burrowed surface (Figure 4). This is the contact between the Morgarts Beach Member (below) and the Moore House Member (above). The sequence is capped by buff-colored cemented fragmented fossil layers that are also assigned to the Moore House Member. Notably absent are specimens of Chesapecten. However, at extreme low tide, shells of Chesapecten madisonius are found which suggests the presence of the Rushmere Member in the shallow subsurface. Thus, the Farm Road section at Morgarts Beach is essentially the same as the section described from Fort Boykins [37].
These two sections, Rushmere and Farm Road, together, provide accessible contacts between the Rushmere, Morgarts Beach, and Moore House Members or Zone 2 of the Yorktown Formation.
Zone 1 Yorktown (Sunken Meadow Member of Ward and Blackwelder [9]) is exposed at Pipsico Scout Reservation, on the south bank of the James River, 5 km southeast of Sunken Meadow Lake (Figure 1). Here, the base of the cliff is obscured by vegetation and slumping. About 16–17 m above beach level, a well sorted silt with few fossils is encountered. Above that is approximately 2 m of fossiliferous sand with common specimens of Isognomon sp. with a characteristic pearlescent luster [9]. These two beds, separated by an unconformity, correspond to the Claremont Manor and Cobham Bay Members, respectively, of the Miocene Eastover Formation. An unconformity separates the Cobham Bay Member from the overlying Sunken Meadow Member of the Yorktown Formation. The Sunken Meadow Member is coarse sand with abundant mollusks including Chesapecten jeffersonius, the marker for Zone 1 of the Yorktown. At the Pipsico locality, the Sunken Meadow Member is about 2.0 m in thickness. At the very top of the section, there are small patches of the Rushmere Member with abundant specimens of Chama congregata (Figure 4).
These three sections (Pipsico, Rushmere, and Farm Road) can be composited to provide a stratigraphic framework for the Yorktown Formation, providing access to all four members (Figure 4).
In addition to the outcrop sections described above, we analyzed core samples from two Coastal Plain cores (see Table 1, Figure 1): the Holland Ball Park (DEQ 161-592) and Dory Murphy Brown Farm (DEQ 187-262) cores, hereinafter referred to simply as the Holland and Dory cores.

3. Materials and Methods

3.1. Alkenones

Paleotemperatures were estimated for 485 Yorktown Formation samples at the Rushmere and Farm Road localities and in the Holland and Dory cores [44], using the U 37 K index, which is based on the temperature dependence of double and triple carbon bonds in the alkenones produced by haptophyte algae [45,46,47,48]. Temperature estimates derived using this technique have an analytical error of 0.1 °C and are calibrated using the Müller coretop calibration [49] with a calibration uncertainty of ±1.38 °C [48].
All alkenone data were generated at the Brown University Alkenone Lab. Details of the technique have been previously published but are included here for completeness. Sediment samples of 1–5 g dry weight were extracted via a Dionex ASE (methylene chloride as solvent) and prepared for gas chromatography using toluene as the solvent for sample injection. Gas chromatographic analyses were carried out on Agilent 5890 and 6890 gas chromatographs equipped with 60 m DB-1 chromatographic columns and Flame Ionization Detection, with a temperature ramp at 25 °C to 240 °C, followed by ramping at 1.5 °C to 320 °C. Gas chromatographic quality control is maintained by daily analysis of a laboratory standard alkenone mixture and by running the same sample at the beginning and end of each gas chromatograph run to determine sample drift due to changing chromatographic conditions. Analysis of both lab standard and sample replication indicates a long-term replication of U 37 K values equivalent to 0.1–0.2 °C. C37 total was used as an indicator for productivity [50,51].

3.2. Planktonic Foraminifera

Our Coastal Plain microfossil sediment samples varied in volume and weight, but generally ~300–500 g of sediment were oven dried at ≤50 °C and agitated in a dilute (5 gL−1 water) sodium hexametaphosphate solution for up to 2 h. Samples were then wet-sieved on a 63 μm mesh until clean, dried at ≤50 °C, and dry-sieved to concentrate the >150 μm coarse fraction. In some cases, the coarse fraction was further processed using a soap floating technique [52] to concentrate foraminifers. After drying, specimens were picked from the floated material, and the residual sample was scanned for additional specimens.
Planktonic foraminifer specimens were obtained from the Rushmere locality and the Holland and Dory cores. At Rushmere 1699 specimens were recovered from nine samples and identified to species level following the taxonomic concepts of Parker [53,54], Blow [39], and Dowsett and Robinson [55].
Species richness (S), Shannon Diversity (H’), and Evenness (E) were calculated for all planktonic foraminifer bearing samples using Equations (1) and (2):
H = i = 1 S p i ln p i
E = e H / S
where S is the total number of species and pi the proportion of S made up of the ith species [56,57,58].

4. Results

4.1. Alkenone SST and Productivity

Temperature estimates based upon U 37 K suggested a sea surface temperature (SST) of ~26.12 °C for the Yorktown Formation. At the Rushmere locality, temperatures ranged from 25.98 °C to 26.78 °C. Holland core temperatures ranged from 24.62 °C to 26.79 °C, and the Dory core SST estimates ranged from 24.59 °C to 27.38 °C. Twenty-seven samples from three levels in the Morgarts Beach Member at the Farm Road locality [44] yielded a mean annual SST estimate of 26.03 °C with a minimum of 25.88 °C and a maximum of 26.23 °C.
The three localities that preserve the Rushmere—Morgarts Beach transition (Figure 5) showed overall similarities in both SST and productivity. All three sites showed temperatures that first increase and then decrease within the Rushmere and rise again in the lower Morgarts Beach Member. Low amplitude variability in productivity (measured by total C37) throughout the Rushmere Member was followed by peak productivity in the lower part of the Morgarts Beach Member at all three sites. Total C37 ranged between 1.00 µg/g and 7.22 µg/g (mean = 3.50 µg/g) at Rushmere, 0 µg/g and 6.10 µg/g (mean = 2.16 µg/g) at the Holland core, and 0.03 µg/g and 4.04 µg/g (mean = 1.28 µg/g) at the Dory core.

4.2. Faunal Analysis

Nine samples were examined for planktonic foraminifers at the Rushmere locality (Table 2). Calcareous microfossils were dissolved in the uppermost sample at 510 cm, and only seven specimens, belonging to Globigerina bulloides and Neogloboquadrina acostaensis, both dissolution resistant taxa, were recovered. The remaining samples had a mean recovery of 212 specimens. The number of planktonic foraminifers per gram increased upward through the Rushmere Member and peaked in the lower part of the Morgarts Beach Member (Table 2, Figure 5). Species richness also increased upward through the Rushmere Member and peaked in the lower part of the Morgarts Beach Member, then decreased above 187 cm. Samples combined from the type locality exhibited a species richness of 25, though no sample had more than 17 species. Shannon Diversity (H’) [55] and Evenness (E) [56] indices followed similar trends with little variation other than the uppermost sample with only seven specimens and signs of dissolution.
Samples were quantitatively dominated by G. bulloides, Globigerinoides obliquus, Gs. ruber, Trilobatus sacculifer, and Globigerinita gutinata. The overall Yorktown assemblage has closest affinities with the Low Latitude—Mid Latitude [55], Tropical–Transitional [18] and Warm [59] assemblages of the North Atlantic.

5. Discussion

5.1. Chronology

The Pliocene age of the Yorktown Formation was first established by Hazel based upon ostracod biostratigraphy [36]. Cronin et al. [61] summarized available biostratigraphic and paleomagnetic data and suggested an age of 4.8 Ma for the base of the Sunken Meadow Member and 3 Ma for the top of the Moore House Member. Krantz [13] tied Neogene units on the MACP to marine oxygen isotope records from Deep Sea Drilling Project (DSDP) Sites 552, 572, 588, 606, and 607, and the Ocean Drilling Program (ODP) Site 655 [62,63,64,65,66,67], bracketing the Yorktown Formation as being between 4 and 3 Ma. Dowsett and Wiggs suggested a Yorktown age between 4 and 2.9 Ma (3.1 Ma when calibrated to the current GPTS [41]) based upon planktonic foraminifer biochronology [14].
Yorktown Formation sediments recovered from the Holland core have been correlated to IODP Site 1313 using alkenone biomarkers [18]. This allowed correlation to MIS and paleomagnetic reversal stratigraphy in the LR04 timescale [68]. Zone 1 Yorktown is not present in the Holland core so that Rushmere sediments sit unconformably on the Miocene Eastover Formation (Figure 5).
Here, we extend the chronology from the Holland core to the lectotype section of the Yorktown at Rushmere (Figure 6). Assuming the Rushmere Member represents a rapidly transgressing unit following the low stand of sea level associated with MIS M2, it is logical to assume sediment accumulation began sometime after 3.30 Ma due to nondeposition during maximum regression. Our correlations suggest the Rushmere Member represents deposition during the latter part of the MIS M2-M1 transition, the gradational change from Rushmere to Morgarts Beach lithology correlates to MIS KM6, and the Morgarts Beach Member at Rushmere contains sediments deposited during KM5–KM3 (3.2–3.15 Ma). This interpretation is supported by unpublished paleomagnetic data (Liddicoat, personal communication, 29 April 2021) that indicates the Morgarts Beach at the Yorktown type section exhibits normal polarity. The Morgarts Beach—Moore House contact then may represent the brief lowstand associated with MIS KM2 (3.13 Ma). These correlations suggest a sediment accumulation rate of ~1.2 cm·ky−1 for the upper part of the Rushmere Member and lower part of the Morgarts Beach Member. While our work does not yet bear on the ages of the top and bottom of the Yorktown Formation, we have established detailed chronology for the Rushmere and Morgarts Beach Members. We date Zone 2 Yorktown exposed at the type locality as ~3.3 Ma to ~3.0 Ma, though the top of the Moore House Member at Rushmere is unconstrained.
Our age model would place MIS KM5c within the lower part of the Morgarts Beach Member at ~150 cm at the Rushmere locality, and at ~34 m and ~20 m depth in the Holland and Dory cores, respectively. Identification of KM5c in the Yorktown Formation is important since it was the interval chosen for investigation by the second phase of the Pliocene Model Intercomparison Project (PlioMIP2) [69]. With this updated age model, aside from improved control on SST data, it may be possible to obtain mollusks from within the KM5c interval for sclerochronological analyses. These analyses could shed light on seasonality and productivity from the MACP that can be integrated with a global network of existing paleoenvironmental data [5,18,70,71,72] as well as results from seventeen PlioMIP2 paleoclimate experiments [7,73,74,75,76,77,78,79,80,81,82,83,84,85,86,87].

5.2. Mid-Piacenzian Conditions on the MACP

Previously published isotopic analyses of mollusks from the Rushmere Member at Fort Boykins are available from a single specimen of Chesapecten madisonius and six specimens of Mercenaria spp. [88,89]. Using a δ 18 O SW of +1.1‰, winter and summer bottom water temperatures (BWT) recorded by C. madisonius were 13.3 °C and 29.3 °C, respectively [16,17]. A difference of ~4–6 °C exists between the maximum temperatures of bottom and surface waters at a depth of 30 m on the shelf today [90]. Assuming a similar water depth and allowing for a 4 °C difference between BWT and SST for the Rushmere, summer SST could have been 33.5 °C [17]. If a δ 18 O SW value of +0.7‰ is adopted, a slightly cooler summer BWT of 27.3 °C (SST 31.3 °C) results. The δ 18 O SW value depends upon the global ice volume offset one chooses [16,17].
The Mercenaria shells from Fort Boyken together document ~18 annual temperature cycles with a mean winter BWT of 17 °C and a mean summer BWT of 25 °C. Assuming again a potential 4 °C difference between bottom and surface waters, this would represent summer temperatures of ~29 °C.
Our SST estimate of ~26 °C for the MPWP, if interpreted as an indicator of spring or summer conditions, is compatible with the existing isotopic analyses for the Rushmere Member.
A single specimen of Carolinapecten eboreus from the up-dip limits of the Morgarts Beach Member at Petersburg, ~65 km WNW of the Rushmere Type Section, was analyzed for oxygen isotopes [88] and yielded BWT of 12.5 °C in winter and 18.8 °C in summer. If a δ 18 O SW of +0.7‰ is used winter and summer BWT would be 10.9 °C and 17.1 °C respectively [16,17,19]. Four additional specimens of C. eboreus were analyzed from the Morgarts Beach Member near Suffolk, ~40 km south of the Rushmere locality on the Nansemond River [19]. These specimens provide a mean for winter (summer) BWT of 9.4 °C (21.1°C) using δ 18 O SW of +0.7‰, and hence, a depth-corrected summer SST of 25.1 °C, close to our alkenone based estimate of 26 °C. While the U 37 K index is calibrated to mean annual SST [18,91], seasonal biases may exist due to changes in timing of production [92]. If our alkenone based SSTs are indicating late spring or summer productivity, the agreement between the two paleothermometers is improved.
Comparison of our SST estimates with BWT estimates based upon δ 18 O of individual mollusk shells is useful in characterizing MACP conditions but requires several assumptions. Choice of δ 18 O SW (+0.7‰ or +1.1‰) makes a difference in the summer BWT estimates, for the analyses discussed above, of up to 2 °C. Water depth estimates at the time of Yorktown deposition are qualitative, based upon mollusk and foraminiferal assemblages, and range from 20 to 40 m. Present day conditions off the coast of southeastern Virginia show summer BWT can vary by as much as 6 °C over that depth range [90]. Conversion of BWT to SST then requires the additional assumption that modern vertical temperature profiles at similar shelf depths were the same during deposition of the Yorktown. This assumes a similar degree of stratification in the water column. A seasonal bias to surface water productivity could shift the U 37 K SST estimate from a mean annual temperature to late spring or summer. Any changes to the timing of productivity with respect to the annual cycle, potentially more likely in a coastal setting than in the open ocean, would require a different interpretation. In addition, there is a tendency to neglect some basic features of the geologic record when comparing different systems. The Yorktown includes discontinuous sedimentary packages deposited during several transgressions, separated by varying amounts of time. All units examined show signs of bioturbation. Thus, our alkenone records are time averaged, as in the open ocean, but possibly more so in a shallower setting [70]. This places real limits on obtainable resolution.
Sclerochronology provides a temporally highly resolved window of temperature and growth variation over the course of a couple of years, something rarely achieved in deep-time marine studies. However, these short records cannot typically be placed in sequence within a chronologic framework. Conversely, time averaged (through natural processes) but continuous records of paleotemperature based upon chemical and faunal assemblage analyses can provide context for the individual data points of shells.
These proxies estimate different aspects of paleotemperature and need not (and in most cases should not) be concordant. Even if water depth was known, and timing of alkenone production during the annual cycle could be ascertained with confidence, there would be differences. A more robust understanding of paleoclimate conditions can be obtained by analyzing the situations that lead to different estimates [93]. Our refined chronology and SST record for the Rushmere–Morgarts Beach transgression provides a framework within which these and future studies can be assessed.

5.3. Paleoclimate Interpretations from Yorktown Formation Data

In one of the first paleoclimatic interpretations of the Yorktown Formation, Lyell described exposures of richly fossiliferous beds along the lower James River that today belong to the Eastover and Yorktown Formations [26,94]. His comparisons with faunas on the opposite shores of the Atlantic suggested a climate for southeastern Virginia warmer than that of the crags in Suffolk, England, cooler than that of the Bordeaux region in France, and possibly equal to that of the Faluns of Touraine [26]. Since that time many studies including those based upon mollusks, foraminifers, ostracods, and bryozoans have led to a nuanced understanding of paleoceanographic conditions during the deposition of the Yorktown Formation (e.g., [8,9,12,36,61,88,95,96]).
Yorktown mollusk occurrences suggest temperate conditions during deposition of the early Pliocene (Zanclean Age) Sunken Meadow Member [97]. This is further supported by paleotemperature estimates based upon stable isotopic analysis of mollusk shells [16,17,88,98,99]. Micropaleontological evidence from the shallow marine record of the Caribbean northward along the Coastal Plain of North America suggests that the Central American Seaway (CAS) was open during the Zanclean, and conditions were cooler and less saline along the Atlantic coast as a result [8,12,17,95,100,101,102].
Restriction of Caribbean and Pacific surface waters due to closure of the CAS was fully established by ~4.2 Ma [103,104]. While this set up the present-day salinity contrast on either side of the Isthmus of Panama, occasional breaches of the isthmus subsequent to the mid-Piacenzian have been documented (e.g., [18,100,105]). Closure of the CAS resulted in warm salty water moving northward along the east coast of North America as the Gulf Stream Current. Ostracod assemblages from the Yorktown Formation in Virginia and the correlative Duplin Formation in North Carolina indicate increasing numbers of thermophilic taxa presumably associated with the closing of the CAS [8,61,96]. Piacenzian mollusk assemblages from the Rushmere and Morgarts Beach Members suggest open-marine warm temperate conditions with a subtropical influence [37,106]. Isotopic analysis of specimens of Chesapecten madisonius, Carolinapecten eboreus, and Mercenaria spp. also indicate much warmer conditions during deposition of the Rushmere and Morgarts Beach Members (e.g., [17,88,89]). Reduced seasonality relative to present day, due to warmer winter temperatures, has been recorded by mollusks, planktonic foraminifers, and bryozoans [14,16,17,89,107].
At the Rushmere locality, our alkenone data show a general increase in SST through the Rushmere Member and into the Morgarts Beach Member. Over this same interval, our faunal data show a steady increase in number of planktic specimens per gram (Figure 5, Table 2) as well as relative abundance of Globigerinoides ruber, a species with tropical affinities [55]. These data all corroborate increasing warmth on the MACP during the MIS M2–M1 transition.
Our data also suggest an overall increase in productivity from the M2–M1 transition into the Morgarts Beach Member. While fine scale details of the total productivity (measured by total C37) differ between localities (Figure 5), the highest values occur within the Morgarts Beach Member. Globigerina bulloides and Globigerinita glutinata are indicators of increased nutrients and together, in samples with greater than 100 specimens, account for ~50% of the faunal assemblage at Rushmere. Other factors can affect both the abundance of individual species as well as the amount of total C37 in shallow shelf sediments. However, taken together, we interpret our data to suggest that while variation exists, mean productivity is high and associated with conditions markedly warmer than during the pre-industrial period.
Today the Gulf Stream diverges from North America at Cape Hatteras and becomes the North Atlantic Current, directing warm salty water toward the northeastern North Atlantic. Planktonic foraminifer assemblages indicate warming of 2.9 °C relative to pre-industrial conditions 600 km to the ESE of the Yorktown type section, in the path of the Gulf Stream Current, at DSDP Site 603 [70]. Other sites in the North Atlantic also suggest a warmer Gulf Stream–North Atlantic Drift and a less steep latitudinal temperature gradient than today [18,59,70,72,101,108,109,110,111,112,113,114,115]. The Gulf Stream North Atlantic Drift system migrated northward over the M2/M1 transition, exhibited high-frequency migrations north and south during M1 and KM6, and attained its most northern position by KM5, the interval selected by PlioMIP2 for paleoclimate simulations [18].
Marine Isotope Stage (MIS) M2, responsible for the regression and resulting unconformity between Zone 1 and Zone 2 Yorktown, has been related to a brief reopening of the CAS that weakened the North Atlantic Current and temporarily reduced northward ocean heat transport [43,116]. The transition out of MIS M2 is associated with increasing SST’s and sea level recorded by the Rushmere–Morgarts Beach transgression. Our alkenone results document the M2–M1 warming at three locations in SE Virginia.
Climate model simulations suggest that an open CAS allowed mixing of Atlantic and Pacific waters thereby reducing the salinity contrast between the two basins. A less saline North Atlantic diminishes high latitude production of North Atlantic Deep water resulting in a much weaker Atlantic Meridional Overturning Circulation (AMOC) compared to simulations with a closed CAS [117]. In contrast, a closed CAS increases temperatures and salinity in the North Atlantic leading to increased production of deep waters at high latitudes and a comparatively stronger AMOC. These simulations support geological evidence for enhanced warming along the ACP as well as salinity changes in the Caribbean mentioned above.
There is ample geological evidence for the Bering Strait initially opening in the late Miocene [118,119] creating a connection between the Atlantic and Pacific via the Arctic also documented during at least parts of the Pliocene and early Pleistocene (e.g., [120,121]). However, the open or closed state of the Bering Strait, since the mid Piacenzian, is determined by glacioeustatic sea level and regional tectonic processes. The present-day shallow depth of the seaway (~50 m) as well as evidence for repeated episodes of subaerial exposure during the early Pliocene and Pleistocene [122,123,124] leave open the possibility of an intermittently closed Bering Strait during the MPWP [18,21].
Climate model experiments indicate that a closed Bering Strait has the effect of increasing salinity in the high-latitude North Atlantic by cutting off input of relatively less saline Pacific water to the Arctic. Higher salinity in the high latitude North Atlantic increases the AMOC and ocean heat transport [125,126,127]. This fits well with existing proxy based North Atlantic SST estimates [18,70,72] and the results of PlioMIP2 modeling experiments, which used the PRISM4 paleogeographic reconstruction featuring a closed BS [21].
The warm Pliocene conditions on the ACP represented by the Yorktown Formation, documented by multiple fossil groups as well as our biomarker data, can be explained as the combined result of a closing CAS, enhanced warming due to a closed Bering Strait, and shifts in the subtropical gyre to the north of its present location [18]. An alternative explanation for Pliocene conditions in southeastern Virginia has been put forward by Johnson et al. [17]. They argue for generally warmer Pliocene conditions moderated at times by a cool Virginia Current from the north. We feel this hypothesis, which does not require direct Gulf Stream influence to explain Pliocene warmth, fits well with our data. Variability in the productivity data presented here (Figure 5) may support a persistent yet highly variable cool Virginia Current from the north, an extension of the Labrador Current. The position of the gyre and Gulf Stream have been shown to affect the Labrador Current and its extensions to the south [128]. In addition, the PRISM4 paleogeographic reconstruction [21] suggests closure of the Canadian Arctic Archipelago, effectively shutting off the Atlantic connection to the Arctic through the Labrador Sea and Baffin Bay. Linkages between the North Atlantic circulation, Labrador, and Virginia Currents, need to be explored for this part of the Pliocene. We feel the mechanism for providing cool waters from the north, along the coast, is closely coupled to the position of the gyre and fits the available isotopic data on mollusks and the alkenone data presented here. Additional data in the form of improved age models, microfossil abundances, alkenone analyses, and isotopic analyses of mollusks will allow for a more nuanced reconstruction of the Pliocene environment in southeastern Virginia.

6. Conclusions

Despite extensive erosion and development along riverbanks in southeastern Virginia, excellent outcrops exposing the Yorktown Formation are available. Still exposed is the lectostratoype for the Yorktown Formation (also the stratotype for the Rushmere Member) at Rushmere, Virginia [9], where the Rushmere, Morgarts Beach, and Moore House Members are exposed above beach level, and the Sunken Meadow Member can be accessed by digging. Because the stratotype locality for the Morgarts Beach Member is now inaccessible, we proposed the section at Rushmere as its neostratotype locality. We introduce a composite section comprised of the Rushmere section and newly described sections at Pipsico and Farm Road. Through correlation with the Dory and Holland cores, collected from areas to the west and south of the section at Rushmere, we provided an improved stratigraphic framework for the Yorktown Formation. We improved the chronology of the Yorktown Formation by establishing the maximum age ranges of the Rushmere Member (3.3.–3.2 Ma) and the Morgarts Beach Member (3.2–3.15 Ma).
The Yorktown Formation records paleoclimate conditions along the mid-Atlantic Coastal Plain during the mid-Piacenzian Warm Period (3.264 to 3.025 Ma), a climate interval of the Pliocene in some ways analogous to near future climate projections.
The biomarker data presented here represent the greatest concentration of paleotemperature estimates to date, for the Yorktown Formation, and more specifically the MPWP on the MACP, adding to our understanding of western North Atlantic temperature patterns, seasonality, and ocean circulation during the MPWP. These data supported previous estimates of warm conditions with reduced seasonality for the early Piacenzian of the MACP. We documented high frequency variability in productivity, which may support the persistence of a cool variable Virginia Coastal Current from the north.
The increased temporal resolution for the MPWP on the MACP provides a chronologic framework within which future studies analyzing the assembly and disassembly of ecological systems during intervals of profound climate change can be conducted.

Author Contributions

H.J.D. conceptualized and designed the study and wrote the first draft of the manuscript. Material preparation, data collection and analysis were performed by H.J.D., M.M.R., K.M.F. and T.D.H. All authors contributed to the revisions and have read and agreed to the published version of the manuscript.

Funding

This research is a product of the Geological Investigations of the Neogene Project, funded by the USGS Climate Research and Development/Land Change Science Program. TH acknowledges National Science Foundation grant NSF OC#- 1459280.

Data Availability Statement

Data presented or analyzed in this study are openly available in ScienceBase at https://doi.org/10.5066/F7959G1S and https://doi.org/10.5066/P9QKSO4W.

Acknowledgments

Our appreciation goes to Laurence and Deborah Demick, James and Elizabeth Landry, Kirsten Kopiczak, and the Tidewater Council of the Boy Scouts of America, for providing access to private properties. The Virginia Department of Environmental Quality provided access to the Holland and Dory cores. We appreciate help from Jennifer Williams England, Isle of Wight County Museum. We thank Lauck Ward, Tom Cronin, and Andrew Johnson for many discussions on the Neogene of the Atlantic Coastal Plain. Nancy Durika, Whittney Spivey, Stephanie Strothers, Kristen Steele, Jillian Powers, Jonathan Bloemers, and Patrick Robinson provided laboratory, field, and analytical assistance. The research described in this report used samples provided by the International Ocean Discovery Program (IODP), the Ocean Drilling Program (ODP), and the Deep Sea Drilling Project (DSDP). Any use of trade, firm, or product names is for descriptive purposes only and does not imply endorsement by the U.S. Government.

Conflicts of Interest

The authors declare no conflict of interest.

References

  1. Stocker, T.F.; Qin, D.; Plattner, G.K.; Tignor, M.; Allen, S.K.; Boschung, J.; Nauels, A.; Xia, Y.; Bex, B.; Midgley, B.M. IPCC, 2013: Climate Change 2013: The Physical Science Basis. Contribution of Working Group I to the Fifth Assessment Report of the Intergovernmental Panel on Climate Change; Cambridge University Press: Cambridge, UK, 2013. [Google Scholar]
  2. Hayhoe, K.; Edmonds, J.; Kopp, R.E.; LeGrande, A.N.; Sanderson, B.M.; Wehner, M.F.; Wuebbles, D.J. Climate models, scenarios, and projections. In Climate Science Special Report: Fourth National Climate Assessment, Volume I; Wuebbles, D.J., Fahey, D.W., Hibbard, K.A., Dokken, D.J., Stewart, B.C., Maycock, T.K., Eds.; U.S. Global Change Research Program: Washington, DC, USA, 2017; pp. 133–160. [Google Scholar]
  3. IPCC. Climate Change 2021: The Physical Science Basis. Contribution of Working Group I to the Sixth Assessment Report of the Intergovernmental Panel on Climate Change; IPCC: Ginevra, Switzerland, 2021.
  4. Haywood, A.M.; Dowsett, H.J.; Dolan, A.M. Integrating geological archives and climate models for the mid-Pliocene warm period. Nat. Commun. 2016, 7, 10646. [Google Scholar] [CrossRef] [PubMed]
  5. Dowsett, H.; Robinson, M.; Haywood, A.; Salzmann, U.; Hill, D.; Sohl, L.; Chandler, M.; Williams, M.; Foley, K.; Stoll, D. The PRISM3D paleoenvironmental reconstruction. Stratigraphy 2010, 7, 123–139. [Google Scholar]
  6. De la Vega, E.; Chalk, T.B.; Wilson, P.A.; Bysani, R.P.; Foster, G.L. Atmospheric CO2 during the mid-piacenzian warm period and the M2 glaciation. Sci. Rep. 2020, 10, 11002. [Google Scholar] [CrossRef]
  7. Haywood, A.M.; Tindall, J.C.; Dowsett, H.J.; Dolan, A.M.; Foley, K.M.; Hunter, S.J.; Hill, D.J.; Chan, W.L.; Abe-Ouchi, A.; Stepanek, C.; et al. The Pliocene model intercomparison project phase 2: Large-scale climate features and climate sensitivity. Clim. Past 2020, 16, 2095–2123. [Google Scholar] [CrossRef]
  8. Hazel, J.E. Paleoclimatology of the Yorktown Formation (Upper Miocene and Lower Pliocene) of Virginia and North Carolinas. Cent. Rech. Pau-SNPA Bull. 1971, 5, 361–375. [Google Scholar]
  9. Ward, L.W.; Blackwelder, B.W. Stratigraphic Revision of Upper Miocene and LOWER Pliocene Beds of the Chesapeake Group, Middle Atlantic Coastal Plain; U.S. Geological Survey Bull.: Reston, VA, USA, 1980; Volume 1482-D, p. 61.
  10. Gibson, T.G. Stratigraphy of miocene through Lower Pleistocene strata of the United States central Atlantic coastal plain. In Geology and Paleontology of the Lee Creek Mine, North Carolina; I: Smithsonian Contributions to Paleobiology; Ray, C.E., Ed.; Smithsonian Institution Offices: Washington, DC, USA, 1983; Volume 53, pp. 35–80. [Google Scholar]
  11. Snyder, S.W.; Mauger, L.L.; Akers, W.H. Planktonic foraminifera and biostratigraphy of the Yorktown Formation, Lee Creek Mine. In Geology and Paleontology of the Lee Creek Mine, North Carolina, I; Ray, C.E., Ed.; Smithsonian: Washington, DC, USA, 1983; Volume 53, pp. 455–481. [Google Scholar]
  12. Cronin, T.M. Pliocene shallow water paleoceanography of the North Atlantic ocean based on marine ostracodes. Quat. Sci. Rev. 1991, 10, 175–188. [Google Scholar] [CrossRef]
  13. Krantz, D.E. A chronology of Pliocene sea-level fluctuations: The U.S. Middle Atlantic coastal plain record. Quat. Sci. Rev. 1991, 10, 163–174. [Google Scholar] [CrossRef]
  14. Dowsett, H.J.; Wiggs, L.B. Planktonic foraminiferal assemblage of the Yorktown Formation, Virginia, USA. Micropaleontology 1992, 38, 75–86. [Google Scholar] [CrossRef]
  15. Campbell, L.D. Pliocene Molluscs from the Yorktown and Chowan River Formations in Virginia; Commonwealth of Virginia, Department of Mines, Minerals, and Energy, Division of Mineral Resources: Washington, DC, USA, 1993; Volume 127, p. 259.
  16. Williams, M.; Haywood, A.M.; Harper, E.M.; Johnson, A.L.A.; Knowles, T.; Leng, M.J.; Lunt, D.J.; Okamura, B.; Taylor, P.D.; Zalasiewics, J. Pliocene climate and seasonality in North Atlantic shelf seas. Philos. Trans. R. Soc. A 2009, 367, 85–108. [Google Scholar] [CrossRef]
  17. Johnson, A.L.A.; Valentine, A.; Leng, M.J.; Sloane, H.J.; SchÖNe, B.R.; Balson, P.S. Isotopic temperatures from the early and mid-Pliocene of the US middle Atlantic coastal plain, and their implications for the cause of regional marine climate change. Palaios 2017, 32, 250–269. [Google Scholar] [CrossRef] [Green Version]
  18. Dowsett, H.J.; Robinson, M.M.; Foley, K.M.; Herbert, T.D.; Otto-Bliesner, B.L.; Spivey, W. The mid-Piacenzian of the North Atlantic Ocean. Stratigraphy 2019, 16, 119–144. [Google Scholar] [CrossRef]
  19. Johnson, A.L.A.; Valentine, A.M.; Leng, M.J.; SchÖNe, B.R.; Sloane, H.J. Life history, environment and extinction of the scallop carolinapecten eboreus (conrad) in the plio-pleistocene of the U.S. eastern seaboard. Palaios 2019, 34, 49–70. [Google Scholar] [CrossRef]
  20. Kier, P.M. Upper Miocene Echinoids from the Yorktown Formation of Virginia and Their Environmental Significance; Smithsonian Institution: Washington, DC, USA, 1972. [Google Scholar]
  21. Dowsett, H.; Dolan, A.; Rowley, D.; Moucha, R.; Forte, A.M.; Mitrovica, J.X.; Pound, M.; Salzmann, U.; Robinson, M.; Chandler, M.; et al. The PRISM4 (mid-Piacenzian) paleoenvironmental reconstruction. Clim. Past 2016, 12, 1519–1538. [Google Scholar] [CrossRef] [Green Version]
  22. Colquhoun, D.J. The geology and physiography of the Orangeburg Scarp. In Southeastern Section of the Geological Society of America, Centennial Field Guide; Neathery, T.L., Ed.; Geological Society of America: Boulder, CO, USA, 1986; Volume 6, pp. 321–322. [Google Scholar]
  23. Dowsett, H.J.; Cronin, T.M. High eustatic sea level during the middle Pliocene: Evidence from the southeastern U.S. Atlantic Coastal Plain. Geology 1990, 18, 435–438. [Google Scholar] [CrossRef]
  24. Rowley, D.B.; Forte, A.M.; Moucha, R.; Mitrovica, J.X.; Simmons, N.A.; Grand, S.P. Dynamic topography change of the Eastern United States since 3 million years ago. Science 2013, 340, 1560. [Google Scholar] [CrossRef] [PubMed] [Green Version]
  25. Ward, L.W.; Allmon, W.D. History of paleontology in Virginia: 1607–2007. Bull. Am. Paleontol. 2019, 397, 196. [Google Scholar]
  26. Lyell, C. Travels in North America: With Geological Observations on the United States, Canada, and Nova Scotia; J. Murray: London, UK, 1845; Volume 2. [Google Scholar]
  27. Dana, J.D. Manual of Geology, 4th ed.; Ivison, Blakeman, Taylor: New York, NY, USA, 1895. [Google Scholar]
  28. Dana, J.D. Manual of Geology, 3rd ed.; Ivison, Blakeman, Taylor: New York, NY, USA, 1880; p. 912. [Google Scholar]
  29. Dana, J.D. Manual of Geology: Treating of the Principles of the Science, with Special Reference to American Geological History, for the Use of Colleges, Academies, and Schools of Science; T. Bliss & Company: Philadelphia, PA, USA, 1862; p. 798. [Google Scholar]
  30. Dall, W.H.; Harris, G.D. Correlation papers Neocene. U. S. Geol. Surv. Bull. 1892, 84, 349. [Google Scholar]
  31. Clark, W.B. A brief summary of the geology of the Virginia Coastal Plain. Va. Geol. Surv. Bull. 1906, 2, 11–24. [Google Scholar]
  32. Clark, W.B.; Miller, B.L.; Berry, E.W.; Watson, T.L. The Physiography and Geology of the Coastal Plain Province of Virginia; University of Virginia: Charlottesville, VA, USA, 1912. [Google Scholar]
  33. Mansfield, W.C. New fossil mollusks from the Miocene of Virginia and North Carolina, with a brief outline of the divisions of the Chesa-peake group. U. S. Natl. Mus. Proc. 1928, 74, 1–2. [Google Scholar] [CrossRef]
  34. Mansfield, W.C. Stratigraphy of the Miocene of Virginia and the Miocene and Pliocene of North Carolina: Mollusca from the Miocene and lower Pliocene of Virginia and North Carolina: Part 1. Pelecypoda. With a summary of the stratigraphy. U. S. Geol. Surv. Prof. Pap. 1943, 199-A, 1–178. [Google Scholar]
  35. Hazel, J.E. Atlantic continental shelf and slope of the United States—Ostracode zoogeography in the southern Nova Scotian and northern Virginian faunal provinces. U. S. Geol. Surv. Prof. Pap. 1970, 529E, 1–21. [Google Scholar]
  36. Hazel, J.E. Ostracode biostratigraphy of the Yorktown Formation (upper Miocene and lower Pliocene) of Virginia and North Carolina. U. S. Geol. Surv. Prof. Pap. 1971, 704, 13. [Google Scholar]
  37. Ward, L.W. Geology and Paleontology of the James River: Richmond to Hampton Roads; Virginia Museum of Natural History: Martinsville, VA, USA, 2008. [Google Scholar]
  38. Cronin, T.M.; Dowsett, H.J.; Gosnell, L.B.; Ross, R.M. Pliocene Marine Micropaleontology of Southeastern Virginia and Northeastern North Carolina; US Geological Survey Open-File Rep.; US Geological Survey: Reston, VA, USA, 1989. [CrossRef] [Green Version]
  39. Blow, W.H. Late middle Eocene to recent planktonic foraminiferal biostratigraphy. In Proceedings of the 1st International Conference on Planktonic Microfossils, Geneva, Switzerland, 1 January 1969; Bronniman, P., Renz, H.H., Eds.; E. J. Brill: Leiden, The Netherlands, 1969; pp. 199–422. [Google Scholar]
  40. Berggren, W.A. The pliocene time scale: Calibration of planktonic foraminiferal and calcareous nannoplankton zones. Nature 1973, 243, 391–397. [Google Scholar] [CrossRef]
  41. Ogg, J.G. Chapter 5—Geomagnetic polarity time scale. In The Geologic Time Scale; Elsevier: Boston, MA, USA, 2012; pp. 85–113. [Google Scholar]
  42. Lisiecki, L.E.; Raymo, M.E. A Pliocene-Pleistocene stack of 57 globally distributed benthic δ18O records. Paleoceanography 2005, 20. [Google Scholar] [CrossRef] [Green Version]
  43. De Schepper, S.; Head, M.J.; Groeneveld, J. North Atlantic Current variability through marine isotope stage M2 (circa 3.3 Ma) during the mid-Pliocene. Paleoceanography 2009, 24, PA4206. [Google Scholar] [CrossRef] [Green Version]
  44. Dowsett, H.J.; Foley, K.M.; Robinson, M.M.; Herbert, T.D. PRISM Late Pliocene (Piacenzian) Alkenone—Derived SST Data; U.S. Geological Survey: Reston, VA, USA, 2017. [CrossRef]
  45. Volkman, J.K. Ecological and environmental factors affecting alkenone distributions in seawater and sediments. Geochem. Geophys. Geosyst. 2000, 1, 1036. [Google Scholar] [CrossRef]
  46. Herbert, T.D. Review of alkenone calibrations (culture, water column, and sediments). Geochem. Geophys. Geosyst. 2001, 2, 1005. [Google Scholar] [CrossRef]
  47. Herbert, T.D. Alkenone palaeotemperature determinations. In The Oceans and Marine Geochemistry; Elderfield, H., Holland, H.D., Turekian, K.K., Eds.; Treatise on geochemistry Elsevier-Pergamon: Oxford, UK, 2004; Volume 6, pp. 391–432. [Google Scholar]
  48. Lawrence, K.T.; Herbert, T.D.; Dekens, P.S.; Ravelo, A.C. The application of the alkenone organic proxy to the study of Plio-Pleistocene climate. In Deep-Time Perspectives on Climate Change: Marrying the Signal from Computer Models and Biological Proxies; Williams, M., Haywood, A.M., Gregory, F.J., Schmidt, D.N., Eds.; Micropalaeontological Society (Special Publication), Geological Society of London: London, UK, 2007; pp. 539–562. [Google Scholar]
  49. Müller, P.J.; Kirst, G.; Ruhland, G.; von Storch, I.; Rosell-MelÈ, A. Calibration of the alkenone paleotemperature index U37K’ based on core-tops from the eastern South Atlantic and the global ocean (60° N–60° S). Geochim. Cosmochim. Acta 1998, 62, 1757–1772. [Google Scholar] [CrossRef]
  50. Bolton, C.T.; Lawrence, K.T.; Gibbs, S.J.; Wilson, P.A.; Cleaveland, L.C.; Herbert, T.D. Glacial-interglacial productivity changes recorded by alkenones and microfossils in late Pliocene eastern equatorial Pacific and Atlantic upwelling zones. Earth Planet. Sci. Lett. 2010, 295, 401–411. [Google Scholar] [CrossRef]
  51. Bolton, C.T.; Lawrence, K.T.; Gibbs, S.J.; Wilson, P.A.; Herbert, T.D. Biotic and geochemical evidence for a global latitudinal shift in ocean biogeochemistry and export productivity during the late Pliocene. Earth Planet. Sci. Lett. 2011, 308, 200–210. [Google Scholar] [CrossRef]
  52. Howe, H.V. Use of soap in the preparation of samples for micropaleontologic study. J. Paleontol. 1941, 15, 691. [Google Scholar]
  53. Parker, F.L. Planktonic foraminiferal species in Pacific sediments. Micropaleontology 1962, 8, 219–254. [Google Scholar] [CrossRef]
  54. Parker, F.L. Late Tertiary biostratigraphy (planktonic foraminifera) of tropical Indo-Pacific deep-sea cores. Bull. Am. Paleontol. 1967, 52, 115–208. [Google Scholar]
  55. Dowsett, H.J.; Robinson, M.M. Mid-Pliocene planktic foraminifer assemblage of the North Atlantic Ocean. Micropaleontology 2007, 53, 105–126. [Google Scholar] [CrossRef]
  56. Shannon, C.E. A mathematical theory of communication. Bell Syst. Tech. J. 1948, 27, 379–423. [Google Scholar] [CrossRef] [Green Version]
  57. Buzas, M.A.; Gibson, T.G. Species diversity: Benthonic foraminifera in western North Atlantic. Science 1969, 163, 72–75. [Google Scholar] [CrossRef] [PubMed]
  58. Collwell, R.K. EstimateS: Statistical Estimation of Species Richness and Shared Species from Samples, Version 9. User’s Guide and Application. Available online: http://purl.oclc.org/estimates (accessed on 1 January 2019).
  59. Dowsett, H.J.; Robinson, M.M.; Foley, K.M. Estimating Piacenzian Sea Surface Temperature Using an Alkenone-Calibrated Transfer Function; U.S. Geological Survey Science Investigate Report; U.S. Geological Survey: Reston, VA, USA, 2021; Volume 17. [CrossRef]
  60. Dowsett, H.J.; Spivey, W. Planktonic Foraminifer Census Data from Type Section of Yorktown Formation at Rushmere, Virginia; U. S. Geological Survey Data Release: Reston, VA, USA, 2021. [CrossRef]
  61. Cronin, T.M.; Bybell, L.M.; Poore, R.Z.; Blackwelder, B.W.; Liddicoat, J.C.; Hazel, J.E. Age and correlation of emerged pliocene and pleistocene deposits, U.S. Atlantic Coastal Plain. Palaeogeogr. Palaeoclimatol. Palaeoecol. 1984, 47, 21–51. [Google Scholar] [CrossRef]
  62. Shackleton, N.J.; Hall, M.A. Oxygen and carbon isotope stratigraphy of Deep Sea Drilling Project Hole 552A: Plio-Pleistocene glacial history. Initial. Rep. Deep. Sea Drill. Proj. 1985, 81, 599–609. [Google Scholar] [CrossRef]
  63. Prell, W.L. Pliocene stable isotope and carbonate stratigraphy (Holes 572C and 573A): Paleoceanographic data bearing on the question of Pliocene glaciation. Initial. Rep. Deep. Sea Drill. Proj. 1985, 85, 723–734. [Google Scholar] [CrossRef]
  64. Hodell, D.A.; Kennett, J.P. Late Miocene—Early pliocene stratigraphy and paleoceanography of the South Atlantic and Southwest Pacific Oceans: A synthesis. Paleoceanography 1986, 1, 285–311. [Google Scholar] [CrossRef]
  65. Keigwin, L.D. Pliocene stable-isotope record of Deep Sea Drilling Project Site 606: Sequential events of 18O enrichment beginning at 3.1 Ma. Initial. Rep. Deep. Sea Drill. Proj. 1987, 94, 911–917. [Google Scholar] [CrossRef]
  66. Raymo, M.E.; Ruddiman, W.F.; Backman, J.; Clement, B.M.; Martinson, D.G. Late pliocene variation in Northern Hemisphere Ice Sheets and North Atlantic deep water circulation. Paleoceanography 1989, 4, 413–446. [Google Scholar] [CrossRef]
  67. Curry, W.B.; Miller, K.G. Oxygen and carbon isotopic variation in Pliocene benthic foraminifers of the equatorial Atlantic. Proc. Ocean. Drill. Program Sci. Results 1989, 108, 157–166. [Google Scholar]
  68. Lisiecki, L.E.; Raymo, M.E. Pliocene-Pleistocene climate evolution: Trends and transitions in glacial cycle dynamics. Quat. Sci. Rev. 2007, 26. [Google Scholar] [CrossRef] [Green Version]
  69. Haywood, A.M.; Dowsett, H.J.; Dolan, A.M.; Rowley, D.; Abe-Ouchi, A.; Otto-Bliesner, B.; Chandler, M.A.; Hunter, S.J.; Lunt, D.J.; Pound, M.; et al. The Pliocene Model Intercomparison Project (PlioMIP) Phase 2: Scientific objectives and experimental design. Clim. Past 2016, 12, 663–675. [Google Scholar] [CrossRef] [Green Version]
  70. Dowsett, H.J.; Foley, K.M.; Stoll, D.K.; Chandler, M.A.; Sohl, L.E.; Bentsen, M.; Otto-Bliesner, B.L.; Bragg, F.J.; Chan, W.-L.; Contoux, C.; et al. Sea surface temperature of the mid-Piacenzian Ocean: A data-model comparison. Sci. Rep. 2013, 3, 1–8. [Google Scholar] [CrossRef]
  71. Salzmann, U.; Dolan, A.M.; Haywood, A.M.; Chan, W.-L.; Voss, J.; Hill, D.J.; Abe-Ouchi, A.; Otto-Bliesner, B.; Bragg, F.J.; Chandler, M.A.; et al. Challenges in quantifying Pliocene terrestrial warming revealed by data-model discord. Nat. Clim. Chang. 2013, 3, 969–974. [Google Scholar] [CrossRef]
  72. Foley, K.M.; Dowsett, H.J. Community Sourced Mid-Piacenzian Sea Surface Temperature (SST) Data; U.S. Geological Survey Data Release: Reston, VA, USA, 2019. [CrossRef]
  73. Chandan, D.; Peltier, W.R. Regional and global climate for the mid-Pliocene using the University of Toronto version of CCSM4 and PlioMIP2 boundary conditions. Clim. Past 2017, 13, 919–942. [Google Scholar] [CrossRef] [Green Version]
  74. Chandan, D.; Peltier, W.R. On the mechanisms of warming the mid-Pliocene and the inference of a hierarchy of climate sensitivities with relevance to the understanding of climate futures. Clim. Past 2018, 14, 825–856. [Google Scholar] [CrossRef] [Green Version]
  75. Hunter, S.J.; Haywood, A.M.; Dolan, A.M.; Tindall, J.C. The HadCM3 contribution to PlioMIP Phase 2 Part 1: Core and Tier 1 experiments. Clim. Past Discuss. 2019, 2019, 1–38. [Google Scholar] [CrossRef]
  76. Kamae, Y.; Yoshida, K.; Ueda, H. Sensitivity of Pliocene climate simulations in MRI-CGCM2.3 to respective boundary conditions. Clim. Past Discuss. 2016, 2016, 1–29. [Google Scholar] [CrossRef] [Green Version]
  77. Zhang, Z.; Li, X.; Guo, C.; Otterå, O.H.; Nisancioglu, K.H.; Tan, N.; Contoux, C.; Ramstein, G.; Feng, R.; Otto-Bliesner, B.L.; et al. Mid-Pliocene Atlantic meridional overturning circulation simulated in PlioMIP2. Clim. Past 2021, 17, 529–543. [Google Scholar] [CrossRef]
  78. Tan, N.; Contoux, C.; Ramstein, G.; Sun, Y.; Dumas, C.; Sepulchre, P.; Guo, Z. Modeling a modern-like pCO2 warm period (Marine Isotope Stage KM5c) with two versions of an Institut Pierre Simon Laplace atmosphere–ocean coupled general circulation model. Clim. Past 2020, 16, 1–16. [Google Scholar] [CrossRef] [Green Version]
  79. Stepanek, C.; Samakinwa, E.; Knorr, G.; Lohmann, G. Contribution of the coupled atmosphere–ocean–sea ice–vegetation model COSMOS to the PlioMIP2. Clim. Past 2020, 16, 2275–2323. [Google Scholar] [CrossRef]
  80. Samakinwa, E.; Stepanek, C.; Lohmann, G. Sensitivity of mid-Pliocene climate to changes in orbital forcing and PlioMIP’s boundary conditions. Clim. Past 2020, 16, 1643–1665. [Google Scholar] [CrossRef]
  81. Oldeman, A.M.; Baatsen, M.L.J.; von der Heydt, A.S.; Dijkstra, H.A.; Tindall, J.C.; Abe-Ouchi, A.; Booth, A.R.; Brady, E.C.; Chan, W.L.; Chandan, D.; et al. Reduced El Niño variability in the mid-Pliocene according to the PlioMIP2 ensemble. Clim. Past Discuss. 2021, 2021, 1–35. [Google Scholar] [CrossRef]
  82. Li, X.; Guo, C.; Zhang, Z.; Otterå, O.H.; Zhang, R. PlioMIP2 simulations with NorESM-L and NorESM1-F. Clim. Past 2020, 16, 183–197. [Google Scholar] [CrossRef] [Green Version]
  83. Han, Z.; Zhang, Q.; Li, Q.; Feng, R.; Haywood, A.M.; Tindall, J.C.; Hunter, S.J.; Otto-Bliesner, B.L.; Brady, E.C.; Rosenbloom, N.; et al. Evaluating the large-scale hydrological cycle response within the PlioMIP2 ensemble. Clim. Past Discuss. 2021, 2021, 1–32. [Google Scholar] [CrossRef]
  84. de Nooijer, W.; Zhang, Q.; Li, Q.; Zhang, Q.; Li, X.; Zhang, Z.; Guo, C.; Nisancioglu, K.H.; Haywood, A.M.; Tindall, J.C.; et al. Evaluation of Arctic warming in mid-Pliocene climate simulations. Clim. Past 2020, 16, 2325–2341. [Google Scholar] [CrossRef]
  85. Chan, W.L.; Abe-Ouchi, A. Pliocene Model Intercomparison Project (PlioMIP2) simulations using the Model for Interdisciplinary Research on Climate (MIROC4m). Clim. Past 2020, 16, 1523–1545. [Google Scholar] [CrossRef]
  86. Berntell, E.; Zhang, Q.; Li, Q.; Haywood, A.M.; Tindall, J.C.; Hunter, S.J.; Zhang, Z.; Li, X.; Guo, C.; Nisancioglu, K.H.; et al. Mid-Pliocene West African Monsoon rainfall as simulated in the PlioMIP2 ensemble. Clim. Past 2021, 17, 1777–1794. [Google Scholar] [CrossRef]
  87. Hunter, S.J.; Haywood, A.M.; Dolan, A.M.; Tindall, J.C. The HadCM3 contribution to PlioMIP phase 2. Clim. Past 2019, 15, 1691–1713. [Google Scholar] [CrossRef] [Green Version]
  88. Krantz, D.E. Mollusk-isotope records of plio-pleistocene marine paleoclimate, U.S. Middle Atlantic Coastal Plain. Palaios 1990, 5, 317–335. [Google Scholar] [CrossRef]
  89. Winkelstern, I.A.N.; Surge, D.; Hudley, J.W. Mulltiproxy sclerochronological evidence for Plio-Pleistocene regional warmth: United States Mid-Atlantic coastal plain. Palaios 2013, 28, 649–660. [Google Scholar] [CrossRef]
  90. Seidov, D.; Baranova, O.K.; Johnson, D.R.; Boyer, T.P.; Mishonov, A.V.; Parsons, A.R. Northwest Atlantic Regional Climatology; NOAA Atlas NESDIS 80, Tech.; NOAA: Silver Spring, MD, USA, 2016. [Google Scholar] [CrossRef]
  91. Huang, B.; Thorne, P.W.; Banzan, V.F.; Boyer, T.; Chepurin, G.; Lawrimore, J.H.; Menne, M.J.; Smith, T.M.; Vose, R.S.; Zhang, H.-M. NOAA Extended Reconstructed Sea Surface Temperature (ERSST), Version 5; NOAA National Centers for Environmental Information: Washington, DC, USA, 2017. [Google Scholar] [CrossRef]
  92. Bova, S.; Rosenthal, Y.; Liu, Z.; Godad, S.P.; Yan, M. Seasonal origin of the thermal maxima at the Holocene and the last interglacial. Nature 2021, 589, 548–553. [Google Scholar] [CrossRef] [PubMed]
  93. Dowsett, H.J.; Robinson, M.M.; Stoll, D.K.; Foley, K.M.; Johnson, A.L.A.; Williams, M.; Riesselman, C.R. The PRISM (Pliocene Palaeoclimate) reconstruction: Time for a paradigm shift. Philos. Trans. R. Soc. 2013, 371, 1–24. [Google Scholar] [CrossRef] [PubMed]
  94. Lyell, C. On the Miocene Tertiary Strata of Maryland, Virginia, and of North and South Carolina. Q. J. Geol. Soc. 1845, 1, 413–429. [Google Scholar] [CrossRef] [Green Version]
  95. Cronin, T.M.; Dowsett, H.J. A quantitative micropaleontologic method for shallow marine peleoclimatology: Application to Pliocene deposits of the western North Atlantic Ocean. Mar. Micropaleontol. 1990, 16, 117–147. [Google Scholar] [CrossRef]
  96. Cronin, T.M. Evolution of marine climates of the U.S. Atlantic Coast during the past four million years. Philos. Trans. R. Society. Ser. B Biol. Sci. 1988, 318, 661–678. [Google Scholar]
  97. Ward, L.W.; Bailey, R.H.; Carter, J.G. Pliocene and early Pleistocene stratigraphy, depositional history, and molluscan paleobiogeography of the coastal plain. In The geology of the Carolinas: Carolina Geological Society Fiftieth Anniversary Volume; Horton, J.W., Zullo, V.A., Eds.; University of Tennessee Press: Knoxville, TN, USA, 1991; pp. 274–289. [Google Scholar]
  98. Johnson, A.L.A.; Hickson, J.A.; Bird, A.; Schône, B.R.; Balson, P.S.; Heaton, T.H.E.; Williams, M. Comparative sclerochronology of modern and mid-Pliocene (c. 3.5 Ma) Aequipecten opercularis (Mollusca, Bivalvia): An insight into past and future climate change in the north-east Atlantic region. Palaeogeogr. Palaeoclimatol. Palaeoecol. 2009, 284, 164–179. [Google Scholar] [CrossRef]
  99. Valentine, A.; Johnson, A.L.; Leng, M.J.; Sloane, H.J.; Balson, P.S. Isotopic evidence of cool winter conditions in the mid-Piacenzian (Pliocene) of the southern North Sea Basin. Palaeogeogr. Palaeoclimatol. Palaeoecol. 2011, 309, 9–16. [Google Scholar] [CrossRef]
  100. Cronin, T.M.; Dowsett, H.J. Biotic and oceanographic response to the Pliocene closing of the Central American isthmus. In Evolution and Environment in Tropical America; Jackson, J.B.C., Budd, A.F., Coates, A.G., Eds.; University of Chicago Press: Chicago, IL, USA, 1996; pp. 76–104. [Google Scholar]
  101. Dowsett, H.J.; Cronin, T.M.; Poore, R.Z.; Thompson, R.S.; Whatley, R.C.; Wood, A.M. Micropaleontological Evidence for Increased Meridional Heat Transport in the North Atlantic Ocean During the Pliocene. Science 1992, 258, 1133–1135. [Google Scholar] [CrossRef] [PubMed]
  102. Haug, G.H.; Tiedemann, R. Effect of the formation of the Isthmus of Panama on Atlantic Ocean thermohaline circulation. Nature 1998, 393, 673–676. [Google Scholar] [CrossRef]
  103. Haug, G.; Tiedemann, R.; Zahn, R.; Ravelo, A. Role of Panama uplift on oceanic freshwater balance. Geology 2001, 29, 207–210. [Google Scholar] [CrossRef]
  104. Montes, C.; Cardona, A.; Jaramillo, C.; Pardo, A.; Silva, J.C.; Valencia, V.; Ayala, C.; Pérez-Angel, L.C.; Rodriguez-Parra, L.A.; Ramirez, V. Middle miocene closure of the Central American seaway. Science 2015, 348, 226–229. [Google Scholar] [CrossRef] [Green Version]
  105. Coates, A.; Jackson, J.B.C.; Collins, L.S.; Cronin, T.M.; Dowsett, H.J.; Bybell, L.M.; Jung, P.; Obando, J.A. Closure of the Isthmus of Panama: The near-shore marine record of Costa Rica and western Panama. Geol. Soc. Am. Bull. 1992, 104, 814–828. [Google Scholar] [CrossRef]
  106. Ward, L.W.; Gilinsky, N.L. Molluscan Assemblages of the Chowan River Formation; Virginia Museum of Natural History: Martinsville, VA, USA, 1993. [Google Scholar]
  107. Knowles, T.; Taylor, P.D.; Williams, M.; Haywood, A.M.; Okamura, B. Pliocene seasonality across the North Atlantic inferred from cheilostome bryozoans. Palaeogeogr. Palaeoclimatol. Palaeoecol. 2009, 277, 226–235. [Google Scholar] [CrossRef]
  108. Groeneveld, J. Effect of the Pliocene Closure of the Panamanian Gateway on Caribbean and East Pacific Sea Surface Temperatures and Salinities by Applying Combined Mg/Ca and δ18O Measurements (5.6–2.2 Ma); University of Kiel: Kiel, Germany, 2005. [Google Scholar]
  109. Bartoli, G.; Sarnthein, M.; Weinelt, M.; Erlenkeuser, H.; Garbe-Schonberg, D.; Lea, D.W. Final closure of Panama and the onset of northern hemisphere glaciation. Earth Planet. Sci. Lett. 2005, 237, 33–44. [Google Scholar] [CrossRef] [Green Version]
  110. Robinson, M.M.; Dowsett, H.J.; Dwyer, G.S.; Lawrence, K.T. Reevaluation of mid-Pliocene North Atlantic sea surface temperatures. Paleoceanography 2008, 23. [Google Scholar] [CrossRef] [Green Version]
  111. Dowsett, H.J.; Chandler, M.A.; Robinson, M.M. Surface temperatures of the Mid-Pliocene North Atlantic Ocean: Implications for future climate. Philos. Trans. R. Soc. A 2009, 367, 69–84. [Google Scholar] [CrossRef]
  112. Sarnthein, M.; Bartoli, G.; Prange, M.; Schmittner, A.; Schneider, B.; Weinelt, M.; Andersen, N.; Garbe-Sch√∂nberg, D. Mid-Pliocene shifts in ocean overturning circulation and the onset of Quaternary-style climates. Clim. Past 2009, 5, 269–283. [Google Scholar] [CrossRef] [Green Version]
  113. Herbert, T.D.; Peterson, L.C.; Lawrence, K.T.; Liu, Z. Tropical Ocean Temperatures Over the Past 3.5 Million Years. Science 2010, 328, 1530–1534. [Google Scholar] [CrossRef]
  114. Lawrence, K.T.; Herbert, T.D.; Brown, C.M.; Raymo, M.E.; Haywood, A.M. High-amplitude variations in North Atlantic sea surface temperature during the early Pliocene warm period. Paleoceanography 2009, 24, PA2218. [Google Scholar] [CrossRef]
  115. Robinson, M.M. New quantitative evidence of extreme warmth in the Pliocene Arctic. Stratigraphy 2009, 6, 265–275. [Google Scholar]
  116. De Schepper, S.; Groeneveld, J.; Naafs, B.D.A.; Van Renterghem, C.; Hennissen, J.; Head, M.J.; Louwye, S.; Fabian, K. Northern Hemisphere glaciation during the globally warm early Late Pliocene. PLoS ONE 2013, 8, e81508. [Google Scholar] [CrossRef]
  117. Lunt, D.; Valdes, P.; Haywood, A.; Rutt, I. Closure of the Panama Seaway during the Pliocene: Implications for climate and Northern Hemisphere glaciation. Clim. Dyn. 2008, 30, 1–18. [Google Scholar] [CrossRef]
  118. Marincovich, L.; Gladenkov, A.Y. Evidence for an early opening of the Bering Strait. Nature 1999, 397, 149–151. [Google Scholar] [CrossRef]
  119. Marincovich, L.; Gladenkov, A.Y. New evidence for the age of Bering Strait. Quat. Sci. Rev. 2001, 20, 329–335. [Google Scholar] [CrossRef]
  120. Cronin, T.M.; Whatley, R.; Wood, A.; Tsukagoshi, A.; Ikeya, N.; Brouwers, E.M.; Briggs, W.M., Jr. Microfaunal Evidence for Elevated Pliocene Temperatures in the Arctic Ocean. Paleoceanography 1993, 8, 161–173. [Google Scholar] [CrossRef]
  121. Matthiessen, J.; Knies, J.; Vogt, C.; Stein, R. Pliocene palaeoceanography of the Arctic Ocean and subarctic seas. Philos. Trans. R. Soc. A Math. Phys. Eng. Sci. 2009, 367, 21–48. [Google Scholar] [CrossRef]
  122. Hopkins, D.M. Cenozoic History of the Bering Land Bridge. Science 1959, 129, 1519–1528. [Google Scholar] [CrossRef] [PubMed]
  123. Hopkins, D.M. The Cenozoic History of Beringia—A Synthesis; Stanford University Press: Stanford, CA, USA, 1967; pp. 451–484. [Google Scholar]
  124. Nelson, C.H.; Hopkins, D.; Scholl, D. Tectonic Setting and Cenozoic Sedimentary History of the Bering Sea. In Marine Geology and Oceanography of the Arctic Seas; Herman, Y., Ed.; Springer: Berlin/Heidelberg, Germany, 1974; pp. 119–140. [Google Scholar]
  125. Hu, A.; Meehl, G.A.; Han, W.; Otto-Bliestner, B.; Abe-Ouchi, A.; Rosenbloom, N. Effects of the Bering Strait closure on AMOC and global climate under different background climates. Prog. Oceanogr. 2015, 132, 174–196. [Google Scholar] [CrossRef] [Green Version]
  126. Feng, R.; Otto-Bliesner, B.L.; Fletcher, T.; Tabor, C.; Ballantyne, A.P.; Brady, E. Amplified Late Pliocene Terrestrial Warmth in Northern High Latitudes from Greater Radiative Forcing and Closed Arctic Ocean Gateways; Elsevier: Amsterdam, The Netherlands, 2017; Volume 466, pp. 129–138. [Google Scholar]
  127. Otto-Bliesner, B.; Jahn, A.; Feng, R.; Brady, E.; Hu, A.; Löfverström, M. Changes in arctic gateways amplify North Atlantic Warming in the Late Pliocene: Arctic gateways and pliocene climate. Geophys. Res. Lett. 2017, 44, 957–964. [Google Scholar] [CrossRef]
  128. Gonçalves Neto, A.; Langan, J.A.; Palter, J.B. Changes in the Gulf Stream preceded rapid warming of the Northwest Atlantic Shelf. Commun. Earth Environ. 2021, 2, 74. [Google Scholar] [CrossRef]
Figure 1. Map showing location of the Farm Road, Rushmere, and Pipsico localities on the south bank of the James River (left panel). Inset map shows these localities and two core sites discussed in the text, (P) Pipsico, (R) Rushmere, (FR) Farm Road, (D) Dory core, (and H) Holland core. Right panel shows the location of the field area covered by left panel (yellow box) in relation to Virginia (gray) and the U.S. Atlantic Coastal Plain. Positions of the Gulf Stream Current, a relatively cool southward flowing Virginia Current (blue), and a warm Carolina Current (orange) are also shown.
Geosciences 11 00486 g001
Figure 2. Divisions of the Chesapeake Group, modified from Mansfield [33].
Geosciences 11 00486 g002
Figure 3. Historical subdivisions of the Yorktown Formation [9,31,32,33,34,35].
Geosciences 11 00486 g003
Figure 4. James River composite section. In stratigraphic order, (A) Claremont Manor Member and (B) Cobham Bay Member of the Miocene Eastover Formation. (C) Sunken Meadow Member of the Yorktown Formation. All three units are well exposed at the Pipsico locality. At the Rushmere locality, the abrupt but conformable contact between the (D) Rushmere Member and (E) Morgarts Beach Member of the Yorktown Formation is well exposed. The burrowed contact between the (F) Morgarts Beach Member and (G) Moore House Member of the Yorktown Formation is best exposed at the Farm Road locality. Fragmented and cemented (H) Moore House boulders can be found on the beach at the Rushmere locality. Black bars on the right indicate units exposed at the three localities. See text for further description of sections.
Geosciences 11 00486 g004
Figure 5. Temperature and Total C37 at the Rushmere locality and in the Holland and Dory cores. The outcrop section at Rushmere is measured in meters above the base of the exposure. Both the Holland and Dory cores are measured in meters depth in core. Planktonic foraminifers per gram of sediment (blue circles) are given for Rushmere locality samples. Paleomagnetic sample levels at the Rushmere locality are shown by black stars. Horizontal red dashed correlation lines indicate the Rushmere–Morgarts Beach transition (equivalent to MIS KM6), KM2, and KM4, after Lisiecki and Raymo [42]. Note changes in scales between localities.
Geosciences 11 00486 g005
Figure 6. Chronologic framework for the Yorktown Formation at Rushmere. Geomagnetic polarity time scale [41]. LR04 oxygen isotope stack with Marine Isotope Stages M2—G20 labeled [42]. Rushmere Member (RM), Morgarts Beach Member (MB), and Moore House Member (MH). Last appearances of Sphaeroidinellopsis seminulina (LAD 3.16 Ma) and Dentoglobigerina altispira (LAD 3.13 Ma) shown by arrows.
Geosciences 11 00486 g006
Table 1. Localities.
LocalityDesignationLatitudeLongitudeMembers Present
Farm Road37.03376.604Rushmere 1, Morgarts Beach, Moore House
Rushmere37.06776.669Sunken Meadow 1, Rushmere, Morgarts Beach, Moore House
Pipsico37.20276.882Claremont Manor, Cobham Bay, Sunken Meadow, Rushmere
Holland coreDEQ 161-59236.68276.781Eastover Fm. 2, Rushmere, Morgarts Beach
Dory coreDEQ 187-26236.85677.038Claremont Manor, Cobham Bay, Rushmere, Morgarts Beach
1 encountered only at extreme low tides; 2 identified to formation only.
Table 2. Planktonic foraminifer abundances from the Yorktown Formation Rushmere and Morgarts Beach Members at the Rushmere locality [60].
SampleMemberElevation (cm)Dentoglobigerina altispiraGlobigerina bulloidesGlobigerina falconensisGlobigerina umbilicataGlobigerinella calidaGlobigerinella siphoniferaGlobigerinita glutinataGlobigerinoides conglobatusGlobigerinoides obliquusGlobigerinoides ruberGloboconella puncticulataGloborotalia crassaformisGloborotalia hirsutaGloborotalia scitulaGloborotalia tumidaGloboturborotalita aperturaGloboturborotalita woodiNeogloboquadrina acostaensisNeogloboquadrina atlanticaNeogloboquadrina humerosaNeogloboquadrina incomptaNeogloboquadrina pachydermaOrbulina universaSphaeroidinellopsisTrilobatus sacculiferTotalPlanktics/gmSH’E
12MR10Morgarts Beach510 4 3 70.0320.680.99
17HD1583871603 217 28281 7 10121 201810.72141.980.52
17HD153299 95 114 2343 2 1 3 813332 2020.81141.670.38
17HD151259 853311291152 11 4 181640.66131.550.36
17HD14718731711 2259 34210 62 2733 3363731.49161.770.37
12HD11100174 271 2751415 1413 13 1 222811.12161.950.44
17HD141Rushmere80 1072 1523 2265 21 268 33 2452430.97171.850.37
12HD1065 36 3528 10112 2 331 1431480.59131.930.53
17HD14062 63 1 116 84 1 2 221000.40101.290.36
Publisher’s Note: MDPI stays neutral with regard to jurisdictional claims in published maps and institutional affiliations.

