
Importance of the Spatial Distribution of Rare Earth Elements in the Bottom Sediments of Reservoirs as a Potential Proxy for Tracing Sediments Sources. A Case Study in the Dominican Republic


Abstract
:1. Introduction
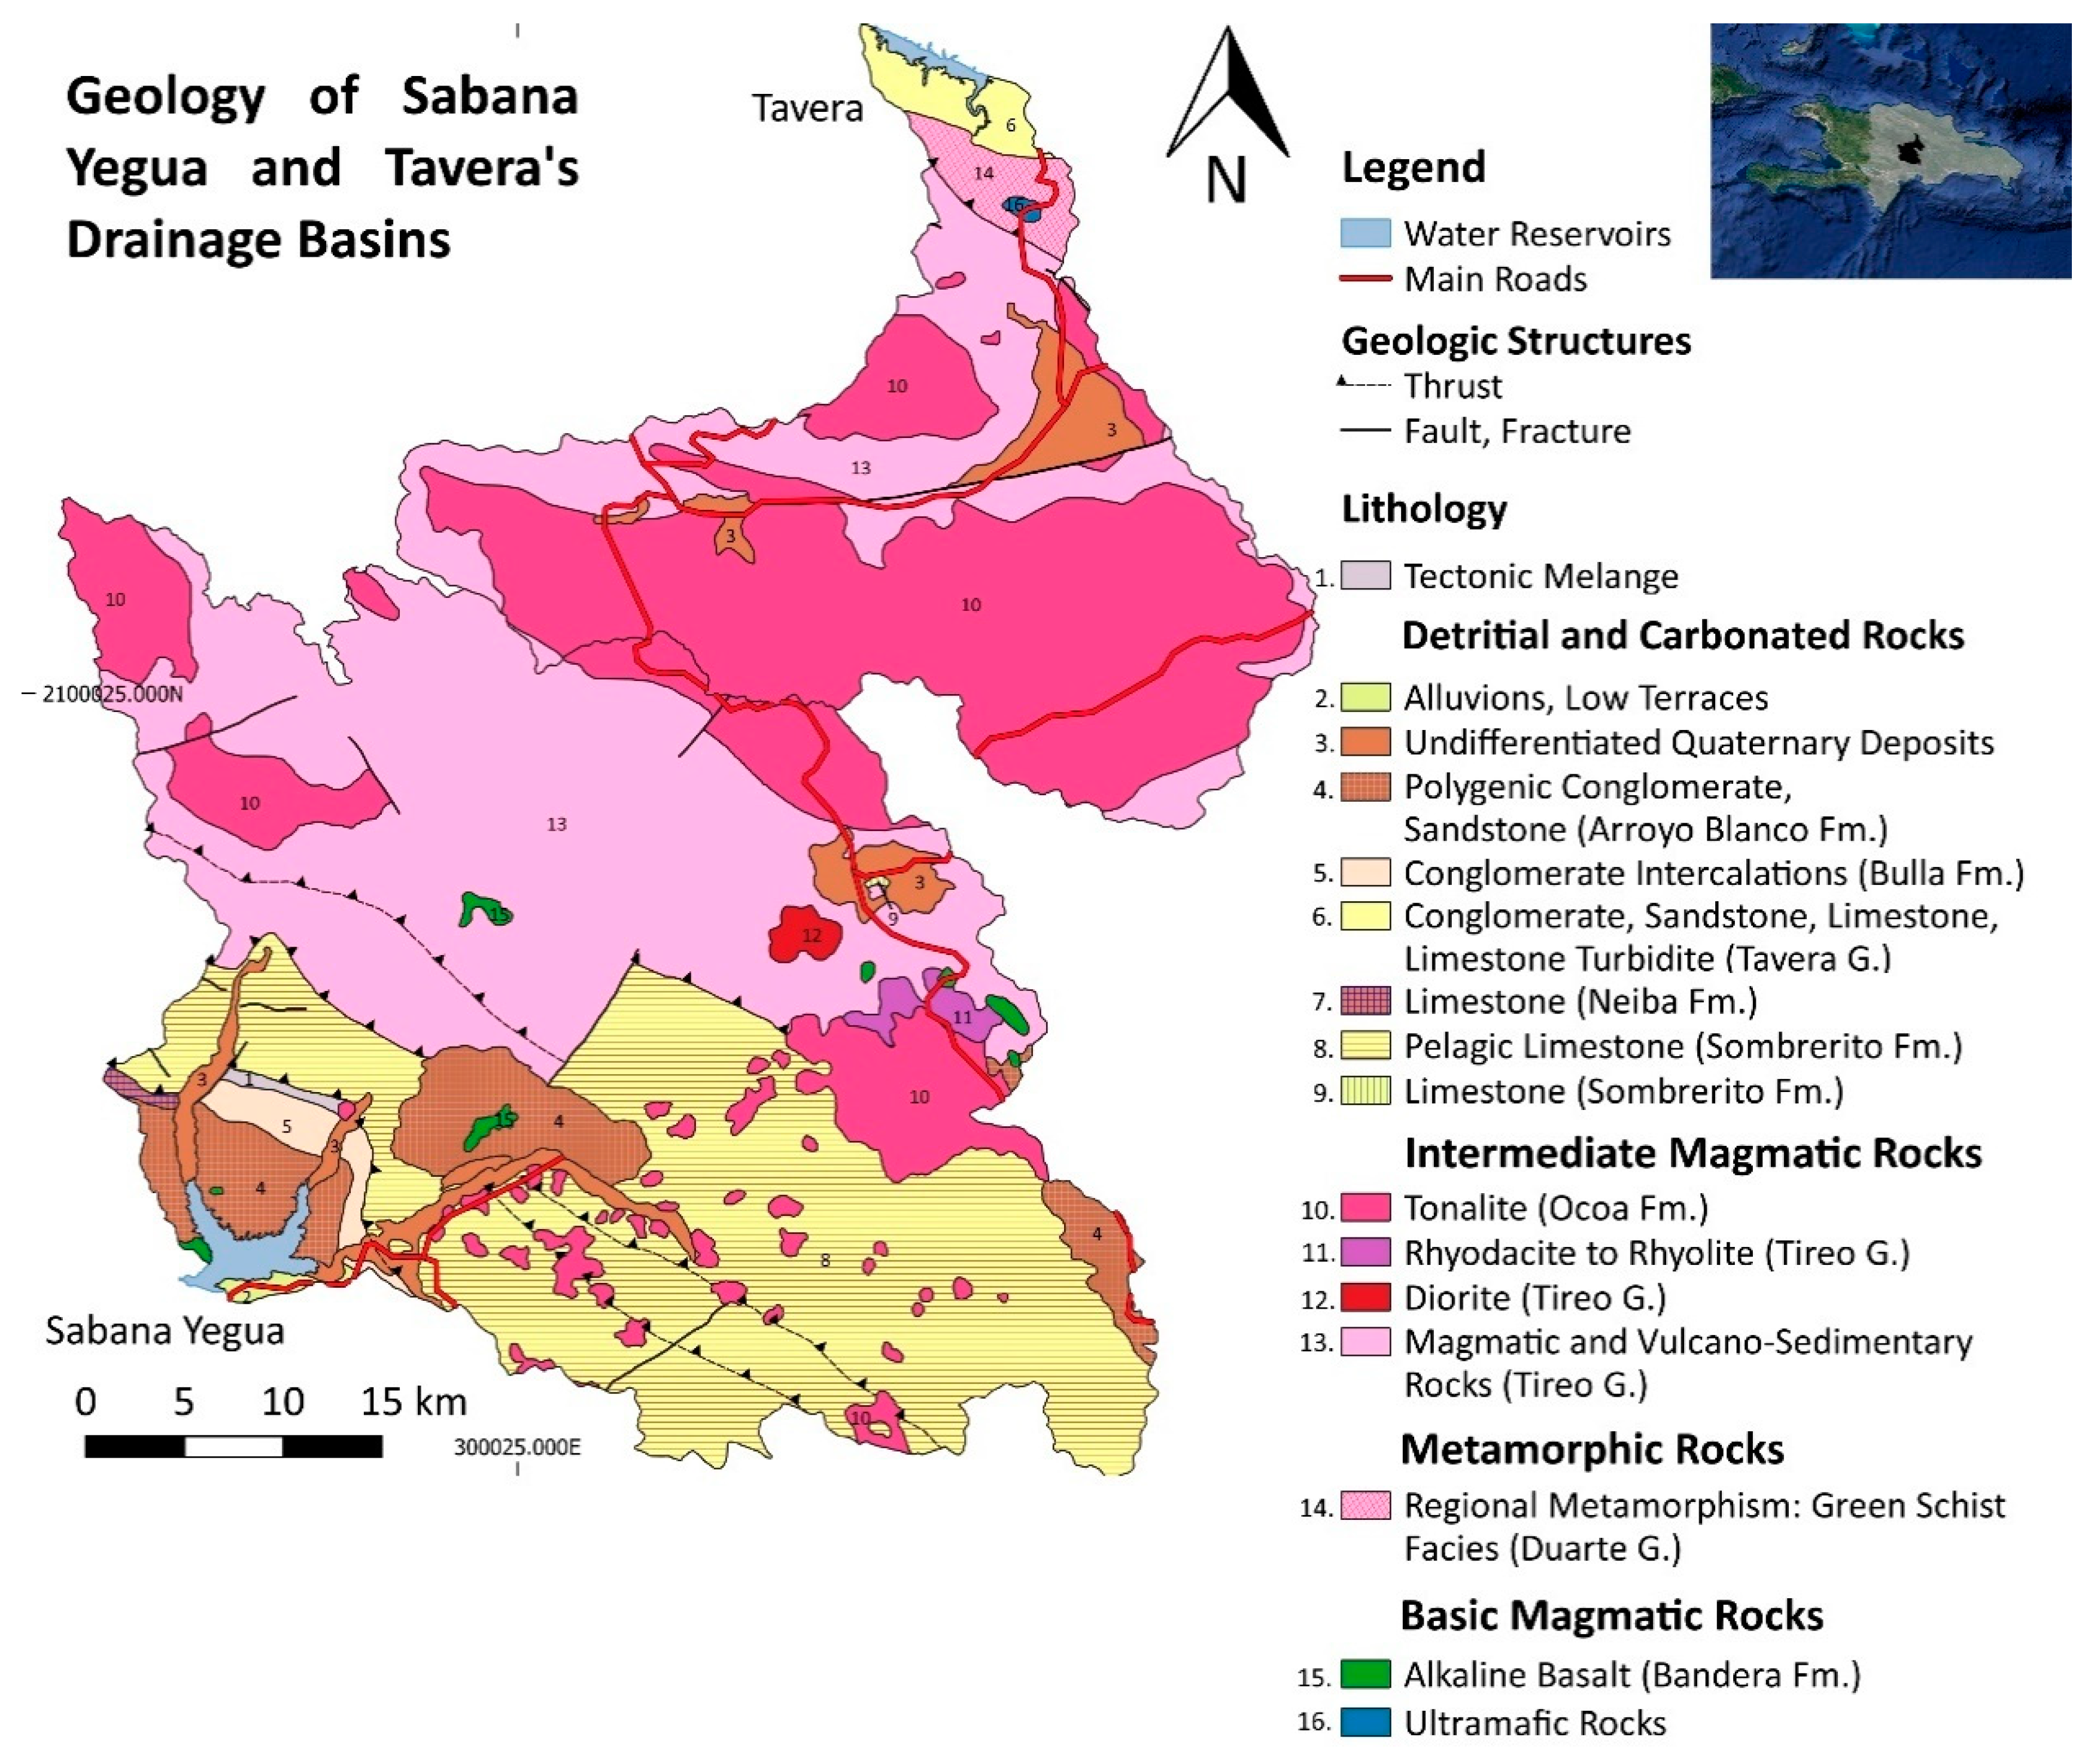
2. Characterization of the Area
3. Methodology
3.1. Sampling
3.2. Analytical Methodologies
3.3. Rare Earth Element Data Processing and Geochemical Parameters
4. Results and Discussion
4.1. Distribution of Rare Earth Elements in the Soils of the Drainage Basins
4.1.1. Soils Derived from Igneous Rocks
4.1.2. Soils Derived from Detrital and Carbonate Sedimentary Rocks
4.2. Rare Earth Elements in the Reservoir’s Sediments
4.2.1. Geochemical Behavior of Rare Earth Elements in the Bottom Sediments
4.2.2. Seasonal Variability of the Rare Earth Elements in the Reservoir Sediments
- (1)
- Light elements (LREE) are preferentially scavenged on the surface of particles of Fe–Mn oxides and of clay minerals, transported in suspension during the rainiest periods, and may also be precipitated as REE phosphates. HREE usually form dissolved complexes that remain in solution [56,58]. The pH values of the water column, which are always higher than those of the sediments (with median values of 6.8–6.9), are slightly alkaline with values between 7.5 and 9 [27]. The pH is slightly higher during the dry season, which is associated with an increase of salinity. According to [23], these pH values favor the release of REE from the surface of the fine-grained suspended particles, so that these elements are removed by the water and enrich the bottom sediments.
- (2)
- At this season there is also a greater tendency to flocculation, followed by the precipitation of particles in suspension.
- (3)
- Increase in the rate of decomposition of organic compounds, followed by the release of REE and subsequent deposition in sediments [18,19]. This process was clearly observed in Tavera, where the higher levels of organic compounds were found [26,27]. In this reservoir, with the exception of the lighter elements (La, Ce), there is a marked increase in the contents of most of the rare elements in a sector near the mouth of the Yaque del Norte, the sediments of which were covered in the driest period by a thin film of water rich in organic debris. This reservoir also has the greatest dispersion of Ce content (CV of 41.5%), the rare element most dependent on local redox conditions. The decomposition reactions of organic material can lead to changes in oxidation–reduction conditions, increasing the variation in Ce content.
- (4)
- Between the two seasons and along the reservoirs, the Ce anomaly is the parameter that shows the greatest variability, indicating the differentiation between Ce and the other REE during the processes of transport and deposition of the sediments. This variability is due to the easy fractionation by oxidation of Ce3+ to Ce4+. Some of the variation observed in Ce anomalies between seasons and between reservoirs could possibly be a consequence of (1) changes in dissociation rates of Ce-rich humic complexes under more alkaline conditions [9], (2) removal of Ce-rich organic complexes present in the water column, under more reductive conditions and in the presence of components with strong adsorption capacities [9,19], or (3) changes in the behavior of complexation and adsorption of REE by organic complexes, clay minerals, or Fe–Mn-oxides, with subsequent changes in the oxidation states of Ce3+–Ce4+ [18], which can be separated as insoluble oxyhydroxides [9,18].
4.2.3. Relationship between the Distribution of Rare Earth Elements in Sediments and in Soils of Drainage Areas
4.2.4. Rare Earth Elements Analysis as a Potential Proxy of Sediments Provenance
- 1.
- Despite the great uniformity of the REE distribution patterns in the reservoirs, slight differences in the concentration of some elements are discernible between the two, Which could be related to the greater or lesser contributions of the different lithotypes of the basins or, to a lesser extent, to changes in the redox conditions of the environment (mainly for Ce):
- -
- Of the lighter (LREE) and heavier (HREE) elements, La and Nd in the first group and Ho, Yb, and Lu in the second group have identical concentrations in both reservoirs, suggesting that they originate from similar lithologies in the basins.
- -
- Elements such as Pr, Sm, Eu, Gd, and Er, which have highest concentrations in tonalites, granites, granodiorites, and schists [50], slightly increase in Tavera, whose basin is very representative of those lithologies [25,26,27]. The lowest concentration of these elements is found in carbonate rocks, which have a strong influence on the sedimentation of Sabana Yegua, where the lowest concentrations of these elements are found.
- -
- Dy behaves irregularly because, although the highest values have been found in ultramafic, mafic, and intermediate rocks of Tavera basin [25,26,27], the sediments of Sabana Yegua have the highest, and more uniform, concentrations of this element, except in the sediments under the influence of carbonate rocks.
- -
- ▪
- In the Sabana Yegua reservoir, the spatial distribution of the different elements illustrates the greater uniformity of their concentration and the specific sedimentation conditions of the sector under the influence of the carbonate rocks of the Las Cuevas River sub-basin (Figure 5). The small variations in the distribution of REE with CV of 10%, in the absence of significant textural differences in sediments and redox conditions, may be related to the greater or lesser contribution of the different lithotypes that outcrop in the three sub-basins:
- -
- A slight depletion of the total contents of REE (except Sc) is observed in the NE sector of the lake, under the influence of an extensive area of coarse detrital rocks (conglomerates and sandstones) and igneous and volcanic sedimentary rocks in the Grande del Medio River basin.
- -
- The highest ∑REE values in the sediments, except for some elements of the MREE group (Ho, Dy), are found in the sector of the lake under the influence of the Yaque del Sur River, which appears to be the sub-basin responsible for the largest supply of REE in this system. These higher concentrations extend throughout the W sector of the lake to the dam wall, where the greatest depths are found, indicating a preferential N–S direction of the circulation of sediments from this sub-basin.
- -
- The distribution of REE in the SE sector of the reservoir, influenced by carbonate and detrital rocks from the Las Cuevas River, shows a slight depletion of the sum of REE, higher contents of lighter elements (La, Pr, and Nd) and lower contents of Dy, Yb, and Sc, leading to an increase in the fraction parameters of light–middle and light–heavy REE (represented by higher ratios (La/Yb)N, (La/Sm)N, and (La/Gd)N). This sector also shows lower anomalies of Ce and Eu. These distribution patterns correspond to those of the carbonate rocks (see Table 3), indicating strong inheritance from these sedimentary rocks.
- ▪
- The spatial distribution of the total contents of REE along Tavera Reservoir (Figure 6) shows a decreasing gradient from the confluence of the Yaque del Norte River, where the highest values were found, to the dam. These values are generally higher in the southern shoreline area of the lake, where the particulate load from this river preferentially circulates and appears to be the area that also receives a high sediment load from the watershed runoff.
- 2.
- Considering the bivariate plots used as indicators to determine the sources of the sediments (Figure 7), the ∑REE vs. LREE/HREE data of the sediments were plotted to reflect the fractionation of REE and its relationship to the patterns of different groups of soils and rocks from the basins (Figure 7A,B). In both time periods, the LREE/HREE ratio in the sediments ranges from 4.13–6.27 in Sabana Yegua and 3.77–6.16 in Tavera. These sediment data are consistent with the average values determined: (1) in Sabana Yegua with soils in low-relief topography, soils derived from Quaternary deposits in the Yaque del Sur basin (SYS3) and soils derived from detrital and carbonate rocks in the Las Cuevas basin (SYS8, SYS9); (2) in Tavera with soils in low-relief topography of the W tributary of the Yaque del Norte River (TS3, TS5) derived from tonalites. In the bivariate diagrams, these soils correspond to points bounded by the ellipse.
- 3.
- To obtain a better overview of the potential sources of sediments, Ce/Eu anomalies and the ratio of normalized contents of some key elements, (La/Yb)N, (La/Sm)N, (La/Gd)N, and (Gd/Yb)N, were also recorded for the different groups of rocks, soils, and sediments.
- ▪
- Bivariate plots for Eu and Ce anomalies show an overlap of data in the Sabana Yegua sediment projection (Figure 7C) with the same rock and soil groups observed in the ∑REE vs. LREE/HREE projection, including a greater number of soils as likely sources. Sediments have average values of Eu/Eu* similar to the volcano-sedimentary rocks of the Rio Grande del Medio basin and to the average values of intermediate igneous rocks at the margins of the Yaque del Sur River. Ce/Ce* in sediments deposited in the alluvial fan of Las Cuevas River show a more heterogeneous distribution and negative anomalies (Ce/Ce* = 0.367–0.486), which are clearly inherited from the carbonate rocks of the watershed (Ce/Ce* = 0.142–0.213).At Tavera, the influence on the Ce and Eu anomalies of sediments includes the same river margin soils in the western sector of the basin (TS3, TS5, TS1) derived from tonalitic and volcano-sedimentary rocks (Figure 7D). In addition to the influence of intermediate and basic igneous rocks located in low-relief topography of the western branch of Yaque del Norte (2-T7, 2-T8), various lithologies (tonalites, gabbros, ultramafic rocks) from higher elevations in the two sub-basins (1-T2, 1-T3, 2-T4, 2-T14) also contribute. Since the anomalies of these two elements (especially Ce) can be affected by the redox conditions of the surrounding environment, there is a wider dispersion of the likely sources of the accumulated sediments; this is one of the main reasons why only the common soils and rocks associated with the sediments should be considered in all bivariate diagrams.
- ▪
- The diagrams corresponding to the fractionation parameters of light and heavy REE: (La/Sm)N vs. (La/Yb)N, (Gd/Yb)N vs. (La/Yb)N, (La/Yb)N vs. YbN, (La/Sm)N vs. SmN, and (La/Yb)N vs. CeN (Figure 7E–H), show, in both systems, in addition to the soil and rock sources obtained from the ∑REE vs. LREE/HREE correlation plots, the influence of soils and rocks from sectors farther from the lakes and with steeper slopes: (1) in Sabana Yegua, sediment fractionation parameters correlate with those of a soil composed of detrital rocks (SYS10) and intermediate igneous rocks (2-S2, 2-S3) in the higher and steeper areas of the Las Cuevas basin; (2) in Tavera, the data of a tonalitic rock (2-T13) and a tonalitic soil (TS6, TS7) in areas with steep slopes, in the extreme SE and in the western tributary of the Yaque del Norte, overlap on the sediments projection.
- (1)
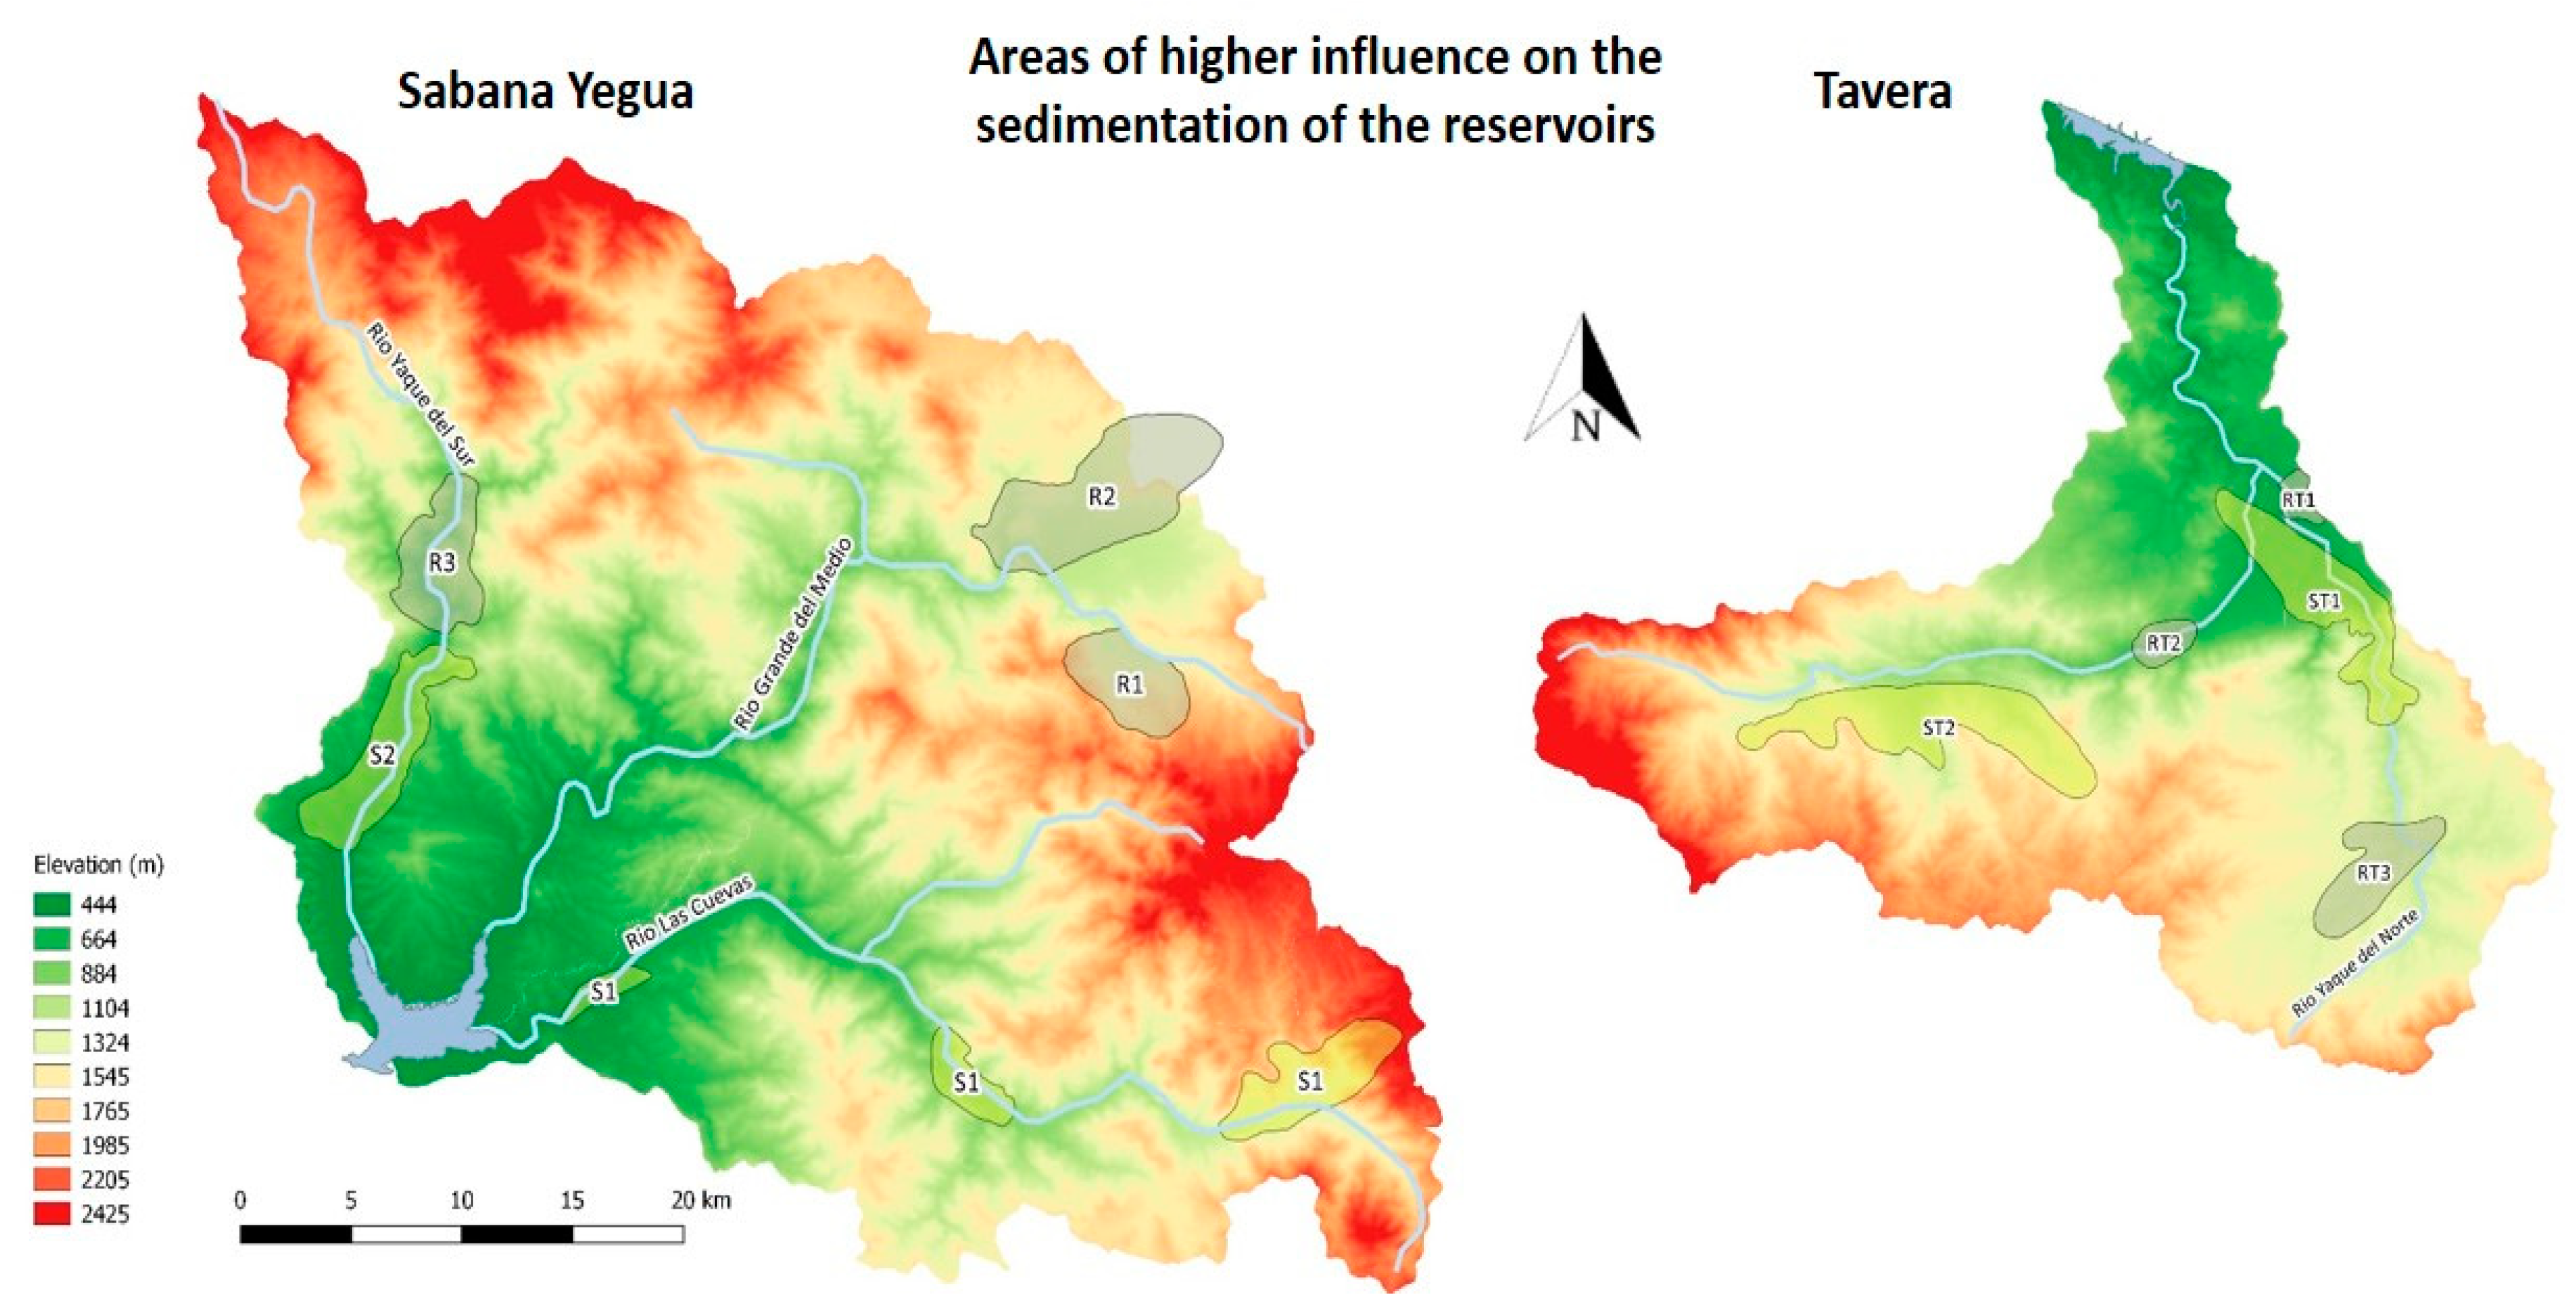
- Sabana Yegua reservoir—sediments deposited in the alluvial fan of the Las Cuevas River in the sector SE are mainly fed by soils in the shallowest topography developed on detrital and carbonate rocks (area S1), and by intermediate igneous rocks located in the areas of greater slope in the area NE of this sub-basin (area R1). Sedimentation in the other sectors of the lake is influenced by (i) soils derived from Quaternary deposits on the margins of the Yaque del Sur (area S2), (ii) volcano-sedimentary rocks in steeply sloping areas in the Rio Grande del Medio watershed (area R2), and (iii) rocks of different nature in a mountainous area in the central region of the Yaque del Sur watershed (intermediate igneous and basaltic rocks (area R3)). Although the volcano-sedimentary rocks of the Rio Grande del Medio basin are one of the main sources of sediment, there is no significant relationship with the soils of this basin, probably because they are undeveloped soils in areas with steep slopes. The distribution of the highest ∑REE values in the NW sector of the lake indicates that the Yaque del Sur River should be the tributary responsible for the largest influx of REE.
- (2)
- Tavera reservoir—with only one tributary, the Yaque del Norte River, sediments have contributions of soils and rocks distributed in two sub-basins of this river. Soils with greater influence are in two distinct areas of the watershed: (i) soils composed of tonalites influenced by volcano-sedimentary rocks in the low-lying topography of the eastern tributary (area ST1), and (ii) tonalite soils in the steep slopes of the western tributary (area ST2). Rocks that could correspond to the main sources of sediments are also scattered in the two sub-basins: (i) intermediate igneous rocks of tonalitic and granodioritic composition in a flattened area near the reservoir (area RT1), (ii) ultramafic igneous rocks in the western tributary (area RT2), and (iii) tonalitic rocks in an area of steep slopes at the SE boundary of the eastern tributary (area RT3).
5. Conclusions
- The spatial distribution of REE in the sediments of the reservoirs shows a high spatial uniformity in both systems and between them, reflecting a high homogeneity of sedimentation and similarity of (i) climatic conditions, (ii) lithological sources, (iii) morphometric and chemical characteristics of the lakes, and (iv) nature of sediments, mostly clayey and silty. This homogeneity can be slightly reduced by some mechanisms of REE mixing and removal within these systems, such as (i) mixing of detrital fractions from weathering of different sources, (ii) removal of dissolved REE in the water column by suspended or bottom sediments, (iii) planktonic removal, (iv) co-precipitation of REE with iron hydroxides, (v) presence of sediments with higher sand content, which have a dilution effect on the concentration of these elements, (vi) runoff effects from the banks, (vii) groundwater discharge, which can affect the salinity of the water column, and (viii) aggregation of colloidal particles transported in suspension into these systems induced by increased salinity during periods of lower precipitation, according to [19,42].
- The first approach to identify the main sources of reservoir sediments, which focused on the study of REE, was based on the comparison of the content, spatial distribution, and fractionation patterns of REE in sediments with those of representative soils and rocks from their catchments. In this study, only the REE data of sediments and soils were presented and discussed, since the geochemistry of rocks has already been analyzed and presented in [25,26]. In the case of soils, the variability of REE distribution testifies to the inheritance from a mixture of different lithotypes scattered in the catchments and the inclusion of particles originated from rocks in rugged areas that are, therefore, more easily eroded. Different conditions such as climate, relief, vegetation, and organisms could promote different soil development and pedogenic processes and alter the distribution of REE in soils derived from similar lithological sources. Changes in the content and distribution of these elements could be due to changes in the content of clay, clay minerals, and other REE-bearing minerals, aluminum, iron, manganese, organic matter, carbonate, and pH values, with which REE are usually positively associated [52]. These processes, responsible for the REE migration from the soils and the possible mixing of lithotypes of different natures, exclude soils as good tracers for defining the origin of the sediments deposited in these Dominican reservoirs, based solely on their data. This definition requires data from other sources, so data on the distribution of REE in the rocks of the basins were used.
- The comparative study of the composition and geochemical behavior of REE in sediments, soils, and rocks provided an initial approach to the areas of greater influence on sedimentation of the two reservoirs. Although it was possible to trace the likely sources of sediment, it was not possible to distinguish influences for each area of the reservoirs because of the homogeneity of spatial and seasonal REE patterns. Although there is not a very consistent fingerprinting model, the source areas are consistent with those based on other geochemical tracers, namely major (SiO2, Al2O3, TiO2, MgO, CaO, K2O, Na2O, and MnO) and trace (Ba, Sr, Ni, Cu, Co, Zn, Pb, and Cr) elements presented in previous studies [26,59,60,61].
- This was the first study to trace the sources of sediments deposited in these two Dominican reservoirs. To obtain a more accurate geochemical signature, data from the REE study will be compared to other fingerprinting techniques that incorporate other chemical tracers and statistical analyses to distinguish and quantify the contribution of sources and differences between regions in each reservoir.
- A robust model on sediments provenance will help identify the most vulnerable areas in the watersheds and the presence of intense human activities to assist appropriate management and remediation strategies in erosion hotspots. Excessive erosion of these soils in a climate of intense annual precipitation characterized by periodic extreme climatic events has greatly increased sedimentation rates in these systems. Excessive siltation of reservoirs has led to degradation of water quality and energy production, and loss of storage capacity, which is of great concern to the national authorities responsible for managing water resources.
Author Contributions
Funding
Institutional Review Board Statement
Informed Consent Statement
Data Availability Statement
Acknowledgments
Conflicts of Interest
References
- Wetzel, M.A.; Wahrendorf, D.S.; von der Ohe, P.C. Sediment pollution in the Erbe estuary and its potential toxicity at different trophic levels. Sci. Total Environ. 2013, 449, 199–207. [Google Scholar] [CrossRef]
- Ding, S.; Han, C.; Wang, Y.; Yao, L.; Wang, Y.; Xu, D.; Zhang, C. In situ, high-resolution imaging of labile phosphorus in sediments of a large eutrophic lake. Water Res. 2015, 74, 100–109. [Google Scholar] [CrossRef]
- Pang, H.; Pan, B.; Garzanti, E.; Gao, H.; Zhao, X.; Chen, D. Mineralogy and geochemistry of modern Yellow River sediments: Implications for weathering and provenance. Chem. Geol. 2018, 488, 76–86. [Google Scholar] [CrossRef]
- Shao, J.Q.; Yang, S.Y.; Li, C. Chemical indices (CIA and WIP) as proxis for integrated chemical weathering in China: Influence from analysis of fluvial sediments. Sediment. Geol. 2012, 265–266, 110–120. [Google Scholar] [CrossRef]
- Garzanti, E.; Padoan, M.; Setti, M.; López-Galindo, A.; Villa, I.M. Provenance versus weathering control on the composition of tropical river mud (southern Africa). Chem. Geol. 2014, 366, 61–74. [Google Scholar] [CrossRef]
- Garzanti, E.; Resentini, A. Provenance control on chemical indices of weathering (Taiwan river sands). Sediment. Geol. 2016, 336, 81–95. [Google Scholar] [CrossRef]
- Taylor, S.R.; McLennan, S.M. Chemical Composition and Element Distribution in the Earth’s Crust. In The Continental Crust: Its Composition and Evolution; Taylor, S.R., McLennan, S.M., Eds.; Blackwell: Oxford, UK, 1985; pp. 697–719. [Google Scholar]
- Schneider, S.; Hornung, J.; Hinderer, M.; Garzanti, E. Petrography and geochemistry of modern river sediments in an equatorial environment (Rwenzori Mountains and Albertine Rift, Uganda): Implications for weathering and provenance. Sediment. Geol. 2016, 336, 106–119. [Google Scholar] [CrossRef]
- Rollinson, H. Using Geochemical Data: Evaluation, Presentation, Interpretation; Pearson Education Ltd.: London, UK, 1993; p. 380. [Google Scholar]
- Moermond, C.T.A.; Tijink, J.; Wetzel, A.P.V.; Koelmans, A.A. Distribution, speciation, and bioavailability of lanthanides in the Rhine-Meuse Estuary, The Neatherlands. Environ. Toxicol. Chem. 2001, 20, 1916–1926. [Google Scholar] [CrossRef]
- Wang, L.; Han, X.; Liang, T.; Guo, Q.; Li, J.; Dai, L.; Ding, S. Discrimination of rare earth element geochemistry and co-occurrence in sediment from Poyang Lake, the larger freshwater lake in China. Chemosphere 2019, 217, 851–857. [Google Scholar] [CrossRef]
- Jones, A.P.; Wall, F.; Williams, C.T. Rare Earth Minerals: Chemistry, Origin and Ore Deposits; Chapman and Hall: London, UK, 1996; p. 372. ISBN 0412610302. [Google Scholar]
- Wang, L.; Han, X.; Ding, S.; Liang, T.; Zhang, Y.; Xiao, J.; Dong, L.; Zhang, H. Combining multiple methods for provenance discrimination based on rare earth element geochemistry in lake sediment. Sci. Total Environ. 2019, 672, 264–274. [Google Scholar] [CrossRef]
- Singh, P. Major, trace and REE geochemistry of the Ganga River sediments: Influence of provenance and sedimentary processes. Chem. Geol. 2009, 266, 242–255. [Google Scholar] [CrossRef]
- Aide, M.; Aide, C. Rare Earth Elements: Their Importance in Understanding Soils Genesis. Int. Sch. Res. Netw. 2012, 783876, 11. [Google Scholar] [CrossRef] [Green Version]
- Khan, A.M.; Abu Bakar, N.K.; Abu Bakar, A.F.; Ashraf, M.A. Chemical speciation and bioavailability of rare earth elements (REEs) in the ecosystem: A review. Environ. Sci. Pollut. 2017, 24, 22764–22789. [Google Scholar] [CrossRef] [PubMed]
- Gwenzi, W.; Mangori, L.; Danha, C.; Chaukura, N.; Dunjana, N.; Sanganyado, E. Sources, behaviour and environmental and human health risks of high-technology rare earth elements as emerging contaminants. Sci. Total Environ. 2018, 636, 299–313. [Google Scholar] [CrossRef] [PubMed]
- Nozaki, Y. Rare earth elements and their isotopes in the ocean. In Encyclopedia of Ocean Sciences; Steele, J.H., Thorpe, S.A., Turekian, K.K., Eds.; Academic Press: San Diego, CA, USA, 2003; pp. 2354–2366. [Google Scholar]
- Caetano, M.; Vale, C.; Anes, B.; Raimundo, J.; Drago, T.; Schmidt, S.; Nogueira, M.; Oliveira, A.; Prego, R. The Condor seamount at Mid-Atlantic Ridge as a supplementary source of trace and rare earth elements to the sediments. Deep Sea Res. 2013, PTII 98, 24–37. [Google Scholar] [CrossRef]
- Li, L.; Su, J.; Rao, W.; Wang, Y. Using geochemistry of rare earth elements to indicate sediment provenance of sand ridges in Southwestern Yellow Sea. Chin. Geogr. Sci. 2017, 27, 63–77. [Google Scholar] [CrossRef] [Green Version]
- Laveuf, C.; Cornu, S. A review on the potentiality of rare earth elements to trace pedogenetic processes. Geoderma 2009, 154, 1–12. [Google Scholar] [CrossRef]
- Chen, K.; Yang, C.; Jiao, J.J. Rare earth elements geochemistry and provenance discrimination of sediments in Tolo Harbour, Hong Kong. Mar. Georesour. Geotec. 2013, 33, 51–57. [Google Scholar] [CrossRef]
- Infraeco. Relevamientos Batimétricos y Estúdios de Calidad del Água y Sedimentación: Proyecto de Recuperación de Emergência y Gestión del Riesgo por Desastres Naturales; Componente 1. Préstamo BIRF 7546-DO; Producto nº 2. Informe de Diagnóstico; Instituto Nacional de Recursos Hidráulicos (INDRHI): Santo Domingo, Dominican Republic, 2015; p. 284. [Google Scholar]
- Fonseca, R.; Araújo, J.; Pinho, C.; Nogueira, P.; Araújo, A. Geochemistry of Rare Earth Elements (REE) as a Fingerprint of Sediment Provenance in Dominican Dam Reservoirs. In XII Congresso Ibérico de Geoquímica: Extended Abstracts, 1st ed.; Nogueira, P., Moreira, N., Roseiro, J., Maia, M., Eds.; Évora University: Evora, Portugal, 2019; pp. 57–60. ISBN 9789727781218. [Google Scholar]
- Araújo, J. Assinatura Geoquímica e Proveniência dos Sedimentos Depositados em Albufeiras Dominicanas. Master’s Thesis, University of Évora, Evora, Portugal, 2020; p. 218. (In Portuguese). [Google Scholar]
- Fonseca, R.; Landa, B.; Pinho, C.; Araújo, J.; Nogueira, P.; Araújo, A. Aprovechamiento de los Sedimentos de los Embalses como Nutrientes para la Fertilización de Suelos Agrícolas en la República Dominicana; Final Report and 8 Interim Reports of the Consortium Project between the University of Évora and the National Institute of Water Resources through the “Centro para la Gestión Sostenible de los Recursos Hídricos en los Estados Insulares del Caribe CEHICA (República Dominicana)”—FONDOCyT; University of Évora: Evora, Portugal, 2019. [Google Scholar]
- Pettijohn, E.J. Sedimentary Rocks, 3rd ed.; Harper & Row Publishers: New York, NY, USA, 1975; p. 628. [Google Scholar]
- Pansu, M.; Gautheyrou, J. Handbook of Soil Analysis: Mineralogical, Organic and Inorganic Methods; Springer: Berlin/Heidelberg, Germany, 2006; p. 993. ISBN 9783540312116. [Google Scholar]
- Zachmann, D.W. Matrix effects in the separation of rare-earth elements, scandium, and yttrium and their determination by inductively coupled plasma optical emission spectrometry. Anal. Chem. 1988, 60, 420–427. [Google Scholar] [CrossRef]
- Watkins, P.J.; Nolan, J. Determination of rare-earth elements, yttrium, scandium and hafnium using cation-exchange separation and inductively coupled plasma-atomic emission spectrometry. Chem. Geol. 1992, 95, 131–139. [Google Scholar] [CrossRef]
- Navarro, M.S.; Ulbrich, H.H.G.J.; Andrade, S.; Janasi, V.A. Adaptation of ICP-OES routine determination techniques for the analysis of rare earth elements by chromatographic separation in geological materials: Tests with reference materials and granitic rocks. J. Alloys Compd. 2002, 344, 40–45. [Google Scholar] [CrossRef]
- White, W.M. Geochemistry; Wiley-Blackwell: Chichester, UK, 2013; p. 660. ISBN 978047065668. [Google Scholar]
- Pedersen, T.L. Package ‘ggforce’: Accelerating ‘ggplot2’, version 0.3.3. MIT File Licence, Copyright Holder: Thomas Lin Pederson. 2021. Available online: https://cran.r-project.org/ (accessed on 15 January 2021).
- Meyer, M.A.; Booker, J.M. Eliciting and Analysing Expert Judgment: A Practical Guide; ASA-SIAM Series on Statistics and Applied Probability; Cambridge University Press: Cambridge, UK, 2001; p. 459. ISBN 0898714745. [Google Scholar]
- Garthwaite, P.H.; Kadane, J.B.; O’Hagan, A. Statistical methods for eliciting probability distributions. JASA 2005, 100, 680–700. [Google Scholar] [CrossRef]
- Phuong, N.; Truong, G.; Heuvelink, B.M.; Gosling, J.P. Web-based tool for expert elicitation of the variogram. Comput. Geosci. 2013, 51, 390–399. [Google Scholar]
- Henderson, P. General geochemical properties and abundances of the rare earth elements. Dev. Geochem. 1984, 2, 1–32. [Google Scholar]
- Vital, H.; Stattegger, K.; Garbe-Schonberg, C.D. Composition and trace element geochemistry of detrital clay and heavy mineral suites of the lowermost Amazon River: A provenance study. J. Sediment. Res. 1999, 69, 563–575. [Google Scholar] [CrossRef]
- Zhang, C.S.; Wang, L.J.; Li, G.S.; Dong, S.; Yang, J.; Wang, X. Grain size effect on multi-element concentration in sediments from the intertidal flats of Bohai Bay, China. Appl. Geochem. 2002, 17, 59–68. [Google Scholar] [CrossRef]
- Cullers, R.L.; Basu, A.; Sutner, L.J. Geochemical signature of provenance in san-mixed material in soils and stream sediments near the Tobacco Root batholith, Montana, USA. Chem. Geol. 1988, 70, 335–348. [Google Scholar] [CrossRef]
- Dinali, G.S.; Root, R.A.; Amistadi, M.K.; Chorover, J.; Lopes, G.; Guilherme, L.R.G. Rare earth elements (REY) sorption on soils of contrasting mineralogy and texture. Environ. Int. 2019, 128, 279–291. [Google Scholar] [CrossRef]
- Alfaro, M.R.; Nascimento, C.W.A.; Biondi, C.M.; Bezzera da Silva, Y.; Bezzera da Silva, Y.; Accioly, A.M.; Montero, A.; Ugarte, O.M.; Estevez, J. Rare-earth-element geochemistry in soils developed in different geological settings of Cuba. Catena 2018, 162, 317–324. [Google Scholar] [CrossRef]
- Yoshida, S.; Maramutsu, Y.; Tagami, K.; Uchida, S. Concentrations of lanthanide elements, Th, and U in 77 Japanese surface soils. Environ. Int. 1998, 24, 275–286. [Google Scholar] [CrossRef]
- Tyler, G.; Olsson, T. Conditions related to solubility of rare and minor elements in forest soils. J. Plant Nutr. Soil Sci. 2002, 165, 594–601. [Google Scholar] [CrossRef]
- Sadeghi, M.; Morris, G.A.; Carranza, E.J.M.; Ladenberger, A.; Andersson, M. Rare earth element distribution and mineralization in Sweden: An application of principal component analysis to FOREGS soil geochemistry. J. Geochem. Explor. 2013, 133, 160–175. [Google Scholar] [CrossRef]
- Bezerra da Silva, Y.; Nascimento, C.W.A.; Bezzera da Silva, Y.; Biondi, C.M.; Cruz Silva, C. Rare earth element concentrations in Brazilian Benchmark soils. Ver. Bras. Ciênc. Solo 2016, 40. [Google Scholar] [CrossRef] [Green Version]
- White, W.M.; Klein, E.M. Composition of the Oceanic Crust. In Treatise on Geochemistry, 2nd ed.; Turekian, K., Holland, H., Eds.; Elsevier Science: Amsterdam, The Netherlands, 2014; Volume 4, pp. 749–806. [Google Scholar] [CrossRef]
- Jiménez-Reyes, M.; Solache-Ríos, M. Chemical behavior of lanthanum in the presence of soils componentes: Adsorption and humate complexes. Water Air Soil Pollut. 2014, 225, 1–13. [Google Scholar] [CrossRef]
- Salminen, R. Foregs, Geochemical Atlas of Europe; EuroGeosurveys: Brussels, Belgium, 2005; ISBN 9516909132. [Google Scholar]
- Kabata-Pendias, A.; Pendias, H. Trace Elements in Soils and Plants, 3rd ed.; CRC Press: Boca Raton, FL, USA, 2001; p. 403. [Google Scholar]
- Mihajlovic, J.; Rinklebe, J. Rare earth elements in German soils—A review. Chemosphere 2018, 205, 514–523. [Google Scholar] [CrossRef]
- Taylor, S.R.; McLennan, S.M. Planetary Crusts: Their Composition, Origin and Evolution; Cambridge University Press: Cambridge, UK, 2009; p. 402. [Google Scholar]
- Erel, Y.; Stolper, E.M. Modelling of rare-earth element partitioning between particles and solution in aquatic environments. Geochim. Cosmochim. Acta 1993, 57, 513–518. [Google Scholar] [CrossRef]
- Yang, S.Y.; Jung, H.S.; Choi, M.S.; Li, C.X. The rare earth element compositions of the Changjiang (Yangtze) and Huanghe (Yellow) river sediments. Earth Planet Sci. Lett. 2002, 201, 407–419. [Google Scholar] [CrossRef]
- Prego, R.; Caetano, M.; Bernárdez, P.; Brito, P.; Ospina-Alvarez, N.; Vale, C. Rare earth elements in coastal sediments of the northern Galician shelf: Influence of geological features. Cont. Shelf Res. 2012, 35, 75–85. [Google Scholar] [CrossRef] [Green Version]
- Liu, S.; Zhang, H.; Zhu, A.; Wang, K.; Chen, M.; Khokiattiwong, S.; Kornkanitnan, N.; Shi, X. Distribution of rare earth elements in surface sediments of the western Gulf of Thailand: Constraints from sedimentology and mineralogy. Quat. Int. 2019, 527, 52–63. [Google Scholar] [CrossRef]
- Nath, B.N.; Roelandts, I.; Sudhakar, M.; Plüger, W. Rare earth element patterns of the Central Indian Basin sediments related to their lithology. Geophys. Res. Lett. 1992, 19, 1197–1200. [Google Scholar] [CrossRef]
- Behrens, M.K.; Pahnke, K.; Paffrath, R.; Schnetger, B.; Brumsack, H.-J. Rare earth element distributions in the West Pacific: Trace element sources and conservative vs. non-conservative behavior. Earth Planet Sci. Lett. 2018, 486, 166–177. [Google Scholar] [CrossRef]
- Araújo, J.; Nogueira, P.; Fonseca, R.; Pinho, C.; Araújo, A. Geochemistry of lacustrine sediments in systems with high sedimentation rates due to extreme climatic events: Case studies in the Dominican Republic; XCNG-17724. In Proceedings of the X Congresso Nacional de Geologia, Ponta Delgada, Portugal, 10–13 July 2018; Laboratório Nacional de Energia e Geologia: Amadora, Portugal, 2018; Volume II, pp. 45–48. [Google Scholar]
- Araújo, J.; Albuquerque, T.; Fonseca, R.; Nogueira, P.; Pinho, C.; Araújo, A. Determination of spatial enrichment/impoverishment clusters in tropical soils—A Dominican Republic case study. In XII Congresso Ibérico de Geoquímica: Extended Abstracts, 1st ed.; Nogueira, P., Moreira, N., Roseiro, J., Maia, M., Eds.; Évora University: Évora, Portugal, 2019; pp. 57–60. ISBN 9789727781218. [Google Scholar]
- Fonseca, R.; Pinho, C.; Araújo, J. Impact of extreme climatic events on the spatial and temporal distribution of major and trace elements in bed sediments of reservoir in the Dominican Republic; Geophysical Research Abstracts. In Proceedings of the 21st EGU General Assembly, Vienna, Austria, 7–12 April 2019; European Geosciences Union: Munich, Germany, 2019; Volume 21, p. EGU20195957. [Google Scholar]


| Sabana Yegua Basin | Tavera Basin | ||
|---|---|---|---|
| Soils | Correspondent Rocks | Soils | Correspondent Rocks |
| SYS1 | Intermediate Igneous Rocks (Granodiorite) | TS1 | Detrital Rocks (conglomerates, sandstones) |
| SYS2; SYS6 | Intermediate Igneous Rocks (Dacite, Andesite) | TS2, TS3 | Mafic Igneous Rocks (Olivinic Norite) |
| SYS3 | Detrital Rocks (conglomerates, sandstones) | TS4, TS5, TS6, TS7 | Intermediate Igneous Rocks (Tonalite) |
| SYS4 | Mafic Igneous Rocks (Basalts) | TS8 | Mafic Igneous Rocks (Gabbro) |
| SYS5, SYS7 | Intermediate Igneous Rocks (Tonalite) | ||
| SYS8, SYS9 | Carbonate Sedimentary Rocks | ||
| Sabana Yegua Reservoir | Tavera Reservoir | ||||||
|---|---|---|---|---|---|---|---|
| Samples | Depth (m) July 2017 | Samples | Depth (m) July 2017 | Samples | Depth (m) February 2017 | Samples | Depth (m) July 2017 |
| (February 2017) | (July 2017) | (February 2017) | (July 2017) | ||||
| SY2 | 50 | SY1 | 43 | T1 | 46.3 | T1 | 42 |
| SY3 | 43 | SY3 | 39 | T5 | 27.5 | T2 | 32 |
| SY9 | 37.3 | SY4 | 20 | T8 | 9 | T3 | 24 |
| SY10 | 27.8 | SY5 | 35 | T12 | 23 | T4 | 19.6 |
| SY11A | 14 | SY6 | 9 | T5 | 22 | ||
| SY13 | 18 | SY7A | 21.5 | T6 | 15 | ||
| SY14 | 7 | SY8 | 8 | T7 | 3.2 | ||
| SY9 | 29 | T9 | 18 | ||||
| SY10 | 20 | T10 | 28.6 | ||||
| SY13 | 13.8 | T11 | 23.8 | ||||
| SY14 | 4 | T12 | 27.1 | ||||
| SY15 | 15 | T13 | 42 | ||||
| Lanthanides | ||||||||||||||||||||||||
|---|---|---|---|---|---|---|---|---|---|---|---|---|---|---|---|---|---|---|---|---|---|---|---|---|
| LREE (µgg−1) | HREE (µgg−1) | Other REE (µgg−1) | Total | Ratio | Normalized Values To NASC | |||||||||||||||||||
| Samples | La | Ce | Pr | Nd | Sm | Eu | Gd | Dy | Ho | Er | Yb | Lu | Y | Sc | Hf | ∑ REE | LREE/HREE | (La/Yb)N | (La/Sm)N | (La/Gd)N | (Gd/Yb)N | Eu/Eu* | Ce/Ce* | Classification |
| ULTRAMAFIC IGNEOUS ROCKS | ||||||||||||||||||||||||
| 2-T4 | 10.244 | 20.091 | 0.806 | 10.764 | 1.749 | 0.445 | 2.084 | 0.750 | 0.138 | 1.338 | 0.842 | 0.173 | 5.703 | 65.498 | 0.136 | 49.425 | 8.28 | 1.178 | 1.043 | 0.799 | 1.475 | 1.024 | 1.523 | Gabbroic cumulate |
| 2-T8 | 16.616 | 23.274 | 4.746 | 19.167 | 3.804 | 1.121 | 3.176 | 5.196 | 0.390 | 1.815 | 0.944 | 0.109 | 12.129 | 73.145 | 0.755 | 80.358 | 5.91 | 1.705 | 0.778 | 0.850 | 2.006 | 1.416 | 0.571 | Gabbroic cumulate |
| 2-T11 | 3.280 | 21.311 | <0.1 | 8.239 | 2.146 | 0.882 | 3.096 | 5.790 | 0.827 | 2.372 | 2.563 | 0.339 | 22.390 | 46.058 | 1.449 | 50.845 | 2.39 | 0.124 | 0.272 | 0.172 | 0.720 | 1.502 | 8.105 | Websterite |
| MAFIC IGNEOUS ROCKS | ||||||||||||||||||||||||
| 1-S1 | 39.996 | 64.474 | 5.978 | 29.402 | 4.072 | 1.171 | 3.600 | 2.726 | 0.521 | 2.077 | 2.038 | 0.366 | 18.993 | 20.199 | 3.119 | 156.422 | 12.81 | 1.901 | 1.749 | 1.805 | 1.053 | 1.343 | 0.908 | Basalt |
| 1-S3 | 36.957 | 66.113 | 8.490 | 36.297 | 5.741 | 1.598 | 3.982 | 3.427 | 0.594 | 1.984 | 1.946 | 0.333 | 18.411 | 26.376 | 2.743 | 167.464 | 12.65 | 1.840 | 1.147 | 1.508 | 1.220 | 1.467 | 0.813 | Basalt |
| 2-S4 | 22.800 | 40.198 | 3.848 | 22.628 | 3.569 | 1.042 | 3.236 | 2.616 | 0.496 | 1.917 | 1.823 | 0.311 | 16.242 | 31.578 | 2.539 | 104.484 | 9.05 | 1.211 | 1.138 | 1.145 | 1.058 | 1.346 | 0.935 | Basalt |
| 2-S6 | 8.228 | 17.852 | 0.110 | 9.363 | 1.391 | 0.428 | 2.082 | 0.941 | 0.187 | 1.186 | 1.038 | 0.203 | 7.254 | 25.866 | 0.585 | 43.009 | 6.63 | 0.768 | 1.054 | 0.642 | 1.195 | 1.105 | 4.080 | Basalt |
| 2-T5 | 8.072 | 16.661 | 0.120 | 9.619 | 1.968 | 0.662 | 3.082 | 3.225 | 0.638 | 2.460 | 2.333 | 0.382 | 18.552 | 47.489 | 0.573 | 49.220 | 3.06 | 0.335 | 0.731 | 0.426 | 0.788 | 1.180 | 3.694 | Olivinic Norite |
| 2-T12A | 1.217 | 18.879 | <0.1 | 6.247 | 1.432 | 0.672 | 2.330 | 5.433 | 0.611 | 2.125 | 1.959 | 0.256 | 17.817 | 38.233 | 1.323 | 41.162 | 2.24 | 0.060 | 0.151 | 0.085 | 0.709 | 1.615 | 11.789 | Basalt |
| 2-T14 | 7.286 | 26.808 | 1.748 | 14.281 | 3.647 | 1.083 | 4.801 | 6.558 | 1.309 | 2.837 | 4.040 | 0.546 | 34.083 | 23.799 | 3.831 | 74.943 | 2.73 | 0.175 | 0.356 | 0.247 | 0.708 | 1.136 | 1.636 | Gabbro |
| 2-T12 | 3.462 | 18.507 | 0.664 | 10.463 | 2.998 | 1.179 | 3.767 | 6.005 | 0.938 | 2.536 | 2.880 | 0.388 | 25.577 | 46.937 | 1.146 | 53.785 | 2.26 | 0.116 | 0.206 | 0.149 | 0.780 | 1.540 | 2.659 | Vesicular Basalt |
| INTERMEDIATE IGNEOUS ROCKS | ||||||||||||||||||||||||
| 1-S2 | 32.162 | 54.075 | 6.457 | 28.556 | 4.274 | 1.245 | 3.264 | 2.714 | 0.488 | 1.779 | 1.834 | 0.315 | 14.521 | 19.587 | 3.060 | 137.163 | 12.20 | 1.699 | 1.341 | 1.601 | 1.061 | 1.464 | 0.817 | Andesite |
| 2-S2 | 17.292 | 37.973 | 4.064 | 26.306 | 6.963 | 1.883 | 8.279 | 11.503 | 2.143 | 5.334 | 6.204 | 0.911 | 56.870 | 39.879 | 5.929 | 128.856 | 2.75 | 0.270 | 0.442 | 0.339 | 0.796 | 1.089 | 0.987 | Phonolitic Tephrite |
| 2-S5 | 33.441 | 57.427 | 6.133 | 26.563 | 3.935 | 1.140 | 2.850 | 2.101 | 0.372 | 1.508 | 1.424 | 0.251 | 11.103 | 19.304 | 2.599 | 137.146 | 15.12 | 2.275 | 1.514 | 1.907 | 1.193 | 1.495 | 0.873 | Foidite |
| 2-S7 | 8.525 | 16.954 | <0.1 | 9.216 | 1.366 | 0.408 | 2.055 | 0.893 | 0.182 | 1.326 | 1.023 | 0.206 | 7.238 | 24.403 | 0.440 | 42.155 | 6.41 | 0.807 | 1.112 | 0.674 | 1.198 | 1.068 | 3.999 | Dacite |
| 2-S8 | 11.393 | 21.524 | 0.909 | 11.357 | 1.914 | 0.553 | 2.345 | 1.207 | 0.225 | 1.335 | 1.092 | 0.216 | 7.811 | 15.941 | 0.691 | 54.069 | 7.42 | 1.010 | 1.060 | 0.790 | 1.280 | 1.145 | 1.457 | Andesite |
| 2-S9 | 17.634 | 36.611 | 3.306 | 19.569 | 3.603 | 1.136 | 3.489 | 2.942 | 0.515 | 1.834 | 1.708 | 0.294 | 15.508 | 8.577 | 2.244 | 92.641 | 7.59 | 1.000 | 0.872 | 0.821 | 1.218 | 1.407 | 1.044 | Quartz Monzonite |
| 2-S3 | 10.451 | 18.216 | 0.488 | 10.866 | 2.026 | 0.660 | 2.793 | 1.952 | 0.363 | 1.537 | 1.301 | 0.231 | 10.511 | 10.115 | 2.567 | 50.884 | 5.22 | 0.778 | 0.919 | 0.608 | 1.280 | 1.218 | 1.757 | Trachyandesite |
| 1-T2 | 14.442 | 27.377 | 1.442 | 13.615 | 2.176 | 0.656 | 2.387 | 1.237 | 0.238 | 1.335 | 1.096 | 0.216 | 7.926 | 12.968 | 1.931 | 66.216 | 9.17 | 1.277 | 1.182 | 0.983 | 1.298 | 1.263 | 1.307 | Tonalite |
| 1-T3 | 13.562 | 27.628 | 1.568 | 13.938 | 2.333 | 0.769 | 2.560 | 1.540 | 0.281 | 1.390 | 1.239 | 0.231 | 9.090 | 24.585 | 1.062 | 67.038 | 8.26 | 1.061 | 1.036 | 0.861 | 1.232 | 1.381 | 1.305 | Tonalite |
| 2-T6 | 26.799 | 40.067 | 3.963 | 19.694 | 2.727 | 0.480 | 2.329 | 1.170 | 0.254 | 1.225 | 1.276 | 0.246 | 7.817 | 4.879 | 2.995 | 100.230 | 14.42 | 2.035 | 1.751 | 1.870 | 1.088 | 0.836 | 0.847 | Granodiorite |
| 2-T7 | 22.618 | 40.918 | 3.371 | 19.035 | 3.058 | 0.842 | 2.687 | 1.619 | 0.298 | 1.435 | 1.254 | 0.233 | 9.485 | 10.014 | 1.960 | 97.369 | 11.94 | 1.747 | 1.317 | 1.368 | 1.277 | 1.290 | 1.021 | Tonalite |
| 2-T9 | 5.699 | 24.394 | 0.865 | 10.972 | 2.349 | 0.868 | 2.489 | 5.145 | 0.391 | 1.809 | 1.063 | 0.133 | 12.106 | 30.897 | 1.516 | 56.177 | 4.09 | 0.519 | 0.432 | 0.372 | 1.396 | 1.576 | 2.393 | Tonalite |
| 2-T9A | 5.643 | 24.006 | 0.977 | 10.532 | 2.018 | 0.723 | 1.985 | 5.000 | 0.315 | 1.886 | 1.043 | 0.134 | 10.577 | 68.439 | 1.005 | 54.261 | 4.24 | 0.524 | 0.498 | 0.462 | 1.135 | 1.586 | 2.226 | Granodiorite |
| 2-T13 | 17.073 | 40.560 | 5.583 | 22.405 | 4.729 | 0.612 | 4.080 | 5.709 | 0.687 | 2.235 | 2.080 | 0.275 | 20.274 | 4.152 | 3.183 | 106.027 | 6.04 | 0.795 | 0.643 | 0.680 | 1.169 | 0.612 | 0.905 | Muscovitic Tonalite |
| METAMORPHIC ROCKS | ||||||||||||||||||||||||
| 1-T1 | 6.241 | 11.259 | <0.1 | 5.018 | 0.497 | 0.058 | 1.194 | 0.753 | 0.341 | 0.820 | 0.520 | 0.136 | 1.999 | 10.075 | 4.999 | 26.835 | 6.13 | 1.162 | 2.239 | 0.850 | 1.367 | 0.328 | 3.104 | Serpentinite |
| 2-T9B | 2.072 | 18.910 | <0.1 | 6.276 | 1.276 | 0.568 | 1.633 | 4.864 | 0.236 | 1.619 | 0.690 | 0.080 | 8.747 | 71.244 | 1.047 | 38.224 | 3.19 | 0.291 | 0.289 | 0.206 | 1.412 | 1.728 | 9.049 | Hornblende Schist |
| 2-T10 | 4.072 | 22.013 | <0.1 | 8.360 | 1.885 | 0.813 | 2.719 | 5.537 | 0.679 | 2.217 | 2.164 | 0.296 | 19.618 | 34.280 | 1.437 | 50.757 | 2.73 | 0.182 | 0.385 | 0.243 | 0.749 | 1.577 | 7.514 | Green Schist |
| VOLCANO SEDIMENTARY ROCKS | ||||||||||||||||||||||||
| 2-S1 | 10.402 | 28.588 | 0.965 | 13.484 | 2.780 | 0.936 | 3.412 | 3.264 | 0.595 | 2.071 | 2.004 | 0.327 | 17.289 | 36.936 | 1.479 | 68.829 | 4.90 | 0.503 | 0.666 | 0.495 | 1.015 | 1.334 | 1.965 | Volcano-sedimentary |
| 2-S1A | 10.962 | 24.558 | 1.444 | 13.979 | 2.909 | 0.990 | 3.567 | 3.363 | 0.615 | 2.082 | 2.082 | 0.341 | 18.162 | 40.368 | 2.928 | 66.893 | 4.55 | 0.510 | 0.671 | 0.499 | 1.022 | 1.350 | 1.345 | Volc. sed. Breccia |
| CARBONATE SEDIMENTARY ROCKS | ||||||||||||||||||||||||
| 3-S10 | 47.015 | 4.717 | 1.113 | 3.217 | 0.487 | 0.237 | 0.681 | <0.1 | 0.154 | <0.1 | 0.205 | 0.136 | 7.572 | 1.331 | <0.1 | 57.963 | 48.27 | 22.193 | 17.188 | 11.215 | 1.979 | 1.803 | 0.142 | Limestone |
| 3-S11 | 65.850 | 12.256 | 2.377 | 8.824 | 1.857 | 0.447 | 1.886 | 1.568 | 0.310 | 0.368 | 0.853 | <0.1 | 11.789 | 15.656 | 1.079 | 96.597 | 18.37 | 7.476 | 6.315 | 5.674 | 1.317 | 1.048 | 0.213 | Carbonate Breccia |
| Concentration of Rare Earth Elements (REE) in the Soils of Sabana Yegua and Tavera’s Basins | |||||||||||||
| LREE | HREE | ||||||||||||
| SAMPLES | La | Ce | Pr | Nd | Sm | Eu | Gd (µgg−1) | Dy | Ho | Er | Yb | Lu | Y |
| SYS1 | 21.13 | 54.07 | 6.56 | 29.58 | 6.64 | 1.79 | 6.26 | 4.86 | 0.81 | 2.58 | 2.15 | 0.40 | 26.16 |
| SYS2 | 5.66 | 22.17 | 1.07 | 8.83 | 1.73 | 0.60 | 2.06 | 2.60 | 0.35 | 2.25 | 1.43 | 0.34 | 10.98 |
| SYS3 | 14.10 | 34.59 | 3.76 | 17.29 | 3.82 | 1.00 | 3.80 | 3.65 | 0.58 | 2.54 | 2.01 | 0.40 | 19.44 |
| SYS4 | 0.05 | 10.32 | 0.68 | 6.73 | 2.04 | 0.77 | 2.89 | 3.50 | 0.55 | 2.52 | 2.06 | 0.40 | 18.81 |
| SYS6 | 2.52 | 15.79 | 1.08 | 8.54 | 2.14 | 0.78 | 2.81 | 3.36 | 0.51 | 2.52 | 1.91 | 0.38 | 16.39 |
| SYS8 | 10.91 | 20.82 | 2.78 | 12.31 | 2.81 | 0.88 | 3.10 | 2.67 | 0.59 | 1.18 | 1.50 | 0.23 | 14.89 |
| SYS9 | 15.84 | 28.44 | 3.67 | 15.33 | 3.24 | 0.99 | 3.30 | 2.73 | 0.63 | 1.31 | 1.64 | 0.26 | 15.51 |
| SYS10 | 10.05 | 19.36 | 2.10 | 11.09 | 2.43 | 0.73 | 2.72 | 2.33 | 0.50 | 1.03 | 1.22 | 0.20 | 11.20 |
| TS1 | 1.42 | 12.99 | 1.04 | 8.07 | 1.64 | 0.62 | 2.63 | 4.14 | 0.77 | 2.86 | 2.50 | 0.41 | 27.64 |
| TS3 | 9.88 | 27.51 | 1.39 | 11.83 | 2.62 | 0.80 | 3.05 | 2.85 | 0.39 | 1.50 | 1.24 | 0.33 | 13.46 |
| TS5 | 9.81 | 29.70 | 2.86 | 13.00 | 3.66 | 0.95 | 3.49 | 2.84 | 0.36 | 1.92 | 1.46 | 0.28 | 14.33 |
| TS6 | 3.81 | 13.65 | 0.90 | 9.29 | 2.24 | 0.74 | 2.51 | 2.53 | 0.24 | 0.73 | 0.81 | 0.28 | 8.33 |
| TS7 | 3.25 | 15.12 | 0.80 | 7.75 | 1.60 | 0.66 | 1.80 | 2.10 | 0.17 | 1.70 | 0.61 | 0.25 | 4.95 |
| TS8 | 5.48 | 16.28 | 0.59 | 8.09 | 0.93 | 0.37 | 1.70 | 1.90 | 0.32 | 1.36 | 1.09 | 0.27 | 5.53 |
| Sc | Hf | ∑ REE | LREE/ | NORMALIZED VALUES TO NASC | TEXTURE (%) | ||||||||
| (µgg−1) | HREE | (La/Yb)N | (La/Sm)N | (La/Gd)N | (Gd/Yb)N | Eu/Eu* | Ce/Ce* | Sand | Silt | Clay | |||
| SYS1 | 33.60 | 5.31 | 136.82 | 7.02 | 0.95 | 0.57 | 0.55 | 1.74 | 1.22 | 1.00 | 68 | 18 | 14 |
| SYS2 | 18.61 | 4.44 | 49.09 | 4.44 | 0.38 | 0.58 | 0.45 | 0.86 | 1.40 | 1.96 | 24 | 28 | 48 |
| SYS3 | 22.99 | 2.75 | 87.54 | 5.75 | 0.68 | 0.66 | 0.60 | 1.13 | 1.15 | 1.03 | 66 | 16 | 18 |
| SYS4 | 48.28 | 1.23 | 32.50 | 1.73 | 0.00 | 0.00 | 0.00 | 0.84 | 1.40 | 12.35 | 47 | 25 | 28 |
| SYS6 | 42.69 | 1.76 | 42.34 | 2.68 | 0.13 | 0.21 | 0.15 | 0.88 | 1.39 | 2.08 | 36 | 32 | 32 |
| SYS8 | 27.01 | 2.15 | 59.78 | 5.45 | 0.70 | 0.69 | 0.57 | 1.23 | 1.31 | 0.82 | 40 | 34 | 26 |
| SYS9 | 24.80 | 2.31 | 77.38 | 6.84 | 0.94 | 0.87 | 0.78 | 1.20 | 1.33 | 0.81 | 40 | 32 | 28 |
| SYS10 | 27.48 | 2.10 | 53.76 | 5.71 | 0.80 | 0.74 | 0.60 | 1.33 | 1.25 | 0.92 | 26 | 52 | 22 |
| TS1 | 45.84 | 2.45 | 39.10 | 1.94 | 0.06 | 0.15 | 0.09 | 0.63 | 1.31 | 2.33 | 27 | 35 | 38 |
| TS3 | 18.39 | 4.08 | 63.42 | 5.77 | 0.77 | 0.67 | 0.53 | 1.46 | 1.24 | 1.62 | 38 | 43 | 19 |
| TS5 | 20.25 | 3.21 | 70.33 | 5.79 | 0.65 | 0.48 | 0.46 | 1.43 | 1.17 | 1.22 | 50 | 23 | 27 |
| TS6 | 32.96 | 1.53 | 37.73 | 4.32 | 0.46 | 0.30 | 0.25 | 1.85 | 1.38 | 1.61 | 47 | 27 | 26 |
| TS7 | 23.91 | 1.89 | 35.79 | 4.41 | 0.52 | 0.36 | 0.29 | 1.76 | 1.71 | 2.04 | 37 | 29 | 34 |
| TS8 | 35.40 | 3.41 | 38.38 | 4.78 | 0.49 | 1.05 | 0.52 | 0.93 | 1.31 | 1.97 | 14 | 21 | 65 |
| Texture | Chemical | |||||||||||||||||||||||||||
|---|---|---|---|---|---|---|---|---|---|---|---|---|---|---|---|---|---|---|---|---|---|---|---|---|---|---|---|---|
| LREE | HREE | Other REE | Total | Ratio | Normalized Values To NASC | Condition | ||||||||||||||||||||||
| Samples | La | Ce | Pr | Nd | Sm | Eu | Gd | Dy | Ho | Er | Yb | Lu | Y | Sc | Hf | ∑ REE | LREE/ | (La/Yb)N | (La/Sm)N | (La/Gd)N | (Gd/Yb)N | Eu/Eu* | Ce/Ce* | Sand | Silt | Clay | pH | Eh |
| (µgg−1) | HREE | (%) | (%) | (%) | (mV) | |||||||||||||||||||||||
| Sabana Yegua: Rainy Season | ||||||||||||||||||||||||||||
| SY2 | 10.376 | 25.894 | 3.057 | 14.245 | 3.190 | 0.874 | 3.430 | 3.451 | 0.517 | 2.504 | 1.817 | 0.375 | 18.518 | 27.996 | 1.925 | 69.730 | 4.765 | 0.553 | 0.579 | 0.492 | 1.125 | 1.160 | 1.001 | 0.05 | 43.73 | 56.22 | 6.74 | −41 |
| SY3 | 10.915 | 27.764 | 3.372 | 14.486 | 3.306 | 0.888 | 3.428 | 3.466 | 0.511 | 2.404 | 1.834 | 0.372 | 18.661 | 26.121 | 2.140 | 72.747 | 5.054 | 0.577 | 0.588 | 0.517 | 1.114 | 1.158 | 0.997 | 0.03 | 47.36 | 52.61 | 6.75 | −57 |
| SY9 | 13.522 | 30.987 | 3.696 | 15.622 | 3.356 | 0.907 | 3.290 | 3.300 | 0.470 | 2.285 | 1.698 | 0.362 | 16.465 | 21.784 | 1.232 | 79.495 | 5.970 | 0.772 | 0.718 | 0.668 | 1.155 | 1.198 | 0.955 | 0.70 | 59.62 | 39.67 | 6.85 | 9 |
| SY10 | 10.489 | 29.363 | 3.641 | 16.507 | 3.874 | 1.022 | 4.036 | 3.836 | 0.603 | 2.448 | 1.979 | 0.389 | 20.393 | 26.067 | 2.586 | 78.188 | 4.882 | 0.513 | 0.482 | 0.422 | 1.216 | 1.135 | 1.035 | 14.89 | 62.88 | 22.23 | 6.79 | −50 |
| SY11A | 9.097 | 27.552 | 3.142 | 14.862 | 3.624 | 1.038 | 3.882 | 3.634 | 0.561 | 2.143 | 1.843 | 0.378 | 19.102 | 29.619 | 3.120 | 71.756 | 4.768 | 0.478 | 0.447 | 0.381 | 1.256 | 1.215 | 1.122 | 5.57 | 52.06 | 42.36 | 6.75 | −65 |
| SY13 | 11.483 | 25.047 | 2.850 | 12.792 | 3.225 | 0.897 | 3.455 | 3.566 | 0.531 | 2.334 | 1.839 | 0.383 | 18.715 | 29.279 | 2.150 | 68.402 | 4.649 | 0.605 | 0.634 | 0.540 | 1.120 | 1.180 | 0.954 | 7.60 | 22.33 | 70.07 | 6.71 | −62 |
| SY14 | 15.418 | 27.489 | 3.123 | 13.175 | 3.024 | 0.817 | 2.802 | 3.012 | 0.399 | 2.146 | 1.365 | 0.338 | 13.814 | 16.090 | 2.056 | 73.108 | 6.266 | 1.095 | 0.908 | 0.894 | 1.224 | 1.233 | 0.863 | 54.52 | 19.77 | 25.70 | 7.26 | −50 |
| Maximun | 15.418 | 30.987 | 3.696 | 16.507 | 3.874 | 1.038 | 4.036 | 3.836 | 0.603 | 2.504 | 1.979 | 0.389 | 20.393 | 29.619 | 3.120 | 79.495 | 6.266 | 1.095 | 0.908 | 0.894 | 1.256 | 1.233 | 1.122 | 54.52 | 62.88 | 70.07 | 7.26 | 9 |
| Minimum | 9.097 | 25.047 | 2.850 | 12.792 | 3.024 | 0.817 | 2.802 | 3.012 | 0.399 | 2.143 | 1.365 | 0.338 | 13.814 | 16.090 | 1.232 | 68.402 | 4.649 | 0.478 | 0.447 | 0.381 | 1.114 | 1.135 | 0.863 | 0.03 | 19.77 | 22.23 | 6.71 | −65 |
| Average | 11.614 | 27.728 | 3.269 | 14.527 | 3.371 | 0.920 | 3.475 | 3.467 | 0.513 | 2.323 | 1.768 | 0.371 | 17.953 | 25.280 | 2.173 | 73.347 | 5.194 | 0.656 | 0.622 | 0.559 | 1.173 | 1.182 | 0.990 | 11.91 | 43.97 | 44.12 | 6.84 | −45 |
| Median | 10.915 | 27.552 | 3.142 | 14.486 | 3.306 | 0.897 | 3.430 | 3.466 | 0.517 | 2.334 | 1.834 | 0.375 | 18.661 | 26.121 | 2.140 | 72.747 | 4.882 | 0.577 | 0.588 | 0.517 | 1.155 | 1.180 | 0.997 | 5.57 | 47.36 | 42.36 | 6.75 | −50 |
| SD | 1.991 | 1.849 | 0.290 | 1.204 | 0.266 | 0.074 | 0.373 | 0.242 | 0.060 | 0.131 | 0.181 | 0.015 | 2.001 | 4.475 | 0.539 | 3.812 | 0.601 | 0.199 | 0.144 | 0.161 | 0.054 | 0.032 | 0.074 | 18.09 | 15.74 | 15.74 | 0.18 | 23 |
| CV (%) | 17.144 | 6.669 | 8.874 | 8.290 | 7.895 | 8.077 | 10.730 | 6.973 | 11.764 | 5.644 | 10.245 | 4.176 | 11.144 | 17.703 | 24.789 | 5.197 | 11.575 | 30.330 | 23.066 | 28.784 | 4.581 | 2.714 | 7.493 | 151.90 | 35.79 | 35.66 | 2.61 | −52 |
| Sabana Yegua: Dry Season | ||||||||||||||||||||||||||||
| SY1 | 12.007 | 31.125 | 2.359 | 15.921 | 3.111 | 0.979 | 3.368 | 5.609 | 0.688 | 1.880 | 2.054 | 0.271 | 20.230 | 25.079 | 2.582 | 79.373 | 4.723 | 0.566 | 0.687 | 0.579 | 0.977 | 1.328 | 1.274 | 0.66 | 33.49 | 65.86 | 6.68 | −94 |
| SY3 | 12.292 | 31.433 | 2.621 | 15.748 | 3.175 | 0.987 | 3.373 | 5.628 | 0.695 | 2.037 | 2.046 | 0.267 | 20.075 | 25.094 | 2.504 | 80.301 | 4.717 | 0.582 | 0.690 | 0.592 | 0.983 | 1.324 | 1.206 | 1.20 | 29.94 | 68.86 | 6.85 | −80 |
| SY4 | 12.834 | 31.766 | 2.492 | 15.009 | 2.847 | 0.922 | 2.951 | 5.422 | 0.584 | 1.839 | 1.722 | 0.224 | 17.335 | 20.921 | 2.711 | 78.610 | 5.170 | 0.722 | 0.803 | 0.707 | 1.022 | 1.396 | 1.224 | 12.36 | 29.71 | 57.93 | 6.81 | −87 |
| SY5 | 12.282 | 32.061 | 2.379 | 16.711 | 3.361 | 1.064 | 3.644 | 5.705 | 0.749 | 1.810 | 2.185 | 0.295 | 21.541 | 28.330 | 3.173 | 82.245 | 4.716 | 0.545 | 0.651 | 0.548 | 0.994 | 1.335 | 1.292 | 0.47 | 40.21 | 59.32 | 6.85 | −104 |
| SY6 | 13.505 | 31.826 | 3.064 | 15.740 | 3.193 | 0.937 | 3.168 | 5.559 | 0.647 | 2.152 | 1.932 | 0.250 | 18.807 | 18.475 | 2.227 | 81.970 | 4.980 | 0.677 | 0.753 | 0.693 | 0.978 | 1.293 | 1.078 | 0.40 | 55.96 | 43.65 | 6.65 | −94 |
| SY7A | 9.447 | 28.824 | 1.926 | 14.019 | 2.878 | 0.978 | 3.353 | 5.619 | 0.686 | 2.132 | 2.004 | 0.255 | 19.789 | 27.468 | 2.246 | 72.120 | 4.134 | 0.457 | 0.585 | 0.458 | 0.997 | 1.383 | 1.472 | 8.48 | 30.85 | 60.67 | 6.94 | −104 |
| SY8A | 9.148 | 28.399 | 1.896 | 13.667 | 2.899 | 0.965 | 3.231 | 5.604 | 0.678 | 2.042 | 1.952 | 0.249 | 19.281 | 26.723 | 2.135 | 70.729 | 4.142 | 0.454 | 0.562 | 0.460 | 0.987 | 1.384 | 1.485 | 1.41 | 63.72 | 34.87 | 7.87 | −106 |
| SY9A | 11.873 | 31.762 | 2.805 | 15.871 | 3.440 | 1.060 | 3.595 | 5.715 | 0.733 | 2.045 | 2.085 | 0.268 | 20.663 | 25.027 | 2.264 | 81.254 | 4.626 | 0.552 | 0.615 | 0.537 | 1.028 | 1.324 | 1.199 | 2.09 | 37.18 | 60.73 | 6.84 | −121 |
| SY10 | 13.771 | 35.077 | 3.499 | 17.746 | 3.657 | 1.160 | 3.720 | 5.706 | 0.727 | 2.070 | 1.996 | 0.256 | 19.693 | 20.861 | 2.929 | 89.384 | 5.175 | 0.668 | 0.671 | 0.602 | 1.111 | 1.381 | 1.101 | 66.94 | 17.40 | 15.66 | 7.06 | −109 |
| SY13 | 14.206 | 13.338 | 4.412 | 17.359 | 3.968 | 1.101 | 3.619 | 3.648 | 0.750 | 2.135 | 1.920 | 0.326 | 21.245 | 28.841 | 2.682 | 66.784 | 4.386 | 0.717 | 0.638 | 0.638 | 1.124 | 1.276 | 0.367 | 0.75 | 25.13 | 74.12 | 6.68 | −92 |
| SY14 | 15.560 | 17.293 | 4.247 | 17.740 | 3.696 | 0.966 | 3.151 | 3.091 | 0.636 | 1.942 | 1.685 | 0.289 | 18.437 | 19.762 | 2.610 | 70.296 | 5.513 | 0.895 | 0.750 | 0.803 | 1.115 | 1.243 | 0.463 | 9.92 | 34.21 | 55.87 | 6.68 | −106 |
| SY15 | 12.206 | 14.633 | 3.525 | 15.358 | 3.657 | 1.017 | 3.230 | 3.271 | 0.666 | 2.067 | 1.680 | 0.280 | 18.694 | 26.191 | 2.736 | 61.588 | 4.503 | 0.704 | 0.595 | 0.614 | 1.147 | 1.299 | 0.486 | 35.16 | 34.13 | 30.72 | 6.80 | −116 |
| Maximun | 15.560 | 35.077 | 4.412 | 17.746 | 3.968 | 1.160 | 3.720 | 5.715 | 0.750 | 2.152 | 2.185 | 0.326 | 21.541 | 28.841 | 3.173 | 89.384 | 5.513 | 0.895 | 0.803 | 0.803 | 1.147 | 1.396 | 1.485 | 66.94 | 63.72 | 74.12 | 7.87 | −80 |
| Minimum | 9.148 | 13.338 | 1.896 | 13.667 | 2.847 | 0.922 | 2.951 | 3.091 | 0.584 | 1.810 | 1.680 | 0.224 | 17.335 | 18.475 | 2.135 | 61.588 | 4.134 | 0.454 | 0.562 | 0.458 | 0.977 | 1.243 | 0.367 | 0.40 | 17.40 | 15.66 | 6.65 | −121 |
| Average | 12.428 | 27.295 | 2.935 | 15.907 | 3.323 | 1.011 | 3.367 | 5.048 | 0.687 | 2.013 | 1.938 | 0.269 | 19.649 | 24.398 | 2.567 | 76.221 | 4.732 | 0.628 | 0.667 | 0.602 | 1.039 | 1.331 | 1.054 | 11.65 | 35.99 | 52.35 | 6.89 | −101 |
| Median | 12.287 | 31.279 | 2.713 | 15.809 | 3.277 | 0.983 | 3.360 | 5.606 | 0.687 | 2.043 | 1.974 | 0.267 | 19.741 | 25.087 | 2.596 | 78.992 | 4.717 | 0.625 | 0.661 | 0.597 | 1.010 | 1.326 | 1.202 | 1.75 | 33.81 | 58.62 | 6.83 | −104 |
| SD | 1.740 | 7.270 | 0.798 | 1.266 | 0.351 | 0.068 | 0.226 | 0.998 | 0.047 | 0.112 | 0.156 | 0.025 | 1.164 | 3.364 | 0.298 | 7.558 | 0.403 | 0.121 | 0.071 | 0.096 | 0.063 | 0.046 | 0.375 | 19.19 | 12.13 | 16.72 | 0.32 | 11 |
| CV (%) | 14.000 | 26.636 | 27.178 | 7.960 | 10.572 | 6.757 | 6.717 | 19.764 | 6.909 | 5.581 | 8.071 | 9.316 | 5.926 | 13.787 | 11.604 | 9.916 | 8.519 | 19.282 | 10.662 | 15.862 | 6.046 | 3.475 | 35.557 | 164.69 | 33.70 | 31.94 | 4.59 | −11 |
| Tavera: Rainy Season | ||||||||||||||||||||||||||||
| T1 | 11.519 | 27.105 | 2.777 | 13.800 | 3.412 | 0.910 | 3.541 | 3.523 | 0.516 | 2.447 | 1.772 | 0.376 | 17.576 | 35.773 | 2.092 | 71.697 | 4.889 | 0.630 | 0.601 | 0.529 | 1.192 | 1.149 | 1.044 | 0.04 | 23.25 | 76.71 | 6.70 | −2 |
| T5 | 9.404 | 27.960 | 2.909 | 14.320 | 3.677 | 0.997 | 3.856 | 3.731 | 0.565 | 2.230 | 1.948 | 0.388 | 19.562 | 37.391 | 2.335 | 71.986 | 4.659 | 0.468 | 0.456 | 0.396 | 1.180 | 1.163 | 1.164 | 0.05 | 42.53 | 57.42 | 6.89 | −48 |
| T8 | 9.558 | 27.664 | 3.027 | 16.458 | 3.691 | 1.008 | 3.966 | 3.728 | 0.577 | 2.488 | 1.974 | 0.392 | 20.061 | 34.725 | 3.206 | 74.532 | 4.679 | 0.469 | 0.461 | 0.392 | 1.198 | 1.156 | 1.120 | 0.45 | 77.61 | 21.94 | 6.95 | −43 |
| T12 | 9.257 | 24.333 | 2.853 | 13.432 | 3.687 | 1.014 | 3.987 | 3.931 | 0.635 | 2.744 | 2.153 | 0.412 | 21.757 | 32.374 | 1.993 | 68.438 | 3.937 | 0.417 | 0.447 | 0.377 | 1.104 | 1.161 | 1.031 | 0.33 | 76.39 | 23.28 | 6.93 | −43 |
| Maximun | 11.519 | 27.960 | 3.027 | 16.458 | 3.691 | 1.014 | 3.987 | 3.931 | 0.635 | 2.744 | 2.153 | 0.412 | 21.757 | 37.391 | 3.206 | 74.532 | 4.889 | 0.630 | 0.601 | 0.529 | 1.198 | 1.163 | 1.164 | 0.45 | 77.61 | 76.71 | 6.95 | −2 |
| Minimum | 9.257 | 24.333 | 2.777 | 13.432 | 3.412 | 0.910 | 3.541 | 3.523 | 0.516 | 2.230 | 1.772 | 0.376 | 17.576 | 32.374 | 1.993 | 68.438 | 3.937 | 0.417 | 0.447 | 0.377 | 1.104 | 1.149 | 1.031 | 0.04 | 23.25 | 21.94 | 6.70 | −48 |
| Average | 9.934 | 26.765 | 2.891 | 14.503 | 3.617 | 0.982 | 3.838 | 3.728 | 0.573 | 2.477 | 1.962 | 0.392 | 19.739 | 35.066 | 2.407 | 71.663 | 4.541 | 0.496 | 0.491 | 0.423 | 1.168 | 1.157 | 1.090 | 0.22 | 54.94 | 44.84 | 6.87 | −34 |
| Median | 9.481 | 27.384 | 2.881 | 14.060 | 3.682 | 1.002 | 3.911 | 3.730 | 0.571 | 2.467 | 1.961 | 0.390 | 19.812 | 35.249 | 2.214 | 71.841 | 4.669 | 0.468 | 0.458 | 0.394 | 1.186 | 1.159 | 1.082 | 0.19 | 59.46 | 40.35 | 6.91 | −43 |
| SD | 0.921 | 1.438 | 0.091 | 1.172 | 0.118 | 0.042 | 0.178 | 0.144 | 0.042 | 0.183 | 0.135 | 0.013 | 1.490 | 1.821 | 0.478 | 2.164 | 0.360 | 0.080 | 0.064 | 0.061 | 0.038 | 0.005 | 0.055 | 0.18 | 23.09 | 23.26 | 0.10 | 19 |
| CV (%) | 9.268 | 5.372 | 3.157 | 8.084 | 3.272 | 4.314 | 4.641 | 3.869 | 7.376 | 7.369 | 6.887 | 3.345 | 7.550 | 5.194 | 19.869 | 3.020 | 7.931 | 16.188 | 12.964 | 14.426 | 3.227 | 0.470 | 5.029 | 82.10 | 42.02 | 51.87 | 1.44 | −55 |
| Tavera: Dry Season | ||||||||||||||||||||||||||||
| T1 | 12.463 | 8.171 | 4.425 | 16.499 | 3.967 | 1.059 | 3.485 | 3.373 | 0.665 | 2.114 | 1.699 | 0.279 | 18.464 | 36.480 | 1.911 | 58.200 | 4.011 | 0.711 | 0.560 | 0.581 | 1.223 | 1.250 | 0.240 | 0.60 | 15.62 | 83.78 | 6.61 | −65 |
| T2 | 13.453 | 14.329 | 4.370 | 17.324 | 4.287 | 1.154 | 3.710 | 3.735 | 0.740 | 2.527 | 1.874 | 0.311 | 20.543 | 37.091 | 2.316 | 67.813 | 4.258 | 0.696 | 0.559 | 0.589 | 1.180 | 1.271 | 0.407 | 0.69 | 26.07 | 73.24 | 6.85 | −92 |
| T3 | 13.089 | 12.996 | 4.338 | 16.638 | 4.095 | 1.138 | 3.595 | 3.653 | 0.726 | 2.632 | 1.852 | 0.306 | 20.119 | 35.282 | 2.120 | 65.059 | 4.097 | 0.685 | 0.569 | 0.592 | 1.157 | 1.302 | 0.376 | 0.96 | 34.11 | 64.92 | 6.97 | −89 |
| T4 | 12.956 | 8.315 | 4.542 | 17.111 | 3.960 | 1.126 | 3.848 | 3.537 | 0.713 | 2.443 | 1.885 | 0.320 | 20.774 | 32.989 | 2.412 | 60.755 | 3.767 | 0.666 | 0.583 | 0.547 | 1.217 | 1.266 | 0.236 | 4.77 | 36.90 | 58.33 | 7.00 | −97 |
| T5 | 11.987 | 40.373 | 2.102 | 17.081 | 3.627 | 1.082 | 4.129 | 3.333 | 0.669 | 2.206 | 1.754 | 0.294 | 19.192 | 33.838 | 2.414 | 88.636 | 6.157 | 0.662 | 0.589 | 0.472 | 1.404 | 1.227 | 1.752 | 0.04 | 45.54 | 54.43 | 6.90 | −87 |
| T6 | 12.600 | 24.388 | 3.390 | 16.702 | 3.752 | 1.128 | 4.730 | 3.549 | 0.716 | 2.203 | 1.858 | 0.312 | 20.148 | 31.711 | 2.631 | 75.326 | 4.636 | 0.657 | 0.598 | 0.433 | 1.518 | 1.176 | 0.813 | 5.45 | 33.09 | 61.46 | 6.91 | −87 |
| T7 | 17.095 | 28.182 | 5.039 | 23.257 | 5.498 | 1.400 | 4.793 | 4.579 | 0.947 | 2.654 | 2.355 | 0.389 | 26.797 | 36.532 | 2.775 | 96.187 | 5.120 | 0.703 | 0.554 | 0.580 | 1.213 | 1.198 | 0.661 | 5.25 | 64.75 | 30.01 | 6.88 | −75 |
| T9 | 15.764 | 29.504 | 2.832 | 15.397 | 3.731 | 0.997 | 3.539 | 3.388 | 0.722 | 2.271 | 1.771 | 0.317 | 19.239 | 33.199 | 1.783 | 80.231 | 5.682 | 0.862 | 0.753 | 0.724 | 1.191 | 1.205 | 0.962 | 1.11 | 25.96 | 72.93 | 6.97 | −82 |
| T10 | 11.981 | 30.592 | 2.692 | 16.345 | 3.743 | 1.046 | 3.338 | 3.301 | 0.658 | 2.146 | 1.689 | 0.286 | 18.487 | 36.008 | 2.189 | 77.817 | 5.815 | 0.687 | 0.570 | 0.583 | 1.178 | 1.300 | 1.173 | 0.09 | 34.41 | 65.50 | 7.11 | −89 |
| T11 | 13.236 | 31.134 | 3.201 | 17.734 | 4.296 | 1.215 | 3.829 | 3.834 | 0.776 | 2.342 | 1.924 | 0.320 | 21.066 | 34.462 | 2.106 | 83.841 | 5.437 | 0.667 | 0.549 | 0.562 | 1.187 | 1.315 | 1.042 | 1.93 | 15.41 | 82.66 | 7.25 | −104 |
| T12 | 13.006 | 29.122 | 2.753 | 16.495 | 4.012 | 1.118 | 3.595 | 3.698 | 0.782 | 2.304 | 1.933 | 0.327 | 21.117 | 33.729 | 2.263 | 79.145 | 5.262 | 0.652 | 0.577 | 0.588 | 1.109 | 1.292 | 1.060 | 0.55 | 34.25 | 65.19 | 6.76 | −92 |
| T13 | 14.220 | 25.313 | 3.204 | 16.019 | 3.728 | 1.019 | 3.516 | 3.290 | 0.670 | 1.968 | 1.647 | 0.285 | 18.046 | 34.519 | 2.048 | 74.879 | 5.582 | 0.836 | 0.679 | 0.657 | 1.272 | 1.236 | 0.817 | 0.28 | 26.18 | 73.55 | 6.61 | −99 |
| Maximun | 17.095 | 40.373 | 5.039 | 23.257 | 5.498 | 1.400 | 4.793 | 4.579 | 0.947 | 2.654 | 2.355 | 0.389 | 26.797 | 37.091 | 2.775 | 96.187 | 6.157 | 0.862 | 0.753 | 0.724 | 1.518 | 1.315 | 1.752 | 5.45 | 64.75 | 83.78 | 7.25 | −65 |
| Minimum | 11.981 | 8.171 | 2.102 | 15.397 | 3.627 | 0.997 | 3.338 | 3.290 | 0.658 | 1.968 | 1.647 | 0.279 | 18.046 | 31.711 | 1.783 | 58.200 | 3.767 | 0.652 | 0.549 | 0.433 | 1.109 | 1.176 | 0.236 | 0.04 | 15.41 | 30.01 | 6.61 | −104 |
| Average | 13.487 | 23.535 | 3.574 | 17.217 | 4.058 | 1.123 | 3.842 | 3.606 | 0.732 | 2.318 | 1.853 | 0.312 | 20.333 | 34.653 | 2.247 | 75.657 | 4.985 | 0.707 | 0.595 | 0.576 | 1.238 | 1.253 | 0.795 | 1.81 | 32.69 | 65.50 | 6.90 | −88 |
| Median | 13.047 | 26.747 | 3.297 | 16.670 | 3.964 | 1.122 | 3.652 | 3.543 | 0.719 | 2.287 | 1.855 | 0.311 | 20.133 | 34.490 | 2.226 | 76.571 | 5.191 | 0.686 | 0.574 | 0.582 | 1.202 | 1.258 | 0.815 | 0.83 | 33.60 | 65.34 | 6.91 | −89 |
| SD | 1.467 | 9.776 | 0.890 | 1.914 | 0.483 | 0.102 | 0.456 | 0.342 | 0.076 | 0.203 | 0.177 | 0.028 | 2.196 | 1.585 | 0.273 | 10.786 | 0.768 | 0.066 | 0.058 | 0.072 | 0.109 | 0.044 | 0.427 | 1.99 | 12.71 | 13.72 | 0.18 | 10 |
| CV (%) | 10.878 | 41.540 | 24.903 | 11.114 | 11.899 | 9.089 | 11.863 | 9.486 | 10.387 | 8.742 | 9.529 | 8.814 | 10.801 | 4.574 | 12.140 | 14.256 | 15.404 | 9.381 | 9.722 | 12.436 | 8.828 | 3.481 | 53.670 | 110.21 | 38.89 | 20.95 | 2.57 | −11 |
Publisher’s Note: MDPI stays neutral with regard to jurisdictional claims in published maps and institutional affiliations. |
© 2021 by the authors. Licensee MDPI, Basel, Switzerland. This article is an open access article distributed under the terms and conditions of the Creative Commons Attribution (CC BY) license (https://creativecommons.org/licenses/by/4.0/).
Share and Cite
Fonseca, R.; Araújo, J.F.; Pinho, C.G. Importance of the Spatial Distribution of Rare Earth Elements in the Bottom Sediments of Reservoirs as a Potential Proxy for Tracing Sediments Sources. A Case Study in the Dominican Republic. Geosciences 2021, 11, 490. https://doi.org/10.3390/geosciences11120490
Fonseca R, Araújo JF, Pinho CG. Importance of the Spatial Distribution of Rare Earth Elements in the Bottom Sediments of Reservoirs as a Potential Proxy for Tracing Sediments Sources. A Case Study in the Dominican Republic. Geosciences. 2021; 11(12):490. https://doi.org/10.3390/geosciences11120490
Chicago/Turabian StyleFonseca, Rita, Joana Fonseca Araújo, and Catarina Gomes Pinho. 2021. "Importance of the Spatial Distribution of Rare Earth Elements in the Bottom Sediments of Reservoirs as a Potential Proxy for Tracing Sediments Sources. A Case Study in the Dominican Republic" Geosciences 11, no. 12: 490. https://doi.org/10.3390/geosciences11120490