Abstract
This case-study focuses on the analysis of several key assumptions necessary for the probabilistic seismic hazard assessment of Romania in the light of a future seismic hazard zonation of the territory. Among the aspects analyzed in this study are the appropriateness of the Poisson assumption which is tested on the earthquake catalogs of several seismic sources (crustal and the Vrancea intermediate-depth source), the azimuthal dependence of ground motion amplitudes from Vrancea intermediate-depth earthquakes and possible ground motion amplifications due to basin effects. The analyses performed in this study show that the Poisson distribution is able to model the observed earthquake frequency occurrence for the larger magnitude seismic events both for crustal and intermediate-depth seismic sources. Similar ground motion attenuation patterns irrespective of the azimuth with respect to the Vrancea intermediate-depth seismic source were observed only in the case of the 30 May 1990 earthquake, while in the case of the seismic events of 30 August 1986 and 31 May 1990 significant azimuthal ground-motion attenuation differences were observed. No significant differences in terms of ground motion amplitudes were observed at three seismic stations in Iasi area during the Vrancea intermediate-depth earthquakes of 30 May 1990 and 31 May 1990 possibly due to the limited elevation difference. Finally, significant long-period spectral amplifications were observed on the ground motions recorded at several sites from intramountainous depressions in Romania.
1. Introduction
Romania can be considered as one of the countries with the highest seismic hazard levels in Europe, mainly due to the highly active Vrancea intermediate-depth seismic source. This seismic source which is capable of generating two-three large magnitude earthquakes in each century affects mainly the southern and eastern part of Romania, as well as the territories of several neighboring countries, such as Moldova, Bulgaria and Ukraine. The seismic hazard at national level is dominated for about two thirds of the territory by this intermediate-depth seismic source. The last earthquake with a moment magnitude MW ≥ 6.0 occurred in October 2004, while the last large magnitude event was the 30 May 1990 event with a moment magnitude MW ≥ 6.9. The Vrancea earthquake of 4 March 1977 is the most damaging seismic event of the XXth century both in terms of human casualties and economic losses. The long-period spectral amplifications observed on the single free-field ground motion recorded in the eastern part of Bucharest and which represents one of the peculiar characteristics of this earthquake were discussed in the literature soon after the event [1].
An in-depth characterization of this peculiar seismic source from the seismological point of view can be found in the studies of Fillerup et al. [2], Koulakov et al. [3], Ismail-Zadeh et al. [4], Bokelmann and Rodler [5] and Petrescu et al. [6]. The most recent study of Petrescu et al. [6] concludes based on the observed seismicity and stress regime patterns that a weak coupling (or an initiation of decoupling) between the sinking slab and the overriding crust currently still exists. The subduction process beneath the Carpathian Mountains is estimated to have stopped about 10 million years ago [7]. From the engineering point of view, the analysis of the spectral characteristics of the ground motions recorded during Vrancea intermediate-depth earthquakes which have occurred in the period 1977–2013 (10 seismic events) can be found in the study of Pavel et al. [8]. More recently, three additional intermediate-depth moderate seismic events (MW ≈ 5.5) occurred in September 2016, December 2016 and October 2018. From the point of view of seismic hazard assessment, the study of [9] shows that the mean peak ground acceleration with 10% exceedance probability in 50 years (mean return period of 475 years) can be as high as 0.5 g in the regions close to the Vrancea intermediate-depth seismic source and about 0.35 g in the capital city of Bucharest. In another seismic hazard study [10], the peak ground acceleration on rock conditions with 10% exceedance probability in 50 years has much smaller values, not exceeding 0.35 g in Romania. However, it was observed that significant differences in terms of the seismic hazard assumptions used in the two above-mentioned studies [9] and [10] exist.
This case-study focuses on several key aspect related to the probabilistic seismic hazard assessment performed recently within the BIGSEES (Bridging the gap between seismology and earthquake engineering) research project [9]. These aspects were not discussed previously in the seismic hazard studies performed neither within the BIGSEES project [9], nor within the SHARE (Seismic hazard harmonization in Europe) project [10] and are important in order to derive meaningful results for the future seismic zonation of Romania. The main aspects related to the probabilistic seismic hazard assessment analyzed in this study are: (i) the applicability of the Poisson assumption on the earthquake catalogs of several seismic sources (two crustal seismic sources affecting mainly the western and central part of Romania and the Vrancea intermediate-depth), (ii) the azimuth-dependent ground motion attenuation, as well as (iii) the possible ground motion amplifications due to basin effects in the case of Iasi and other sites in Romania (including some sites situated in the intramountainous depressions near the Carpathian Mountains).
2. Evaluation of the Poisson’s Assumption
The seismicity of Romania comprises a mix of 13 crustal seismic sources situated in Romania and in some neighboring countries, as well and the Vrancea intermediate-depth seismic source which is located within the Carpathian Mountains [11]. The positions of all the seismic sources affecting the Romanian territory was defined within the BIGSEES research project by the National Institute of Earth Physics (NIEP) in Romania [9].
The Poisson assumption is a very important aspect in the probabilistic seismic hazard assessment (PSHA) [12,13]. Ordaz and Arroyo [14] note that that if the earthquake occurrence process in time is Poissonian, then the occurrence process of earthquakes with intensities larger than a pre-scribed value is also Poissonian. In the case of non-Poisson processes, Ordaz and Arroyo [14] have derived general expressions to compute the probability distribution, the expected value, and the variance of the number of earthquakes per year. The earthquake catalogs used in the probabilistic seismic hazard assessment performed in the study of Pavel et al. [9] were declustered using the algorithm proposed by Gardner and Knopoff [15]. The minimum magnitude for all the earthquake catalogs of crustal seismic sources was taken as Mmin = 4.5, while in the case of the Vrancea intermediate-depth seismic source, a higher Mmin = 4.9 was employed.
In this study, the assessment of the suitability of the Poisson assumption is performed for the earthquake catalogs corresponding to three seismic sources: the Vrancea intermediate-depth seismic source, as well as the Banat and Fagaras-Campulung crustal seismic sources which are based on the ROMPLUS earthquake catalog developed by the National Institute of Earth Physics (NIEP) [16]. The characteristics of the three earthquake catalogs (no. of seismic events, starting year of the catalog, as well as the minimum and the maximum magnitude of the dataset) are given in Table 1.

Table 1.
Characteristics of the earthquake catalogs for the three considered seismic sources.
A comparison between the observed and the theoretical (Poisson) earthquake frequency occurrence for the three analyzed seismic sources and for four magnitude thresholds are shown in Figure 1, Figure 2 and Figure 3.
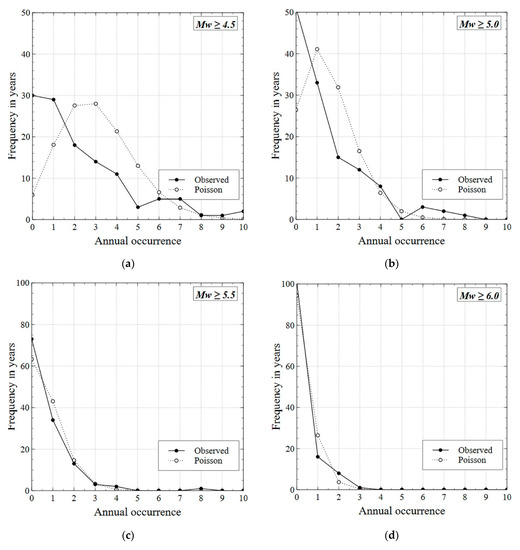
Figure 1.
Comparison between the observed and the theoretical earthquake frequency occurrence for earthquakes occurring in the Vrancea intermediate-depth seismic source with: (a) MW ≥ 4.5; (b) MW ≥ 5.0; (c) MW ≥ 5.5; (d) MW ≥ 6.0.
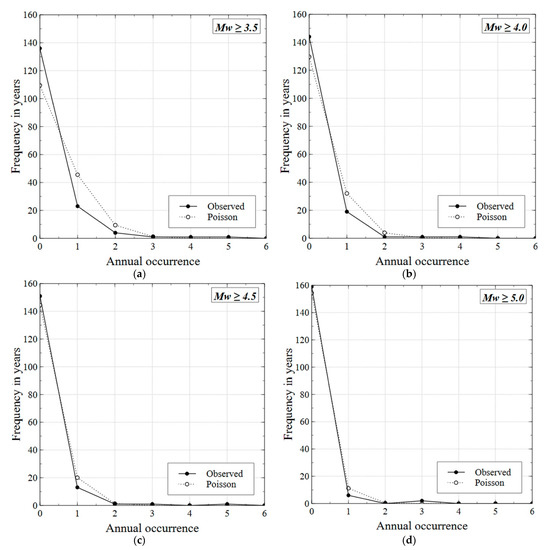
Figure 2.
Comparison between the observed and the theoretical earthquake frequency occurrence for earthquakes occurring in the Banat seismic source with: (a) MW ≥ 3.5; (b) MW ≥ 4.0; (c) MW ≥ 4.5; (d) MW ≥ 5.0.
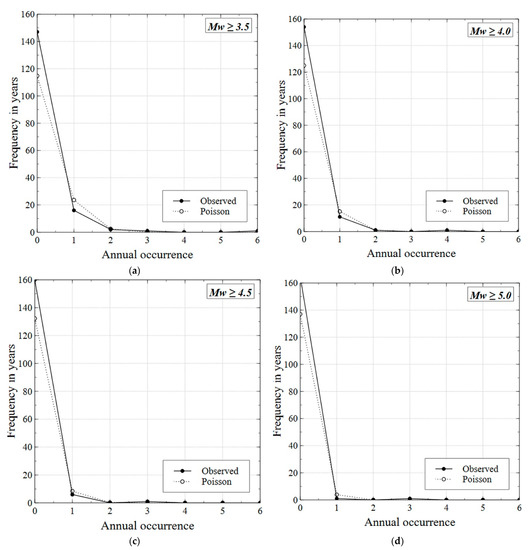
Figure 3.
Comparison between the observed and the theoretical earthquake frequency occurrence for earthquakes occurring in the Fagaras-Campulung seismic source with: (a) MW ≥ 3.5; (b) MW ≥ 4.0; (c) MW ≥ 4.5; (d) MW ≥ 5.0.
It can be noticed from all the plots that the Poisson distribution is able to model the observed earthquake frequency occurrence for the larger magnitude seismic events in the dataset. The same observation was made in other studies with the same topic (e.g., [17,18]). A Chi-square test is performed for each earthquake catalog in order to evaluate the threshold magnitude at which the Poisson assumption in no-longer rejected. The resulting threshold magnitudes are as follows:
- MW = 6.0 for the Vrancea intermediate-depth seismic source;
- MW = 5.2 for the Banat crustal seismic source;
- MW = 5.3 for the Fagaras-Campulung crustal seismic source.
In order to evaluate the impact of the Poisson assumption, a seismic hazard disaggregation [19] is performed for several cities affected by earthquakes originating in the three analyzed seismic sources, namely Bucharest, Focsani and Iasi which are under the influence of the Vrancea intermediate-depth seismic source, Sibiu which is affected by the Fagaras-Campulung seismic source and Timisoara which is directly influenced by the Banat seismic source. The positions of the five sites and the contours of the three analyzed seismic sources are illustrated in Figure 4.
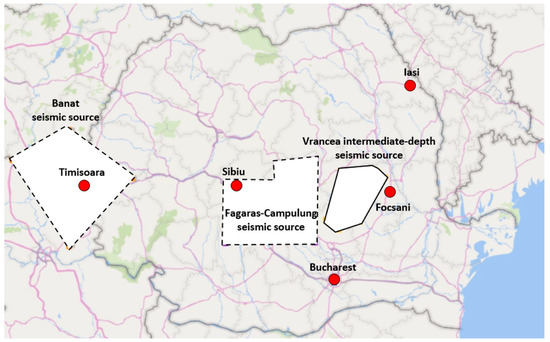
Figure 4.
Positions of the five analyzed sites and contours of the three seismic sources.
The contribution of each magnitude range on the seismic hazard level for the peak ground acceleration (PGA) with a mean return period of 475 years (probability of exceedance of 10% in 50 years) is shown in Table 2 based on the results from [9].
Table 2.
Seismic hazard disaggregation (peak ground acceleration with a mean return period of 475 years) as a function of the earthquake magnitude for five cities in Romania [9].
It can be observed from Table 2 that the contribution to the seismic hazard (e.g., peak ground acceleration with a mean return period of 475 years) of the earthquake magnitudes for which the Poisson assumption can be rejected is relatively small for the two cities affected by the crustal seismic sources and can be totally disregarded for the sites under the influence of the Vrancea intermediate-depth seismic source. Consequently, it can be concluded that the impact of disregarding the Poisson assumption on the probabilistic seismic hazard results is rather limited. Finally, it has to be noted that the procedure for performing aftershock probabilistic seismic hazard assessment conditional on the mainshock occurrence can be found in the paper of Yeo and Cornell [20], while the procedure of sequence-based probabilistic seismic hazard analysis is given in [21].
3. Assessment of the Azimuthal Dependency of Ground Motion Amplitudes
Pavel et al. [22] have performed an analysis of the possible directional effects observed during four moderate and large Vrancea intermediate-depth seismic events from 1986, 1990 and 2004 using the ground motion measures proposed in [23,24]. The study has shown, based on the available ground motion recordings, a visible directional pattern for IJMA (Japan Meteorological Agency seismic intensity) [25], while in the case of RotD100 [24] the directional patterns (angles corresponding to RotD100) were less visible. Moreover, it has to be highlighted the fact that a significant number of ground motion prediction equations developed for the Vrancea intermediate depth seismic source employ azimuth-dependent coefficients [26,27,28,29,30]. On the other hand, the ground motion models of Vacareanu et al. [31,32] had proposed different attenuation coefficients only for the backarc vs. forearc regions (both regions are defined with respect to the Carpathian Mountains). The same observation regarding the different attenuation coefficients only for the backarc vs. forearc regions instead of azimuth-dependent coefficients was made in the study of [33]. The seismic hazard performed in SHARE project [10] employed a Vrancea intermediate-depth seismic source of more than 50,000 km2 in order to capture an azimuth-dependent attenuation of ground motions from earthquakes originating in this seismic source.
In this study, the analysis of the azimuthal dependency of the ground motion amplitudes is performed considering the recordings from three Vrancea intermediate-depth seismic events from 30 August 1986 (moment magnitude MW = 7.1 and focal depth h = 131 km), 30 May 1990 (MW = 6.9, h = 91 km) and 31 May 1990 (MW = 6.4, h = 87 km). The assessment is performed in order to check: (i) the influence of the epicentre position on the ground motion attenuation and (ii) the influence of the strike on the ground motion attenuation. The strike of the analyzed seismic events is taken from [34] and [35]. The 30 August 1986 and the 30 May 1990 events have a strike of about 230°, while the 31 May 1990 earthquake has a strike of 308° (almost perpendicular fault rupture plane as compared with the other two analyzed events). The parameters of the three considered earthquakes are given in Table 3 [34,35].
Table 3.
Parameters of the focal mechanisms for the three considered earthquakes [34,35].
Figure 5 shows the distribution of the seismic station used in this study, as well as the position of the three earthquakes from 1986 and 1990. The soil conditions for each seismic station can be evaluated using the study of Pavel et al. [36]. The comparisons are performed considering the same recording stations for two pairs of seismic events (1986 vs. 1990(1) and 1990(1) vs. 1990(2)) in order to remove the effect of the site conditions and to have, thus, meaningful results. The positions of the seismic stations are defined in Figure 5 as a function of the position relative to the epicenters of the Vrancea intermediate-depth earthquakes (a total of three zones). The notation of the seismic stations from Figure 5 is similar with the one from [33]. The data for the seismic stations situated in zone 3 as denoted in [33] are not used in this study due to the very limited number of ground motions recorded during the three analyzed events in this study.
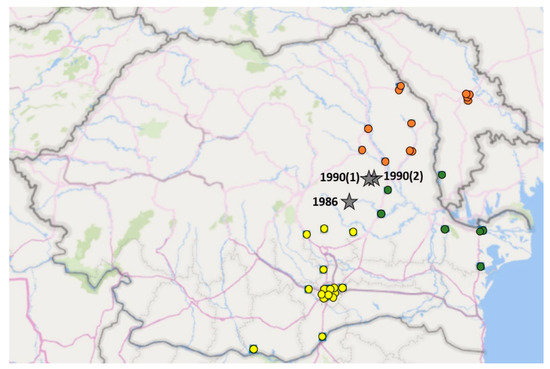
Figure 5.
Positions of the recording seismic stations and epicenters of the Vrancea intermediate-depth earthquakes of August 1986 and May 1990. The color code is as follows: orange—zone 1 seismic stations, green—zone 2 seismic stations and yellow—zone 4 seismic stations.
Figure 6, Figure 7 and Figure 8 show the attenuation with the hypocentral distance of the peak ground accelerations and of the spectral accelerations at T = 0.s s and T = 1.0 s for the seismic stations in the three zones which have recorded both the 30 August 1986 and the 30 May 1990 Vrancea intermediate-depth earthquakes and the corresponding logarithmic fit curves, as well.
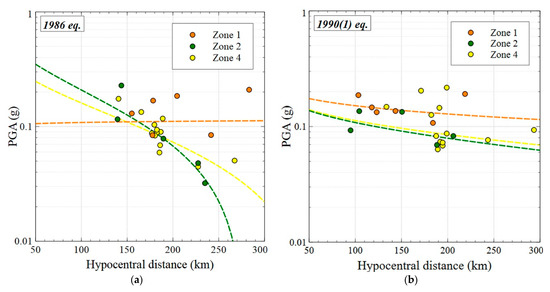
Figure 6.
Comparison between the hypocentral distance attenuation curves for peak ground acceleration for: (a) the 1986 Vrancea earthquake; (b) the 1990(1) Vrancea earthquake. Dashed lines show the corresponding logarithmic fit curves.
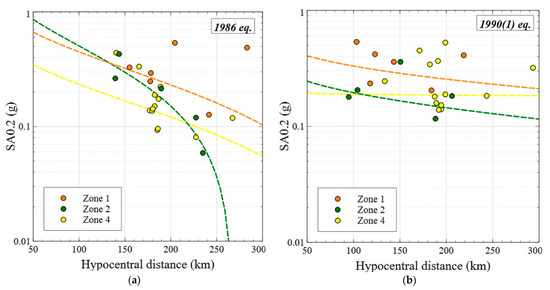
Figure 7.
Comparison between the hypocentral distance attenuation curves for the spectral acceleration at 0.2 s for: (a) the 1986 Vrancea earthquake; (b) the 1990(1) Vrancea earthquake. With dashed lines are shown the corresponding logarithmic fit curves.
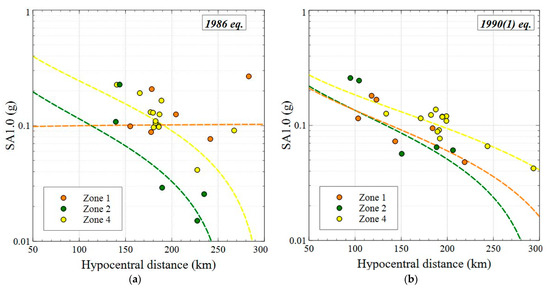
Figure 8.
Comparison between the hypocentral distance attenuation curves for the spectral acceleration at 1.0 s for: (a) the 1986 Vrancea earthquake; (b) the 1990(1) Vrancea earthquake. With dashed lines are shown the corresponding logarithmic fit curves.
Figure 9, Figure 10 and Figure 11 show the attenuation with the hypocentral distance of the peak ground accelerations and of the spectral accelerations at T = 0.2 s and T = 1.0 s for the seismic stations in the three zones which have recorded both the 30 May 1990 and the 31 May 1990 Vrancea intermediate-depth earthquakes and the corresponding logarithmic fit curves, as well. The number of ground motion recordings per event ranges from 6 to 14. The ground motion parameter used in the analysis is GMRotD50 (Median orientation-independent g geometric mean using period-dependent rotation angles) [23]. This parameter was chosen because it is a commonly used parameter for modern ground motion prediction equations (GMPEs) [37,38,39,40,41]. The analysis shows somewhat similar trends in the attenuation for all three zones and for all three spectral periods only in the case of 30 May 1990 earthquake. However, in the case of the 31 May 1990 event and especially in the case of 30 August 1986 earthquake, the differences in attenuation among the three zones are significant. The fit between the observed data and the proposed model is extremely poor in many cases, thus the attenuation process is much more complex and it requires additional parameters in order to better explain the recorded data. One of the reasons for the data scattering can be related to the influence of the focal mechanism, as well as the complex geologic structures from Zone 2 which are encountered by the seismic waves (Focsani Depression and the North-Dobrogea orogenic belt). In addition, the number of available ground motion recordings is relatively limited, thus the data fit cannot be accurately estimated. The rupture propagation direction can also play a role, but in this case, too, more data are necessary in order to validate the hypothesis. The largest event for which ground motion recordings are available and which has a rupture propagating on a perpendicular direction to the Carpathian Mountains is the 31 May 1990 event.
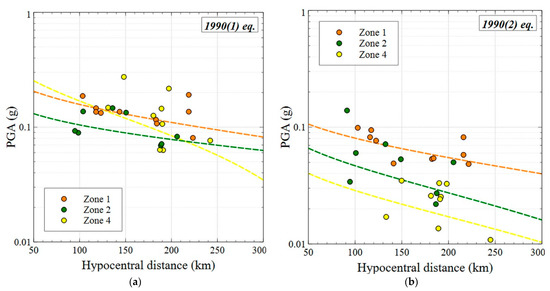
Figure 9.
Comparison between the hypocentral distance attenuation curves for peak ground acceleration for: (a) the 1990(1) Vrancea earthquake; (b) the 1990(2) Vrancea earthquake. With dashed lines are shown the corresponding logarithmic fit curves.
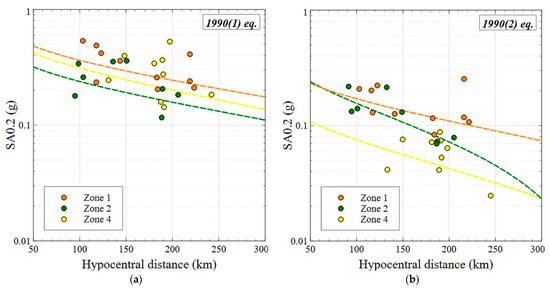
Figure 10.
Comparison between the hypocentral distance attenuation curves for the spectral acceleration at 0.2 s for: (a) the 1990(1) Vrancea earthquake; (b) the 1990(2) Vrancea earthquake. With dashed lines are shown the corresponding logarithmic fit curves.
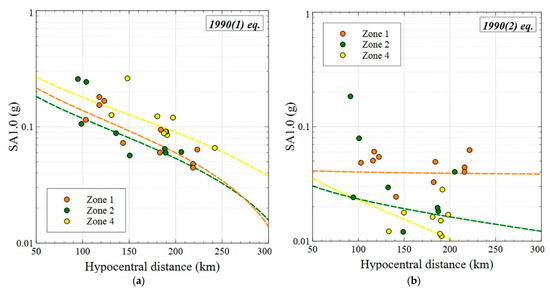
Figure 11.
Comparison between the hypocentral distance attenuation curves for the spectral acceleration at 1.0 s for: (a) the 1990(1) Vrancea earthquake; (b) the 1990(2) Vrancea earthquake. With dashed lines are shown the corresponding logarithmic fit curves.
Subsequently, a discussion regarding the seismic damage observed during the last two significant Vrancea intermediate-depth seismic events, namely the 10 November 1940 earthquake (MW = 7.7, h ≈ 150 km) and 4 March 1977 (MW = 7.4, h = 94 km) is also shown in this section based on recently revealed data [42,43]. In the above-mentioned two studies, the geographic distribution of the damage observed throughout Romanian during the two largest intermediate-depth Vrancea seismic events from the XXth century is discussed. The main observations from the two studies are summarized below:
- The damage for the 1940 event which had an epicenter in the region of the May 1990 events was concentrated mainly towards the North-East and in the regions close to the epicenter. Thus, a slower attenuation towards Zones 1 and 2 (as defined in Figure 5) can be deduced from the collected damage data;
- The damage for the 1977 event which had an epicenter in the region of the August 1986 event was concentrated mainly towards the South-West and in the regions close to the epicenter. In this case, a slower attenuation towards Zone 4 can be inferred from the damage observations;
- Some of the regions which were affected in both the 1940 and 1977 earthquakes are situated near rivers, in soft soil conditions. In some of these areas, liquefaction phenomena were observed during both the 1940 and the 1977 earthquakes [44].
Thus, from the analyses performed in this study, it can be concluded that some azimuthal ground motion attenuation differences can occur in the case of individual seismic events, but no pattern has been observed. Moreover, since the probabilistic seismic hazard assessment accounts for all possible magnitude and epicenter positions (which are equally likely within the seismic source), the impact of azimuthal ground motion attenuation differences should be considered as very limited.
4. Analysis of Ground Motion Amplifications Due to Basin Effects
In this section of the paper, an analysis is made regarding the amplification of ground motion amplitudes due to possible basin effects, based on ground motion recordings from past Vrancea intermediate-depth earthquakes and based on observed damage during significant earthquakes.
The GMRotD50 [23] response spectra of the ground motions recorded at three seismic stations in Iasi during the Vrancea intermediate-depth earthquake of 30 May 1990 and 31 May 1990 are analyzed subsequently. The distance between the three analyzed seismic stations, as well as the corresponding elevations, are shown in Figure 12. The first two seismic stations are situated in the river valley, with the second station having the smallest elevation, while the third one is situated on the slope. The elevation difference between the first and the second seismic station is 27 m, while the elevation difference between the second and the third one is 57 m. The elevation and the estimated average shear wave velocity in the upper 30 m of soil deposits Vs,30 [45] for each seismic station is given in Table 4.
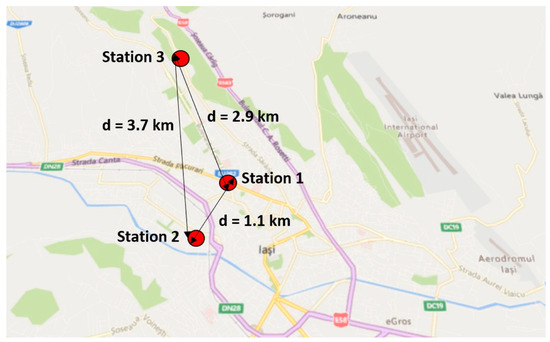
Figure 12.
Positions of the three seismic stations in Iasi, as well as the distance between them.
Table 4.
Elevations and estimated soil Vs,30 for the three seismic stations in Iasi [45].
The GMRotD50 [23] response spectra for the three seismic stations observed during the two seismic events of May 1990 are illustrated in Figure 13.
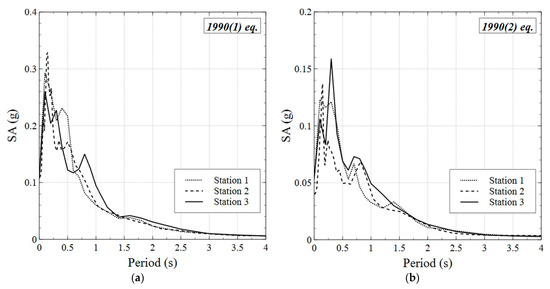
Figure 13.
Comparison between the GMRotD50 response spectra of the ground motions recorded at two seismic stations in Iasi area during: (a) the 1990(1) Vrancea earthquake; (b) the 1990(2) Vrancea earthquake.
It can be observed from Figure 13 that the three GMRotD50 [23] response spectra exhibit significant similarities in terms of amplitudes, thus denoting similar local soil conditions. However, some differences between the spectral amplitudes for the three seismic stations can be observed at periods of about 0.3–0.4 s, especially between seismic stations 1 and 3 on one hand and seismic station 2 on the other hand. The largest spectral amplitudes occur at seismic station 2 in the case of the 30 May 1990 earthquake and at seismic station 3 in the case of the latter event of 31 May 1990.
The studies of Riga et al. [46,47] provide values of the aggravation factors (ratio between the 2D spectral acceleration and the 1D spectral acceleration) as a function of the width of the basin, angle of the slope, thickness of the sediments, and the shear wave velocity of the sediments. Thus, significant differences of the ground motion amplitudes should be expected between the valley and the slope area. However, such differences are not noticeable in the case of Iasi, even though the position of the seismic stations is different. This situation can be due to the limited difference in elevation between the three seismic stations and further data from other seismic stations are necessary in order to evaluate this phenomenon.
Another city which was affected by the Vrancea 1977 earthquake is Craiova, situated at more than 200 km from the epicenter [43]. In this case, the damage was also concentrated in the river valley area situated on recent sedimentary layers. Unfortunately, no free-field ground motion was recorded in Craiova during the August 1986 and May 1990 earthquakes in order to bring some new relevant information on this topic. The only seismic station in Craiova was placed in the underground of a high-rise reinforced concrete building.
Other examples of possible ground motion amplifications due to basin effects are the intramountainous depressions situated in the areas affected by Vrancea intermediate-depth earthquakes. Two such examples of sites situated in such depressions are Joseni and Turnu-Rosu. The normalized GMRotD50 [23] response spectra observed at the two sites during the Vrancea earthquake of November 2014 are illustrated in Figure 14. The long-period spectral amplifications observed at both sites are clearly visible in Figure 14. Thus, it has to be highlighted the fact that the design response spectra from the current Romanian seismic design code P100-1/2013 [48] appears to underestimate the long-period spectral amplifications which might occur at such sites during future large magnitude Vrancea intermediate-depth earthquakes.
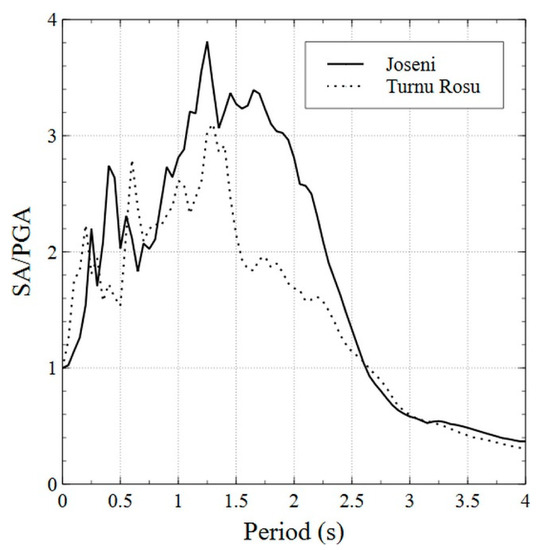
Figure 14.
Comparison of the normalized GMRotD50 response spectra (SA/PGA) for the ground motions recorded at Joseni and Turnu Rosu during the Vrancea earthquake of November 2014.
5. Conclusions
This case-study is focused on the analysis of several key assumptions necessary for the probabilistic seismic hazard assessment of Romania in the light of a future seismic zonation of Romania. The most important findings of the study can be summarized as follows:
- The Poisson distribution is able to model the observed earthquake frequency occurrence for the larger magnitude seismic events in the dataset. The threshold magnitudes below which the Poisson assumption can be rejected are MW = 5.2–5.3 for the Banat and Fagaras-Campulung crustal seismic sources and MW = 6.0 for the Vrancea intermediate-depth seismic source;
- Similar attenuation trends in the attenuation were observed for all three zones and for all three spectral periods only in the case of 30 May 1990 earthquake. In the case of the 31 May 1990 event and especially in the case of 30 August 1986 earthquake, the differences in attenuation among the three zones are significant. However, it has to be highlighted the fact that the observations made in this study are based on a rather limited ground motion dataset and thus further analyses are needed in order to validate the findings in this study. Moreover, the fit between the observed data and the proposed model is extremely poor in many cases, thus the attenuation process is much more complex and it requires additional parameters in order to better explain the recorded data;
- The damage for the 1940 event which had an epicenter in the region of the May 1990 events was concentrated mainly towards the North-East and in the regions close to the epicenter. In the case of the 1977 event which had an epicenter in the region of the August 1986 event, the damage was concentrated mainly towards the South-West and in the regions close to the epicenter;
- No significant differences in terms of ground motion amplitudes were observed at three seismic stations in Iasi area during the Vrancea intermediate-depth earthquakes of 30 May 1990 and 31 May 1990 even though two seismic stations were situated in the valley and the other one on the slope, possibly due to the small elevation difference between them.
- Long-period spectral amplifications were observed at seismic stations situated in the intramountainous depressions (e.g., Joseni and Turnu-Rosu). A re-estimation of the design spectral shapes for such sites should be performed in the future version of the Romanian seismic design code, as the current version of the code [48] seems to underestimate these amplifications.
Funding
This research received no external funding.
Institutional Review Board Statement.
Not applicable
Informed Consent Statement
Informed consent was obtained from all subjects involved in the study.
Data Availability Statement
The data presented in this study are available on request from the corresponding author.
Conflicts of Interest
The author declares no conflict of interest.
References
- Ambraseys, N.N. Long-Period Effects in the Romanian Earthquake of March 1977. Nature 1977, 268, 324–325. [Google Scholar] [CrossRef]
- Fillerup, M.A.; Knapp, J.H.; Knapp, C.C.; Raileanu, V. Mantle Earthquakes in the Absence of Subduction? Continental Delamination in the Romanian Carpathians. Lithosphere 2010, 2, 333–340. [Google Scholar] [CrossRef][Green Version]
- Koulakov, I.; Zaharia, B.; Enescu, B.; Radulian, M.; Popa, M.; Parolai, S.; Zschau, J. Delamination or Slab Detachment beneath Vrancea? New Arguments from Local Earthquake Tomography. Geochem. Geophys. Geosyst. 2010, 11. [Google Scholar] [CrossRef]
- Ismail-Zadeh, A.; Matenco, L.; Radulian, M.; Cloetingh, S.; Panza, G. Geodynamics and Intermediate-Depth Seismicity in Vrancea (the South-Eastern Carpathians): Current State-of-the Art. Tectonophysics 2012, 530–531, 50–79. [Google Scholar] [CrossRef]
- Bokelmann, G.; Rodler, F.-A. Nature of the Vrancea Seismic Zone (Eastern Carpathians)—New Constraints from Dispersion of First-Arriving P-Waves. Earth Planet. Sci. Lett. 2014, 390, 59–68. [Google Scholar] [CrossRef]
- Petrescu, L.; Borleanu, F.; Radulian, M.; Ismail-Zadeh, A.; Maţenco, L. Tectonic Regimes and Stress Patterns in the Vrancea Seismic Zone: Insights into Intermediate-Depth Earthquake Nests in Locked Collisional Settings. Tectonophysics 2020, 799, 228688. [Google Scholar] [CrossRef]
- Frohlich, C. Deep Earthquakes; Cambridge University Press: Cambridge, UK, 2006; ISBN 978-0-521-82869-7. [Google Scholar]
- Pavel, F.; Vacareanu, R.; Cioflan, C.; Iancovici, M. Spectral Characteristics of Strong Ground Motions from Intermediate-Depth Vrancea Seismic SourceSpectral Characteristics of Strong Ground Motions from Intermediate-Depth Vrancea Seismic Source. Bull. Seismol. Soc. Am. 2014, 104, 2842–2850. [Google Scholar] [CrossRef]
- Pavel, F.; Vacareanu, R.; Douglas, J.; Radulian, M.; Cioflan, C.; Barbat, A. An Updated Probabilistic Seismic Hazard Assessment for Romania and Comparison with the Approach and Outcomes of the SHARE Project. Pure Appl. Geophys. 2016, 173, 1881–1905. [Google Scholar] [CrossRef]
- Woessner, J.; Laurentiu, D.; Giardini, D.; Crowley, H.; Cotton, F.; Grünthal, G.; Valensise, G.; Arvidsson, R.; Basili, R.; Demircioglu, M.B.; et al. The 2013 European Seismic Hazard Model: Key Components and Results. Bull. Earthq. Eng. 2015, 13, 3553–3596. [Google Scholar] [CrossRef]
- Radulian, M.; Mândrescu, N.; Panza, G.F.; Popescu, E.; Utale, A. Characterization of Seismogenic Zones of Romania. In Seismic Hazard of the Circum-Pannonian Region; Panza, G.F., Radulian, M., Trifu, C.-I., Eds.; Pageoph Topical Volumes; Birkhäuser: Basel, Switzerland, 2000; pp. 57–77. ISBN 978-3-0348-8415-0. [Google Scholar]
- Cornell, C.A. Engineering Seismic Risk Analysis. Bull. Seismol. Soc. Am. 1968, 58, 1583–1606. [Google Scholar]
- McGuire, R.K. FORTRAN Computer Program for Seismic Risk Analysis; Open-File Report; U.S. Geological Survey: North Pole, AK, USA, 1976; Volume 76-67.
- Ordaz, M.; Arroyo, D. On Uncertainties in Probabilistic Seismic Hazard Analysis. Earthq. Spectra 2016, 32, 1405–1418. [Google Scholar] [CrossRef]
- Gardner, J.K.; Knopoff, L. Is the Sequence of Earthquakes in Southern California, with Aftershocks Removed, Poissonian? Bull. Seismol. Soc. Am. 1974, 64, 1363–1367. [Google Scholar]
- ROMPLUS Earthquake Catalog. Available online: http://www.infp.ro/data/romplus.txt (accessed on 5 December 2020).
- Wang, J.P.; Huang, D.; Chang, S.-C.; Wu, Y.-M. New Evidence and Perspective to the Poisson Process and Earthquake Temporal Distribution from 55,000 Events around Taiwan since 1900. Nat. Hazards Rev. 2014, 15, 38–47. [Google Scholar] [CrossRef]
- Kagan, Y.Y. Earthquake Number Forecasts Testing. Geophys. J. Int. 2017, 211, 335–345. [Google Scholar] [CrossRef][Green Version]
- McGuire, R.K. Probabilistic Seismic Hazard Analysis and Design Earthquakes: Closing the Loop. Bull. Seismol. Soc. Am. 1995, 85, 1275–1284. [Google Scholar]
- Yeo, G.L.; Cornell, C.A. A Probabilistic Framework for Quantification of Aftershock Ground-Motion Hazard in California: Methodology and Parametric Study. Earthq. Eng. Struct. Dyn. 2009, 38, 45–60. [Google Scholar] [CrossRef]
- Iervolino, I.; Giorgio, M.; Polidoro, B. Sequence-Based Probabilistic Seismic Hazard AnalysisShort Note. Bull. Seismol. Soc. Am. 2014, 104, 1006–1012. [Google Scholar] [CrossRef]
- Pavel, F.; Vacareanu, R.; Radulian, M.; Cioflan, C. Investigation on Directional Effects of Vrancea Subcrustal Earthquakes. Earthq. Eng. Eng. Vib. 2015, 14, 399–410. [Google Scholar] [CrossRef]
- Boore, D.M. Orientation-Independent Measures of Ground Motion. Bull. Seismol. Soc. Am. 2006, 96, 1502–1511. [Google Scholar] [CrossRef]
- Boore, D.M. Orientation-Independent, Nongeometric-Mean Measures of Seismic Intensity from Two Horizontal Components of Motion. Bull. Seismol. Soc. Am. 2010, 100, 1830–1835. [Google Scholar] [CrossRef]
- Shabestari, K.T.; Yamazaki, F. A Proposal of Instrumental Seismic Intensity Scale Compatible with MMI Evaluated from Three-Component Acceleration Records. Earthq. Spectra 2001, 17, 711–723. [Google Scholar] [CrossRef]
- Sokolov, V.; Bonjer, K.-P.; Wenzel, F.; Grecu, B.; Radulian, M. Ground-Motion Prediction Equations for the Intermediate Depth Vrancea (Romania) Earthquakes. Bull. Earthq. Eng. 2008, 6, 367–388. [Google Scholar] [CrossRef]
- Sørensen, M.B.; Stromeyer, D.; Grünthal, G. A Macroseismic Intensity Prediction Equation for Intermediate Depth Earthquakes in the Vrancea Region, Romania. Soil Dyn. Earthq. Eng. 2010, 30, 1268–1278. [Google Scholar] [CrossRef]
- Enescu, D.; Marmureanu, G.; Enescu, B.D. A Procedure for Estimating the Seismic Hazard Generated by Vrancea Earthquakes and Its Application. II. Attenuation Curves. Romanian Rep. Phys. 2004, 56, 124–128. [Google Scholar]
- Sandi, H.; Borcia, I.S.; Stancu, M. Analysis of Attenuation for Recent Vrancea Intermediate Depth Earthquakes. In Proceedings of the 13th World Conference on Earthquake Engineering, Vancouver, BC, Canada, 1–6 August 2004; Volume 2477. [Google Scholar]
- Böse, M.; Sokolov, V.; Wenzel, F. Shake Map Methodology for Intermediate-Depth Vrancea (Romania) Earthquakes. Earthq. Spectra 2009, 25, 497–514. [Google Scholar] [CrossRef]
- Vacareanu, R.; Radulian, M.; Iancovici, M.; Pavel, F.; Neagu, C. Fore-Arc and Back-Arc Ground Motion Prediction Model for Vrancea Intermediate Depth Seismic Source. J. Earthq. Eng. 2015, 19, 535–562. [Google Scholar] [CrossRef]
- Vacareanu, R.; Iancovici, M.; Neagu, C.; Pavel, F. Macroseismic Intensity Prediction Equations for Vrancea Intermediate-Depth Seismic Source. Nat. Hazards 2015, 79, 2005–2031. [Google Scholar] [CrossRef]
- Pavel, F.; Vacareanu, R. Investigation on Regional Attenuation of Vrancea (Romania) Intermediate-Depth Earthquakes. Earthq. Eng. Eng. Vib. 2018, 17, 501–509. [Google Scholar] [CrossRef]
- Ganas, A.; Grecu, B.; Batsi, E.; Radulian, M. Vrancea Slab Earthquakes Triggered by Static Stress Transfer. Nat. Hazards Earth Syst. Sci. 2010, 10, 2565–2577. [Google Scholar] [CrossRef]
- Cioflan, C.O.; Apostol, B.F.; Moldoveanu, C.L.; Panza, G.F.; Marmureanu, G. Deterministic Modelling for Microzonation of Bucharest: Case-Study for August 30, 1986 and May 30–31, 1990 Vrancea Earthquakes; The Abdus Salam International Centre for Theoretical Physics: Trieste, Italy, 2002. [Google Scholar]
- Pavel, F.; Vacareanu, R.; Pitilakis, K. Intensity-Dependent Site Amplification Factors for Vrancea Intermediate-Depth Earthquakes. Bull. Earthq. Eng. 2019, 17, 2363–2380. [Google Scholar] [CrossRef]
- Abrahamson, N.A.; Silva, W.J.; Kamai, R. Summary of the ASK14 Ground Motion Relation for Active Crustal Regions. Earthq. Spectra 2014, 30, 1025–1055. [Google Scholar] [CrossRef]
- Boore, D.M.; Stewart, J.P.; Seyhan, E.; Atkinson, G.M. NGA-West2 Equations for Predicting PGA, PGV, and 5% Damped PSA for Shallow Crustal Earthquakes. Earthq. Spectra 2014, 30, 1057–1085. [Google Scholar] [CrossRef]
- Campbell, K.W.; Bozorgnia, Y. NGA-West2 Ground Motion Model for the Average Horizontal Components of PGA, PGV, and 5% Damped Linear Acceleration Response Spectra. Earthq. Spectra 2014, 30, 1087–1115. [Google Scholar] [CrossRef]
- Chiou, B.S.-J.; Youngs, R.R. Update of the Chiou and Youngs NGA Model for the Average Horizontal Component of Peak Ground Motion and Response Spectra. Earthq. Spectra 2014, 30, 1117–1153. [Google Scholar] [CrossRef]
- Idriss, I.M. An NGA-West2 Empirical Model for Estimating the Horizontal Spectral Values Generated by Shallow Crustal Earthquakes. Earthq. Spectra 2014, 30, 1155–1177. [Google Scholar] [CrossRef]
- Atanasiu, I. The Earthquakes in Romania; Academiei, R.P.R., Ed.; Centre for Earth Physics and Seismology: Buhcarest, Romania, 1961. (In Romanian) [Google Scholar]
- Mandrescu, N. The March 4, 1977 Earthquake—Damage Distribution. In Proceedings of the Seismological Research on the March 4, 1977 Earthquake; Centre for Earth Physics and Seismology: Bucharest, Romania, 1979; pp. 371–388. [Google Scholar]
- Ishihara, K.; Perlea, V. Liquefaction-Associated Ground Damage During the Vrancea Earthquake of March 4, 1977. Soils Found. 1984, 24, 90–112. [Google Scholar] [CrossRef][Green Version]
- Heath, D.C.; Wald, D.J.; Worden, C.B.; Thompson, E.M.; Smoczyk, G.M. A Global Hybrid VS30 Map with a Topographic Slope–Based Default and Regional Map Insets. Earthq. Spectra 2020, 36, 1570–1584. [Google Scholar] [CrossRef]
- Riga, E.; Makra, K.; Pitilakis, K. Aggravation Factors for Seismic Response of Sedimentary Basins: A Code-Oriented Parametric Study. Soil Dyn. Earthq. Eng. 2016, 91, 116–132. [Google Scholar] [CrossRef]
- Riga, E.; Makra, K.; Pitilakis, K. Investigation of the Effects of Sediments Inhomogeneity and Nonlinearity on Aggravation Factors for Sedimentary Basins. Soil Dyn. Earthq. Eng. 2018, 110, 284–299. [Google Scholar] [CrossRef]
- MDRAP. P100-1/2013: Code for Seismic Design—Part I—Design Prescriptions for Buildings; MDRAP: Bucharest, Romania, 2013. [Google Scholar]


Publisher’s Note: MDPI stays neutral with regard to jurisdictional claims in published maps and institutional affiliations. |
© 2021 by the author. Licensee MDPI, Basel, Switzerland. This article is an open access article distributed under the terms and conditions of the Creative Commons Attribution (CC BY) license (http://creativecommons.org/licenses/by/4.0/).