
Studying the Depth Structure of the Kyrgyz Tien Shan by Using the Seismic Tomography and Magnetotelluric Sounding Methods


Abstract
:1. Introduction
2. Geological Environment and Geodynamic Model of the Tien Shan Formation
3. Seismic Tomography Studies
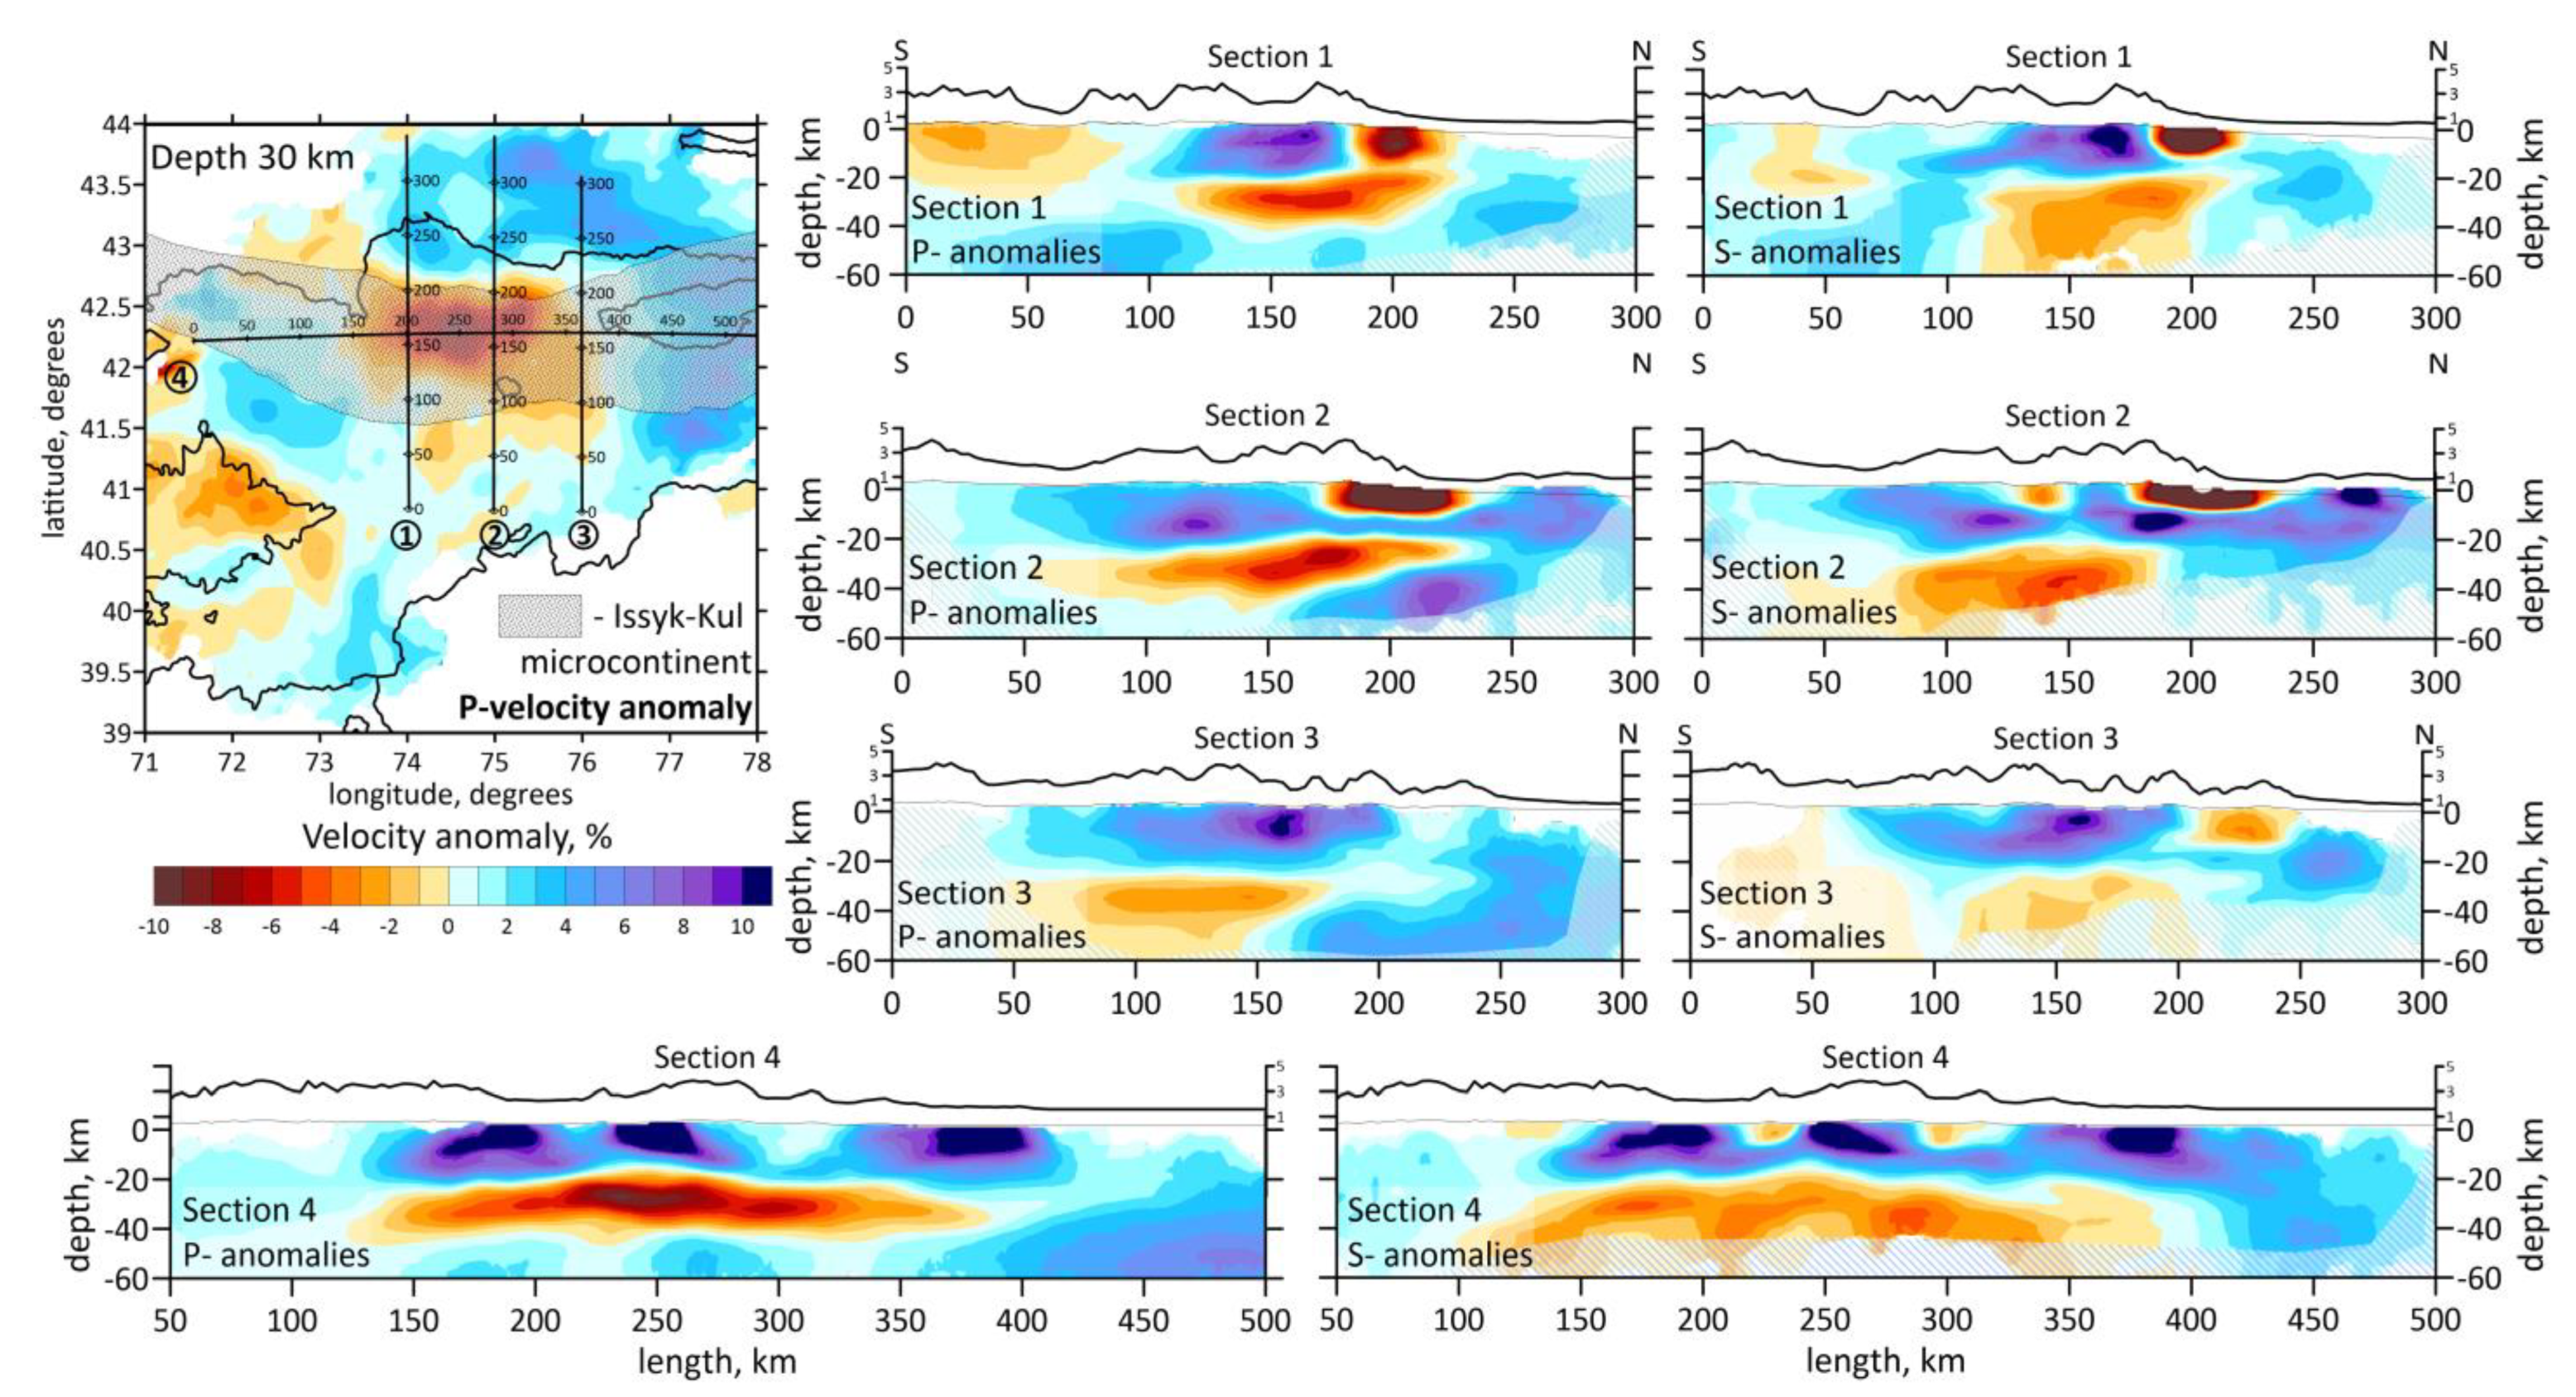
Seismic Tomography Results
4. Magnetotelluric Studies
4.1. Magnetotelluric Data and Method
4.2. The Naryn Profile
4.3. The Kekemeren Profile
5. Comparison of the MTS and Seismic Tomography Results
- (1)
- (2)
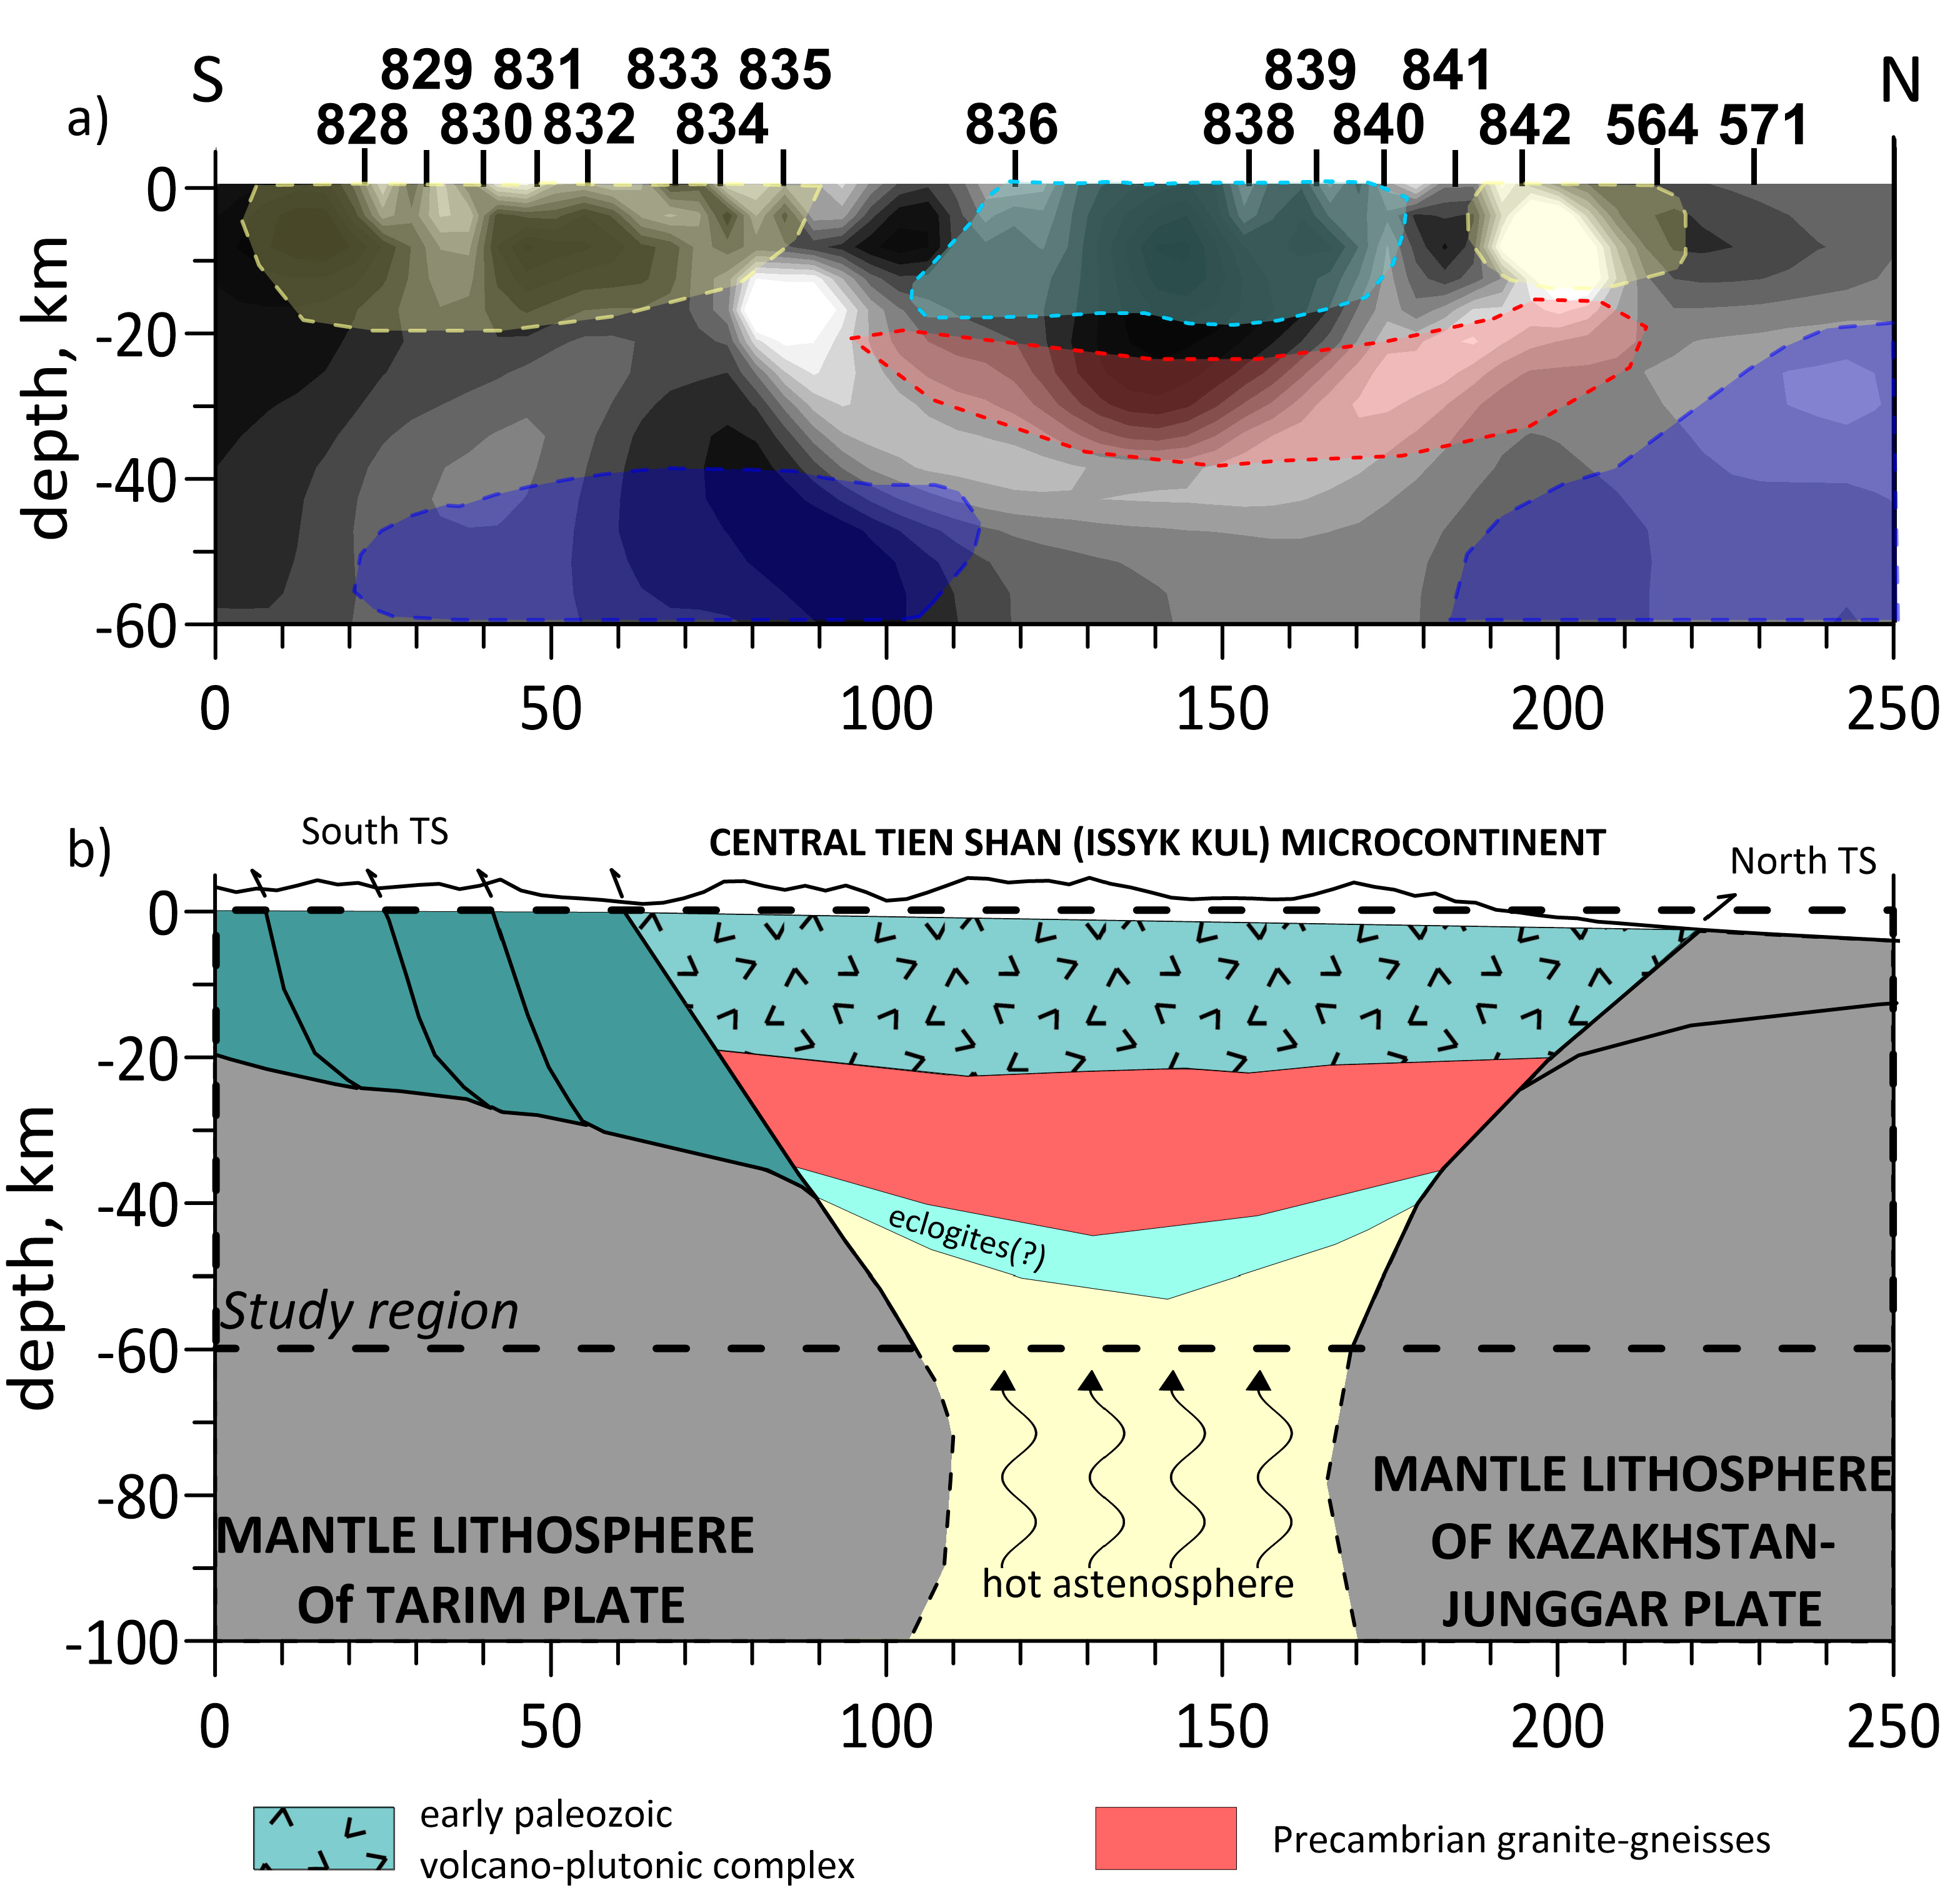
- Subsequent to the tomographic inversion results, a low-velocity anomaly with a thickness of ~20 km was distinguished at a depth of ~20 km (Figure 10b). In the MTS models, this anomaly was present as a highly conductive saddle-shaped layer with the resistivity ρ ≈ 10–100 ohm and a thickness of ~15–20 km. In Figure 11a, this anomaly is shown in red.
- (3)
- The locations of the low-velocity near-surface seismic anomalies in the northern and southern parts of the vertical profiles coincided with those of the anomalously conductive subvertical structures (ρ ≈ 0.1 ohm) found according to the MTS results beneath the points 835 and 842. In Figure 11a, these anomalies are highlighted in yellow.
- (4)
- At a depth of ~40 km in the southern part of the Kekemeren profile, there was a high-velocity ST anomaly, which coincided with the MTS anomaly having ρ >> 103 ohm. In Figure 11a, this anomaly is marked in blue.
- (5)
- In the northern part of the Naryn profile (Figure 10a) under the observation point 510 (Kyrgyz Range) in the 30 km depth, an anomaly with ρ > 103 ohm was distinct, which coincided with the high-velocity anomaly. Both anomalies have the same shape and plunging trend from the north to south. In Figure 11a, this anomaly is in blue color.
- (1)
- The near-surface anomaly with ρ ≈ 103 ohm, as follows from the geoelectric model, occurred to a depth of about 30 km, while the seismic velocity anomaly (light-blue in Figure 11a) had a thickness of only ~15–20 km and lay subhorizontally.
- (2)
- The derived from the MTS results lower-crustal low-resistivity anomaly with a thickness of ~20 km had a saddle-like shape, whereas the seismic velocity anomaly was subhorizontal (red anomaly in Figure 11a).
6. Discussion
7. Conclusions
- (1)
- Parts of the Tarim and Kazakhstan–Junggar plates submerged under the Tien Shan are distinguished as high-velocity anomalies with resistivity ρ ≈ 10–100 ohm.
- (2)
- The Nikolaev Line and Kyrgyz–Kungei fault zones, confining the Precambrian Central Tien Shan (Issyk–Kul) microcontinent, are discerned in the models in the form of low-velocity high-resistivity (ρ > 103 ohm) anomalies tending to submerge under the Central Tien Shan. The obtained features of the depth structure indicate the fluid saturation of the fault zones.
- (3)
- The structure of the Middle Tien Shan crust is conditioned by the presence of the Precambrian Central Tien Shan (Issyk–Kul) microcontinent, which is differentiated in the geophysical models as two anomalies lying one below the other, each having a thickness of ~20 km: the upper high-velocity anomaly with resistivity ρ >> 102 ohm, and the lower low-velocity high-conductivity anomaly with ρ ≈ 10–100 ohm, with the exception of individual sections where ρ ≈ 0.1 ohm.
- (4)
- The geophysical features of the upper anomaly in the Issyk–Kul block are likely to have resulted from the presence of the Late Ordovician and Early Silurian volcanic–plutonic intrusive bodies.
- (5)
- The geophysical characteristics of the lower anomaly in the Issyk–Kul block are most likely to be associated with the presence of ancient granite–gneisses, which, as indicated in [27], are fluid-saturated.
Author Contributions
Funding
Data Availability Statement
Conflicts of Interest
References
- Avouac, J.P.; Tapponnier, P.; Bai, M.; You, H.; Wang, G. Active thrusting and folding along the Northern Tien Shan, and Late Cenozoic rotation of the Tarim relative to Dzungaria and Kazakhstan. J. Geophys. Res. Solid Earth 1993, 98, 6755–6804. [Google Scholar] [CrossRef] [Green Version]
- Windley, B.F.; Alexeiev, D.; Xiao, W.J.; Kroner, A.; Badarch, G. Tectonic models for accretion of the Central Asian Orogenic Belt. J. Geol. Soc. 2007, 164, 31–47. [Google Scholar] [CrossRef] [Green Version]
- Gao, J.; Klemd, R.; Qian, Q.; Zhang, X.; Li, J.L.; Jiang, T.; Yang, Y.Q. The collision between the Yili and Tarim blocks of the Southwestern Altaids: Geochemical and age constraints of a leucogranite dike crosscutting the HP–LT metamorphic belt in the Chinese Tianshan Orogen. Tectonophysics 2011, 499, 118–131. [Google Scholar] [CrossRef]
- He, C.; Santosh, M.; Chen, X.; Li, X. Crustal growth and tectonic evolution of the Tianshan orogenic belt NW China: A receiver function analysis. J. Geodyn. 2014, 75, 41–52. [Google Scholar] [CrossRef]
- Lei, J.; Zhao, D. Teleseismic P-wave tomography and the upper mantle structure of the central Tien Shan orogenic belt. Phys. Earth Planet. Inter. 2007, 162, 165–185. [Google Scholar] [CrossRef]
- Xu, Y.; Liu, F.; Liu, J.; Chen, H. Crust and upper mantle structure beneath western China from P wave travel time tomography. J. Geophys. Res. Solid Earth 2002, 107, ESE-4. [Google Scholar] [CrossRef]
- Xu, L.; Rondenay, S.; Van der Hilst, R.D. Structure of the crust beneath the southeastern Tibetan Plateau from teleseismic receiver functions. Phys. Earth Planet. Inter. 2007, 165, 176–193. [Google Scholar] [CrossRef]
- Zhiwei, L.; Roecker, S.; Zhihai, L.; Bin, W.; Haitao, W.; Schelochkov, G.; Bragin, V. Tomographic image of the crust and upper mantle beneath the western Tien Shan from the MANAS broadband deployment: Possible evidence for lithospheric delamination. Tectonophysics 2009, 477, 49–57. [Google Scholar] [CrossRef]
- Koulakov, I.Y. High-frequency P and S velocity anomalies in the upper mantle beneath Asia from inversion of worldwide traveltime data. J. Geophys. Res. Solid Earth 2011, 116. [Google Scholar] [CrossRef] [Green Version]
- Zabelina, I.V.; Koulakov, I.Y.; Buslov, M.M. Deep mechanisms in the Kyrgyz Tien Shan orogen (from results of seismic tomography). Russ. Geol. Geophys. 2013, 54, 695–706. [Google Scholar] [CrossRef]
- Vinnik, L.; Reigber, C.; Aleshin, I.; Kosarev, G.; Kaban, M.; Oreshin, S.; Roecker, S. Receiver function tomography of the central Tien Shan. Earth Planet. Sci. Lett. 2004, 225, 131–146. [Google Scholar] [CrossRef]
- Makarov, V.I.; Alekseev, D.V.; Batalev, V.Y.; Bataleva, E.A.; Belyaev, I.V.; Bragin, V.D.; Dergunov, N.; Efimova, N.; Leonov, M.; Munirova, L.; et al. Underthrusting of Tarim beneath the Tien Shan and deep structure of their junction zone: Main results of seismic experiment along MANAS Profile Kashgar-Song-Köl. Geotectonics 2010, 44, 102–126. [Google Scholar] [CrossRef]
- Laverov, N.P. Present-Day Geodynamics of the Intracontinental Collisional Orogeny; Nauchnyi Mir: Moscow, Russia, 2005; pp. 1–400. (In Russian) [Google Scholar]
- Sychev, I.V.; Koulakov, I.; Sycheva, N.A.; Koptev, A.; Medved, I.; El Khrepy, S.; Al-Arifi, N. Collisional processes in the crust of the northern Tien Shan inferred from velocity and attenuation tomography studies. J. Geophys. Res. Solid Earth 2018, 123, 1752–1769. [Google Scholar] [CrossRef]
- Chen, H.; Kosarev, G.; Roecker, S. Shear wave velocity structure at depths 0–410 km determined by the teleseismic broadband P-wavefroms in northern Pakistan and Kirghizstan. EOS Trans. AGU 1994, 75, 464. [Google Scholar]
- Bump, H.A.; Sheehan, A.F. Crustal thickness variations across the northern Tien Shan from teleseismic receiver functions. Geophys. Res. Lett. 1998, 25, 1055–1058. [Google Scholar] [CrossRef]
- Peive, A.V. Tectonic Stratification of the Lithosphere of the Latest Mobile Zones; Nauka: Moscow, Russia, 1982; Volume 115. (In Russian) [Google Scholar]
- Bragin, V.D.; Dergunov, N.; Efimova, N.; Leonov, M.; Munirova, L.; Pavlenkin, A.; Shchelochkov, G. Tarim sinking under the Tien Shan and the deep structure of the zone of their articulation: The main results of seismic studies on the MANAS profile. Geotectonics 2010, 2, 23–42. (In Russian) [Google Scholar]
- Gubin, I.E. The Tien Shan Lithosphere; Nauka: Moscow, Russia, 1986. (In Russian) [Google Scholar]
- Nikolaevsky, V.N. Mechanics of Porous & Fractured-Fissured Media; Nedra: Moscow, Russia, 1984; Volume 232. (In Russian) [Google Scholar]
- Krasnopevtseva, G.V. Geologic-Geophysical Features of Low Velocity Layers in the Earth’s Crust; All-Union Scientific Research Institute of Mineral Resources Economics: Helsinki, Finland, 1978; Volume 30. [Google Scholar]
- Batalev, V.Y.; Berdichevsky, M.N.; Golland, M.L.; Golubtsova, N.S.; Kuznetsov, V.A. Interpretation of the deep magnetotelluric soundings in the в Chu basin. Izv. Phys. Solid Earth 1989, 9, 42–45. [Google Scholar]
- Batalev, V.Y.; Volykhin, A.M.; Rybin, A.K.; Trapeznikov, Y.A.; Finyakin, V.V. The structure of the crust in the Eastern Kyrgyz Tien Shan from MTS data. In Reflection of Geodynamic Processes in Geophysical Fields; Nauka: Moscow, Russia, 1993; pp. 96–113. (In Russian) [Google Scholar]
- Batalev, V.Y.; Bataleva, E.A.; Matyukov, V.E.; Rybin, A.K.; Egorova, V.V. The lithospheric structure of the Central and Southern Tien Shan: MTS data correlated with petrology and laboratory studies of lower-crust and upper-mantle xenoliths. Russ. Geol Geophys. 2011, 52, 1592–1599. [Google Scholar] [CrossRef]
- Batalev, V.Y. Petrological interpretation of the magnetotelluric data of the depth zone of the Tarim and Tian Shan junction. Dokl. Earth Sci. 2011, 438, 588–592. (In Russian) [Google Scholar] [CrossRef]
- Batalev, V.Y.; Bataleva, E.A.; Matyukov, V.E.; Rybin, A.K. Deep structure of the western area of Talas-Fergana fault because of magnetotelluric soundings. Lithosphere 2013, 4, 136–145. (In Russian) [Google Scholar]
- Trapeznikov, Y.A.; Andreeva, E.V.; Batal Kissinev, V.Y.; Berdichevsky, M.N.; Vanyan, L.L.; Volykhin, A.M.; Golubtsova, N.S.; Rybin, A.K. Magnetotelluric soundings in the Kyrgyz Tien Shan. Izv. Phys. Solid Earth 1997, 33, 1–17. [Google Scholar]
- Rybin, A.K.; Batalev, V.Y.; Il’ichev, P.V.; Shchelochkov, G.G. Magnetotelluric and magnetovariational soundings of the Kyrgyz Tien Shan. Russ. Geol. Geophys. 2001, 42, 1485–1492. [Google Scholar]
- Rybin, A.K.; Batalev, V.Y.; Bataleva, E.A.; Matyukov, V.E.; Spichak, V.V. Array magnetotelluric soundings in the active seismic area of northern Tian Shan. Russ. Geol. Geophys. 2008, 49, 337–349. [Google Scholar] [CrossRef]
- Bragin, V.D.; Batalev, V.Y.; Zubovich, A.V.; Lobanchenko, A.N.; Rybin, A.K.; Trapeznikov, Y.A.; Shchelochkov, G.G. Signature of neotectonic movements in the geoelectric structure of the crust in and seismicity distribution in the central Tian Shan. Russ. Geol. Geophys. 2001, 42, 1527–1537. [Google Scholar]
- Bataleva, E.A.; Buslov, M.M.; Rybin, A.K.; Batalev, V.Y.; Safronov, I.V. Crustal conductor associated with the Talas-Fergana fault and deep structure of the southwestern Tien Shan: Geodynamic implications. Russ. Geol. Geophys. 2006, 9, 1036–1042. [Google Scholar]
- Kissin, I.G.; Ruzaikin, A.I. Relations between seismically active and electrically conductive crustal zones in the Kyrgyz Tien Shan. Izv. Phys. Solid Earth 1997, 33, 18–25. [Google Scholar]
- Rybin, A.K. Deep Structure and Recent Geodynamics of the Central Tien Shan by Magnetotelluric Research Results; Nauchnyi Mir: Moscow, Russia, 2011; p. 272. (In Russian) [Google Scholar]
- Dobretsov, N.L.; Buslov, M.M.; Delvaux, D.; Berzin, N.A.; Ermikov, V.D. Meso-and Cenozoic tectonics of the Central Asian mountain belt: Effects of lithospheric plate interaction and mantle plume. Int. Geol. Rev. 1996, 38, 430–466. [Google Scholar] [CrossRef]
- Buslov, M.M.; De Grave, J.; Bataleva, E.A. Cenozoic tectonics and geodynamic evolution of the Tien Shan mountain belt as response to India-Eurasia convergence. Himal. J. Sci. 2004, 2, 106–107. [Google Scholar] [CrossRef] [Green Version]
- Buslov, M.M.; De Grave, J.; Bataleva, E.A.V.; Batalev, V.Y. Cenozoic tectonic and geodynamic evolution of the Kyrgyz Tien Shan Mountains: A review of geological, thermochronological and geophysical data. J. Asian Earth Sci. 2007, 29, 205–214. [Google Scholar] [CrossRef]
- De Grave, J.; Buslov, M.M.; Van den Haute, P. Distant effects of India—Eurasia convergence and Mesozoic intracontinental deformation in Central Asia: Constraints from apatite fission-track thermochronology. J. Asian Earth Sci. 2007, 29, 188–204. [Google Scholar] [CrossRef]
- Dobretsov, N.L.; Buslov, M.M.; Vasilevsky, A.N. Geodynamic Complexes and Structures of Transbaikalia: Record in Gravity Data. Russ. Geol. Geophys. 2019, 60, 254–266. [Google Scholar]
- Buslov, M.M. Geodynamic nature of the Baikal Rift Zone and its sedimentary filling in the Cretaceous–Cenozoic: The effect of the far-range impact of the Mongolo-Okhotsk and Indo-Eurasian collisions. Russ. Geol. Geophys. 2012, 53, 955–962. [Google Scholar] [CrossRef]
- De Grave, J.; Buslov, M.M.; Van den Haute, P. Intracontinental deformation in central Asia: Distant effects of India–Eurasia convergence revealed by apatite fission-track thermochronology. Himal. J. Sci. 2004, 2, 121–122. [Google Scholar] [CrossRef] [Green Version]
- De Grave, J.; Buslov, M.; Van den Haute, P.; Metcalf, J.; Batalev, V. From Palaeozoic Eurasian assembly to ongoing Indian indentation: Multi-chronometry of the northern Kyrgyz Tien Shan batholith. J. Asian Earth Sci. 2006, 26, 133. [Google Scholar]
- De Grave, J.; Buslov, M.M.; Van den Haute, P.; Dehandschutter, B. Meso-Cenozoic evolution of Mountain range—Intramontane basin systems in the southern Siberian Altai Mountains by apatite fission–track thermochronology. J. Asian Earth Sci. 2007, 29, 2–9. [Google Scholar]
- De Grave, J.; Buslov, M.M.; Van den Haute, P.; Dehandschutter, B.; Delvaux, D. Meso-Cenozoic evolution of Mountain Range—Intramontane basin systems in the Southern Siberian Altai Mountains by apatite fission-track thermochronology. In Trust Belts and Foreland Basins: From Fold Kinematics Hydrocarbon Systems; Springer: Berlin/Heidelberg, Germany, 2007; Volume 24, pp. 457–490. [Google Scholar]
- De Grave, J.; Van den Haute, P.; Buslov, M.M.; Dehandschutter, B.; Glorie, S. Apatite fission-track thermochronology applied to the Chulysman Plateau, Siberian Altai Region. Radiat. Meas. 2008, 43, 38–42. [Google Scholar] [CrossRef]
- De Grave, J.; Glorie, S.; Buslov, M.M.; Izmer, A.; Fournier-Carrie, A.; Elburg, M.; Batalev, V.Y.; Vanhaeke, F.; Van den Haute, P. The thermo-tectonic history of the Song-Kul Plateau, Kyrgyz Tien Shan: Constraints by apatite and titanite thermo-chronometry and zircon U/Pb dating. Gondwana Res. 2011, 20, 745–763. [Google Scholar] [CrossRef]
- De Grave, J.; Glorie, S.; Zhimulev, F.I.; Buslov, M.M.; Elburg, M.; Vanhaecke, F.; Van den Haute, P. Emplacement and exhumation of the Kuznetsk-Alatau basement (Siberia): Implications for the tectonic evolution of the Central Asian Orogenic Belt and sediment supply to the Kuznetsk, Minusa and West Siberian Basins. Terra Nova 2011, 23, 248–256. [Google Scholar] [CrossRef]
- De Grave, J.; Glorie, S.; Ryabinin, A.; Zhimulev, F.I.; Buslov, M.M.; Izmer, A.; Elburg, M.A.; Vanhaecke, F. Late Palaeozoic and Meso-Cenozoic tectonic evolution of the southern Kyrgyz Tien Shan: Constraints from multimethod thermochronology in the Trans-Alai, Turkestan-Alai segment and the southeastern Ferghana Basin. J. Asian Earth Sci. 2012, 44, 149–168. [Google Scholar] [CrossRef]
- De Grave, J.; Glorie, S.; Buslov, M.M.; Stockli, D.F.; Mcwilliams, M.O.; Batalev, V.Y.; Van den Haute, P. Thermo-tectonic history of the Issyk-Kul basement (Kyrgyz Northern Tien Shan, Central Asia). Gondwana Res. 2013, 23, 998–1020. [Google Scholar] [CrossRef]
- Glorie, S.; De Grave, J.; Buslov, M.M.; Elburg, M.A.; Stockli, D.F.; Gerdes, A.; Van den Haute, P. Multimethod chronometric constraints on the evolution of the Northern Kyrgyz Tien Shan granitoids (Central Asian Orogenic Belt): From emplacement to exhumation. J. Asian Earth Sci. 2010, 38, 131–146. [Google Scholar] [CrossRef]
- Glorie, S.; De Grave, J.; Buslov, M.M.; Zhimulev, F.I.; Stockli, D.F.; Batalev, V.Y.; Izmer, A.; Van den Haute, P.; Vanhaecke, F.; Elburg, M.A. Thermotectonic history of the Kyrgyz South Tien Shan (Atbashi-Inylchek) suture zone: The role of inherited structures during deformation-propagation. Tectonics 2011, 30, 6016. [Google Scholar] [CrossRef]
- Glorie, S.; De Grave, J.; Buslov, M.M.; Zhimulev, F.I.; Elburg, M.A.; Van den Haute, P. Structural control on Meso-Cenozoic tectonic reactivation and denudation in the Siberian Altai: Insights from multi-method thermochronometry. Tectonophysics 2012, 544–545, 75–92. [Google Scholar] [CrossRef]
- Allen, M.B.; Windley, B.F.; Zhang, C. Palaeozoic collisional tectonics and magmatism of the Chinese Tien Shan, Central Asia. Tectonophysics 1993, 220, 89–115. [Google Scholar] [CrossRef]
- Jun, G.; Maosong, L.; Xuchang, X.; Yaoqing, T.; Guoqi, H. Paleozoic tectonic evolution of the Tienshan Orogen, northwestern China. Tectonophysics 1998, 287, 213–231. [Google Scholar] [CrossRef]
- Chen, C.; Lu, H.; Jia, D.; Cai, D.; Wu, S. Closing history of the southern Tianshan oceanic basin, western China: An oblique collisional orogeny. Tectonophysics 1999, 302, 23–40. [Google Scholar] [CrossRef]
- Brookfield, M.E. Geological development and Phanerozoic crustal accretion in the western segment of the southern Tien Shan (Kyrgyzstan, Uzbekistan and Tajikistan). Tectonophysics 2000, 328, 1–14. [Google Scholar] [CrossRef]
- Laurent-Charvet, S.; Charvet, J.; Shu, L.; Ma, R.; Lu, H. Palaeozoic late collisional strike-slip deformations in Tianshan and Altay, Eastern Xinjiang, NW China. Terra Nova 2002, 14, 249–256. [Google Scholar] [CrossRef]
- Van der Voo, R.; Levashova, N.M.; Skrinnik, L.I.; Kara, T.V.; Bazhenov, M.L. Late orogenic, large-scale rotations in the Tien Shan and adjacent mobile belts in Kyrgyzstan and Kazakhstan. Tectonophysics 2006, 426, 335–360. [Google Scholar] [CrossRef]
- Yang, T.N.; Wang, Y.; Li, J.Y.; Sun, G.H. Vertical and horizontal strain partitioning of the central Tianshan (NW China): Evidence from structures and 40Ar/39Ar geochronology. J. Struct. Geol. 2007, 29, 1605–1621. [Google Scholar] [CrossRef]
- Alexeiev, D.; Cook, H.E.; Djenchuraeva, A.V.; Mikolaichuk, A.V. The stratigraphic, sedimentological and structural evolution of the southern margin of the Kazakhstan continent in the Tien Shan Range during the Devonian to Permian. Geol. Soc. Lond. Spec. Publ. 2017, 427, 231–269. [Google Scholar] [CrossRef]
- Biske, Y.S.; Seltmann, R. Paleozoic Tian-Shan as a transitional region between the Rheic and Urals-Turkestan oceans. Gondwana Res. 2010, 17, 602–613. [Google Scholar] [CrossRef]
- Bakirov, A.B.; Maksumova, R.A. Geology and evolution of the Tien Shan lithosphere. Russian Geol. Geofiz. 2001, 42, 1435–1443. [Google Scholar]
- Maksumova, R.A.; Jenchuraeva, A.V.; Berezansky, A.V. Major tectonic units and evolution of the Tien Shan orogen. In Paleozoic Geodynamics and Gold Deposits in the Kyrgyz Tien Shan, Proceedings of the IGCP 373 Field Conference, IAGOD Guidebook Series 9, London, UK, 16–25 August 2001; Seltmann, S., Jenchuraeva, R., Eds.; Natural History Museum: London, UK, 2001; pp. 17–20. [Google Scholar]
- Buslov, M.M.; Klerkx, J.; Abdrakhmatov, K.; Delvaux, D.; Batalev, V.Y.; Kuchai, O.A.; Dehandschutter, B.; Muraliev, A. Recent strike-slip deformation of the northern Tien Shan. In Intraplate Strike-Slip Deformation Belts; Storti, F., Holdsworth, R.E., Salvini, F., Eds.; Geological Society, Special Publications: London, UK, 2003; Volume 210, pp. 53–64. [Google Scholar]
- Wang, B.; Chen, Y.; Zhan, S.; Shu, L.; Faure, M.; Cluzel, D.; Charvet, J.; Laurent-Charvet, S. Primary Carboniferous and Permian paleomagnetic results from the Yili block (NW China) and their implications on the geodynamic evolution of Chinese Tianshan belt. Earth Planet. Sci. Lett. 2007, 263, 288–308. [Google Scholar] [CrossRef] [Green Version]
- Wang, B.; Shu, L.S.; Cluzel, D.; Faure, M.; Charvet, J. Geochemical constraints on Carboniferous volcanic rocks of the Yili block (Xinjiang, NW China): Implications for the tectonic evolution of western Tianshan. J. Asian Earth Sci. 2007, 29, 148–159. [Google Scholar] [CrossRef] [Green Version]
- Solomovich, L.I.; Trifonov, B.A. Postcollisional granites in the South Tien Shan Variscan collisional belt, Kyrgyzstan. J. Asian Earth Sci. 2002, 21, 7–21. [Google Scholar] [CrossRef]
- Konopelko, D.; Biske, G.; Seltmann, R.; Eklund, O.; Belyatsky, B. Hercynian post-collisional Atype granites of the Kokshaal Range, Southern Tien Shan, Kyrgyzstan. Lithosphere 2007, 97, 140–160. [Google Scholar]
- Kröner, A.; Hegner, E.; Lehmann, B.; Heinhorst, J.; Wingat, M.T.D.; Liu, D.Y.; Ermelov, P. Palaeozoic arc magmatism in the Central Asian Orogenic Belt of Kazakhstan: SHRIMP zircon ages and whole-rock Nd isotopic systematics. J. Asian Earth Sci. 2008, 32, 118–130. [Google Scholar] [CrossRef]
- Burtman, V.S. The structural geology of the Variscan Tien Shan. Am. J. Sci. 1975, 275, 157–186. [Google Scholar]
- Biske, Y.S. Paleozoic Structure and History of Southern Tian-Shan; Leningrad University: Leningrad, Russia, 1996; p. 187. [Google Scholar]
- Seltmann, R.; Konopelko, D.; Biske, G.; Divaev, F.; Sergeev, S. Hercynian postcollisional magmatism in the context of Paleozoic magmatic evolution of the Tien Shan orogenic belt. J. Asian Earth Sci. 2011, 42, 821–838. [Google Scholar] [CrossRef]
- Koulakov, I. LOTOS code for local earthquake tomographic inversion. Benchmarks for testing tomographic algorithms. Bull. Seismol. Soc. Am. 2009, 99, 194–214. [Google Scholar] [CrossRef]
- Zabelina, I.; Ruppert, N.A.; Freymueller, J.T. Velocity structure of the Saint Elias, Alaska, Region from local earthquake tomography. Bull. Seismol. Soc. Am. 2014, 104, 2597–2603. [Google Scholar] [CrossRef]
- Zabelina, I.; Koulakov, I.; Amanatashvili, I.; El Khrepy, S.; Al-Arifi, N. Seismic structure of the crust and uppermost mantle beneath Caucasus based on regional earthquake tomography. J. Asian Earth Sci. 2016, 119, 87–99. [Google Scholar] [CrossRef]
- Ghose, S.; Hamburger, M.W.; Virieux, J. Three-dimensional velocity structure and earthquake locations beneath the northern Tien Shan of Kyrgyzstan, central Asia. J. Geophys. Res. Solid Earth 1998, 103, 2725–2748. [Google Scholar] [CrossRef]
- Roecker, S.W.; Sabitova, T.M.; Vinnik, L.P.; Burmakov, Y.A.; Golvanov, M.I.; Mamatkanova, R.; Munirova, L. Three-dimensional elastic wave velocity structure of the western and central Tien Shan. J. Geophys. Res. Solid Earth 1993, 98, 15779–15795. [Google Scholar] [CrossRef]
- Um, J.; Thurber, C.A. Fast algorithm for two-point seismic ray tracing. Bull. Seismol. Soc. Am. 1987, 77, 972–986. [Google Scholar]
- Van der Sluis, A.; Van der Vorst, H.A. Seismic Tomography; Nolet, G., Ed.; Springer: Dordrecht, The Netherlands, 1987; pp. 49–83. ISBN 978-90-277-2583-7. [Google Scholar]
- Roecker, S. Constraints on the crust and upper mantle of the Kyrgyz Tien Shan from the preliminary analysis of GHENGIS broadband seismic data. Russ. Geol. Geophys. 2001, 42, 1554–1565. [Google Scholar]
- Rybin, A.K.; Batalev, V.Y.; Bataleva, E.A.; Makarov, V.I.; Safronov, I.V. Structure of the Earth crust by magnitotelluric soundings. In Recent Geodynamics of Intracontinental Areas of Collision Mountain Building (Central Asia); Nauchny Mir: Moscow, Russia, 2005; pp. 79–96. [Google Scholar]
- Rybin, A.K.; Bataleva, E.A.; Morozov, Y.A.; Leonov, M.G.; Batalev, V.Y.; Matyukov, V.E.; Nelin, V.O. Specific features in the deep structure of the Naryn Basin–Baibichetoo Ridge–Atbashi Basin System: Evidence from the complex of geological and geophysical data. Dokl. Earth Sci. 2018, 479, 499–502. [Google Scholar] [CrossRef]
- Bielinski, R.A.; Park, S.K.; Rybin, A.; Batalev, V.; Jun, S.; Sears, C. Lithospheric heterogeneity in the Kyrgyz Tien Shan imaged by magnetotelluric studies. Geophys. Res. Lett. 2003, 30, 15. [Google Scholar] [CrossRef]
- Bataleva, E.A.; Przhiyalgovskii, E.S.; Batalev, V.Y.; Lavrushina, E.V.; Leonov, M.G.; Matyukov, V.E.; Rybin, A.K. New data on the deep structure of the South Kochkor zone of concentrated deformation. Dokl. Earth Sci. 2017, 475, 930–934. (In Russian) [Google Scholar] [CrossRef]
- Zabinyakova, O.; Rybin, A. The Deep Distribution of Longitudinal Electrical Conductivity in the Earth’s Crust (Central Tien Shan). Int. J. Civ. Eng. Technol. 2019, 10, 398–404. [Google Scholar]
- Berdichevsky, M.N.; Dmitriev, V.I.; Novikov, D.B.; Pastutsan, V.V. Analysis and Interpretation of Magnetotelluric Data; Dialog: Moscow, Russia, 1997; pp. 1–161. (In Russian) [Google Scholar]
- Berdichevsky, M.N.; Sokolova, E.Y.; Varentsov, I.M.; Rybin, A.K.; Baglaenko, N.V.; Batalev, V.Y.; Golubtsova, N.; Matyukov, V.; Pushkarev, P.Y. Geoelectric section of the Central Tien Shan: Analysis of magnetotelluric and magnetovariational responses along the Naryn geotraverse. Izv. Phys. Solid Earth 2010, 46, 679–697. [Google Scholar] [CrossRef]
- Bataleva, E.A.; Batalev, V.Y.; Rybin, A.K. Interrelation of conductivity, seismic velocities and the seismicity for Central Tien Shan lithosphere. Lithosphere 2015, 5, 81–89. [Google Scholar]
- Thompson, S.C.; Weldon, R.J.; Rubin, C.M.; Abdrakhmatov, K.; Molnar, P.; Berger, G.W. Late Quaternary slip rates across the central Tien Shan, Kyrgyzstan, Central Asia. J. Geophys. Res. 2002, 107, 1–32. [Google Scholar] [CrossRef]
- Makarov, V.I. The Newest Tectonic Structure of the Tien Shan; Nauka: Moscow, Russia, 1977; Volume 169. (In Russian) [Google Scholar]
- Austrheim, H. The granulite-eclogite facies transition: A comparison of experimental work and a natural occurrence in the Bergen Arcs, western Norway. Lithosphere 1990, 25, 163–169. [Google Scholar] [CrossRef]
- Bird, P. Formation of the Rocky Mountains, western United States: A continuum computer model. Science 1988, 239, 1501–1507. [Google Scholar] [CrossRef] [PubMed]
- Leech, M.L. Arrested orogenic development: Eclogitization, delamination, and tectonic collapse. Earth Planet. Sci. Lett. 2001, 185, 149–159. [Google Scholar] [CrossRef]
- Houseman, G.A.; McKenzie, D.P.; Molnar, P. Convective instability of a thickened boundary layer and its relevance for the thermal evolution of continental convergent belts. J. Geophys. Res. Solid Earth 1981, 86, 6115–6132. [Google Scholar] [CrossRef]
- McKenzie, D.; O’nions, R.K. Mantle reservoirs and ocean island basalts. Nature 1983, 301, 229. [Google Scholar] [CrossRef]
- Kiselev, A.; Gordienko, I.; Lashkevich, V. Petrological aspects of gravitational instability of tectonically thickened lithosphere. Tikhookean. Geol. 2004, 23, 20–29. (In Russian) [Google Scholar]
- Zubovich, A.V.; Trapeznikov, Y.A.; Bragin, V.D.; Mosienko, O.I.; Shchelochkov, G.G.; Rybin, A.K.; Batalev, V.Y. Deformation field, earth’s crust deep structure, and spatial seismicity distribution in the Tien Shan. Russ. Geol. Geophys. 2001, 42, 1634–1640. [Google Scholar]
- Ueda, K.; Gerya, T.V.; Burg, J.P. Delamination in collisional orogens: Thermomechanical modeling. J. Geophys. Res. Solid Earth 2012, 117. [Google Scholar] [CrossRef] [Green Version]


| Depth, km | Vp, km/s | Vs, km/s |
|---|---|---|
| −4 | 3.5 | 2.78 |
| 6 | 5.7 | 3.35 |
| 21 | 6.2 | 3.5 |
| 65 | 6.9 | 3.8 |
| 120 | 7.8 | 4.2 |
Publisher’s Note: MDPI stays neutral with regard to jurisdictional claims in published maps and institutional affiliations. |
© 2021 by the authors. Licensee MDPI, Basel, Switzerland. This article is an open access article distributed under the terms and conditions of the Creative Commons Attribution (CC BY) license (http://creativecommons.org/licenses/by/4.0/).
Share and Cite
Medved, I.; Bataleva, E.; Buslov, M. Studying the Depth Structure of the Kyrgyz Tien Shan by Using the Seismic Tomography and Magnetotelluric Sounding Methods. Geosciences 2021, 11, 122. https://doi.org/10.3390/geosciences11030122
Medved I, Bataleva E, Buslov M. Studying the Depth Structure of the Kyrgyz Tien Shan by Using the Seismic Tomography and Magnetotelluric Sounding Methods. Geosciences. 2021; 11(3):122. https://doi.org/10.3390/geosciences11030122
Chicago/Turabian StyleMedved, Irina, Elena Bataleva, and Michael Buslov. 2021. "Studying the Depth Structure of the Kyrgyz Tien Shan by Using the Seismic Tomography and Magnetotelluric Sounding Methods" Geosciences 11, no. 3: 122. https://doi.org/10.3390/geosciences11030122