Article

Stiffness and Strength of Stabilized Organic Soils—Part I/II: Experimental Database and Statistical Description for Machine Learning Modelling

by
Francisco G. Hernandez-Martinez
1,*,
Abir Al-Tabbaa
2,
Zenon Medina-Cetina
3,* and
Negin Yousefpour
4
1
Consulting Services Department, Civil & Structural Engineering Division, Saudi Aramco, Dhahran 31311, Saudi Arabia
2
Department of Engineering, University of Cambridge, Cambridge CB2 1PZ, UK
3
Zachry Department of Civil & Environmental Engineering, Texas A&M University, College Station, TX 77843, USA
4
Infrastructure Department, The University of Melbourne, Parkville, VIC 3010, Australia
*
Authors to whom correspondence should be addressed.
Geosciences 2021, 11(6), 243; https://doi.org/10.3390/geosciences11060243
Submission received: 9 November 2020 / Revised: 30 April 2021 / Accepted: 6 May 2021 / Published: 4 June 2021

Abstract

:
This paper presents the experimental database and corresponding statistical analysis (Part I), which serves as a basis to perform the corresponding parametric analysis and machine learning modelling (Part II) of a comprehensive study on organic soil strength and stiffness, stabilized via the wet soil mixing method. The experimental database includes unconfined compression tests performed under laboratory-controlled conditions to investigate the impact of soil type, the soil’s organic content, the soil’s initial natural water content, binder type, binder quantity, grout to soil ratio, water to binder ratio, curing time, temperature, curing relative humidity and carbon dioxide content on the stabilized organic specimens’ stiffness and strength. A descriptive statistical analysis complements the description of the experimental database, along with a qualitative study on the stabilization hydration process via scanning electron microscopy images. Results confirmed findings on the use of Portland cement alone and a mix of Portland cement with ground granulated blast furnace slag as suitable binders for soil stabilization. Findings on mixes including lime and magnesium oxide cements demonstrated minimal stabilization. Specimen size affected stiffness, but not the strength for mixes of peat and Portland cement. The experimental database, along with all produced data analyses, are available at the Texas Data Repository as indicated in the Data Availability Statement below, to allow for data reproducibility and promote the use of artificial intelligence and machine learning competing modelling techniques as the ones presented in Part II of this paper.

1. Introduction

The building of superstructures on organic soils has always been a great challenge to geotechnical engineers due to the high compressibility and low strength on these soil types. Particularly, peat particle-size distribution differs as compared to inorganics soils, its plasticity if any is low and PH is low. Peat has high compressibility linked to its high permeability and high porosity ratio resulting in considerable consolidation settlement, and it has low shear strength linked to its low density resulting in a low bearing capacity [1]. Methods used for improving peat and organic clay deposits are extensive. These include the removal of organic soil layers and replacement by either granular or lightweight fill, preloading and drains and the use of geosynthetic reinforcement and vibro-concrete column construction. The chemical stabilisation of organic soils with cementitious binders is a promising technique which has recently gained commercial interest due to its simple application and adaptation to specific project requirements and site conditions, low noise and vibration levels during execution, and cost effectiveness [2]. The in situ application of the technique using mass stabilisation and/or deep mix column installation to stabilise organic deposits has proved in recent years to be an economical and reliable solution [3,4,5,6,7,8,9]. Materials such as organic soils, however, due to their nature and formation process, present some difficulties for stabilisation. Generally, the strength development of stabilised soils obtained in several studies has been shown to be dependent on a number of factors, such as the characteristics of the binder, characteristics and conditions of the soil, and mixing and curing conditions [10,11,12].
Developments of deep mixing technology are derived simultaneously in Nordic countries and Japan where lime and lime-cement were first used as the main stabilizing agents [11,12,13,14]. Historical reviews, development facts and general aspects of the deep mixing method can be found elsewhere [15,16,17,18,19,20,21,22,23]. Deep mixing technology has two specific variants for improving organic soils: the dry soil mixing method (DSMM) and the wet soil mixing method (WSMM). In DSMM, the binder is a powder injected into the soil by compressed air, whereas in WSMM, the binder is pumped into the soil in slurry form. The DSMM has been widely used in the improvement of organic soils by taking advantage of its high water content [24,25], and it is advantageous due to the fact that in some countries, e.g., Scandinavia, where temperatures often reach below zero, the use of air instead of water for transporting the binder is preferable [26]. On the other hand, WSMM applicability has gained importance in recent decades for stabilizing soft soils by the use of different binders, which allows for improving their in situ high deformable and soft strength behaviour [8,17]. Moreover, it is now known that WSMM is applicable to most soils, proving consistently that it produces a more uniform and effective mixing [27].
Additionally, former studies examining the successful stabilization of organic soils set via WSMM have focused on estimating the deviation from laboratory unconfined compressive strength tests with in situ practices [11,28]: assessing the influence of mixing time; assessing the number of mixing cycles during field column installation [29,30]; determining quality control in field implementations [8,31]; and investigating binding mixture conditions in terms of soil strength [32]. However, more can be added to this investigation of organic soil stabilization within WSMM by providing correlations for a wider spectrum of control variables associated with stabilized soils’ stiffness and strength and by determining which variables yield the maximum stiffness and strength outcomes.
This work, introducing results from a comprehensive feasibility study conducted at the University of Cambridge, expands on those former investigations of organic soil stabilization by examining the relationship between the stiffness and strength of stabilized organic soils and a wider spectrum of control variables within the WSMM. The main focus of this work is to set the basis to explore, via machine learning modelling (Part II), the effects of the control variables—soil type, the soil’s organic content, the soil’s initial natural water content, binder type, binder quantity, grout to soil ratio, water to binder ratio, curing time, temperature, curing relative humidity and carbon dioxide content—on the stiffness and strength of the resulting stabilized organic specimens. These variables were investigated experimentally by preparing mechanically different mixtures under a laboratory-controlled environment. The resulting stabilized soils were then examined quantitatively via a descriptive statistical analysis, to set the foundation for the following Machine Learning modelling, based on unconfined compression tests conducted on the stabilized specimens with the aim of investigating the effects of the mixtures and mixing methods on the soils’ stiffness and strength. A complementary qualitative analysis is included based on the use of scanning electron microscopy (SEM) to provide a unique insight into the specimens’ hydration processes over the curing time, which helps us to better understand both the descriptive statistics and the machine learning modelling. The experimental database, along with all produced data analyses, are available at the Texas Data Repository for reproducibility and the comparison of competing modelling techniques to the ones presented in Part II of this paper.
Part II of this work [33] introduces a modelling methodology based on the use of machine learning modelling, with a particular application of artificial neural networks (ANN), to correlate the influence of the control variables with the unconfined tangent modulus or Young’s modulus (E) and the unconfined strength (UCS) of all types of specimens described in this paper. It is anticipated that the combined effort of Part I and II of this work will contribute to a recommendation for standard deep mixing practices by introducing sound arguments for selecting optimal mixtures and mixing conditions of a wide range of design control variables.

2. Database Experimental Design

An experimental design was formulated with the objective of guiding the experimental work and supporting the generation of sufficient evidence where metrics could be applied to show the effectiveness of the soil mixtures and the mixing techniques via any modelling technique available. A summary of the experimental design is presented in Figure 1. All experimental investigations were included in a database, which served as the basis source of information for the generation of the present work [2,34,35,36,37,38].

3. Base Materials

Soil Types

Three main soil types were used as the base material for the mixing process, including Irish moss peat and two organic clays. The peat classification used in this work was based on the Von Post scale approach [39,40]. This was Irish moss peat (Pt) known as sphagnum moss peat, which is brown-black in colour with a moderately strong decomposition H6 and a considerable amorphous material content. It also showed a moderate smell, no plastic limit, a density of about 294 kg/m3 and water content of about 210%. The density was obtained following the BS EN 12580:2000 standard [41]. Its water content was evaluated using a conventional oven at a temperature of 105 °C following the Standard Test Method A for moisture content in the ASTM D2974-14 [42]. A literature review with the objective to search for available stabilized peat data was performed; the findings indicate that the natural water content of peat ranges from 442% (Arlanda-Sweden peat) to 1600% (Dömle-Sweden peat). Thus, to better represent peats found in nature and to obtain a reference for comparison, Pt’s water content was increased from 210% to 500% and then to 1000%, resulting in three different Pt combinations used for stabilization.
The two organic clay soils, produced for stabilization purposes, used kaolin clay as a base with two variations of moisture content at 100% and 75%, respectively. The Pt, at a water content of 500%, was used as the source of organic content and mixed into the two variations of kaolin clay. The first organic clay soil consisted of a combination of 50% Pt and 50% kaolin with a water content of 100%. The second organic clay soil consisted of a combination of 10% Pt and 90% kaolin with a water content of 75%. The first organic clay soil was classified as medium-organic and of extremely high plasticity (OH-1) with 30% organic content. The second organic clay soil was classified as a low-organic clay of high plasticity (OH-2) with 4% organic content. This classification was carried out on the basis of the plasticity index properties, as described by Head [43], together with the classification for organic material, as described by Hartlén and Wolski [40]. A summary with the basic properties of both organic clay soils is presented in Table 1.

4. Cementitious Materials

Six distinct cementitious materials were used for stabilizing the Pt, OH-1 and OH-2 soils; (i) Portland cement (PC), (ii) ground granulated blast furnace slag (BFS), (iii) pulverized fuel ash (PFA), (iv) magnesium oxide cement (MgO-C), (v) lime (L) and (vi) gypsum (G).
Although several types of cement, from CEM I (Portland cement) to CEM V (composite material), are available commercially [44], ordinary Portland cement (OPC), now Portland cement (PC), is the most commonly used for stabilization. A description of the origin and the reactions that cement produces as a binder in the stabilization process is given elsewhere [45,46]. Only PC was used in this study.
Ground granulated blast furnace slag (GGBS) is obtained from the manufacture of pig iron and contains silica, alumina and lime, but not in same proportions as found in PC [47]. There are many types of slag mentioned in the literature, with little attempt to distinguish between them. They are different from pozzolans in that the nature of the reactions and the reaction products are different [45]. GGBS, which is the type most available in the UK, is classed as latent hydraulic cement with compositions broadly intermediate between pozzolanic materials and Portland cements [45,48], and GGBS was used in this study. The blast furnace slag cement is similar to normal Portland cement in its physical properties, except that the rate of hardening is slower in the first 28 days. It is important to mention that large quantities of slag in the cement render it more resistant to chemical attack. Likewise, the presence of excessive iron sulphide in slag may cause colour and durability problems in concrete products. Under certain conditions, sulphide can be converted to sulphate, which is undesirable from the standpoint of sulphate attack on concrete. As a reference, British specifications limit the content of acid-soluble SO3 and total sulphide sulphur in alga to 0.7% and 2%, respectively.
Pulverised fuel ash (PFA) is a synthetic pozzolana created by the combustion of coal. Generally, two types of PFA exist, namely, low-lime PFA and high-lime PFA. The UK ashes are generally classified as low-lime PFA. The material consists mostly of glassy, hollow, spherical particles called cenospheres [45]. PFA can be described as a siliceous and aluminous material that on its own possesses little or no cementitious value, but in a finely divided form and in the presence of moisture will chemically react with lime to form compounds possessing cementitious properties [47]. The stabilization effect of PFA relies on the formation of calcium silicate gels, which gradually harden over a long period of time to form a stable material. Although slow to harden, the hydration products may be similar to those of PC [48], indicating PFA’s potential as a binder. Within this study, low-lime PFA was used.
The recent emergence of magnesium oxide cement (MgO-C) provides a unique opportunity to develop durable high-quality novel cement-based materials [49,50]. MgO-C uses ‘reactive’ magnesia that is manufactured at much lower temperatures than PC, contains a large proportion of by-product pozzolans, is more recyclable than PC, is expected to provide an improved durability and has a high propensity for binding with waste materials. MgO-C is fundamentally different and has a very different chemistry from PC [51]. It is produced by mixing ‘reactive’ magnesium oxide (magnesia) with the calcining of magnesite (magnesium carbonate), and a pozzolan in the presence of a small quantity of hydraulic cement, such as PC. MgO-C, is unlike magnesium salt or sorel type cement, which is known to release undesirable salts and is subject to phase changes into weaker forms. Hence, MgO-based cement is included in this work for comparison with PC and to investigate its potential binding capability and any other advantages over PC.
Although several forms of lime exist, generally, it is only quicklime (calcium oxide) and hydrated lime (calcium hydroxide) that are used as binders [45]. Quicklime, which exists either in granular or powder form, is produced from heating chalk or limestone. Hydrated lime, which is generally available as a fine, dry powder, is produced as a result of the reaction of quicklime with water. In this study, only hydrated lime was used (L).
Gypsum (G) is the dihydrate of calcium sulphate CaSO4·2H2O and occurs widely as a naturally occurring mineral. Deposits of gypsum can be either pure or impure. In the impure deposits, it can be found with other minerals, such as anhydrite, quartz, calcite, dolomite and clays. Therefore, gypsum is a very versatile material in cementitious compositions. In the UK, for instance, impure deposits are more common. Most quantities of gypsum are produced by flue gas desulphurization at coal-fired power stations. By-product gypsums are generally named after the chemical process from which they have been obtained, for example, phosphogypsum from phosphoric acid manufacture, fluorogypsum from hydrofluoric acid manufacture, formogypsum from formic acid manufacture and desulphogyspsum (or FGD-gypsum) from flue gas desulophurization [52]. Two of the main obstacles to a more widespread use of gypsum are the variability in the composition of the product and the presence of impurities, which affect the setting and strength characteristics of cement. On the other hand, the gypsum in the cement affects not only the setting time but also the strength development and volume stability [48]. For this study, a commercial British gypsum was used.

5. Binder Mixes

The most common binders used in practice to stabilize a wide range of soils are cement and lime, applied alone or in combination [19]. In particular, a mix of cement and granulated blast furnace slag has been shown to be effective in stabilizing many soil types [53]. However, due to the complex nature of peat and organic soils, lime has been found to have a poor effect on their stabilization, whereas other binders, such as blast furnace slag, have shown more promise.
All binder materials considered in the present study were applied as ‘wet’ binders, meaning that a grout comprising of binder, e.g., PC, plus water was prepared in advance before pouring it into the soil to be stabilized. A water to dry binder ratio of 1:1 was used for the 210% and 500% water content peats, and a lower ratio of 0.5:1 for the higher water content of 1000% Pt. In the cases of the OH-1 and the OH-2, a water to dry binder ratio of 1:1 was employed. This is based on preliminary investigations where different ratios were tested. The selection of binder mixes and their percentage constituents was based on literature findings on peat and organic soils [17,54]. These included Portland cement (PC) alone, PC-GGBS, PC-PFA, PC-PFA-L, PC-PFA-MgO-C and L-G-GGBS.
An experimental design was formulated in order to maximize the inferences stemming from the potential use of a large combination of binder mixes. A scheme of this is presented in Figure 1. Descriptions of all mixture constituents are shown in Table 2. The selection of soil to grout ratio was based on literature findings [12,17,54,55,56,57] combined with preliminary investigations conducted at the beginning of this study as part of this research (1:1.7, 1:1.12 and 1:0.33 were the selected ratios for the 210%, 500% and 1000% water content Pts, respectively). Notice that as the peat content in the soil decreased, the binder quantity required decreased, and as a given peat type’s water content increased, the grout content also decreased. The corresponding soil:grout ratio for the OH-1 clay was 1:0.41 and for the OH-2 clay soil was 1:0.34.

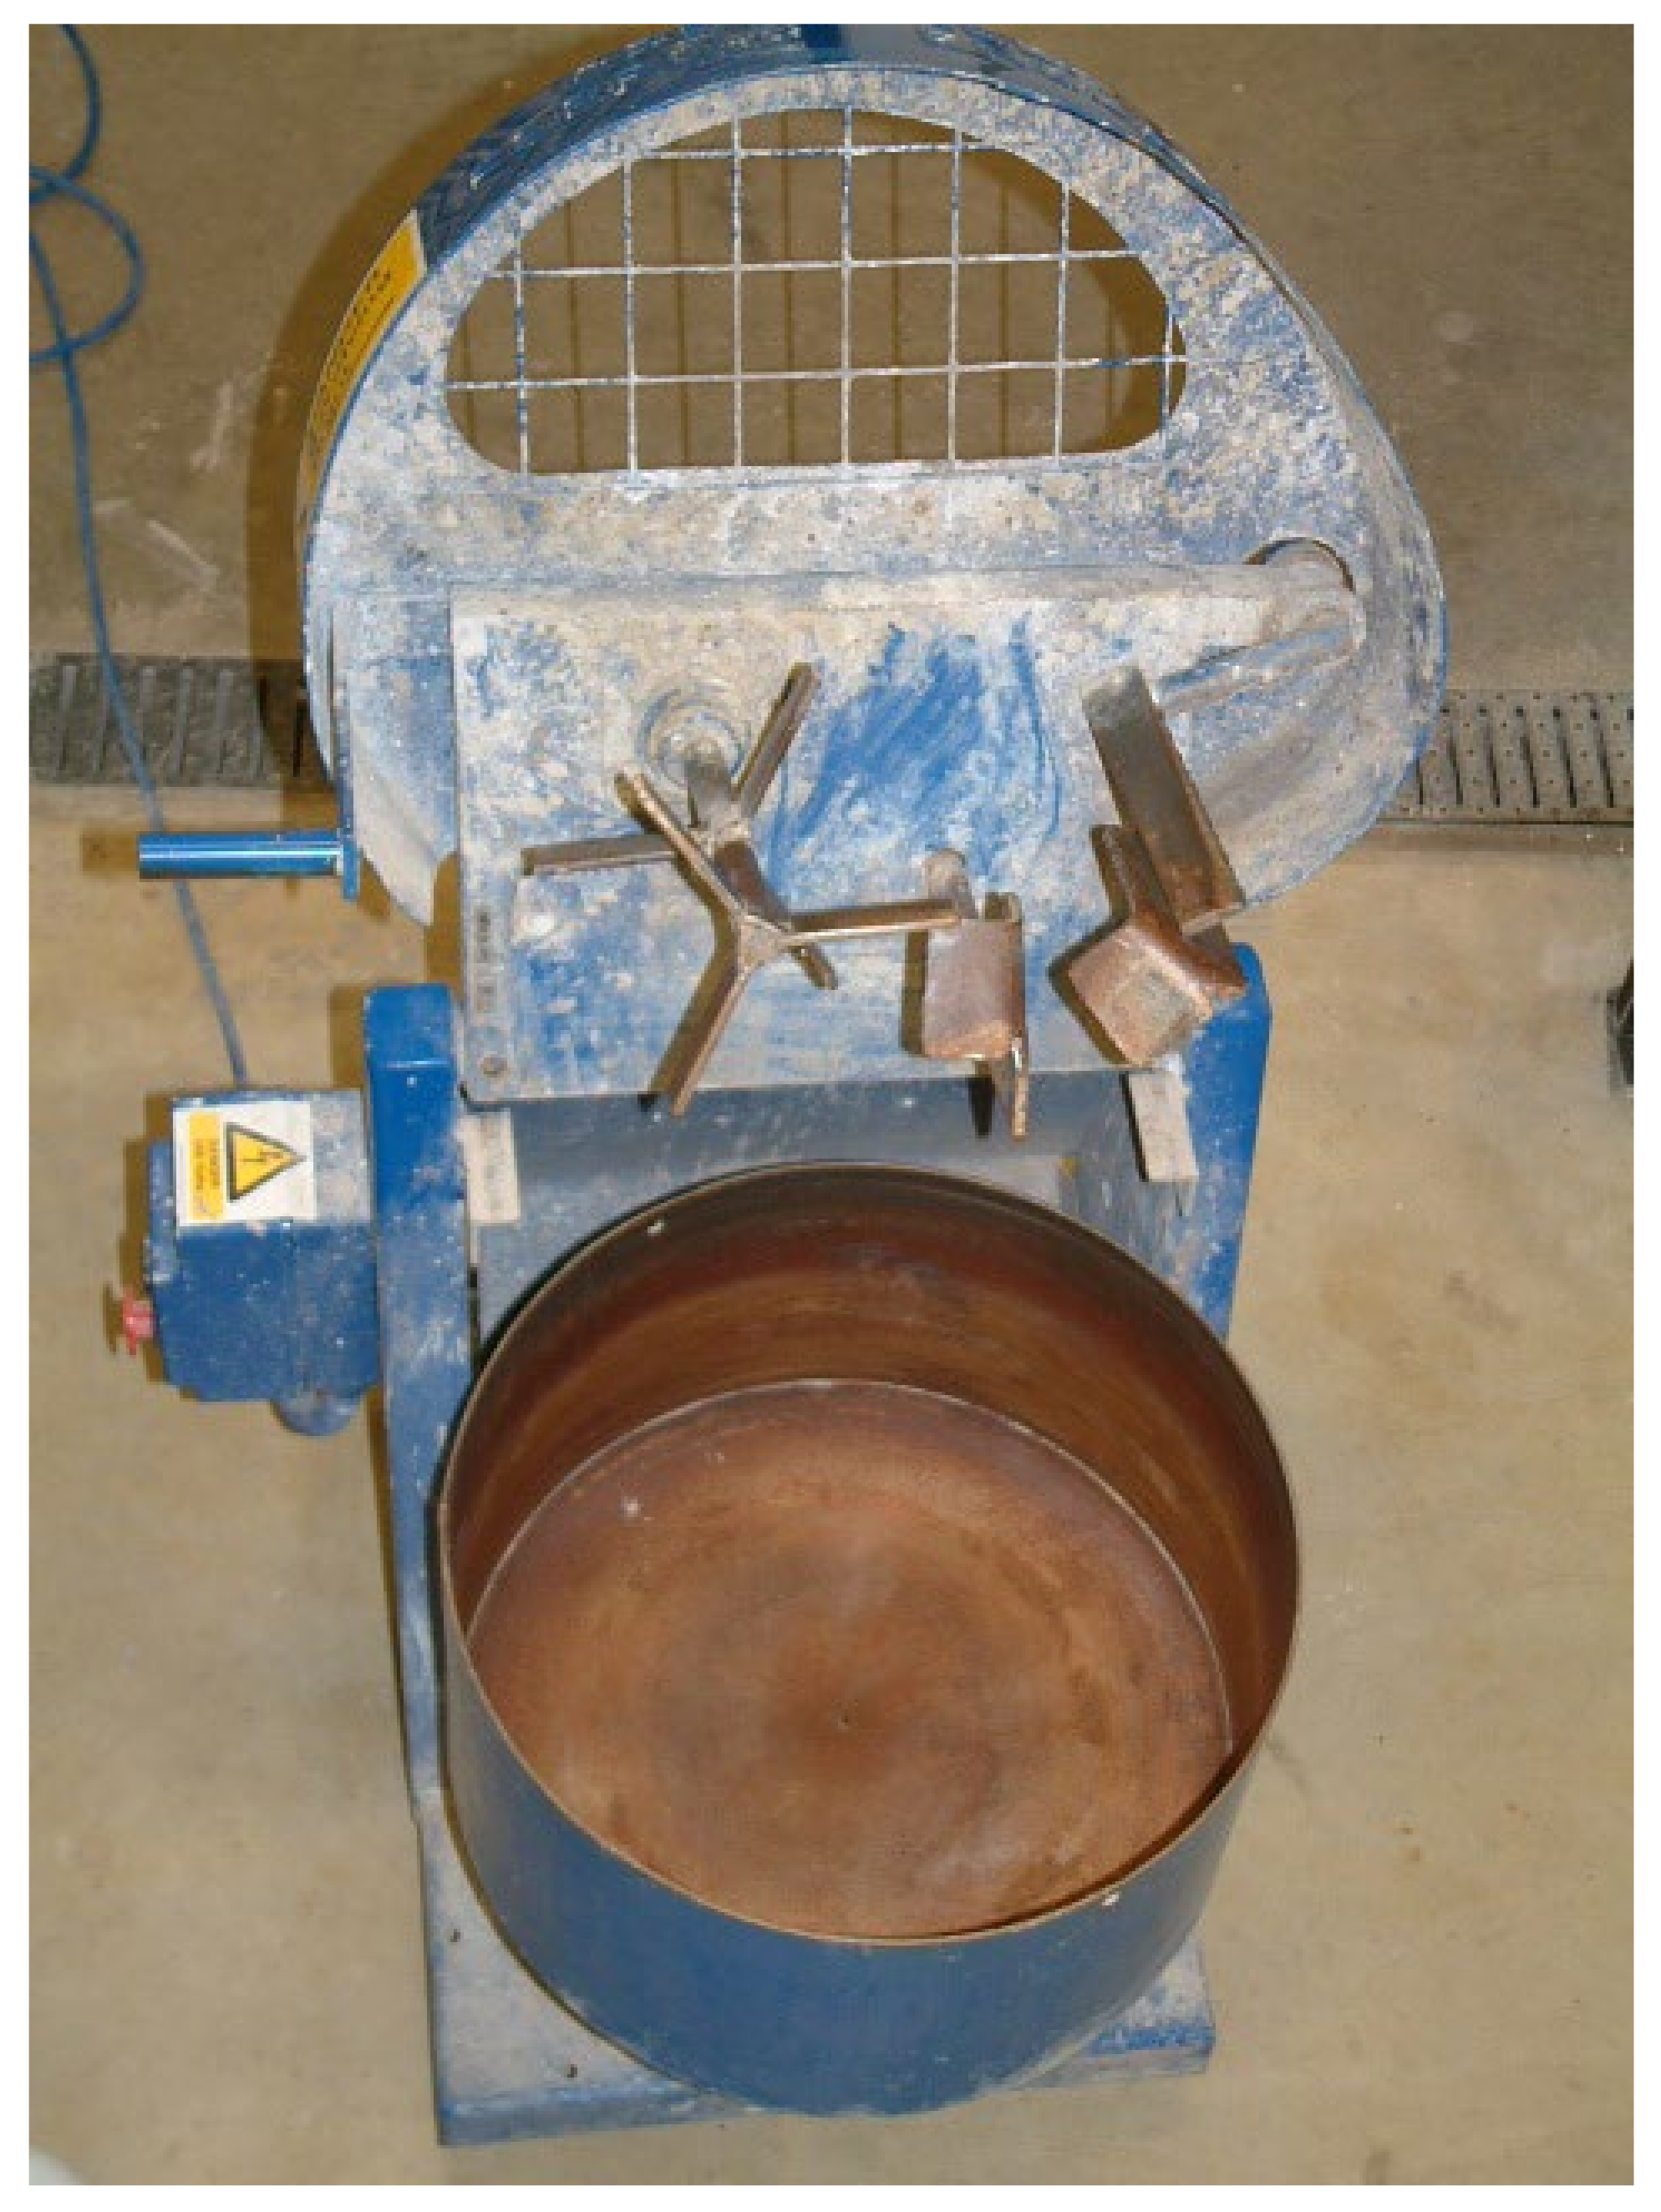
6. Sample Preparation

With the objective to study the effect of the specimen size on strength and stiffness, two different cylindrical specimen sizes were prepared: one with a 50 mm diameter and 100mm height (d/h = 0.5) and the other with a 100 mm diameter and 100 mm height (d/h = 1). This was performed only for the cement stabilized Pt with water contents of 210%, 500% and 1000%, respectively. For the remaining mixes, only a specimen size of d/h = 0.05 was studied.
Samples were mainly prepared by mechanical mixing using a small concrete-type mixer (Figure 2). These followed a sample preparation process similar to the process reported in the 2001 EuroSoilStab [17] project. After mixing the basic soil types and the grout together in the concrete mixer for ten minutes, the mix was placed in split PVC moulds, where samples were uniformly compacted.
To maintain consistency, samples were compacted in five layers of about 20 mm in height with the same compactness effort. In order to achieve a similar compaction in each specimen prepared, each time a layer of material was placed inside the mould, it was pressed slightly (eight times) using a fork with peaks blended at a 45-degree angle. Then, in each layer, the material was also compacted by applying five light blows using a circular aluminium cylinder of about 50 mm in diameter and 50 mm in height for samples with D/H = 0.5, and of about 100 mm in diameter and 50 mm in height for samples with D/H = 1.0. Throughout the process, special care was taken to avoid the generation of air bubbles.
A number of samples were prepared to study the effect of temperature (T), carbon dioxide concentration (CO2) and relative humidity (RH) (Figure 1). For this purpose, a scheme for sample curing was proposed: (i) curing of samples at room temperature, (ii) curing of samples using ovens and (iii) curing of samples using incubators. The first curing procedure consisted of placing the samples on trays inside humidity containers and curing them at a room temperature of about 21 °C and at a relative humidity (RH) of 90%. All specimens were permitted to absorb water from the bottom and top during their curing time in storage. Samples were cured at different ages: 28 days, 60 days, 90 days and 180 days. The second curing procedure consisted of placing the samples in plastic containers exposed to 21 °C and 90% relative humidity. After a period of two days during which the samples became strong enough to be extruded, samples were separated from the mould; and they were wax-coated to preserve their temperature uniformly. After accommodating the wax-coated samples in aluminium trays, they were stored inside the ovens (Figure 3a). These stabilized samples were exposed to temperatures of 45 °C and 60 °C and an RH of 90%. The third curing approach followed a similar curing procedure as the second one, but this time, samples were allowed to cure for two days before they were extruded. Note that the samples were placed unwaxed in the incubators and stored as observed in Figure 3b.
This permitted some samples to be exposed to CO2 to speed up the carbonation process, while varying the temperature and the relative humidity. This curing procedure used three temperatures (T) at 21 °C (control), 45 °C and 60 °C with three relative humidity values (RH) of 70%, 80% and 90%, respectively. Notice that some stabilized samples were exposed to temperatures of 45 °C and 60 °C and RH of 80% and 70% without the injection of CO2 (see Figure 1).

7. Testing Procedures

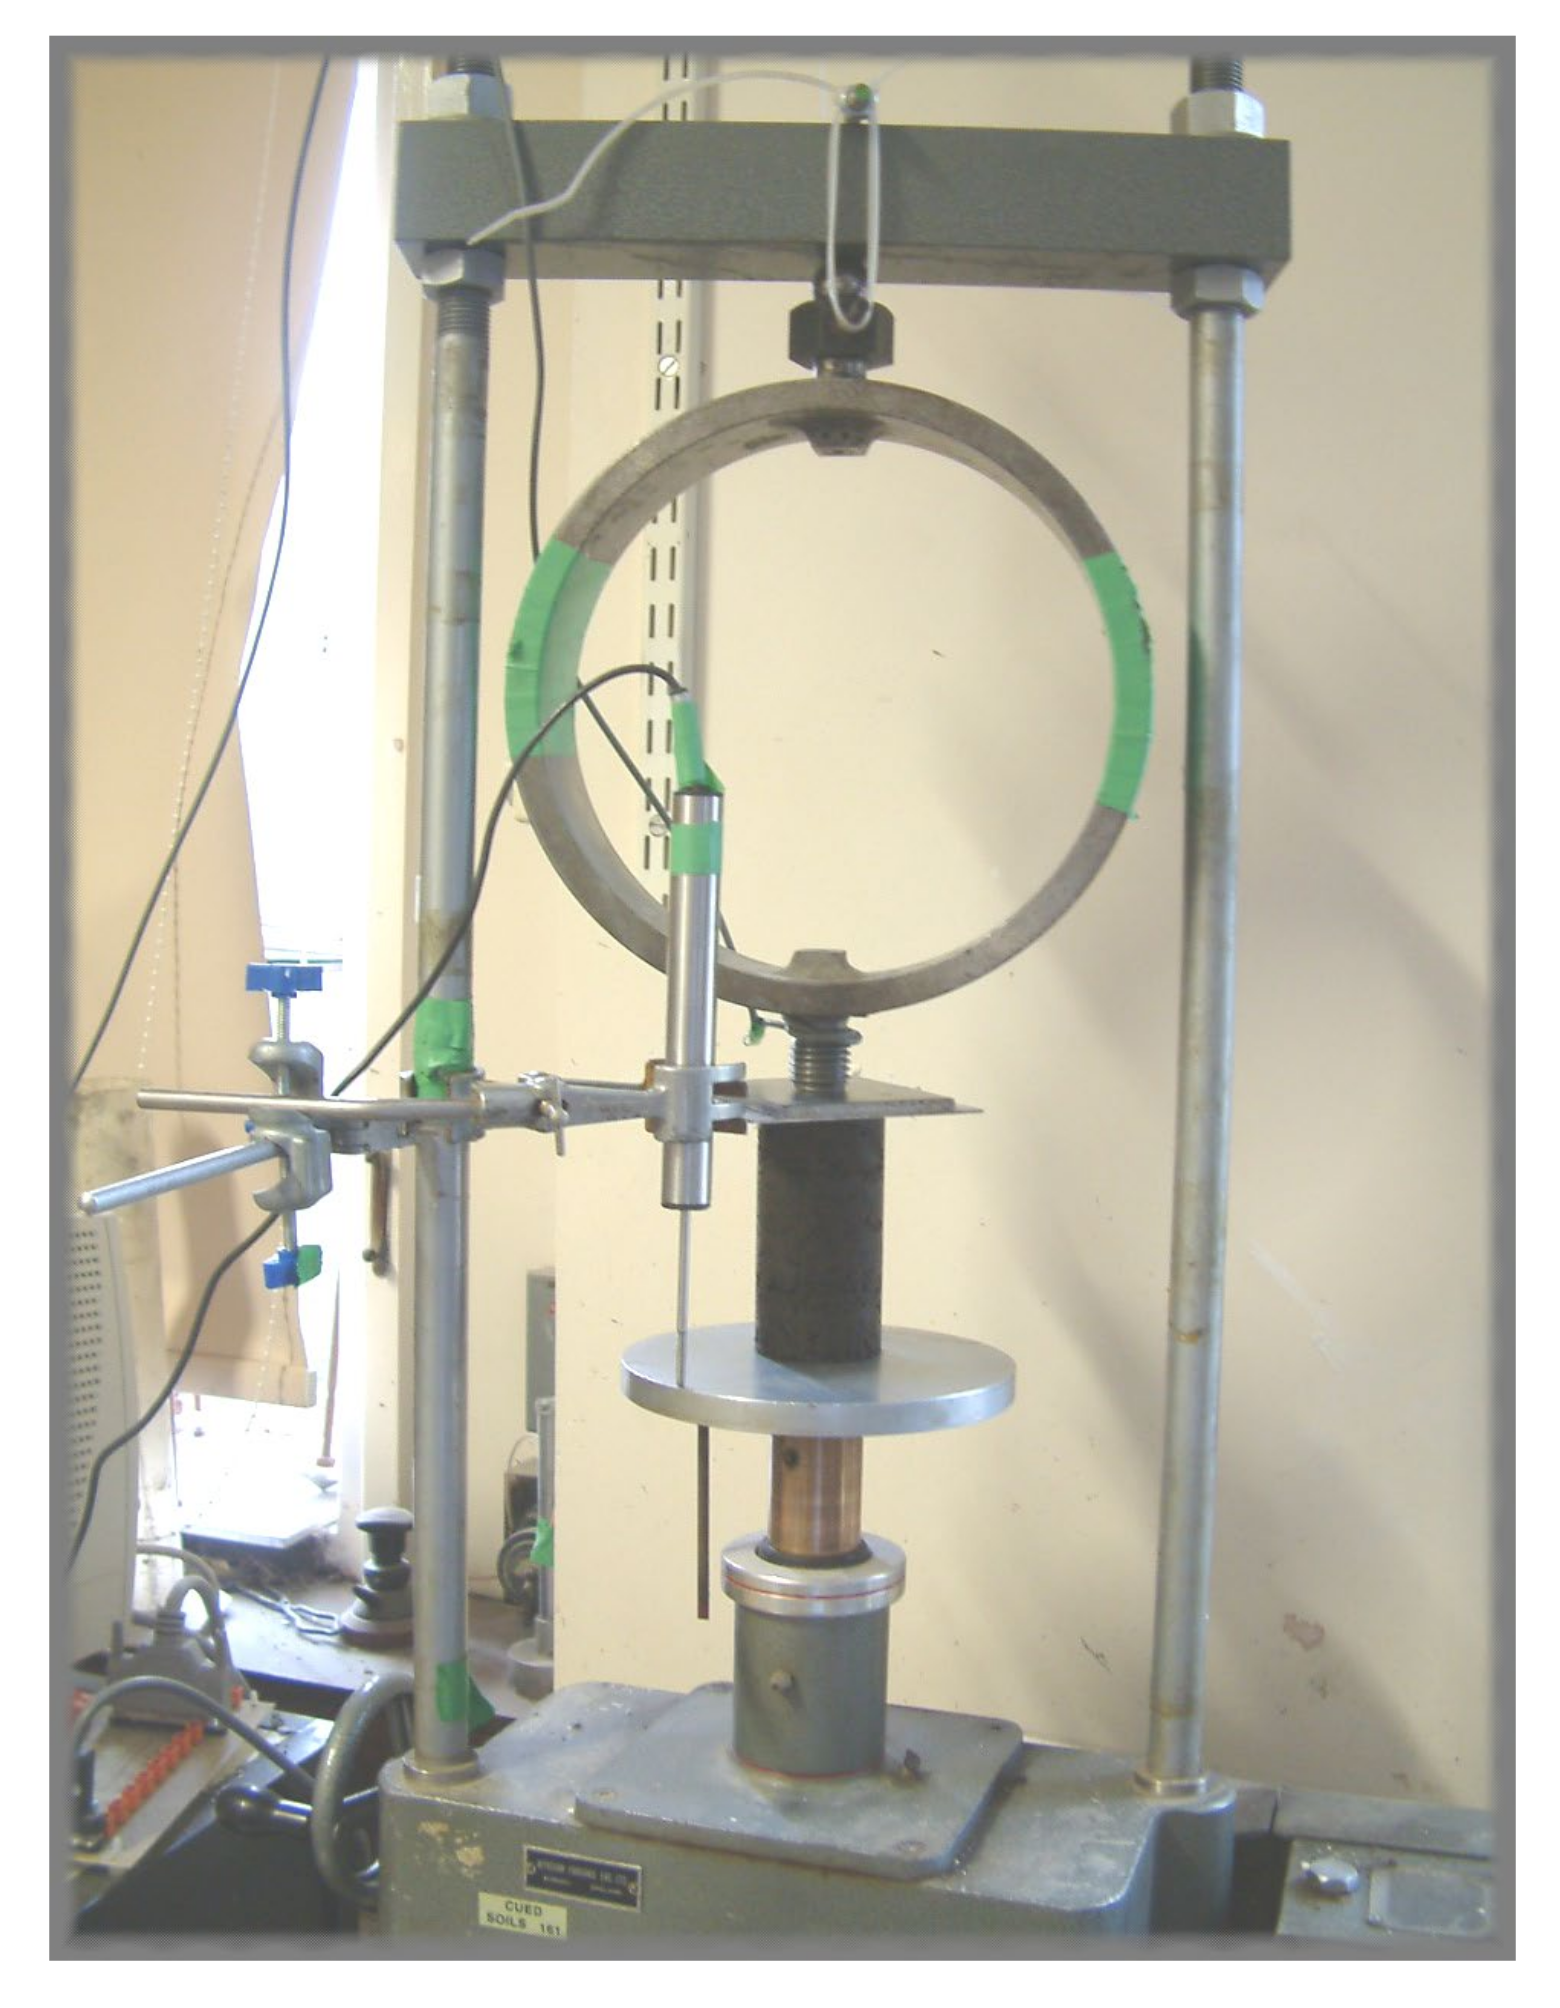
7.1. Unconfined Compression Tests

After the corresponding curing time was completed, unconfined compression tests were conducted for all soil stabilized samples. The unconfined compressive strength was measured using a conventional loading machine (Figure 4).
The load was applied to a constant rate of 1.5 mm/min until an axial strain of 10% was reached. The compressive stress corresponding to each reading was computed, including the simplified area correction [58]. A strain correction due to the initial bedding deformation during loading was also included [17]. Typical stress–strain curves are shown in Figure 5. From these curves, the unconfined elastic tangent modulus (E) and the unconfined compression strength (UCS) were estimated. Triplicated samples were tested to confirm experimental reproducibility (see Figure 5), populating a database of up to 1030 specimens in total.

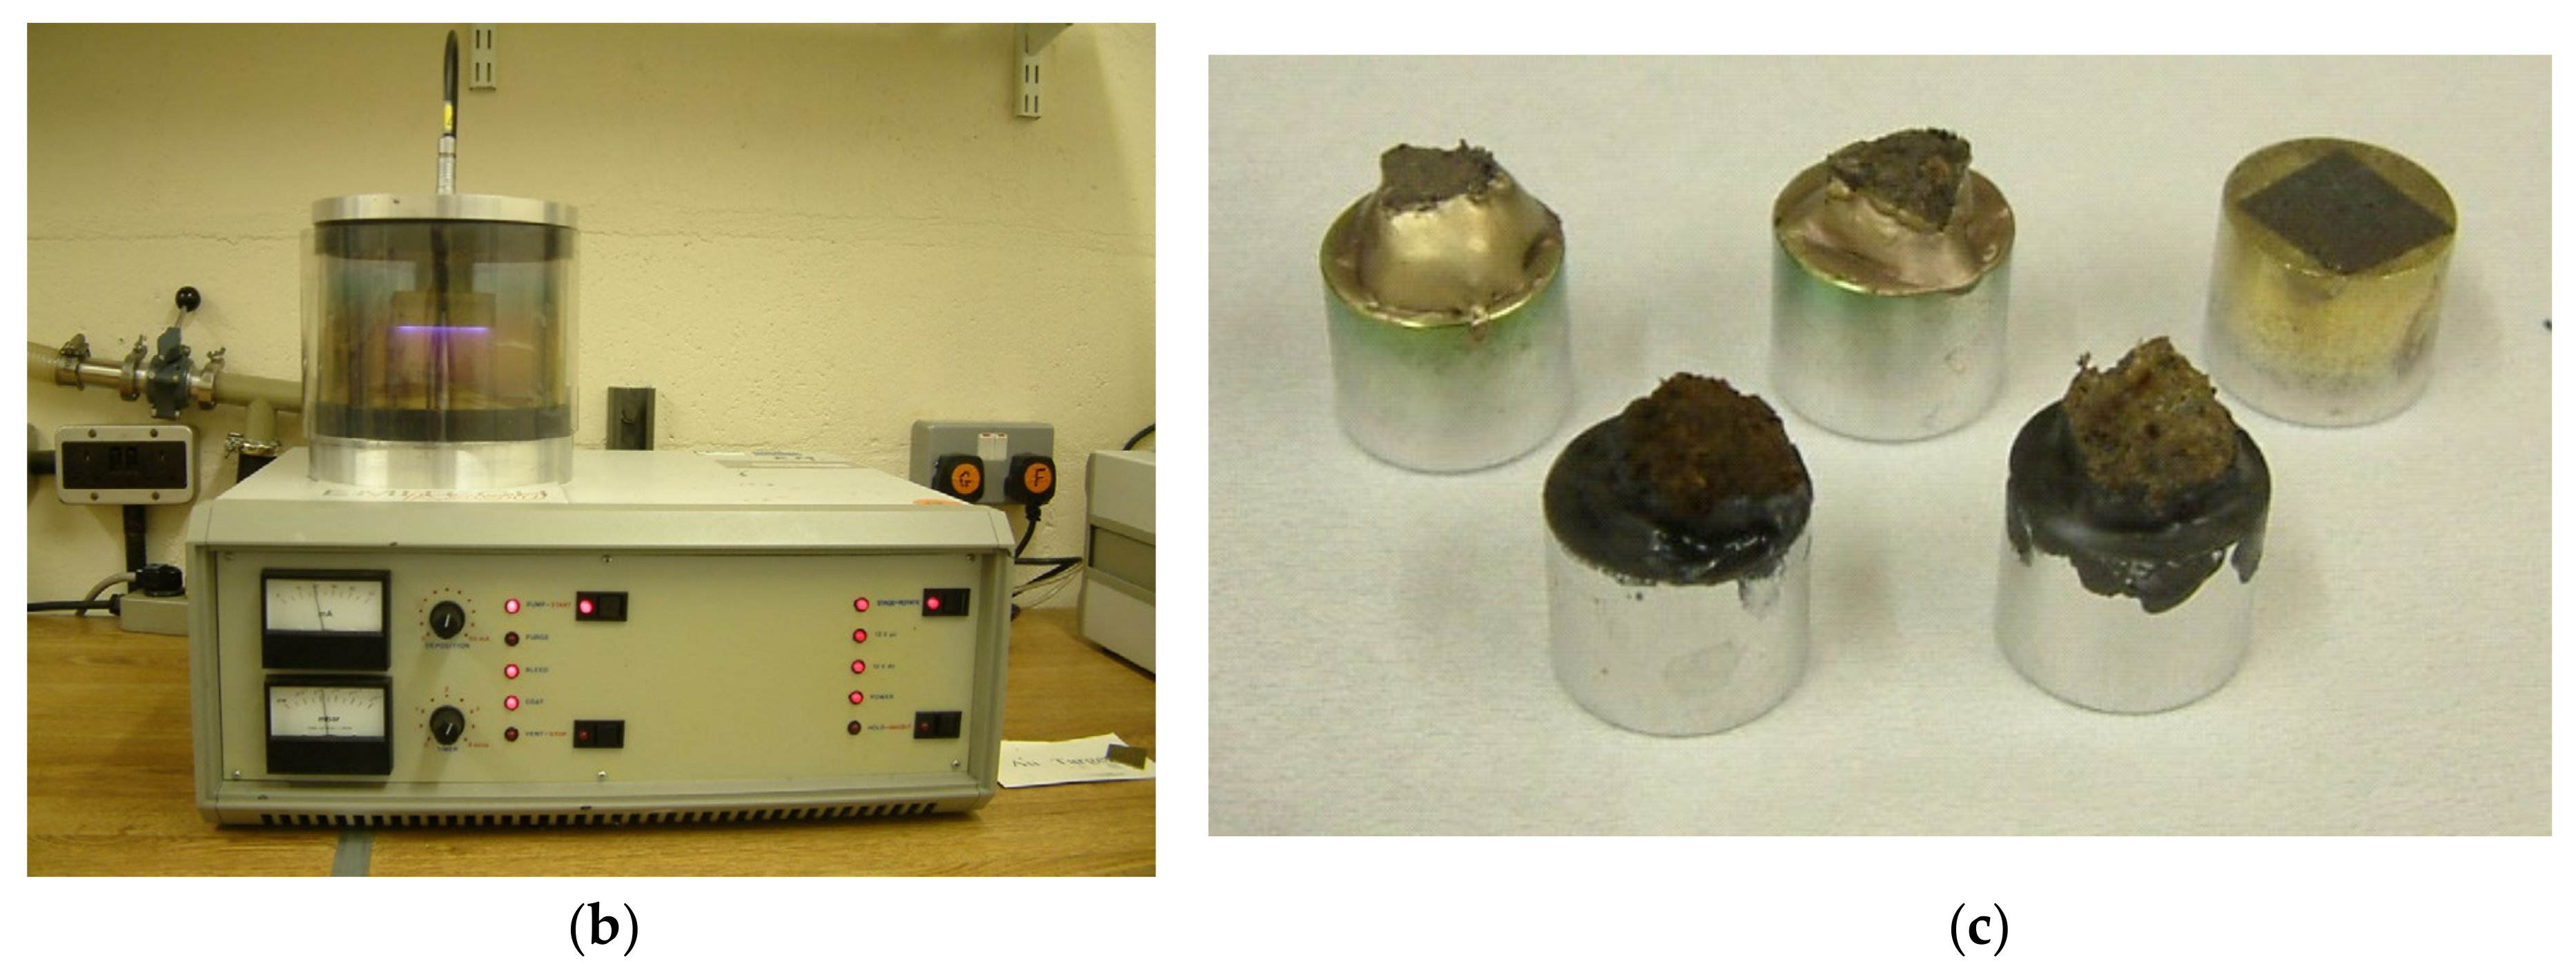
7.2. Scanning Electron Microscopy

Scanning electron microscopy (SEM) technology was used as a complementary qualitative approach to improve the understanding on the hydration mechanisms of cementitious materials when mixed with organic soils. This technique has been used previously to observe the main reaction products due to soil–binder reactions in organic soils [9,36,57,59]. The scanning electron microscope used in this study is shown in Figure 6a, including a photo and a schematic diagram of the various components of the equipment.
Most of the prepared mixtures were used to observe the change in the microstructure over time. SEM images were taken of most mixtures at the curing times of 28 days, 60 days and 90 days. After specimens underwent the unconfined compression tests and reached failure, splitting the specimen into various fragments, the optimal fragment was selected for SEM observation. Sample fragments were fixed onto small holders called “stubs”. Carbon was placed around the sample in order to maintain the sample fixed to the stub. The surface of the specimen was then coated with a very thin uniform layer of gold to provide an electrically conductive film representative of the specimen to be viewed (Figure 6c). A sputter coater, the Emitech K550 model (Figure 6b), was used; Argon was chosen as the plasma gas. Then, coated samples were placed in the SEM chamber for observation.

8. Experimental Results

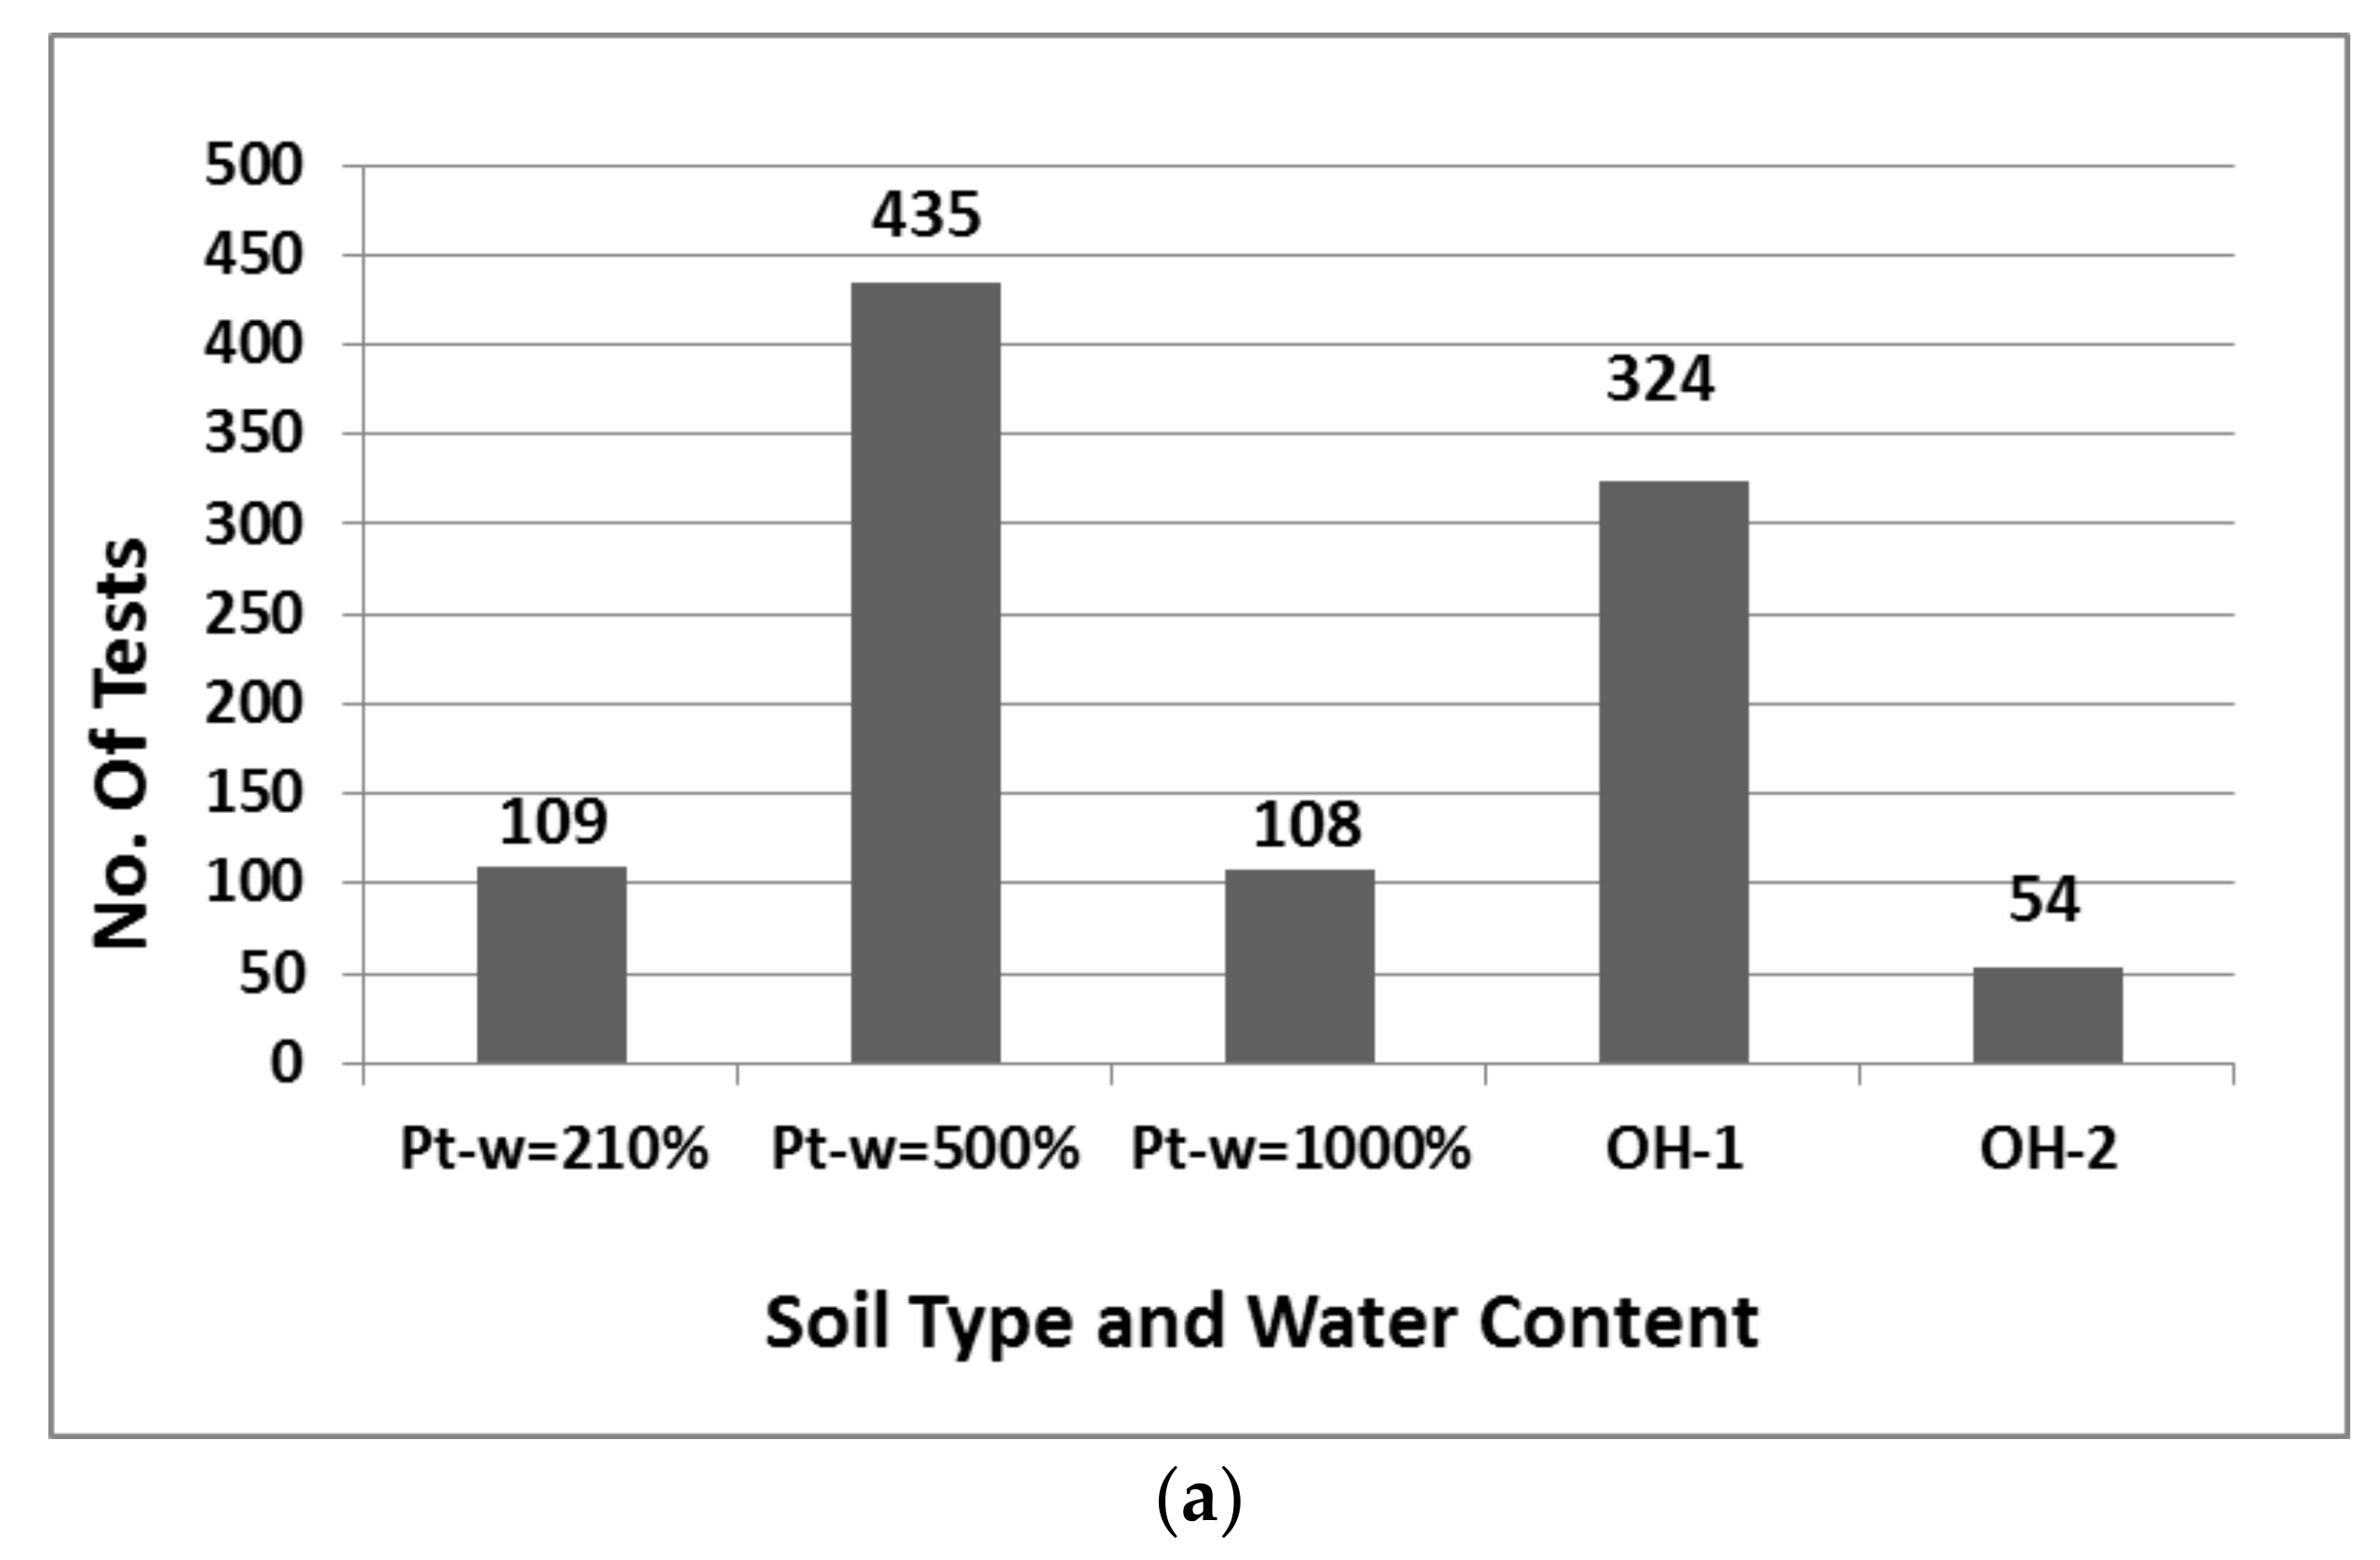
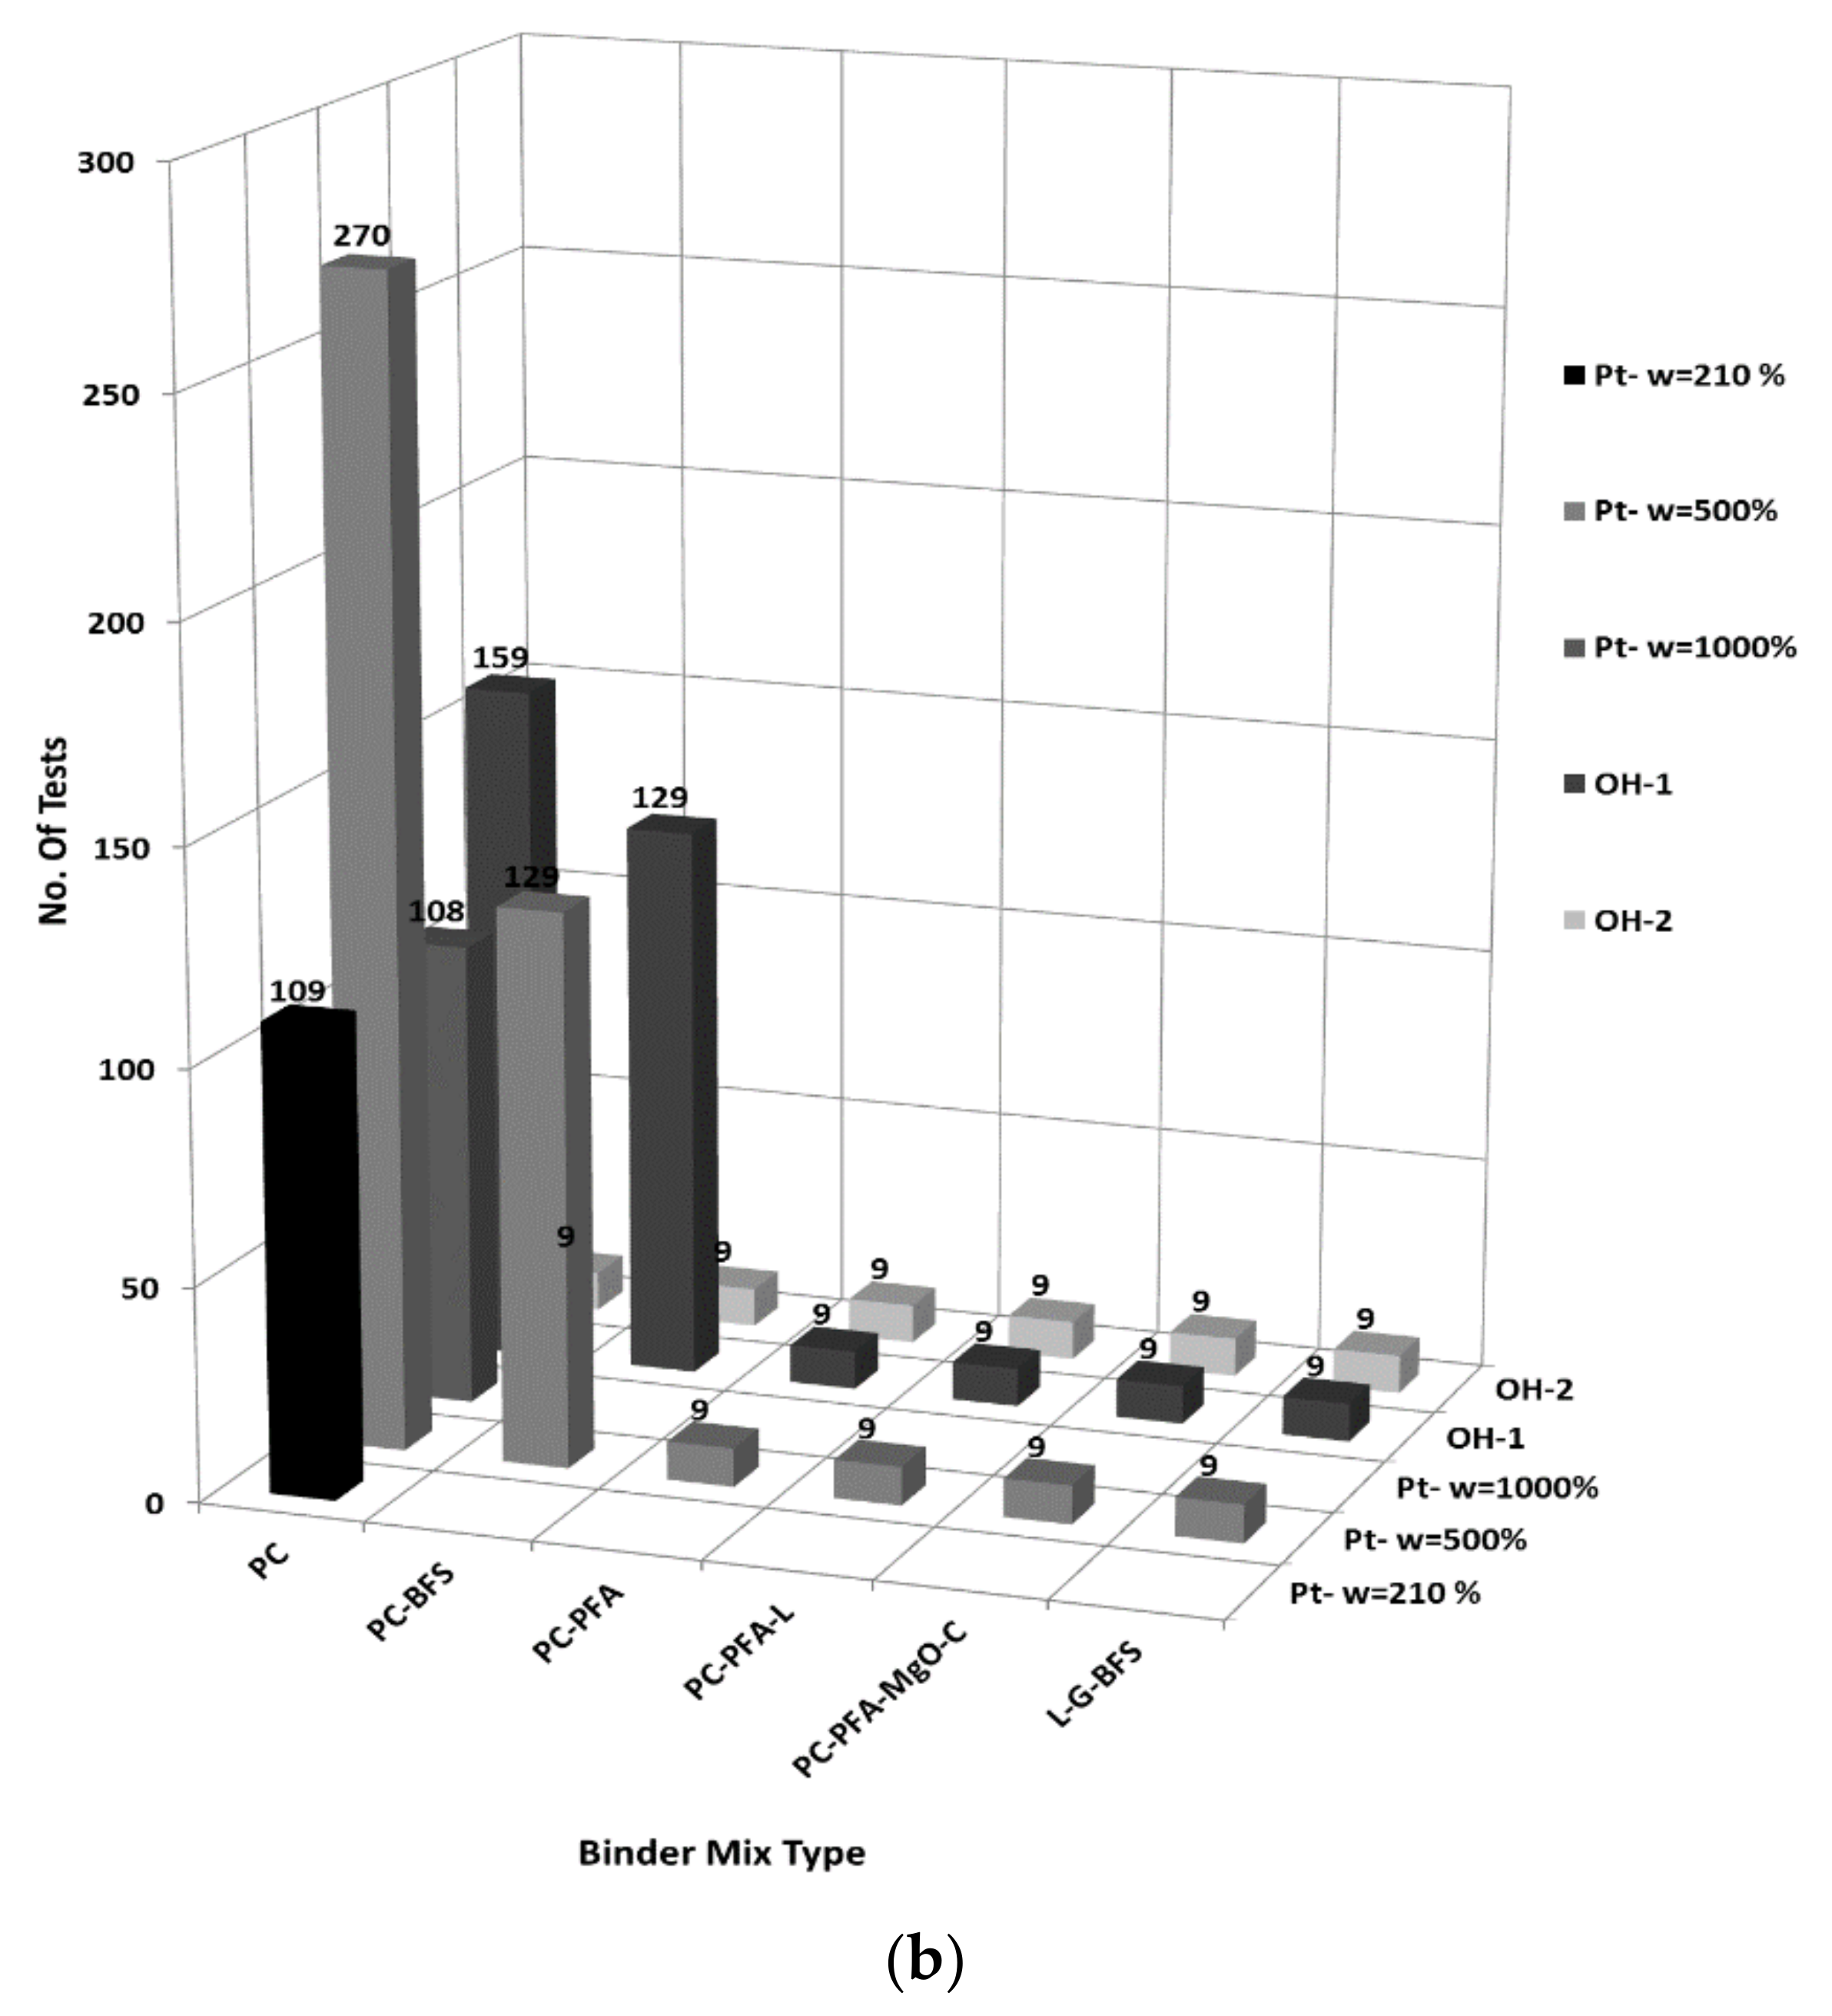
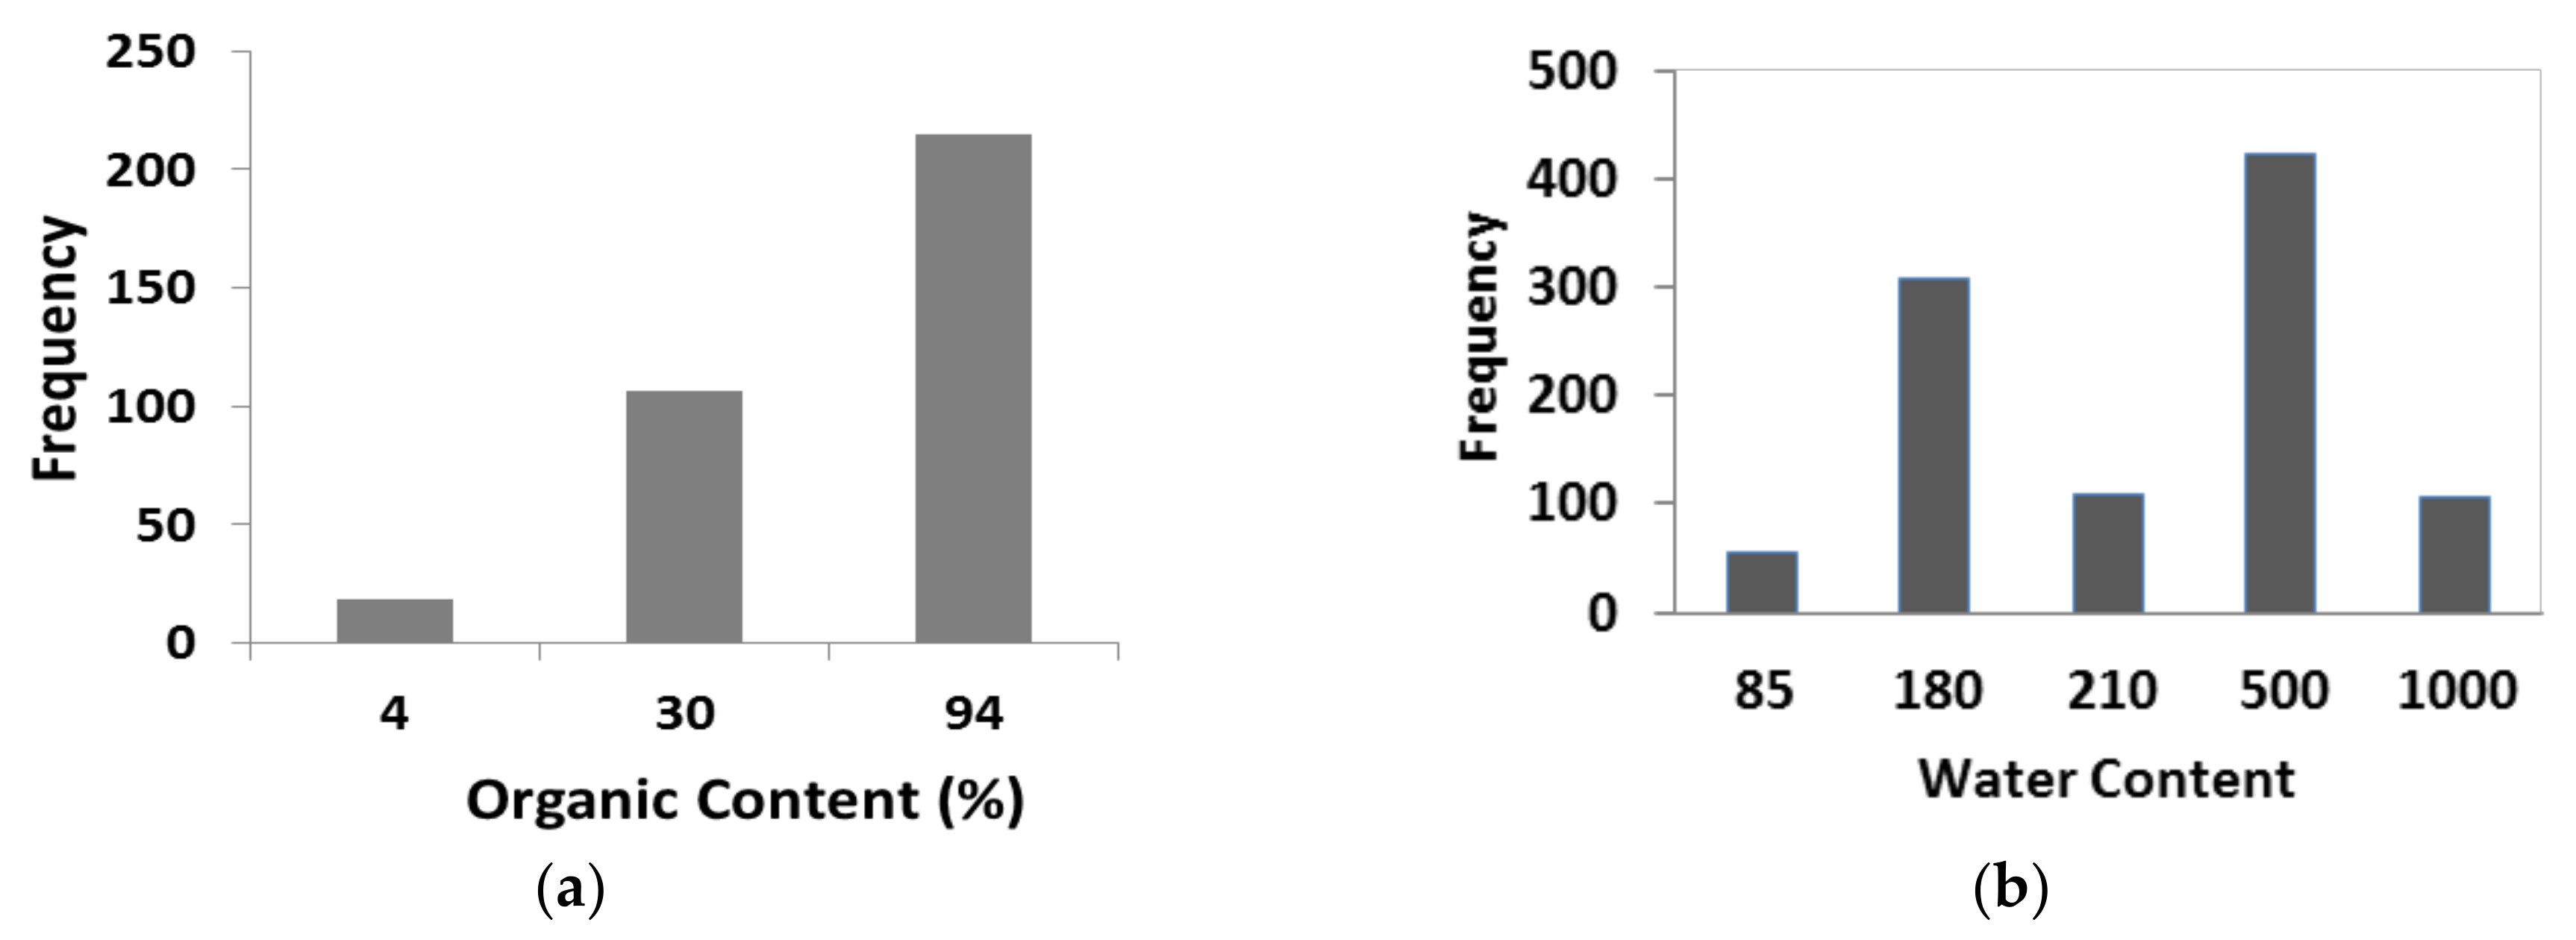
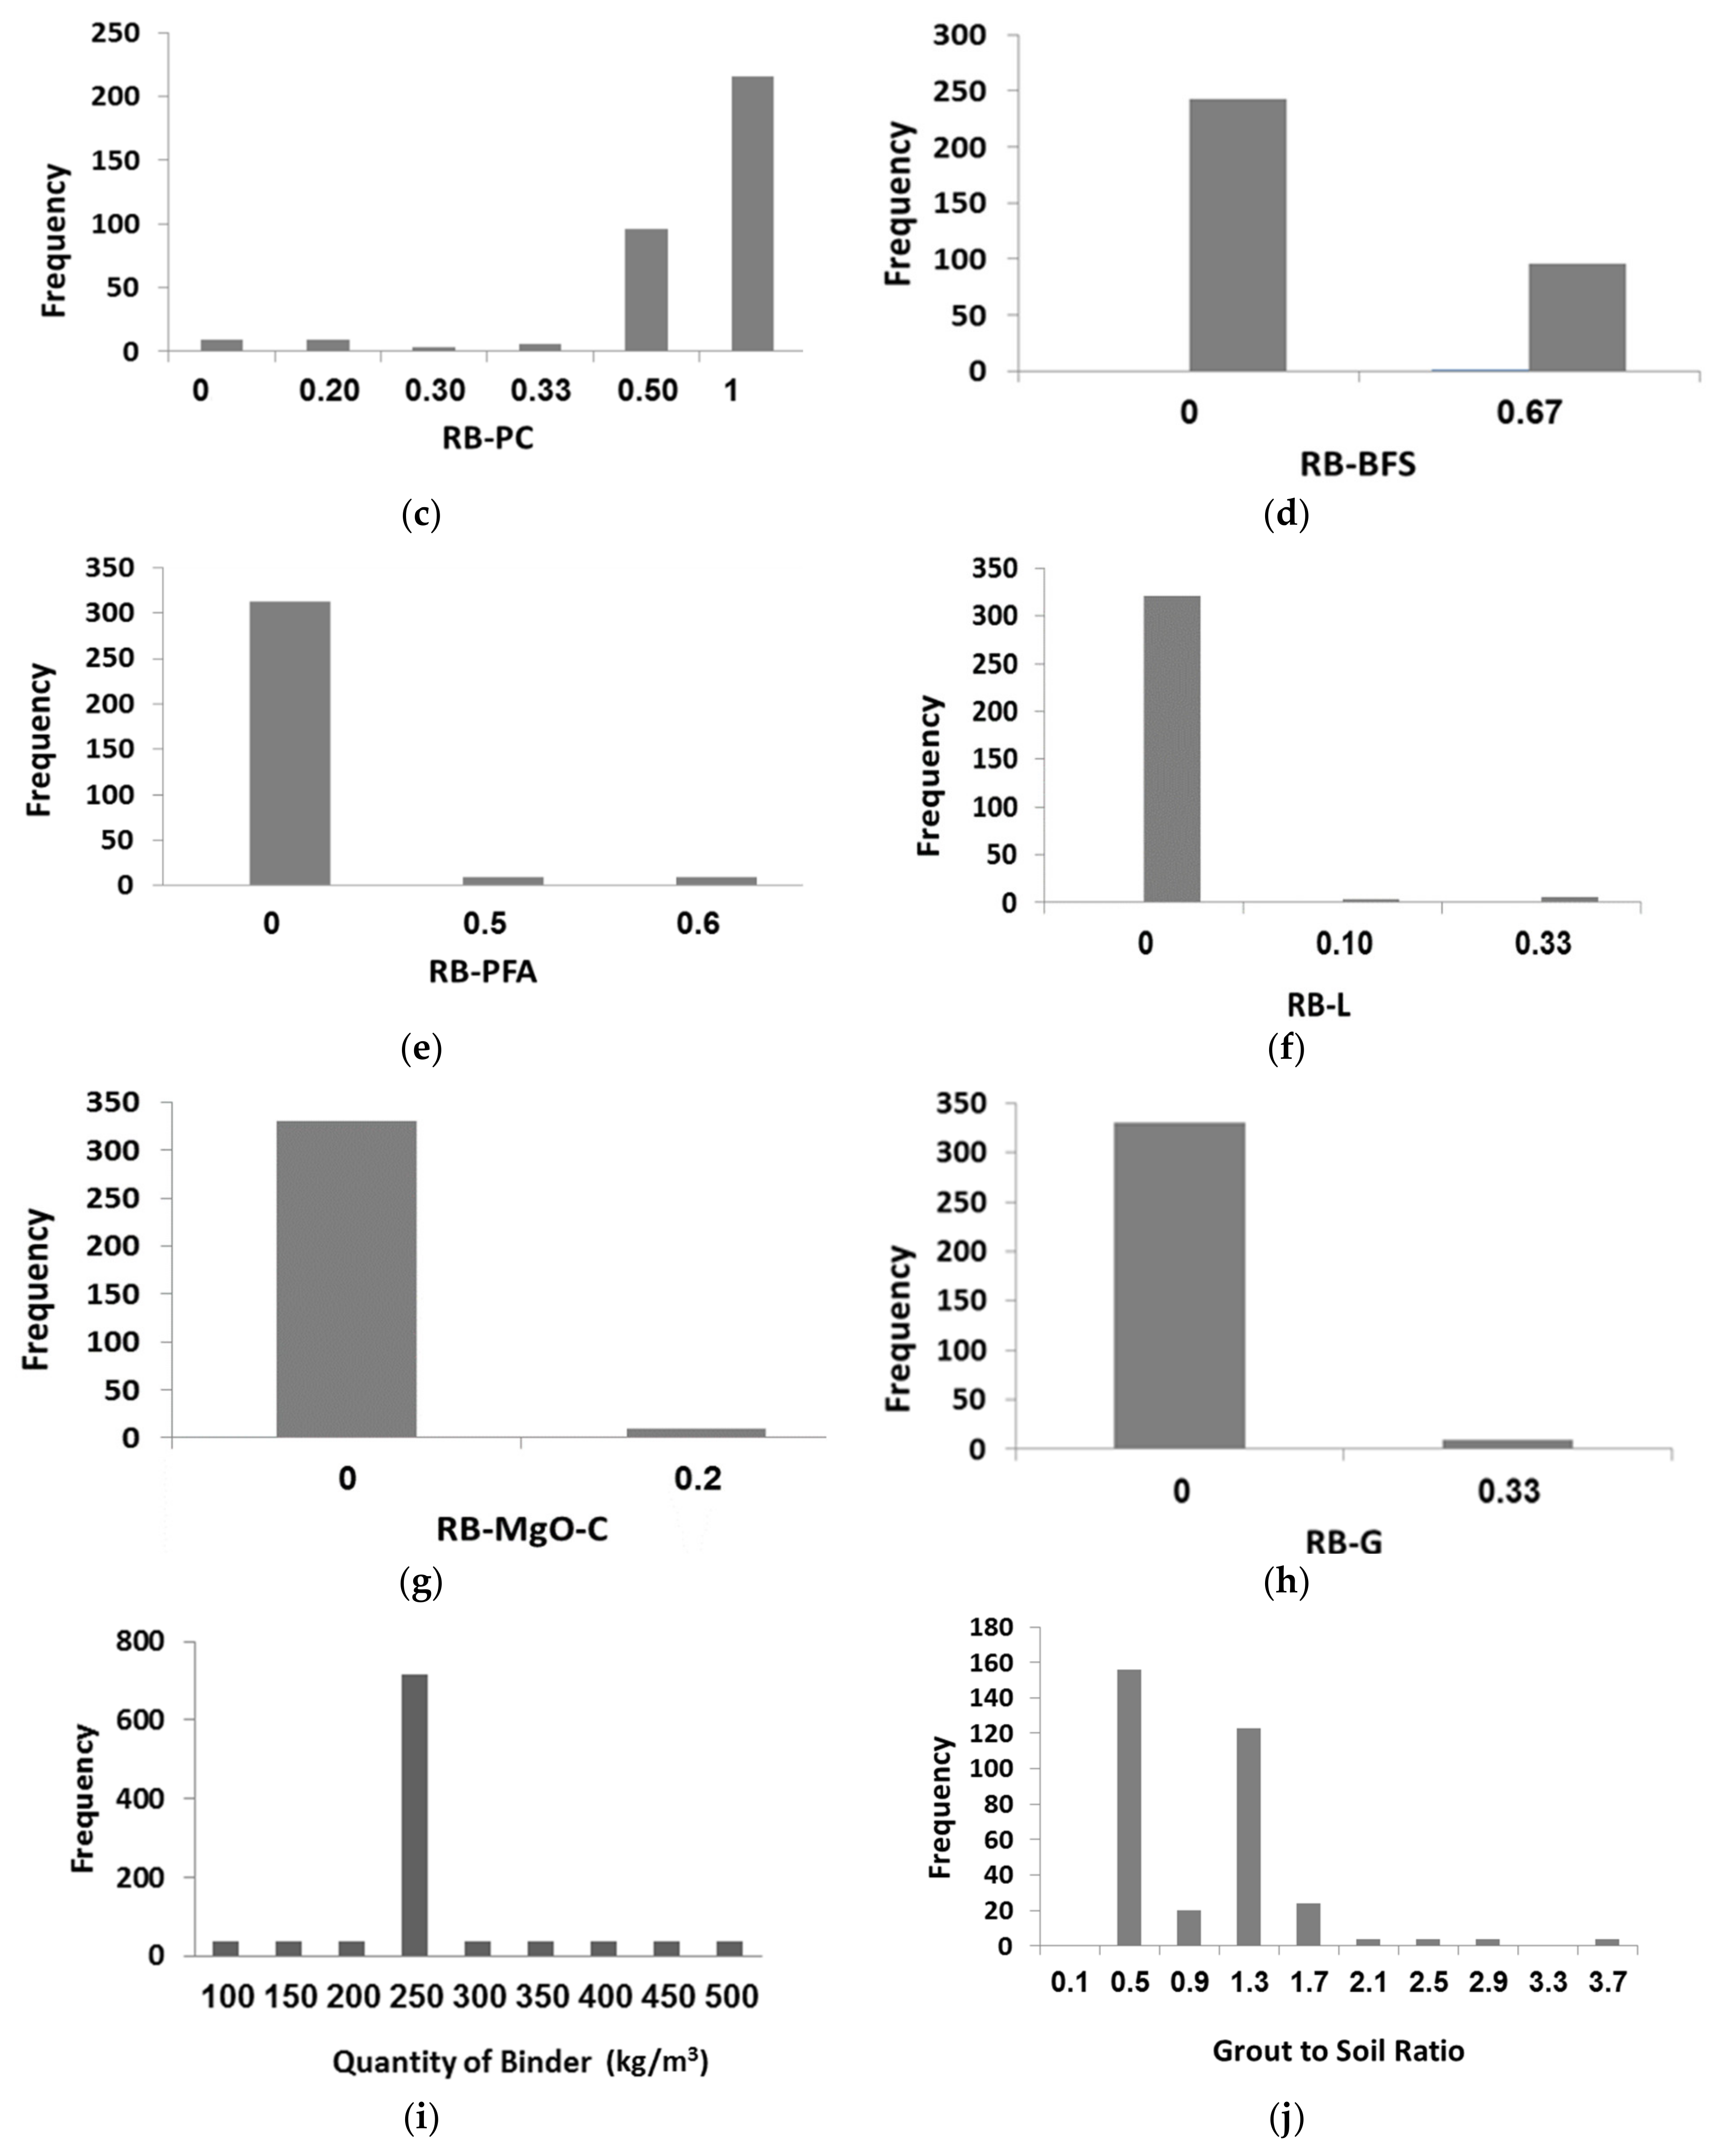
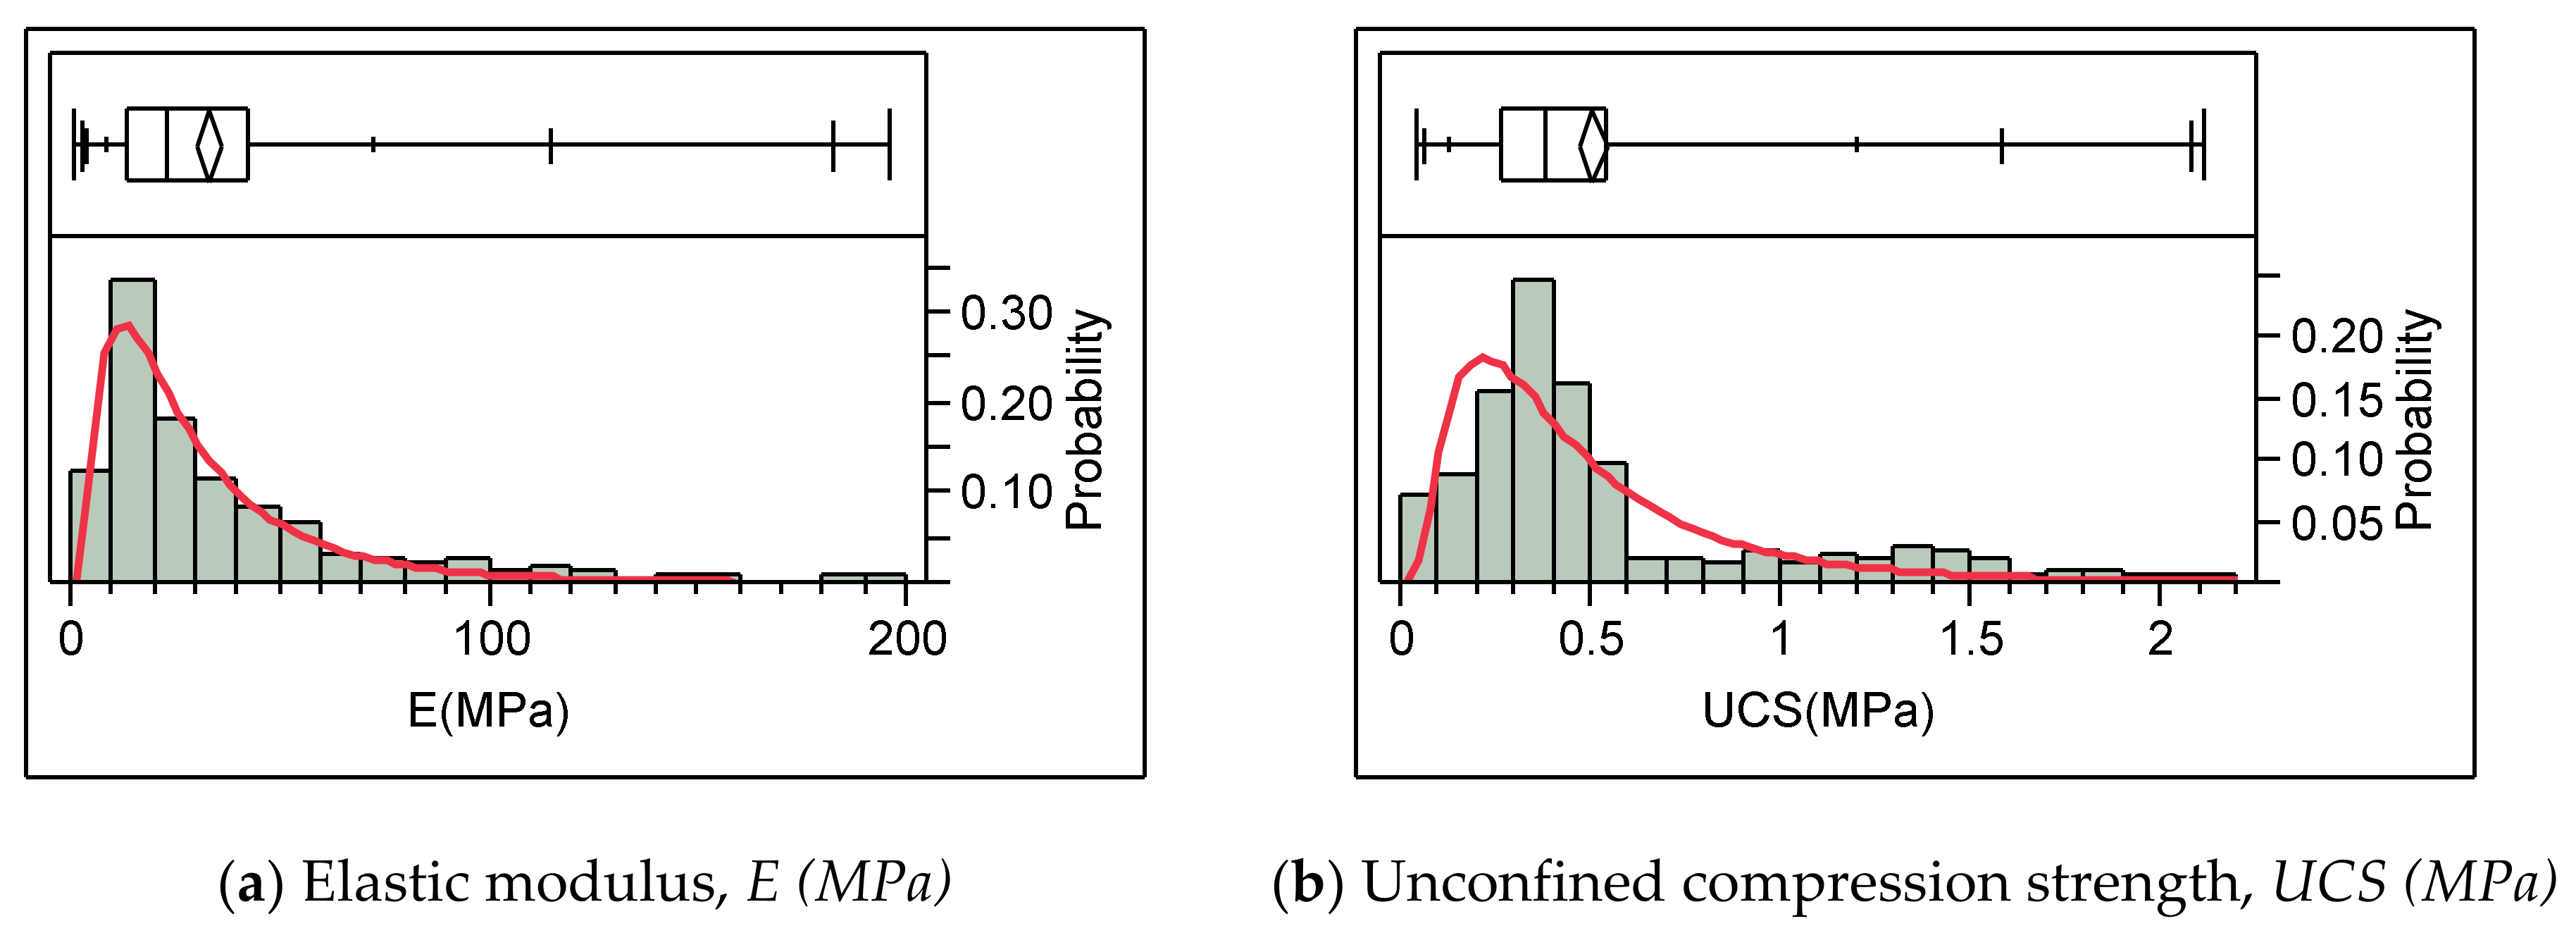
8.1. Descriptive Statistics

No artificial intelligence nor machine learning modelling should be conducted unless the datasets of interest are properly described statistically. This chapter presents the descriptive statistics of the experimental database introduced above.
The average values of triplicated unconfined elastic tangent modulus (E) and the unconfined compression strength (UCS) were computed from each compression test generating 339 distinct ‘data points’. Using these values, first-order and descriptive statistics were obtained. The key control variables included in the statistical analysis were the specimen’s diameter to height ratio (D/H), initial water content of the soil (w), organic content (OC), quantity of binder (QB), water to binder ratio (W/B), grout to soil ratio (G/S), curing time (t), curing temperature (T), curing relative humidity (RH), carbonation (CO2), ratio of binder for Portland cement (RB-PC), ratio of binder for ground granulated blast furnace slag (RB-GGBS), ratio of binder for pulverized fuel ash (RB-PFA), ratio of binder for lime (RB-L), ratio of binder for magnesium oxide (RB-MgO-C), and ratio of binder for gypsum (RB-G). Table 3 shows the different varying parameters and their corresponding ranges considered.
The statistical analysis presented below corresponds to the experimental design described in Figure 1. Histograms for the mixture samples in terms of soil type (Pt, OH-1 and OH-2), with respect to their corresponding water content (w) and binder mix type content (RB-PC, RB-GGBS, RB-PFA, RB-L, RB-MgO and RB-G), are shown in Figure 7a,b. From these figures, it is observed that peat containing 500% water content and the medium organic clay (OH-1) containing 180% water content represent the main sub-populations of the study, as also reflected in Figure 1. From Figure 7b, it is also observed that Pt and OH-1 represent the most stabilized soils, while PC alone and PC plus GGBS were the two binders mostly used. Limited data were populated for binder mixes containing PFA, L, MgO-C and G. These later binders were chosen in order to study whether or not they could increase pozzolanic reactions and to evaluate their ability to enhance strengthening in organic soils since their use could reduce cost.
Figure 8 presents a descriptive distribution of each control variable, as listed in Table 3, by introducing their marginal histograms.
Figure 9 shows the relative frequency distribution and lognormal fits for both the elasticity modulus (E) and the unconfined compression strength (UCS).
The corresponding summary of the first-order statistics for these parameters are shown in Table 4. This shows that the E varies from 0.83 MPa to 214.62 MPa, with a mean value of 34.03, MPa and a standard deviation of 31.49 MPa, while UCS varies from 0.04 MPa to 2.09 MPa with a mean of 0.5 MPa and a standard deviation of 0.41 MPa.

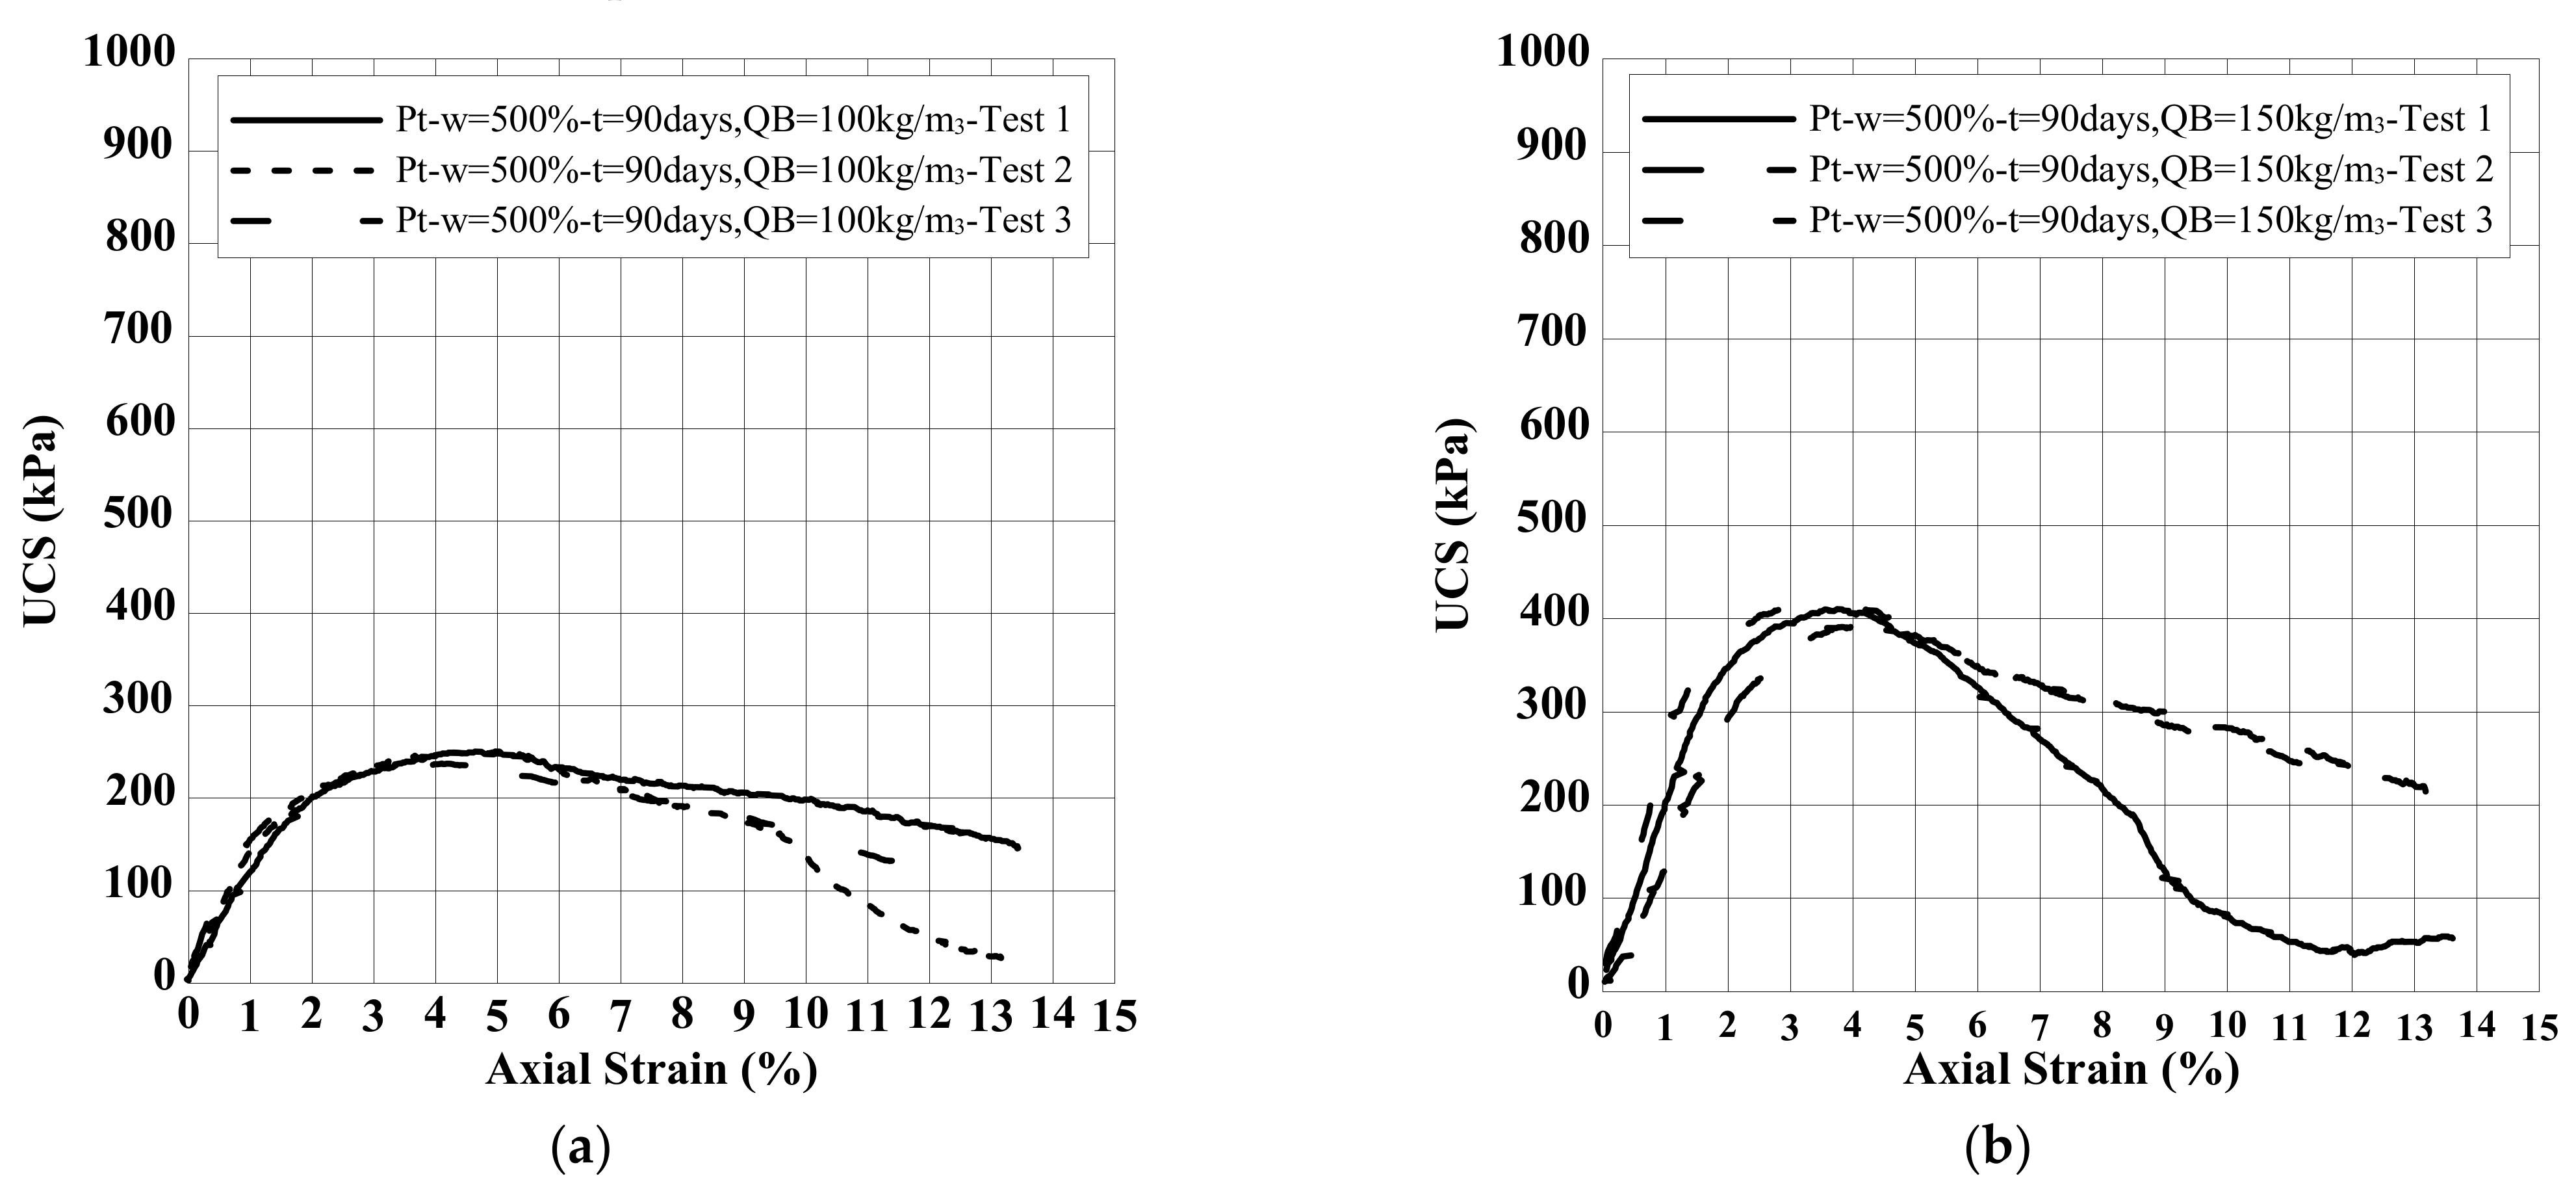
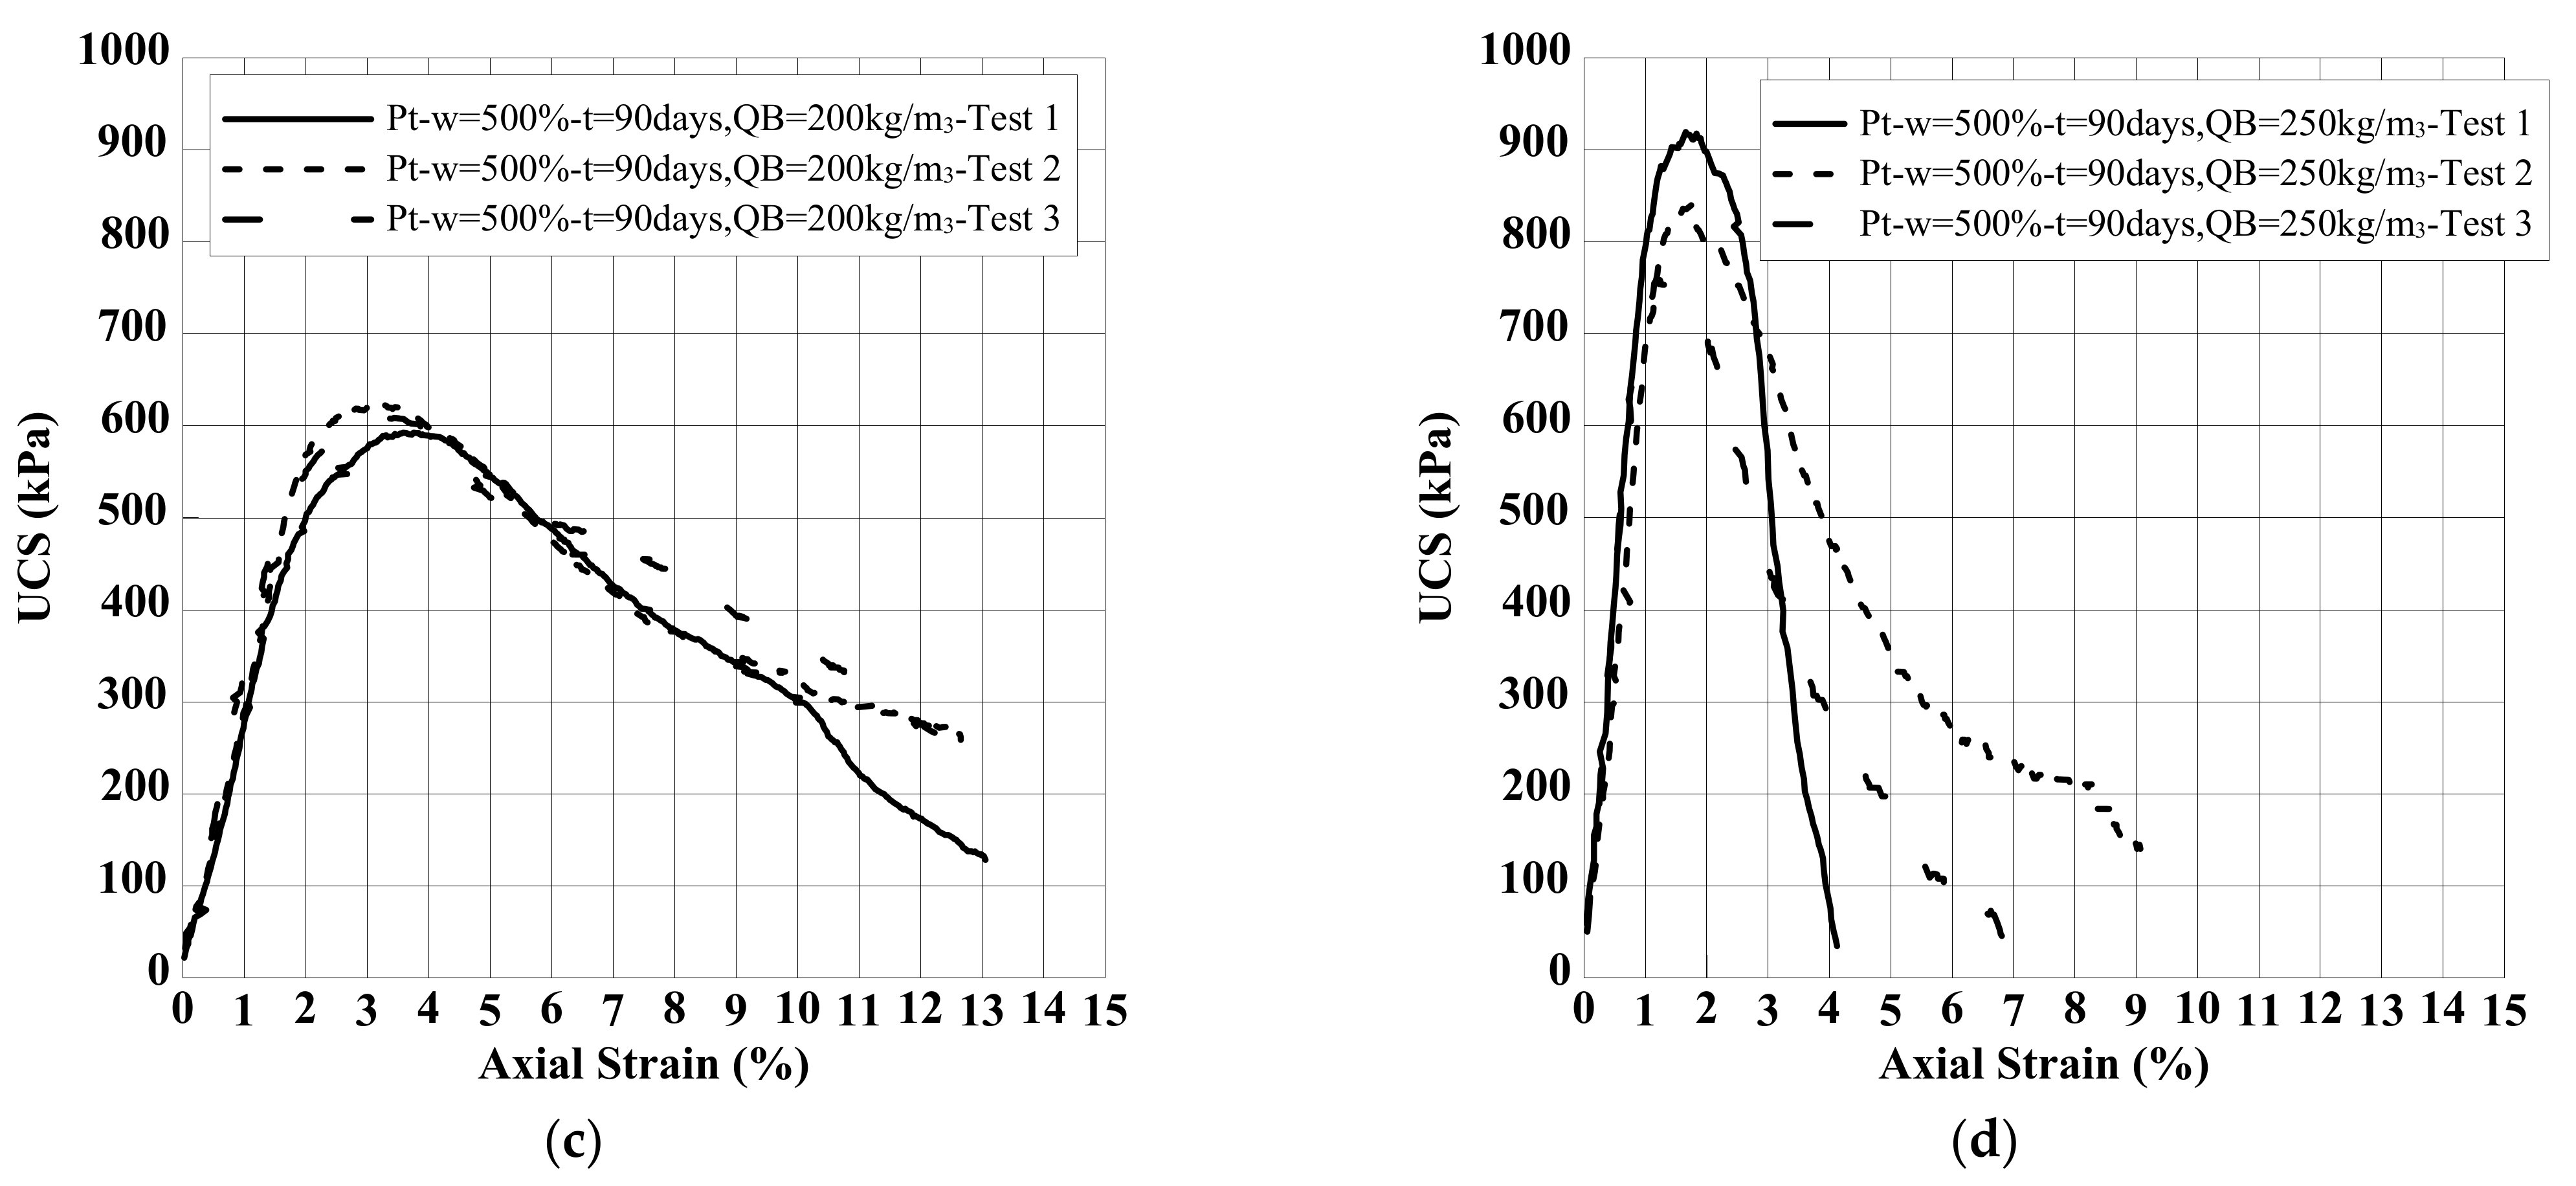
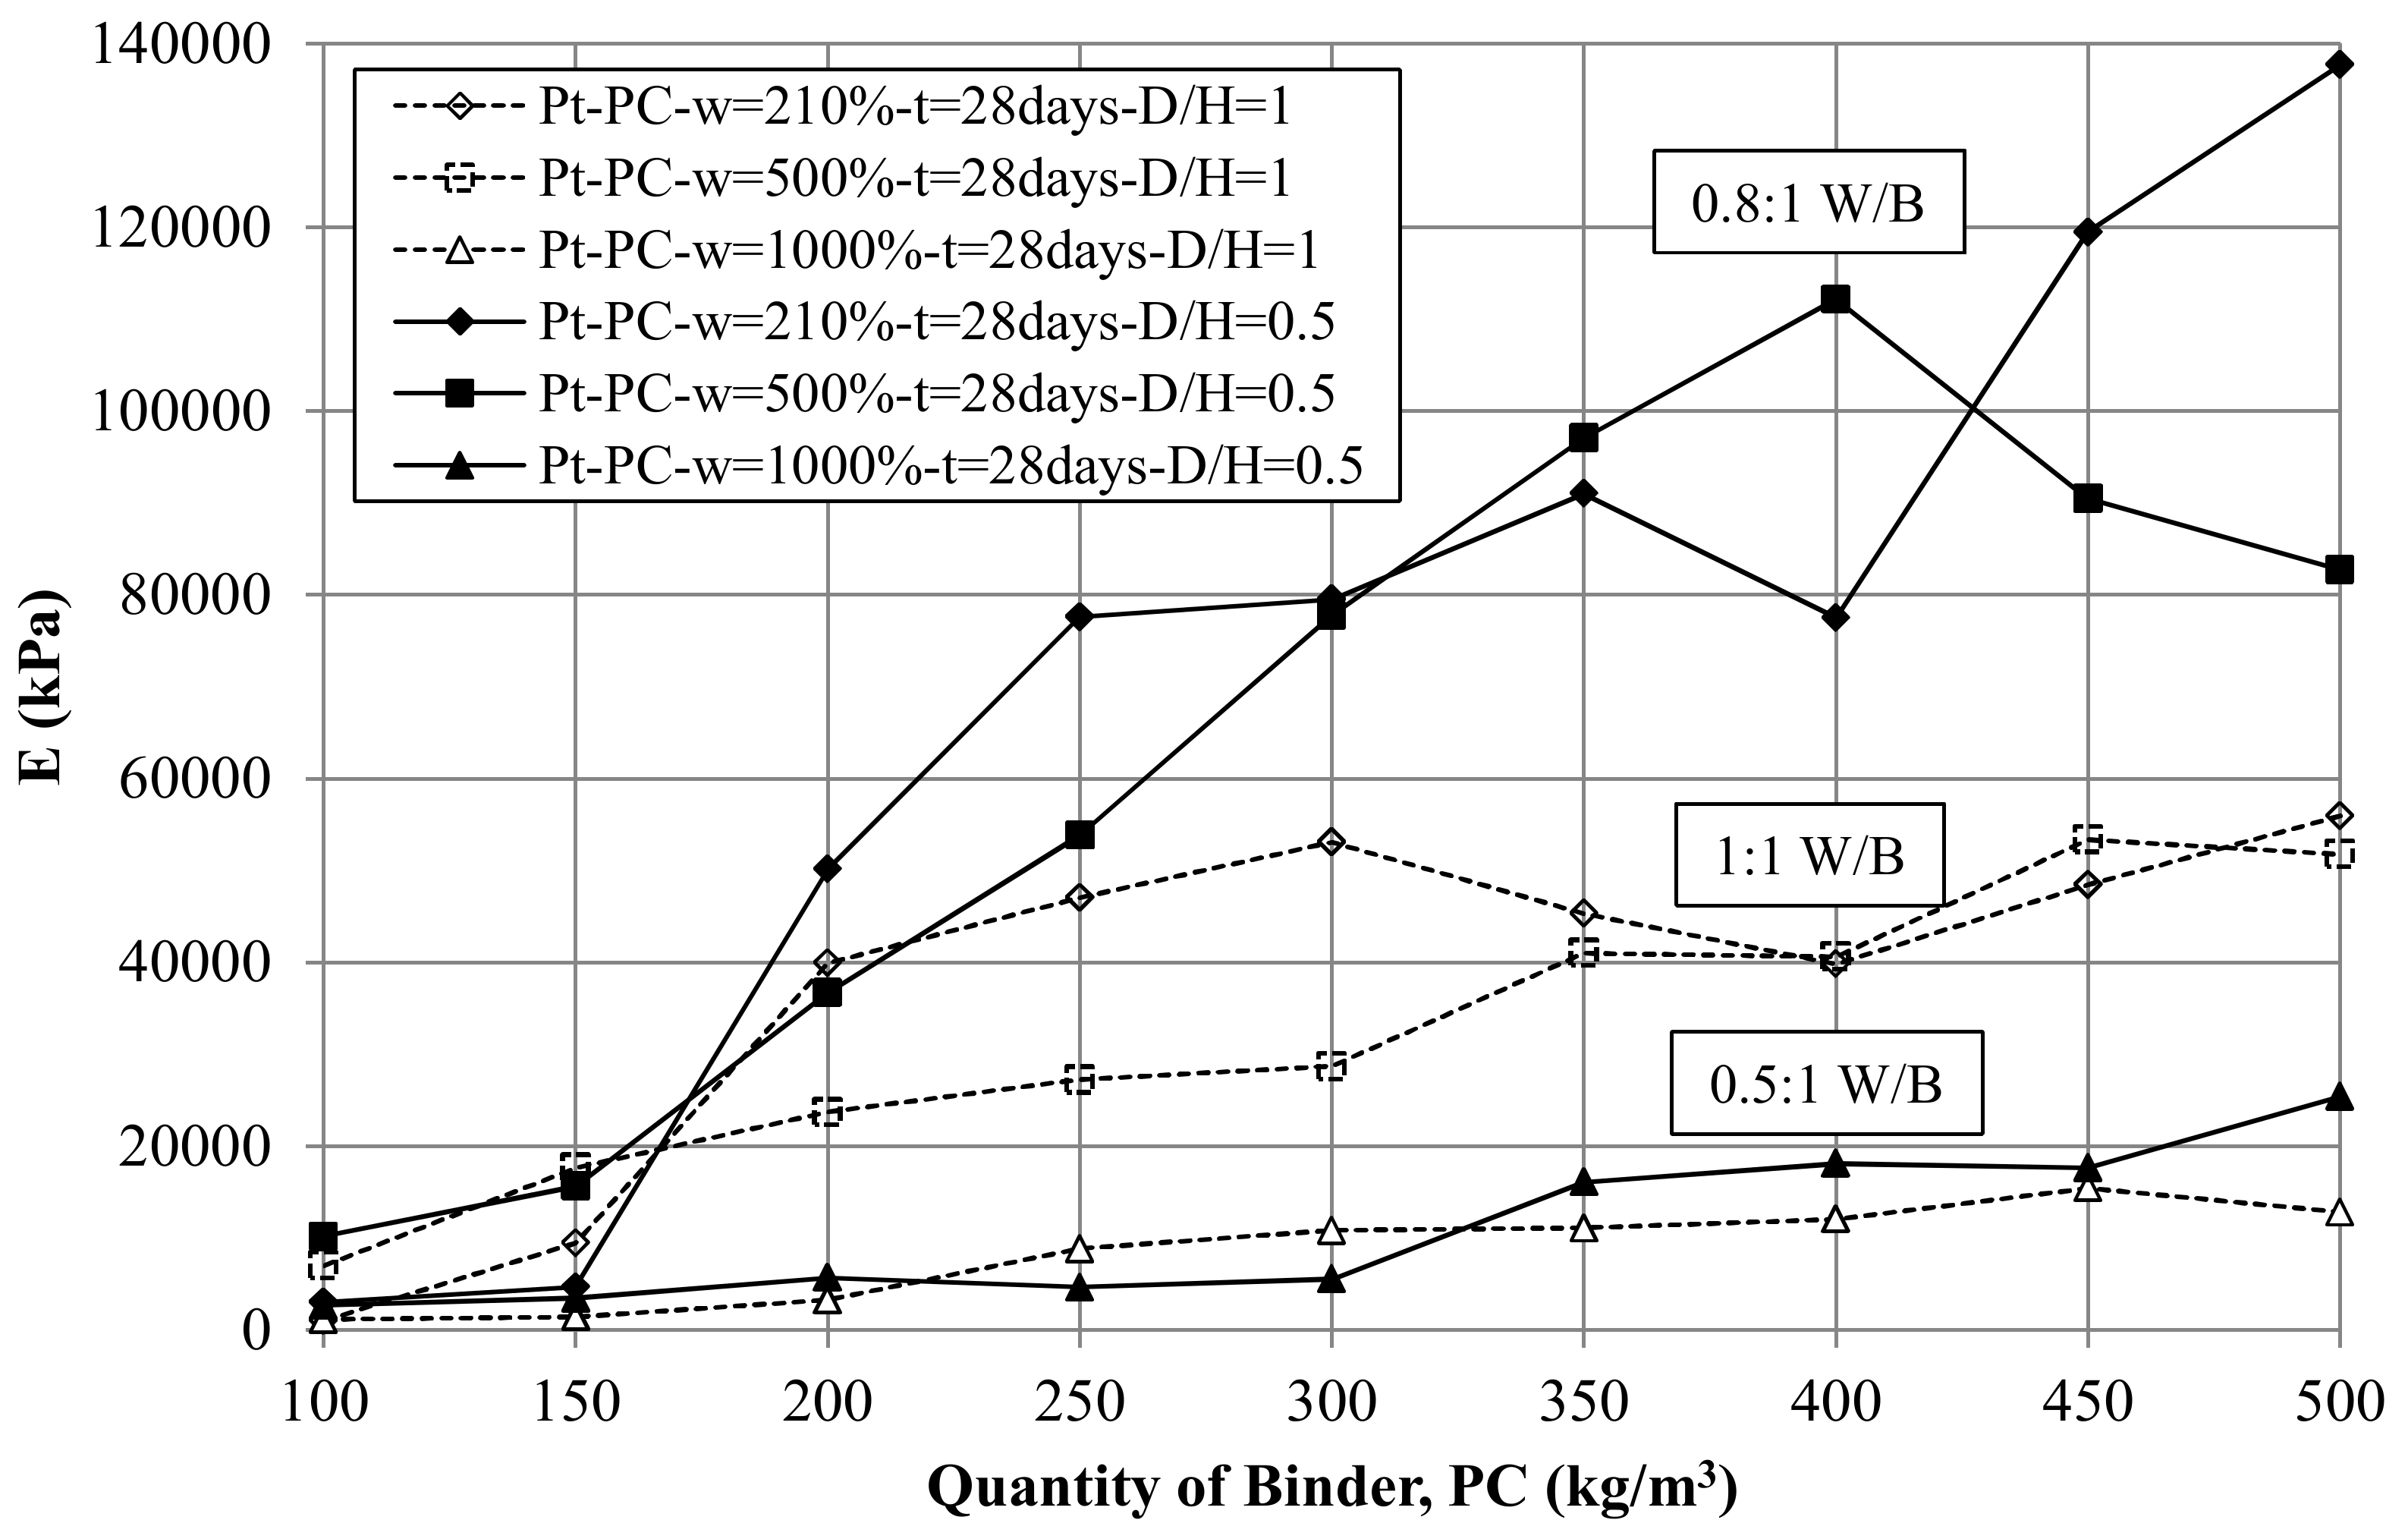
8.2. Effect of Binder Quantity on E and UCS

Figure 10 presents the unconfined elastic tangent modulus (E) obtained from the stress–strain curves for the cement-treated peat at 28 days. For all stabilized PC-peat specimens, it can be assumed that the larger the quantity of cement, the stiffer the material. However, this is not always the case; for instance, the stiffness of the peat at w = 210% with quantities of cement of 350 kg/m3 and 400 kg/m3 is shown to be more deformable than the remaining mixes with the same initial water content, which contain larger quantities of cement. The stiffness for the peat at w = 500% also shows a linear increase with larger quantities of cement, although a decrease also occurs for quantities of cement above 400 kg/m3. The stiffness for the peat at w = 1000% indicates a linear increase with larger quantities of binder (QB). From Figure 10, it can also be observed that the effect of the size of the specimen on stiffness shows a clear trend, where the E values obtained in 50 mm × 100 mm specimens are larger than those of 100 mm × 100 mm; however, this is not true for all-natural water content variations. Thus, the stabilization of peat with cement is directly linked to two variables, water content and quantity of binder. Generally, the higher the water content, the more deformable the material is, and the higher the QB is, the stiffer the material becomes. Care should be taken in choosing stiffness values in terms of specimen size, since stiffness values depend on this.
Figure 11 presents the UCS values of cement-treated peat at 28 days. Results show in general that the higher the quantity of PC added, the higher the UCS values. However, the results of the peat at 210% of w show a notable decrease in UCS for PC quantities greater than 300 kg/m3. This is related to the high water content used in the binder (W/B-PC of 1:1). Hence, it appears that a 1:1 W/B-PC ratio is unsuitable for mixes with higher quantities of cement, above 300 kg/m3. This is confirmed by the results shown in Figure 11 corresponding to peats with w = 500% in which the W/B-PC ratio considered was decreased from 1:1 to 0.8:1 for a cement content up to 250 kg/m3 PC, resulting in higher strength. This indicates that the W/B ratio plays an important role in the stabilization of the peat. For the peat with w = 1000%, the W/B-PC was decreased further to 0.5:1, which proved to be effective in producing a continual increase in UCS with higher quantities of PC. However, the strength obtained for this condition was always lower, approximately up to 3 times lower than the peat with w = 210%. This is a result of the significantly higher water content in the peat–cement mixes with w = 1000%. In addition, these samples continued to suffer some degree of bleeding and settlement of solid particles [48].
Trends for the E and UCS shown in Figure 10 and Figure 11, respectively, are similar in that the larger the BC, the stiffer and stronger the stabilized material is. Additionally, the higher the initial water content in the peat–PC mix, the more deformable and weaker the stabilized material becomes. From the results discussed from Figure 10 and Figure 11, it can be concluded that in Pt-PC mixes, a reduction in the W/B ratio for quantities of cement larger than 300 kg/m3 is recommended. In an attempt to compare the influence of the w% in peats, it is only feasible to compare those with the same W/B ratio; hence, a comparison can be made between the 210% and 500% of w% peats for a cement content between 100 and 250 kg/m3 in Figure 11. The results show that the two sets of UCS values are almost similar. Nevertheless, higher strength is achieved for the samples in which the w = 210% is smaller. This indicates that the initial water content of the peat has an influence on the UCS of the mix at 28 days. With regard to the specimen size, Figure 10 and Figure 11 show similar values and trends for E and UCS, respectively.

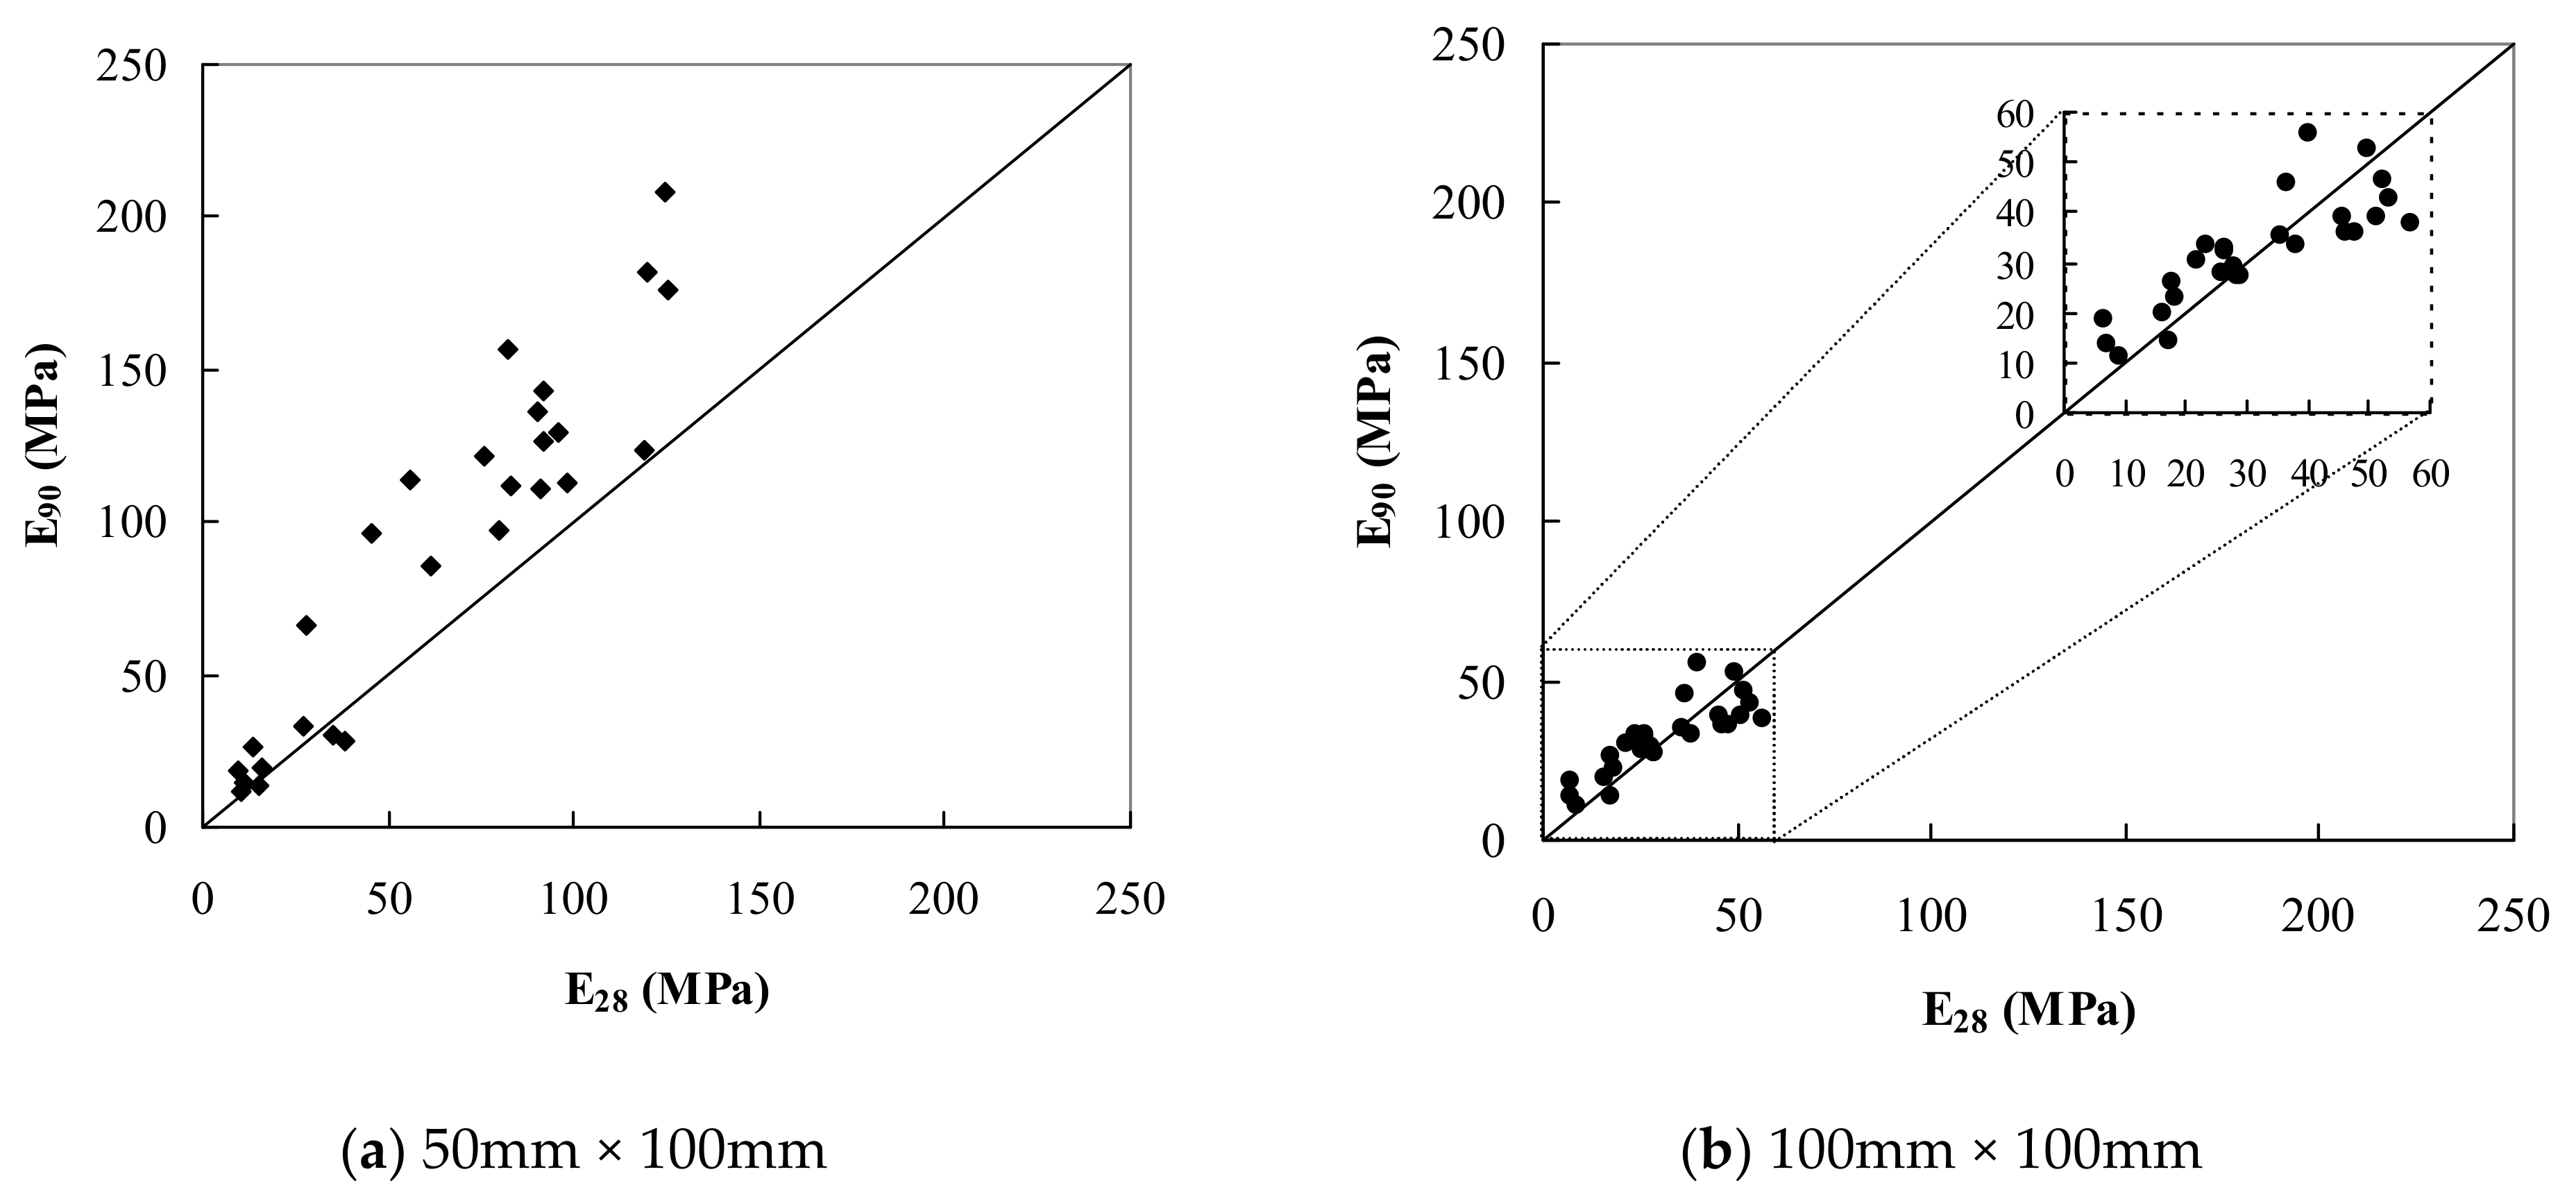
8.3. Effect of Curing Time on E and UCS

The effect of curing time on stiffness and strength is presented in Figure 12 and Figure 13, respectively. Figure 12 shows Pt-PC stabilized specimens with w = 500% tested at 28 days and 90 days of curing time, indicating higher E values at 90 days than those tested at 28 days, which would show consistent results when assessing the effect of strength as well (Figure 13). There is a clear indication that the stiffness obtained for E values below 20 MPa of both specimen sizes of 50 mm × 100 mm and 100 mm × 100 mm are similar at 28 days and 90 days, but once E values reach above 40 MPa, the 50 mm × 100 mm sized specimens’ stiffness values are about 50% greater than those calculated for the specimens of 100 mm × 100 mm in size. This trend is not the same for the larger specimens since the stiffness values are rather similar at 28 days and 90 days. Figure 13 shows the results of Pt soils with w = 500% at 28 days and 90 days of curing time. Results indicate that the UCS at 90 days is slightly higher than at 28 days. Hence, it is clear that most of the strength development of the peat–cement mixes took place within the first 28 days.

8.4. Effect of Binder Type E and UCS

Figure 14a,d,c,f show the 28-day, 60-day and 90-day E and UCS values for the stabilized Pt and OH-2 clay, respectively, whereas Figure 14b,e shows the 28-day, 90-day and 180-day E and UCS results for the OH-1 clay. These results show the wide range of E and UCS obtained for the three different organic soils and for the five different binders used. The highest E and UCS for the peat were achieved using PC. A similar finding was reported in [56,60,61,62]. On the other hand, as the organic content decreased and the clay content increased in the organic soil, shown in Figure 14a–c and Figure 14d–f, the best results were obtained with a PC-GGBS binder mix which agrees with previous findings [17,25,63,64]. This is related to the interaction between the glassy particles of the ground granulated blast furnace slag and the clay, which induces a better hydration process. Additionally, it is observed that PC alone is still relatively effective for the peat and two organic clays. It is clear that regardless of the organic content of the soil, the UCS development using PC-PFA and PC-PFA-L was quite low, although the best results were obtained for the peat. Similarly, other studies have shown a gain in the strength of peat stabilized using PFA and lime [65,66,67].
The results shown in Figure 14 generally indicate an increase in E and UCS with time, although this change is small for mixes containing PFA, which agrees well with the results reported by Åhnberg et al. (2003) [55] who reported only a small variation of UCS with time with admixtures containing PFA in the stabilization of two clays and one organic clay. The UCS of treated Pt, OH-1 and OH-2 containing PC alone increased by around 30%, 13% and 50% from 28 days to 90 days, respectively. These increases are similar to those reported by Hebib and Farrell (2003) [60], where a considerable increase in strength of around 30% from 28 days to 90 days for cement-stabilized Ballydermot peat is obtained. These findings, however, are the opposite to the data reported in EuroSoilStab (2001) [17], where a slight or non-existent increase in strength with time of cement-treated peat is presented. Using PC-GGBS in the three stabilized organic soils, generally an increase of around 20% was obtained from 28 days to 90 days. With the same admixture, a larger strength increase of 40% is reported by EuroSoilStab (2001) [17] in stabilized peat.
Results of the L-G-GGBS mix for both the Pt and OH-1 clay are unique, as the UCS value significantly increased with time from the very low values at 28 days, probably attributed to the slow rate of hydration of GGBS by the presence of lime and gypsum. For the OH-2 clay, however, the L-G-GGBS binder mix resulted in the highest UCS value at 28 days compared to the other two soils (Pt and OH-1), but it did not show any development over time. This may be related to two causes: (i) the presence of a high kaolin content in the low-organic clay soil, which has been directly linked to a detrimental effect when mixed with lime [68] and (ii) the occurrence of sulphate attack due to the presence of gypsum, which allows the development of expansive products, such as ettringite, that induce crack formation, initiating failure planes in the specimens.

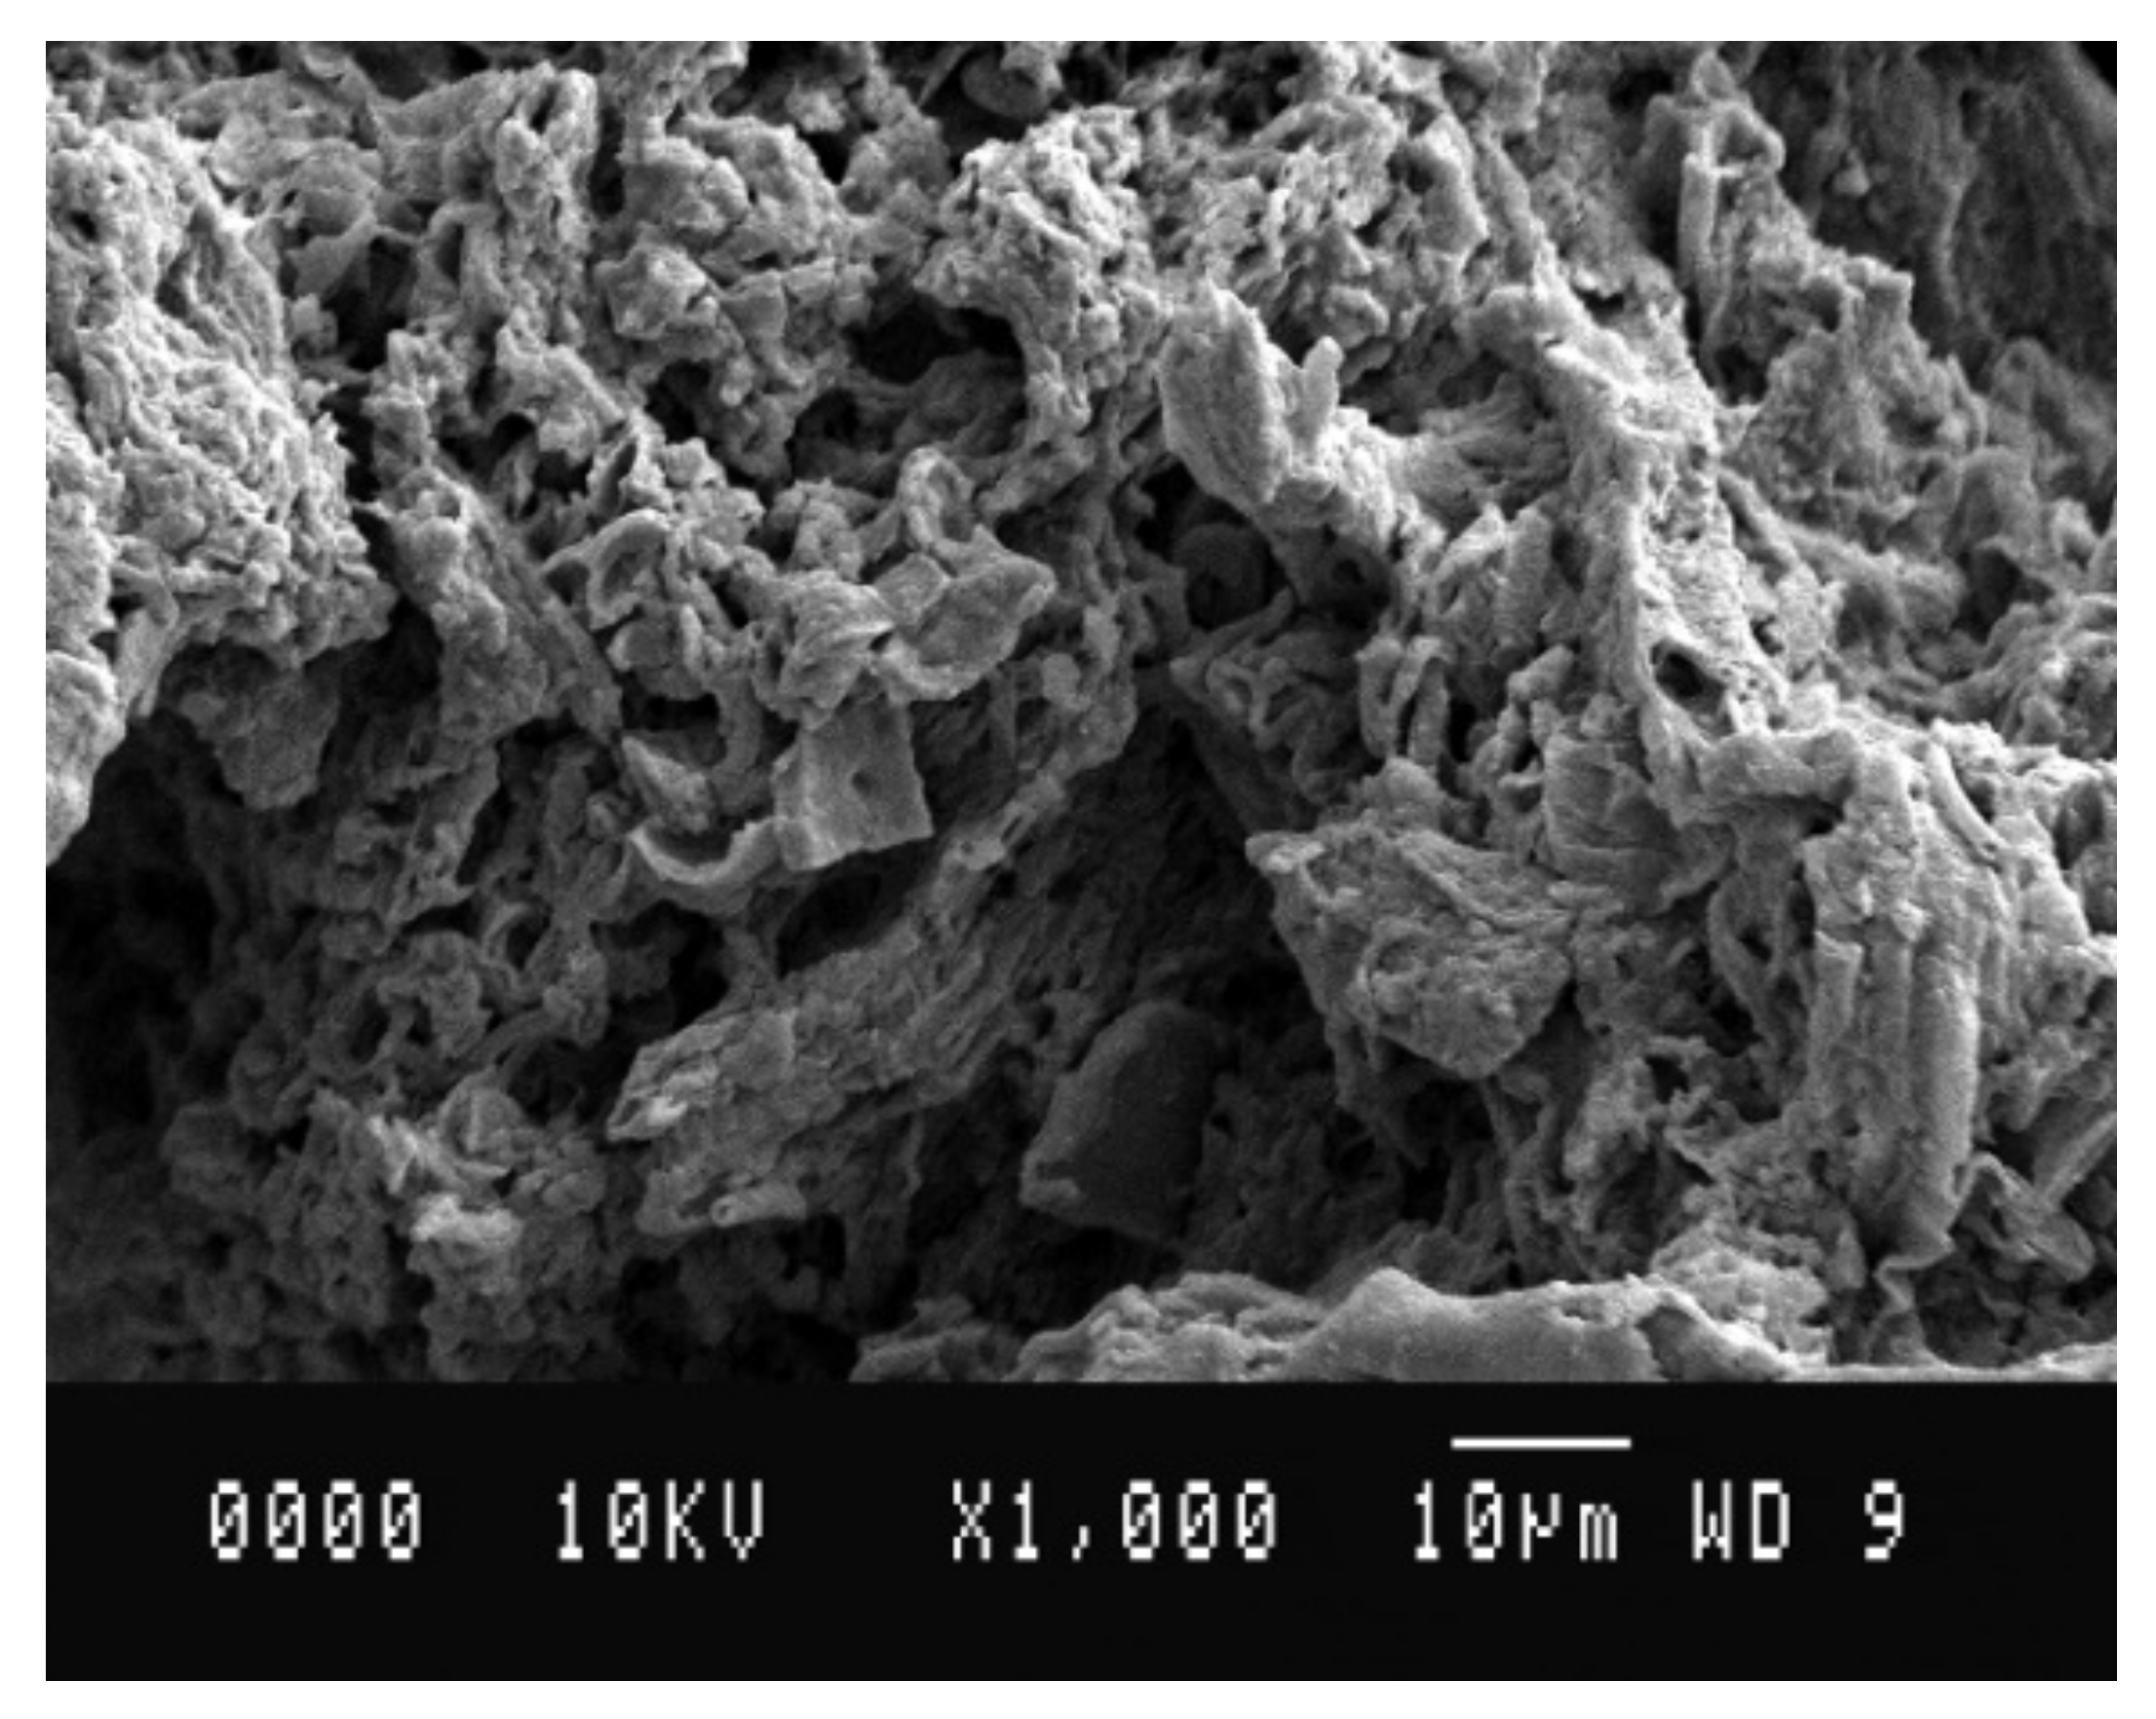
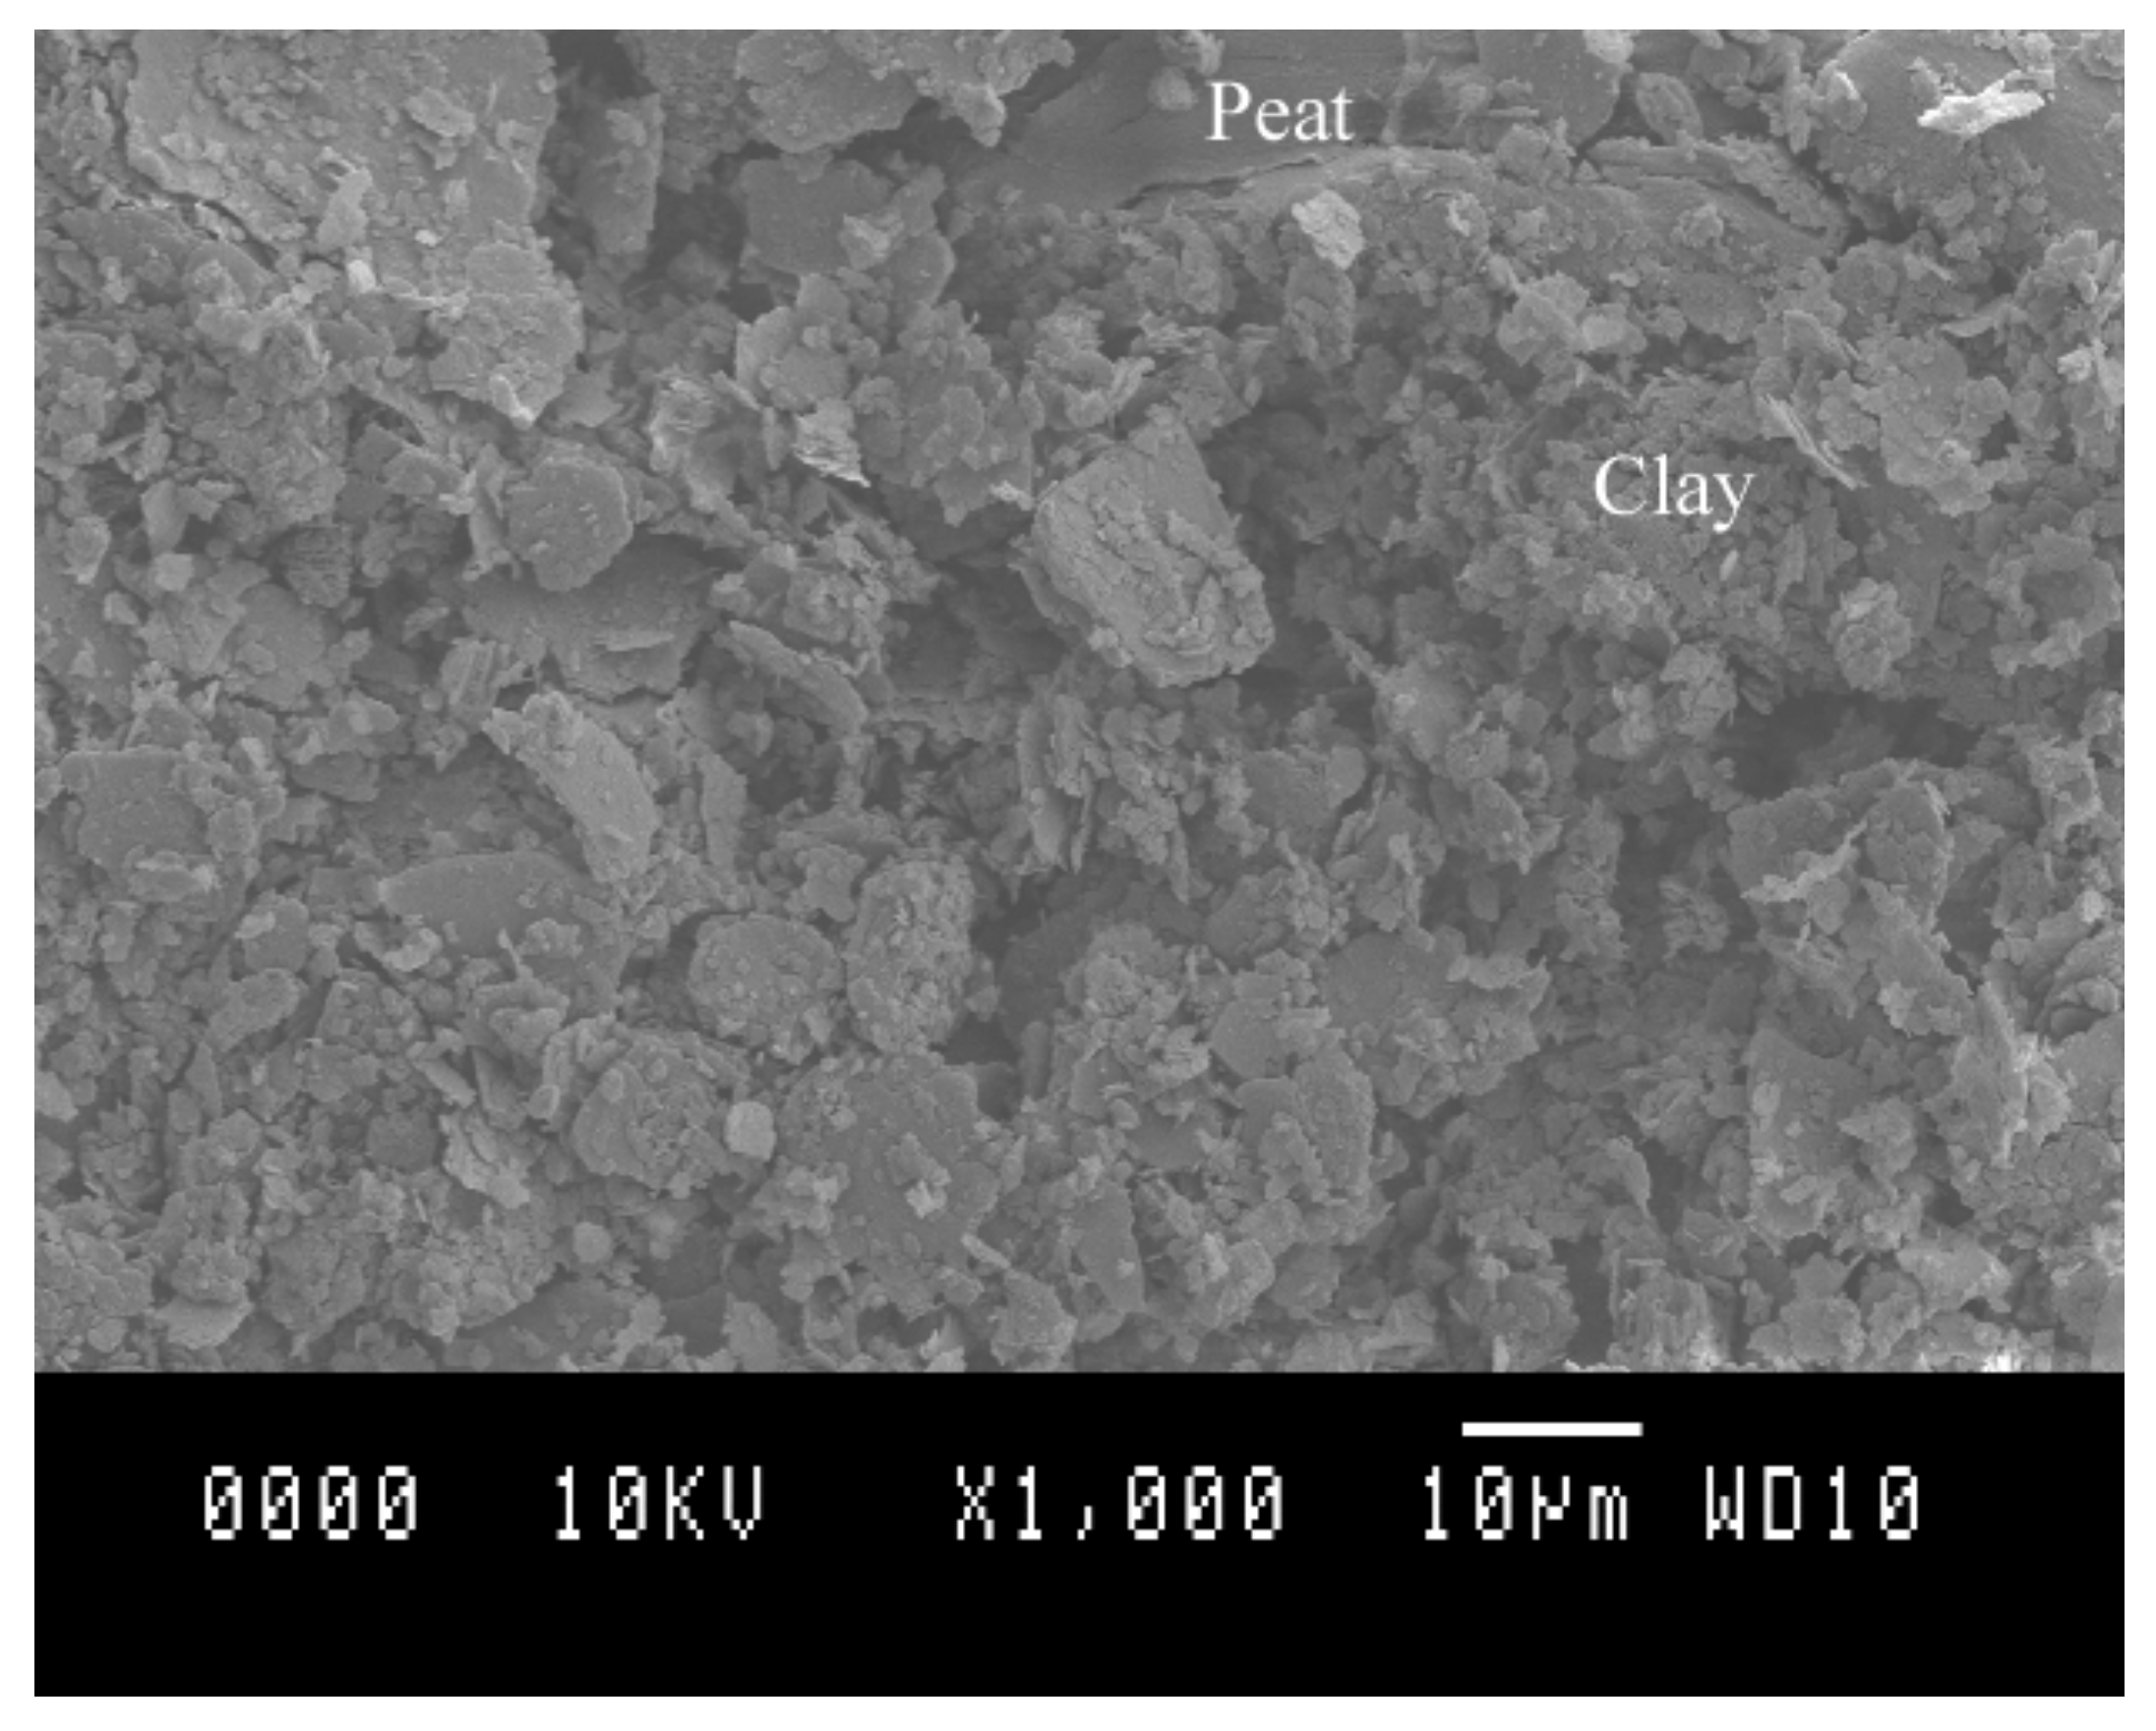
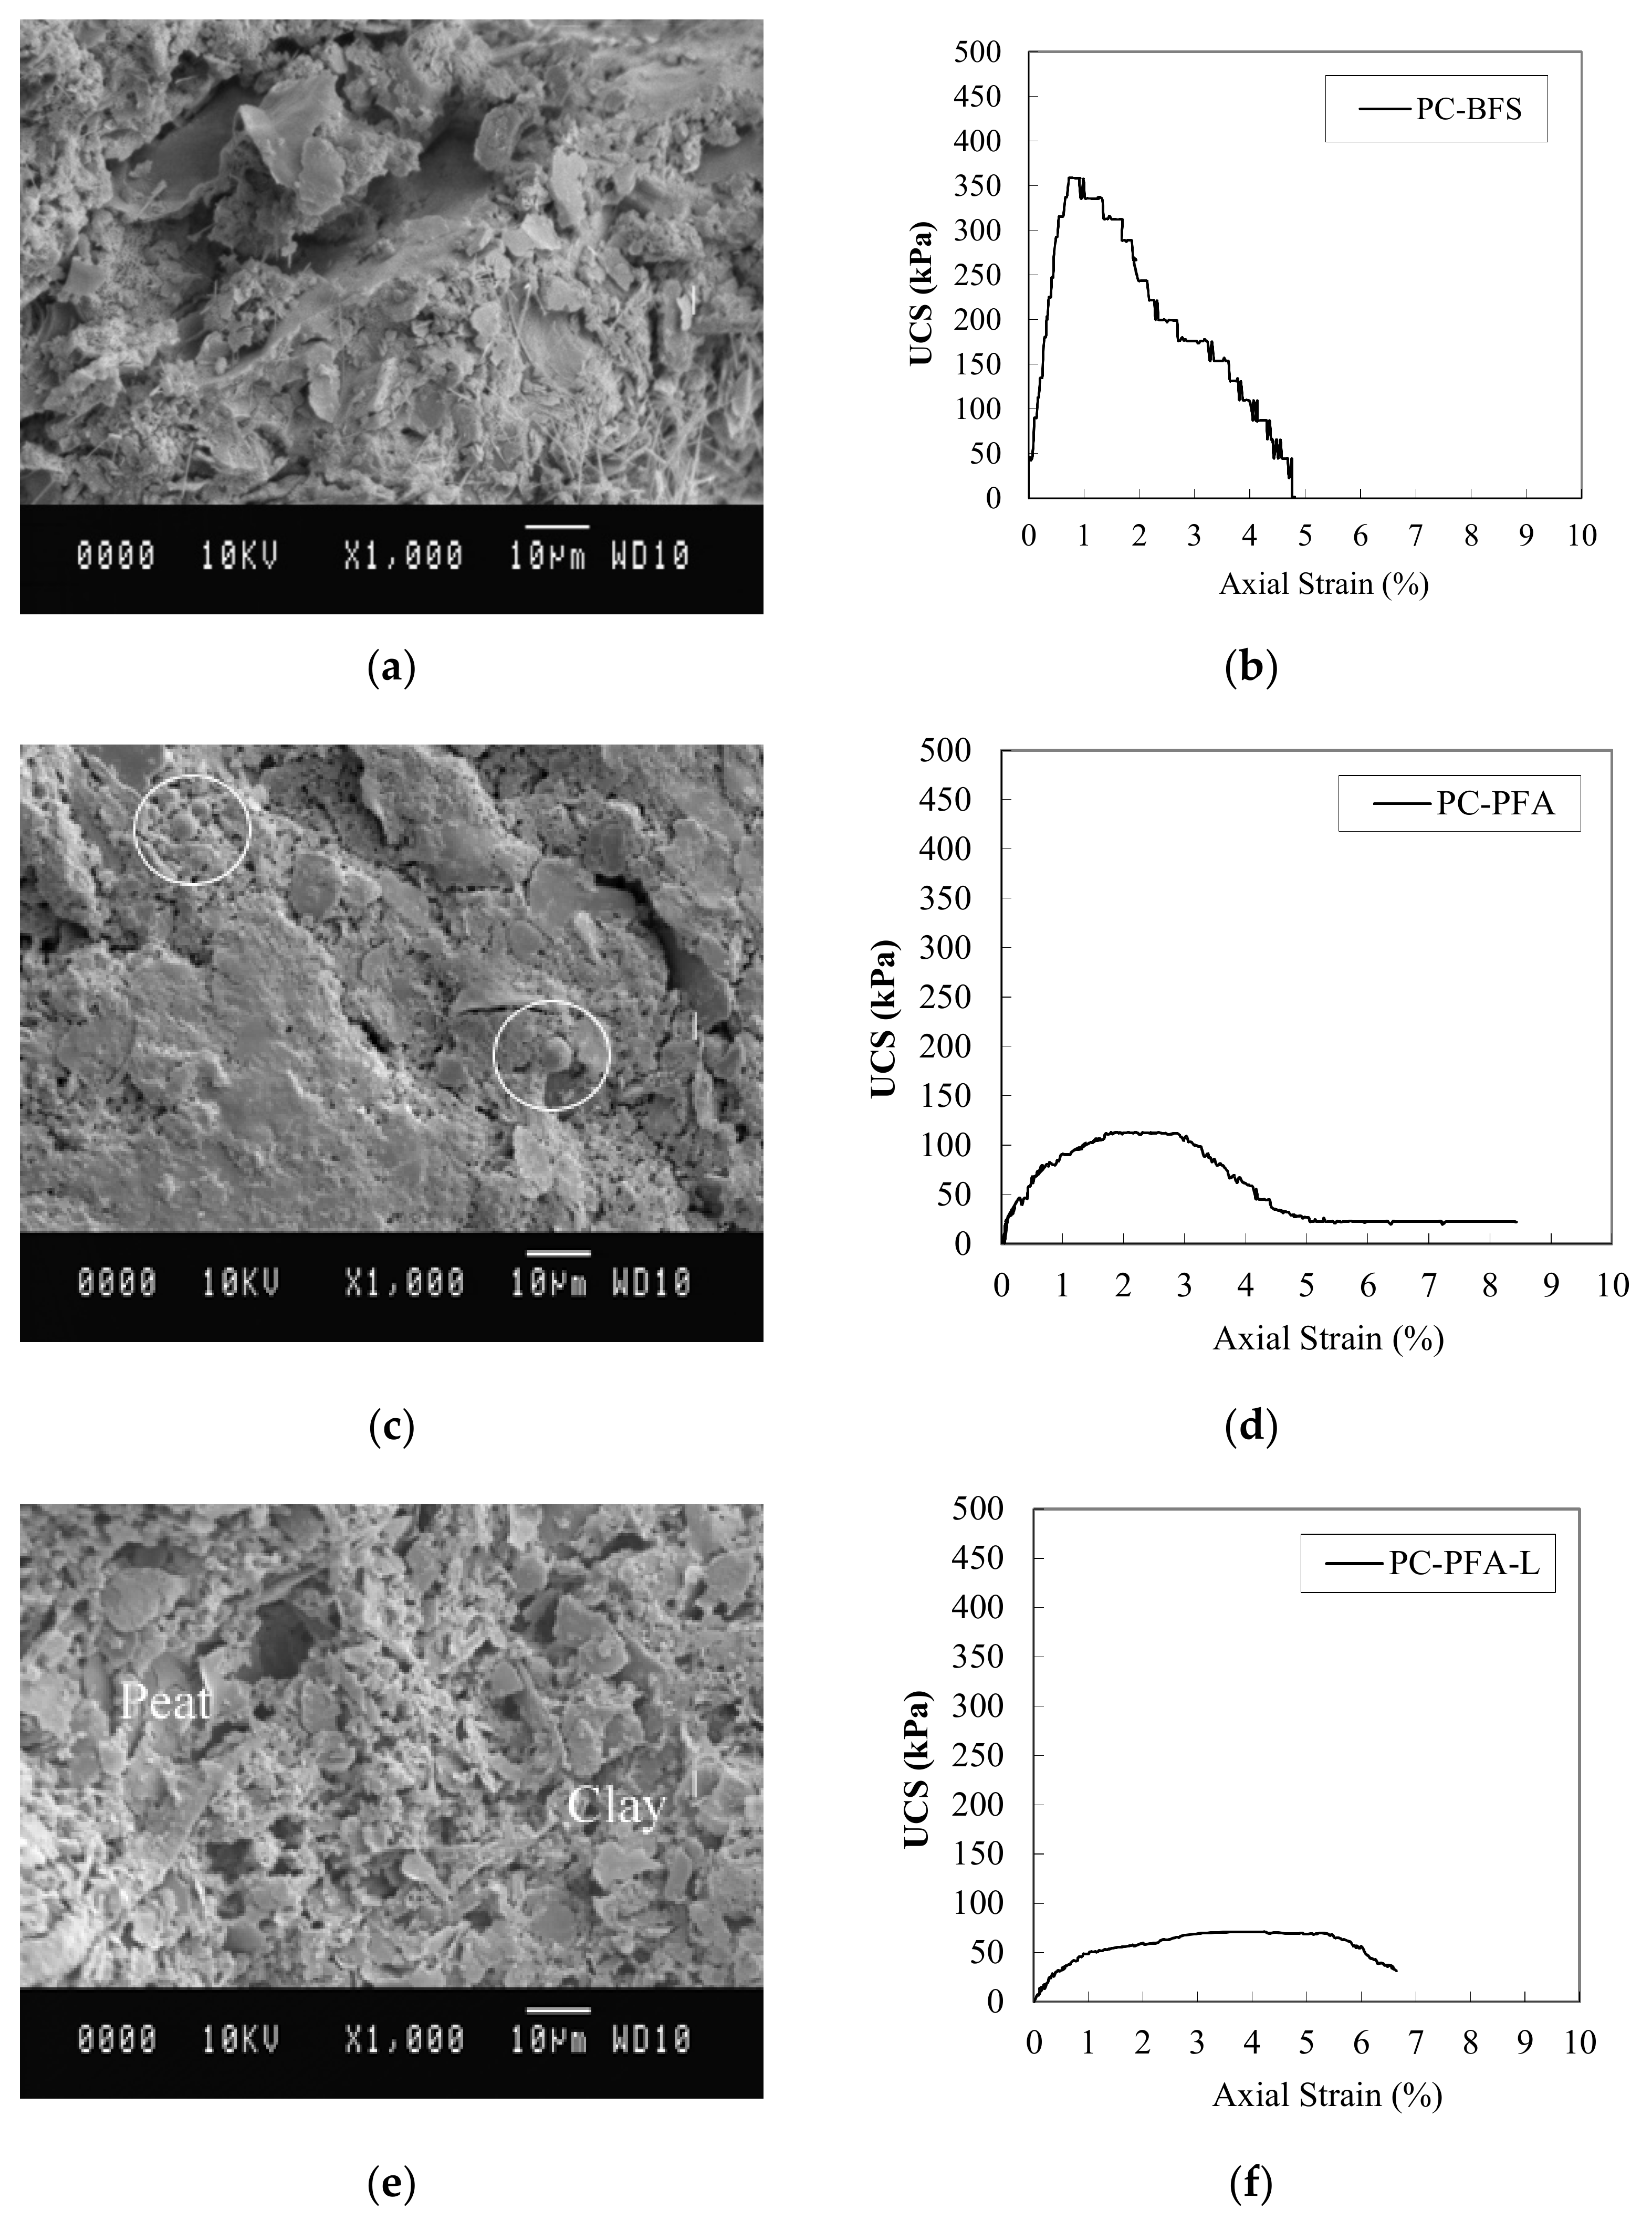
8.5. Scanning Electron Microscopy (SEM)

This section introduces a qualitative discussion about the microstructure of a subset of soils included in the database presented in this paper by the use of SEM imaging. The aim is to complement the statistical description of the experimental design and to further provide an extended basis for the interpretation of the machine learning modelling of Part II of this work, by providing a qualitative perspective on the baseline given by the imaging of unstabilized soils with respect to variations of stabilized soils, particularly due to hydration product development. This also opens the possibility for further artificial intelligence and machine learning analysis beyond the scope of this work.

8.6. Unstabilized Soils

Figure 15, Figure 16 and Figure 17 show the SEM images of the Irish moss peat (Pt), medium organic clay soil (OH-1) and low-organic clay soil (OH-2), respectively. Figure 15 shows a SEM microimage of the Pt soil under study. Wrinkled fibrous structures and long flat particles, characteristic of peat, are observed. From this figure, it can be observed that there is a significant presence of voids which can be directly related to the inherent high compressibility characteristic of the peat.
Figure 16 shows a typical micrograph of the medium-clay soil (OH-1). The image clearly shows the peat and clay particles present in the mix. The hollow structure peat and the flake-like clay structures are clearly distinguishable. Owing to the difference in particle size between the clay and the peat, the mix itself looks heterogeneous.
A microstructure of the low-organic clay soil (OH-2) is presented in Figure 17 in which the flaky clay particles are clearly identified. Clay particles, which vary in size from 1 µm (0.001 mm) to 30 µm, are expected to be beneficial in achieving a better mix in comparison with the other two unstabilized materials. Although this material only contains 10% peat, peat particles can still be observed in the microimages, as shown in the figure.

8.7. Stabilized Soils
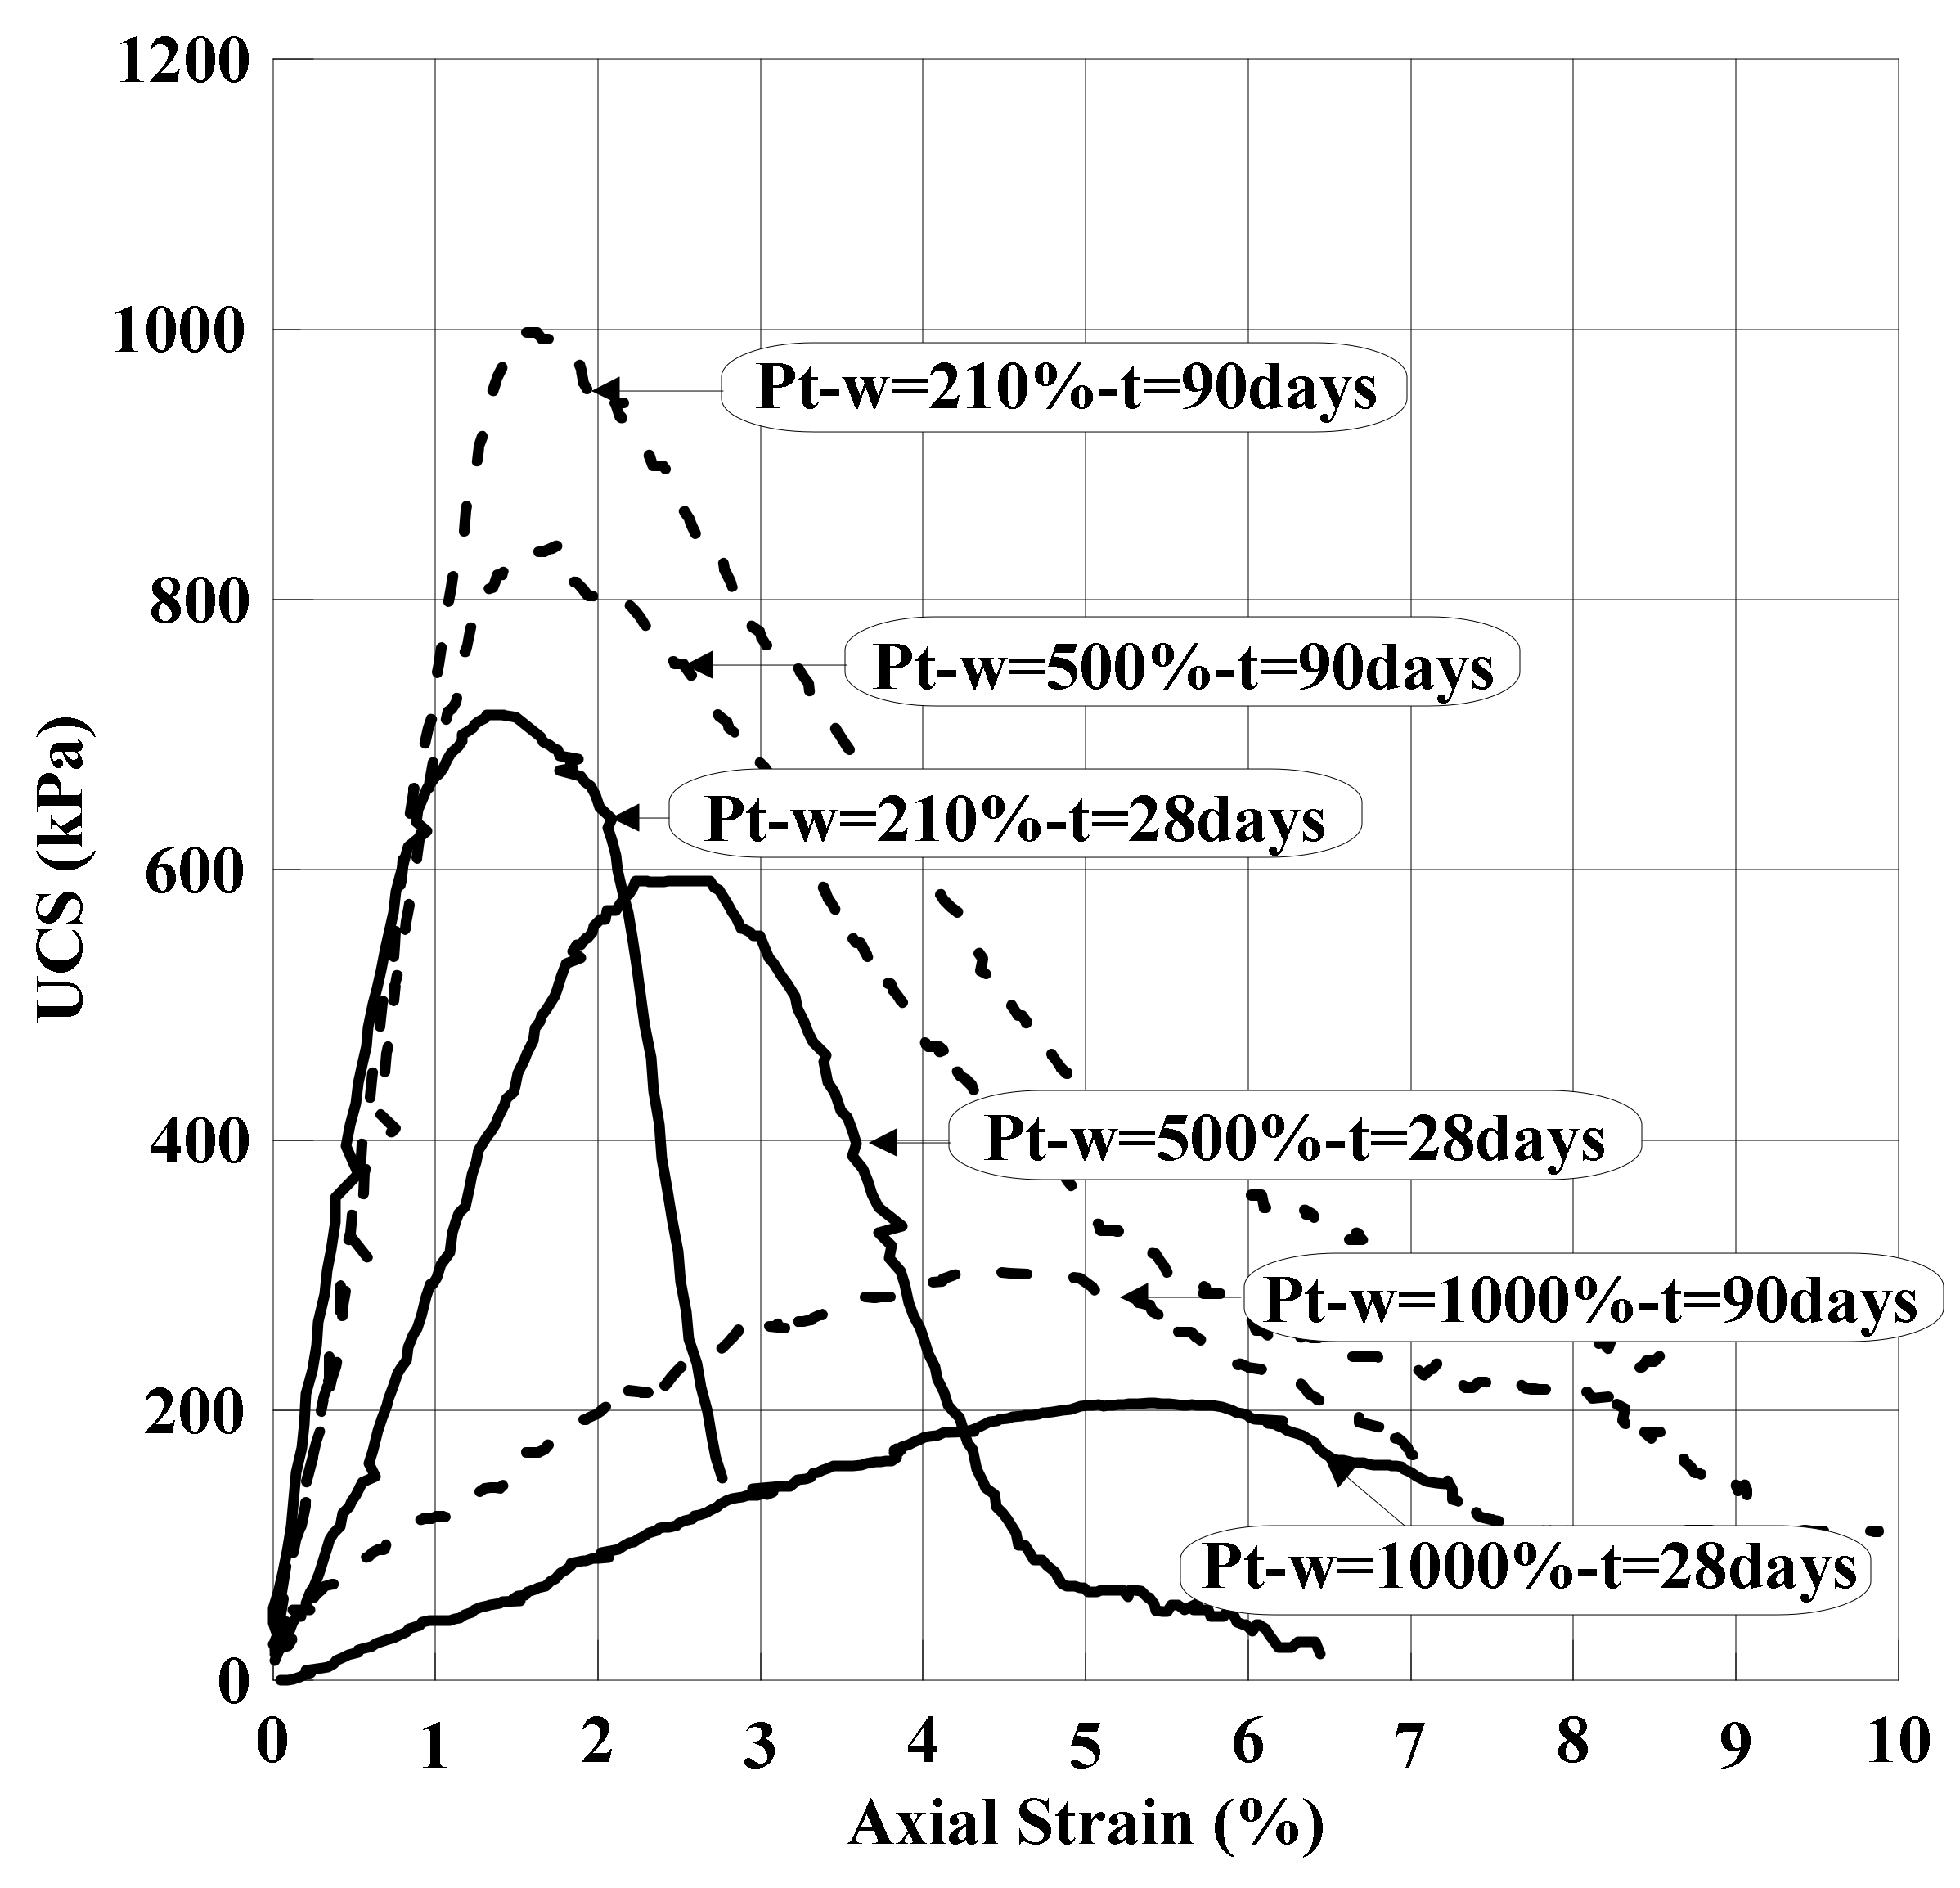
The use of SEM has been beneficial in improving the understanding of the hydration process of PC [48,69], since it provides visual micro-characteristics of the hydration products resulting from the application of different cementitious binders, and it demonstrates how hydration products develop over time. The micro-images also provide an indication of the porosity and degree of homogeneity of the hydration products within the mix. Typical SEM micrographs of all the mixes are presented below. All the micrographs have a magnification of 1000th order.

8.8. Pt-PC Mix

Figure 18a–d show the Pt-PC mix after 28 days and 90 days of curing, for the Pt at w = 500%, respectively. The former image shows the main hydration product to be the minute needle-shaped ettringite crystals (calcium sulphoaluminate). The abundance of ettringite around the peat particles is also clear. The limited development of the calcium silicate hydrate (C-S-H) gel is clear in the Pt-PC mix during the early period of curing. An important observation is the poor development of ettringite around the small wood fibre shown inside the circle mark. This is evidence of the influence of some organic matter on the enhancement of strength. Figure 18c, on the other hand, shows a denser area of mainly C-S-H gel, although some crystals of ettringite (inside the circle mark) are still visible. The denser the area is, the stronger the material becomes, as observed in Figure 18b,d, in which a strength increase from about 600 kPa to 850 kPa is shown. This can be linked to the development of hydration products filling voids throughout all specimens and producing a more compact material.

8.9. OH1-Binder Mixes

Figure 19a–c show SEM micro-images of OH-1-PC-BFS, OH-1-PC-PFA and OH-1-PFA-L mixes at 28 days of curing. Each image is accompanied with its corresponding stress–strain curve. Figure 19a shows the typical hydration products developed in the presence of BFS, i.e., calcium sulphoaluminate (ettringite) in the lower right corner. One can also observe flattened clay particles together with fibrous Pt particles. Note that the peat particles show an absence of hydration products within the soil’s structure; however, some areas are totally filled with developed hydration products. Based on UCS results in Figure 14, this mix has high stiffness and strength as compared with the others. This can be linked to the fact that, generally, a more compacted material is obtained, as the image clearly shows.
It is well known that strength development in fly ash concretes occurs at a slower rate than in Portland cement concretes. Figure 19b shows an OH-1-PC-PFA mix after 28 days of curing. The presence of partially reacted or unreacted PFA particles by their distinctive spheroidal shape is clearly observed in the circled regions in the image. The presence of the C-S-H gel is also clear, and it is also noticeable that although some dense areas are present, large void areas are distinguishable. This effect is linked to the low strength obtained as indicated in the stress–strain curve. Figure 19c shows a SEM image of OH-1-PC-PFA-L mixes at 28 days. From this image, no reaction hydration products are observed that may suggest the presence of unbounded clay and Pt particles. This poor reaction observed via the large voids, the lack of uniform development of C-S-H gel and the lack of hydration products can, therefore, be associated with the poor strength performance, as corroborated by the corresponding stress–strain curve.
The SEM image of the OH-1-PC-PFA-MgO mixture at 28 days is shown in Figure 20a. There appears to be a low level of binding among particles and no signs of hydration products at all. This suggests that the poor gain in strength observed is due to the lack of reaction between binder constituents and Pt and OH-1 clay. Therefore, the low strength obtained is due to the poor development of the typical hydration products and to the significant presence of voids.
A typical SEM micrograph of specimens of the OH-1-L-G-BFS mix at 28 days of curing is shown in Figure 20b. The figure shows a large presence of plate-shaped calcium hydroxide crystals. The SEM micrograph of this mix shows fewer voids and denser zones in comparison with those shown in the previous images of the other binder mixes (Figure 19c and Figure 20a), but the performance in terms of UCS is still poor, as observed in the stress–strain curves. This may indicate that calcium hydroxide crystals, as presented in this mix, are weaker than calcium sulphoaluminate products developed in other mixes. This, however, needs to be confirmed with further studies.
From Figure 19 and Figure 20, it can be concluded that the strength gains of the mixtures increased due to two principal causes: (i) the growth of hydration products, such as needle-like ettringite (calcium sulphoaluminate) crystals in the voids and (ii) the development of hydrated products, such as C-S-H gel and calcium hydroxide crystals, joining the particles of the agents with the Pt and OH-1 clay. On the contrary, two main causes can be linked to the poor strength gain: (i) the deficient development of the hydration products due to the wood or less decomposed particles within the Pt and OH-1, and (ii) the high porosity observed in the Pt-OH-1–cementitious admixture mixes.

9. Conclusions

Part I of this work set the basis for a parametric analysis and machine learning modelling presented in Part II of this work. In this paper (Part I), the authors examined the effect of variables on the strength and stiffness of three stabilized organic soils. The studied variables are specimen size, soil type, organic content, initial natural water content, binder type, binder quantity, grout to soil ratio, curing time, curing temperature, curing relative humidity and carbon dioxide content. This work included a descriptive statistics analysis focusing on the effects produced by binder type, quantity of binder, specimen size and the effect of curing time on the soils’ strength and stiffness.
It was found that the higher quantity of binder produces a higher strength in all three soils. On the other hand, the higher the initial moisture content present in the soil, the lower the strength achieved. For peat stabilized with Portland cement (PC), it was shown that the water: binder ratio in the mix can notably affect the UCS values for W/B-PC ratios of 0.5:1 to 1:1. Based on these results, it is reasonable to recommend a 1:1 water/binder ratio for mixes that contain quantities of cement up to 300 kg/m3. Consequently, a reduction to 0.8:1 and 0.5:1 can be suitable for quantities of cement above this value. It was also found for peat stabilized with PC that the UCS was independent of the size of the sample tested. At the same time, specimens of different sizes, 50 mm × 100 mm and 100 mm × 100 mm diameter/height, demonstrated a difference in the value of the initial unconfined tangent modulus. During the stabilization of the three types of organic soils, it was found for all cases that the PC alone and the PC-BFS mix resulted in the highest UCS and highest elastic modulus values. The Pt-L-G-BFS mix generally provided better results than the Pt-PC-BFS, Pt-PC-PFA and Pt-PC-PFA-L mixes, although the improvement occurred at the later stages of curing. The Pt-PC-PFA-MgO mix demonstrated the lowest values for strength and stiffness. For the peat, the values of strength increased with curing time, and the stiffness varied with curing time. The effect of curing time is more pronounced for PC and L-G-BFS mixes.
SEM observations helped us to better understand the relative hydration processes of the mixtures over time and their linkage with the strength development. Observations are in line with the results obtained during statistical analysis. The gain in strength and stiffness is linked to the development of hydration products. The development of ettringites and C-H-S is more prominent in the PC mixtures in comparison to binders with L and MgO.
When using the wet soil mixing method (WSMM), the selection of the binder type and quantity has a significant impact of the organic soil’s stabilization. Therefore, careful considerations need to be made in order to maximize soil stabilization outcome. The amount of binder can be selected depending on the application.
A final conclusion about this work is that no artificial intelligence or machine learning modelling should be conducted unless the datasets of interest are properly described statistically.

Author Contributions

Conceptualization, F.G.H.-M., A.A.-T. and Z.M.-C.; Data curation, N.Y.; Formal analysis, F.G.H.-M., Z.M.-C. and N.Y.; Funding acquisition, A.A.-T. and Z.M.-C.; Investigation, F.G.H.-M., Z.M.-C. and N.Y.; Methodology, F.G.H.-M., A.A.-T. and Z.M.-C.; Project administration, A.A.-T.; Resources, A.A.-T. and Z.M.-C.; Supervision, A.A.-T. and Z.M.-C.; Validation, F.G.H.-M., Z.M.-C. and N.Y.; Writing—original draft, F.G.H.-M.; Writing—review & editing, F.G.H.-M., A.A.-T., Z.M.-C. and N.Y. All authors have read and agreed to the published version of the manuscript.

Funding

This research was supported by the Zachry Career Development Professorship II awarded to Zenon Medina-Cetina at Texas A&M University.

Institutional Review Board Statement

Saudi Aramco approval number 21-Q1-687.

Informed Consent Statement

Not applicable.

Data Availability Statement

All the data and models, including codes and results have been made available through the Texas Data Repository at https://dataverse.tdl.org/dataverse/SGL-Geosciences-MDPI/ (accessed on 1 June 2021).

Acknowledgments

The first author would like to acknowledge the financial support given by the Gates Cambridge Trust and the National Council of Science and Technology, CONACYT (Mexico). Particular thanks are due to David Vowles, Chris Collison, Pat Goldthorp and Frank Sixsmith for their technical assistance.

Conflicts of Interest

The authors declare no conflict of interest.

References

  1. Rahgozar, M.A.; Saberian, M. Geotechnical Properties of peat soil stabilised with shredded waste tyre chips. Mires Peat 2016, 18, 1–13. [Google Scholar] [CrossRef]
  2. Hernandez-Martinez, F.G. Ground Improvement of Organics Soils using Wet Deep Soil Mixing. Ph.D. Thesis, University of Cambridge, Cambridge, UK, 2006. [Google Scholar]
  3. Hampton, M.B.; Edil, T. Strength Gain of Organic Ground with Cement-Type Binders; Geotechnical Special Publication: Reston, VA, USA, 1998; pp. 135–148. [Google Scholar]
  4. Åhnberg, H.; Bengtsson, P.E.; Holm, G. Effect of initial loading on the strength of stabilised peat. Proc. Inst. Civil Eng. Improv. 2001, 5, 35–40. [Google Scholar] [CrossRef]
  5. DGSSS; EuroSoilStab. Design Guide: Soft Soil Stabilisation. Development of Design and Construction Methods to Stabilize Soft Organic Soils; Building Research Establishment: Watford, UK, 2001. [Google Scholar]
  6. Jelisic, N.; Leppänen, M. Mass Stabilization of Organic Soils and Soft Clay. In Grouting and Ground Treatment; Geotechnical Special Publication: Reston, VA, USA, 2003. [Google Scholar]
  7. Lambrechts, J.R.; Ganse, M.A.; Layhee, C.A. Soil Mixing to Stabilize Organic Clay for I-95 Widening, Alexandria, VA. In Grouting and Ground Treatment; Geotechnical Special Publication: Reston, VA, USA, 2003. [Google Scholar]
  8. McGinn, A.J.; O’Rourke, T.D. Performance of Deep Mixing Methods at Fort Point Channel; Bechtel/Parsons Brinckerhoff, Massachussetts Turnpike Authority; Federal Highway Administration, Cornell University: Ithaca, NY, USA, 2003. [Google Scholar]
  9. Hayashi, H.; Nishimoto, S. Strength characteristics of stabilized peat using different types of binders. In Proceedings of the International Conference on Deep Mixing Best Practice and Recent Advances, Stockholm, Sweden, 23–25 May 2005; Volume 1.1, pp. 55–62. [Google Scholar]
  10. Porbaha, A.; Shibuya, S.; Kishida, T. State of the Art in Deep Mixing Technology. Part III: Geomaterial characterization. Proc. Inst. Civil Eng. -Ground Improv. 2000, 4, 91–110. [Google Scholar] [CrossRef]
  11. Coastal Development Institute of Technology (CDIT). In Deep Mixing Method, Principle, Design and Construction; Kitazume, M.; Terashi, M. (Eds.) Balkema: Rotterdam, The Netherlands, 2001. [Google Scholar]
  12. Terashi, M. Theme lecture: Deep mixing method—Brief state of the art. In Proceedings of the 14th International Confernece on Soil Mechanics and Foundation Engineering, Hamburg, Germany, 6–12 September 1997; pp. 2475–2478. [Google Scholar]
  13. Broms, B.B.; Boman, P. Lime stabilized column. In Proceedings of the 5th Asian Regional Conference on Soil Mechanics and Foundation Engineering, Southeast Asian Geotechnical Society, Asian Institute of Technology and Canadian International Development Agency, Kuala, Malaysia, 7–10 April 1975; Volume 1, pp. 227–234. [Google Scholar]
  14. Rathmayer, H. Deep mixing method for soft subsoil improvement in the nordic countries, Grouting and deep mixing. In Proceedings of the 2nd International Conference on Ground Improvement Geosystems, Tokyo, Japan, 14–17 May 1996; Volume 2, pp. 869–877. [Google Scholar]
  15. Al-Tabbaa, A. State of practice report–Stabilisation/solidification of contaminated materials with wet deep soil mixing. In Proceedings of the International Conference on Deep Mixing Best Practice and Recent Advances, Stockholm, Sweden, 23–25 May 2005; Volume 2, pp. 697–731. [Google Scholar]
  16. Bruce, D.A.; Bruce, M.E.C.; DiMillio, A.E. Dry mix methods: A brief overview of international practice. In Dry Mixing Methods for Deep Soil Stabilisation; Brendenberg, H., Holm, G., Broms, B., Eds.; Balkema: Rotterdam, The Netherlands, 1999; pp. 15–25. [Google Scholar]
  17. EuroSoilStab. Development of design and construction methods to stabilise soft organic soils. In Design Guide Soft Soil Stabilisation; BRE: Wadford, UK, 2001. [Google Scholar]
  18. Holm, G. Keynote lecture: Applications of dry mix methods for deep soil stabilization. In Dry Mixing Methods for Deep Soil Stabilisation; Brendenberg, H., Holm, G., Broms, B., Eds.; Balkema: Rotterdam, The Netherlands, 1999; pp. 3–13. [Google Scholar]
  19. Kitazume, M. State of Practice Report—Field and laboratory investigations, properties of binders and stabilized soil. In Proceedings of the International Conference on Deep Mixing Best Practice and Recent Advances, Stockholm, Sweden, 23–25 May 2005; Volume 2, pp. 660–684. [Google Scholar]
  20. Larsson, S. State of practice report—Execution, monitoring and quality control. In Proceedings of the International Conference on Deep Mixing Best Practice and Recent Advances, Stockholm, Sweden, 23–25 May 2005; Volume 2, pp. 732–785. [Google Scholar]
  21. Porbaha, A. Special report: Research and advancement of deep mixing technology in the USA. In Proceedings of the International Conference on Deep Mixing Best Practice and Recent Advances, Stockholm, Sweden, 23–25 May 2005; Volume 2, pp. 796–809. [Google Scholar]
  22. Porbaha, A. State of the art in deep mixing technology, part I: Basic concepts and overview. Ground Improv. 1998, 2, 81–92. [Google Scholar] [CrossRef]
  23. Porbaha, A.; Tanaka, H.; Kobayashi, M. State of the art in deep mixing technology, part II: Applications. Ground Improv. 1998, 3, 125–139. [Google Scholar] [CrossRef]
  24. Hansson, T. Dry deep mixing; A working procedure for improvement of organic soil. In Deep Mixing Workshop 2002; Port and Airport Research Institute: Tokyo, Japan; Coastal Development Institute of Technology: Tokyo, Japan, 2002. [Google Scholar]
  25. Timoney, M.J.; McCabe, B.A.; Bell, A.L. Experiences of dry soil mixing in highly organic soils. Proc. Inst. Civ. Eng. Ground Improv. 2012, 165, 3–14. [Google Scholar] [CrossRef]
  26. Bredenberg, H. Keynote Lecture: Equipment for Deep Soil Mixing with the Dry Jet Mix Method. In Dry Mixing Methods for Deep Soil Stabilisation; Brendenberg, H., Holm, G., Broms, B., Eds.; Balkema: Rotterdam, The Netherlands, 1999; pp. 323–331. [Google Scholar]
  27. Taki, O.; Bell, R.A. Soil-cement pile/column—A systems of deep mixing. In Proceedings of the Geo-Congress 98, Boston, MA, USA, 18–21 October 1998; pp. 59–71. [Google Scholar]
  28. Usui, H. Quality control of cement deep mixing method (wet mixing method) in Japan. In Proceedings of the International Conference on Deep Mixing Best Practice and Recent Advances, Stockholm, Sweden, 23–25 May 2005; Volume 1.2, pp. 635–638. [Google Scholar]
  29. Larsson, S.; Nilsson, L. Findings of the work on influencing factors on the installation process for lime-cement columns. In Proceedings of the International Conference on Deep Mixing Best Practice and Recent Advances, Stockholm, Sweden, 23–25 May 2005; pp. 561–569. [Google Scholar]
  30. Larsson, S.; Dahlstrom, M.; Nilsson, B. A complementary field study on the uniformity of lime-cement columns for deep mixing. Ground Improv. 2005, 9, 67–77. [Google Scholar] [CrossRef]
  31. Yang, D.S.; Coutu, C.J.; Scheibel, L.L. Quality control of cement deep soil mixing work for the Port of Oakland Projects. In Proceedings of the 5th International Conference on Case Histories in Geotechnical Engineering, New York, NY, USA, 13–17 April 2004. [Google Scholar]
  32. Anagnostopoulus, C.A.; Chatziangelou, M. Compressive Strength of Cement Stabilized Soils. A New Statistical Model. Electron. J. Geotech. Eng. 2009, 13, 1–10. [Google Scholar]
  33. Yousefpour, N.; Medina-Cetina, Z.; Hernandez-Martinez, F.G.; Al-Tabbaa, A. Stiffness and Strength of Stabilized Organic Soils—Part II/II: Para-metric Analysis and Modeling with Machine Learning. Geosciences 2021, 11, 218. [Google Scholar] [CrossRef]
  34. Hernández Martínez, F.G.; Osman, A.A.-M.; Al-Tabbaa, A. Wet soil improvement of soft clays and organic soils: Laboratory investigation. In Proceedings of the XIV European Conference on Soils Mechanics and Geotechnical Engineering, Madrid, Spain, 24–27 September 2007; Cuellar, V., Dapena, E., Alonso, E., Gens, A., Justo, J.L., Oteo, C., Rodriguez-Ortiz, J.M., Sagasera, C., Sola, P., Soriano, A., Eds.; Millpress: Madrid, Spain, 2007; Volume 3, pp. 1329–1334. ISBN 978-90-5966-055-7. [Google Scholar]
  35. Hernández Martínez, F.G.; Al-Tabbaa, A. Laboratory strength correlations for cement-treated peat. In GEO-TRANS 2004, Geotechnical Engineering for Transportation Projects; Yegian, M., Kavazanjian, E., Eds.; Geotechnical Special Publication No. 126; ASCE: Los Angeles, CA, USA, 2004; Volume 2, pp. 1403–1411. ISBN 0-7844-0744-4. [Google Scholar]
  36. Hernández Martínez, F.G.; Al-Tabbaa, A. Strength Properties of Stabilised Peat. In Proceedings of the International Conference of Deep Mixing Best Practice and Recent Advances, Stockholm, Sweden, 23–25 May 2005; Volume 1.1, pp. 69–78. [Google Scholar]
  37. Hernández Martínez, F.G.; Al-Tabbaa, A. Mechanical properties of stabilised peat based on laboratory testing. In Proceedings of the 16th International Conference on Soil Mechanics and Geotechnical Engineering, 16 ICSMGE, Osaka, Japan, 12–16 September 2005; Millpress: Bethlehem, PA, USA, 2005; Volume 3, pp. 1193–1198. [Google Scholar]
  38. Hernández-Martínez, F.G.; Al-Tabbaa, A. Effectiveness of different binders in the stabilisation of organic soils. In Proceedings of the International Symposium on Deep Mixing and Admixture Stabilization, Okinawa, Japan, 19–21 May 2009. Paper CT-3. [Google Scholar]
  39. Hobbs, N.B. Mire morphology and the properties and behaviour of some British and foreign peats. Quat. J. Eng. Geol. 1986, 19, 7–80. [Google Scholar] [CrossRef]
  40. Hartlén, J.; Wolski, W. (Eds.) Embankment on Organic Soils; Elsevier: Amsterdam, The Netherlands, 1996. [Google Scholar]
  41. British Standard Institution (BSI). Soil improvers and growing media: Determination of a quantity. BS EN 12580:2000; BSI Publications: London, UK, 2000. [Google Scholar]
  42. ASTM International. D2974-14 Standard Test Methods for Moisture, Ash, and Organic Matter of Peat and Other Organic Soils; West ASTM International: Conshohocken, PA, USA, 2014. [Google Scholar]
  43. Head, K.H. Manual of Soil Laboratory Testing: Volume 1: Soil Classification and Compaction Tests; Pentech Press: London, UK, 1992. [Google Scholar]
  44. British Standard Institution (BSI). Cement-part 1: Composition, specifications and conformity criteria for common cements. In BS EN 197-1; BSI: London, UK, 2000. [Google Scholar]
  45. Al-Tabbaa, A.; Perera, A.S.R. State of practice report UK stabilisation/solidification treatment and remediation: Binder and technologies—Part, I. Basic principles. In Proceedings of the International Conference on Stabilisation/Solidification Treatment and Remediation, Cambridge, UK, 12–13 April 2005; CRC Press: Boca Raton, FL, USA, 2005; pp. 365–386. [Google Scholar]
  46. Neville, A.M. Properties of Concrete, 4th ed.; Pearson Education Limited: Harlow, UK, 1995. [Google Scholar]
  47. Neville, A.M.; Brooks, J.J. Concrete Technology, 2nd ed.; Longman Group UK limited: Harlow, UK, 1993. [Google Scholar]
  48. Taylor, H.F.W. Cement Chemistry, 2nd ed.; Thomas Telford: London, UK, 1997. [Google Scholar]
  49. Dyer, O. A Rock and Hard place, Eco-cement yet to Cover Ground in the Building Industry. The Guardian, 28 May 2003. [Google Scholar]
  50. Pearce, F. Green foundations. New Sci. 2002, 175, 39–41. [Google Scholar]
  51. Harrison, A.J.W. The Case for and Ramification of Blending Reactive Magnesia with Portland cement. In Proceedings of the 28th Annual Conference on Our World in Concrete Structures, Singapore, 28–29 August 2003. [Google Scholar]
  52. Bensted, J.; Barnes, P. (Eds.) Structure and Performance of Cements, 2nd ed.; Spon Press: London, UK, 2002. [Google Scholar]
  53. Holm, G. Keynote lecture: Towards a sustainable society—Recent advances in deep mixing. In Proceedings of the International Conference on Deep Mixing Best Practice and Recent Advances, Stockholm, Sweden, 23–25 May 2005; Volume 1.1, pp. K13–K24. [Google Scholar]
  54. Axelsson, K.; Johansson, S.E.; Andersson, R. Stabilization of Organic Soils by Cement and Puzzolanic Reactions—Feasibility Study; Report 3; Swedish Deep Stabilization Research CentreL: Linkoping, Sweden, 2002; pp. 1–54. [Google Scholar]
  55. Åhnberg, H.; Johansson, S.-E.; Pihl, H.; Carlsson, T. Stabilising effects of different binders in some Swedish soils. Ground Improv. 2003, 7, 9–23. [Google Scholar] [CrossRef]
  56. Hebib, S.; Farrell, E.R. Some experience of stabilising Irish organic soils. In Dry Mixing Methods for Deep Soil Stabilisation; Brendenberg, H., Holm, G., Broms, B., Eds.; Balkema: Rotterdam, The Netherlands, 1999; pp. 81–84. [Google Scholar]
  57. Lahtinen, P.; Jyrava, H.; Kuusipuro, K. Development of binders for organics soils. In Dry Mixing Methods for Deep Soil Stabilisation; Brendenberg, H., Holm, G., Broms, B., Eds.; Balkema: Rotterdam, The Netherlands, 1999; pp. 109–114. [Google Scholar]
  58. Head, K.H. Manual of Soil Laboratory Testing: Volume 2: Permeability; Shear Strength and Compressibility Tests Pentech Press: London, UK, 1982. [Google Scholar]
  59. Butcher, A.P. The durability of deep wet mixed columns in an organic soil. In Proceedings of the International Conference on Deep Mixing Best Practice and Recent Advances, Stockholm, Sweden, 23–25 May 2005; Volume 1.1, pp. 47–54. [Google Scholar]
  60. Hebib, S.; Farrell, E.R. Some experience of the stabilisation of Irish peats. Can. Geotech. J. 2003, 40, 107–120. [Google Scholar] [CrossRef]
  61. Skels, P.; Bondars, K.; Korjakins, A. Unconfined compressive strength properties of cement stabilized peat. In Proceedings of the Civil Engineering 4th International Science Conference, Jelgava, Latvia, 16–17 May 2013; Volume 4, pp. 202–206. [Google Scholar]
  62. Sing, W.L.; Hashim, R.; Ali, F. Unconfined compressive strength characteristics of stabilized peat. Sci. Res. Essays 2011, 6, 1915–1921. [Google Scholar]
  63. Tomac, I.; Van Impe, W.F.; Verástegui-Flores, R.D.; Mengé, P. Binder-soil interaction in cement deep mixing through SEM analysis. In Proceedings of the 16th International Conference on Soil Mechanics and Geotechnical Engineering, Osaka, Japan, 12–16 September 2005; pp. 1149–1936. [Google Scholar]
  64. Van Impe, W.F.; Verástegui-Flores, R.D. Deep Mixing in underwater conditions: A laboratory and field investigation. Ground Improv. 2006, 10, 15–22. [Google Scholar] [CrossRef]
  65. Kolay, P.K.; Pui, M.P. Peat Stabilization using Gypsum and Flay Ash. J. Civ. Eng. Sci. Technol. 2010, 1, 1–5. [Google Scholar]
  66. Boobathiraja, S.; Balamurugan, P.; Dhansheer, M.; Adhikari, A. Study on strength of peat soil stabilised with cement and other pozzolanic materials. Int. J. Civil Eng. Res. 2014, 5, 431–438. [Google Scholar]
  67. Lakshmi, S.; Ramya, K. Strength Characteristics of Stabilized Peat Soil using Fly Ash. Grenze Int. J. Eng. Technol. 2015, 1. Available online: https://issuu.com/grenze/docs/gijet_volume1_issue2 (accessed on 1 May 2021).
  68. Sherwood, P.T. Soil Stabilization with Cement and Lime: Trl State of the Art Review; HSMO: London, UK, 1993. [Google Scholar]
  69. Hewlett, P.C. (Ed.) Lea’s Chemistry of Cement and Concrete, 4th ed.; Elsevier: London, UK, 1998. [Google Scholar]
Figure 1. Flow diagram of the experimental design.
Geosciences 11 00243 g001
Figure 2. Soil mixer.
Geosciences 11 00243 g002
Figure 3. (a) Oven and (b) incubator used for the sample curing.
Geosciences 11 00243 g003
Figure 4. Unconfined compression frame.
Geosciences 11 00243 g004
Figure 5. Axial stress–strain curves showing testing repeatability for Pt-PC-w = 500%-t = 90 days; (a) QB = 100 kg/m3; (b) QB = 150 kg/m3; (c) QB = 200 kg/m3; and (d) QB = 250 kg/m3.
Geosciences 11 00243 g005aGeosciences 11 00243 g005b
Figure 6. SEM and vacuum coating equipment: (a) SEM’s main components, (b) coating of samples with gold and (c) samples before and after coating.
Geosciences 11 00243 g006aGeosciences 11 00243 g006b
Figure 7. Histograms of (a) number of tests of soils and soil–binder combinations, and of (b) soils and soil–binder combinations in terms of binder mix type content (RB-PC, RB-GGBS, RB-PFA, RB-L, RB-MgO and RB-G).
Geosciences 11 00243 g007aGeosciences 11 00243 g007b
Figure 8. Histograms of number of tests performed according to each control variable: (a) Organic Content of Soil (OC), (b) Water Content of Soil (w), (c) Ratio of Binder for Portland cement (RB-PC), (d) Ratio of Binder for Blast Furnace Slag (RB-BFS), (e) Ratio of Binder for Pulverized Fuel Ash (RB-PFA), (f) Ratio of Binder for Lime (RB-L), (g) Ratio of Binder for Magnesium Oxide (RB-MgO-C), (h) Ratio of Binder for Gypsum (RB-G), (i) Quantity of Binder (QB), (j) Grout to Soil Ratio (G/S), (k) Water to Binder ratio (W/B), (l) Specimen Diameter/Height (D/H), (m) Time (t), (n) Temperature (T), (o) Relative Humidity (RH), and (p) Carbonation (CO2).
Geosciences 11 00243 g008aGeosciences 11 00243 g008bGeosciences 11 00243 g008c
Figure 9. Relative frequency histograms and lognormal fits of response variables (a) Elastic Modulus (E), and (b) Unconfined Compression Strength (UCS).
Geosciences 11 00243 g009
Figure 10. Effect of quantity of binder (PC) and water/binder ratio on E at 28 days.
Geosciences 11 00243 g010
Figure 11. Effect of quantity of binder (PC) and water/binder ratio on UCS at 28 days.
Geosciences 11 00243 g011
Figure 12. Relation between E at 28 days and 90 days for two distinct specimen sizes.
Geosciences 11 00243 g012
Figure 13. Effect of curing time on Pt-PC samples at 28 days and 90 days.
Geosciences 11 00243 g013
Figure 14. Stiffness and strength of stabilized organic soils using different binders: (a) and (d): Pt; (b) and (e): OH-1 clay; (c) and (f): OH-2 clay.
Geosciences 11 00243 g014
Figure 15. Typical SEM microimages of the Pt studied at a magnification of 1000.
Geosciences 11 00243 g015
Figure 16. Micrograph of the medium-organic clay (OH-1) studied at a magnification of 1000.
Geosciences 11 00243 g016
Figure 17. Micrograph of the low-organic clay (OH-2) studied at a magnification of 1000.
Geosciences 11 00243 g017
Figure 18. SEM image of Pt-PC mix with its corresponding UCS tests results; (a,b) after 28 days of curing and (c,d) after 90 days of curing.
Geosciences 11 00243 g018
Figure 19. Stabilized OH-1 clay with 250 kg/m3 binder amount, 28 days curing time: (a,b) OH-1-PC-BFS, (c,d) OH-1-PC-PFA and (e,f) OH-1-PC-PFA-L.
Geosciences 11 00243 g019
Figure 20. Stabilized OH-1 clay with 250kg/m3 binder amount, 28 days curing time: (a,b) OH-1-PC-PFA-MgO-C and (c,d) OH-1-L-G-BFS.
Geosciences 11 00243 g020
Table 1. Index properties of the two types of organic clays used for stabilization.
ClayDensity Kg/m3Water Content w (%)Liquid Limit wL (%)Plastic Limit wP (%)Organic Content OC (%)Soil Classification
Medium-organic clay of extremely high plasticity
(OH-1)
1219180155.712330OH-1
Low-organic clay of high plasticity
(OH-2)
1471856533.54OH-2
Table 2. Binder mixtures characteristics (% weight).
Grout
AdmixturesPeat:Grout RatiosBinders RatiosPeatWater Added
%
Binders
Dry Peat
%
Water
%
PC
%
PFA
%
BFS
%
L
%
MgO-C
%
G
%
PtPt-PC-w= 210%1:1.7 11.925.131.531.5
Pt-PC-w= 500%1:1.12 7.839.426.426.4
Pt-PC-w= 1000%1:0.33 6.868.48.216.5
Pt-PC-w= 500%1:1.12 7.839.426.426.4
Pt-PC-BFS-w= 500%1:1.121:27.839.426.48.8 17.6
Pt-PC-PFA-w= 500%1:1.121:17.839.426.413.213.2
Pt-PC-PFA-L-w= 500%1:1.123:6:17.839.426.4815.6 2.8
Pt-PC-PFA-MgO-C-w= 500%1:1.122:6:27.839.426.45.216 5.2
Pt-L-G-BFS-w= 500%1:1.121:1:17.839.426.4 8.88.8 8.8
Clay-peat:Grout RatiosBinders RatiosDry Medium Organic Clay
%
Water
%
Water Added
%
Binders
PC
%
PFA
%
BFS
%
L
%
MgO-C
%
G
%
OH-1OH-1-PC-w= 180%1:0.41 25.445.614.514.5
OH-1-PC-BFS-w = 180%1:0.411:225.445.614.54.8 9.7
OH-1-PC-PFA-w = 180%1:0.411:125.445.614.57.257.25
OH-1-PC-PFA-L-w = 180%1:0.413:6:125.445.614.54.48.7 1.4
OH-1-PC-PFA-MgO-C-w= 180%1:0.412:6:225.445.614.52.98.7 2.9
OH-1-L-G-BFS-w= 180%1:0.411:1:125.445.614.5 4.84.8 4.8
Clay-Peat:Grout RatiosBinders RatiosDry Low organic Clay
%
Water
%
Water Added
%
Binders
PC
%
PFA
%
BFS
%
L
%
MgO-C
%
G
%
OH-2OH-2-PC-w= 85%1:0.34 40.334.312.712.7
OH-2-PC-BFS-w = 85%1:0.341:240.334.312.74.2 8.46
OH-2-PC-PFA-w= 85%1:0.341:140.334.312.76.356.35
OH-2-PC-PFA-L-w= 85%1:0.343:6:140.334.312.73.87.62 1.27
OH-2-PC-PFA-MgO-C-w = 85%1:0.342:6:240.334.312.72.57.64 2.5
OH-2-L-G-BFS-w= 85%1:0.341:1:140.334.312.7 4.24.2 4.2
Table 3. Control variables and ranges of variation.
Ref.VariablesRange of VariationMeanStandard Deviation
Control Variables (Input Parameters)
aOrganic Content of Soil (OC)4 (OH-2), 30 (OH-1), 94 (Pt) (%)69.2 (%)33.2 (%)
bWater Content of Soil (w)85, 180, 210, 500, 1000 (%)400.2 (%)258.6 (%)
cRatio of Binder for Portland cement (RB-PC)0, 0.2, 0.3, 0.33, 0.5, 10.7490.339
dRatio of Binder for Blast Furnace Slag (RB-BFS)0, 0.33, 0.67 0.1800.292
eRatio of Binder for Pulverized Fuel Ash (RB-PFA)0, 0.5, 0.60.0450.154
fRatio of Binder for Lime (RB-L)0, 0.1, 0.33 0.0120.056
gRatio of Binder for Magnesium Oxide (RB-MgO-C)0, 0.20.0050.032
hRatio of Binder for Gypsum (RB-G)0, 0.33 0.0090.054
iQuantity of Binder (QB)100–500 (kg/m3)265.9 (kg/m3)76.6 (kg/m3)
jGrout to Soil Ratio (G/S)0.14–3.380.8560.568
kWater to Binder ratio (W/B)0.5, 0.8, 10.9370.157
lSpecimen Diameter/Height (D/H)0.5, 10.9200.183
mTime (t)14–180 (days)61 (days)36 (days)
nTemperature (T)21, 45, 60 (ºC)32.9 (ºC)15.7 (ºC)
oRelative Humidity (RH)70, 80, 90 (%)87.6 (%)4.9 (%)
pCarbonation (CO2)0, 20 (%)2.9 (%)7.1 (%)
Response Variables (Target Parameters)
qElastic Modulus (E)0.83–214.62 (MPa)34.03 (MPa)31.44 (MPa)
rUnconfined Compression Strength (UCS)0.04–2.09 (MPa)0.50 (MPa)0.40 (MPa)
Table 4. First order statistics of response variables Elastic Modulus (E) and Unconfined Compression Strength (UCS).
StatisticsE (MPa)UCS (MPa)
Minimum0.830.04
Median24.320.39
Maximum214.622.09
Mean34.030.50
Standard Deviation31.490.41
Number of Data Points339339
Publisher’s Note: MDPI stays neutral with regard to jurisdictional claims in published maps and institutional affiliations.

