
Seismicity and the State of Stress in the Dezful Embayment, Zagros Fold and Thrust Belt

1
Department of Earth and Environmental Sciences, University of Waterloo, Waterloo, ON N2L 3G1, Canada
2
Waterloo Institute for Sustainable Energy (WISE), University of Waterloo, Waterloo, ON N2L 3G1, Canada
3
Department of Geography and Environmental Management, University of Waterloo, ON N2L 3G1, Canada
*
Author to whom correspondence should be addressed.
Geosciences 2021, 11(6), 254; https://doi.org/10.3390/geosciences11060254
Submission received: 2 May 2021
/
Revised: 29 May 2021
/
Accepted: 4 June 2021
/
Published: 12 June 2021
(This article belongs to the Section Geomechanics)
Abstract
:This study focuses on determining the orientation and constraining the magnitude of present-day stresses in the Dezful Embayment in Iran’s Zagros Fold and Thrust Belt. Two datasets are used: the first includes petrophysical data from 25 wells (3 to 4 km deep), and the second contains 108 earthquake focal mechanisms, mostly occurring in blind active basement faults (5 to 20 km deep). Formal stress inversion analysis of the focal mechanisms demonstrates that there is currently a compressional stress state ( in the basement. The seismologically determined SHmax direction is 37° ± 10°, nearly perpendicular to the strike of most faults in the region. However, borehole geomechanics analysis using rock strength and drilling evidence leads to the counterintuitive result that the shallow state of stress is a normal/strike-slip regime. These results are consistent with the low seismicity level in the sedimentary cover in the Dezful Embayment, and may be evidence of stress decoupling due to the existence of salt layers. The stress state situation in the field was used to identify the optimally oriented fault planes and the fault friction coefficient. This finding also aligns with the prediction Coulomb faulting theory in that the N-S strike-slip basement Kazerun Fault System has an unfavorable orientation for slip in a reverse fault regime with an average SW-NE SHmax orientation. These results are useful for determining the origin of seismic activity in the basin and better assessing fault-associated seismic hazards in the area.
1. Introduction
The Zagros fold-and-thrust belt (ZFTB), southwest Iran, is one of the most seismically active areas in the world [1,2], with more than 5000 earthquakes of Mw ≥ 3 recorded between 1 January 2010 and 1 January 2020 (Iranian Seismological Centre catalog). The Dezful Embayment (DE) within the ZFTB is also one of the richest hydrocarbon regions in the world, hosting many onshore hydrocarbon fields and containing about 9% of global hydrocarbon [3]. Improving our knowledge of its state of stress is important in view of the area’s enormous economic value and seismic activity.
Understanding the state of stress in the area is important to seismology research [4,5] and to reservoir geomechanics studies at various scales [6]. Knowing the state of stress in the Dezful Embayment helps us understand crustal-scale seismicity pattern issues (10 km) arising from oil and gas extraction [7], the reservoir scale issues (1 km) of induced seismicity [8], and borehole scale engineering issues (10 m) related to casing shear and borehole stability [9].
In the Dezful Embayment area, most seismicity occurs around the Balarud Fault (BL), Kazerun Fault (KZ) System, and the Mountain Front Fault (MFF), and is restricted to depths below 5 km and to the area with a surface elevation of fewer than 1500 m above sea level (Figure 1). However, the major oil and gas fields of the Dezful Embayment region are located at low elevation; therefore, combining both earthquake datasets and borehole well logs leads to better coverage of the various scales.
Numerous studies have focused on determining stress states in the ZFTB by using earthquake focal mechanism data, where most seismicity happens on blind faults at basement level or beneath the sedimentary cover at depths of 5–20 km [1,2,10,11,12,13,14,15]. Berberian [1] stated that active thrust basement fault systems are covered by quiescent sedimentary layers in the ZFTB. A micro-earthquake study [16] carried out around the Kazerun Fault System also revealed that the shallower sedimentary cover deforms by strike-slip faulting, but that a reverse faulting regime exists at greater depths. However, very few studies have integrated drilled wellbore datasets for shallower depths (<5 km) to help delineate the area’s current state of stress [17,18]. The study by Yaghoubi and Zeinali [17] of the Cheshmeh-khosh field and by Haghi, Chalaturnyk and Ghobadi [18] of the Ahvaz Field indicated that normal/strike-slip faulting predominates in the sedimentary cover to a depth of 5 km.
The presence of several continuous highly ductile layers (the Hormuz Salt, and the evaporitic Dashtak and Gachsaran Formations) in the ZFTB leads the upper sedimentary cover to be decoupled from the basement [19]. The state of stress in the Dezful Embayment is a classic case of decoupling, where the stress regimes are changed at various depths because of the existence of highly ductile layers. These ductile zones shield the shallower sediments from the compressional strains in the basement rock arising from the collision between the Arabian and Eurasian plates that have generated the Zagros [1,20,21,22].
This study determines the orientation and constrains the magnitude of the area’s present-day stresses and tectonic regimes based on the geophysical wellbore log datasets of 25 wells as well as 108 earthquake focal plane mechanisms. The database includes the style of faulting derived from earthquake focal mechanisms and analyses of borehole breakouts and tensile-induced fractures. Evidence of stress-induced borehole instability and geophysical data from various wells, as well as seismicity datasets, are used to estimate the state of stress in the Dezful Embayment.
First, we used borehole failures, drilling evidence, and rock strength information to constrain the stress state to a depth of around 4 km. Second, we determined the style of fault movement using focal mechanism events at depths of more than 5 km. Finally, the seismicity pattern in the region and strike-slip earthquake events around the N-S Kazerun Fault System are used to verify and confirm that the state of stress in the Dezful Embayment changes with depth.
2. Regional Tectonic Setting
The Zagros fold-and-thrust belt (ZFTB) results from the active collision of the Arabian and Eurasian plates. Extending for almost 1400 km and 100–200 km wide, with an approximately N 125°–160° trend, the Belt stretches from eastern Turkey to the northern area of the Strait of Hormuz in the Persian Gulf. The ongoing collision started during the Miocene era as the Arabian plate pushed against the central Iranian one [1]. This compressional tectonic activity has led to significant crustal shortening across the fold belt, and resulted in the faulting and folding, thrusting, and reactivation of large-scale strike-slip faulting of the sedimentary cover sequence. Among the major faults are the Izeh-Hendijan Fault (IZHF), the Kharg-Mish Fault (KMF), and the Kazerun Fault (KZ) System (Figure 1).
The deep-seated strike-slip Balarud Fault (BL) from the northwest and the Kazerun Fault System from the southeast divide the ZFTB into various geological zones, each with a different structural style and stratigraphy. These zones include two regional embayments: the Kirkuk Embayment to the northwest and the Dezful Embayment to the southeast. There are also folded belts: from NW to SE, the in the Lorestan area, Izeh zone, and Fars (Central Zagros) arch [23]. An earlier study by Sherkati and Letouzey [24] showed that the Dezful Embayment has subsided approximately 5000 m, compared to the Izeh zone across the Mountain Front Fault.
Extending over 60,000 km2, the Dezful Embayment is a discrete structural lowland bounded by the Balarud Fault (BL) and the Mountain Front Fault (MFF) to the north and northeast, the Kazerun Fault (KF) System to the east and southeast, and the Zagros Foredeep Fault (ZFF) to the south and southeast. Most seismicity in the area occurs around the Balarud Fault, Kazerun Fault, and the Mountain Front Fault. Each colored dot in Figure 1 indicates the epicenter of an earthquake recorded by the Iranian Seismological Centre after 2010. We display that earthquakes have a recorded waveform only for the sake of accuracy [25]. This embayment is one of the most prolific oil regions in the world [26] and hosts more than 40 onshore hydrocarbon fields. Most of the hydrocarbon fields (oval green shapes in Figure 1) are elongated along the regional strike of the whaleback folds, NW-SE, orthogonal to the shortening direction (SW-NE). The majority of oil and gas hydrocarbon fields in the Dezful Embayment are found in two regional carbonate zones, the Asmari and the Sarvak Formations.
3. Dezful Embayment Stratigraphy
The present-day stratigraphic disposition of the Zagros Mountains and the Dezful Embayment is well established and is the result of a long geological history [20,24,27,28,29,30].
More than 10 km of Palaeozoic sedimentary successions have been deposited over the infra-Cambrian Hormuz in the ZFTB. The significant difference in the stratigraphy between the Dezful Embayment and Fars geological province is that the sedimentary cover of Fars province has been deposited on top of the infra-Cambrian Hormuz Salt layer, whereas this layer is much thinner or absent in the northern Zagros [29]. The main detachment levels in the Dezful Embayment are located in the evaporite-rich Triassic Dashtak and Miocene Gachsaran Formations (the yellow formations in Figure S1 of the Supplementary Materials).
The Gachsaran Formation (lower Fars) varies in thickness from several hundred to 2000 m and includes thick beds of evaporates (anhydrite, gypsum, and salt) with some marl, limestone, dolomite, and shale zones [31]. The Gachsaran Formation is a regional seal and is the caprock for the Asmari Formation reservoirs. The Asmari Formation is composed of sandstone in its lower part and carbonates in the upper part (Figure S1), but at the northern edge of the basin, its uppermost part is conglomeratic, with clasts derived from the Asmari itself [32,33]. The Upper Cretaceous Sarvak Formation, the second-most important reservoir unit in the Dezful Embayment, is part of the carbonate series of the Sarvak and Ilam Formations [32] and overlain by the Gurpi Formation. Motiei [34] pointed out that the Sarvak Formation consists of three limestone units, together reaching a maximum thickness of 821 m in the Dezful Embayment. The high hydrocarbon productivity of these reservoirs, particularly the Asmari, results mostly from the fracture systems created by the compressive folding characteristic of the Zagros area [3].
4. Data Collection
Logging data and drilling reports of twenty-five wells of the Dezful Embayment have been analyzed. For all these wells, resistivity and acoustic image logs are available and provide a circumferential picture of the borehole walls. This information has enabled the identification of structures in the borehole wall, due to the differences in acoustic, resistivity reflectivity, and the rugosity of the borehole wall. To analyze the stress state, borehole breakouts and drilling-induced tensile fractures (according to WSM) have been examined. Details of each well, including the depth of their image logs, are provided in Table 1. Red triangles in Figure 1 denote the locations of the examined wells, which were drilled in 15 different hydrocarbon fields at various locations in the Dezful Embayment.
A total of 108 individual well-constrained focal mechanisms have been extracted and compiled from previous publications and sources [2,11,12,35,36,37,38,39,40,41,42] and the Iranian Seismological Centre. Details of each focal mechanism and its references are provided in the Supplementary Materials. We have selected only those focal mechanisms that rank A in their references. Of the 108 focal mechanisms, 73 are compiled from the Iranian Seismological Centre [43] using broad-wave forms modeling. The selected focal mechanisms range in depth from 4 to 20 km, with an average depth of 10 km. A number of the focal mechanisms belong to the Lorestan Arc and Fars Arc to evaluate the state stress variation on the border of structural subdivisions. Of all earthquakes considered in this focal mechanism study, 86 are thrust faulting at various locations, and 22 events are strike-slip, which mostly occur around the NS striking Kazerun Fault System.
5. Constraining the State of Stress from Borehole Data
5.1. Methodology
Since most of the ZFTB’s earthquakes have been recorded below a depth of 4 km, datasets obtained from boreholes fill a critical gap in understanding the state of stress at shallower depths in the sedimentary cover. There are well-established techniques for determining stress orientation from borehole geometry and borehole geophysics datasets [44]. Drilling causes stress concentrations around the borehole wall. The local stress concentrations due to drilling a circular hole in an infinite homogenous rock mass can be calculated from the Kirsch solution [45]. In a vertical wellbore, observation of compressive features (breakouts) and tensile features (induced axial fractures) proves to be an effective approach for determining the minimum and maximum horizontal principal stress orientation, respectively [46].
In the context of the Mohr-Coulomb theory and considering the Kirsch equation, compressive failure, borehole breakout, in a vertical well occur when the circumferential effective stress () or the vertical effective stress () exceeds the rock strength.
where Sv, SHmax, Shmin are the vertical, maximum, and minimum horizontal stress magnitudes, respectively; ν is the static Poisson’s ratio; Pp is pore pressure, and ΔP is the difference between mud pressure and pore pressure. Drilling-induced tensile fracture form when the circumferential effective stress () or the vertical effective stress () goes into tension. Note that the above equation is a simple presentation of induced stress around a vertical borehole wall due to drilling. Please see Schmitt, Currie and Zhang [46] for more information on the stress state surrounding arbitrarily inclined boreholes.
The Leak-Off Test [47], Hydraulic Fracturing Test, and Pressure While Drilling (PWD) [48] are different direct in-situ stress measurements taken during well drilling. Since no direct Shmin measurement was available for this study, the state of stress had to be constrained from the borehole well-log data for the lower depth of the Dezful Embayment. An alternate approach used to constrain the in-situ stress magnitude in the absence of direct stress measurement is to utilize the observations of wellbore failures (Equation (1)) along with considering that the stress magnitudes are in equilibrium with the frictional strength of pre-existing faults [49]. The ratio of the maximum (S1 − PP) to minimum (S3 − PP) effective stress on an optimally oriented cohesionless fault is limited by frictional strength:
where PP is pore pressure and μ is the coefficient of frictional sliding on a pre-existing fault [45]. It has been found in laboratory studies and in-situ experiments that the magnitude of the coefficient of friction falls within the range of 0.6 to 1 [50]. In this study, we have used the observation of borehole failure (Equation (1)), information on rock strength, and the frictional strength of crust (Equation (2)) to constrain the state of stress at shallow depths in the sedimentary cover in the Dezful Embayment.
5.2. Stress Orientation
Detailed analysis was done on the image logs of 25 wells. Figure 2 illustrates examples of (a) borehole breakouts, and (b) and (c) tensile induced fractures detected in different hydrocarbon fields located in the Dezful Embayment. Figure 3 shows the depth, frequency, and orientations of borehole breakouts in well P-7 of the Paydar field. Statistical analysis indicates that the Shmin direction (borehole breakout azimuth) in P-7 is 100.7° ± 5.7°. This result is approximately the same as that for the borehole breakout azimuth analysis for P-6, drilled about 4 km away (101.7° ± 12.1°). The same analysis was performed for different wells in the Paydar, Agha-Jari, Khaviz, Abe-Teymor, Lali, Marun, Dalpari, Cheshmeh-khosh, and Mansori fields. The SHmax orientations resulting from breakouts, plus the tensile-induced fractures in each well, are ranked A to D according to the World Stress Map quality ranking system [51]. Table 1 presents the result of this analysis of borehole breakouts and tensile-induced fractures observed in the vertical wells at different fields in the Dezful Embayment.
Of all wells, wells CK-9, LL-29, and the wells drilled in the Balarud field show significant variations and anomalies in breakout azimuths (D quality) and tensile-induced fractures as a function of depth, due to stress perturbations associated with geological structures and faults. Figure S3 (Supplementary Materials) shows how breakout azimuths on the ultrasonic image logs for wells CK-9 and LL-29 change abruptly at different depths, resume at slightly greater depths, and gradually change in the vicinity of the fault. Seismic interpretation (3D) of the Cheshmeh-khosh field revealed two sets of faults with a NW-SE and WNW-ESE trend in the field, one of them close to well CK-9 (internal communication with NIOC). Talebi, et al. [52] and Hosseini, et al. [53] also observed that the stress orientations in the Lali field varied from well to well and were too complex to interpret due to an east-west trending strike-slip fault in the Asmari Formation. The Balarud Field is also a fault-bend fold, where stress orientations are significantly affected and perturbed by their geological setting. The stress orientations in the different part of the Balarud Field are highly variable.
5.3. Stress Magnitude
From the surface to a 7 km depth, three abnormally pressured formations are present in the Dezful Embayment: the Miocene evaporitic Gachsaran Formation (Lower Fars), the Triassic Dashtak Formation, and the Lower Cretaceous carbonate Fahliyan Formation. Almost all wells drilled in the Embayment experience difficulties in penetrating the Gachsaran Formation, sometimes leading to blowouts [54]. The pressure gradient in the Gachsaran Formation ranges from 15.5 to 22.1 MPa/km in several oil fields located in the Dezful Embayment, such as the Masjid-i-Sulaiman, Lali, Haft-Kel, Naft Safid, AghaJari, Pazanan, Gachsaran, and Naft Shahar. The Dashtak Formation in the Embayment is located at a greater depth. The pressure variation along the Triassic Dashtak Formation is equivalent to that of the Gachsaran formation due to both having evaporitic rock composites; however, the former is the caprock in the Fars region hydrocarbon fields. Drilling experience in the Fars region shows that high mud weights are needed to drill into the Dashtak Formation [55]. The lower Fahliyan Formation, which mainly consists of limestone, is another location of slight overpressure in the ZFTB, mostly in the Abadan Plain [56,57]. Apart from these three strata, other formations such as Asmari and Sarvak is close to hydrostatic. Since the Gachsaran and Dashtak Formations are severely over-pressured, running the petrophysical well tools and performing formation evaluation tests is challenging. Therefore, there is not much information available on the rock physics and geomechanics properties of these two specific formations. Figure S2 of the Supplementary Materials shows variations of mud weight and direct pore pressures with depth, drawn from direct observations of several wells in the Dezful Embayment.
Few Hydraulic fracturing tests and extended leak-off tests have been reported for the ZFTB area. Table 2 provides a summary of the leak-off tests and Hydraulic fracture tests reported for the Gachsaran and Ahvaz oil fields in the Dezful Embayment. Table 2 shows that the minimum principal stress gradient is about 14 and 15 MPa/km at a depth of 2.5 km and 3.5 km, respectively. That means the state of stress in oil and gas fields in the Dezful Embayment is normal to strike-slip faulting regime. Since no direct Shmin measurement was available for this study, the stress state was taken from well log data at the shallow depth (<5 km) of the Dezful Embayment.
Sufficient rock mechanics studies are available for the Sarvak and Asmari Formations to use in establishing the relation between static and dynamic elastic moduli and rock mechanics properties. The study carried out by Najibi, et al. [59] shows that the uniaxial compressive rock strength (UCS) of limestone in the Sarvak and Asmari Formations varies considerably between 30 to 180 MPa, with the most-frequent value being 80 MPa (Figure S4). The same results have been reported by other studies [59,60,61,62,63,64,65,66]. Note that the Asmari and Sarvak Formations, as described above, also contain sandstone and shale of lower strength than the carbonate parts.
In the absence of direct stress measurement, observations of drilling-induced wellbore failure in a vertical borehole along with the information on rock strength can estimate the range of possible horizontal stresses acting around a drilled well at any given depth. To elaborate on this, Figure 4a illustrates an example of the rock strength (UCS) required to prevent breakout in a vertical borehole for a case Sv = 100 MPa, Smin = 100 MPa, SHmax = 120 MPa, and Pp = 40 MPa, which is equivalent to a strike-slip/reverse faulting stress state at depth of 4 km. The Mohr-Coulomb failure criterion and Kirsch formulation (Equation (2)) [45] were used in these calculations. For this example, the rock strength required to prevent borehole breakout is around 180 MPa. Thus, for such a state of stress, compressive failure would not be expected if the rock is stronger than 180 MPa and wide breakout failure (wash-out) would also result in lower rock strength than 80 MPa. When the rock strength is known, the presence and absence of breakouts provide a lower and upper bound on the horizontal stress difference acting around the borehole, respectively.
Figure 4b shows the range of possible magnitude (stress polygon) for the horizontal principal stresses for a depth of 3.5 km where pore pressure is 35 MPa and vertical stress is 87.5 MPa. It is assumed that the crust is in a state of frictional failure equilibrium and the coefficient of friction (µ) is 0.6 (Equation (2)). The color inside of the stress polygon represents the rock strength required to prevent breakout formation for different stress regimes. For each possible stress state case, the analysis same as a present for Figure 4a has been performed to know the rock strength under which borehole breakout might have occurred. For instance, dark blue in Figure 4b indicates the possible state of stress at which compressive failure will occur if the rock strength is less than 120 MPa.
Assuming that stress magnitudes at each depth are consistent with Coulomb frictional-failure theory for a coefficient of friction (Equation (2)), Figure 4c,d illustrate two possible states of stress, extensional (normal/strike-slip) and compressional (reverse/strike-slip) in the sedimentary cover of the Dezful Embayment. Figure 4c,d present an analysis similar to that of Figure 4b (stress polygon) but at various depths (see Figure 9 of Moos and Zoback [67]). In each case, SV is assumed to be principal stress and is equal to the weight of the overburden rocks (ρ ≈ 2.5 g/cm3). A depth between 2000 to 4500 m has been chosen since the reservoir formations, the Asmari and Sarvak in the Dezful Embayment, are generally located at such depths, and most of the relevant conventional petrophysics and image logs are usually available. In Figure 4c, Shmin changes from the value limited by a friction coefficient μ = 0.6 to SV = SHmax (the horizontal dashed line inside of the stress polygon in Figure 4b). The same idea applies for Figure 4d; but SHmax changes from SV to the value limited by a friction coefficient μ = 0.6 (the vertical dashed line inside of the stress polygon in Figure 4b). The color shows the rock strength needed to prevent breakouts occurs for a given value of horizontal principal stress for each possible case. As stress magnitudes increase with depth, the compressive rock strength needed to prevent failure increases at any state of stress.
In a compressional stress system in the studied region (Figure 4d), the minimum rock strength needed to prevent borehole failure at a depth of 2 km, for example, should be around 180 MPa except when the three principal stresses are close together (SV ≈ SHmax ≈ Shmin). Whereas in an extensional environment at such depth, the minimum required compressive rock strength to make a vertical hole stable is around 90 MPa. Figure 3, the UBI log of well P-7 in the Payder Field, can be used here as a related example. First, the presence of breakouts shown in Figure 3 at depths between 3925–4130 m indicates that horizontal principal stresses are not equal (SHmax ≠ Shmin). Second, if the state of stress were reverse faulting regime, the minimum rock stress needed to prevent borehole breakout at these depths should be around 180 MPa (like the case presented in Figure 4a). Hence, considering the average UCS value of 80 MPa in the Sarvak and Asmari Formations, one would expect to observe continuous wide breakouts at all azimuths (wash-out) around any borehole drilled in the Dezful Embayment. In other words, for a compressional state of stress at a depth of 4 km when rock strength is around 80 MPa, major borehole instability (such as wash-out) is expected to occur. Note that the Asmari and Sarvak Formations in the shale and sandstone section has a lower rock strength than carbonate. Observations of borehole breakout with respect to average rock strength in the Sarvak and Asmari Formation support that the state of stress is not in a compressional stress system.
The normal/strike-slip faulting regime in the shallow sedimentary cover of the Dezful Embayment also aligns with drilling experiences and borehole instability problems as well as mud weight in vertical and deviated boreholes. Many oil and gas wells have been drilled vertically into the Sarvak and Asmari Formations in the studied area, with no instability problems or borehole breakout. Directional and horizontal wells, however, do experience instability, and normally need more mud weight for safe drilling. Note that Table 2 presents just those wells in which breakouts and tensile-induced fractures have been observed. Directional wells drilled in the direction of minimum principal stress (borehole breakout azimuth) are much more stable, as less horizontal stress difference is acting around the borehole wall. For example, well P-7 in the Paydar Field is side-tracked in two azimuths of 212° and 292°: ST-1, the first side-track at azimuth 212°, was drilled 212 m in 20 days with a mud weight of 70 pcf, and ST-2 was drilled 717 m in 15 days at azimuth 292° with a mud weight of 63 pcf. Both side-tracks were drilled in the Sarvak Formation at a depth of 4020 m TVD (see Table S2 for more information). This drilling experience example supports the counterintuitive fact that the state of stress in the sedimentary cover of the Dezful Embayment is a normal/strike-slip regime.
These results are similar to those reported by Yaghoubi and Zeinali [17] for the Cheshmeh-khosh field, Haghi, Chalaturnyk and Ghobadi [18] for the Ahvaz field in the southern part of the Dezful Embayment, and others [58,68]. Their results show that normal/strike-slip faulting predominates in the sedimentary cover to a depth of 5 km. Haghi, Chalaturnyk and Ghobadi [18] performed borehole geomechanics modelling of the Sarvak Formation in the southern part of the Dezful Embayment and determined through extended leak-off tests that the Shmin gradient varies from 15.2 MPa/km (0.67 psi/ft) to 17.4 MPa/km (0.77 psi/ft). The normal/strike-slip faulting regime in the shallow sedimentary cover of the Dezful Embayment is also consistent with little seismicity and fault slip. A micro-earthquake study by [16] revealed that the shallower sedimentary cover deforms by less-compressive states of stress, confirming the legitimacy of our results.
6. State of the Stress from Earthquake Focal Mechanisms
More than 5000 earthquakes of Mw ≥ 3 have been recorded in the area since 2010 (Iranian Seismological Centre). Their magnitude and distribution increase from northwest to southeast, but they are scattered and rarely associated with co-seismic surface rupture (except in the case reported by Walker, et al. [69]). Most have occurred on active blind and hidden faults [1] beneath sedimentary cover (Figure 1). There is always uncertainty associated with the depth of an earthquake. However, of the earthquakes observed in the ZFTB, most occurred relatively deeper underground (with an average depth of 12 km) and fewer occurred at shallow depths in the sedimentary cover (see the histogram in Figure 1). Talebian and Jackson [2] stated that earthquakes in the ZFTB are only rarely associated with surface faulting. Many seismicity analyses in the ZFTB confirmed that the sedimentary cover is not highly seismically active even though it has been crisscrossed by many faults, as shown in Figure 1 [15,70,71]. Rarely have earthquakes with an Mw greater than 7 been recorded in the ZFTB.
Figure 5 displays two NE-SW cross-sections of the topography and earthquake hypocenters in the northern (A-A’) and southern parts (B-B’) of the Dezful Embayment. As illustrated in Figure 1 inset (histogram) and Figure 5, most earthquakes are located and nucleate at a depth greater than 5 km, and are confined between 10 and 15 km, below the sedimentary cover at the site of hidden faults. Seismic events are restricted to an elevation less than 1500 m in the area where most oil and gas fields are located (the embayment area).
6.1. Methodology
Earthquake focal mechanisms enable to constrain relative stress magnitudes. Assuming that SV is one of the principal stresses, an appropriate stress regime for each earthquake focal mechanism can be assigned based on WSM criteria (Table 3, Zoback [70]). The SHmax orientation can be determined from a single earthquake focal mechanism solution (FMS) and the formal stress inversion (FMF) of that focal mechanism. Whereas single focal mechanisms are only approximate indicators of SHmax orientation, the inversion of sets of earthquake focal mechanisms determines a best-fitting stress field and provides a more accurate estimation of principal stress orientations [71,72]. In this study, we also conduct a formal inversion of moment tensors using MSATSI MATLAB code, which iteratively inverts for the stress field based on the SATSI algorithm [73,74,75].
Assuming that the state of stress is in frictional failure equilibrium as one constraint on relative stress magnitudes (Equation (2)), Angelier [76] introduced another constraint by quantity , defined by the equation
where S1, S2, and S3 are the maximum, intermediate, and minimum principal stresses. Depending on the magnitude of the intermediate stress magnitude relative to the other two, Angelier’s shape parameter is between zero and one. Simpson [77] generalized the parameter values to provide a quantitative measure for each possible faulting regime as an equation:
where n = 0, 1, 2, for normal faulting, strike-slip faulting, and reverse faulting, respectively. The fault parameter (the style of faulting) ranges continuously from 0 to 1 for normal, 1 to 2 for strike-slip, and 2 to 3 for reverse faults [78,79].
6.2. Stress Orientation
The SHmax orientation has been determined from 108 single earthquake focal mechanisms and the formal stress inversion of those focal mechanisms (Table S2 in the Supporting Material). We determine the SHmax orientation of every single focal mechanism based on the plunge of P, B, and T Axes (Table 3, Zoback [70]). Besides, The total data cluster into three groups based on their location (latitude and longitude), so stress inversion is calculated for each group using the method presented in Martínez-Garzón, Kwiatek, Ickrath and Bohnhoff [75] (see Figures S4 and S5 for more information). Table 3 contains the results of the formal stress inversion. The red lines crossing the beachballs in Figure 6 show the 108 SHmax orientations inferred from individual focal mechanisms (P-axis), while the inward-pointing black arrows (reverse faulting regime) and green arrows (strike-slip) represent the SHmax direction calculated from formal stress inversion in the Dezful Embayment.
Seismologically determined maximum horizontal stress (SHmax) orientations show more overall consistency and spatial uniformity than those obtained from the borehole wall examination (the blue inward arrows in Figure 6). The study suggests that the evaluated earthquakes are in both a thrust and a strike-slip faulting regime, with an average SHmax orientation of 37° ± 10°. However, stress orientation variations are seen in most of the investigated oil and gas fields, from relatively abrupt changes of stress orientation when drilling crosses a fault, to gradual lateral variations over scales of several hundred meters. The resultant spatial variation of stress orientations determined from boreholes in different locations of the study area shows general stress heterogeneity (discussed later).
6.3. Relative Stress Magnitudes and Style of Faulting
Using Equation (4) (Simpson (1997)), the style of faulting regime for each focal mechanism is displayed by colours in Figure 6. The color inside of each focal beachball indicates the style of faulting based on values. Noticeably, the highest frequency value (Figure 6c) for suggests that SHmax is considerably greater than the vertical stress (S3) and Shmin (S2) and Shmin/SV stress permutations. This compressional environment regime corresponds to a state in which both the reverse fault and strike-slip fault are potentially active. Of the 108 earthquake focal mechanisms considered, 22 earthquakes are strike-slip events at various locations, but most occurred around the NS striking Kazerun Fault System.
7. Seismicity and State of Stress
In this section, the relationship between seismicity and stress states in the Dezful Embayment are investigated. The seismicity pattern in the sedimentary cover and basement as well as strike-slip earthquake events around the N-S Kazerun Fault System are used to confirm that the state of stress in the Dezful Embayment changes with depth. We then determine that fewer earthquakes occur in the sedimentary cover because the stresses are less compressive at relatively shallow depths.
The occurrence of fewer earthquakes in an area, such as in the sedimentary cover of the ZFTB, can generally be explained in two main ways. First, the state of stress in an area is not sufficient to exceed the rock’s frictional strength to the point that a failure/earthquake is nucleated by the relative stress magnitudes. Second, there may be no critically stressed faults in the area with respect to in-situ stress orientation [80,81,82,83]. Hence, the presence or absence of seismicity with respect to fault orientations in an area with a known stress orientation will provide information on the stress magnitudes. Since seismogenic fault properties, such as fault orientation and dip angle, in the studied area are unknown, this section first investigates which of two nodal planes for an earthquake focal mechanism is geometrically optimal for fault slip, and what the frictional likelihood is of a slip occurring along the preferred nodal plane. That helps us to understand and investigate the relationship between seismicity and the state of stress, particularly for the Kazerun Fault area.
Earthquakes in the Zagros area occur along blind/hidden faults for which neither geological mapping nor 3D seismic imaging can clearly determine the geometries [1]. However, existing faults can now be inferred from earthquake events. Using earthquake focal mechanisms that provide two nodal planes, we can deduce the possible fault plane. Figure 7a illustrates a normalized 3D Mohr diagram with a representative reverse focal event (Mw = 4.2, 14 August 2015). The stress magnitude in the diagram is based on the value calculated for the event. The circle points in Figure 7a correspond to the normalized shear and normal stress acting on each nodal plane. As shown for this example, the plane fault striking NW-SE and dipping NE is most likely to slip and is the preferred nodal plane. Figure 7b shows the slip-tendency in a case where the state of stress is the reverse faulting regime (), with an average SHmax orientation of N 37° E and hydrostatic pore pressure. A red circle on the Mohr diagram represents critically stressed fault poles, and black corresponds to fault poles with a lower likelihood of slip (). Small circles on the stereonet represent 92 preferentially-oriented nodal planes. The result shows that in the reverse fault regime, where SHmax is oriented NEE, faults striking NW-SE and dipping 30–50° either NE or SW are most likely to slip. According to the analysis, a friction coefficient of 0.5–0.6 can be inferred as an optimum friction angle for NW-SE-oriented faults in the Zagros.
Despite relatively uniform compressive stress orientations on both sides of the N-S Kazerun transverse active fault, the relative principal stress magnitudes inferred from earthquake focal mechanisms abruptly change from a reverse faulting regime to a pure strike-slip faulting regime near the fault segment (Figure 8). Previous studies [2,38,40] have stated that the strike-slip earthquake associated with the old inherited basement Kazerun Fault System occurred at a depth of 4–11 km, with an average depth uncertainty ±3 km in the uppermost basement. In contrast, reverse-faulting focal mechanisms occurred at greater depths (below 12 km) in the basement. In fact, the state of stress in the different sides of the Kazerun Fault System does not change laterally but rather vertically. The same results were reported after seven weeks’ observations of micro-seismicity around the northern end of the near-vertical Kazerun Fault, in which slips at greater depths occurred in response to a pure reverse faulting regime [16]. They reported that nearly all of the relative shallow-depth events resulted from a pure strike-slip regime.
These observations align with the frictional faulting theory that the N-S trending Kazerun Fault System is in an unfavorable orientation for a slip in a reverse fault regime with an average SW-NE SHmax orientation. Figure 8b presents an analysis similar to that of Figure 7b. As shown, the fault striking N-S and dipping more than NE is most likely to slip and is the preferred nodal plane around the Kazerun Fault system. In Figure 8c, black circles on the stereonet plot represent the seismologically actual fault plane around the Kazerun Fault System, showing that the N-S strike fault has a higher slip likelihood. The same fault plane (N-S strike) in a reverse faulting regime (Figure 7b) is not in a geometric state permitting nucleation of an earthquake, except for a fault surface having a frictional strength within μ ≈ 0.3–0.4. Since the state of stress varies with depth, the slip tendency for a N-S strike Kazerun Fault increases when the state of stress changes to the strike-slip regime at the upper depths.
High heat flow in fault zones generally indicates a fault’s frictional resistance to slip and implies that the fault is frictionally strong [84]. Heat flow measured in different oil and gas wells in the Dezful Embayment reflects significantly higher temperatures in the vicinity of the Kazerun Fault System (66 mW/m2) (Figure 4 Rudkiewicz, et al. [85]), whereas the central and northern embayment has a mean heat flux between 30–40 mW/m2. No particular reason is stated for such a high thermal anomaly around the Kazerun line, but one can assume that it results from friction and that the fault is not weak. This supposition is consistent with the lack of reverse slip around the fault, as the frictional strength needs to be as low as 0.3–0.4 (Figure 7b) and demonstrates why most earthquakes around the Kazerun Fault System are a response to a strike-slip stress state. Note that the reverse slip observed in the northern Kazerun Fault System is small in magnitude [16].
Fewer earthquakes in an area can generally be explained by a state of stress in a faulted area that is not sufficient to exceed the rock’s frictional strength. This phenomenon could explain the situation in the Dezful Embayment, as regional geophysics and geological studies have revealed its sedimentary cover to be crisscrossed by faults at both low and highly elevated areas. Similarly, many oil and gas boreholes have been drilled through local faults (Figure S3); nevertheless, earthquakes at shallow depth in the sedimentary cover are rare.
Figure 9 shows a stability analysis of faults mapped in the Zagros area color-coded by the ratio of shear to effective normal stress (the required frictional coefficient) ; it is assumed that the state of stress is on the border of the strike-slip and normal faulting regimes (), as illustrated in the lower left inset in the 3D Mohr diagram. In a normal faulting regime with an average SHmax orientation of , the NW striking faults will have highly unfavourable orientations for slip. The locations of earthquakes since 2009 at a depth above 6 km are mapped as black circles in Figure 9. These earthquakes are scattered over the area, except for the August 2014, Murmuri Mw 6.2 event in the north of the Dezful Embayment.
Since most faults in the area strike NW-SE, almost perpendicular to the maximum horizontal stress orientation, they are critically stressed and associated with seismicity only in the reverse faulting regime (Figure 7). Consequently, the state of stress in the sedimentary cover cannot be as strongly compressional as that in the basement; otherwise, more earthquakes would be expected in the area. In fact, the few earthquakes occurring at shallow depths compared to the number at greater depths in the area, plus the present NW-SE striking faults, strongly indicate that the state of stress in the sedimentary cover in all areas of the Dezful Embayment is a normal/strike-slip faulting regime. This fact confirms that the state of stress in the sedimentary cover is gradually changing from extensional to compressional from the sedimentary cover to the basement. The analysis has determined that earthquakes are concentrated within the basement and concludes that the state of stress at the near-surface deposits is not as compressional as that deeper in the basement.
8. Discussion
The stress orientation in the sedimentary rock strata and the basement shows two entirely distinct types. The stress orientations constrained from inversion of the focal mechanisms are consistently in the NE-SW direction in all areas of the ZFTB. However, lateral variations of stress orientations (blue arrow line in Figure 6) are seen in most of the investigated oil and gas fields in the area, from relatively abrupt changes of borehole breakouts to gradual variations over scales of several hundred meters.
Stress deflections or second-order stress patterns can be due to lateral density/strength contrasts, flexural stresses, or superimposed geological structures such as faults [86]. The magnitude of local stresses relative to regional stress along with the angle between local structures and the regional stress orientation are all significant parameters affecting the deviation of local stress orientation [70,86].
The regional horizontal stress difference (SHmax − Shmin) is the determining factor [86] for these anomalies in the folded and faulted sedimentary cover in the ZFTB. With this compressional state of the stress field at seismogenic depths (5–15 km) in the ZFTB, where SHmax − Shmin ≈ 30 MP/km (see Figure 7), the local uniaxial stress is not sufficient to deflect stress orientation. However, in the sedimentary rock where the regional state of stress has been constrained to be on the border between normal and the strike-slip faulting regime (), a moderate local horizontal stress difference can cause stress deflection. Thus, variations in stress orientations are seen in most of the oil and gas fields examined in the Dezful Embayment.
Stress variation with depth can be explained by decoupling of the stress because of the existence of a ductile formation [87,88,89]. The ZFTB can be considered as a classic case for stress decoupling and a varying stress regime with depth in sedimentary basins due to several continuous highly ductile formations: the Precambrian Hormuz, Triassic Dashtak, and Miocene Gachsaran. These formations can shield the shallower sediments from the compressional strains in the basement rock arising from the collision between the Arabian and Eurasian plates [20,21,22,90]. These detachment horizons can also result in the decoupling of the basement and overburden deformation during crustal compression. Similar vertical variations in the state of a stress regime have been observed in the eastern part of the Paris Basin [88], the eastern North German Basin (NGB) [87,89], and the Nile Delta [91].
9. Conclusions
The state of stress and the style of faulting for the Dezful Embayment in the ZFTB was investigated using data from boreholes drilled for hydrocarbon resources development and from earthquake focal mechanism records. The study supports the following findings:
- Geomechanics study of 25 boreholes confirms that the stresses in the sedimentary cover is normal to strike-slip faulting. This finding is consistent with fault slip tendency analysis of the sedimentary cover, and the relatively few earthquakes at shallower depths, as well as the leak-off test results reported by other researchers.
- The style of faulting and relative stress magnitudes and stress orientation in the area were investigated using Simpson’s (1997) approach in 108 well-constrained earthquake focal mechanisms. This analysis shows that the Anderson fault parameter, , varies from 2 (strike-slip faulting) to 3 (reverse faulting) in the Dezful Embayment, with the highest frequency being between 2.0–2.2, suggesting that the style of faulting in the basement is compressional (a reverse to a strike-slip faulting regime) because the Shmin and SV magnitudes are close to one another but far less than the maximum horizontal stress value.
- Studying both the sedimentary cover and the basement of the Dezful Embayment shows a change from the normal/strike-slip faulting stress regime in the former to a thrust–fault stress regime in the latter.
- Critically stressed fault analysis using the Mohr-Coulomb failure criterion was applied to both the sedimentary cover and the basement in the Dezful Embayment. The analysis shows that the fault plane most likely to slip in the basement is 30–50° dip angle fault aligned NW-SE. The local shallow depth faults, mostly lying NW-SE, are not critically stressed, and in fact, at the current state of stress, they are mechanically quiescent.
Supplementary Materials
The following are available online at https://www.mdpi.com/article/10.3390/geosciences11060254/s1, Figure S1: Stratigraphy column, source rocks, and reservoir formations for the Dezful Embayment, Figure S2: A typical mud weight profile from several wells drilled in the Dezful Embayment, Figure S3: Ultrasonic image logs of well CK-9 and LL-29 along with depth juxtaposed with observations of breakout orientations, Figure S4: The uniaxial compressive rock strength (UCS) histogram of limestone in the Sarvak and Asmari Formations of the Kupal field, Figure S5: The result of stress inversion of focal mechanisms in the northern, southern, and around Kazrun fault system (middle) in the Dezful Embaymen, Figure S5: Histogram of R-value (1 − ϕ) from the inversion of focal mechanism within the 95% confidence region in the northern (top), southern (middle), and around Kazrun fault system (bottom), Figure S6: Histogram of R-value (1 − φ) from the inversion of focal mechanism within the 95% confidence region in the northern (top), southern (middle), and around Kazrun fault system (bottom). Latitude and longitude in each subplot represent the centroid of the corresponding earthquake group. Table S1: Detailed drilling information on sidetracks of well P-7, Table S2: Earthquake source parameters used for stress determination and the tectonic regime in the ZFTB of the Dezful Embayment.
Author Contributions
A.Y. planned the project, the main conceptual ideas, and the proof outline and wrote the paper. S.M. to investigate and supervised the findings of this work. M.B.D. and Y.L. helped supervise the project. All authors discussed the results and contributed to the final manuscript. All authors have read and agreed to the published version of the manuscript.
Funding
This study received no external funding.
Data Availability Statement
The authors confirm that the data supporting the findings of this study are available within the article and its Supplementary Materials.
Acknowledgments
We would like to thank Shahram Sherkati and Mojtab Rajabi for their comments on a preliminary version of the paper. The Generic Mapping Tool (GMT) was used to generate some figures. All earthquake data used in this study are openly available from the Iranian Seismological Centre (www.irsc.ut.ac.ir, accessed on 2 May 2021) or in the Supplementary Materials.
Conflicts of Interest
The authors declare that the research was conducted in the absence of any commercial or financial relationships that could be construed as a potential conflict of interest.
References
- Berberian, M. Master “blind” thrust faults hidden under the Zagros folds: Active basement tectonics and surface morphotectonics. Tectonophysics 1995, 241, 193–224. [Google Scholar] [CrossRef]
- Talebian, M.; Jackson, J. A reappraisal of earthquake focal mechanisms and active shortening in the Zagros mountains of Iran. Geophys. J. Int. 2004, 156, 506–526. [Google Scholar] [CrossRef]
- Bordenave, M.L.; Hegre, J.A. Current distribution of oil and gas fields in the Zagros Fold Belt of Iran and contiguous offshore as the result of the petroleum systems. Geol. Soc. Lond. Spéc. Publ. 2010, 330, 291–353. [Google Scholar] [CrossRef]
- Hauksson, E. State of stress from focal mechanisms before and after the 1992 Landers earthquake sequence. Bull. Seismol. Soc. Am. 1994, 84, 917–934. [Google Scholar]
- Levandowski, W.; Herrmann, R.B.; Briggs, R.; Boyd, O.; Gold, R. An updated stress map of the continental United States reveals heterogeneous intraplate stress. Nat. Geosci. 2018, 11, 433–437. [Google Scholar] [CrossRef]
- Dusseault, M.B. Geomechanical challenges in petroleum reservoir exploitation. KSCE J. Civ. Eng. 2011, 15, 669–678. [Google Scholar] [CrossRef]
- McGarr, A.; Simpson, D.; Seeber, L. 40 Case histories of induced and triggered seismicity. Int. Geophys. 2002, 81, 647–661. [Google Scholar] [CrossRef]
- Shen, L.W.; Schmitt, D.R.; Haug, K. Quantitative constraints to the complete state of stress from the combined borehole and focal mechanism inversions: Fox Creek, Alberta. Tectonophysics 2019, 764, 110–123. [Google Scholar] [CrossRef] [Green Version]
- Dusseault, M.B.; Bruno, M.S.; Barrera, J. Casing Shear: Causes, Cases, Cures. SPE Drill. Complet. 2001, 16, 98–107. [Google Scholar] [CrossRef]
- Allen, M.B.; Saville, C.; Blanc, E.J.-P.; Talebian, M.; Nissen, E. Orogenic plateau growth: Expansion of the Turkish-Iranian Plateau across the Zagros fold-and-thrust belt. Tectonics 2013, 32, 171–190. [Google Scholar] [CrossRef] [Green Version]
- Jackson, J.; Fitch, T. Basement faulting and the focal depths of the larger earthquakes in the Zagros mountains (Iran). Geophys. J. R. Astron. Soc. 1981, 64, 561–586. [Google Scholar] [CrossRef] [Green Version]
- Nissen, E.; Tatar, M.; Jackson, J.A.; Allen, M.B. New views on earthquake faulting in the Zagros fold-and-thrust belt of Iran. Geophys. J. Int. 2011, 186, 928–944. [Google Scholar] [CrossRef] [Green Version]
- Talebian, M.; Jackson, J. Offset on the Main Recent Fault of NW Iran and implications for the late Cenozoic tectonics of the Arabia-Eurasia collision zone. Geophys. J. Int. 2002, 150, 422–439. [Google Scholar] [CrossRef] [Green Version]
- Tatar, M.; Hatzfeld, D.; Ghafory-Ashtiany, M. Tectonics of the Central Zagros (Iran) deduced from microearthquake seismicity. Geophys. J. Int. 2004, 156, 255–266. [Google Scholar] [CrossRef] [Green Version]
- Lacombe, O.; Mouthereau, F.; Kargar, S.; Meyer, B. Late Cenozoic and modern stress fields in the western Fars (Iran): Implications for the tectonic and kinematic evolution of central Zagros. Tectonics 2006, 25, 94. [Google Scholar] [CrossRef] [Green Version]
- Yamini-Fard, F.; Hatzfeld, D.; Tatar, M.; Mokhtari, M. Microearthquake seismicity at the intersection between the Kazerun fault and the Main Recent Fault (Zagros, Iran). Geophys. J. Int. 2006, 166, 186–196. [Google Scholar] [CrossRef] [Green Version]
- Yaghoubi, A.A.; Zeinali, M. Determination of magnitude and orientation of the in-situ stress from borehole breakout and effect of pore pressure on borehole stability—Case study in Cheshmeh Khush oil field of Iran. J. Pet. Sci. Eng. 2009, 67, 116–126. [Google Scholar] [CrossRef]
- Haghi, A.H.; Chalaturnyk, R.; Ghobadi, H. The state of stress in SW Iran and implications for hydraulic fracturing of a naturally fractured carbonate reservoir. Int. J. Rock Mech. Min. Sci. 2018, 105, 28–43. [Google Scholar] [CrossRef]
- Mouthereau, F.; Lacombe, O.; Tensi, J.; Bellahsen, N.; Kargar, S.; Amrouch, K. Mechanical Constraints on the Development of the Zagros Folded Belt (Fars). In Thrust Belts and Foreland Basins; Springer: Berlin/Heidelberg, Germany, 2007; pp. 247–266. [Google Scholar]
- Bahroudi, A.; Koyi, H. Effect of spatial distribution of Hormuz salt on deformation style in the Zagros fold and thrust belt: An analogue modelling approach. J. Geol. Soc. 2003, 160, 719–733. [Google Scholar] [CrossRef]
- Sepehr, M.; Cosgrove, J. Structural framework of the Zagros Fold–Thrust Belt, Iran. Mar. Pet. Geol. 2004, 21, 829–843. [Google Scholar] [CrossRef]
- Walpersdorf, A.; Hatzfeld, D.; Nankali, H.; Tavakoli, F.; Nilforoushan, F.; Tatar, M.; Vernant, P.; Chéry, J.; Masson, F. Difference in the GPS deformation pattern of North and Central Zagros (Iran). Geophys. J. Int. 2006, 167, 1077–1088. [Google Scholar] [CrossRef]
- Sepehr, M.; Cosgrove, J.W. The role of major fault zones in controlling the geometry and spatial organization of structures in the Zagros Fold-Thrust Belt. Geol. Soc. Lond. Spéc. Publ. 2007, 272, 419–436. [Google Scholar] [CrossRef]
- Sherkati, S.; Letouzey, J. Variation of structural style and basin evolution in the central Zagros (Izeh zone and Dezful Embayment), Iran. Mar. Pet. Geol. 2004, 21, 535–554. [Google Scholar] [CrossRef]
- Yaghoubi, A. List of the Earthquake Recorded by IRSC Since 2010 in the Dezful Embayment. Harvard Dataverse. 2020. Available online: https://dataverse.harvard.edu/dataset.xhtml?persistentId=doi:10.7910/DVN/ZABGNF (accessed on 5 June 2021).
- Bordenave, M.L.; Burwood, R. The Albian Kazhdumi Formation of the Dezful Embayment, Iran: One of the Most Efficient Petroleum Generating Systems. In Sandstone Petroleum Reservoirs; Katz, B.J., Ed.; Springer: Berlin/Heidelberg, Germany, 1995; pp. 183–207. [Google Scholar]
- Alavi, M. Tectonics of the zagros orogenic belt of iran: New data and interpretations. Tectonophysics 1994, 229, 211–238. [Google Scholar] [CrossRef]
- Alavi, M. Structures of the Zagros fold-thrust belt in Iran. Am. J. Sci. 2007, 307, 1064–1095. [Google Scholar] [CrossRef]
- Jahani, S.; Callot, J.P.; de Lamotte, D.F.; Letouzey, J.; Leturmy, P. The Salt Diapirs of the Eastern Fars Province (Zagros, Iran): A Brief Outline of their Past and Present. In Thrust Belts and Foreland Basins: From Fold Kinematics to Hydrocarbon Systems; Lacombe, O., Lavé, J., Roure, F.M., Verges, J., Eds.; Springer: Berlin/Heidelberg, Germany, 2007; pp. 289–308. [Google Scholar]
- Pirouz, M. Post-collisional deposits in the Zagros foreland basin: Implications for diachronous underthrusting. Acta Diabetol. 2017, 107, 1603–1621. [Google Scholar] [CrossRef]
- Bahroudi, A.; Koyi, H.A. Tectono-sedimentary framework of the Gachsaran Formation in the Zagros foreland basin. Mar. Pet. Geol. 2004, 21, 1295–1310. [Google Scholar] [CrossRef]
- Mahbaz, S.B.; Sardar, H.; Namjouyan, M.; Mirzaahmadian, Y. Optimization of reservoir cut-off parameters: A case study in SW Iran. Pet. Geosci. 2011, 17, 355–363. [Google Scholar] [CrossRef]
- Sardar, H.; Mahbaz, S.B. Rock physics modeling in sandstone member of Asmari reservoir (a case study from Mansuri oil field). In SEG Technical Program Expanded Abstracts 2009; Society of Exploration Geophysicists: Tulsa, OK, USA, 2009; pp. 2203–2207. [Google Scholar]
- Motiei, H. Stratigraphy of Zagros (In Farsi); Geological Survey of Iran: Tehran, Iran, 1994. [Google Scholar]
- McKenzie, D. Active Tectonics of the Mediterranean Region. Geophys. J. Int. 1972, 30, 109–185. [Google Scholar] [CrossRef] [Green Version]
- Jackson, J.; McKenzie, D. Active tectonics of the Alpine--Himalayan Belt between western Turkey and Pakistan. Geophys. J. Int. 1984, 77, 185–264. [Google Scholar] [CrossRef]
- Ni, J.; Barazangi, M. Seismotectonics of the Zagros continental collision zone and a comparison with the Himalayas. J. Geophys. Res. Space Phys. 1986, 91, 8205. [Google Scholar] [CrossRef]
- Baker, C.; Jackson, J.; Priestley, K. Earthquakes on the Kazerun Line in the Zagros Mountains of Iran: Strike-slip faulting within a fold-and-thrust belt. Geophys. J. Int. 1993, 115, 41–61. [Google Scholar] [CrossRef] [Green Version]
- Priestley, K.; Baker, C.; Jackson, J. Implications of earthquake focal mechanism data for the active tectonics of the south Caspian Basin and surrounding regions. Geophys. J. Int. 1994, 118, 111–141. [Google Scholar] [CrossRef]
- Maggi, A.; Jackson, J.A.; Priestley, K.; Baker, C. A re-assessment of focal depth distributions in southern Iran, the Tien Shan and northern India: Do earthquakes really occur in the continental mantle? Geophys. J. Int. 2000, 143, 629–661. [Google Scholar] [CrossRef] [Green Version]
- Adams, A.; Brazier, R.; Nyblade, A.; Rodgers, A.; Al-Amri, A. Source Parameters for Moderate Earthquakes in the Zagros Mountains with Implications for the Depth Extent of Seismicity. Bull. Seismol. Soc. Am. 2009, 99, 2044–2049. [Google Scholar] [CrossRef]
- Peyret, M.; Rolandone, F.; Dominguez, S.; Djamour, Y.; Meyer, B. Source model for the Mw 6.1, 31 March 2006, Chalan-Chulan earthquake (Iran) from InSAR. Terra Nova 2008, 20, 126–133. [Google Scholar] [CrossRef]
- Hosseini, H.; Pakzad, M.; Naserieh, S. Iranian regional centroid moment tensor catalog: Solutions for 2012–2017. Phys. Earth Planet. Inter. 2019, 286, 29–41. [Google Scholar] [CrossRef]
- Plumb, R.A.; Cox, J.W. Stress directions in eastern North America determined to 4.5 km from borehole elongation measurements. J. Geophys. Res. Space Phys. 1987, 92, 4805–4816. [Google Scholar] [CrossRef]
- Jaeger, J.C.; Cook, N.G.; Zimmerman, R. Fundamentals of Rock Mechanics; John Wiley & Sons: Hoboken, NJ, USA, 2009. [Google Scholar]
- Schmitt, D.R.; Currie, C.A.; Zhang, L. Crustal stress determination from boreholes and rock cores: Fundamental principles. Tectonophysics 2012, 580, 1–26. [Google Scholar] [CrossRef]
- Gaarenstroom, L.; Tromp, R.A.J.; de Jong, M.C.; Brandenburg, A.M. Overpressures in the Central North Sea: Implications for trap integrity and drilling safety. In Geological Society, London, Petroleum Geology Conference Series; Geological Society of London: London, UK, 1993; Volume 4, pp. 1305–1313. [Google Scholar]
- Ward, C.; Andreassen, E. Pressure-While-Drilling Data Improve Reservoir Drilling Performance. SPE Drill. Complet. 1998, 13, 19–24. [Google Scholar] [CrossRef]
- Brace, W.F.; Kohlstedt, D.L. Limits on lithospheric stress imposed by laboratory experiments. J. Geophys. Res. Space Phys. 1980, 85, 6248–6252. [Google Scholar] [CrossRef]
- Byerlee, J. Friction of Rocks, in Rock Friction and Earthquake Prediction; Springer: Berlin/Heidelberg, Germany, 1978; pp. 615–626. [Google Scholar]
- Heidbach, O.; Rajabi, M.; Reiter, K.; Ziegler, M.; Wsm Team. World stress map 2016. Science 2016, 277, 1956–1962. [Google Scholar]
- Talebi, H.; Alavi, S.A.; Sherkati, S.; Ghassemi, M.R.; Golalzadeh, A. In-situ stress regime in the Asmari reservoir of the Zeloi and Lali oil fields, northwest of the Dezful embayment in Zagros fold-thrust belt, Iran. Geosciences 2018, 106, 53–68. [Google Scholar]
- Hosseini, E.; Ghojogh, J.N.; Habibnia, B. Study of Faults in Asmari Formation by FMI Image Log, Case Study: Lali Oilfield. Am. J. Oil Chem. Technol. 2015, 3, 5. [Google Scholar]
- Nabaei, M.; Moazzeni, A.R.; Ashena, R.; Roohi, A. Complete Loss, Blowout and Explosion of Shallow Gas, Infelicitous Horoscope in Middle East. In SPE European Health, Safety and Environmental Conference in Oil and Gas Exploration and Production; Society of Petroleum Engineers (SPE): Vienna, Austria, 2011. [Google Scholar]
- Salehi, M.; Miri, A.; Sherkati, S.; Bahroudi, A. Analysis of pore pressure effect on abnormal thickness variation of Dashtak Fm. as a detachment layer in Fars region of Zagros fold and thrust belt. In International Geophysical Conference and Oil & Gas Exhibition; Society of Exploration Geophysicists and The Chamber of Geophysical: Tulsa, OK, USA, 2012. [Google Scholar]
- Atashbari, V. Origin of Overpressure and Pore Pressure Prediction in Carbonate Reservoirs of the Abadan Plain Basin, in Australian School of Petroleum. Ph.D. Dissertation, University of Adelaide, Adelaide, Australia, 2016. [Google Scholar]
- Soleimani, B.; Hassani-Giv, M.; Fard, I.A. Formation Pore Pressure Variation of the Neocomian Sedimentary Succession (the Fahliyan Formation) in the Abadan Plain Basin, SW of Iran. Geofluids 2017, 2017, 1–13. [Google Scholar] [CrossRef] [Green Version]
- Amiri, M.; Lashkaripour, G.R.; Ghabezloo, S.; Moghaddas, N.H.; Tajareh, M.H. Mechanical earth modeling and fault reactivation analysis for CO2-enhanced oil recovery in Gachsaran oil field, south-west of Iran. Environ. Earth Sci. 2019, 78, 112. [Google Scholar] [CrossRef]
- Najibi, A.R.; Ghafoori, M.; Lashkaripour, G.R.; Asef, M.R. Empirical relations between strength and static and dynamic elastic properties of Asmari and Sarvak limestones, two main oil reservoirs in Iran. J. Pet. Sci. Eng. 2015, 126, 78–82. [Google Scholar] [CrossRef]
- Asef, M.R.; Farrokhrouz, M. Governing parameters for approximation of carbonates UCS. Electron. J. Geotech. Eng. 2010, 15, 1581–1592. [Google Scholar]
- Najibi, A.R.; Asef, M.R. Prediction of seismic-wave velocities in rock at various confining pressures based on unconfined dataPrediction of seismic-wave velocities in rock at various confining pressures based on unconfined data. Geophysics 2014, 79, 235–242. [Google Scholar] [CrossRef]
- Haghnejad, A.; Ahangari, K.; Noorzad, A. Investigation on Various Relations Between Uniaxial Compressive Strength, Elasticity and Deformation Modulus of Asmari Formation in Iran. Arab. J. Sci. Eng. 2014, 39, 2677–2682. [Google Scholar] [CrossRef]
- Farrokhrouz, M.; Asef, M.R.; Kharrat, R. Empirical estimation of uniaxial compressive strength of shale formations. Geophysics 2014, 79, D227–D233. [Google Scholar] [CrossRef]
- Asadi, S.; Javan, M.M.; Bohloli, B.; Mutabashiani, S. Experimental, Numerical and Analytical Investigation the Initiation and Propagation of Hydraulic Fracturing. World Appl. Sci. J. 2013, 22, 637–646. [Google Scholar]
- Mazidi, S.M.; Haftani, M.; Bohloli, B.; Cheshomi, A. Measurement of uniaxial compressive strength of rocks using reconstructed cores from rock cuttings. J. Pet. Sci. Eng. 2012, 86, 39–43. [Google Scholar] [CrossRef]
- Koleini, M. Engineering Geological Assessment and Rock Mass Characterization of the Asmari Formation (Zagros Range) as Large Dam Foundation Rocks in Southwestern Iran. Ph.D. Dissertation, University of Pretoria, Pretoria, South Africa, 2012. [Google Scholar]
- Moos, D.; Zoback, M.D. Utilization of observations of well bore failure to constrain the orientation and magnitude of crustal stresses: Application to continental, Deep Sea Drilling Project, and Ocean Drilling Program boreholes. J. Geophys. Res. Space Phys. 1990, 95, 9305–9325. [Google Scholar] [CrossRef]
- Taghipour, M.; Ghafoori, M.; Lashkaripour, G.R.; Moghaddas, N.H.; Molaghab, A. Estimation of the current stress field and fault reactivation analysis in the Asmari reservoir, SW Iran. Pet. Sci. 2019, 16, 513–526. [Google Scholar] [CrossRef] [Green Version]
- Walker, R.T.; Andalibi, M.J.; Gheitanchi, M.R.; Jackson, J.A.; Karegar, S.; Priestley, K. Seismological and field observations from the 1990 November 6 Furg (Hormozgan) earthquake: A rare case of surface rupture in the Zagros mountains of Iran. Geophys. J. Int. 2005, 163, 567–579. [Google Scholar] [CrossRef] [Green Version]
- Zoback, M.L. First and Second Order Patterns of Tectonic Stress: The World Stress Map Project. J. Geophys. Res. 1992, 97, 11703–11728. [Google Scholar] [CrossRef]
- Gephart, J.W.; Forsyth, D.W. An improved method for determining the regional stress tensor using earthquake focal mechanism data: Application to the San Fernando Earthquake Sequence. J. Geophys. Res. Space Phys. 1984, 89, 9305–9320. [Google Scholar] [CrossRef]
- Michael, A. Determination of stress from slip data: Faults and folds. J. Geophys. Res. Space Phys. 1984, 89, 11517–11526. [Google Scholar] [CrossRef]
- Lund, B.; Townend, J. Calculating horizontal stress orientations with full or partial knowledge of the tectonic stress tensor. Geophys. J. Int. 2007, 170, 1328–1335. [Google Scholar] [CrossRef] [Green Version]
- Hardebeck, J.L.; Michael, A. Damped regional-scale stress inversions: Methodology and examples for southern California and the Coalinga aftershock sequence. J. Geophys. Res. Space Phys. 2006, 111, 172. [Google Scholar] [CrossRef]
- Martinez-Garzon, P.; Kwiatek, G.; Ickrath, M.; Bohnhoff, M. MSATSI: A MATLAB Package for Stress Inversion Combining Solid Classic Methodology, a New Simplified User-Handling, and a Visualization Tool. Seismol. Res. Lett. 2014, 85, 896–904. [Google Scholar] [CrossRef] [Green Version]
- Angelier, J. Tectonic analysis of fault slip data sets. J. Geophys. Res. Space Phys. 1984, 89, 5835–5848. [Google Scholar] [CrossRef]
- Simpson, R.W. Quantifying Anderson’s fault types. J. Geophys. Res. Solid Earth 1997, 102, 17909–17919. [Google Scholar] [CrossRef]
- Yang, W.; Hauksson, E. The tectonic crustal stress field and style of faulting along the Pacific North America Plate boundary in Southern California. Geophys. J. Int. 2013, 194, 100–117. [Google Scholar] [CrossRef] [Green Version]
- Hurd, O.; Zoback, M.D. Intraplate earthquakes, regional stress and fault mechanics in the Central and Eastern U.S. and Southeastern Canada. Tectonophysics 2012, 581, 182–192. [Google Scholar] [CrossRef]
- Snee, J.-E.L.; Zoback, M.D. State of stress in Texas: Implications for induced seismicity. Geophys. Res. Lett. 2016, 43, 10208–10214. [Google Scholar] [CrossRef]
- Lei, X.; Su, J.; Wang, Z. Growing seismicity in the Sichuan Basin and its association with industrial activities. Sci. China Earth Sci. 2020, 63, 1633–1660. [Google Scholar] [CrossRef] [PubMed]
- Morris, A.; Ferrill, D.A.; Henderson, D.B. Slip-tendency analysis and fault reactivation. Geology 1996, 24, 275–278. [Google Scholar] [CrossRef]
- Zoback, M.D.; Harjes, H.-P. Injection-induced earthquakes and crustal stress at 9 km depth at the KTB deep drilling site, Germany. J. Geophys. Res. Space Phys. 1997, 102, 18477–18491. [Google Scholar] [CrossRef]
- Lachenbruch, A.H.; Sass, J.H. Heat flow and energetics of the San Andreas Fault Zone. J. Geophys. Res. Space Phys. 1980, 85, 6185–6222. [Google Scholar] [CrossRef] [Green Version]
- Rudkiewicz, J.L.; Sherkati, S.; Letouzey, J. Evolution of Maturity in Northern Fars and in the Izeh Zone (Iranian Zagros) and Link with Hydrocarbon Prospectivity. In Thrust Belts and Foreland Basins; Springer: Berlin/Heidelberg, Germany, 2007; pp. 229–246. [Google Scholar]
- Sonder, L.J. Effects of density contrasts on the orientation of stresses in the lithosphere: Relation to principal stress directions in the Transverse Ranges, California. Tectonics 1990, 9, 761–771. [Google Scholar] [CrossRef]
- Ahlers, S.; Hergert, T.; Henk, A. Numerical Modelling of Salt-Related Stress Decoupling in Sedimentary Basins–Motivated by Observational Data from the North German Basin. Geosciences 2018, 9, 19. [Google Scholar] [CrossRef] [Green Version]
- Cornet, F.H.; Röckel, T. Vertical stress profiles and the significance of “stress decoupling”. Tectonophysics 2012, 581, 193–205. [Google Scholar] [CrossRef]
- Roth, F.; Fleckenstein, P. Stress orientations found in north-east Germany differ from the West European trend. Terra Nova 2001, 13, 289–296. [Google Scholar] [CrossRef]
- Molinaro, M.; Leturmy, P.; Guezou, J.-C.; De Lamotte, D.F.; Eshraghi, S.A. The structure and kinematics of the southeastern Zagros fold-thrust belt, Iran: From thin-skinned to thick-skinned tectonics. Tectonics 2005, 24. [Google Scholar] [CrossRef]
- Tingay, M.; Bentham, P.; De Feyter, A.; Kellner, A. Present-day stress-field rotations associated with evaporites in the offshore Nile Delta. GSA Bull. 2010, 123, 1171–1180. [Google Scholar] [CrossRef]
Figure 1.
Topographic, structural and seismicity map of Zagros Fold and Thrust Belt along with locations of hydrocarbon fields (green oval shapes). Colored circles are IRSC-recorded earthquake centroid depths since 2010. Details of each earthquake are provided in Yaghoubi (2020). The bottom left histogram shows the depth (km) distribution of earthquakes. Red triangles denote the location of the 25 wells investigated in this study. Fault traces (the solid black lines) are inferred and compiled from Berberian (1995) and Talebian & Jackson (2004). The white lines show the main structural subdivisions of the ZFTB. Major active faults are the HZF, High Zagros Fault; KZ, Kazerun Fault System; MFF, Mountain Front Fault; MRF, Main Recent Fault; MZRF, Main Zagros Reverse Fault; ZFF, Zagros Foredeep Fault; BL, Balarud Fault.

Figure 2.
Examples of (a) borehole breakout in the E-W direction in vertical well CK-8 in the Cheshmeh-khush oil field (3460 m) and (b) tensile induced fracture in NE-SW direction in vertical well KH-5 in the Khesht oil field (2880 m), and (c) one in the N-S direction in vertical well P-2 in the Paydar oil field (3210 m). Note that for (c) the image started from the west (W) side of the borehole to better show two axial induced fractures at θ = 0° and θ = 180°.

Figure 3.
(a) UBI log of borehole breakouts in vertical well P-7 in the Paydar Field at a depth between 3925–4130 m; (b,c) rose diagram and histogram showing that the frequency of observed borehole breakout azimuth in well P-7 (the minimum principal direction) is 100° ± 5.7°.
Figure 3.
(a) UBI log of borehole breakouts in vertical well P-7 in the Paydar Field at a depth between 3925–4130 m; (b,c) rose diagram and histogram showing that the frequency of observed borehole breakout azimuth in well P-7 (the minimum principal direction) is 100° ± 5.7°.

Figure 4.
(a) example of stress concentration around a vertical borehole and the location of borehole breakout and tensile induced fracture and their relation to principal stress orientations; (b) range of possible stress magnitudes (stress polygon) for horizontal principal stress at a depth of 3.5 km where Pp = 35 MPa, and SV = 87.5 MPa; (c,d) rock strength required to initiate a breakout in normal and reverse faulting regimes in the Sarvak and Asmari Formations of the Dezful Embayment, assuming that the stresses at the limit are constrained by a friction coefficient where μ = 0.6, Pp = 10 MPa/km, and SV = 25 MPa/km. The color bar for each case shows the rock strength needed to prevent borehole breakout in vertical boreholes. The white line in the colorbar is to mark the rock strength value of 80 MPa. The Mohr-Coulomb failure criterion and Kirsch equations were used in these calculations.

Figure 5.
Cross-sections of Dezful Embayment displaying topography and seismicity in A-A’ and B-B’ sections shown in Figure 1. The color scale represents earthquake magnitudes. The high seismicity density in the area is restricted to below 5 km. The inset is an upper view of the cross-section profile (red dash line) and its nearby seismicity shown in Figure 1. Details of each earthquake are provided in Yaghoubi (2020).

Figure 6.
(a) Map view of the value of 108 interpreted focal mechanisms in the Dezful Embayment. Colors show the stress regimes, with Aϕ values ranging from 0 to 1.0 for normal faulting, 1.0 to 2.0 for strike-slip faulting, 2.0 to 3.0 for reverse faulting. Red and black lines indicate the orientation of SHmax for individual focal earthquakes (P-Axis) and formal stress inversion respectively. Blue inward arrows show the SHmax direction derived from borehole breakouts and induced tensile fractures of A quality (Table 1). (b) interpreted focal mechanism in southern Dezful Embayment (inset 2); (c) histogram of Aϕ value from the inversion of 108 focal mechanisms using Simpson (1997) approach. Light blue arrow is GPS velocity vectors relative to central Iran derived from Walpersdorf, Hatzfeld, Nankali, Tavakoli, Nilforoushan, Tatar, Vernant, Chéry and Masson [22]. The greatest concentration of earthquakes is around the Balarud fault in the northern part of the embayment (inset 1).

Figure 7.
(a) 3D Mohr’s circle showing representative reverse focal mechanism and resolved shear and normal stresses for each nodal plane. The color inside the beach ball represents and is based on the color bar shown in Figure 6. (b) Lower hemisphere stereonet plot of the preferred nodal plane for 92 focal mechanisms in the Dezful Embayment where the state of stress is a thrust-faulting regime. Colors show the ratio of shear to effective normal stresses (required μ) needed for shear failure on a fault plane.

Figure 8.
(a) Earthquake focal mechanisms in the vicinity of the N-S Kazerun transverse active fault. The state of stress changes from strike-slip faulting around the fault to a reverse faulting regime on either side, whereas the seismologically (red line) determined azimuth SHmax (P-Axis) is stable and uniform around the area. (b) 3D Mohr’s circle showing a representative strike-slip focal mechanism and resolved shear and normal stresses for each nodal plane. The red line on the focal beach-ball indicates the actual fault plane. (c) Lower hemisphere stereonet plot illustrates the slip-tendency (ratio of resolved shear to normal stress) for strike-slip faulting regime nearby Kazerun Fault System and actual nodal plane for 12 fault plane solutions mapped in (a).

Figure 9.
Large-scale faults examined in slip tendency analysis, in terms of for the normal state of stress in the sedimentary cover of Dezful Embayment. Black circles represent earthquakes at a depth above 6 km with Mw ≥ 4 in the area since 2010. The lower left inset illustrates 3D Mohr diagram frictional slip stability assigned for the slip tendency analysis.


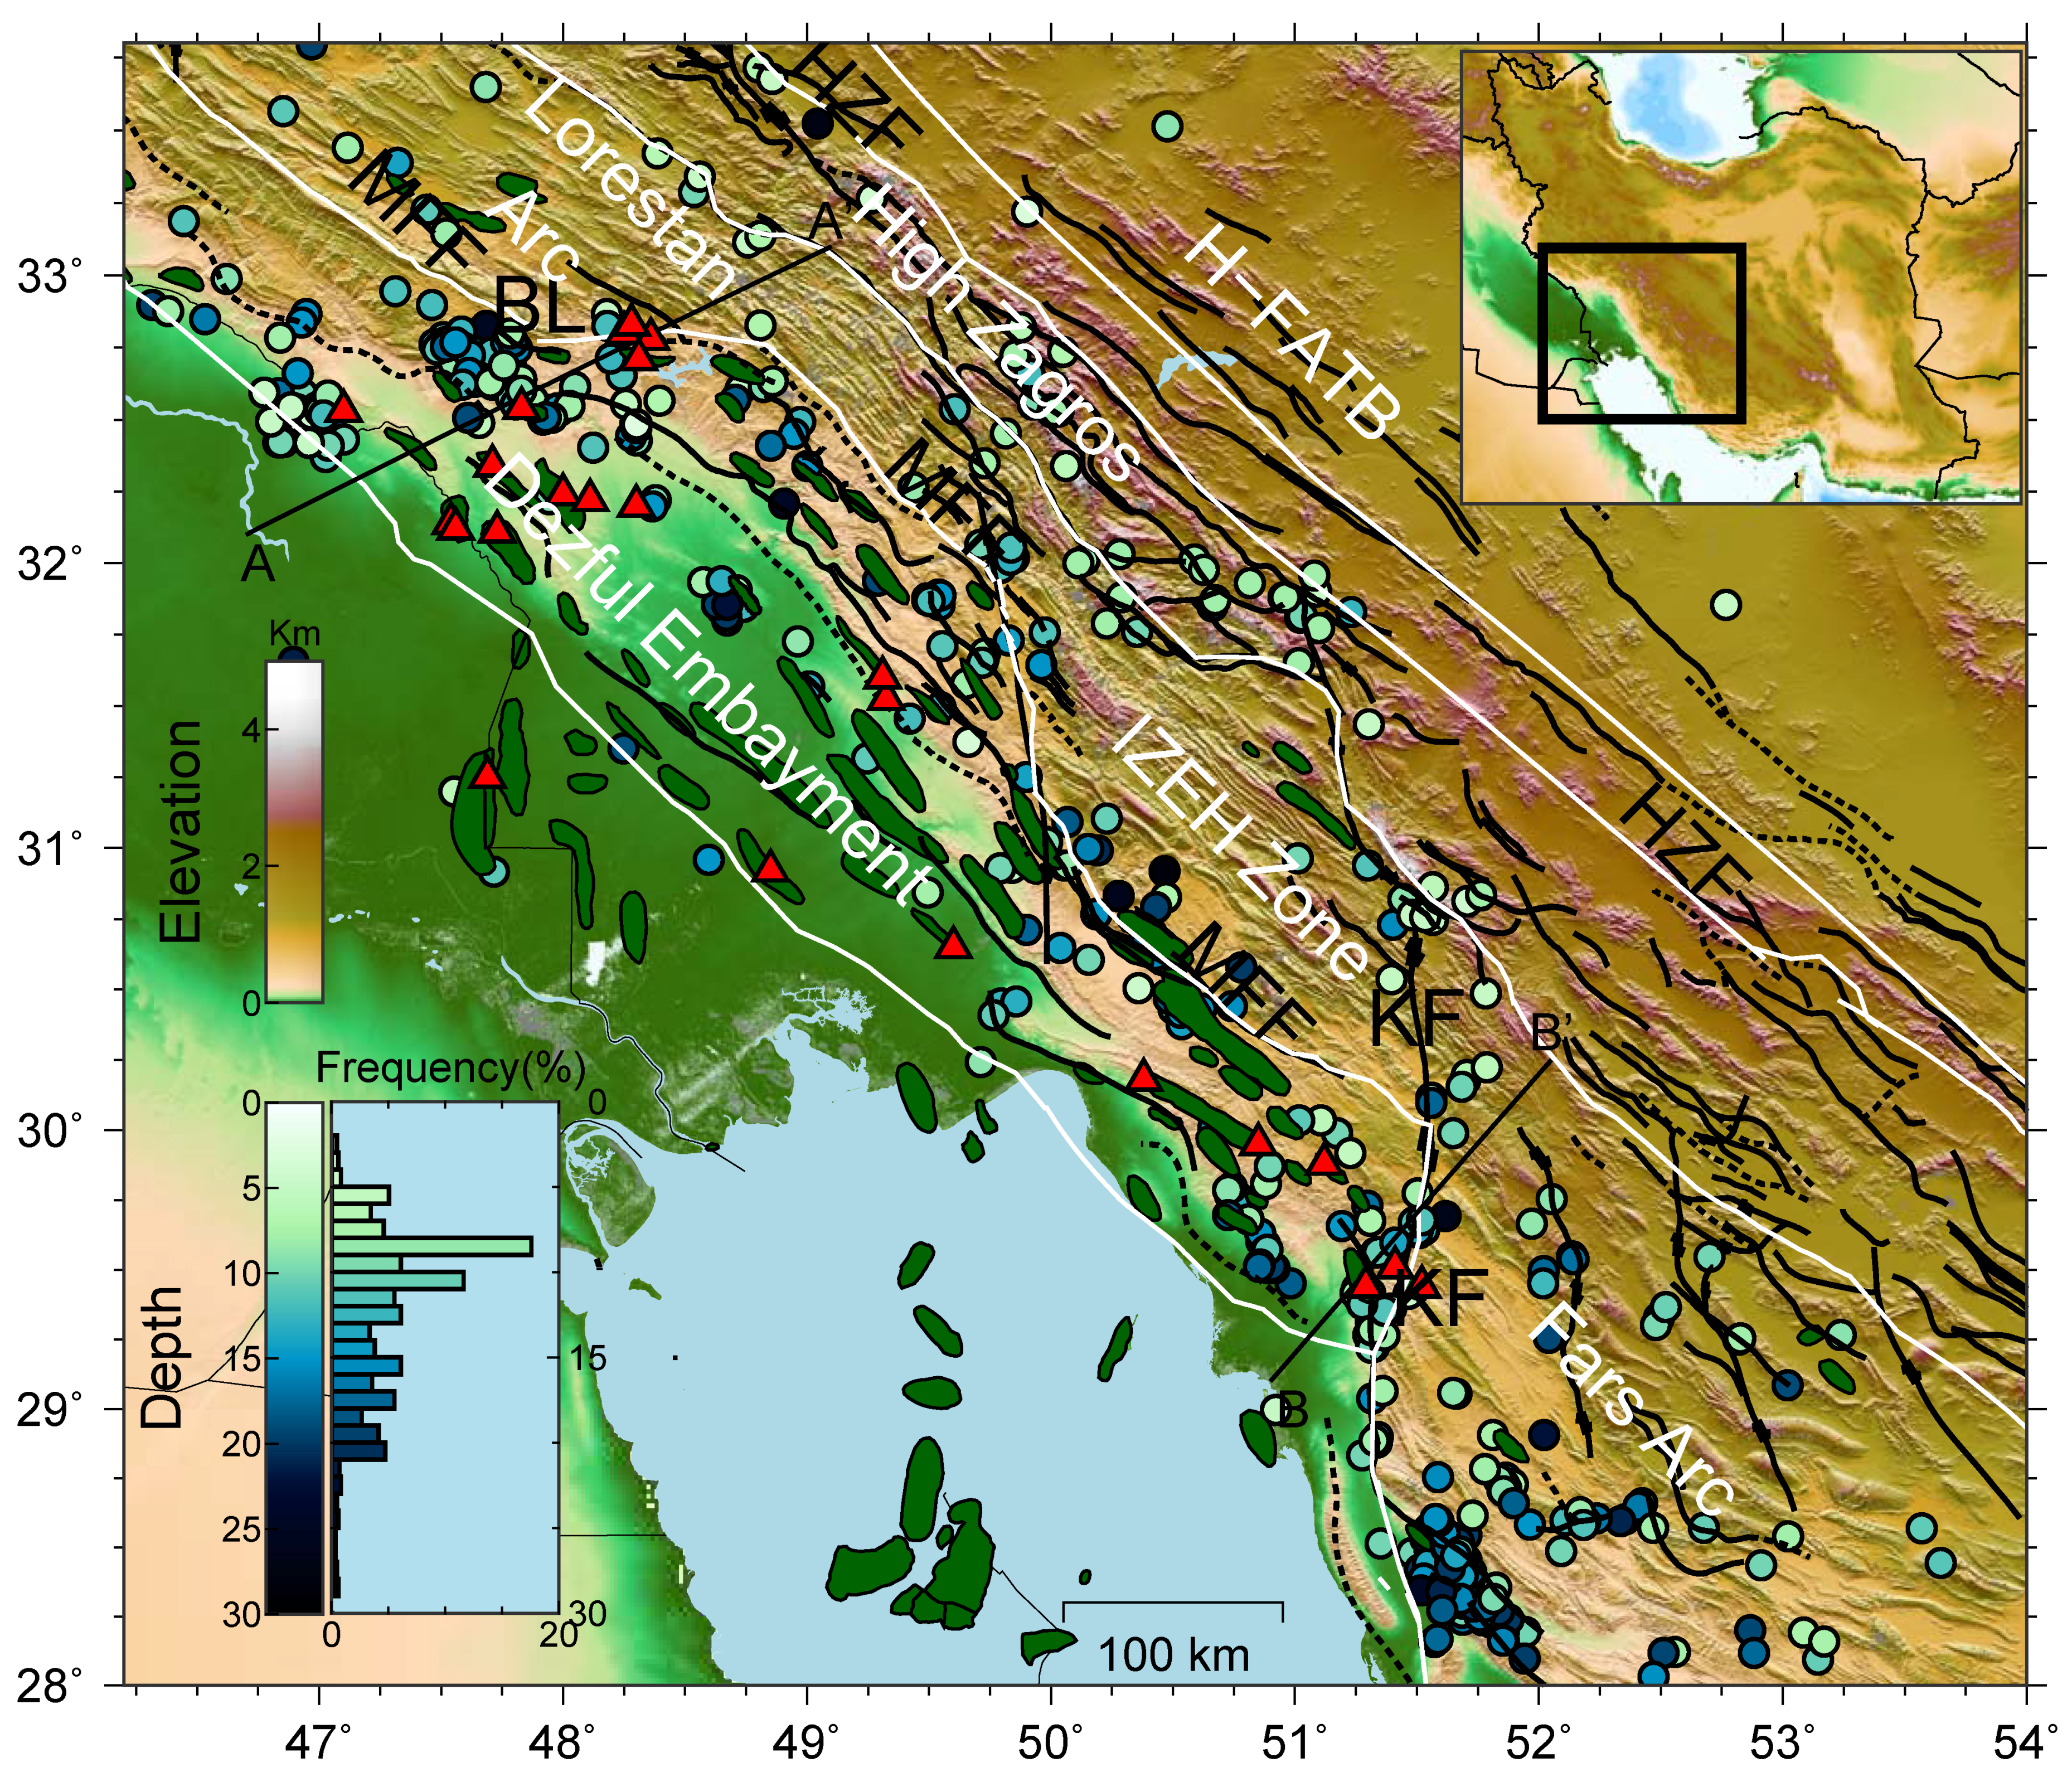
Table 1.
SHmax orientations derived from both borehole breakout (BO) and drilling induced fracture (DIF) in the different fields of the Dezful Embayment (S.D, standard deviation). SHmax orientations are ranked from A to D according to the World Stress Map (WSM) quality ranking system.
Table 1.
SHmax orientations derived from both borehole breakout (BO) and drilling induced fracture (DIF) in the different fields of the Dezful Embayment (S.D, standard deviation). SHmax orientations are ranked from A to D according to the World Stress Map (WSM) quality ranking system.
| Field | Well Name Abbreviation | SHmax Azimuth (deg) | Type | Number | Total Length (m) | Depth (m) | Orientation (deg.) | S.D. | WSM (Quality) |
|---|---|---|---|---|---|---|---|---|---|
| Aghajari | AJ-215 | 32 | BO | 5 | 110 | 2475 | 122 | 7.3 | C |
| Balarud | BL-2 | 147.6 | BO | 6 | 140 | 2243 | 57.6 | 2.1 | B |
| BL-2 | 152.5 | DIF | 6 | 464 | 2174 | 152.5 | 11.1 | B | |
| BL-3 | 175 | BO | 1 | 1616 | 85 | D | |||
| BL-3 | 174.9 | DIF | 10 | 269 | 1805 | 174.9 | 20 | B | |
| BL-4 | 42.9 | BO | 19 | 503 | 1846 | 132.92 | 19.9 | B | |
| BL-4 | 109.9 | DIF | 3 | 18 | 1705 | 109.9 | 18.6 | D | |
| BL-6 | 169.08 | DIF | 24 | 623 | 1934 | 169.08 | 12.9 | A | |
| Bibi-Hakimih | BH-177 | 87.2 | BO | 51 | 210 | 1972 | 177.2 | 11.6 | A |
| BH-179 | 90.3 | BO | 109 | 520 | 2121 | 180.3 | 10.8 | A | |
| Chahar Bisheh | CB-4 | 52 | BO | 149 | 295 | 1953 | 142.0 | 9.9 | A |
| Cheshmeh-khosh | CK-8 | 176 | BO | 25 | 238 | 3548 | 86.00 | 4.2 | A |
| CK-9 | 75 | BO | 43 | 221 | 4172 | 165.00 | 26.0 | C | |
| CK-22 | 182.6 | BO | 10 | 106 | 3522 | 92.6 | 6.9 | A | |
| Dalpari | DP-08 | 157.3 | BO | 30 | 150 | 2340 | 67.3 | 32.1 | D |
| Dehloran | DH-23 | 31.4 | BO | 52 | 415 | 4164 | 121.4 | 7.14 | A |
| Khesht | KH-2 | 138 | BO | 28 | 402 | 2810 | 48.0 | 9.8 | A |
| KH-2 | 142.75 | DIF | 4 | 191 | 2845 | 322.75 | 8.7 | C | |
| KH-5 | 124.05 | BO | 36 | 197 | 2994 | 34.05 | 8.7 | A | |
| KH-5 | 119.4 | DIF | 19 | 215 | 2984 | 299.4 | 17.8 | B | |
| Lali | LL-22 | 44.2 | BO | 35 | 230 | 2278 | 44.2 | 11.2 | A |
| LL-29 | 135 | BO | 158 | 466 | 2547 | 46.10 | 43.3 | E | |
| Mansouri | MI-99 | 72.02 | BO | 22 | 179 | 3259 | 162.02 | 5.02 | A |
| Maroun | MN446 | 75.7 | BO | 167 | 125 | 4293 | 165.70 | 5.3 | A |
| Naft_Sefied | NS-47 | 72.75 | BO | 29 | 270 | 1625 | 162.75 | 9.78 | A |
| Paydar | P-2 | 1.3 | BO | 89 | 681 | 3304 | 91.30 | 6.8 | A |
| P-2 | 179.2 | DIF | 99 | 576 | 3294 | 179.2 | 20.3 | A | |
| P-6 | 10.7 | BO | 213 | 310 | 4045 | 100.7 | 5.7 | A | |
| P-7 | 9.8 | BO | 135 | 230 | 4035 | 99.8 | 6.2 | A | |
| Ramshir | RR-19 | 59.65 | BO | 32 | 248 | 3061 | 149.65 | 6.70 | A |
| RR-19 | 70.8 | DIF | 3 | 48 | 2818 | 70.8 | 3.9 | D | |
| Yaran | YRRN-2 | 43.6 | BO | 11 | 140 | 3980 | 133.60 | 7.5 | A |
Table 2.
Summary of the leak-off test results reported for the Dezful Embayment.
| Field | Lat (°N) | Long (°W) | Depth (m) | Shmin Magnitude (MPa) | Shmin Gradient (MPa/km) | Reference |
|---|---|---|---|---|---|---|
| Gachsaran | 30.32 | 50.48 | 2410 | 35.1 | 14.5 | Amiri, et al. [58] |
| 2578 | 37.7 | 14.6 | ||||
| Ahvaz | 31.19 | 48.4 | 3450 | 52.44 | 15.2 | Haghi, Chalaturnyk and Ghobadi [18] |
| 3513 | 53.4 | 15.2 |
Table 3.
Stress inversion results at different locations in the Dezful Embayment.
| Lat (°N) | Long (°W) | Number of Focal Mechanisms | S1 Azimuth (°) | S1 Plunge (°) | R = (1 − φ) | Faulting Regime |
|---|---|---|---|---|---|---|
| 48 | 33 | 68 | 205 | 3.8 | 0.70 ± 0.2 | R |
| 52 | 29 | 31 | 223 | 5.7 | 0.78 ± 0.25 | R |
| 51.6 | 29.8 | 23 | 221 | 4.3 | 0.84 ± 0.15 | S |
Publisher’s Note: MDPI stays neutral with regard to jurisdictional claims in published maps and institutional affiliations. |
© 2021 by the authors. Licensee MDPI, Basel, Switzerland. This article is an open access article distributed under the terms and conditions of the Creative Commons Attribution (CC BY) license (https://creativecommons.org/licenses/by/4.0/).
Share and Cite
MDPI and ACS Style
Yaghoubi, A.; Mahbaz, S.; Dusseault, M.B.; Leonenko, Y. Seismicity and the State of Stress in the Dezful Embayment, Zagros Fold and Thrust Belt. Geosciences 2021, 11, 254. https://doi.org/10.3390/geosciences11060254
AMA Style
Yaghoubi A, Mahbaz S, Dusseault MB, Leonenko Y. Seismicity and the State of Stress in the Dezful Embayment, Zagros Fold and Thrust Belt. Geosciences. 2021; 11(6):254. https://doi.org/10.3390/geosciences11060254
Chicago/Turabian StyleYaghoubi, Ali, SeyedBijan Mahbaz, Maurice B. Dusseault, and Yuri Leonenko. 2021. "Seismicity and the State of Stress in the Dezful Embayment, Zagros Fold and Thrust Belt" Geosciences 11, no. 6: 254. https://doi.org/10.3390/geosciences11060254
Note that from the first issue of 2016, this journal uses article numbers instead of page numbers. See further details here.