Article

The Driving Mechanisms on Southern Ocean Upwelling Change during the Last Deglaciation

1
Department of Earth and Planetary Sciences, University of California Riverside, Riverside, CA 92521, USA
2
Department of Geography, Ohio State University, Columbus, OH 43210, USA
*
Author to whom correspondence should be addressed.
Geosciences 2021, 11(7), 266; https://doi.org/10.3390/geosciences11070266
Submission received: 28 April 2021 / Revised: 15 June 2021 / Accepted: 18 June 2021 / Published: 22 June 2021

Abstract

:
We explore the change in Southern Ocean upwelling during the last deglaciation, based on proxy records and a transient climate model simulation. Our analyses suggest that, beyond a conventional mechanism of the Southern Hemisphere westerlies shift, Southern Ocean upwelling is strongly influenced by surface buoyancy forcing and the local topography. Over the Antarctic Circumpolar Current region, the zonal mean and local upwelled flows exhibited distinct evolution patterns during the last deglaciation, since they are driven by different mechanisms. The zonal mean upwelling is primarily driven by surface wind stress via zonal mean Ekman pumping, whereas local upwelling is driven by both wind and buoyancy forcing, and is tightly coupled to local topography. During the early stage of the last deglaciation, the vertical extension of the upwelled flows increased downstream of submarine ridges but decreased upstream, which led to enhanced and diminished local upwelling, downstream and upstream of the submarine ridges, respectively.

1. Introduction

Paleo-proxy reconstructions have shown dramatic changes in the Southern Ocean upwelling during the last deglaciation, which potentially contribute to the deglacial rise of atmospheric CO2 [1,2,3,4,5]. The “westerlies shift” hypothesis is one of the mostly discussed mechanisms on the changes in Southern Ocean upwelling. According to this hypothesis, an equatorward shift of the Southern Hemisphere westerlies acts to weaken the Southern Ocean upwelling during glacial periods such that more respired CO2 accumulates in deep oceans while the atmospheric CO2 concentration reduces [6,7,8]. During interglacial periods, a poleward displacement of the the Southern Hemisphere westerlies intensifies the Southern Ocean upwelling and respired CO2 outgassing [1,9,10], thus leading to an increase in CO2 in the atmosphere. Such glacial–interglacial swings of the Southern Hemisphere westerlies and Southern Ocean upwelling could be coupled to atmospheric CO2 variations and be related to the global mean climate, the bipolar seesaw and Earth’s obliquity [5].
Nevertheless, the “westerlies shift” hypothesis is confronted with several challenges. First, the meridional shifts of the Southern Hemisphere westerlies during the glacial–interglacial transition show large uncertainties in either proxy records [11,12,13,14,15,16,17,18,19,20,21,22,23] or climate model simulations [24,25,26,27,28,29]. Seen from various paleo-proxies (e.g., pollen, dust and lake level), the Southern Hemisphere westerlies during the Last Glacial Maximum (LGM, ∼ 21,000 years ago) likely displace either equatorward [11,12,13,14,15,16] or poleward [16,17,18,19,20,21,22,23] from their position in the modern climate. Similarly, paleo-climate modeling also shows diverse results regarding the changes in the strength and position of the Southern Hemisphere westerlies between LGM and modern climates. Paleoclimate Modeling Intercomparison Project Phase 2 and 3 (PMIP2 and PMIP3) models simulate either an equatorward or poleward shift of the LGM Southern Hemisphere westerlies [24,25,26,27,28,29], or little shift but a change in the wind strength [24,30]. Therein, a sea-ice effect on the westerlies shift is highlighted from the model results. During the LGM, Antarctic sea ice, which modulates the meridional and vertical gradients of atmosphere temperature, greatly expanded, counteracting the equatorward tendency of wind shifts in the colder climate and bringing out a slight poleward displacement of the Southern Hemisphere westerlies [28,29].
The “westerlies shift” hypothesis is intrinsically proposed for the upwelled flow over the Southern Ocean from a zonal mean perspective, whereas evidences of Southern Ocean upwelling change are mostly derived from a limited number of proxy records at scattered sites [2,31,32]. As shown in previous studies, perhaps due to the lack of an integrated data set, the local upwelling from individual proxy record is usually treated as a representative of zonal mean upwelling, and therefore, the wind-driven mechanism is adopted to explain the glacial–interglacial changes in Southern Ocean upwelling from a zonal mean perspective [2]. However, given the complex local topography and, in turn, the significant differences between local and zonal mean upwelled flows, it has remained unclear whether features derived from a few local upwelling proxies can truly represent those of zonal mean upwelling over the Southern Ocean.
In this study, we elucidate that local and zonal mean upwelled flows in the Southern Ocean are driven by distinct mechanisms. Combining paleo-proxy records and a simulation of the Transient Climate of the Last 21,000 Years (TraCE-21ka) [33], we show that, besides the “westerlies shift" hypothesis, several alternative mechanisms, such as freshwater forcing and topography effects, can explain the changes in Southern Ocean upwelling during the last deglaciation. Our mechanisms are built on Southern Ocean dynamics [34,35] in which the bottom topography in the Southern Ocean can strongly affect the wind-driven upwelling by undermining the barotropic structure of vertical flows. This topographic effect, meanwhile, is largely dependent on deep ocean stratification. During the last deglaciation, deep ocean stratification was greatly modulated by the changes in surface freshwater fluxes over the Southern Ocean. As a result, topographic effects expectedly varied correspondingly during the deglaciation, and should have contributed to the change in Southern Ocean upwelling.
The rest of the paper is structured as follows: Section 2 gives a brief introduction of TraCE-21ka and paleo-proxy data as well as the approaches used for the data–model comparison. A subsequent analysis is made in Section 3 that focuses on the mechanisms driving the changes in Southern Ocean upwelling during the last deglaciation from local and zonal mean perspectives. Conclusions and discussions are given in Section 4.

2. Model and Approaches

We use a synchronously coupled atmosphere-ocean general circulation model, the National Center for Atmospheric Research (NCAR) Community Climate System Model version 3 (CCSM3) [36], in the version of T31_gx3v5 resolution [37]. CCSM3 includes the atmosphere component of Community Atmosphere Model version 3 (CAM3) [38], the land component of Community Land Surface Model version 3 (CLM3) [39], the sea ice component of Community Sea Ice Model version 5 (CSIM5) [40] and the ocean component of Parallel Ocean Program version (POP) [41]. CAM3 and CLM3 adopt a horizontal resolution of T31 spectral truncation (3.75 by 3.75 transform grid), with 26 vertical levels in CAM3. POP and CSIM5 adopt an x3ocn horizontal grid (nominally 3 ), with 25 vertical levels in POP.
TraCE-21ka is carried out with CCSM3 and initialized from an earlier LGM equilibrium simulation in which dynamic vegetation is included [42]. From LGM to the present-day climate, TraCE-21ka adopts the boundary conditions and external forcings, such as Earth’s orbits, atmospheric greenhouse gases (GHGs), ice sheets and meltwater discharge into oceans inferred from paleo-evidences (Figure 1a,b). Driven by these boundary conditions and external forcings, TraCE-21ka is successful in capturing many key features of climate evolution during the last deglaciation, such as changes in the Atlantic Meridional Overturning Circulation (AMOC; Figure 1c) as well as cooling during Heinrich event 1, the abrupt Bølling–Allerød warming and cooling in the Younger Dryas [33,43,44]. In this study, analyses are performed using decadal mean model outputs of TraCE-21ka during the last 22,000 years.
Regarding observations, we use preserved opal fluxes and the 231Pa/230Th ratio in the sedimentary record as proxies for Southern Ocean upwelling [2,32]. The benchmark here is to compare the simulated upwelling with its proxy-indicated counterpart at multiple sites for the credibility of further analyses. Since TraCE-21ka does not include a silica cycle in its ocean component, we cannot make a direct comparison between the model and observations in terms of opal fluxes or other upwelling proxies. As an alternative, we use the column integrated upwelling as a proxy analogous to opal fluxes, considering that opal production is likely to be governed by an integrated upwelled flow throughout different ocean depths [48]. At individual sites, the local upwelling is estimated as a gridded upward velocity w u p on each level and a gridded volume-averaged velocity w ¯ u p over the whole depth. Particularly, w u p and w ¯ u p are calculated as follows:
w u p = w w > 0 0 w 0
w ¯ u p = k = 1 N w u p ( k ) d z ( k ) k = 1 N d z ( k )
where w u p ( k ) and d z ( k ) are, respectively, the gridded upwelling velocity and the thickness of the kth level, and N is the number of grids in the vertical at each site. Moreover, to explore the Southern Ocean upwelling from a zonal mean perspective, we focus on zonal mean vertical velocity w ¯ and Ekman pumping w ¯ E k . We examine the area-averaged velocity ( w A C C ) over the latitudinal belt of the Antarctic Circumpolar Current (ACC) and the upwelling over the ACC region ( w ¯ A C C u p ). Particularly, w A C C and w ¯ A C C u p are calculated as follows:
w A C C = 1 A x y y S y N w d y d x
w A C C u p = w A C C w A C C > 0 0 w A C C 0
w ¯ A C C u p = k = 1 N w A C C u p ( k ) d z ( k ) k = 1 N d z ( k )
where w A C C u p ( k ) is the value of w A C C u p at the kth level. y N and y S are the northern and southern boundaries of the ACC region and A x y denotes the area of the ACC region. We also calculate the Ekman pumping averaged over the ACC region:
w ¯ E k = 1 A x y y S y N w e d y d x = 1 ϕ N ϕ S ϕ S ϕ N ϕ τ x f ρ 0 d ϕ = Δ τ x f ρ 0 Δ ϕ
where Δ τ x = τ x ( ϕ N ) τ x ( ϕ S ) denotes the difference of zonal wind stress between the southern ( ϕ S = 62 ° S ) and northern ( ϕ S = 55 ° S ) boundaries, w e denotes local Ekman pumping, Δ ϕ = ϕ N ϕ S denotes the latitudinal span, f is Coriolis parameter and ρ 0 is water density.

3. Results

3.1. Southern Ocean Upwelling Indicated by Proxy Records and in TraCE-21ka

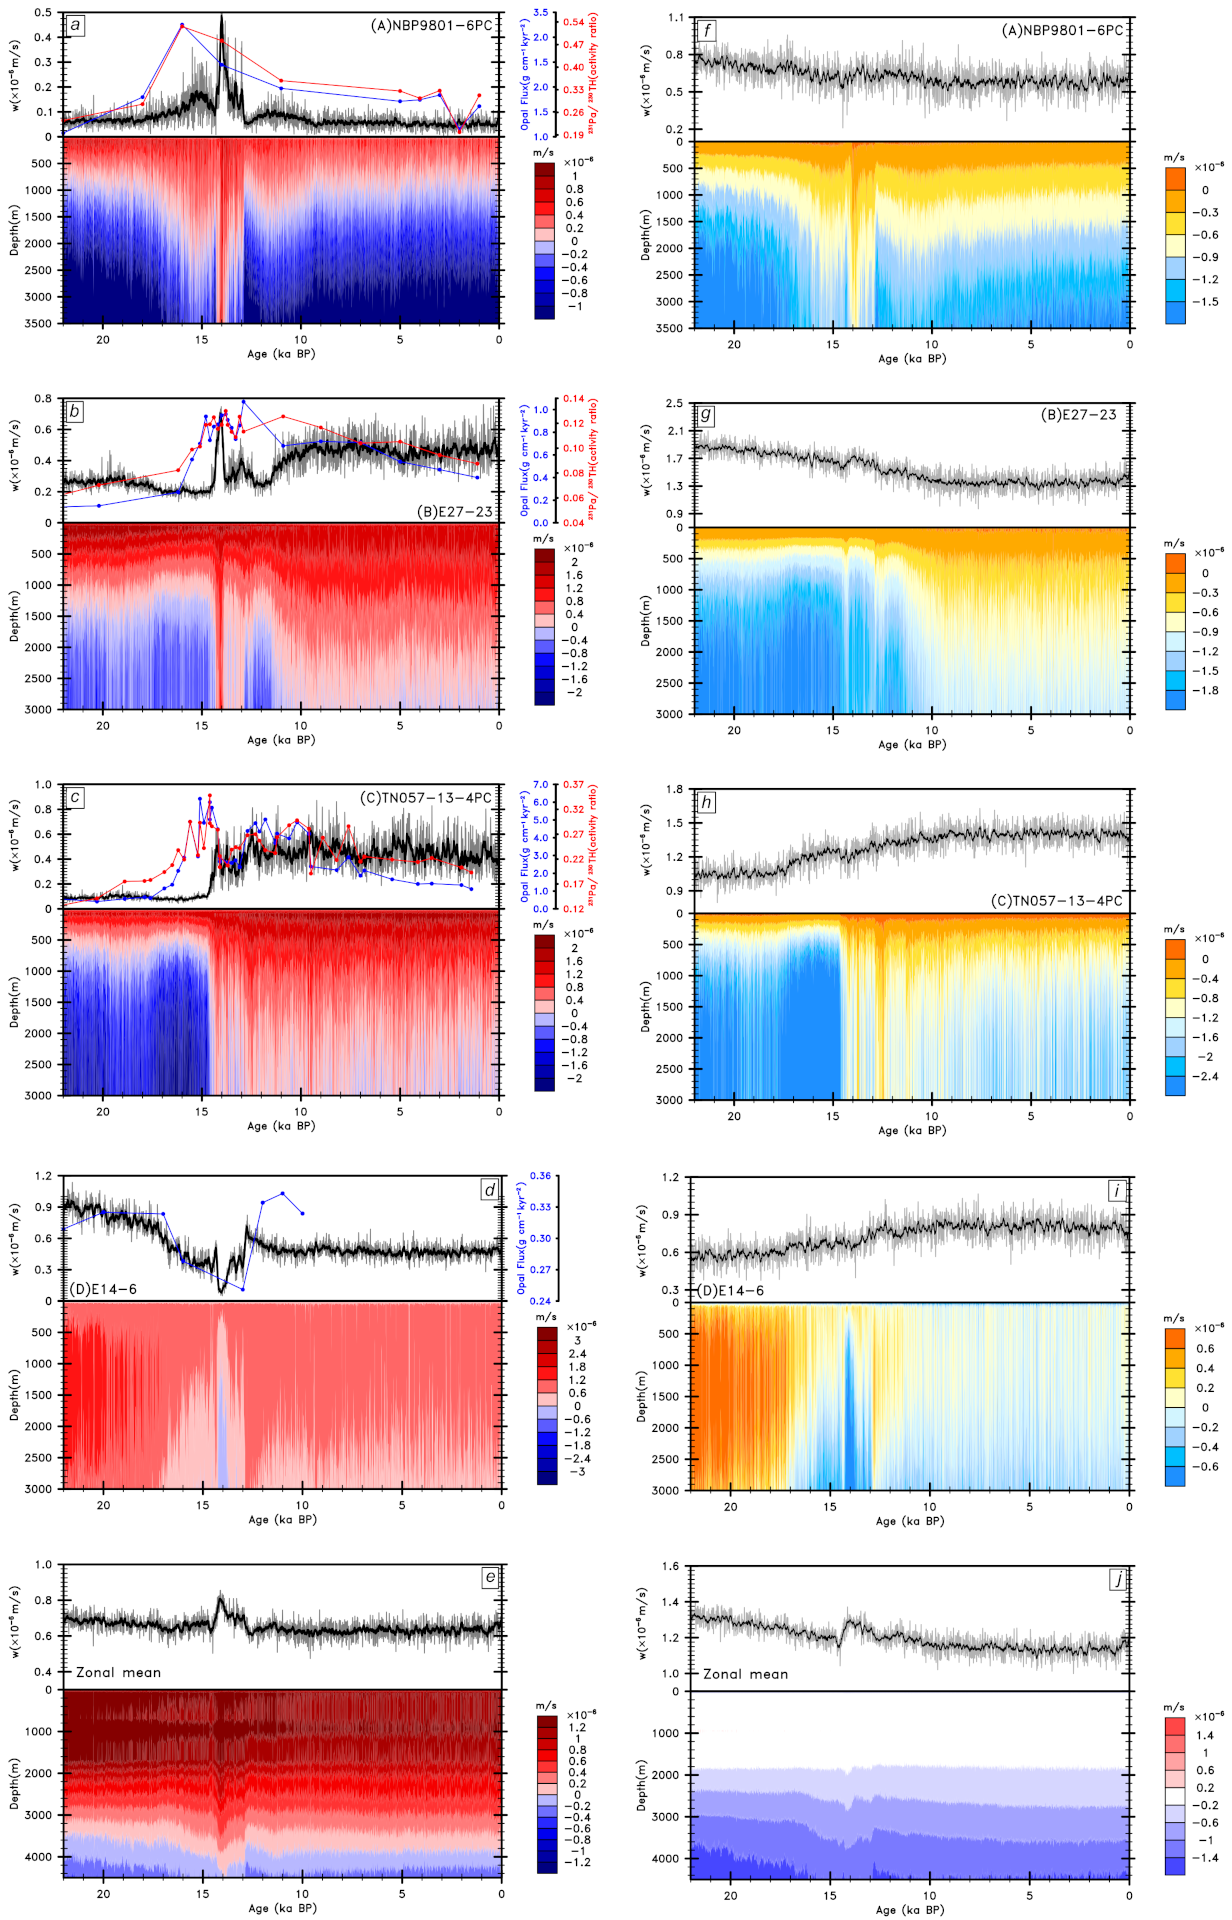
We investigate the local upwelling indicated by paleo-proxies and simulated by TraCE-21ka at four sites (Figure 2) scattered over the Southern Ocean along the path of the ACC: NBP9802-6PC (169.9 W, 61.9 S), E27-23 (155.24 E, 59.62 S), TN057-13-4PC (5.1 E, 53.2 S) and E14-6 (160.15 E, 57.01 S). These cores are selected to provide high-resolution records of opal accumulation during the last deglaciation, which are denoted as cores A–D, thereafter. Since the LGM, upwelling implied from proxy records exhibited dramatic changes. It increased toward ∼15 ka at cores A, B and C, but decreased at core D (Figure 1d–g), which indicates that changes in zonal mean and local upwelled flows over the ACC region potentially followed different evolution patterns during the last deglaciation.
The simulated upwelling in TraCE-21ka, on the other hand, exhibits generally consistent features with the proxy records over the four sites, albeit with some differences in the timing and magnitude of the upwelling changes (Figure 1d–g). Particularly, both observations and model simulations reveal intensified upwelling at cores A–C but weakened upwelling at core D. In contrast, the zonal mean upwelling over the ACC region has little altered during the last 22,000 years, except a small increase during the Bølling–Allerød interstadial (Figure 1h), which is different from that of any local upwelling at cores A–D. Moreover, it is worth noting that TraCE-21ka simulates a poleward displacement of Southern Hemisphere westerlies during the LGM from their present day position (Figure 1h). This pattern is consistent with the wind shifts in multiple PMIP3 models, indicative of the role of Antarctic sea ice in modulating the westerlies shift [28]. During the last deglaciation, Southern Hemisphere westerlies showed a consistently equatorward shift in TraCE-21ka (Figure 1h), suggesting that the westerlies shift seems unlikely to be the major mechanism for the change in Southern Ocean upwelling.
Based on the results above, we elucidate that the available local upwelling reconstructions from individual proxy records are not representative of the zonal mean upwelling over the ACC region and thus cannot be interpreted to be forced predominantly by the westerlies shift. Instead, changes in the local and zonal mean ocean upwelled flows during the last deglaciation could be driven by different mechanisms.

3.2. The Mechanism of Zonal Mean Upwelling Changes in the Southern Ocean

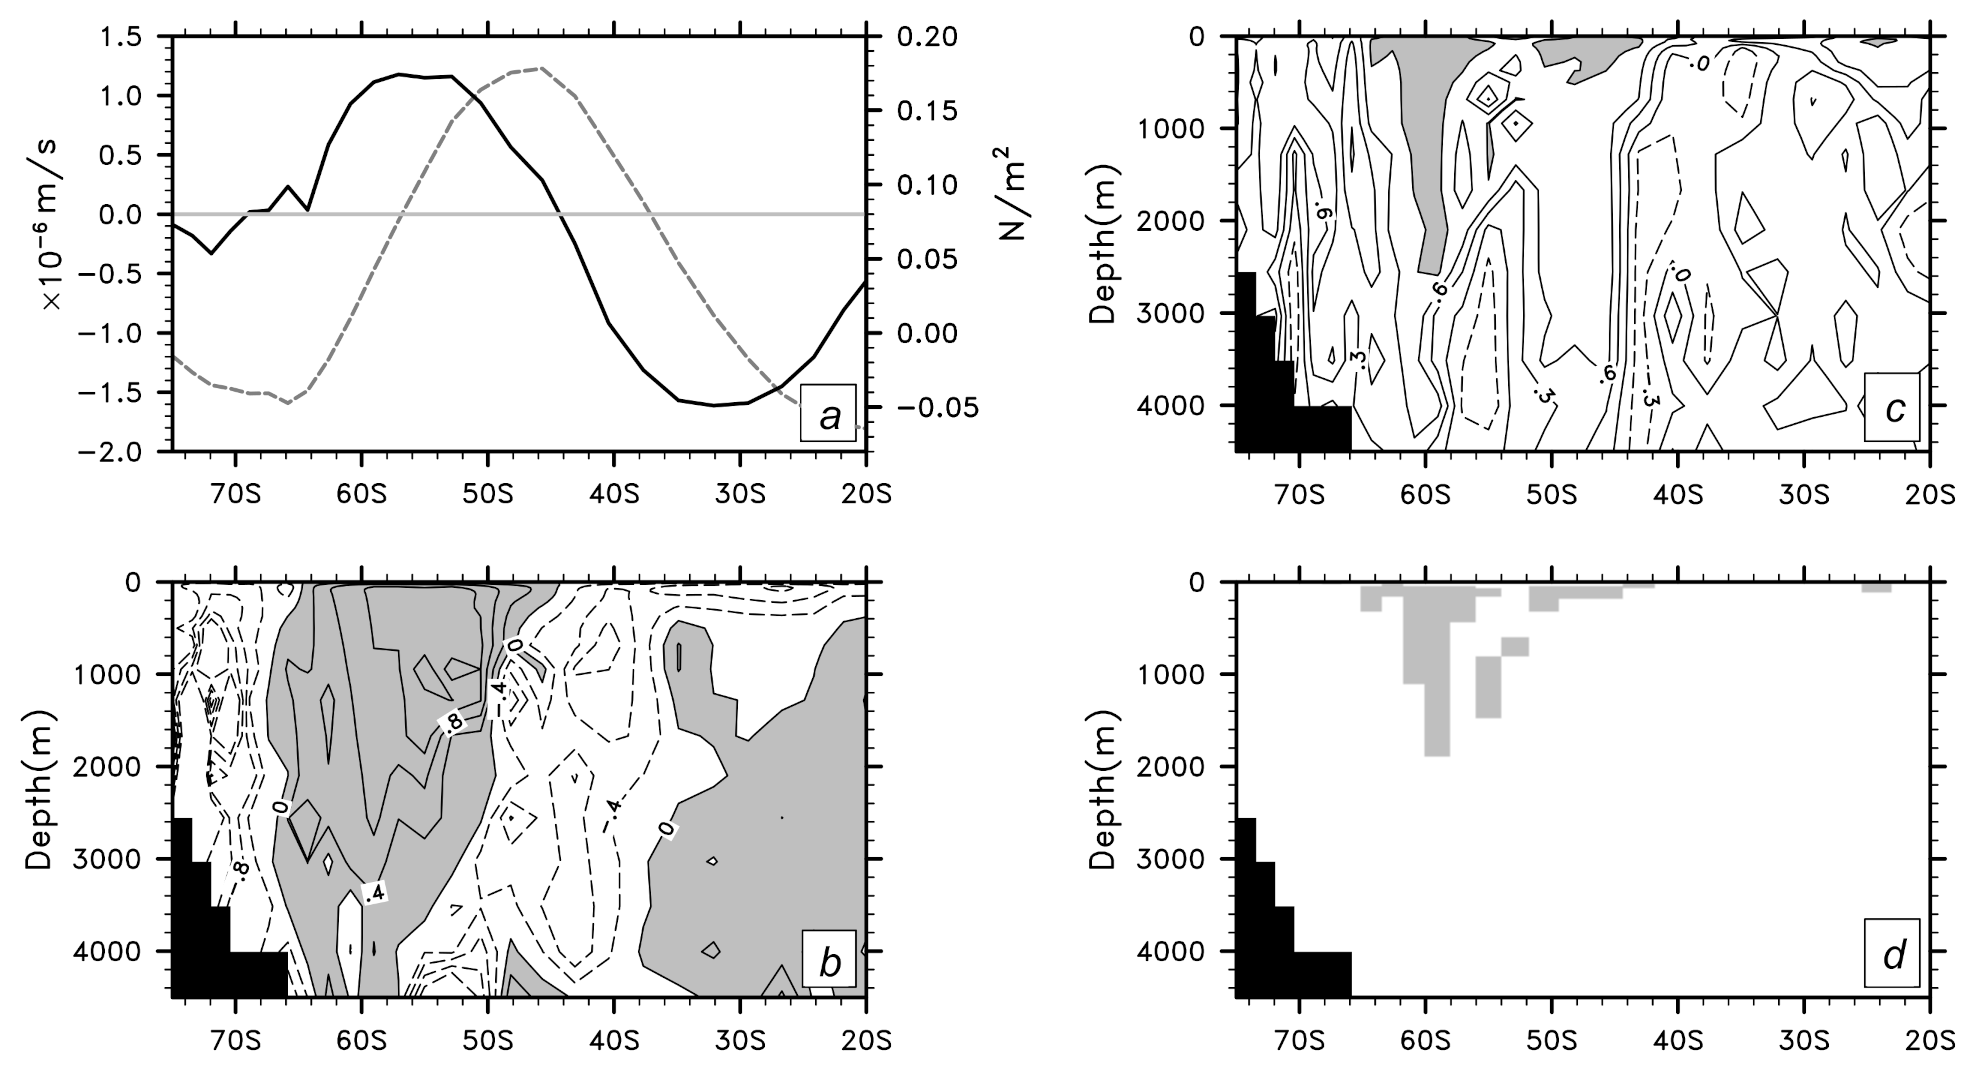
We find that the change in zonal mean Southern Ocean upwelling is driven mainly by changes in surface wind stress and associated Ekman pumping. As shown in Figure 3a, surface westerly winds over the Southern Ocean drive a northward Ekman transport, whose divergence leads to a positive (upward) Ekman pumping to the south of the wind maximum, and in turn, an upwelling below the Ekman layer (Figure 3c). Over the ACC region, the wind effect can penetrate to a mid-depth of ∼2000 m, above which the ocean is unblocked by the topography and is, therefore, driven by interfacial form stress, according to the “open channel” dynamics [49,50]. As a result, the magnitude of the zonal mean upwelling in the upper 2000 m equals approximately that of the zonally mean Ekman pumping within this region (Figure 3d). Note here that the definition of “approximate equality” is based on two conditions: (1) the correlation coefficient between vertical velocity w and Ekman pumping w ¯ E k is higher than 0.9 (see Figure 3b); and (2) the difference between the two is one order smaller than either in magnitude (see Figure 3d).
During the last deglaciation, the zonal mean Ekman pumping and therefore, the vertical velocity in the upper ∼ 2000 m over the ACC showed a general decline trend, except a sharp increase during the Bølling–Allerød interstadial (Figure 4e). Below ∼2000 m, waters are blocked by the Drake Passage and flows are greatly affected by the bottom topography. Surface wind forcing can penetrate the unblocked levels over the ACC region and drive deep ocean flows in an advective ventilation depth [51]. As a result, the deep ocean upwelling extends deepest during the Bølling–Allerød interstadial (Figure 4e). To summarize, our results suggest that the zonal mean upwelling is primarily wind-driven in the ACC region, exhibiting a decline trend throughout the last 22,000 years, except a short intensification during the Bølling–Allerød interstadial.

3.3. The Mechanism of Local Ocean Upwelling Changes in the Southern Ocean

We further delve into the mechanism that determines the local upwelling at the four core sites, using TraCE-21ka. We find that changes in the column integrated upwelling (Figure 1d–g) depend more on the vertical extension than the strength of upwelled flows during the last deglaciation. This feature is evident in the vertical profiles of local upwelling at the four core sites (Figure 4a–d). From ∼17 ka to ∼14 ka, increases of local upwelling at sites A, B and C are mainly caused by a vertical extension of upwelled flows from ∼1000 m to ocean bottom (Figure 4a–c), whilst the decrease of the local upwelling at site D is primarily related to shallowing upwelled flows from the ocean bottom to ∼1000 m (Figure 4d). These changes in the vertical extension of local upwelled flows are much larger than that in zonal mean upwelled flows over the ACC region (Figure 4e).
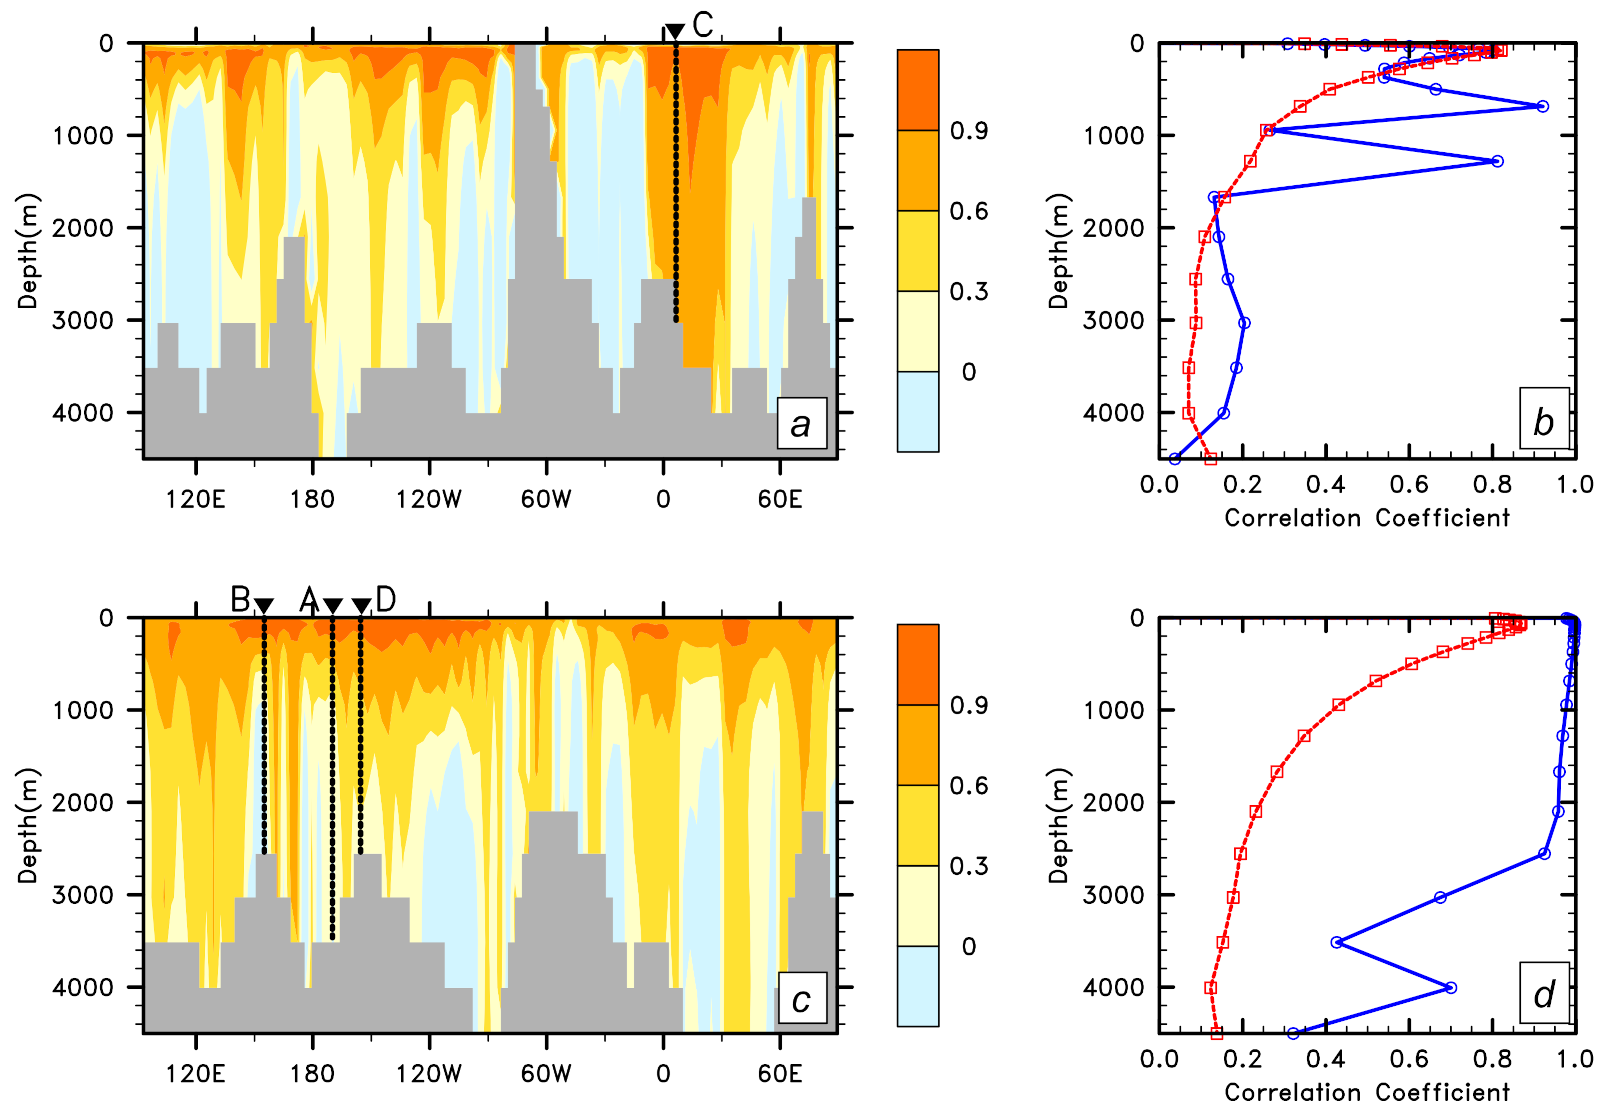
The difference in the change of vertical extension between local and zonal mean upwelled flows indicates different mechanisms driving these flows during the last deglaciation. Herein we examine the correlation between vertical velocity and Ekman pumping from both local and zonal mean perspectives. We find that the zonal mean vertical velocity over the ACC region is highly correlated with the zonal mean Ekman pumping to a depth of ∼2000 m in the unblocked levels (Figure 5d). In contrast, correlation profiles between local Ekman pumping and local vertical velocity vary greatly along a latitudinal circle (Figure 5a,b). The zonal average of these local correlations diminishes rapidly with depth (Figure 5c,d), indicating that local upwelling is driven by mechanisms beyond local wind forcing.
To better understand the mechanism that controls the vertical extension of local upwelling, we interpret the vertical velocity w into two parts: the local Ekman pumping w e , and the depth-dependent w p v a that denotes the vertical integration of the convergence of the meridional velocity of large-scale geostrophic flows. Particularly, if we start from the planetary vorticity conservation in a water column below the Ekman layer, we have the following:
β v = f w z
where β is the gradient of the Coriolis parameter f, and v denotes the meridional velocity. Integrating Equation (7) from an arbitrary depth z to the bottom of the Ekman layer z = d , we have the following:
w ( z ) = w e β f z d v d z = w e + w p v a
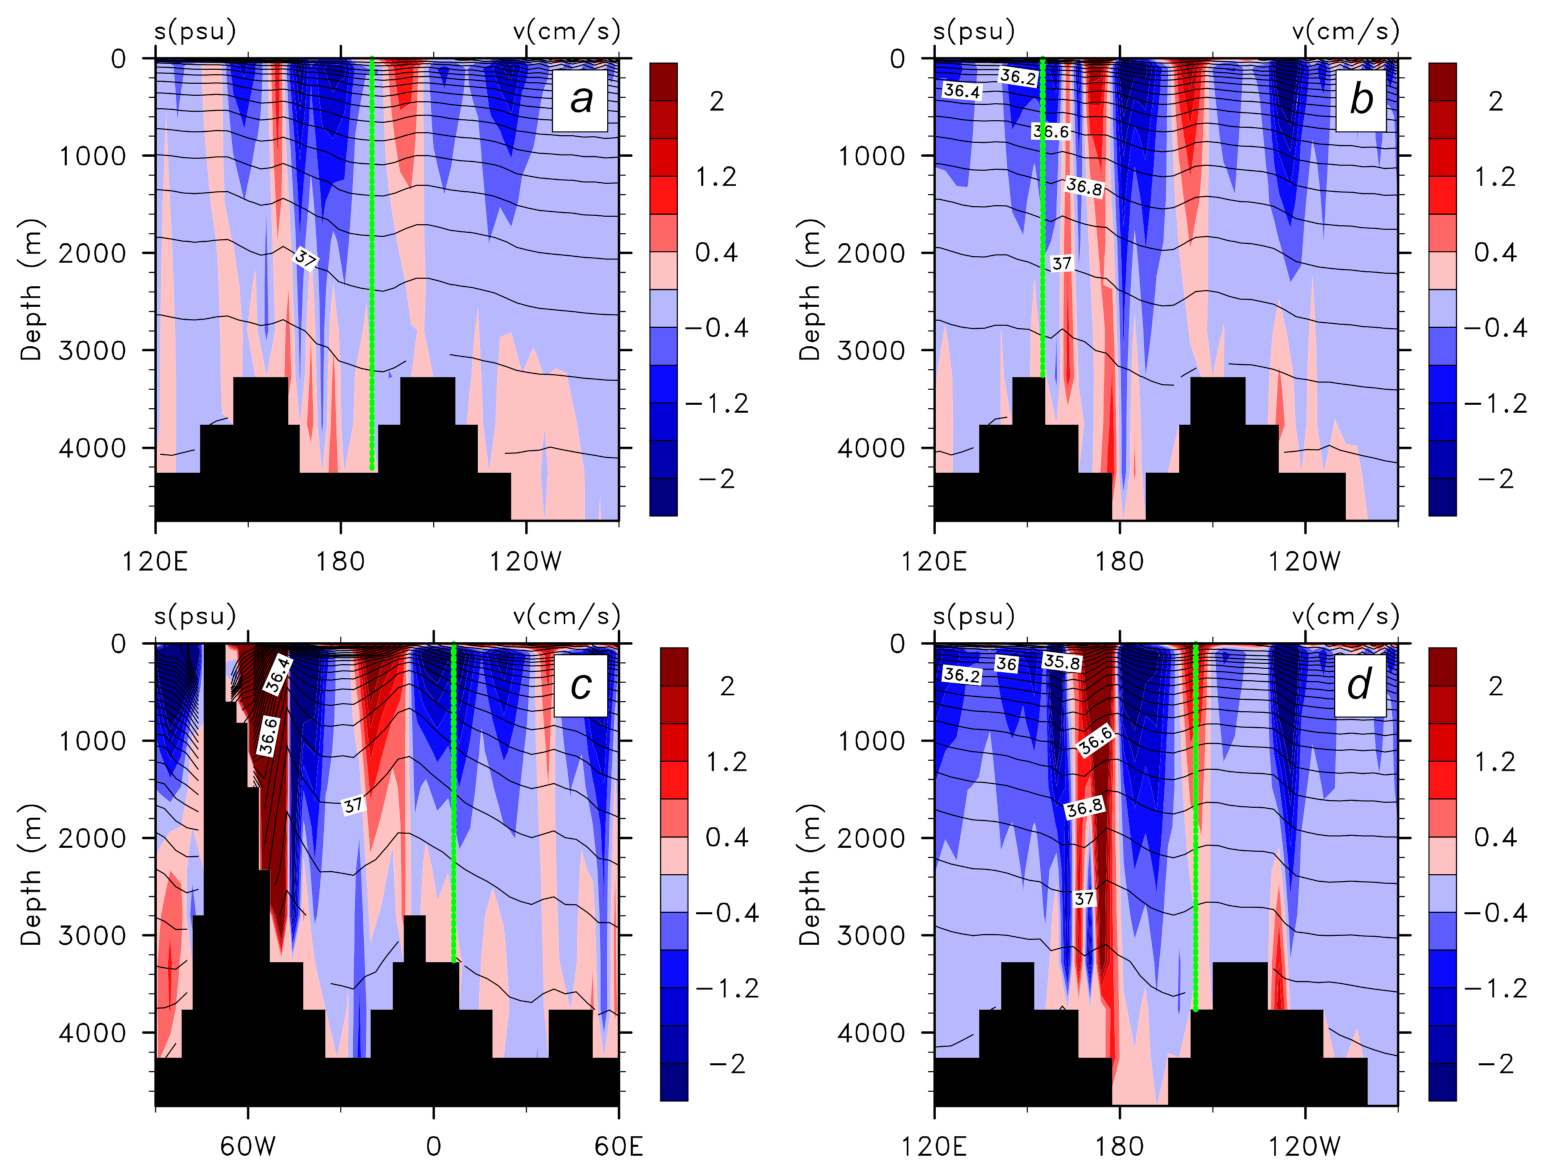
where the Ekman pumping w e = w ( d ) = c u r l ( τ 0 ) f ρ 0 , τ 0 is the surface wind stress, and w p v a = β f z d v d z where the integration is from an arbitrary depth z that is away from ocean bottom to the bottom of the Ekman layer. Here, w p v a is related to a local topographic steering [45]. Based on Equation (8), the vertical velocity, and in turn, the local upwelling, are expected to be different downstream (upstream) of a submarine ridge where a strong southward (northward) flow exists. During the LGM, cores A, B and C were located downstream of the Macquarie Ridge, the Kerguelen Plateau, and the American-Antarctic Ridge, respectively (Figure 2), where a prevailing southward flow (Figure 6a–c) was accompanied by a vertical stretching that increased with depth. As a result, the upward velocity was reduced from the base of the Ekman layer with depth, and may have vanished or even been reversed to downwelling at certain depths. In contrast, core D was located in the upstream of the Macquarie Ridge (Figure 2), so the prevailing northward flow there (Figure 6d) was accompanied by a compression of the water column, which enhanced the upwelling from the Ekman layer toward deeper levels. Clearly, meridional vorticity advection controls the vertical extension of upwelled flows below the Ekman layer and therefore, regulates the variation of local upwelling.
Figure 4f–i shows the decomposition of the vertical velocity w into w e and w p v a at core sites A–D during the past 22,000 years. It is evident that changes in the vertical extension of local upwelling at four sites are determined primarily by w p v a . Furthermore, the change of w p v a is associated with the vertical shear of the meridional flow and therefore, the zonal density gradient, according to the thermal wind relationship. Since the meridional flow is approximately geostrophic in places away from the Ekman layer and ocean bottom, the thermal wind relationship can be written as follows:
v z v g z = g f ρ 0 ρ x
where v g denotes the geostrophic meridional velocity, g is the gravitational acceleration and ρ denotes the local water density.
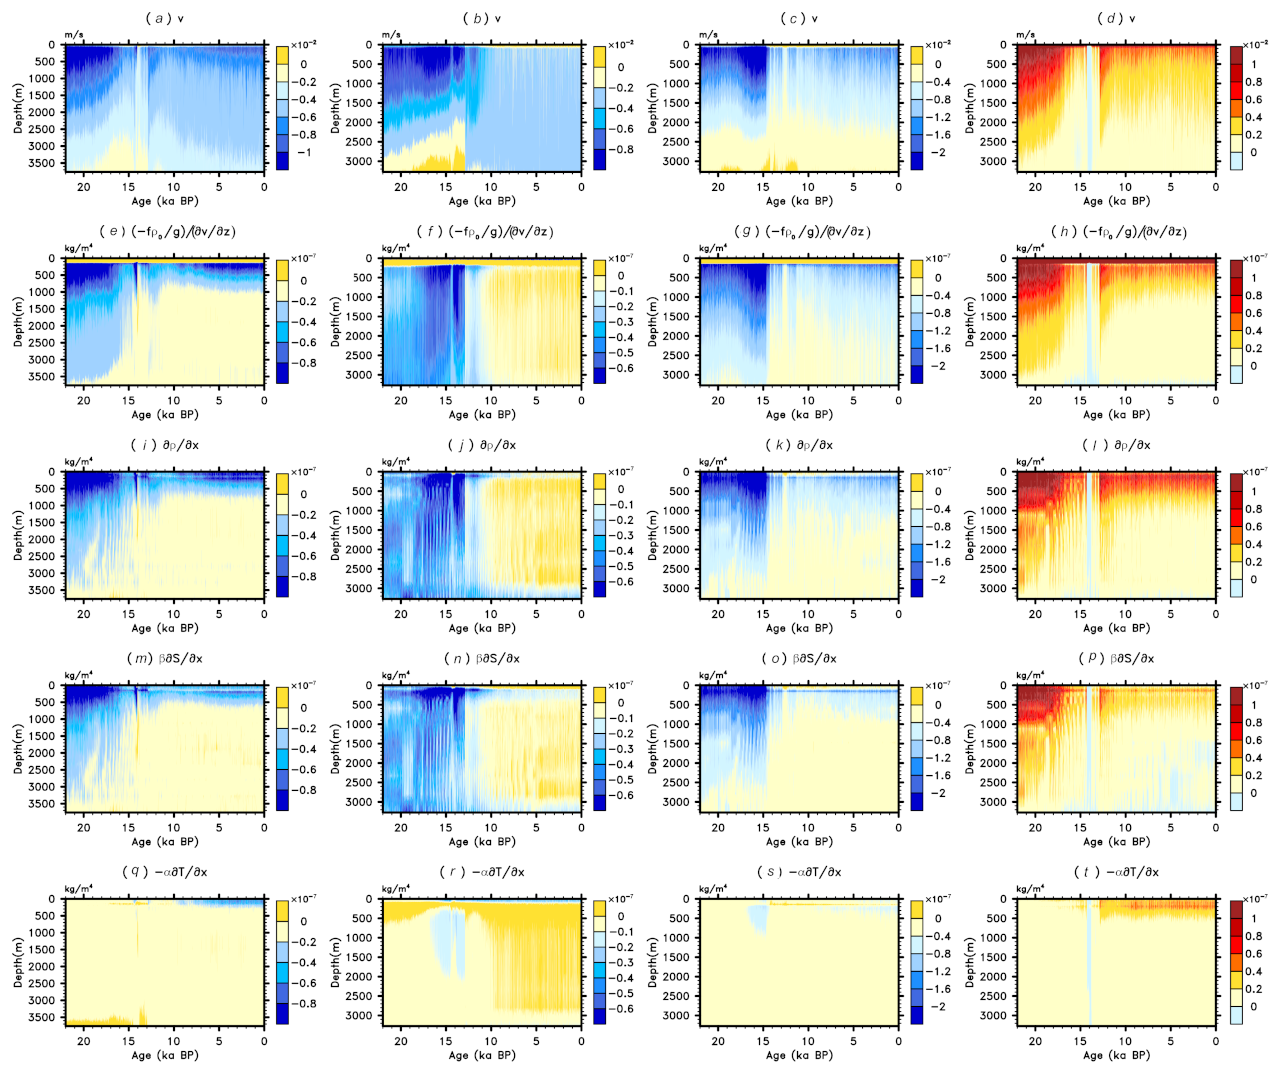
Figure 7 displays the thermal wind relationship at the four cores, which relates a negative (positive) shear of the meridional flow at cores A–C (core D) to the eastward decreasing (increasing) density in the Southern Ocean. Accordingly, changes in zonal density gradients alter the vertical shears of meridional flows. During the LGM, cores A–C (core D) showed strong negative (positive) zonal density gradients. However, these negative (positive) density gradients reduced in magnitude during the last deglaciation. As a result, the vertical shears of meridional flows at all four cores became smaller in magnitude, correspondingly.
To unravel the reason on the change in zonal density gradients, we write the zonal density gradient ( ρ / x ) as follows:
ρ x α t x + β s x
where α = 1 ρ ρ t | p , s is the thermal expansion coefficient and β = 1 ρ ρ s | p , t is the saline contraction coefficient, and α t x and β s x denote the thermal and haline contributions to the zonal density gradient, respectively. We find that changes in zonal density gradient are mainly caused by the haline contribution, i.e., due to the changes in zonal salinity gradient at all four sites (Figure 7). These changes in zonal salinity gradient, moreover, are closely tied to the changes in the meridional salinity gradient. Herein we examine the salinity budget as follows:
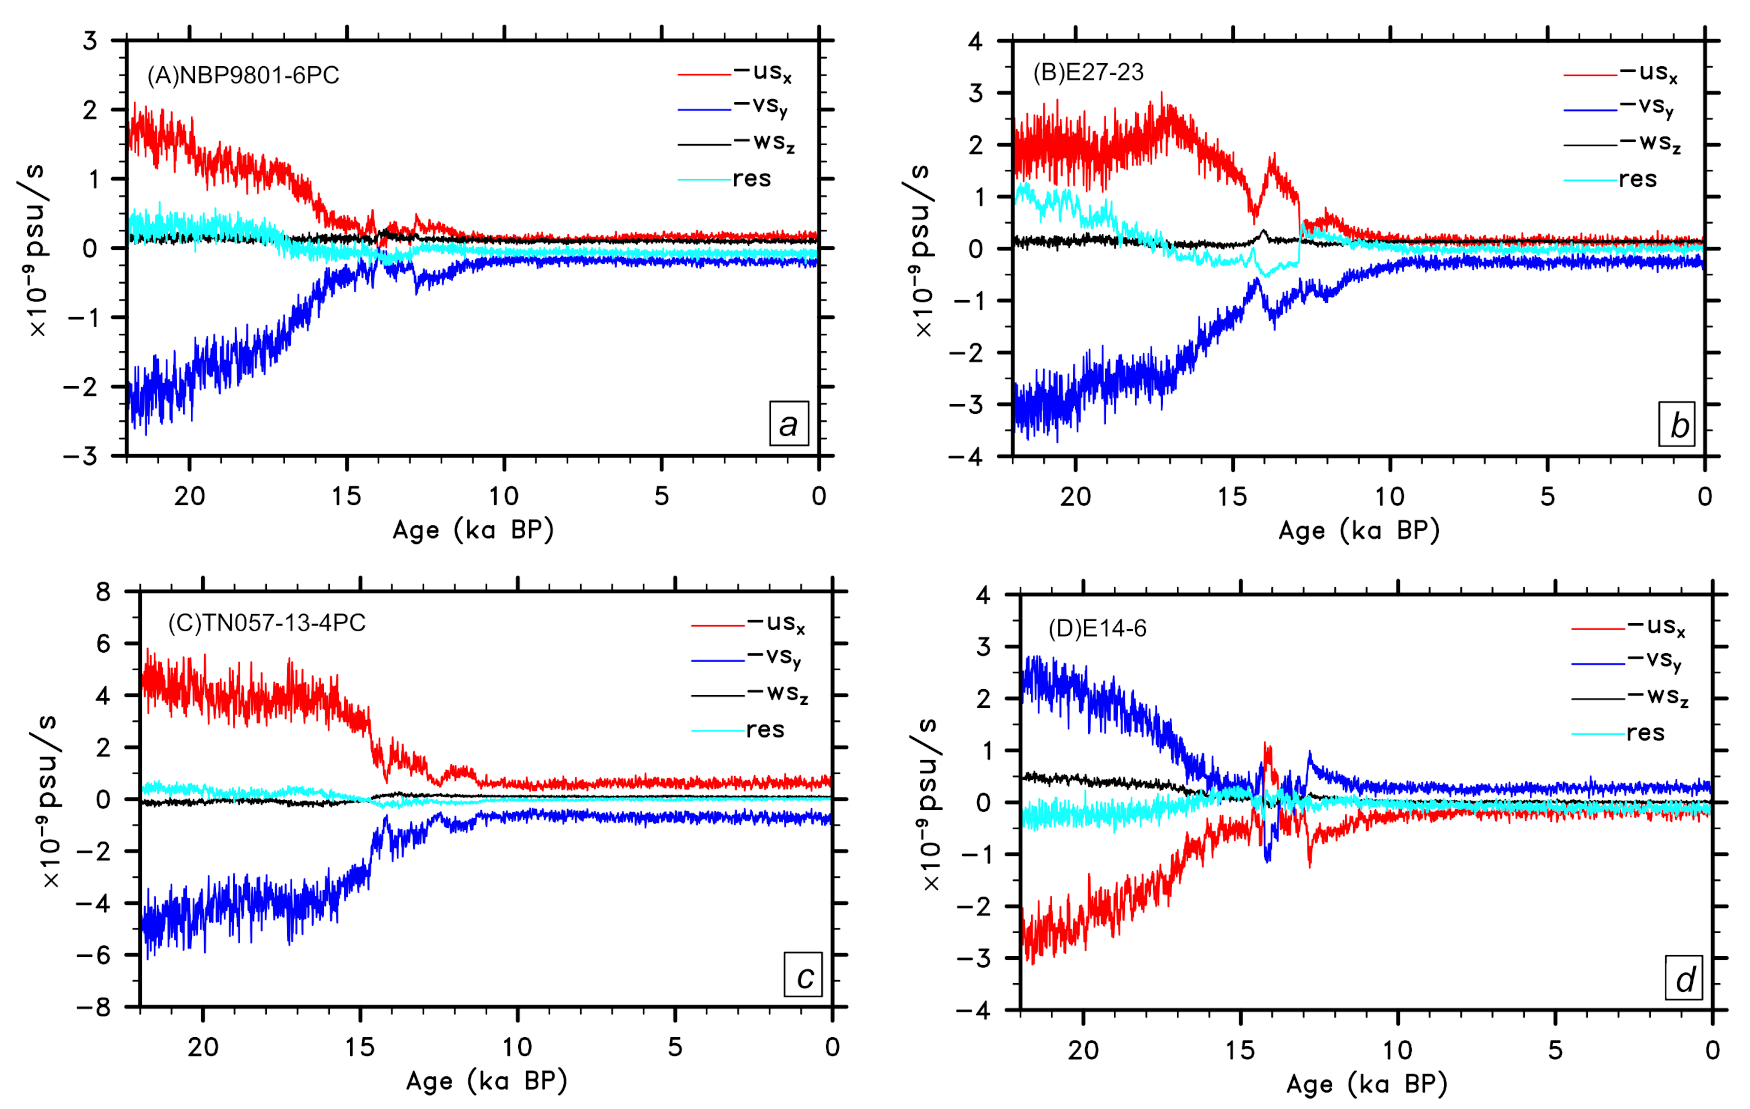
u s x v s y w s z + R e s = 0
which states a balance among the zonal ( u s x ), meridional ( v s y ) and vertical ( w s z ) salinity advection and a residual term ( R e s ) that includes salinity tendency and parameterized sub-grid mixing. We find that, at cores A–C (core D), salinity budgets are dominated by southward, negative (northward, positive) meridional salinity advection and eastward, positive (westward, negative) zonal salinity advection (Figure 8). From the time of Heinrich event 1 toward the Bølling–Allerød interstadial, meridional salinity gradients diminish over the ACC region, which leads to reduced meridional and zonal salinity advection and diminished zonal salinity gradients across the four proxy sites.
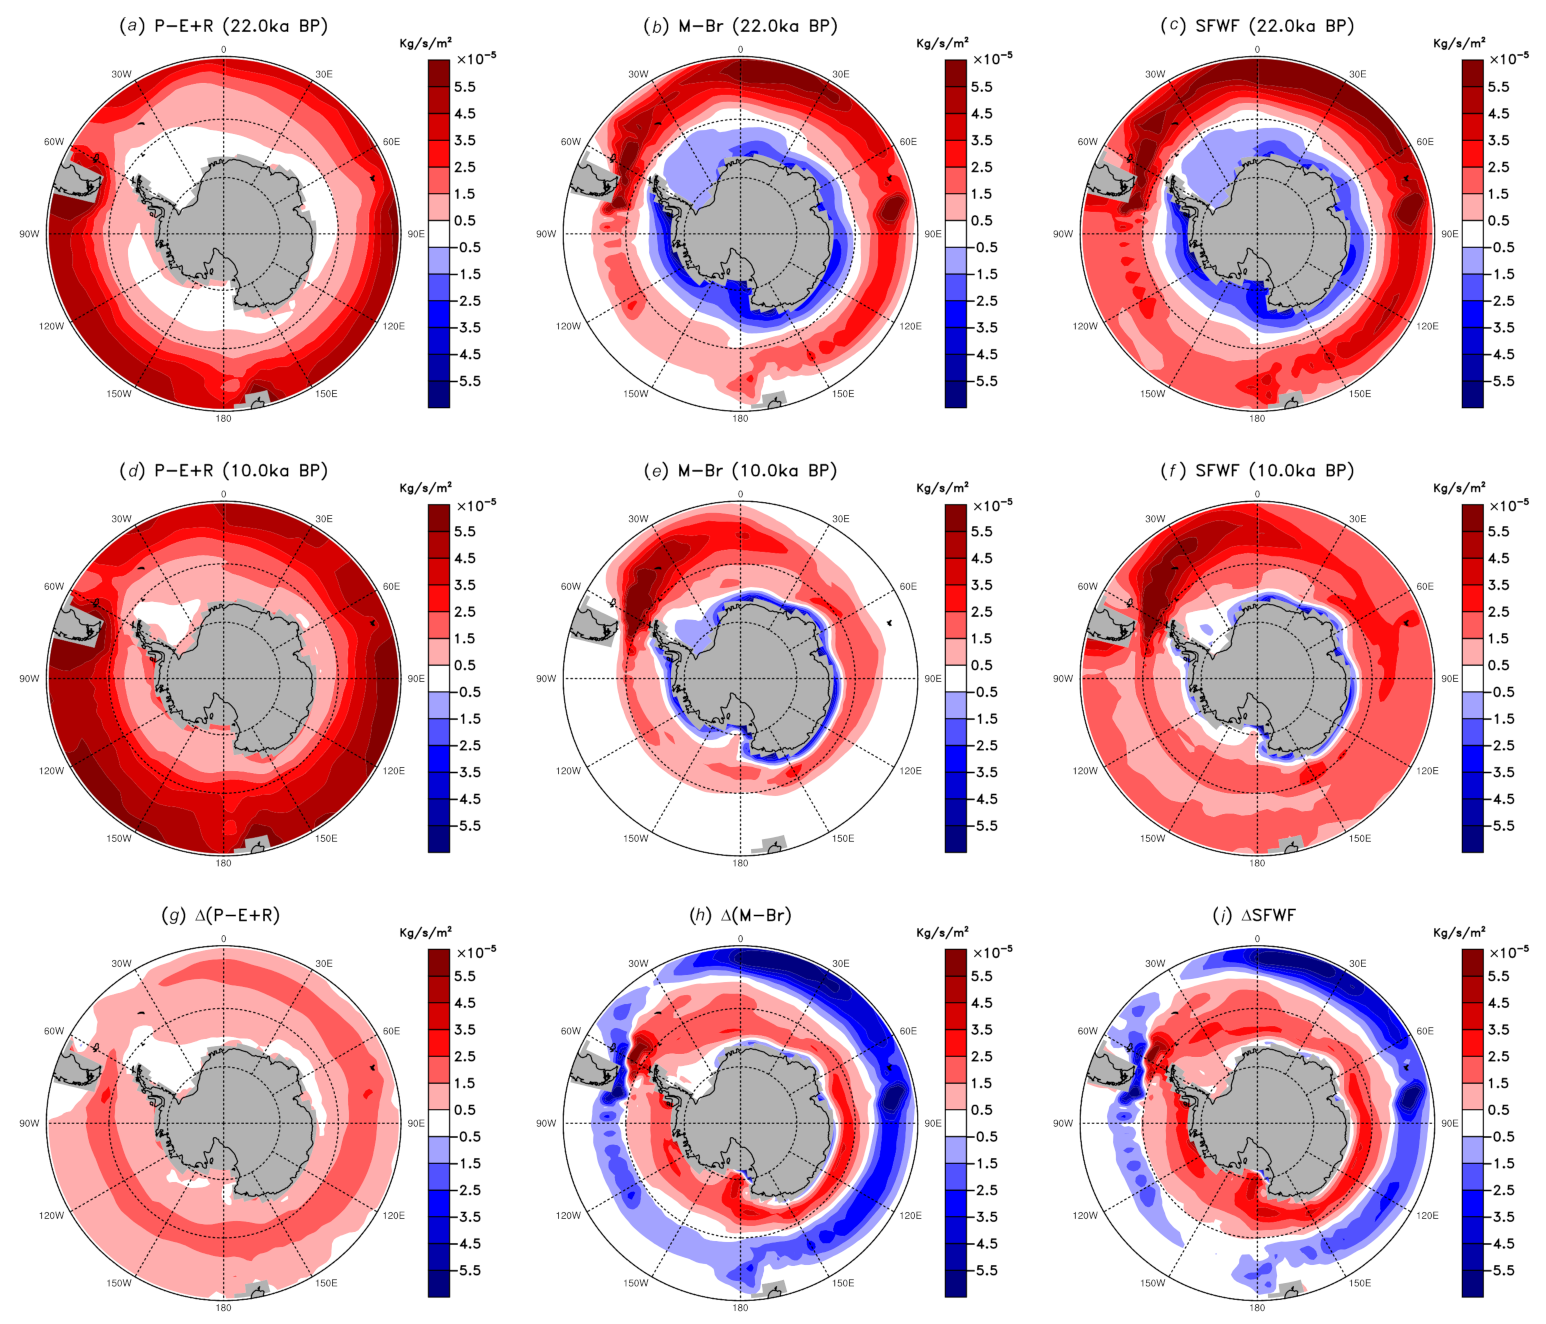
Furthermore, we find that the reduction in meridional salinity gradient is generated by changes in surface freshwater fluxes over the Southern Ocean. The total surface freshwater flux ( S F W F ) can be written as follows:
S F W F = P E + R + M B r
where SFWF is composed of various freshwater fluxes from precipitation (P), evaporation (E), river runoff (R), sea ice melt (M) and brine rejection ( B r ) due to the melting of sea ice.
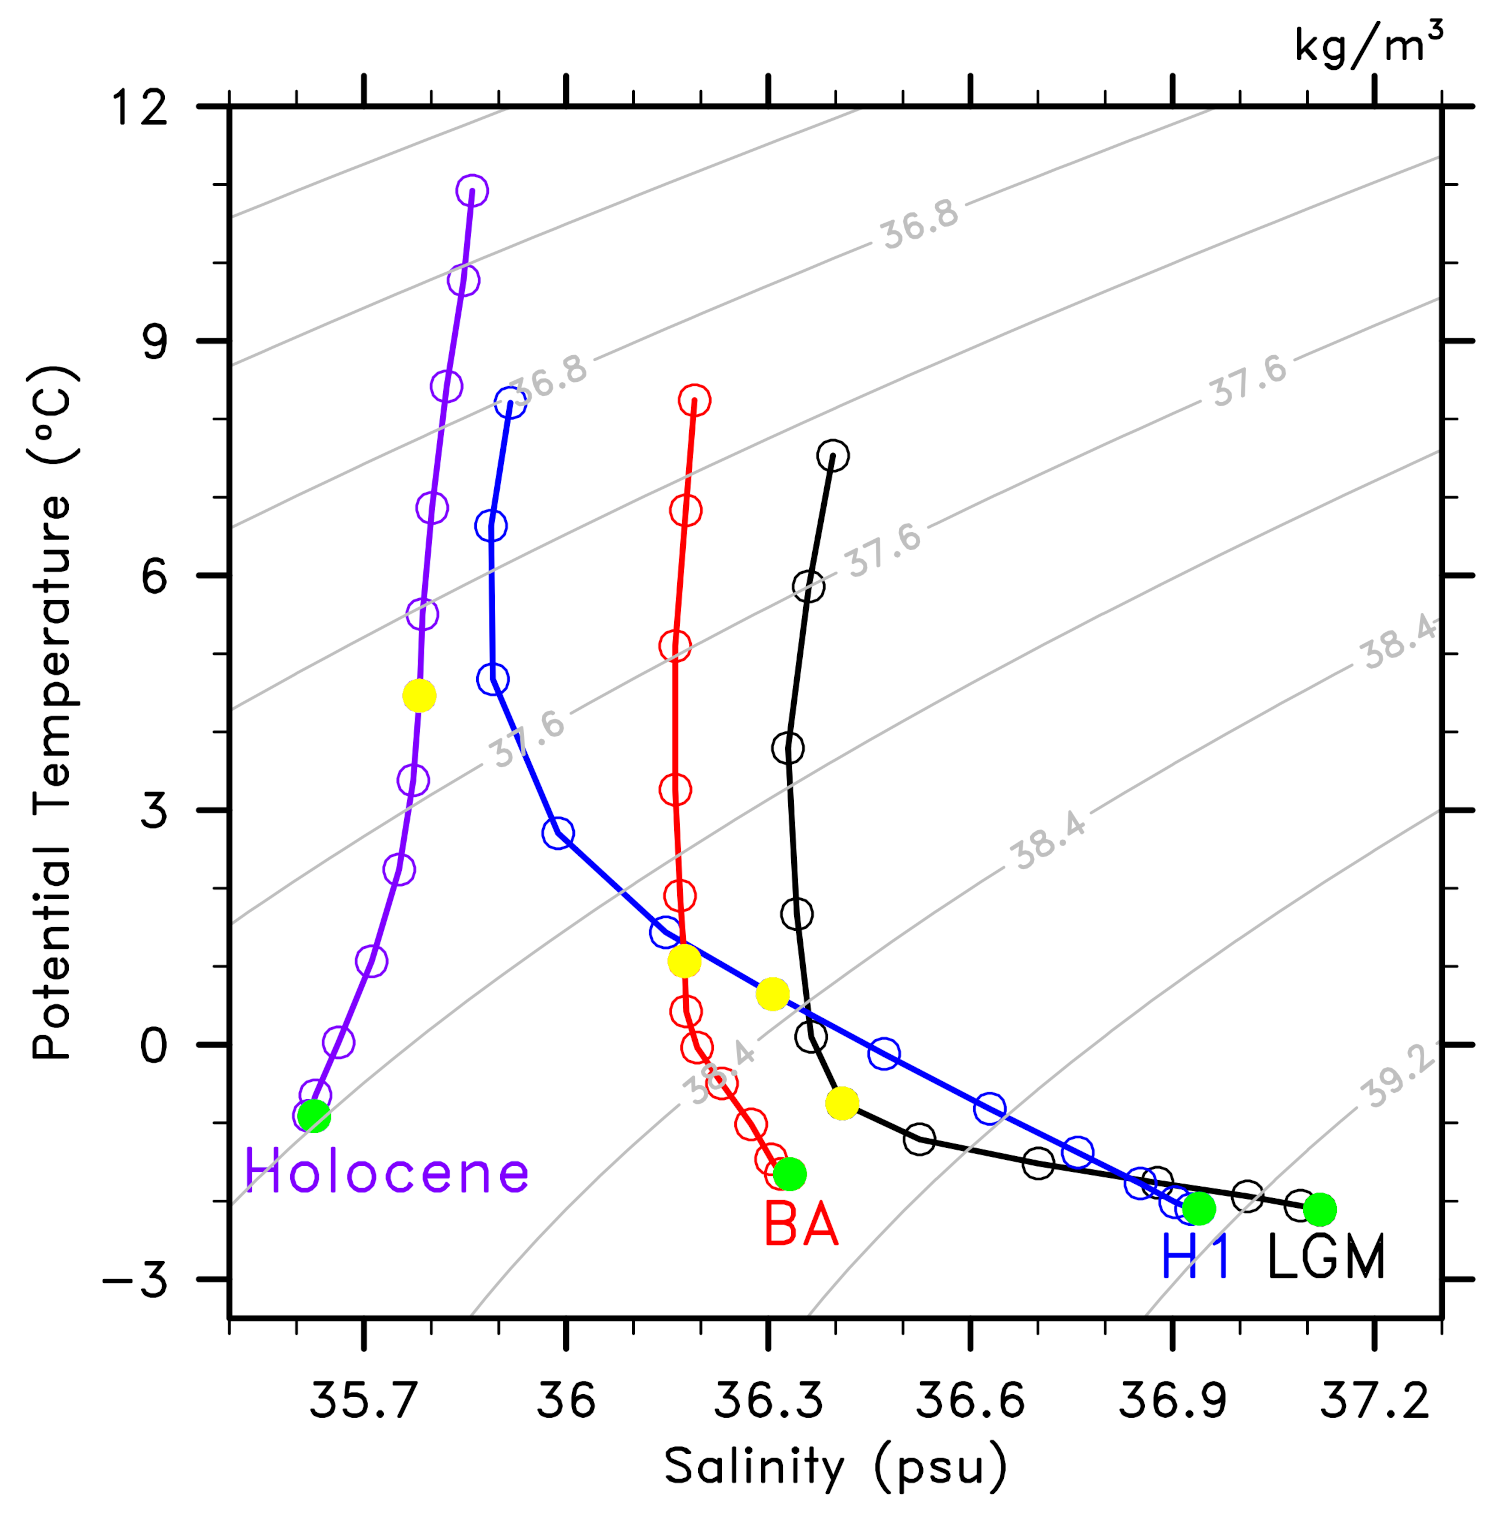
We find that, during the last deglaciation, changes in surface freshwater fluxes over the Southern Ocean were essentially contributed by those in sea ice melt and brine rejection (Figure 9). From the LGM to early Holocene, surface ocean temperature around Antarctica significantly increased due to a bipolar see-saw response [52] to meltwater discharge into the North Atlantic [53] during Heinrich event 1 and the Younger Dryas as well as a CO2 warming [54]. Accordingly, less Antarctic sea ice was formed in austral winter such that brine rejection was also reduced, which led to an anomalous freshwater input around Antarctica to dilute Antarctic Bottom Water (AABW). During the last deglaciation, the dilution of AABW was even stronger than that of North Atlantic Deep Water (NADW), which is indicated from the proxy records [55,56]. Therefore, the meridional salinity gradient across the Circumpolar Deep Water (CDW), as exampled by the salinity contrast between AABW and the southward outflow of NADW through the South Atlantic sector, was reduced (Figure 10).

4. Conclusions and Discussion

In this study, we combined paleo-proxy observations and a fully coupled climate model simulation, TraCE-21ka, to analyze the change in Southern Ocean upwelling during the last deglaciation. We tested the “westerlies shift" hypothesis but found that the displacement of Southern Hemisphere westerlies cannot explain the upwelling change as indicated from paleo-proxies and TraCE-21ka. We then detected the driving mechanisms on the Southern Ocean upwelling change from both zonal mean and local perspectives. We showed that the zonal mean upwelling over the ACC region is primarily driven by surface wind stress via zonal mean Ekman pumping, whilst the local upwelling is driven by both surface wind stress and surface buoyancy forcing and is tightly coupled to local topography. The latter mechanism can be summarized as follows: dwindling Antarctic sea ice during the last deglaciation helped reduce the meridional salinity gradient in the Southern Ocean, leading to diminished negative (positive) zonal salinity gradients downstream (upstream) of submarine ridges. Due to a dominant haline contribution to density change, the magnitude of zonal density gradient decreased, which abates the baroclinicity in meridional flows and hence associated planetary vorticity advection. As a result, the vertical extension of upwelled flows became deeper (shallower) downstream (upstream) of submarine ridges, corresponding to intensified (weakened) column integrated upwelling.
Our results show that Antarctic sea ice and associated surface freshwater fluxes played a vital role in modulating Southern Ocean upwelling during the last deglaciation, which is consistent with the results from previous studies [57,58,59,60,61,62,63,64,65,66,67] that highlight the effects of buoyancy forcing on Southern Ocean overturning and upwelling. While most of these studies compared ocean circulations between LGM and modern climates, they suggested that the expansion of Antarctic ice extent during the LGM led to a contraction of the overturning of NADW but an expansion of the overturning of AABW, hence pushing the Southern Ocean upwelling equatorward and abating respired CO2 outgassing. Our results, furthermore, demonstrate that, besides the zonally integrated overturning and upwelling, Antarctic sea ice and associated surface freshwater forcing can also significantly influence the local upwelling from LGM to the modern climate.
Eddy effects are not discussed in this study due to a lack of model outputs of eddy-induced velocities in TraCE-21ka. It was suggested that the Eulerian-mean meridional overturning circulation (MOC) can be partially offset by a reversed eddy-induced MOC, resulting in a residual MOC [68,69] in the Southern Ocean. Meanwhile, as we have shown in this study, the column integrated upwelling in TraCE-21ka can still capture the robust change in Southern Ocean upwelling during the last deglaciation as indicated by proxy records. This is likely due to a major contribution from the Eulerian-mean upwelling to the tracer’s movements. Nevertheless, it is worth noting that eddies still play a role in modulating Southern Ocean upwelling. We estimate that oceanic eddies may partially modify the change in the Eulerian mean upwelling either from a local or zonal mean perspective, due to their essences to even the baroclinicity in the Southern Ocean.
It is also worth noting that uncertainties exist in the impacts of Southern Ocean upwelling change on the carbon cycle and atmospheric CO2 variations. Several climate model simulations depict that changes in Southern Ocean upwelling only weakly influence atmospheric CO2 variations [70,71], whilst many others report that Southern Ocean upwelling changes could well explain the atmospheric CO2 changes during the last deglaciation [10,72]. Moreover, besides the Southern Ocean upwelling change, there are many other processes and mechanisms, such as biological pump and vertical mixing, potentially affecting the carbon sequestration in deep ocean and respired CO2 outgassing [4,66,73].

Author Contributions

Conceptualization, W.L. and Z.L.; methodology, W.L.; software, W.L.; validation, W.L.; formal analysis, W.L.; investigation, W.L.; resources, W.L and Z.L.; data curation, W.L. and Z.L.; writing—original draft preparation, W.L.; writing—review and editing, W.L., Z.L. and S.L.; visualization, W.L. and S.L.; supervision, W.L. and Z.L.; project administration, W.L.; funding acquisition, W.L. All authors have read and agreed to the published version of the manuscript.

Funding

W.L. is supported by the Alfred P. Sloan Foundation as a Research Fellow. S.L. is supported by the Sloan Research Fellowship awarded to W.L.

Institutional Review Board Statement

Not applicable.

Informed Consent Statement

Not applicable.

Data Availability Statement

The proxy data of NBP9802-6PC, E27-23, TN057-13-4PC and E14-6 are publicly available at https://www.ncei.noaa.gov (accessed on 24 April 2021) and https://doi.pangaea.de/ (accessed on 24 April 2021). The outputs of TraCE-21ka are publicly available at Climate Data at https://www.earthsystemgrid.org (accessed on 24 April 2021).

Acknowledgments

We thank Jiang Zhu and Jun Cheng for helpful discussions.

Conflicts of Interest

The authors declare no conflict of interest.

References

  1. Toggweiler, J.R.; Russell, J.L.; Carson, S.R. Midlatitude westerlies, atmospheric CO2, and climate change during the ice ages. Paleoceanography 2006, 21, PA2005. [Google Scholar] [CrossRef] [Green Version]
  2. Anderson, R.F.; Ali, S.; Bradtmiller, L.; Fleisher, M.Q.; Burckle, L.H. Wind-driven upwelling in the Southern Ocean and the deglacial rise of atmospheric CO2. Science 2009, 323, 1443–1448. [Google Scholar] [CrossRef] [PubMed]
  3. Skinner, L.C.; Fallon, S.; Waelbroeck, C.; Michel, E.; Barker, S. Ventilation of the deep Southern Ocean and deglacial CO2 rise. Science 2010, 328, 1147–1151. [Google Scholar] [CrossRef] [PubMed]
  4. Sigman, D.; Hain, M.; Haug, G. The polar ocean and glacial cycles in atmospheric CO2 concentration. Nature 2006, 466, 47–55. [Google Scholar] [CrossRef] [PubMed]
  5. Ai, X.E.; Studer, A.S.; Sigman, D.M.; Martínez-García, A.; Fripiat, F.; Thöle, L.M.; Michel, E.; Gottschalk, J.; Arnold, L.; Moretti, S.; et al. Southern Ocean upwelling, Earth’s obliquity, and glacial-interglacial atmospheric CO2 change. Science 2020, 370, 1348–1352. [Google Scholar] [CrossRef] [PubMed]
  6. Delmas, R.J.; Ascencio, J.-M.; Legrand, M. Polar ice evidence that atmospheric CO2 29,000 years B.P. was 50% of the present. Nature 1980, 282, 155–157. [Google Scholar] [CrossRef]
  7. Neftel, A.; Oeschger, H.; Schwander, J.; Stauffer, B.; Zumbrunn, R. Ice core sample measurements give atmospheric CO2 contents during the past 40,000 years. Nature 1982, 295, 220–223. [Google Scholar] [CrossRef]
  8. Moore, J.K.; Abbott, M.R.; Richman, J.G.; Nelson, D.M. The Southern Ocean at the last glacial maximum: A strong sink for atmospheric carbon dioxide. Global Biogeochem. Cycles 2000, 14, 455–475. [Google Scholar] [CrossRef] [Green Version]
  9. Lauderdale, J.M.; Williams, R.G.; Munday, D.R.; Marshall, D.P. The impact of Southern Ocean residual upwelling on atmospheric CO2 on centennial and millennial timescales. Clim. Dyn. 2017, 48, 1611–1631. [Google Scholar] [CrossRef] [Green Version]
  10. Menviel, L.; Spence, P.; Yu, J.; Chamberlain, M.A.; Matear, R.J.; Meissner, K.J.; England, M.H. Southern Hemisphere westerlies as a driver of the early deglacial atmospheric CO2 rise. Nat. Commun. 2018, 9, 1–12. [Google Scholar] [CrossRef] [Green Version]
  11. Heusser, C.J. Southern westerlies during the last glacial maximum. Quat Res. 1989, 31, 423–425. [Google Scholar] [CrossRef]
  12. Lamy, F.; Hebbeln, D.; Wefer, G. High-resolution marine record of climatic change in mid-latitude Chile during the last 28,000 years based on terrigenous sediment parameters. Quat. Res. 1999, 51, 83–93. [Google Scholar] [CrossRef]
  13. Heusser, L.; Heusser, C.J.; Mix, A.; McManus, J. Chilean and Southeast Pacific paleoclimate variations during the last glacial cycle: Directly correlated pollen and δ18O records from ODP Site 1234. Quat. Sci. Rev. 2006, 25, 3404–3415. [Google Scholar] [CrossRef]
  14. Heusser, L.; Heusser, C.J.; Pisias, N. Vegetation and climate dynamics of southern Chile during the past 50,000 years: Results of ODP Site 1233 pollen analysis. Quat. Sci. Rev. 2006, 25, 474–485. [Google Scholar] [CrossRef]
  15. Mc Glone, M.; Turney, C.S.M.; Wilmshurst, J.M.; Renwick, J.; Pahnke, K. Divergent trends in land and ocean temperature in the Southern Ocean over the past 18,000 years. Nat. Geosci. 2010, 3, 622–626. [Google Scholar] [CrossRef]
  16. Kohfeld, K.E.; Graham, R.M.; de Boer, A.M.; Sime, L.C.; Wolff, E.W.; Le Quéré, C.; Bopp, L. Southern Hemisphere westerly wind changes during the Last Glacial Maximum: Paleo-data synthesis. Quat. Sci. Rev. 2013, 68, 76–95. [Google Scholar] [CrossRef]
  17. Markgraf, V. Late and postglacial vegetational and paleoclimatic changes in subantarctic, temperate, and arid environments in Argentina. Palynology 1983, 7, 43–70. [Google Scholar] [CrossRef]
  18. Markgraf, V.; Bradbury, J.P.; Busby, J.R. Palaeoclimates in southwestern Tasmania during the last 13,000 years. Palaios 1986, 1, 368–380. [Google Scholar] [CrossRef] [Green Version]
  19. Markgraf, V. Paleoclimates in central and South America since 18,000 BP based on pollen and lake-level records. Quat. Sci. Rev. 1989, 8, 1–24. [Google Scholar] [CrossRef]
  20. Petit, J.R.; Jouzel, J.; Raynaud, D.; Barkov, N.I.; Barnola, J.M.; Basile, I.; Bender, M.; Chappellaz, J.; Davis, M.; Delaygue, G.; et al. Climate and atmospheric history of the past 420,000 years from the Vostok ice core, Antarctica. Nature 1999, 399, 429–436. [Google Scholar] [CrossRef] [Green Version]
  21. Delmonte, B.; Petit, J.R.; Maggi, V. Glacial to Holocene implications of the new 27000-year dust record from the EPICA Dome C (East Antarctica) ice core. Clim. Dyn. 2002, 18, 647–660. [Google Scholar]
  22. Wolff, E.W.; Fischer, H.; Fundel, F.; Ruth, U.; Twarloh, B.; Littot, G.C.; Mulvaney, R.; Röthlisberger, R.; de Angelis, M.; Boutron, C.F.; et al. Southern Ocean sea-ice extent, productivity and iron flux over the past eight glacial cycles. Nature 2002, 440, 491–496. [Google Scholar] [CrossRef] [PubMed]
  23. Williams, N.J.; Harle, K.J.; Gale, S.J.; Heijnis, H. The vegetation history of the last glacial-interglacial cycle in eastern New South Wales, Australia. J. Quat. Sci. 2006, 21, 735–750. [Google Scholar] [CrossRef]
  24. Rojas, M.; Moreno, P.; Kageyama, M.; Crucifix, M.; Hewitt, C.; Abe-Ouchi, A.; Ohgaito, R.; Brady, E.C.; Hope, P. The southern westerlies during the last glacial maximum in PMIP2 simulations. Clim. Dyn. 2009, 32, 525–548. [Google Scholar] [CrossRef]
  25. Chavaillaz, Y.; Codron, F.; Kageyama, M. Southern westerlies in LGM and future (RCP4.5) climates. Clim. Past 2013, 9, 517–524. [Google Scholar] [CrossRef] [Green Version]
  26. Rojas, M. Sensitivity of Southern Hemisphere circulation to LGM and 4×CO2 climates. Geophys. Res. Lett. 2013, 40, 1–6. [Google Scholar] [CrossRef]
  27. Sime, L.C.; Kohfeld, K.E.; Le Quéré, C.; Wolff, E.W.; de Boer, A.M.; Graham, R.M.; Bopp, L. Southern Hemisphere westerly wind changes during the Last Glacial Maximum: Model-data comparison. Quat. Sci. Rev. 2013, 64, 104–120. [Google Scholar] [CrossRef] [Green Version]
  28. Liu, W.; Lu, J.; Leung, L.R.; Xie, S.-P.; Liu, Z.; Zhu, J. The de-correlation of westerly winds and westerly-wind stress over the Southern Ocean during the Last Glacial Maximum. Clim. Past 2015, 11, 3157–3168. [Google Scholar] [CrossRef]
  29. Sime, L.C.; Hodgson, D.; Bracegirdle, T.J.; Allen, C.; Perren, B.; Roberts, S. Sea ice led to poleward-shifted winds at the Last Glacial Maximum: The influence of state dependency on CMIP5 and PMIP3 models. Clim. Past 2016, 12, 2241–2253. [Google Scholar] [CrossRef] [Green Version]
  30. Otto-Bliesner, B.; Brady, E.; Clauzet, G.; Thomas, R.; Levis, S.; Kothavala, Z. Last glacial maximum and Holocene climate in CCSM3. J. Clim. 2006, 19, 2526–2544. [Google Scholar] [CrossRef] [Green Version]
  31. Dezileau, L.; Bareille, G.; Reyss, J.L. The 231Pa/230Th ratio as a proxy for past changes in opal fluxes in the Indian sector of the Southern Ocean. Mar. Chem. 2003, 81, 105–117. [Google Scholar] [CrossRef]
  32. Chase, Z.; Anderson, R.; Fleisher, M.; Kubik, P. Accumulation of biogenic and lithogenic material in the Pacific sector of the Southern Ocean during the past 40,000 years. Deep Sea Res. Part II 2003, 50, 799–832. [Google Scholar] [CrossRef]
  33. Liu, Z.; Otto-Bliesner, B.L.; He, F.; Brady, E.C.; Tomas, R.; Clark, P.U.; Carlson, A.E.; Lynch-Stieglitz, J.; Curry, W.; Brook, E.; et al. Transient simulation of last deglaciation with a new mechanism for Bølling-Allerød warming. Science 2009, 325, 310–314. [Google Scholar] [CrossRef] [Green Version]
  34. Olbers, D. Comments on “On the obscurantist physics of ’form drag’ in theorizing about the Circumpolar Current”. J. Phys. Oceanogr. 1998, 28, 1647–1654. [Google Scholar] [CrossRef]
  35. Rintoul, S.; Hughes, C.; Olbers, D. Ocean Circulation and Climate. In The Antarctic Circumpolar Current System; Siedler, G., Church, J., Gould, J., Eds.; International Geophysics Series; Academic Press: Cambridge, MA, USA, 2001; Volume 77, pp. 271–302. [Google Scholar]
  36. Collins, W.D.; Bitz, C.M.; Blackmon, M.L.; Bonan, G.B.; Bretherton, C.S.; Carton, J.A.; Chang, P.; Doney, S.C.; Hack, J.J.; Henderson, T.B.; et al. The community climate system model version 3 (CCSM3). J. Clim. 2006, 19, 2122–2143. [Google Scholar] [CrossRef]
  37. Yeager, S.G.; Shields, C.A.; Large, W.G.; Hack, J.J. The low-resolution CCSM3. J. Clim. 2006, 19, 2545–2566. [Google Scholar] [CrossRef]
  38. Collins, W.D.; Rasch, P.J.; Boville, B.A.; Hack, J.J.; McCaa, J.R.; Williamson, D.L.; Briegleb, B.P.; Bitz, C.M.; Lin, S.-J.; Zhang, M. The formulation and atmospheric simulation of the Community Atmosphere Model version 3 (CAM3). J. Clim. 2006, 19, 2144–2161. [Google Scholar] [CrossRef] [Green Version]
  39. Dickinson, R.E.; Oleson, K.W.; Bonan, G.; Hoffman, F.; Thornton, P.; Vertenstein, M.; Yang, Z.L.; Zeng, X. The Community Land Model and its climate statistics as a component of the Community Climate System Model. J. Clim. 2006, 19, 2302–2324. [Google Scholar] [CrossRef]
  40. Briegleb, B.P.; Bitz, C.M.; Hunke, E.C.; Lipscomb, W.H.; Holland, M.M.; Schramm, J.L.; Moritz, R.E. Scientific Description of the Sea Ice Component in the Community Climate System Model; Version Three. Tech. Rep. NCAR/TN-463+STR; National Center for Atmospheric Research: Boulder, CO, USA, 2004; pp. 1–78. [Google Scholar]
  41. Smith, R.D.; Gent, P.R. (Eds.) Reference Manual for the Parallel Ocean Program (POP), Ocean Component of the Community Climate System Model (CCSM2.0 and 3.0); Tech. Rep., LA-UR-02-2484; Los Alamos National Laboratory: Los Alamos, NM, USA; National Center for Atmospheric Research: Boulder, CO, USA, 2002; pp. 1–76. [Google Scholar]
  42. He, F. Simulating Transient Climate Evolution of the Last Deglaciation with CCSM3. Ph.D. Thesis, University of Wisconsin-Madison, Madison, WI, USA, 2011. [Google Scholar]
  43. Shakun, J.D.; Clark, P.U.; He, F.; Marcott, S.A.; Mix, A.C.; Liu, Z.; Otto-Bliesner, B.; Schmittner, A.; Bard, E. Global warming preceded by increasing carbon dioxide concentrations during the last deglaciation. Nature 2006, 484, 49–54. [Google Scholar] [CrossRef]
  44. Liu, W.; Liu, Z.; Cheng, J.; Hu, H. On the stability of the Atlantic meridional overturning circulation during the last deglaciation. Clim. Dyn. 2015, 44, 1257–1275. [Google Scholar] [CrossRef]
  45. Berger, A. Long-term variations of daily insolation and Quaternary climatic changes. J. Atmos. Sci. 1978, 35, 2362–2367. [Google Scholar] [CrossRef]
  46. Joos, F.; Spahni, R. Rates of change in natural and anthropogenic radiative forcing over the past 20,000 years. Proc. Natl. Acad. Sci. USA 2008, 105, 1425–1430. [Google Scholar] [CrossRef] [Green Version]
  47. McManus, J.F.; Francois, R.; Gherardi, J.M.; Keigwin, L.D.; Brown-Leger, S. Collapse and rapid resumption of Atlantic meridional circulation linked to deglacial climate changes. Nature 2004, 428, 834–837. [Google Scholar] [CrossRef]
  48. Sarmiento, J.L.; Nicolas, G. Ocean Biogeochemical Dynamics; Princeton University Press: Princeton, NJ, USA, 2006; Volume 1015, pp. 1–528. [Google Scholar]
  49. Marshall, D. Topographic steering of the Antarctic Circumpolar Current. J. Phys. Oceanogr. 1995, 25, 1636–1650. [Google Scholar] [CrossRef] [Green Version]
  50. Gille, S. The Southern Ocean momentum balance: Evidence for topographic effects from numerical model output and altimeter data. J. Phys. Oceanogr. 1997, 27, 2219–2231. [Google Scholar] [CrossRef] [Green Version]
  51. Bryan, F.O. Parameter sensitivity of primitive equation ocean general circulation models. J. Phys. Oceanogr. 1987, 17, 970–985. [Google Scholar] [CrossRef] [Green Version]
  52. Broecker, W.S. Paleocean circulation during the last deglaciation: A bipolar seesaw? Paleoceanography 1998, 13, 119–121. [Google Scholar] [CrossRef]
  53. Alley, R.B.; Clark, P.U. The deglaciation of the northern hemisphere: A global perspective. Annu. Rev. Earth Planet. Sci. 1999, 27, 149–182. [Google Scholar] [CrossRef] [Green Version]
  54. Anderson, J.B.; Shipp, S.S.; Lowe, A.L.; Wellner, J.S.; Mosola, A.B. The Antarctic Ice Sheet during the Last Glacial Maximum and its subsequent retreat history: A review. Quat. Sci. Rev. 2002, 21, 49–71. [Google Scholar] [CrossRef]
  55. Curry, W.B.; Oppo, D.W. Glacial water mass geometry and the distribution of δ13C of ΣCO2 in the western Atlantic Ocean. Paleoceanography 2002, 20, PA1017. [Google Scholar]
  56. Adkins, J.F. The role of deep ocean circulation in setting glacial climates. Paleoceanography 2013, 28, 539–561. [Google Scholar] [CrossRef] [Green Version]
  57. Shin, S.-I.; Liu, Z.; Otto-Bliesner, B.; Brady, E.; Kutzbach, J.; Harrison, S. A Simulation of the Last Glacial Maximum climate using the NCAR?CCSM. Clim. Dyn. 2003, 20, 127–151. [Google Scholar] [CrossRef]
  58. Liu, Z.; Shin, S.-I.; Webb, R.S.; Lewis, W.; Otto-Bliesner, B.L. Atmospheric CO2 forcing on glacial thermohaline circulation and climate. Geophys. Res. Lett. 2005, 32, L02706. [Google Scholar] [CrossRef]
  59. Ferrari, R.; Jansen, M.F.; Adkins, J.F.; Burke, A.; Stewart, A.L.; Thompson, A.F. Antarctic sea ice control on ocean circulation in present and glacial climates. Proc. Natl. Acad. Sci. USA 2014, 111, 8753–8758. [Google Scholar] [CrossRef] [Green Version]
  60. Watson, A.J.; Vallis, G.K.; Nikurashin, M. Southern Ocean buoyancy forcing of ocean ventilation and glacial atmospheric CO2. Nat. Geosci. 2015, 8, 861–864. [Google Scholar] [CrossRef] [Green Version]
  61. Jansen, M.F.; Nadeau, L.P. The effect of Southern Ocean surface buoyancy loss on the deep-ocean circulation and stratification. J. Phys. Oceanogr. 2016, 46, 3455–3470. [Google Scholar] [CrossRef]
  62. Sun, S.; Eisenman, I.; Stewart, A. The influence of Southern Ocean surface buoyancy forcing on glacial-interglacial changes in the global deep ocean stratification. Geophys. Res. Lett. 2016, 43, 8124–8132. [Google Scholar] [CrossRef]
  63. Jansen, M.F. Glacial ocean circulation and stratification explained by reduced atmospheric temperature. Proc. Natl. Acad. Sci. USA 2017, 114, 45–50. [Google Scholar] [CrossRef] [Green Version]
  64. Marzocchi, A.; Jansen, M.F. Connecting Antarctic sea ice to deep?ocean circulation in modern and glacial climate simulations. Geophys. Res. Lett. 2017, 44, 6286–6295. [Google Scholar] [CrossRef]
  65. Sun, S.; Eisenman, I.; Stewart, A. Does southern ocean surface forcing shape the global ocean overturning circulation? Geophys. Res. Lett. 2018, 45, 2413–2423. [Google Scholar] [CrossRef] [Green Version]
  66. Marzocchi, A.; Jansen, M.F. Global cooling linked to increased glacial carbon storage via changes in Antarctic sea ice. Nat. Geosci. 2019, 12, 1001–1005. [Google Scholar] [CrossRef]
  67. Nadeau, L.P.; Ferrari, R.; Jansen, M.F. Antarctic sea ice control on the depth of North Atlantic deep water. J. Clim. 2019, 32, 2537–2551. [Google Scholar] [CrossRef]
  68. Karsten, R.; Marshall, J. Constructing the residual circulation of the Antarctic Circulation Current from observations. J. Phys. Oceanogr. 2002, 32, 3315–3327. [Google Scholar] [CrossRef] [Green Version]
  69. Marshall, J.; Speer, K. Closure of the meridional overturning circulation through Southern Ocean upwelling. Nat. Geosci. 2012, 5, 171–180. [Google Scholar] [CrossRef] [Green Version]
  70. d’Orgeville, M.N.; Sijp, W.P.; England, M.H.; Meissner, K.J. On the control of glacial?interglacial atmospheric CO2 variations by the Southern Hemisphere westerlies. Geophys. Res. Lett. 2010, 37, L21703. [Google Scholar]
  71. Völker, C.; Köhler, P. Responses of ocean circulation and carbon cycle to changes in the position of the Southern Hemisphere westerlies at Last Glacial Maximum. Paleoceanography 2013, 28, 726–739. [Google Scholar] [CrossRef] [Green Version]
  72. Tschumi, T.; Joos, F.; Parekh, P. How important are the Southern Hemisphere wind changes for low glacial carbon dioxide? Paleoceanography 2013, 34, PA4208. [Google Scholar]
  73. François, R.; Altabet, M.A.; Yu, E.-F.; Sigman, D.M.; Bacon, M.P.; Frank, M.; Bohrmann, G.; Bareille, G.; Labeyrie, L.D. Contribution of Southern Ocean surface-water stratification to low atmospheric CO2 concentrations during the last glacial period. Nature 1997, 389, 929–935. [Google Scholar] [CrossRef]
Figure 1. (a) June insolation at 60 N (purple) [45] and atmospheric CO2 concentration (green) [46]; ppmv, parts per million by volume. (b) Freshwater fluxes (FWF) in the Northern (dark pink) and Southern (light pink) Hemispheres in TraCE-21ka. (c) The 231Pa/230Th ratio (brown) at Bermuda (GGC5 core) as a proxy for AMOC export [47], and model maximum AMOC transport (below 500 m, orange). (dh) The column integrated upwelling (gray) and its 100-year average (black) in TraCE-21ka at corresponding grids of proxy cores (d) A, (e) B, (f) C and (g) D, and (h) averaged over the ACC region. In these panels, opal fluxes (blue) and initial unsupported 231Pa/230Th ratio (red) are reproduced from previous studies [2,32]. In (h), the maximum of the 100-year mean Southern Hemisphere westerlies on 867 hpa is shown in orchid. As the shift of the westerlies could be small and within a grid of the atmosphere model, a quadratic interpolation around the grid point with maximum mean wind is adopted to yield the exact latitude of the mean jet [25]. H1: Heinrich event 1; BA: Bølling–Allerød; YD: Younger Dryas.
Geosciences 11 00266 g001
Figure 2. Southern Ocean topography denoted by the depth from ocean surface (shading) and the sites of four proxy cores: A. NBP9802-6PC (169.9 W, 61.9 S), B. E27-23 (155.24 E, 59.62 S), C. TN057-13-4PC (5.1 E, 53.2 S) and D. E14-6 (160.15 E, 57.01 S), which are denoted by black dots. The corresponding grids in TraCE-21ka are shaded in yellow.
Geosciences 11 00266 g002
Figure 3. (a) The meridional distribution of the zonal mean zonal wind stress ( τ ¯ x ) (gray, dashed line) and zonal mean Ekman pumping w ¯ E k (black, solid line) averaged over the last 22,000 years. (b) The depth–latitude diagram of the correlation between w ¯ E k and zonal mean vertical velocity w ¯ in the last 22,000 years. At each latitude, the simultaneous correlation coefficient is calculated between w ¯ E k and w ¯ on each depth. Gray shading areas denote where the correlation coefficient is higher than 0.9. (c) The depth–latitude diagram of w ¯ (contour in 10 6   m / s ) averaged over the last 22,000 years. Gray shading areas show where w ¯ is positive. (d) The depth–latitude diagram in which gray shading areas denote where w ¯ E k is approximately equal to w ¯ by satisfying two conditions: (1) the correlation coefficient between w ¯ E k and w ¯ is higher than 0.9; and (2) the difference between w ¯ E k and w ¯ is smaller than 10 6   m / s (about 10% of maximum w ¯ E k ).
Geosciences 11 00266 g003
Figure 4. (ad) The depth-time diagram of vertical velocity (shading in 10 6   m / s ), column integrated upwelling (gray) and its 100-year average (black) in TraCE-21ka at corresponding grids of proxy cores A–D. In these panels, opal fluxes (blue) and the initial unsupported 231Pa/230Th ratio (red) are reproduced from previous studies [2,32]. (e) Similar to panels (ad) but for the zonal mean vertical velocity (shading in 10 6   m / s ), zonal mean upwelling (gray) and its 100-year average (black) over the ACC region. (fi) The local Ekman pumping w E k (gray), its 100-year average (black) and local w p v a (shading in 10 6   m / s ) at proxy cores A–D during the last 22,000 years. (j) Similar to panels (fi) but for the zonal mean Ekman pumping (gray), its 100-year average (black) and zonal mean w p v a (shading in 10 6   m / s ) over the ACC region.
Geosciences 11 00266 g004
Figure 5. Depth–longitude diagrams of local correlation between the Ekman pumping and local vertical velocity (a) outside the open channel region, along 52.9 S and (c) within the open channel region, along the average section between 60.9 S and 57.1 S. Locations of the proxy cores A–D are marked. Vertical profiles of the correlation between zonal mean Ekman pumping and zonal mean vertical velocity (blue) and the zonal average of the correlation between local Ekman pumping and local vertical velocity (red) along the latitude of (b) 52.9 S and (d) the average section between 60.9 S and 57.1 S.
Geosciences 11 00266 g005
Figure 6. Zonal sections of salinity (contour in psu) and meridional velocity (shading in 10 2 m/s) along (a) 60.9 S, (b) 59.0 S, (c) 52.9 S and (d) 57.1 S at 22 ka BP. The locations of the four proxy cores are marked (green) on the zonal sections, respectively.
Geosciences 11 00266 g006
Figure 7. Depth-time diagrams for cores A–D during the last 22,000 years: (ad) the meridional velocity v (shading in 10 2   m / s ), (eh) the vertical shear of v which is scaled for zonal density gradient via the thermal wind relationship: ( f ρ 0 / g ) / ( v / z ) (shading in 10 7   k g / m 4 ), (il) the zonal density gradient ρ / x (shading in 10 7   k g / m 4 ), (mp) the haline contribution to zonal density gradient ρ / x : β ( s / x ) (shading in 10 7   k g / m 4 ) and (qt) the thermal contribution to zonal density gradient ρ / x : α ( t / x ) (shading in 10 7   k g / m 4 ).
Geosciences 11 00266 g007
Figure 8. The vertical integrated salinity budget below 200 m at proxy cores (ad) during the last 22,000 years, which is composed of zonal salinity advection ( u s x , red), meridional salinity advection ( v s y , blue), vertical salinity advection ( w s z , black) and residual ( r e s , cyan) terms.
Geosciences 11 00266 g008
Figure 9. (Top row (ac)) Surface freshwater fluxes (shading in 10 5   k g / s / m 2 ) from (a) precipitation, evaporation and runoff and (b) sea ice melting and brine rejection as well as (c) the total surface freshwater flux in the Southern Ocean at 22 ka BP. (middle row (df)) The same as the top row but for 10 ka BP. (bottom row (gi)) Differences between the fluxes in the middle and top rows (fluxes at 10 ka BP minus fluxes at 22 ka BP).
Geosciences 11 00266 g009
Figure 10. Atlantic basin-average T-S profiles (with depth) during the LGM (22 ka BP, black), H1 (17 ka BP, blue), BA (14.2 ka BP, red) and early Holocene (10 ka BP, purple). NADW is denoted at 1475 m (solid yellow dots) while AABW is denoted at 4751 m (solid green dots). For each profile, only the part below 326 m is shown. Contours of constant potential density are shown in gray.
Geosciences 11 00266 g010
Publisher’s Note: MDPI stays neutral with regard to jurisdictional claims in published maps and institutional affiliations.