Article

Cosmogenic and Geological Evidence for the Occurrence of a Ma-Long Feedback between Uplift and Denudation, Chur Region, Swiss Alps

by
Ewerton da Silva Guimarães
1,2,*,
Romain Delunel
1,3,
Fritz Schlunegger
1,
Naki Akçar
1,
Laura Stutenbecker
1,4 and
Marcus Christl
5
1
Institute of Geological Sciences, University of Bern, Baltzerstrasse 3, 3012 Bern, Switzerland
2
Department of Earth Sciences, Vrije Universiteit Amsterdam, De Boelelaan 1085, 1081 HV Amsterdam, The Netherlands
3
French National Centre for Scientific Research (CNRS), UMR 5600 EVS/IRG-Lyon 2, 69676 Bron, France
4
Institute of Applied Geosciences, Technical University of Darmstadt, Karolinenplatz 5, 64289 Darmstadt, Germany
5
Laboratory of Ion Beam Physics, Swiss Federal Institute of Technology Zurich (ETHZ), Otto-Stern-Weg 5, 8093 Zurich, Switzerland
*
Author to whom correspondence should be addressed.
Geosciences 2021, 11(8), 339; https://doi.org/10.3390/geosciences11080339
Submission received: 9 June 2021 / Revised: 19 July 2021 / Accepted: 27 July 2021 / Published: 12 August 2021
(This article belongs to the Special Issue Cutting Edge Earth Sciences: Three Decades of Cosmogenic Nuclides)

Abstract

:
We used concentrations of in situ cosmogenic 10Be from riverine sediment to quantify the basin-averaged denudation rates and sediment fluxes in the Plessur Basin, Eastern Swiss Alps, which is a tributary stream to the Alpine Rhine, one of the largest streams in Europe. We complement the cosmogenic dataset with the results of morphometric analyses, geomorphic mapping, and sediment fingerprinting techniques. The results reveal that the Plessur Basin is still adjusting to the landscape perturbation caused by the glacial carving during the Last Glacial Maximum c. 20,000 years ago. This adjustment has been most efficient in the downstream part where the bedrock comprises high erodibility North Penninic flysch and Bündnerschist, whereas glacial landforms are still prominently preserved in the upstream region, comprising low erodibility South Penninic and Austroalpine bedrock. This geomorphic observation is supported by the 10Be based denudation rate and sediment provenance analysis, which indicate a much faster sediment production in the flysch and schist lithologies. Interestingly, the reach of fast denudation has experienced the highest exhumation and rock uplift rates. This suggests that lithologic and glacial conditioning have substantially contributed to the local uplift and denudation as some of the driving forces of a positive feedback system.

1. Introduction

In mountainous areas, the shape of a landscape is the expression of a complex interaction between tectonic and erosional processes over multiple temporal scales [1,2,3,4]. Tectonic forces create topography through the vertical upward-directed advection of crustal material, resulting in rock uplift, whereas erosional processes are mainly driven by gravitational forces and climate, and result in the downwearing of the accreted material. One particular expression of the interaction between tectonic and denudation is a positive feedback, where erosion-driven unloading has the potential to initiate an isostatic response of the lithosphere in the form of crustal uplift [5]. Such a mechanism at work has, for instance, been proposed for the Central European Alps [6,7]. However, for the Alps of Eastern Switzerland (Figure 1), several authors have suggested that the high uplift rates are rather a long-lived consequence of neotectonic shortening [8] than a feedback response to erosion. Furthermore, the occurrence of high uplift rates was explained within the context of a shorter timescale of observations, whereby the retreat and melting of glaciers of the Last Glacial Maximum (LGM), ca. 20 ka ago, was considered to have induced an isostatic rebound in response to unloading [9,10,11].
It has recently been documented that surface denudation rates over the past hundreds to thousands of years are lower than geodetically measured rock uplift rates, particularly in the Central Alps of Europe [18,19]. This observation was based on a compilation of published and new 10Be concentrations in riverine quartz in >350 rivers. Thus, an active tectonic driving force has to be invoked to explain the occurrence of a surface uplift component at the scale of the Central European Alps [19]. The authors of the aforementioned study also emphasized that the identifications of distinct driving forces on surface erosion and landscape shape at the regional scale and at that of individual catchments can be hampered because of the stochastic and site-specific nature of erosion.
The aim of this paper is to explore whether or not a positive feedback response to erosion can be invoked to explain the high uplift and exhumation rates in the Eastern Alps of Switzerland (Figure 1). To this end, we focused on the erosional mechanisms and related denudation rates in the Prättigau half-window near Chur, situated in the Eastern Alps of Switzerland (Figure 1a). This region exposes North Penninic flysch and Bündnerschist with a high bedrock erodibility in the core of the half-window, and these units are overlain by Penninic rocks and the Austroalpine orogenic lid that comprise limestones, gneiss, and schists with a lower erodibility [20]. We focused on this area because of previously published evidence for a tectonic control on erosion in the region and for the occurrence of an inferred, yet contested, positive feedback between denudation and uplift at least since the Pliocene [21,22] and possibly the Holocene [7]. We focused on the Plessur Basin (labeled as P in Figure 1b–e), situated in the southern part of this window where geodetically measured rock uplift rates are highest in the region (Figure 1b) and where the youngest apatite fission track ages have been reported (Figure 1c). We measured the denudation flux in this basin using in situ 10Be. We identified the sediment source areas through provenance tracing, and we related these data to the lithotectonic architecture of the Plessur Basin and to the topographic imprint caused by the LGM and possibly previous glaciers. These data are combined with the results of previous work [22] conducted in the Landquart Basin (labeled as L in Figure 1b) situated in the northern part of the Prättigau half-window. We then used the combined dataset to reconstruct a picture about the pattern of erosion at the regional scale during the Holocene and over millennia. It additionally allows us to re-address the problem of whether or not a positive feedback response to erosion can be invoked to explain the uplift and exhumation pattern in the region.

2. Setting

2.1. Lithotectonic Architecture

The tectonic architecture in the area is characterized by a stack of Helvetic, Penninic, and Austroalpine nappes, which generally show a regional dip toward the SE (Figure 1a). During Mesozoic times, the Helvetic units were part of the stretched margin of the European plate and formed the transition toward the Valais Ocean. These rocks crop out to the NW of the study area and are mainly composed of limestones with marl interbeds. Currently, the Helvetic thrust nappes overlay the Aar massif, a pre-Triassic crystalline basement unit, which is largely exposed west of our study area where this massif forms major topographic peaks. The top of the crystalline rocks then plunges toward the NNE, where it currently lies at a depth of 10 km beneath the study area (Figure 1e). To the north of Chur, however, a small outcrop made up of basement crystalline rocks can be found in the Vättis window ([12,17]; red star on Figure 1).
The Penninic units in the region, which overlay the Helvetic thrust sheets, are divided into Lower, Middle, and Upper Penninic thrust nappes (Figure 2). The Lower Penninic units comprise Mesozoic–Cenozoic hemipelagic sediments that were deposited within the Valais trough to the south of the Helvetic sedimentary realm. In the study area, the Lower Penninic rocks are represented by the Mesozoic Bündnerschist and the Upper Cretaceous to Eocene North Penninic flysch that are exposed in the Prättigau half-window (Figure 2).
The only Middle Penninic unit that is found in the area is the Falknis nappe, which is mainly composed of Mesozoic limestones that were deposited on the northern margin of the Briançonnais zone. During Mesozoic times, this zone was a submarine swell that separated the Valais Ocean from the Piemont Ocean farther north and south, respectively [12,15,17,23]. On the southern margin of the Briançonnais swell, ophiolitic sequences and fragments of continental crustal rocks (mélange) were formed during the Jurassic phase of spreading within the Piemont Ocean, which are now found in the Arosa Zone of the Upper Penninic unit ([17,24,25]; Figure 2). The Austroalpine units, situated on top of the Penninic thrust sheets, are divided into the Lower and Upper Austroalpine nappes and comprise rocks of the Adriatic continental plate (upper Austroalpine rocks) and its northern margin ([24]; lower Austroalpine units). The Lower Austroalpine nappes are mainly composed of Mesozoic limestones and are represented in the study area by the Rothorn and Tschirpen nappes [17,26] (Figure 2). The Upper Austroalpine units are represented by Triassic dolomites that make up the Languard nappe, and by Paleozoic sediments of the basement in the Silvretta nappe [27].
In summary, the lowermost part of the Plessur Basin is underlain by Lower Penninic Bündnerschist and North Penninic flysch, both of which are part of the Prättigau half-window (Figure 1a) and have a high erodibility [20]. The headwater part of the Plessur Basin, however, comprises ophiolites, limestones, and basement rocks of Penninic and Austroalpine origin with a substantially lower bedrock erodibility [20]. As will be shown below, the differences in bedrock erodibilities are seen in the pattern of surface denudation and sediment fluxes.

2.2. Rock Uplift and Exhumation

As previously mentioned, the study area has experienced one of the highest uplift rates in the Swiss Alps during the past decades, reaching up to 1.3 mm a−1 [13,14] (Figure 1b). The contour lines of rock uplift rates display a similar shape as those of apatite fission track cooling ages (Figure 1c), where the occurrence of highest uplift and lowest apatite fission track ages of c. 4 Ma are centered near Chur [15,23,28]. These young ages point to one of the fastest exhumation rates in the Central European Alps [17,21,29], and the contour lines follow the boundaries of the Prättigau half-window (Figure 1c). Interestingly, the location with the highest exhumation rates also corresponds to the region with the largest negative Bouguer anomalies near Chur [16] (Figure 1d), which suggests that the loads related to the surface topography are overcompensated in the region where the study area is situated [30,31,32].

2.3. Geomorphologic Framework

The Plessur Basin is a tributary of the Alpine segment of the Rhine River (here named Upper Rhine), located in the southeastern Swiss Alps. The basin covers an area of ca. 265 km2, and its trunk, the Plessur River, is ca. 30 km long (Figure 2). The lowermost section of the Plessur Basin is located within the Prättigau half-window. The Plessur Basin hosts four main tributaries streams: (i) the Rabiusa, which entirely drains Bündnerschist and North Penninic flysch rocks; (ii) the Sagabach, flowing through Penninic units; (iii) the Sapünerbach, which drains mainly Penninic rocks and a small part of Austroalpine units; and (iv) the Welschtobelbach, which is entirely sourced in Austroalpine units (Figure 2). The catchment areas of these tributary streams vary from ca. 25 to 60 km2.
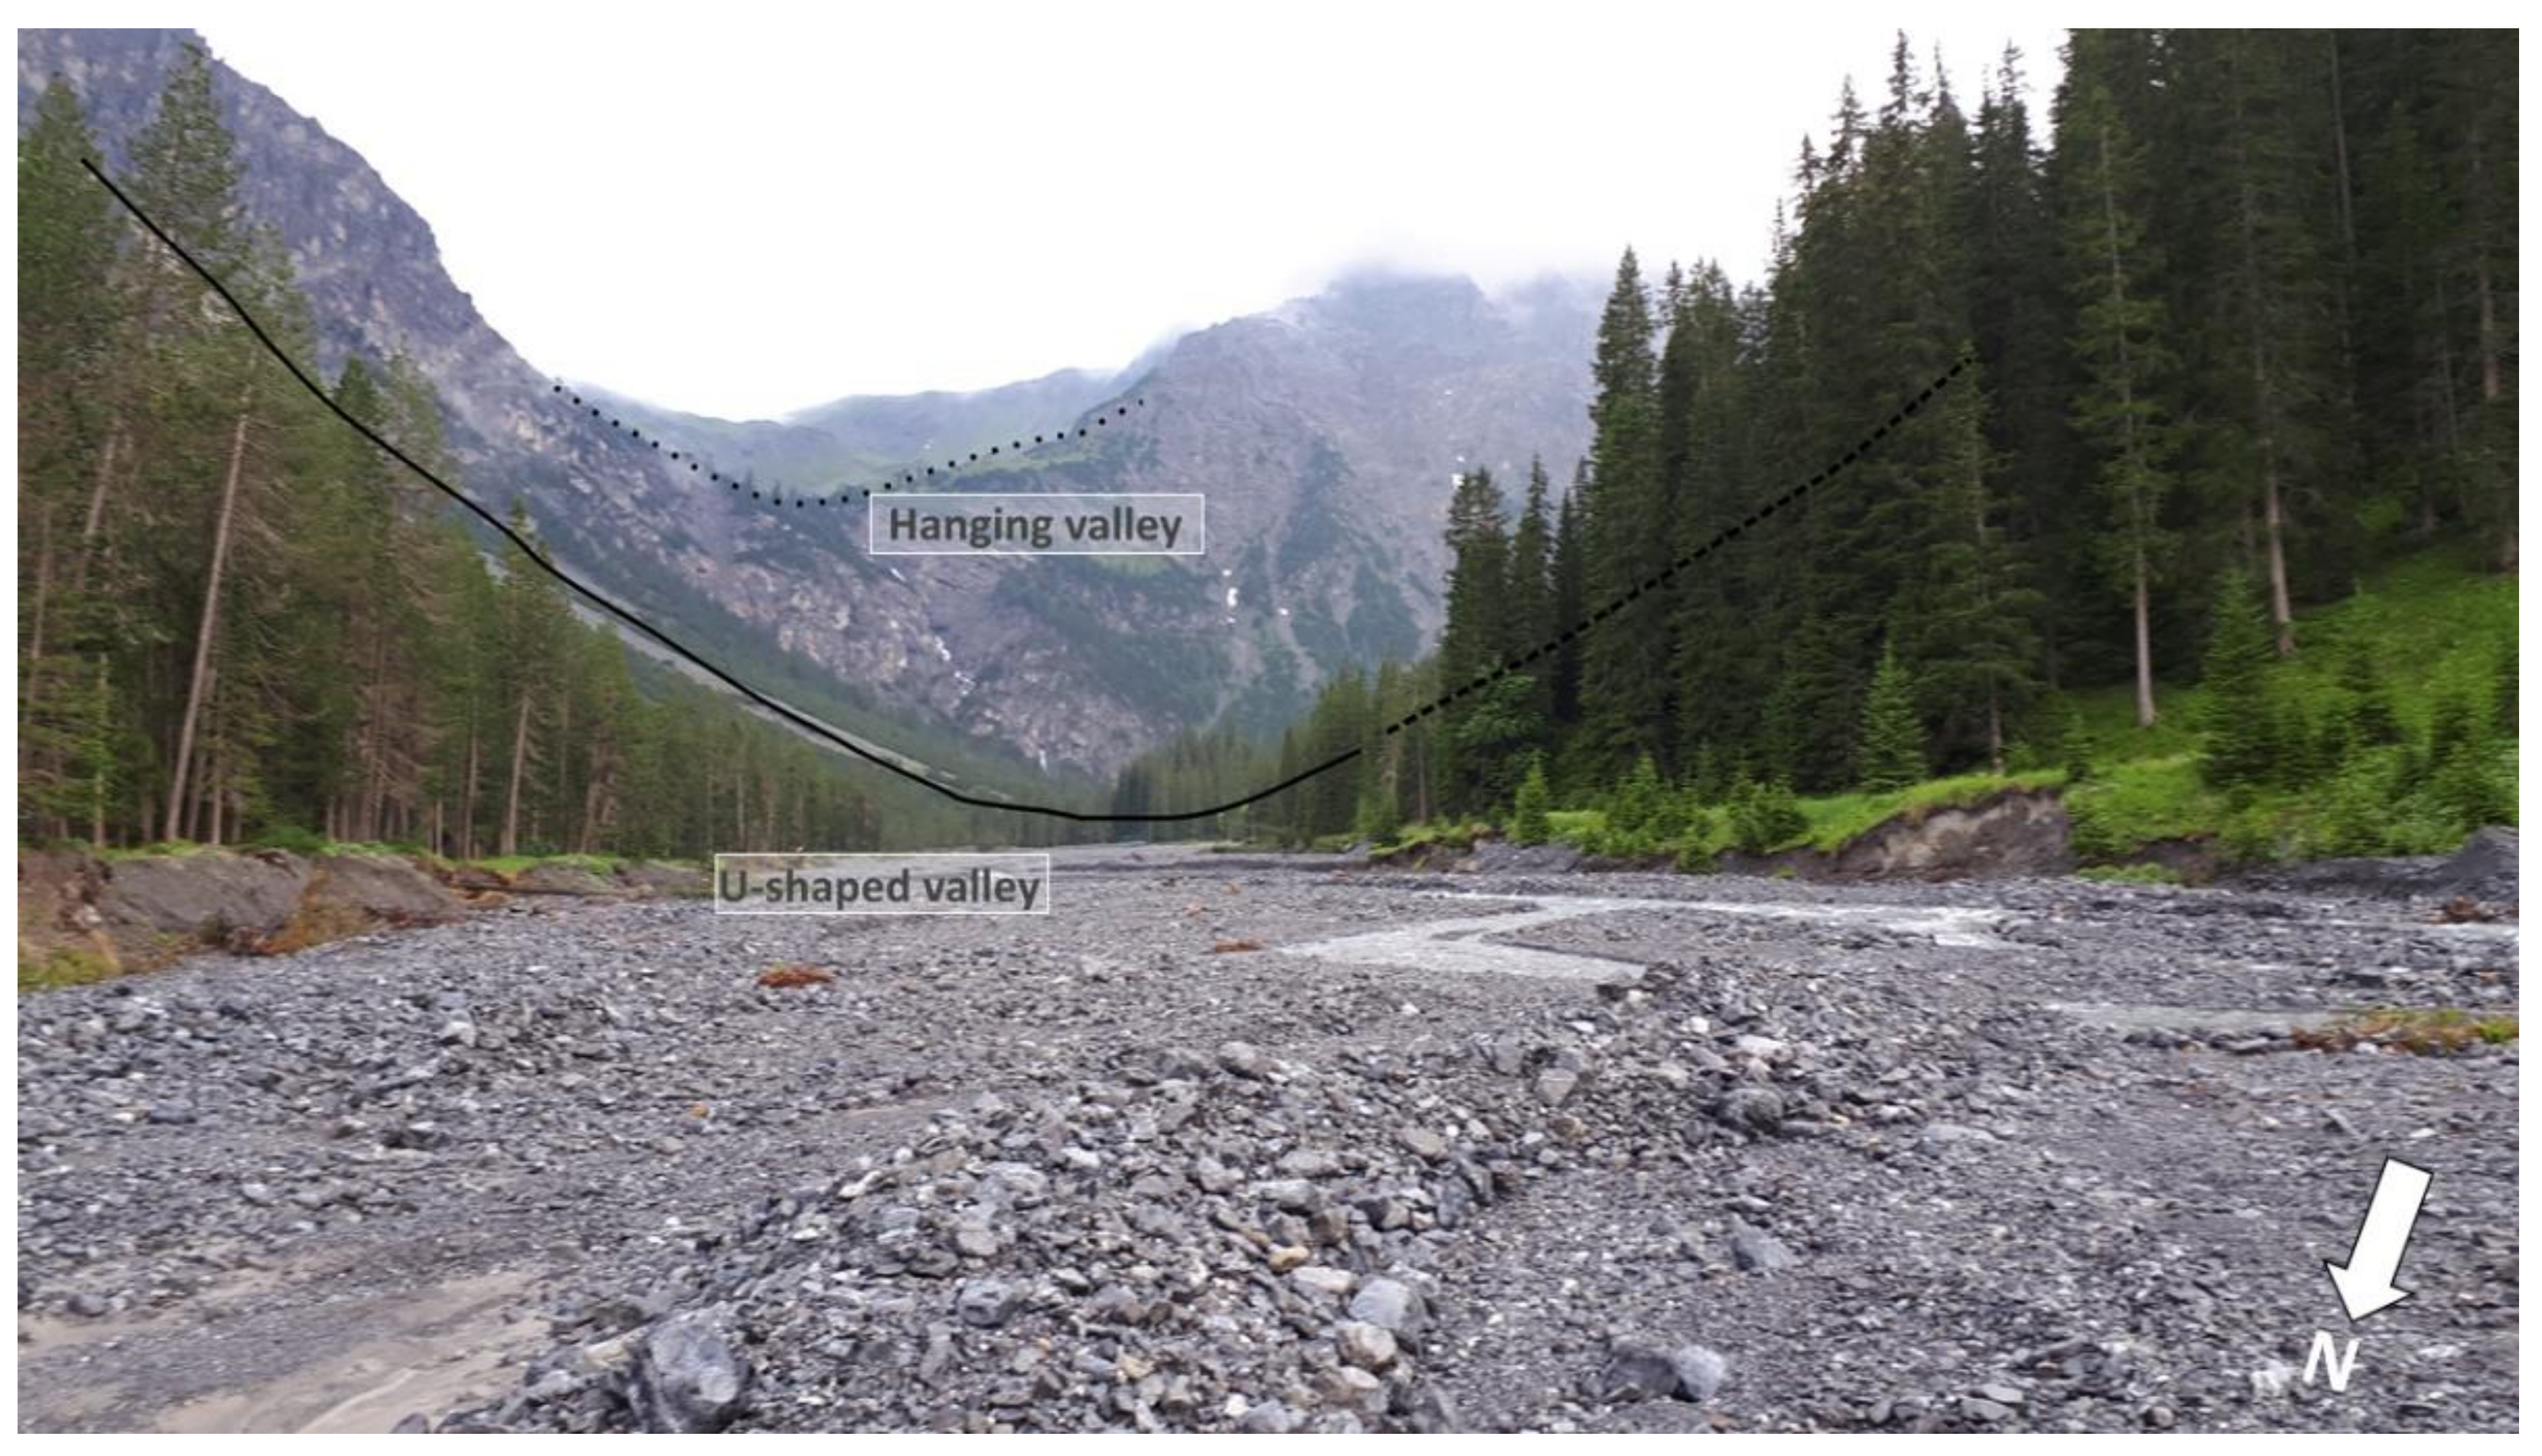
The cross-sectional geometries of the major tributary basins are generally V-shaped (Figure 3, transects EE’ and FF’) and reflect the ongoing dissection of the streams during the Holocene [33]. This observation is often verified in the lowermost part of the Plessur Basin, in the Rabiusa sub-catchment, and in the lowermost part of the Sagabach sub-catchment. In contrast, in the headwater areas of the Plessur Basin, which also includes the Sapünerbach and Welschtobelbach sub-catchments, U-shaped cross-sectional geometries and multiple convex-concave segments along the course of the valley are more common (Figure 3, transects AA’ and BB’, and Figure 4), both of which are an indication for glacial carving during the LGM and previous glaciations [34,35].

3. Methods

Following the scopes of the paper, we assembled geomorphic, provenance, and cosmogenic data to reveal that the Bündnerschist and North Penninic flysch units have been the most important sediment sources at least during the Holocene, and that the material contribution from the Austroalpine cover nappes has been less. We will relate the high denudation rates in the flysch and schist units to the high erodibility of these lithologies. We will then combine this information with data on long-term exhumation rates, offered by published fission track ages [15], and with the results of geodetic surveys where modern rock uplift rates has been measured [13]. These data suggest that uplift and exhumation have occurred at the highest rates in the Prättigau half-window that exposes Bündnerschist and Penninic flysch units with high bedrock erodibilities. We will use the combined information about (i) the long-term exhumation pattern; (ii) the geodetically measured uplift rates; (iii) the provenance of the material; (iv) the cosmogenic data; and (v) information on the landscape’s properties to propose that (a) erosion has occurred at the highest rates where bedrock with high erodibilities is exposed, (b) this pattern of erosion has occurred during the past millions of years including the Holocene, and that (c) the area of highest denudation rates coincides with the region of highest rock uplift and exhumation rates. Because of this spatial relationship between erosion and uplift over multiple time scales, we will propose that uplift and denudation could have been accelerated through a positive feedback mechanism. Following this concept, we will first describe the methods and the results of the geomorphic investigations, and we proceed with a presentation of how the sources of the material have been determined, and how, in combination with cosmogenic data, the pattern of sediment generation is quantified through budgeting. In doing so, we will also consider the dataset by Glaus et al. [22], which includes seven cosmogenic data so that our inferences will be based on a dataset with a total of 13 concentrations of cosmogenic 10Be.

3.1. Morphometric Analysis

3.1.1. Knickzones and Steepness Indices

Topographic variables provide evidence for how the landscape has been shaped in response to tectonic and surface driving forces (e.g., [1,7,36,37]). Among the various morphometric parameters, longitudinal river profiles offer the most diagnostic information on how streams have adjusted to changes in uplift, erosional mechanisms, and rates [38].
River profiles ideally have a concave-up shape, and deviations thereof in general and knickzones in particular indicate the occurrence of perturbations such as a modification in erosion and/or uplift rates and patterns (e.g., [37,39,40]). Knickzones are generally initiated in the lowermost section of a river profile, from where these steps migrate upward through the channel network [38,40,41,42]. In this study we identified the occurrence of knickzones in the Plessur Basin using a 50 m resolution digital elevation model (DEM) that was resampled from a 2 m resolution LiDAR DEM provided by Swisstopo®. The resampling was done in order to reduce the computing time. We extracted the longitudinal stream profiles of the main channel and the main tributaries from this digital dataset within an open-source GIS environment. The data were then exported into a spreadsheet and included information on profile length, altitude, slope, and drainage area. From these data, we calculated the steepness indices for these river profiles following Flint’s law [43] using TopoToolbox, a MATLAB script [44]. We normalized the steepness index (ksn) through a constant concavity value of 0.45 [45], which allows for a better comparison of river profiles with varying drainage areas. Knickzones in the longitudinal stream profiles were then identified along reaches with high ksn values. Their locations were also verified in the 2 m resolution LiDAR DEM.

3.1.2. Hypsometry, Slope Distribution, and Landscape Shape

The distribution of elevations within a basin bears relevant information on the extent of which a basin has been dissected by fluvial processes after the retreat of glaciers at the end of the LGM (e.g., [46]). Such data are commonly illustrated with a hypsographic curve where the cumulative area is plotted versus the relative elevation [47,48]. Additionally, the area under the curve, also known as the hypsometric integral (HI), can be calculated and normalized. This value represents the proportion of a basin that lies below a given elevation [49]. In addition, conceptual investigations have shown that a convex curve (HI > 0.5) is indicative for a young and thus immature stage in the development of a fluvially controlled landscape, whereas a concave curve (HI < 0.5) points toward a more mature stage [47,50]. Here, we reproduced such diagrams and extracted elevation data for the major tributaries and the trunk stream from a 2 m resolution DEM within an open source GIS environment.
Slope has been shown to exert one of the most important controls on erosion and sediment production [19,51,52]. In addition, hillslope steepness and length can positively influence runoff [53]. Moreover, it has been shown that denudation rates increase with steeper slopes until a threshold hillslope angle of c. 32°–35° (angle of repose) has been reached [19,52,54,55]. For landscapes where the hillslopes are steeper than this threshold, correlations between slope and denudation rates decouple [19,52]. We thus analyzed the slope distribution and the average slope of the Plessur and surrounding basins in an attempt to identify possible differences in sediment production and denudation between these basins. The analysis was based on a 50 m resolution DEM.
Finally, we mapped V-shaped versus U-shaped valley bottoms on the 2 m LiDAR-DEM for the Plessur Basin. These correspond to areas where streams have dissected into the previously glacially shaped landscape (e.g., cross section FF’ on Figure 3), or alternatively, these can be considered as reaches where the original glacial landscape is still preserved (e.g., Figure 4).

3.2. Sediment Provenance

We determined the bulk geochemistry of selected river samples to allocate the sources of the clastic riverine sediment. The samples were collected along the main stream as well as along tributaries of the Plessur River (Figure 2a, green dotted and yellow crossed circles, Figure S1 and Table S1), aiming for a good representation of the entire basin and its different lithotectonic units. From this detrital material, c. 5 g of the fine-grained sediment fraction of each sample (<63 μm) was separated, which was then analyzed through ICP-MS at the Activation Laboratories Ltd., in Ontario, Canada. This sediment fraction size was selected because silt grains are readily transported through the channel network, and since it was considered to adequately represent the different lithologies in the study area [56]. Therefore, the resulting sediment provenance model was only based on this sediment fraction, and it did not include the contribution of, for example, solute loads [57]. The results were expressed as major oxides and as selected trace elements (Sc, Cr, Ni, Sr, Y, Zr, Nb, and Ba). These were corrected for the loss of ignition and normalized to 100%. Values below the detection limit were changed to half of the detection limit.
The composition of all samples was investigated through principal component analysis (PCA). This method allows one to reduce the dimensionality of the dataset and, thus, facilitates the discrimination between the different samples according to their chemical composition [58,59]. Before conducting PCAs, we ran statistical tests to define the best combination of tracer elements that permits a discrimination between different compositional endmembers. For this purpose, we employed R-code fingerPro® [60] and conducted a three-step statistical test [61]: (i) in the first test, referred to as the range test, we explored whether the tracer elements are mass-conservative along the entire source to sink path; (ii) the second test, the Kruskal–Wallis H-test, allows one to exclude single tracer elements that do not vary significantly from the different samples and that, thus, do not provide a solid basis for a further discrimination; and (iii) we employed the Wilk’s lambda test as the third step. This particular test is a stepwise linear discriminant analysis, which allows one to identify the ensemble of tracers that yield a maximum variation between the samples. This was used to enhance the reliability of the discrimination. As a following up task, we applied the routine fingerPro® code to assess the relative contribution of the potential sediment sources (endmembers) for each in-stream sample. The results of this analysis will finally build the basis to reconstruct a sediment provenance model.

3.3. Catchment-Wide Denudation Rates Inferred from In Situ Produced Cosmogenic 10Be

3.3.1. Sediment Collection

We used concentrations of in situ 10Be in detrital quartz grains of river-born sediments to estimate the catchment-averaged denudation rates [62]. A total of four riverine sediment samples were collected in the main channel and in selected tributaries (Figure 2a, yellow crossed circles). We also collected a sediment sample in the Rhine River upstream of the confluence with the Plessur River and downstream after the confluence with the Landquart River (RHE01 and RHE02, respectively; inset Figure 2b) to complete the budgeting of the material. We collected 2.5 kg of sand material for each sample location because high carbonate contents were expected in the stream sediment samples as the upstream basin comprises Bündnerschist and North Penninic flysch with a high calcite content [22]. Finally, we also included the results of [22] from the Landquart basin, represented by the cosmogenic sample site Lan-1 (inset Figure 2b) in our analysis.

3.3.2. Laboratory Work

In the laboratory, the sediment samples were processed using state-of-the art techniques established at the University of Bern [63]. Accordingly, we sieved the samples to the size-fraction of 0.25–0.5 mm, from which the non-magnetic fraction was separated using a Franz isodynamic magnetic separator. The remaining material was treated to gain pure quartz grain void of atmospheric 10Be and other impurities. This includes (i) leaching with 5% hydrochloric acid (HCl) to dissolve the carbonates and organic components; (ii) three times treatment with 5% hydrofluoric acid (HF); and (iii) three treatment steps using 2.5% HF. As a last step of quartz purification, we used Aqua Regia in order to dissolve the remaining metallic components as well as residual carbonate and organic materials.
The chemical separation of 10Be was then performed using the lab protocol of [63] including: (i) Addition of ca. 0.2 mg of a 1g/L 9Be carrier to the purified quartz samples, which were then dissolved in concentrated HF; and (ii) completion of the evaporation of the solution. The sample was then fumed with HNO3, Aqua Regia, and HCl. The separation was followed by ion-chromatography columns. Beryllium and iron were then co-precipitated as hydroxides at a pH of around 8. The precipitates were dried and baked in a furnace at 675 °C before the resulting beryllium-iron oxide was finally pressed into copper targets. 10Be/9Be ratios were measured at the 500 kV TANDY AMS facility at the ETH Zurich [64] and normalized to the ETH in-house standard S2007N [65] using the 10Be half-life of 1.387 ± 0.012 Ma [66,67]. The full process blank ratio of (2.41 ± 0.13) × 10−15 was then subtracted from the measured ratios in order to calculate the 10Be concentrations for each sample.

3.3.3. Calculation of Denudation Rates, Scaling, and Sediment Fluxes

Calculation of the denudation rates was accomplished using the CAIRN® algorithm [68]. It calculates 10Be production rates and shielding factors on a pixel-by-pixel basis and propagates the uncertainty in AMS measurements and production rates. Based on this calculation, the software estimates the 10Be concentration of the basin considering a spatially homogeneous denudation rate. Finally, the software computes, through a Newton’s iteration method, the best denudation rate that fits the measured 10Be concentration. A 50 m-resolution DEM (resampled from a 2 m LiDAR DEM) was applied in the calculations as well as default parameters such as the SLHL 10Be production rate of 4.30 at g−1 a−1 (e.g., [19]). The calculations of the topographic shielding were based on inferred values of 8° and 5° for zenith (Δφ) and azimuth (Δθ), respectively [68]. A rock density of 2.65 g cm−3 was used. Snow shielding factors were estimated based on a combination of Swiss and French snow-data records [19]. We then used the calculated denudation rates to infer the sediment fluxes for specific areas. This was accomplished by multiplying the denudation rate of a specific sample by the drainage area upstream of this sample.

4. Results

4.1. Geomorphometric Analysis

4.1.1. Knickzones, Steepness Indices, and Hypsometries

Knickzones and their respective steepness index plots are found in Figure 5 and Table 1. The location of the knickzones is shown in Figure 6. In the Plessur River and Sagabach tributary channel, knickzones were found close to the lithological border between the Bündnerschist and the North Penninic flysch, having propagated horizontally 35% along the Plessur River and 14% along the Sagabach River, and vertically ca. 20% in both streams (Table 1). In the Sapünerbach and Welschtobelbach, the knickzones have propagated horizontally by 48% and 31%, respectively, and vertically, by 49% and 24%, respectively. The Rabiusa tributary stream does not present any knickzone. The steepness index plots reveal that the segments above the identified knickzones are consistently flatter (ksn varying from 126 to 213 m0.9) than the segments below the knickzones (ksn varying from 128 to 347 m0.9).
The hypsographic curves and hypsometric integrals (HI) of the Plessur River and its tributaries are shown in Figure 7. The Rabiusa tributary presents the lowest HI (0.48) of the Plessur Basin and a concave-shaped hypsographic curve, whereas the Sagabach has the highest HI (0.60) and a convex-shaped hypsometric curve. The Sapünerbach and Welschtobelbach have a HI of 0.55 and 0.51, respectively. The average is represented by the Plessur curve with a HI of 0.53.
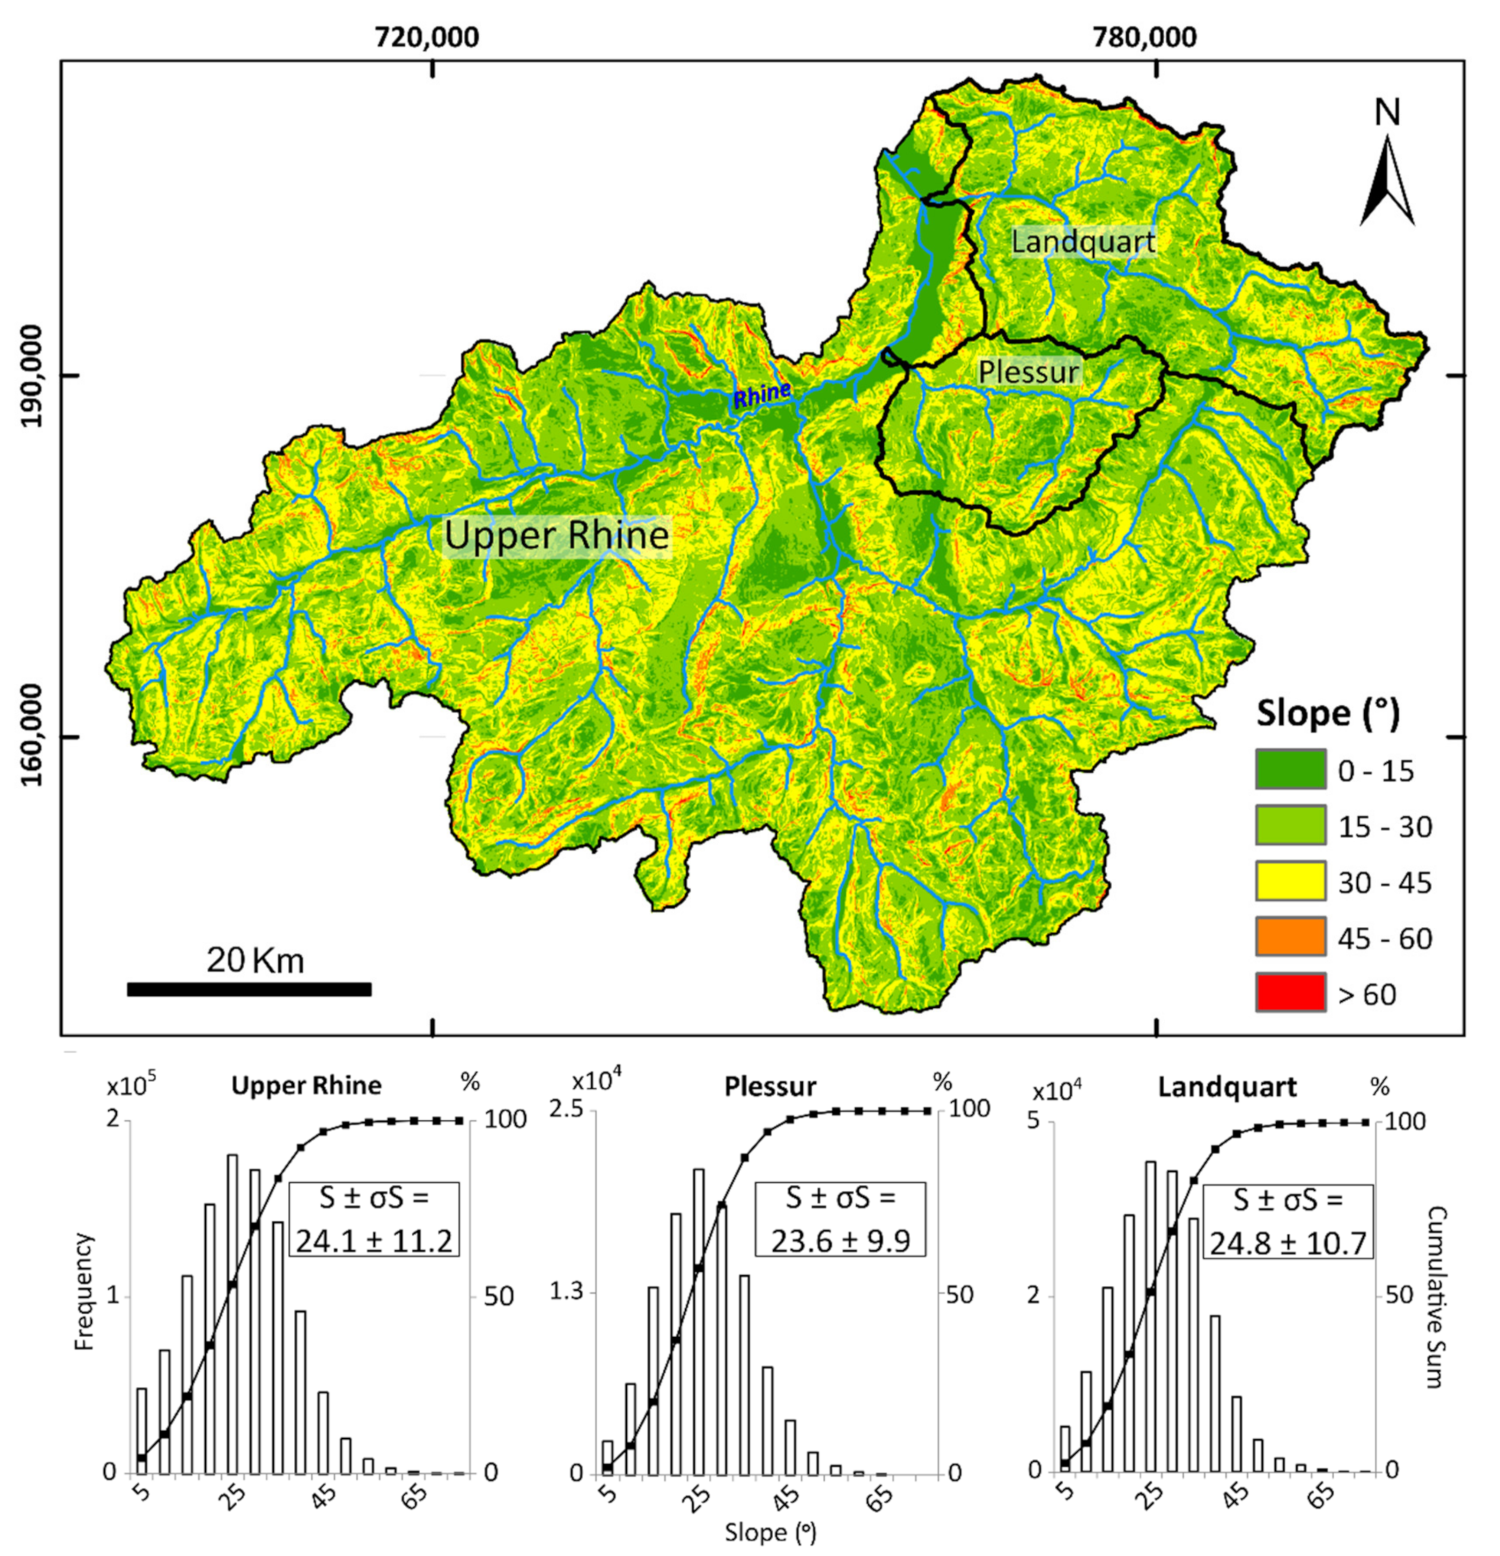
The slope distribution within the Plessur, Landquart, and Upper Rhine Basins are displayed in frequency plots (Figure 8). The three basins present a very similar situation, with a normal slope distribution and none of them display average hillslope angles beyond the commonly inferred threshold (angle of repose) of c. 32°–35° (e.g., [19,52]). The Plessur has an average slope of 23.6° ± 9.9°, the Landquart is c. 24.8° ± 10.7° steep, and the Upper Rhine has hillslope angles in the range of 24.1° ± 11.2°.

4.1.2. Landscape Patterns

The main glacial and fluvial patterns of the Plessur Basin are presented in Figure 9. Fluvial patterns (labelled as FP on Figure 9b,c) are predominantly represented by a rough aspect and channel dissection, whereas glacial patterns (labelled as GP on Figure 9b) have a smoother aspect with multiple concavities and convexities along the thalweg. For example, contrasts between glacial and fluvial patterns are found in the Sagabach sub-catchment (Figure 9b), whilst fluvial dissection predominates in the Rabiusa (Figure 9c). In general, the Plessur Basin presents clear fluvial dissection patterns in its lowermost sections where Lower Penninic Bündnerschist and North Penninic flysch predominates. However, it also displays glacial features in its uppermost areas, which are made up of Middle and Upper Penninic as well as Austroalpine units. The separation between both geomorphic domains is indicated by the dashed lines in Figure 9a,b.

4.2. Sediment Fingerprinting

4.2.1. Discrimination of Endmembers

The bulk geochemistry of each collected sample is displayed as the concentrations of major elements in the form of oxides (Table 2 and Table S2 for complete results) and of trace elements (Table 3 and Table S2 for complete results). The three statistical tests were then applied to this dataset. In the first test (range test), four tracers were excluded (P2O5, Sr, Y, and Zr). None of the remaining tracers passed the Kruskal–Wallis H-test and no patterns resulted from the Wilk’s Lambda test. This might be due to the low number of samples compiled in the dataset. The results of the PCA are displayed in Figure 10a, which indicates that, despite the low sample quantity, the samples can be attributed to three endmembers: ophiolitic, dolomitic, and clastic sedimentary.
The ophiolitic endmember is characterized by higher contents of Fe2O3, MnO, Ni, and Cr, whereas the dolomitic endmember is defined by the higher concentration of CaO and MgO. The clastic sedimentary endmember displays a more diffuse but still consistent signal, which is characterized by an intermediate content of all the oxides and trace elements used in the analysis. We note, however, that the sedimentary endmember comprises both the North Penninic flysch and Bündnerschist, because they cannot be discriminated by the PCA due to compositional similarities. The mixture samples are the ones collected in the main trunk (Plessur River). They displayed an average content of all the oxides and trace elements, which showed a composition similar to the clastic sedimentary endmembers. In the next step, the samples representing the clastic sedimentary endmember of the Landquart Basin (Table 3 and Table 4 in [22]) were combined with this work’s dataset, making the analysis more robust, since the Plessur endmembers are derived from identical lithotectonic units as those from the neighboring Landquart Basin (Figure 1). The range test excluded P2O5, Y, and Zr, whereas no tracer passed the Kruskal–Wallis H-test. The results of the Wilk’s Lambda test suggest that a combination of MgO and Ni is most suited to discriminate between the endmembers. The results are displayed in Figure 10b, in which Ni and MgO characterize the ophiolitic and dolomitic endmembers, respectively. Intermediate values between Ni and MgO represent the series of the clastic sedimentary endmember, where the data are well clustered near the center of the plot.

4.2.2. Sediment Provenance

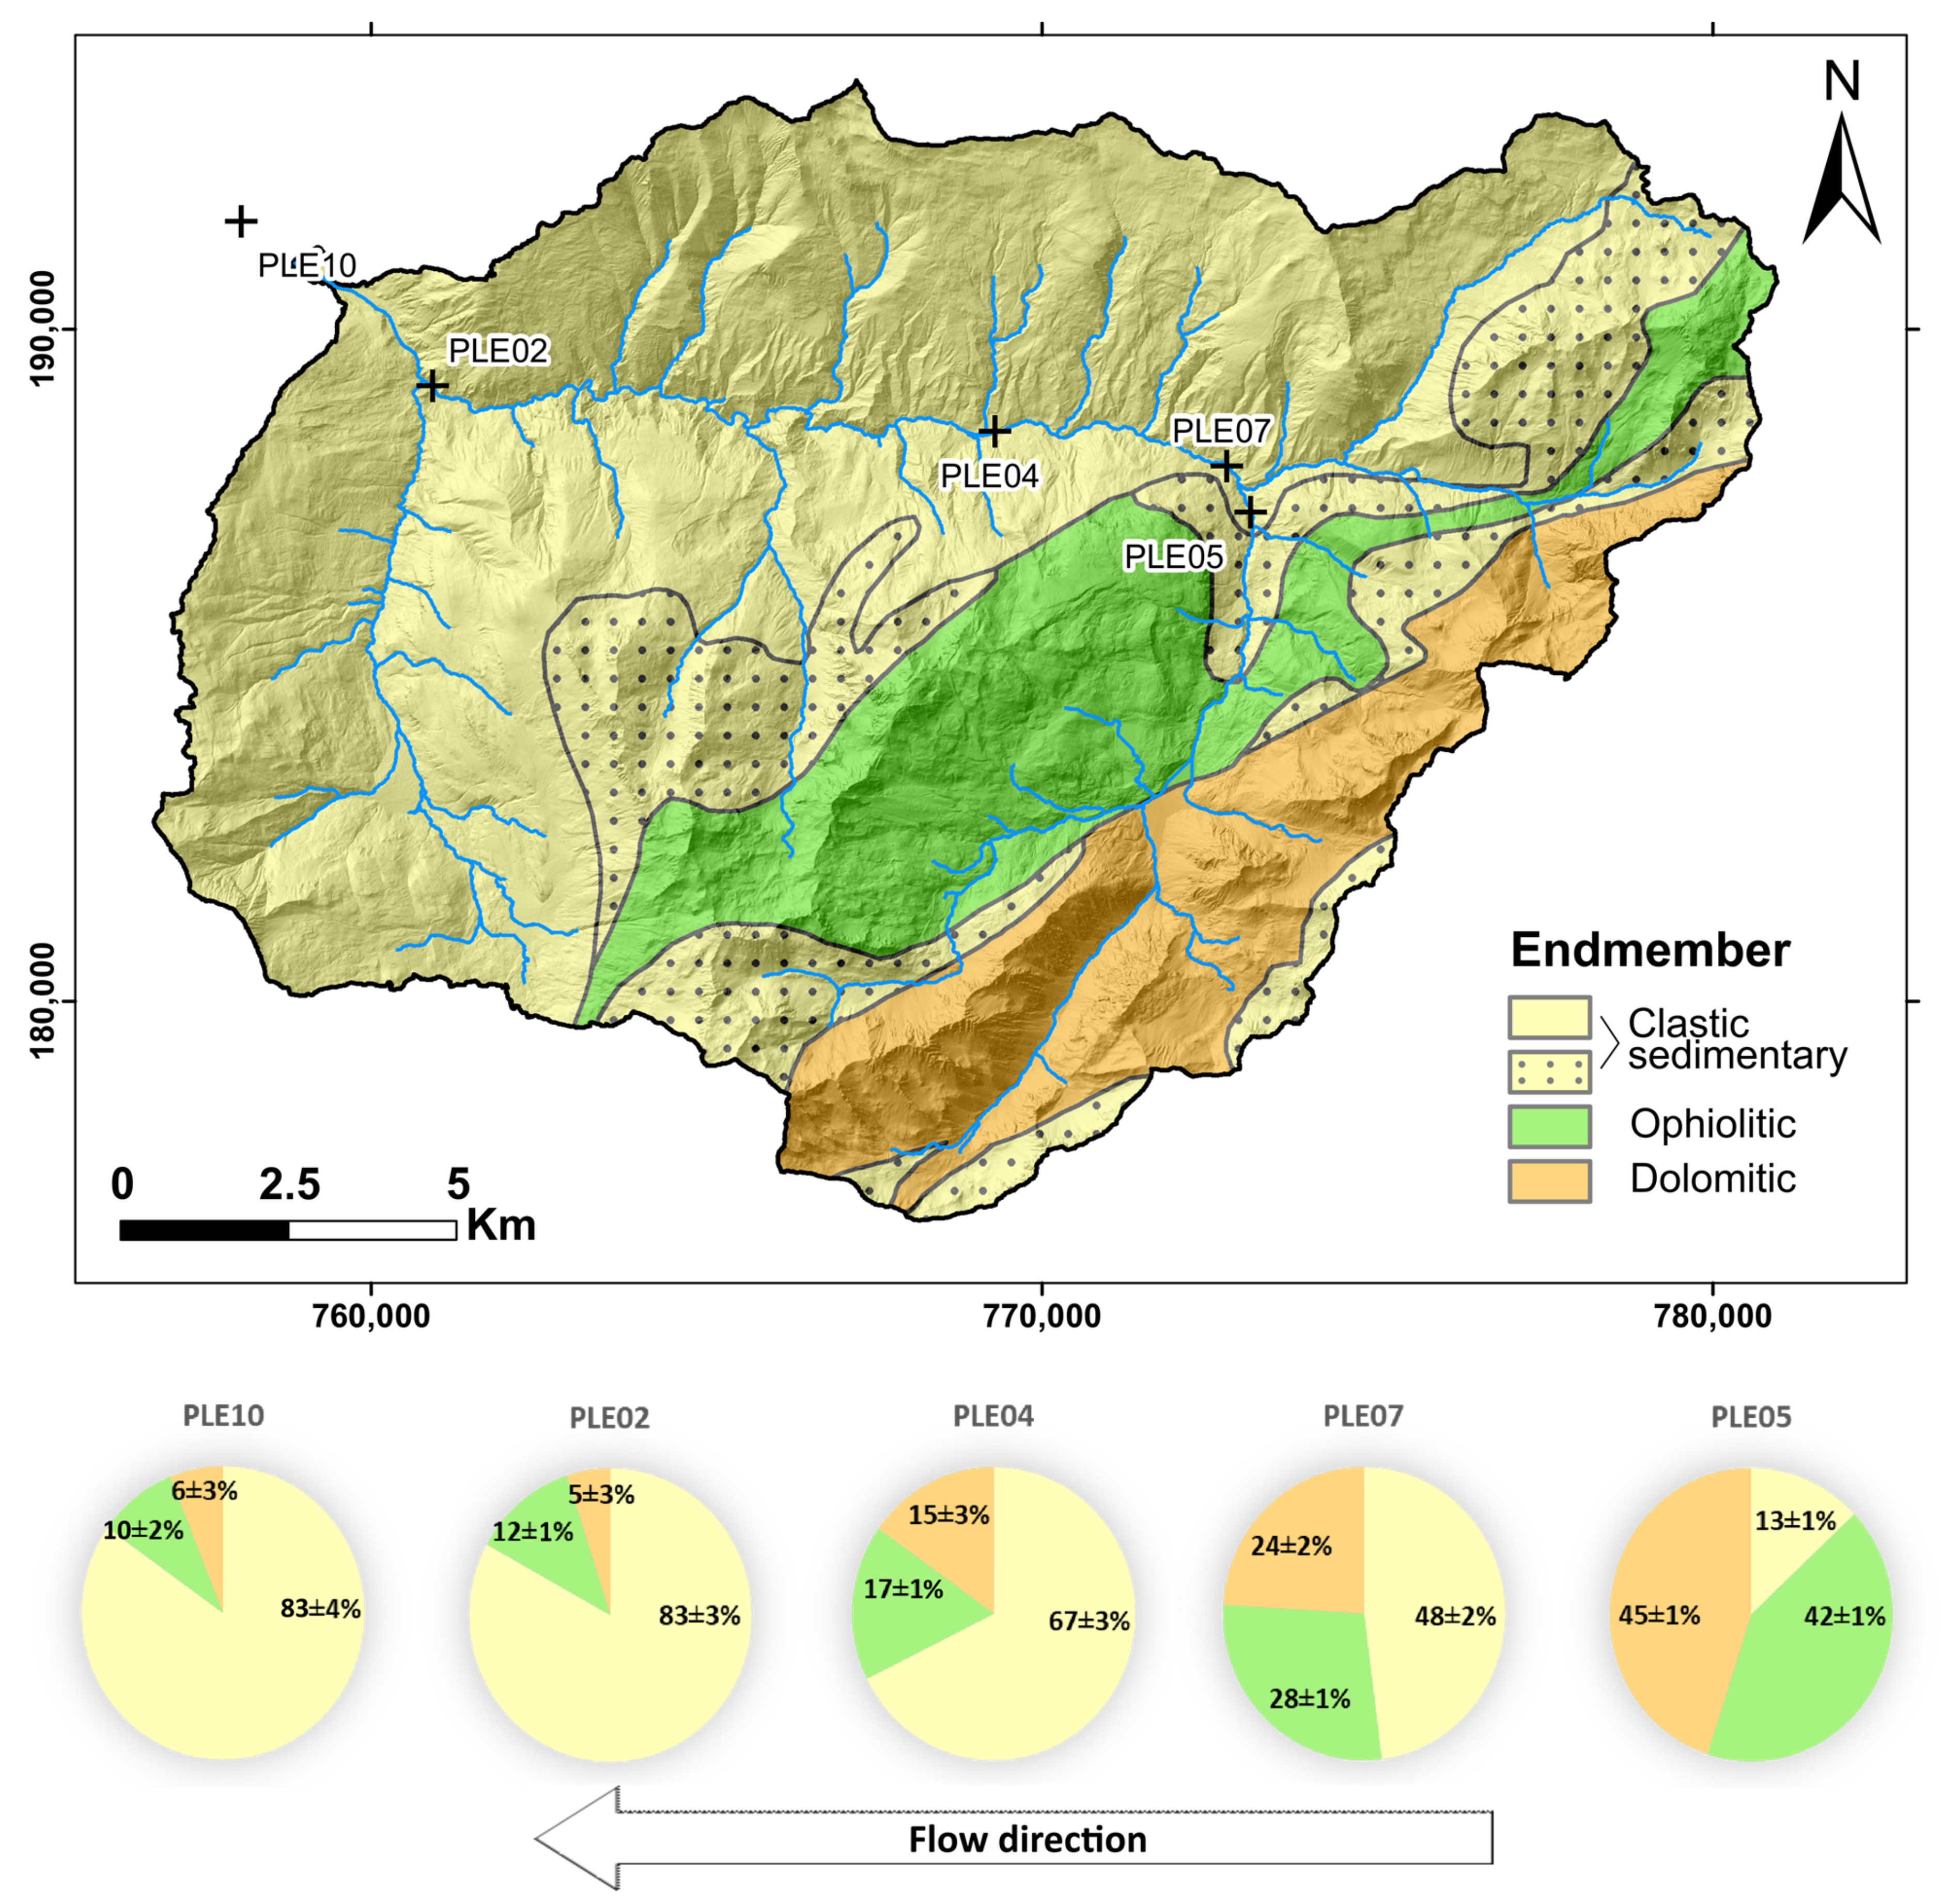
Using the endmembers identified above, we built a sediment provenance model to quantify the relative amount of sediment produced in the different lithotectonic units. We used the merged dataset (this work’s dataset and the Glaus et al. [22] dataset) to build the provenance model. We then compared the results before and after the application of the tests to the dataset (Table 4). Despite the similarities of the results in both runs, we selected the results of run 2 for our model because of the higher goodness of fit (GOF). In order to test whether the model is geologically consistent, we compared the model results with the lithological architecture of the Plessur Basin. Figure 11 displays a consistent pattern that is characterized, in the downstream direction, by an increase in the clastic sedimentary endmember contribution (from 13% ± 1% to 83% ± 4%) and a decrease in the ophiolitic and dolomitic contribution (from 42% ± 1% and 45% ± 1% to 10% ± 2% and 6% ± 3%, respectively). Furthermore, as also seen in Figure 11, the material composition of sample PLE05 displays a good agreement with the local lithology in the sense that it shows a relatively low contribution of the clastic sedimentary endmember (13% ± 1%) and relatively high contribution of both the ophiolitic (42% ± 1%) and dolomitic (45% ± 1%) endmembers.

4.3. Cosmogenic Data and Denudation Rates

The measured 10Be concentrations (Table 5) vary from 1.53 × 10⁴ atoms g−1 (PLE02) to 3.86 × 10⁴ atoms g−1 (PLE06) for the Plessur Basin, whereas for the Upper Rhine segment, they vary from 1.48 × 10⁴ atoms g−1 (RHE02) to 1.78 × 10⁴ atoms g−1 (RHE01). The calculated spatially-averaged denudation rates (Table 6 and Figure 12) range from 0.34 ± 0.07 mm a−1 (PLE06) to 0.77 ± 0.16 mm a−1 (PLE02) for the Plessur Basin, whereas for the Upper Rhine segment, they vary from 0.70 ± 0.14 mm a−1 at RHE01 to 0.81 ± 0.16 mm a−1 at RHE02 after the confluence of the Plessur and Landquart Rivers. These results are in line with local denudation rates of similar lithotectonic units [22,69,70] as well as with denudation rates reported for the Central European Alps [18,19,71]. The sediment budget of the Plessur and Landquart Basins were then compared with that of the Upper Rhine Basin in order to estimate the relative contribution of these tributary basins to the total Upper Rhine sediment budget (Table 7; Figure 13). The results show that the total sediment flux of the Upper Rhine is c. 3494 ± 677 × 103 m3 a−1. The contribution of the Plessur Basin to the Upper Rhine basin is approximately 181 ± 35 × 103 m3 a−1, which corresponds to c. 5.2% of the total budget while it covers a relative area of 6.1%. The Landquart Basin has a sediment flux of c. 704 ± 190 × 103 m3 a−1, which corresponds to 20.1% of the total sediment budget and represents a relative area of 14.3%.

5. Discussion

5.1. Topographic Parameters Reveal a Transient Stage

The combination of the data extracted from stream profiling facilitates the understanding of the landscape development. The normalized steepness index patterns show that the Plessur River, and those tributaries where knickzones were identified, have a relatively steeper downstream profile when compared with their upstream river segments (Table 1, Figure 5). This implies that the downstream part of the Plessur Basin, where normalized steepness indices are generally higher, has already undergone a rejuvenation process after the retreat of the LGM glaciers. In contrast, the areas where steepness indices are lower and where LGM-inherited glacial imprints are still preserved, the landscape shape is still in an immature stage with respect to fluvial processes rejuvenating a glacially conditioned landscape (e.g., [22,38,69]). In the Plessur Basin, evidence for fluvial carving is better developed in the mechanically weak lithologies such as the Bündnerschist and the North Penninic flysch, especially in the areas near the main trunk and within the Rabiusa drainage area (Figure 9). For instance, evidence for fluvial dissection can be seen in the Sagabach tributary sub-catchment. There, glacial features in the landforms underlain by rocks of the Falknis nappe contrast with the V-shaped fluvial landscape farther downstream where the bedrock is made up of the North Penninic flysch (Figure 9a). The Rabiusa sub-catchment and the lowermost areas of the Plessur Basin, which are underlain by Lower Penninic units, also display well-developed V-shaped cross-sectional valley geometries, thus pointing toward the occurrence of fluvial processes dissecting the landscape (Figure 9b). Interestingly, the Rabiusa tributary stream does not show any evidence for a knickzone (Figure 6). This suggests that this stream has not had any major steps in the long-stream profile after the retreat of the LGM glaciers, or more likely that a possible knickzone has already fully propagated through the entire channel network by headward retreat after the LGM. We support this interpretation with ample evidence for fluvial processes at work in the entire Rabiusa sub-catchment (V-shaped incision, Figure 9c), pointing toward an incised and rejuvenated landscape. In contrast to these morphologies, the uppermost areas of the Plessur Basin, where the bedrock comprises Austroalpine and Upper Penninic units, glacial landforms including concavities and convexities along the thalweg and U-shaped cross-sectional geometries occur more frequently. This is shown in Figure 9a for the uppermost part of the Plessur Basin (upstream of the dashed line), where all the other lithotectonic units are found, except for the Penninic flysch and Bündnerschist (Figure 2).
The hypsometric analysis (Figure 7) supports the aforementioned interpretations. The Plessur River presents a hypsometric integral of 0.53, which implies that the basin is in a late immature stage, almost reaching a denudation equilibrium [47]. Similarly, the Rabiusa sub-catchment has a hypsometric integral of 0.48, which implies a slightly more mature but yet an unequilibrated stage, whereas the Sagabach sub-catchment, with a hypsometric integral of 0.60, reveals a rather young stage of fluvial development [47]. The Sapünerbach and Welschtobelbach (HI of 0.55 and 0.51, respectively) are considered to be in a late immature stage.
Overall, considering the combination of topographic parameters, we propose that the Plessur Basin is in a transient stage, as evidenced by the on-going upstream migration of knickzones and the contrast between fluvial (downstream) and glacial patterns (upstream) in the landscape. As outlined by different authors [33,69,72], this transient state most likely reflects that the Alpine streams are still adjusting their geometries to the perturbation caused by the carving of the LGM glaciers.

5.2. The Relationship between Sediment Provenance and Denudation Rate

We built a sediment provenance model according to the three compositional endmembers suggested by the PCA (Figure 11). This was accomplished considering the <63 μm sediment fractions only, which limits a holistic analysis of the sediment production in the Plessur basin, but still yields meaningful results (e.g., [18,22]). Indeed, the data show that the clastic sedimentary contribution abruptly increases from 13% ± 1% to 48% ± 2% from PLE05 to PLE07 farther downstream (Figure 11). This change could be related to a significant contribution of the sedimentary endmember component provided by the Sapünerbach sub-catchment. Another explanation could be attributed to a difference in the mechanical properties of the sedimentary rocks exposed in the Middle Penninic and Austroalpine units (dotted yellow, Figure 11), if compared with the Bündnerschist and flysch sediments of the Valais Ocean that make up the Lower Penninic units (yellow, Figure 11). In particular, the Middle Penninic and Austroalpine units (ophiolites and dolomites) upstream of PLE05 are considered to have a lower erodibility than the Lower Penninic units (Bündnerschist and flysch; [20]) that are exposed downstream of PLE05. We thus explain the relatively low contribution of the sedimentary endmember in the PLE05 sample by the low areal extent at which Bündnerschist and flysch lithologies are exposed upstream of that sample site. Farther downstream, a persistent increase of the clastic sedimentary endmember contribution along the Plessur River, rising from 13% ± 1% at the PLE05 site to 83% ± 4% at the PLE10 sample location, reflects the combined effect of a widespread exposure of the Bündnerschist and flysch source rocks and the high erodibility of these lithologies. Furthermore, although the sedimentary endmember covers an area of around 185 km2 and thus ca. 69% of the total basin area, the relative abundance of the sedimentary endmember is almost 85% at the end of the Plessur River. In contrast, at the downstream end of the basin, dolomite and ophiolitic lithologies contribute up to 15% to the sediment budget, whilst covering an area of around 80 km2 (ca. 31% of the total basin area). Therefore, we consider the area surrounding the Lower Penninic units made up of Bündnerschist and North Penninic flysch as a denudation hotspot within the Plessur Basin. However, we note that only the fine sediment fraction was analyzed, which could have resulted in an overestimation of the clastic sedimentary endmember contribution because it is possible that schist and flysch tend to break down to smaller grains more rapidly than limestones and ophiolites.
Similar to the material composition of the riverine material, the denudation rate pattern calculated for the Plessur Basin reflects the differences in the bedrock erodibilities of the underlying rocks. This is shown by an increase in the basin-averaged denudation rates in the downstream direction. In particular, material of the samples PLE05 and PLE06 (Figure 12) records the lowest catchment-averaged denudation rate (0.44 ± 0.08 mm a−1 and 0.34 ± 0.07 mm a−1, respectively) in the Plessur Basin, whereas the PLE02 material yielded the highest values (0.77 ± 0.16 mm a−1). We note that 10Be concentrations in sediments at the lowermost PLE10 site yield a denudation rate of 0.68 ± 0.13 mm a−1, which might be perceived as lower than the records at site PLE02 farther upstream. However, considering the uncertainties on the denudation rate estimates, the difference in the inferred catchment-averaged denudation rates becomes non-significant.

5.3. Upscaling and Including the Material Flux of the Rhine River

We upscale the results of the Plessur Basin analysis and include the material flux of the Upper Rhine through measuring concentrations of in situ 10Be in samples collected upstream (RHE01) and downstream (REH02) of the confluences of the Plessur and Landquart Rivers (Figure 13). The scope of this task is to estimate the relative importance of the Plessur and Landquart Basins on the sediment budget in the region. Accordingly, sample RHE01 yields a basin averaged denudation rate of the Upper Rhine River before the Rhine receives the material of the Plessur and Landquart Rivers (Figure 13, Table 6 and Table 7). Similarly, with sample RHE02, we estimate the average denudation rate of the entire Upper Rhine Basin including the contribution of the Plessur and Landquart Basins (Figure 13 and Table 7). Considering that the sediment flux calculated at RHE02 and the related upstream drainage area is 100%, then the Plessur River (drainage area of 6.1%) contributes up to 5.2% to the sediment flux at RHE02 (Table 7), whereas the Landquart River (drainage area of 14.3%) contributes up to 20.1% to this material budget (Table 7, data taken from [22]). Therefore, the sediment contribution of both the Landquart and Plessur Basins is, at the basin scale, in the same range as the other parts of the Upper Rhine Basin. However, it was documented for the Landquart Basin that a small downstream portion of the catchment that is underlain by Bündnerschist contributes between 60 to 70% of the basin’s sediment flux, although it represents only <30% of the entire Landquart drainage area [22]. A comparable picture, although not as prominent as in the Landquart, arises if the denudation rate and sediment flux patterns in the Plessur Basin are considered. In particular, in the upper part of the Plessur Basin, which is underlain by rocks of the Austroalpine and Penninic units, the catchment-averaged denudation rates are ca. 0.3–0.4 mm a−1. The rates nearly double to almost 0.8 mm a−1 as the stream flows through the Lower Penninic units where Bündnerschist and flysch are exposed, and the relative abundance of sedimentary material increases accordingly (Figure 11). Because the relative area of this downstream portion makes up to around 50% of the entire basin, then a doubling of the catchment-averaged denudation rates requires a three times larger contribution of material from the lower part, as calculated through mass balancing (see calculations in Equation S1 in the Supplementary Material). This implies that the Lower Penninic area, similar to the Landquart Basin, could be considered as hosting a denudation hotspot of the region (see also [22,70]).

5.4. Possible Controls on the Local Uplift Rates and Feedbacks with Denudation

The fast exhumation rates in the Landquart-Chur region are the response of a long-lived tectonic forcing ([15]; Figure 1). The updoming of the region was considered to have started ca. 4–5 Ma ago and might have exposed the Bündnerschist and North Penninic flysch to the surface, thereby forming the Prättigau half-window [15,21,29]. The site of updoming coincides in space with a peak of a negative isostatic anomaly (Figure 1d), caused by the almost-60-km-deep crustal root underneath the Central European Alps [30,32]. The related rocks, which are most likely buoyant [30], possibly contribute, or at least facilitate a possible positive feedback mechanism where rapid denudation of the Bündnerschist and North Penninic flysch with high erodibilities promote an isostatic response, which is likely reflected by the high exhumation rates over Ma. Thus, this isostatic anomaly not only has the potential to support a long-lived uplift signal, but it also points to the role of how deep crustal and geodynamic processes have the potential to exert a control on denudation at the surface (e.g., through contributing to the controls on the high uplift rates). In line with previous studies [7,22], we therefore propose that the exposure of mechanically weak lithologies has not only promoted surface denudation in the region where flysch and Bündnerschist are exposed, but also, through a positive feedback, the high modern uplift, and long-term exhumation rates. Equally relevant is the surface response to glacial carving, which could destabilize the local basin’s equilibrium [11,69], possibly altering the local base level. The topographic parameters analyzed in this work indeed support the interpretation that the transient stage of the local basins is also due to the perturbation caused by the carving of the LGM glaciers. The rate of fluvial adjustments has then been controlled by the erodibility of the underlying bedrock. Furthermore, the melting of the LGM glaciers was likely to have initiated an isostatic rebound [11], thereby contributing to the maintenance of a possible positive feedback between uplift and lithology-controlled denudation. However, because the pattern of fission track ages comprises an exhumation record, which goes beyond the timescales of Alpine glaciations, and since the Prättigau half-window is characterized by the largest negative isostatic anomaly in the region, we infer a scenario where an active tectonic driving force has sustained the high uplift and denudation rates over millennia. This uplift, however, has most likely been accelerated in response to a denudation feedback, which in turn, could have been conditioned and controlled by lithology contrasts and possibly by glacial perturbations, at least since the Pleistocene.

6. Conclusions

The topographic variables reveal that the Plessur Basin is still adjusting to the perturbation caused by the termination of the LGM. This can be observed in the distribution of glacial and fluvial patterns in the landscape. Fluvial patterns are more often found in the lowermost areas of the basin where the thalweg of the trunk stream is steepest, whereas glacial patterns are more commonly observed in the uppermost and flatter areas of the basin. The presence of knickzones in the basin also supports the observations that a transient stage is still prevailing, most likely due to the last deglaciation event. Besides, the knickzones’ locations disclose the role of the differential erosion mechanisms in the Plessur Basin. Apparently, the Bündnerschist is mechanically weaker than the North Penninic flysch, given that the two most prominent knickzones of the Plessur Basin are located between Bündnerschist and North Penninic flysch. Nonetheless, both units are considerably more erodible if compared with all the other units in the study site. Such high erodibility is reflected in the contribution of the mechanically weak units to the total sediment budget of the Plessur Basin. The data show an abrupt increase in the contribution of the Bündnerschist and flysch material to the Plessur sediment budget, rising from 13% ± 1% to 48% ± 2% within a reach of ca. 1 km where the corresponding bedrock changes. Furthermore, the highest catchment averaged-denudation rates of the Plessur Basin are found in locations where Bündnerschist and North Penninic flysch are predominant. At the regional scale, the long-lived uplift rates recorded by apatite fission track ages and geodetic surveys are possibly a consequence of the combination of two mechanisms: (i) sustainment of uplift rates by tectonic and deep crustal processes; and (ii) amplification of uplift rates caused by denudation unloading of the highly erodible Lower Penninic units (Bündnerschist and North Penninic flysch) of the Prättigau half-window. We thus conclude that lithologic, glacial, and geodynamic conditioning have substantially contributed to the local uplift and erosion mechanism as some of the driving forces of a positive feedback system.

Supplementary Materials

The following are available online at https://www.mdpi.com/article/10.3390/geosciences11080339/s1, Figure S1: Pictures of the sample sites. The location of samples PLE08, RHE01, and RHE02 were not photographed; Equation (S1): Mass balance; Table S1: Location, day, and time of sample collection; Table S2: Complete results of the ICP-MS analysis showing the composition of each sample.

Author Contributions

F.S. and R.D. designed the study, together with E.d.S.G. E.d.S.G. conducted all analyses with support from R.D., N.A., L.S. and M.C. E.d.S.G. wrote the text and drafted the figures with support by F.S. and R.D. All authors contributed to the discussion of the article. All authors have read and agreed to the published version of the manuscript.

Funding

This research was funded through various grants offered by the University of Bern, with major contributions by the Swiss National Science Foundation (project 147689 awarded to Fritz Schlunegger) and some support from the European Union’s Horizon 2020 research and innovation programme under the Marie Sklodowska-Curie grant agreement No 860383 (awarded to Ronald van Balen).

Data Availability Statement

All data used in this paper are presented as tables or Supplementary Materials. The swisstopo DEMs are openly accessible.

Acknowledgments

The authors would like to thank Julijana Krbanjevic, Catharina Dieleman, and Serdar Yesilyurt for their technical support during the samples preparation. We are also grateful to the Laboratory of Ion Beam Physics accelerator mass spectrometry facility operated by the Swiss Federal Institute of Technology, Zurich, Switzerland. The quality of the paper has benefited from constructive reviews by three anonymous reviewers, which are especially acknowledged.

Conflicts of Interest

The authors declare no conflict of interest.

References

  1. Willett, S.D.; Brandon, M.T. On steady states in mountain belts. Geology 2002, 30, 175. [Google Scholar] [CrossRef]
  2. Burbank, D.W.; Anderson, R.S. Tectonic Geomorphology; John Wiley & Sons, Ltd.: Chichester, UK, 2011; Volume 13, ISBN 9781444345063. [Google Scholar]
  3. Champagnac, J.-D.; Molnar, P.; Sue, C.; Herman, F. Tectonics, climate, and mountain topography. J. Geophys. Res. Solid Earth 2012, 117, B2. [Google Scholar] [CrossRef] [Green Version]
  4. Whittaker, A.C. How do landscapes record tectonics and climate? Lithosphere 2012, 4, 160–164. [Google Scholar] [CrossRef] [Green Version]
  5. Whipple, K.X. The influence of climate on the tectonic evolution of mountain belts. Nat. Geosci. 2009, 2, 97–104. [Google Scholar] [CrossRef]
  6. Champagnac, J.-D.; Schlunegger, F.; Norton, K.; von Blanckenburg, F.; Abbühl, L.M.; Schwab, M. Erosion-driven uplift of the modern Central Alps. Tectonophysics 2009, 474, 236–249. [Google Scholar] [CrossRef] [Green Version]
  7. Korup, O.; Schlunegger, F. Rock-type control on erosion-induced uplift, eastern Swiss Alps. Earth Planet. Sci. Lett. 2009, 278, 278–285. [Google Scholar] [CrossRef]
  8. Persaud, M.; Pfiffner, O. Active deformation in the eastern Swiss Alps: Post-glacial faults, seismicity and surface uplift. Tectonophysics 2004, 385, 59–84. [Google Scholar] [CrossRef]
  9. Gudmundsson, G.H. An order-of-magnitude estimate of the current uplift-rates in Switzerland caused by the Würm Alpine deglaciation. Eclogae Geol. Helv. 1994, 87, 545–557. [Google Scholar]
  10. Barletta, V.R.; Ferrari, C.; Diolaiuti, G.; Carnielli, T.; Sabadini, R.; Smiraglia, C. Glacier shrinkage and modeled uplift of the Alps. Geophys. Res. Lett. 2006, 33, L14307. [Google Scholar] [CrossRef]
  11. Mey, J.; Scherler, D.; Wickert, A.D.; Egholm, D.L.; Tesauro, M.; Schildgen, T.F.; Strecker, M.R. Glacial isostatic uplift of the European Alps. Nat. Commun. 2016, 7, 13382. [Google Scholar] [CrossRef] [Green Version]
  12. Schmid, S.M.; Pfiffner, O.A.; Froitzheim, N.; Schönborn, G.; Kissling, E. Geophysical-geological transect and tectonic evolution of the Swiss-Italian Alps. Tectonics 1996, 15, 1036–1064. [Google Scholar] [CrossRef] [Green Version]
  13. Kahle, H.; Marti, U.; Geiger, A.; Wirth, B.; Gubler, E. Recent crustal movements, geoid and density determination: Contribution from integrated satellite and terrestrial measurements. In Deep Structure of the Swiss Alps: Results of NRP 20; Pfiffner, O.A., Lehner, P., Heitzmann, P., Mueller, S., Steck, A., Eds.; Birkhäuser: Basel, Switzerland, 1997; pp. 251–259. [Google Scholar]
  14. Schlatter, A.; Schneider, D.; Geiger, A.; Kahle, H.-G. Recent vertical movements from precise levelling in the vicinity of the city of Basel, Switzerland. Int. J. Earth Sci. 2005, 94, 507–514. [Google Scholar] [CrossRef]
  15. Weh, M. Tektonische Entwicklung der Penninischen Sediment-Decken in Graubünden (Prättigau bis Oberhalbstein); Universitaet Basel: Basel, Switzerland, 1998. [Google Scholar]
  16. Klingelé, E.; Olivier, R. Schwerekarte der Schweiz (Bouguer-Anomalien). Carte Gravimetrique de la Suisse (Anomalies de Bouguer). (Karte 4 der Geophysikalischen Landeskarten 1:500,000); Bundesamt für Landestopografie Swisstopo: Wabern/Bern, Switzerland, 1979. [Google Scholar]
  17. Pfiffner, O. Geology of the Alps; John Wiley & Sons, Ltd.: Chichester, UK, 2014. [Google Scholar]
  18. Stutenbecker, L.; Delunel, R.; Schlunegger, F.; Silva, T.A.; Šegvić, B.; Girardclos, S.; Bakker, M.; Costa, A.; Lane, S.N.; Loizeau, J.-L.; et al. Reduced sediment supply in a fast eroding landscape? A multi-proxy sediment budget of the upper Rhône basin, Central Alps. Sediment. Geol. 2018, 375, 105–119. [Google Scholar] [CrossRef] [Green Version]
  19. Delunel, R.; Schlunegger, F.; Valla, P.G.; Dixon, J.; Glotzbach, C.; Hippe, K.; Kober, F.; Molliex, S.; Norton, K.P.; Salcher, B.; et al. Late-Pleistocene catchment-wide denudation patterns across the European Alps. Earth Sci. Rev. 2020, 211, 103407. [Google Scholar] [CrossRef]
  20. Kühni, A.; Pfiffner, O. The relief of the Swiss Alps and adjacent areas and its relation to lithology and structure: Topographic analysis from a 250-m DEM. Geomorphology 2001, 41, 285–307. [Google Scholar] [CrossRef]
  21. Vernon, A.; van der Beek, P.A.; Sinclair, H.D.; Rahn, M.K. Increase in late Neogene denudation of the European Alps confirmed by analysis of a fission-track thermochronology database. Earth Planet. Sci. Lett. 2008, 270, 316–329. [Google Scholar] [CrossRef] [Green Version]
  22. Glaus, G.; Delunel, R.; Stutenbecker, L.; Akçar, N.; Christl, M.; Schlunegger, F. Differential erosion and sediment fluxes in the Landquart basin and possible relationships to lithology and tectonic controls. Swiss J. Geosci. 2019, 112, 453–473. [Google Scholar] [CrossRef]
  23. Weh, M.; Froitzheim, N. Penninic cover nappes in the Prattigau half-window (Eastern Switzerland): Structure and tectonic evolution. Eclogae Geol. Helv. 2001, 94, 237–252. [Google Scholar] [CrossRef]
  24. Trümpy, R. Penninic-Austroalpine boundary in the Swiss Alps: A presumed former continental margin and its problems. Am. J. Sci. 1975, 275, 209–238. [Google Scholar]
  25. Ring, U.; Ratschbacher, L.; Frisch, W.; DÜrr, S.; Borchert, S. The internal structure of the Arosa Zone (Swiss-Austrian Alps). Geol. Rundsch. 1990, 79, 725–739. [Google Scholar] [CrossRef]
  26. Ferreiro Mählmann, R.; Giger, M. The Arosa zone in Eastern Switzerland: Oceanic, sedimentary burial, accretional and orogenic very low- to low grade patterns in a tectono-metamorphic mélange. Swiss J. Geosci. 2012, 105, 203–233. [Google Scholar] [CrossRef] [Green Version]
  27. Mohn, G.; Manatschal, G.; Masini, E.; Müntener, O. Rift-related inheritance in orogens: A case study from the Austroalpine nappes in Central Alps (SE-Switzerland and N-Italy). Int. J. Earth Sci. 2011, 100, 937–961. [Google Scholar] [CrossRef]
  28. Wagner, G.; Reimer, G.M. Fission track tectonics: The tectonic interpretation of fission track apatite ages. Earth Planet. Sci. Lett. 1972, 14, 263–268. [Google Scholar] [CrossRef]
  29. Fox, M.; Herman, F.; Willett, S.D.; Schmid, S.M. The Exhumation history of the European Alps inferred from linear inversion of thermochronometric data. Am. J. Sci. 2016, 316, 505–541. [Google Scholar] [CrossRef]
  30. Kissling, E. Deep structure of the Alps—What do we really know? Phys. Earth Planet. Inter. 1993, 79, 87–112. [Google Scholar] [CrossRef]
  31. Schlunegger, F.; Kissling, E. Slab rollback orogeny in the Alps and evolution of the Swiss Molasse basin. Nat. Commun. 2015, 6, 8605. [Google Scholar] [CrossRef] [PubMed] [Green Version]
  32. Kissling, E.; Schlunegger, F. Rollback Orogeny Model for the Evolution of the Swiss Alps. Tectonics 2018, 37, 1097–1115. [Google Scholar] [CrossRef]
  33. Salcher, B.C.; Kober, F.; Kissling, E.; Willett, S.D. Glacial impact on short-wavelength topography and long-lasting effects on the denudation of a deglaciated mountain range. Glob. Planet. Chang. 2014, 115, 59–70. [Google Scholar] [CrossRef]
  34. Ivy-Ochs, S.; Kerschner, H.; Reuther, A.; Preusser, F.; Heine, K.; Maisch, M.; Kubik, P.W.; Schlüchter, C. Chronology of the last glacial cycle in the European Alps. J. Quat. Sci. 2008, 23, 559–573. [Google Scholar] [CrossRef]
  35. Bini, A.; Buoncristiani, J.; Couterrand, S.; Ellwanger, D.; Felber, M.; Florineth, D.; Graf, H.; Keller, O.; Kelly, M.; Schluchter, C.; et al. Die Schweiz Während des Letzteiszeitlichen Maximums (LGM); Bundesamt für Landestopografie Swisstopo: Wabern/Bern, Switzerland, 2009. [Google Scholar]
  36. Ahnert, F. Functional relationships between denudation, relief, and uplift in large, mid-latitude drainage basins. Am. J. Sci. 1970, 268, 243–263. [Google Scholar] [CrossRef]
  37. Tucker, G.E.; Slingerland, R. Drainage basin responses to climate change. Water Resour. Res. 1997, 33, 2031–2047. [Google Scholar] [CrossRef]
  38. Whipple, K.X.; Tucker, G.E. Dynamics of the stream-power river incision model: Implications for height limits of mountain ranges, landscape response timescales, and research needs. J. Geophys. Res. Solid Earth 1999, 104, 17661–17674. [Google Scholar] [CrossRef]
  39. Radaideh, O.M.A.; Mosar, J. Tectonics controls on fluvial landscapes and drainage development in the westernmost part of Switzerland: Insights from DEM-derived geomorphic indices. Tectonophysics 2019, 768, 228179. [Google Scholar] [CrossRef] [Green Version]
  40. Korup, O.; Montgomery, D.R. Tibetan plateau river incision inhibited by glacial stabilization of the Tsangpo gorge. Nature 2008, 455, 786–789. [Google Scholar] [CrossRef] [PubMed]
  41. Schlunegger, F.; Norton, K.P.; Zeilinger, G. Climatic Forcing on Channel Profiles in the Eastern Cordillera of the Coroico Region, Bolivia. J. Geol. 2011, 119, 97–107. [Google Scholar] [CrossRef] [Green Version]
  42. Walsh, L.S.; Martin, A.J.; Ojha, T.P.; Fedenczuk, T. Correlations of fluvial knickzones with landslide dams, lithologic contacts, and faults in the southwestern Annapurna Range, central Nepalese Himalaya. J. Geophys. Res. Earth Surf. 2012, 117, F01012. [Google Scholar] [CrossRef]
  43. Flint, J.J. Stream gradient as a function of order, magnitude, and discharge. Water Resour. Res. 1974, 10, 969–973. [Google Scholar] [CrossRef]
  44. Schwanghart, W.; Kuhn, N.J. TopoToolbox: A set of Matlab functions for topographic analysis. Environ. Model. Softw. 2010, 25, 770–781. [Google Scholar] [CrossRef]
  45. Wobus, C.; Whipple, K.X.; Kirby, E.; Snyder, N.; Johnson, J.; Spyropolou, K.; Crosby, B.; Sheehan, D. Tectonics from topography: Procedures, promise, and pitfalls. In Tectonics, Climate, and Landscape Evolution; Geological Society of America: Boulder, CO, USA, 2006. [Google Scholar]
  46. Stutenbecker, L.; Costa, A.; Schlunegger, F. Lithological control on the landscape form of the upper Rhône Basin, Central Swiss Alps. Earth Surf. Dyn. 2016, 4, 253–272. [Google Scholar] [CrossRef] [Green Version]
  47. Strahler, A.N. Hypsometric (Area-Altitude) Analysis of Erosional Topography. Geol. Soc. Am. Bull. 1952, 63, 1117–1142. [Google Scholar] [CrossRef]
  48. Brozovic, N.; Burbank, D.W.; Meigs, A.J. Climatic Limits on Landscape Development in the Northwestern Himalaya. Science 1997, 276, 571–574. [Google Scholar] [CrossRef] [Green Version]
  49. Hurtrez, J.-E.; Sol, C.; Lucazeau, F. Effect of drainage area on hypsometry from an analysis of small-scale drainage basins in the Siwalik Hills (Central Nepal). Earth Surf. Process. Landforms 1999, 24, 799–808. [Google Scholar] [CrossRef]
  50. Brocklehurst, S.H.; Whipple, K.X. Hypsometry of glaciated landscapes. Earth Surf. Process. Landf. J. Br. Geomorphol. Res. Group 2004, 29, 907–926. [Google Scholar] [CrossRef]
  51. Woodward, D. Method to predict cropland ephemeral gully erosion. Catena 1999, 37, 393–399. [Google Scholar] [CrossRef]
  52. Ouimet, W.B.; Whipple, K.X.; Granger, D.E. Beyond threshold hillslopes: Channel adjustment to base-level fall in tectonically active mountain ranges. Geology 2009, 37, 579–582. [Google Scholar] [CrossRef]
  53. Strahler, A.N. Quantitative Slope Analysis. Geol. Soc. Am. Bull. 1956, 67, 571–596. [Google Scholar] [CrossRef]
  54. Strahler, A.N. Equilibrium theory of erosional slopes approached by frequency distribution analysis; Part II. Am. J. Sci. 1950, 248, 800–814. [Google Scholar] [CrossRef]
  55. Burbank, D.W.; Leland, J.; Fielding, E.; Anderson, R.S.; Brozovic, N.; Reid, M.R.; Duncan, C. Bedrock incision, rock uplift and threshold hillslopes in the northwestern Himalayas. Nature 1996, 379, 505–510. [Google Scholar] [CrossRef]
  56. Owens, P.; Blake, W.; Gaspar, L.; Gateuille, D.; Koiter, A.J.; Lobb, D.A.; Petticrew, E.L.; Reiffarth, D.G.; Smith, H.G.; Woodward, J.C. Fingerprinting and tracing the sources of soils and sediments: Earth and ocean science, geoarchaeological, forensic, and human health applications. Earth Sci. Rev. 2016, 162, 1–23. [Google Scholar] [CrossRef] [Green Version]
  57. Hinderer, M.; Kastowski, M.; Kamelger, A.; Bartolini, C.; Schlunegger, F. River loads and modern denudation of the Alps—A review. Earth Sci. Rev. 2013, 118, 11–44. [Google Scholar] [CrossRef]
  58. Aitchison, J. Principal component analysis of compositional data. Biometrika 1983, 70, 57–65. [Google Scholar] [CrossRef]
  59. Vermeesch, P.; Garzanti, E. Making geological sense of ‘Big Data’ in sedimentary provenance analysis. Chem. Geol. 2015, 409, 20–27. [Google Scholar] [CrossRef]
  60. Lizaga, I.; Latorre, B.; Gaspar, L.; Navas, A. FingerPro: An R Package for Tracking the Provenance of Sediment. Water Resour. Manag. 2020, 34, 3879–3894. [Google Scholar] [CrossRef]
  61. Collins, A.; Walling, D. Selecting fingerprint properties for discriminating potential suspended sediment sources in river basins. J. Hydrol. 2002, 261, 218–244. [Google Scholar] [CrossRef]
  62. Von Blanckenburg, F. The control mechanisms of erosion and weathering at basin scale from cosmogenic nuclides in river sediment. Earth Planet. Sci. Lett. 2005, 237, 462–479. [Google Scholar] [CrossRef]
  63. Akçar, N.; Ivy-Ochs, S.; Alfimov, V.; Schlunegger, F.; Claude, A.; Reber, R.; Christl, M.; Vockenhuber, C.; Dehnert, A.; Rahn, M.; et al. Isochron-burial dating of glaciofluvial deposits: First results from the Swiss Alps. Earth Surf. Process. Landf. 2017, 42, 2414–2425. [Google Scholar] [CrossRef]
  64. Christl, M.; Vockenhuber, C.; Kubik, P.; Wacker, L.; Lachner, J.; Alfimov, V.; Synal, H.-A. The ETH Zurich AMS facilities: Performance parameters and reference materials. Nucl. Instrum. Methods Phys. Res. Sect. B Beam Interact. Mater. At. 2013, 294, 29–38. [Google Scholar] [CrossRef]
  65. Kubik, P.W.; Christl, M. 10Be and 26Al measurements at the Zurich 6MV Tandem AMS facility. Nucl. Instrum. Methods Phys. Res. Sect. B Beam Interact. Mater. At. 2010, 268, 880–883. [Google Scholar] [CrossRef]
  66. Korschinek, G.; Bergmaier, A.; Faestermann, T.; Gerstmann, U.C.; Knie, K.; Rugel, G.; Wallner, A.; Dillmann, I.; Dollinger, G.; von Gostomski, C.L.; et al. A new value for the half-life of 10Be by Heavy-Ion Elastic Recoil Detection and liquid scintillation counting. Nucl. Instrum. Methods Phys. Res. Sect. B Beam Interact. Mater. At. 2010, 268, 187–191. [Google Scholar] [CrossRef]
  67. Chmeleff, J.; von Blanckenburg, F.; Kossert, K.; Jakob, D. Determination of the 10Be half-life by multicollector ICP-MS and liquid scintillation counting. Nucl. Instrum. Methods Phys. Res. Sect. B Beam Interact. Mater. At. 2010, 268, 192–199. [Google Scholar] [CrossRef] [Green Version]
  68. Mudd, S.M.; Harel, M.-A.; Hurst, M.D.; Grieve, S.W.D.; Marrero, S.M. The CAIRN method: Automated, reproducible calculation of catchment-averaged denudation rates from cosmogenic nuclide concentrations. Earth Surf. Dyn. 2016, 4, 655–674. [Google Scholar] [CrossRef] [Green Version]
  69. Norton, K.P.; Abbühl, L.M.; Schlunegger, F. Glacial conditioning as an erosional driving force in the Central Alps. Geology 2010, 38, 655–658. [Google Scholar] [CrossRef]
  70. Cruz Nunes, F.; Delunel, R.; Schlunegger, F.; Akçar, N.; Kubik, P.W. Bedrock bedding, landsliding and erosional budgets in the Central European Alps. Terra Nova 2015, 27, 370–378. [Google Scholar] [CrossRef]
  71. Wittmann, H.; von Blanckenburg, F.; Kruesmann, T.; Norton, K.P.; Kubik, P.W. Relation between rock uplift and denudation from cosmogenic nuclides in river sediment in the Central Alps of Switzerland. J. Geophys. Res. Earth Surf. 2007, 112, F04010. [Google Scholar] [CrossRef] [Green Version]
  72. Chittenden, H.; Delunel, R.; Schlunegger, F.; Akçar, N.; Kubik, P. The influence of bedrock orientation on the landscape evolution, surface morphology and denudation (10 Be) at the Niesen, Switzerland. Earth Surf. Process. Landf. 2014, 39, 1153–1166. [Google Scholar] [CrossRef] [Green Version]
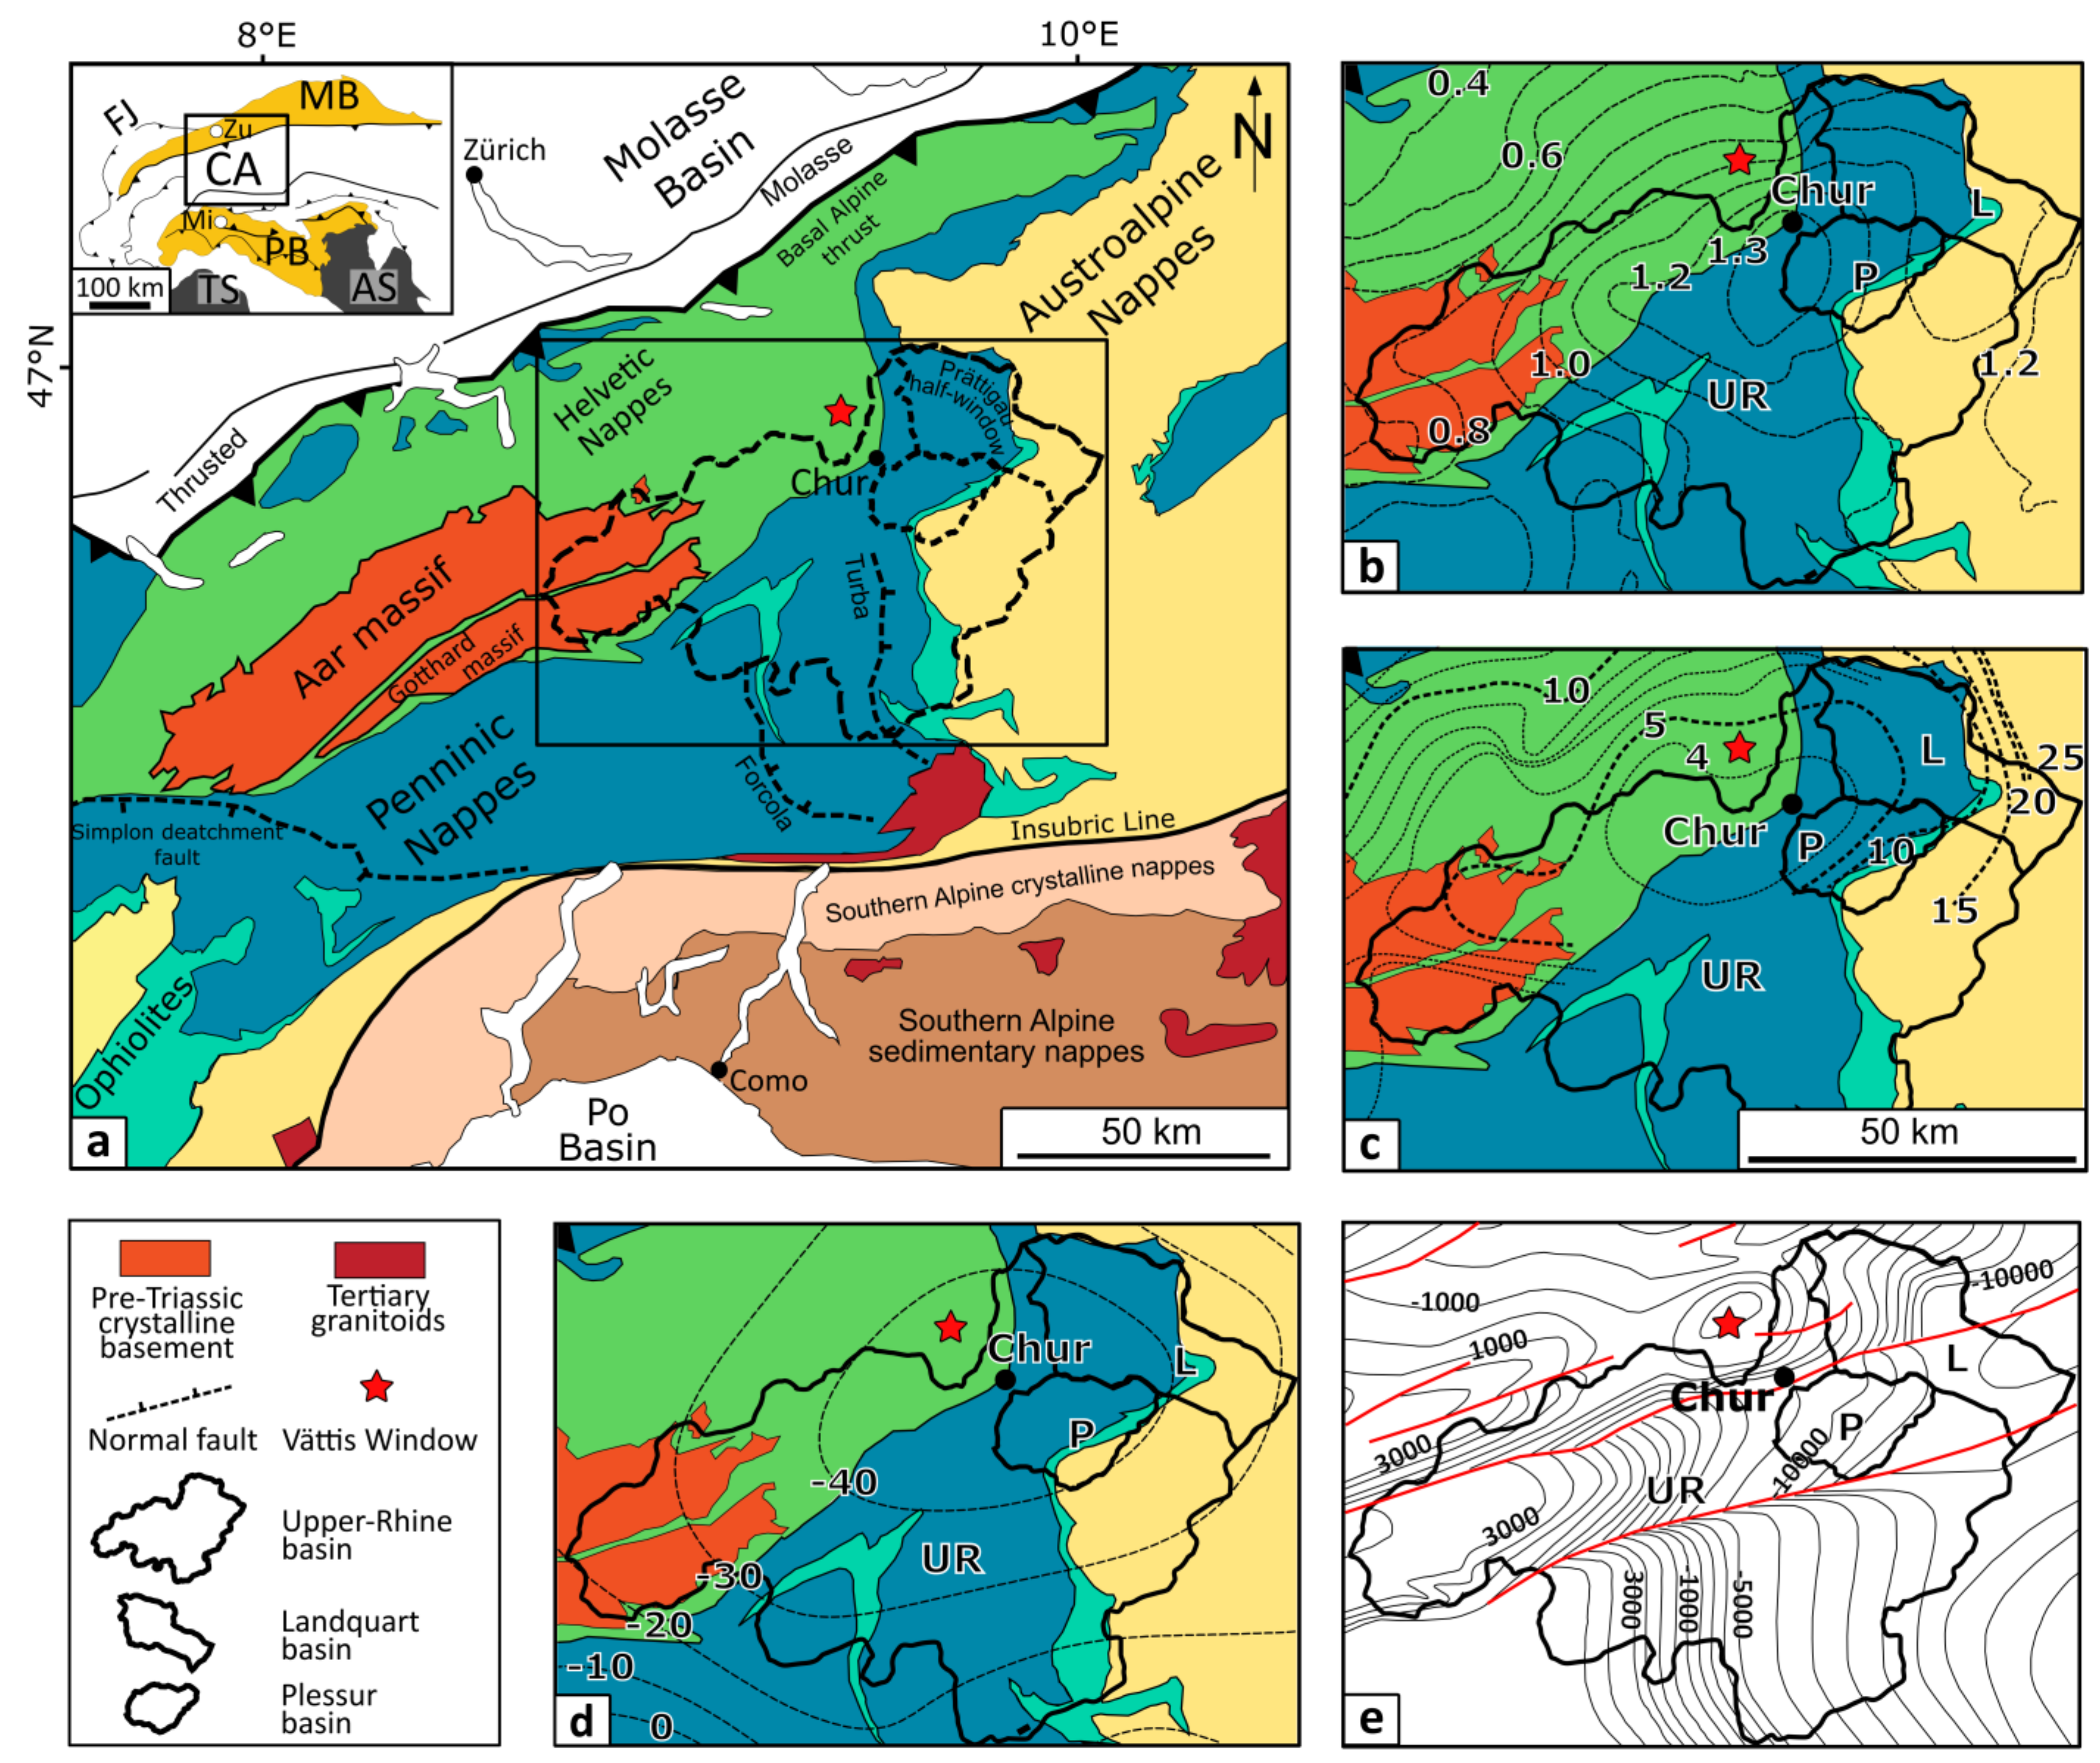
Figure 1. (a) Geological and tectonic framework of the Alps and the studied drainage basins (modified after [12]). FJ: Folded Jura, MB: Molasse Basin, CA: Central Alps, PB: Po Basin, TS: Tyrrhenian Sea, AS: Adriatic Sea, Zu: Zurich, Mi: Milan; (b) geodetic uplift rate in mm a−1 [13,14]; (c) apatite fission track pattern in Ma [15]; (d) isostatic anomaly in mGal [16]; (e) top crystalline basement in m [17].
Geosciences 11 00339 g001
Figure 2. (a) Lithotectonic framework of the Plessur drainage basin and its main tributaries, and locations of collected samples. IHC: Infrahelvetic Complex; BS: Bündnerschist; NPF: North Penninic Flysch; FN: Falknis Nappe; AZ: Arosa zone; TRN: Tschirpen and Rothorn Nappes; LN: Languard Nappe; SN: Silvretta Nappe; Q: Quaternary deposits; (b) Location of samples used in this study but collected outside of the Plessur Basin. Samples RHE01 and RHE02 were collected in the Rhine River and are part of this work’s dataset, whereas sample Lan-1 was collected at the outlet of the Landquart River and is part of the work by [22]. Green dots indicate sites where samples have been processed for provenance tracing purposes only, whereas yellow dots represent sites where the samples have been analyzed for both provenance and concentrations of 10Be. Refer to Figure 1 for the explanation of colors. The numbers at the border of the figure indicate the Swiss coordinates in meters.
Geosciences 11 00339 g002
Figure 3. Map of the ice thickness in the Plessur basin during the LGM (from [35]) and main geomorphologic features. The contour lines of the ice thickness map display the elevations of the ice surface in meters above sea level. The map also shows the highest peaks in the study area. The transects from AA’ to FF’ (from up- to downriver) displays an ongoing transformation of an originally U-shaped valley to a V-shaped valley, reflecting the response to more prominent fluvial incision in the lowermost part of the Plessur basin. The numbers at the border of the figure indicate the Swiss coordinates in meters.
Geosciences 11 00339 g003
Figure 4. Picture of a U-shaped valley and an associate hanging valley in the Welschtobelbach sub-catchment, nearby the PLE09 site (Figure 2 and Figure 3).
Geosciences 11 00339 g004
Figure 5. Longitudinal stream profiles of the Plessur River and main tributaries and respective normalized steepness index plots. Knickzones (KZ) are identified in the stream profiles. The KZ horizontal and vertical relative propagation are indicated as percentages, respectively. Refer to Table 1 for the dataset.
Geosciences 11 00339 g005
Figure 6. Map of normalized steepness indices (ksn) displayed in a simplified lithotectonic framework for the Plessur Basin. The knickzones are identified in the map and in the stream profiles (see also Figure 5).
Geosciences 11 00339 g006
Figure 7. Comparison between the hypsographic curves of the Plessur Basin and its main tributaries. The resulting hypsometric integral (HI) is shown in the legend between parentheses.
Geosciences 11 00339 g007
Figure 8. Slope distribution of the Plessur, Landquart, and Upper Rhine basin. The slope histograms of each basin display the slope averages in degrees (°), the associated uncertainties, and the cumulative sums in percentage (%). The numbers at the border of the figure indicate the Swiss coordinates in meters.
Geosciences 11 00339 g008
Figure 9. (a) Identification of fluvial patterns (FP) and glacial pattern (GP) in a digital elevation model of the Plessur Basin. The dashed line marks the division between lithologies with high and low erodibilities, and it separates the downstream sector I of the basin, which is dominated by fluvial processes and highly dissected, from the upstream sector II, which preserves glacial patterns, displayed by a smoother landscape. (b) Details of the Sagabach drainage area displaying the contrasts between the rougher fluvially controlled landscape (FP) and the topography that has still preserved features related to glacial erosion (GP). (c) Details of the Rabiusa drainage area showing landscape patterns indicative for fluvial erosion (FP) and associated hillslope erosion. The numbers at the border of the figure indicate the Swiss coordinates in meters.
Geosciences 11 00339 g009
Figure 10. (a) Principal component analysis (PCA) of this work’s dataset. In this case, only the range test was applied due to the low number of samples. The sum of the two principal components (PC1 and PC2) was 93.3%. (b) Results of PCA using a combination of the dataset presented in this work and [22]. The figure displays the results that were achieved after running the three tests mentioned in the text and with the combination of oxides/elements as suggested by the results of the Wilk’s lambda test (MgO and Ni). The sum of PC1 and PC2 was 100%.
Geosciences 11 00339 g010
Figure 11. Sediment provenance considering three endmembers (Clastic sedimentary, Ophiolitic, and Dolomitic) and calculated for five in-stream samples (PLE02, PLE04, PLE05, PLE07, and PLE10). The results were obtained using the model run 2 of Table 4. The numbers at the border of the figure indicate the Swiss coordinates in meters.
Geosciences 11 00339 g011
Figure 12. A lithotectonic map of the Plessur Basin (refer to Figure 2 for legend) with main tributaries, denudation rates (DR) in mm a−1, and sediment flux (SF) in 103 m3 a−1. The numbers at the border of the figure indicate the Swiss coordinates in meters.
Geosciences 11 00339 g012
Figure 13. A simplified lithotectonic map of the Upper Rhine Basin including the Plessur and Landquart Basins, and their respective denudation rates (DR) in mm a−1, sediment flux (SF) in 103 m3 a−1, relative area (RA), and relative contribution (RC).
Geosciences 11 00339 g013
Table 1. Normalized steepness index of the Plessur River and main tributaries and their upriver propagation.
ksnUpstream/Downstream ksn Increase FactorKnickzone Elevation (m)Relative Knickzone (KZ) Distance Propagation (towards Upstream) (%)Relative Knickzone (KZ) Relief Propagation (Relative Vertical Propagation) (%)
PlessurUpstream (Up)1761.09653522
Downstream (Down)180
RabiusaUp172----
Down-
SagabachUp2131.611541423
Down347
SapünerbachUp1371.616134849
Down214
WelschtobelbachUp1261.018143124
Down128
Table 2. Content of oxides (%).
SampleLithologySiO2Al2O3Fe2O3(T)MnOMgOCaONa2OK2OTiO2P2O5
PLE01Sedimentary55.959.463.830.0742.4725.090.791.660.480.19
PLE02 49.548.654.480.0886.5427.810.711.490.5240.17
PLE03Sedimentary45.7910.184.350.1129.6726.510.652.060.5470.13
PLE04 45.2810.014.950.08810.226.240.731.710.640.16
PLE05 34.047.394.480.12221.4329.960.481.530.4680.1
PLE06Sedimentary46.715.743.870.09210.0131.120.740.930.60.18
PLE07 41.27.634.350.10113.6830.20.691.420.5870.14
PLE08Ophiolitic52.1713.527.820.19212.289.650.952.430.810.17
PLE09Dolomitic7.932.121.240.10335.0652.680.090.630.1080.04
PLE10 46.317.44.390.0876.8232.270.651.210.6210.22
Table 3. Content of trace elements (ppm).
SampleLithologySrZrBaCrNiYNbSc
PLE01Sedimentary647247197705019.57.47
PLE02 6142271821609018.48.17
PLE03Sedimentary316134224806014.78.47
PLE04 45721822918011015.69.38
PLE05 15212914428020011.66.26
PLE06Sedimentary53136112416010017.186
PLE07 387292158200150158.47
PLE08Ophiolitic12717931055045021.711.313
PLE09Dolomitic112517510103.11.21
PLE10 712103915315080289.17
Table 4. Comparison between two datasets used in the calculation of the relative contribution of the three selected endmembers. In-stream locations are displayed in Figure 2. The uncertainties of the relative contribution are given as standard deviation. Goodness of fit (GOF) expresses the quality of the model. varying from 0 to 100.
Model Run.In-Stream LocationGOFSedimentary Contribution (%)Ophiolitic Contribution (%)Dolomitic Contribution (%)
1 (all elements)PLE029372 ± 516 ± 312 ± 3
PLE049357 ± 529 ± 313 ± 2
PLE059510 ± 141 ± 149 ± 1
PLE079345 ± 528 ± 327 ± 2
PLE108284 ± 710 ± 45 ± 3
2 (MgO, Ni)PLE029983 ± 312 ± 15 ± 3
PLE049967 ± 317 ± 115 ± 3
PLE059913 ± 142 ± 145 ± 1
PLE079948 ± 228 ± 124 ± 2
PLE109983 ± 410 ± 26 ± 3
Table 5. Cosmogenic nuclide data.
SampleSample Weight (g)9Be Spike (mg)AMS Ratio (×10−12)Uncertainty in AMS (%)10Be Concentration (×10 4 atoms g−1)
PLE0237.030.1950.0449.91.53 ± 0.15
PLE0544.540.1880.1064.32.99 ± 0.12
PLE0649.550.1950.1475.43.86 ± 0.21
PLE1050.470.1920.0666.21.68 ± 0.10
RHE0150.170.1900.0707.11.78 ± 0.13
RHE0250.130.1980.0565.61.48 ± 0.08
Lan-124.440.1990.0215.90.95 ± 0.17
AMS ratio uncertainty is at the 1σ level. The weighted average 9Be/10Be full process blank ratio is (2.59 ± 0.45) × 10−15.
Table 6. 10Be derived denudation rates.
SampleTopographic Shielding aSnow Shielding bDenudation Rate (mm a−1) c
PLE020.960.890.77 ± 0.16
PLE050.960.880.44 ± 0.08
PLE060.960.880.34 ± 0.07
PLE100.960.900.68 ± 0.13
RHE010.950.890.70 ± 0.14
RHE020.960.890.81 ± 0.16
Lan-10.970.901.14 ± 0.30
a Topographic shielding factor calculated after [68]. b Snow shielding factor calculated after [19]. c Denudation rates calculated by the CAIRN routine [68].
Table 7. Sediment budget calculated according to 10Be derived denudation rates.
SampleArea (Km2)Relative Area (%)Denudation Rate (mm a−1)Sediment Flux (103 m3 a−1)Relative Contribution (%)
PLE02207.34.80.77 ± 0.16160.28 ± 33.824.59 ± 1.31
PLE05112.42.60.44 ± 0.0850.12 ± 9.471.43 ± 0.04
PLE0640.9< 10.34 ± 0.0714.03 ± 2.690.04 ± 0.01
PLE10265.46.10.68 ± 0.13181.16 ± 35.575.18 ± 1.43
RHE013270.975.80.70 ± 0.142297.26 ± 455.6565.74 ± 18.23
RHE024311.71000.81 ± 0.163494.07 ± 676.83100.00 ± 27.39
Lan-1 *616.114.31.14 ± 0.30703.93 ± 186.2320.15 ± 6.60
* Extracted from [22]. The sediment flux uncertainty was calculated in this study.
Publisher’s Note: MDPI stays neutral with regard to jurisdictional claims in published maps and institutional affiliations.