Article

Pilot Study Using ArcGIS Online to Enhance Students’ Learning Experience in Fieldwork

by
Sumet Phantuwongraj
1,
Piyaphong Chenrai
2 and
Thitiphan Assawincharoenkij
2,*
1
Morphology of Earth Surface and Advanced Geohazards in Southeast Asia Research Unit (MESA RU), Department of Geology, Faculty of Science, Chulalongkorn University, Bangkok 10330, Thailand
2
Applied Mineral and Petrology Special Task Force for Activating Research (AMP STAR), Department of Geology, Faculty of Science, Chulalongkorn University, Bangkok 10330, Thailand
*
Author to whom correspondence should be addressed.
Geosciences 2021, 11(9), 357; https://doi.org/10.3390/geosciences11090357
Submission received: 22 July 2021 / Revised: 22 August 2021 / Accepted: 23 August 2021 / Published: 24 August 2021
(This article belongs to the Special Issue Advances and Applications in Computational Geosciences)

Abstract

:
Applying ArcGIS Online application to geological fieldwork provides an alternative way to teach students. This brief report describes an educational innovation for geological fieldwork with the ArcGIS Online application to examine students’ learning experiences. In comparison to traditional classrooms, this teaching method enables students to more easily comprehend how geological structures and features connect through the mapping area. This observation indicates that students can think about the structure and deformation events as spatial continuity during acquisition data gathering in the field. Results from independent t-tests between treated and untreated student groups show that the average post-test scores of the treated students were significantly higher than pre-test scores, at a p = 0.05 level, after using ArcGIS Online in fieldwork designed in this study. Therefore, the ArcGIS Online application plays an important role in changing and developing the geological fieldwork in Thailand at the university scale for students. This teaching method could potentially benefit any science teaching and have applications in other disciplines requiring similar skills as well.

1. Introduction

Fieldwork is a necessary component of geoscience and geographical education and is typically a part of higher education curricula such as in universities and colleges [1,2,3,4,5]. Geoscience fieldwork is an interpretation-based field and requires students to observe and classify Earth’s materials including structural geology, tectonic setting, and lithology [6]. Field geological sites may sometimes be remote and difficult to access for many students. Thus, traditional fieldwork management usually divides students into groups or teams to increase their opportunities to access the field sites and participate in field-based learning activities. However, misinterpretation for making a geological map may occur among students between teams because each team may approach different geological sites or gain different experiences based on their different observations during their fieldwork.
Today, computer technology offers alternative teaching methods to traditional fieldwork. The portable and precise digital tools offer benefits in geological fieldwork such as precision location, rapid acquisition and recording of data sets, and real-time data visualization in the field [7,8]. Thus, fieldwork in geoscience and geographical education today needs to be transformed by utilizing technology and digital information. It is important for instructors to use cutting-edge technology to perform fieldwork in a form that is practical for students to enhance students’ learning experiences.
Recently, the number of geographical information systems (GIS) mobile applications has increased rapidly corresponding to the widespread of global navigation satellite system (GNSS)-equipped mobile devices such as smartphones and tablets [9]. This allows a smart device to become a potential tool for geomatic applications since modern smart devices are able to reach a very notable quality of positioning [10]. Additionally, geospatial information can be accessed by a web browser on desktop computers, tablets, and smartphones [11]. Furthermore, web mapping used for creating an online map is now also more attractive than previous versions of GIS with user-friendly interfaces that do not require expert knowledge of GIS to use [11]. Different examples of GIS in teaching and learning have been demonstrated in many studies [12,13,14]. GIS-based teaching methods are considered to help students in the development of spatial ability that improves their mapping skills [15,16,17].
Several advanced technologies have been developed to help teachers and instructors creating digital fieldwork for a practical and low-cost alternative to traditional fieldwork. ArcGIS Online is a geographic information system hosted on a cloud-based server with broad functionality. It opens many opportunities for scientific visualization in many areas of geoscience and geography and can be used as a teaching medium [18]. ArcGIS Online systems can run on handheld computing devices such as tablets and smartphones that have become almost commonplace in many universities around the world. ArcGIS Online in fieldwork is simple and accessible via internet hotspots with students’ smart devices. In addition, the ArcGIS system has been used as a digital tool in several fieldworks with positive responses from students, but it can sometimes be challenging to a beginner [8].
This study examines the students’ learning experience of the students using ArcGIS Online via smartphones and tablets. The development and design of a new method for teaching fieldwork described in this study targets smartphone enthusiasts because the students in colleges and universities are most likely using mobile devices for informal learning. Additionally, smartphone-based methods have gained interest among geoscience and geography instructors in many schools [8,19,20]. This study attempts to create a new method for teaching fieldwork using ArcGIS Online application on mobile devices. Thus, the challenge of this study in terms of geoscience education is to bring a new technology to geological fieldwork.

2. Materials and Methods

Traditional teaching methods in fieldwork including paper-based mapping, geochemical sampling, collecting geophysical data, and using remote sensing are commonly used in many Thai universities. Digital fieldwork is gaining popularity internationally across geoscience and geographical education, but there have been no case studies conducted in Thailand. In addition, this new method is useful for students to prepare digital mapping skills for future geoscience professions [21]. Additionally, a smartphone-based teaching method is ideally suitable at the university level, because students studying at universities are familiar with this type of teaching. Thus, this brief report describes the case study of using ArcGIS Online with an educational institution license in geological fieldwork to enhance students’ learning experience at Chulalongkorn University, Thailand, where geology students must enroll in a four-credit geological fieldwork course. The course comprises two parts: (1) field methods in theory and practice and (2) field mapping projects carried out in teams of three to four students.
Among the ArcGIS Online applications that can be used for digital fieldwork, ArcGIS Survey123 stands out as a field dedicated application for collecting, analyzing, and reporting data and can be used flexibly on a smart device (e.g., smartphone, computer, tablet), with or without a field internet connection [22,23]. Survey123 is a part of the Esri Geospatial Cloud and can integrate with Esri’s ArcGIS platform, making it is fully compatible with both ArcGIS Desktop and ArcGIS Online [9,24]. Survey123 is useful for collecting survey data in various types including text, number, picture, and location.

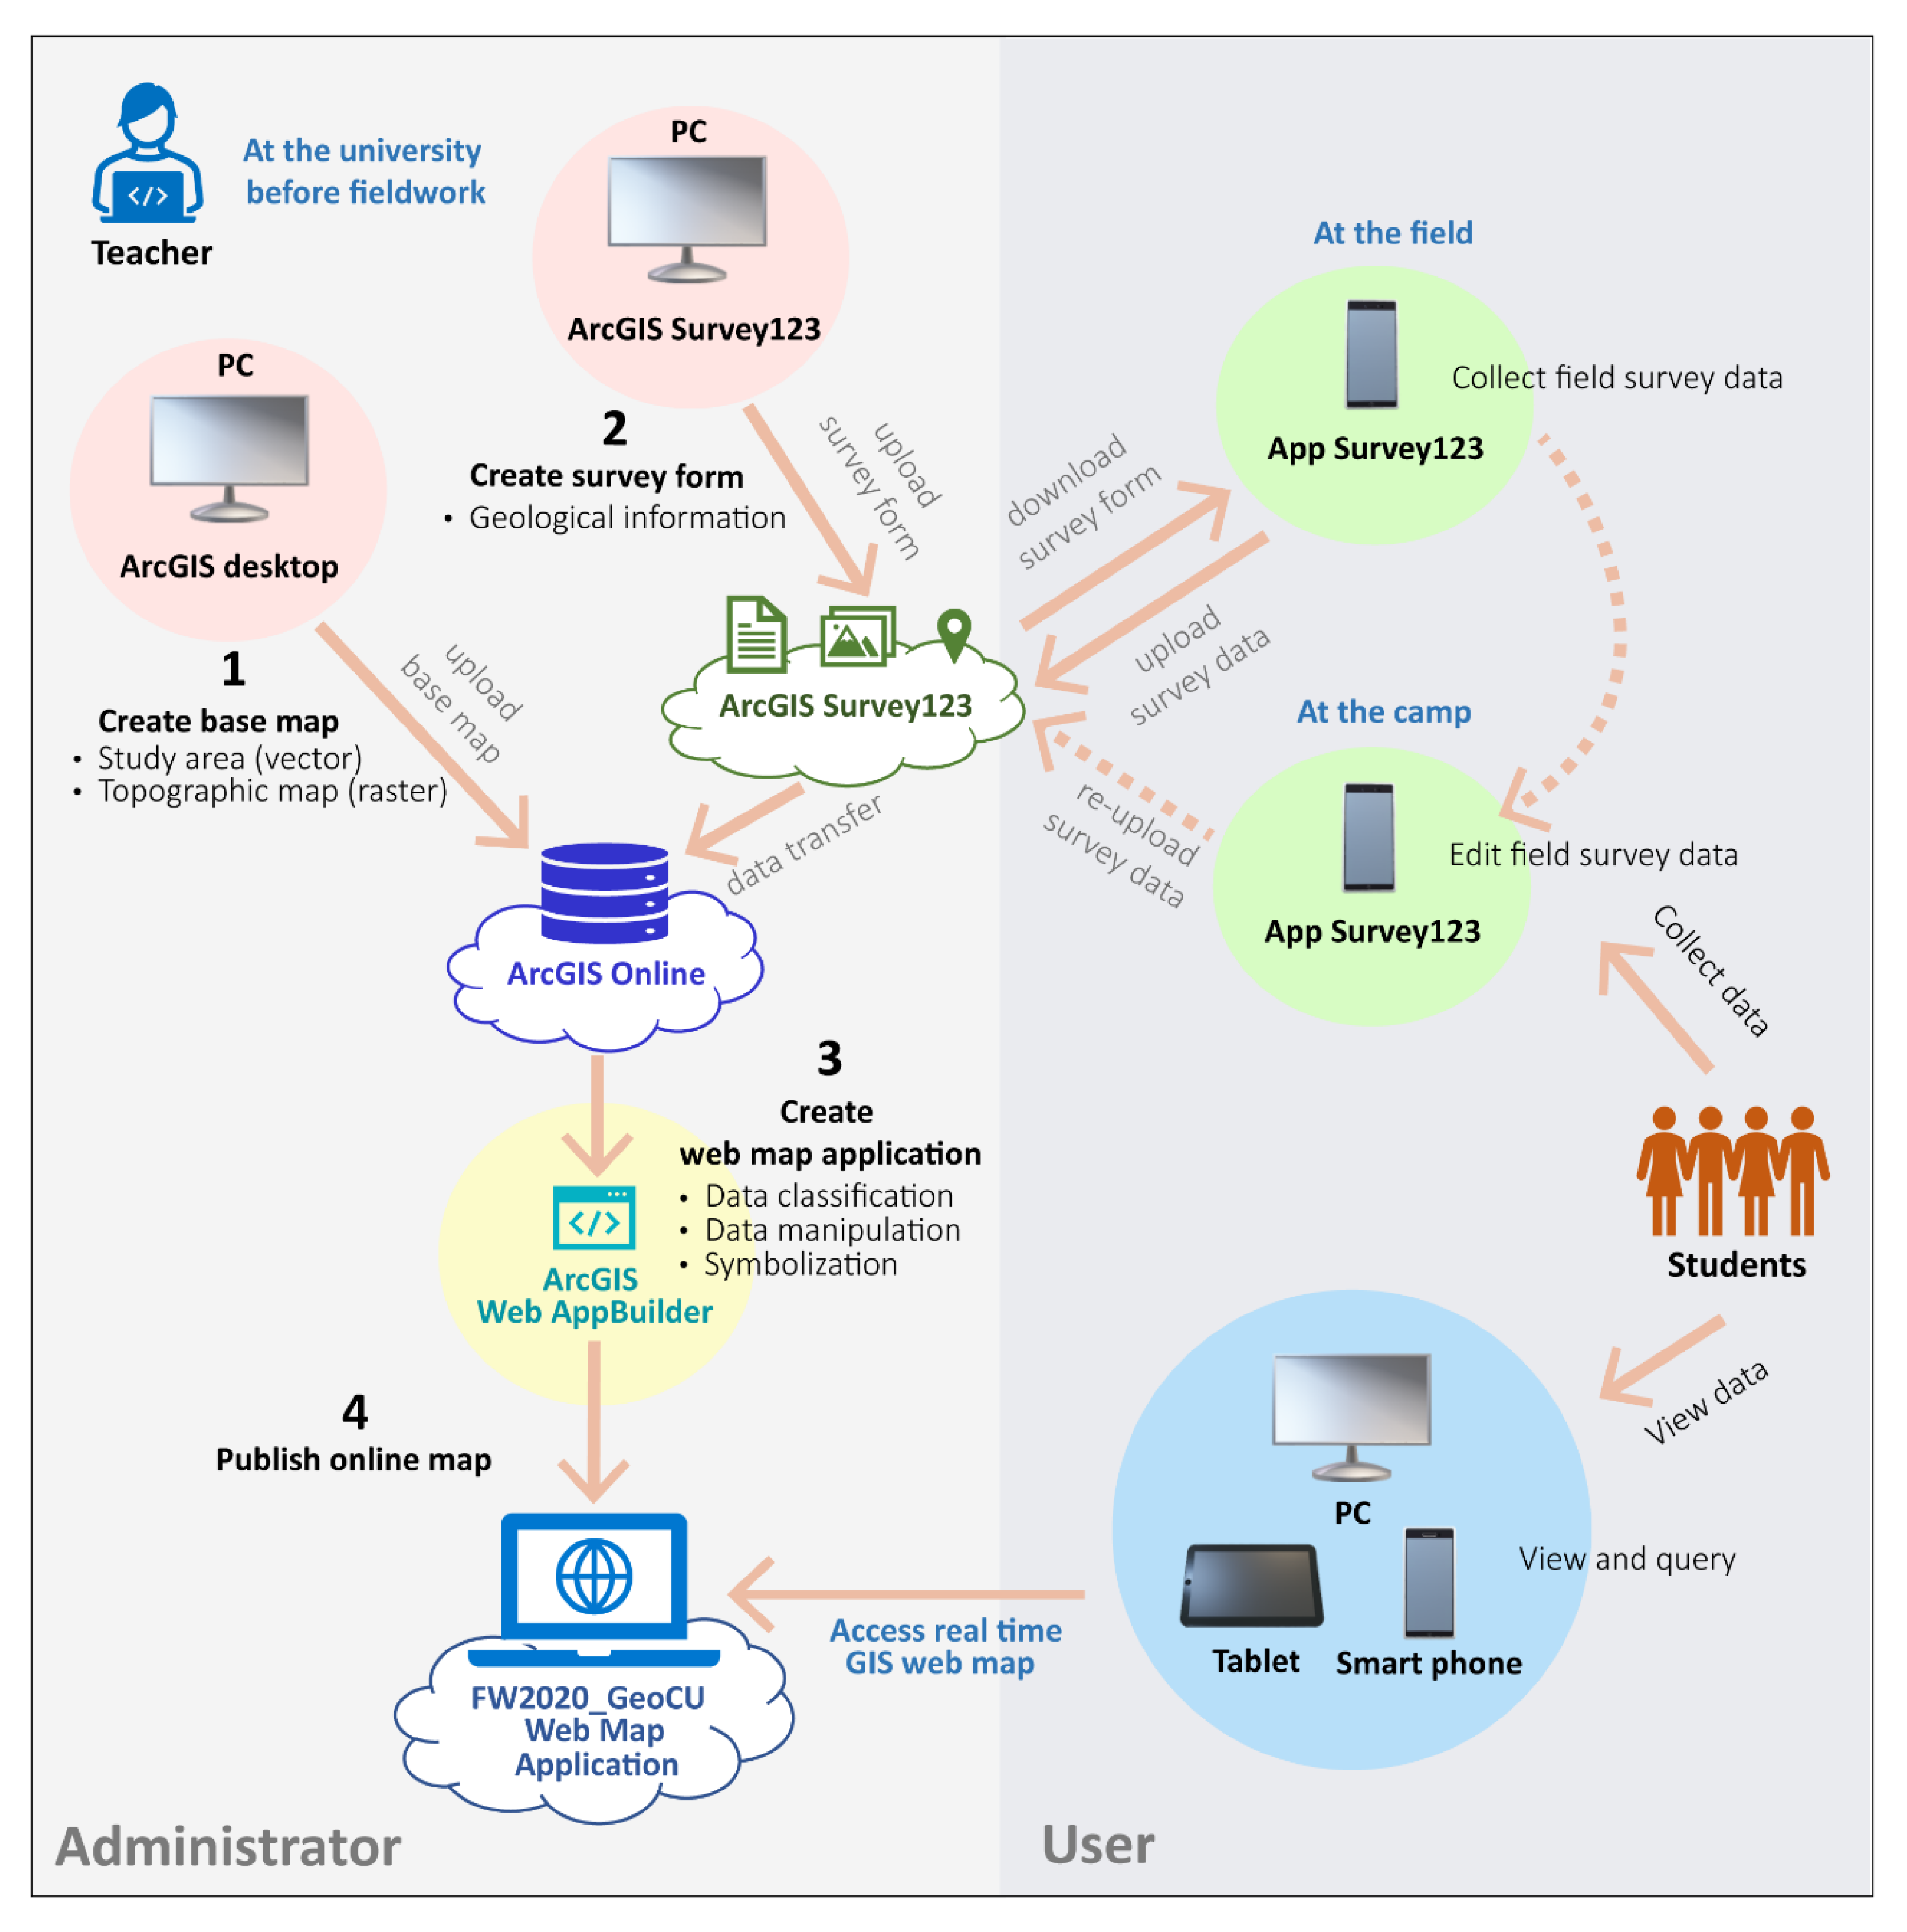
2.1. Development and Design

A two-week geological field mapping was designed to investigate the potential of the ArcGIS Online application in supporting innovative ways of teaching fieldwork. Students were assigned a different field mapping area for each team and asked to give a short discussion, summary, or progress of the mapping area including rock units, geological structures, and tectonics during the field. The development of the geological fieldwork teaching with the ArcGIS Online application included four steps: (1) creating a base map layer, (2) generating a survey form, (3) making a web map application, and (4) publishing an online map. The typical workflow diagram for this fieldwork teaching method is shown in Figure 1.
Firstly, a base map layer was prepared by the ArcGIS Desktop software. A topographic map is typically used as the base map layer for geological work. For this study, the topographic map from the Royal Thai Survey Department (RTSD) was used. The map with the field areas for students was applied and rectified within the ArcGIS Desktop software. Then, the base map layers were uploaded to ArcGIS Online for use as a reference map layer.
Secondly, the teacher created a survey form using ArcGIS Survey123 for geological outcrop descriptions before embarking upon the fieldwork. The survey form is based on necessary geological information to make a geological map and help students discuss with their classmates. For example, in this study, the necessary geological information consists of “area”, “day”, “station”, “exposure type”, “rock type”, “rock name”, “rock unit”, “strike”, “dip direction”, “dip angle”, “photo”, “location”, and “description”. Three types of data, including number, text, and photo, can be filled in the survey form and as attribute tables (Figure 2).
In the field, students were required to download the Survey123 application to their smartphones. Afterward, students could download the survey created on their smart devices and then fill out field information within the form even in the offline mode. Additionally, pictures taken in the field are automatically geotagged by the smart device if an internet connection is available, which makes it possible to include them in the ArcGIS system. Subsequently, all data entered into the survey form are then automatically transferred to the ArcGIS Online cloud and uploaded to a server. However, if there is no internet connection in the field, Survey123 offers the possibility of locating the geological sites by manually inserting the location from the topographic map.
Thirdly, a fieldwork web map application was created by using the ArcGIS Web AppBuilder that is included with the ArcGIS Online application. The fieldwork web map in this study was designed for easy use so that teachers and students could view and query data on the map by clicking on layer names. Survey data were classified by categories and properly manipulated to be represented on a 1:50,000 topographic map and ArcGIS Online base maps. Subsequently, in this study, six layers of point features, including area, rock type, day, rock name, rock unit, strike, and dip, were created from the survey information data. These layers were then symbolized by the unique value method based on the data in the attribute table of the survey form. To illustrate, the “rock name” layer, which was further classified as limestone, sandstone, conglomerate, mudstone, and andesite, was symbolized by an orange square, blue square, green square, purple square, and red square, respectively. In addition, the “strike” layer was symbolized by a strike and dip symbol, which rotated to follow the value of the azimuth angle in the “strike” field such as 340°. Apart from the symbolization, we then created the label for these layers by selecting the most related data from the attribute table of the survey form. For example, the “strike” layer was labeled with the value from the “dip angle” field such as 13° (Figure 3). Afterward, basic widgets such as the base map gallery, measurement, and filter were also added to the web map in case users want to customize the map.
Finally, the web map application was completed and ready to be published online with a uniform resource locator (URL) link. Additionally, anyone with the link could view and query the result data in real time. Thus, students could easily view and share their own data on ArcGIS Online with their classmates and teachers at the geological sites during and after the fieldwork for discussions (Figure 3 and Figure 4).
In addition, detailed survey information for each station can be shown in a pop-up window when the user clicks on a point feature on the map (Figure 4).

2.2. Study Population

The population consisted of third-year undergrad students in a gender-mixed classroom from the Department of Geology, Chulalongkorn University. A total of 30 students (11 males, 19 females) participated in fieldwork during the summer semester. They were equally separated into two groups including the treated and untreated groups. The 30 students participating in the study were divided into 8 gender-mixed teams for each mapping area. The treated group was designed to use the new method from this study, while the untreated group performed via a traditional paper-based method. The treated students had no previous experience with the ArcGIS Online application. They were given the opportunity to become familiar with the ArcGIS Online application at the university before conducting their fieldwork.

2.3. Data Collection and Evaluation

In order to evaluate the learning effectiveness of using the ArcGIS Online application in fieldwork, participating students in both groups were asked to do pre- and post-tests comprising 20 multiple choice questions, which was the same test before and after the fieldwork. The pre-test was conducted in order to seek out the initial scores, or capability, of the students before the fieldwork. The post-test was conducted at the end of the fieldwork to find out and compare the learning gains of the students in both groups. The multiple-choice questions were based on the course objectives and field mapping conceptions. The questions included geological block diagrams, map projections, interpretation of aerial photos and topographic maps, fossil and rock classification, arrangement of the rock layers, and geological structure interpretation from outcrop photos. In addition, the validity and difficulty level of the questions were carried out by the fieldwork committee. The statistical tools calculated from the pre- and post-test are basic statistics including average, standard deviation, and t-test. The hypothesis of this statistic was that the treated group had a significantly higher score than the untreated group. To evaluate the advantage of the ArcGIS Online application on the fieldwork, students’ experiences were observed during and after the fieldwork.

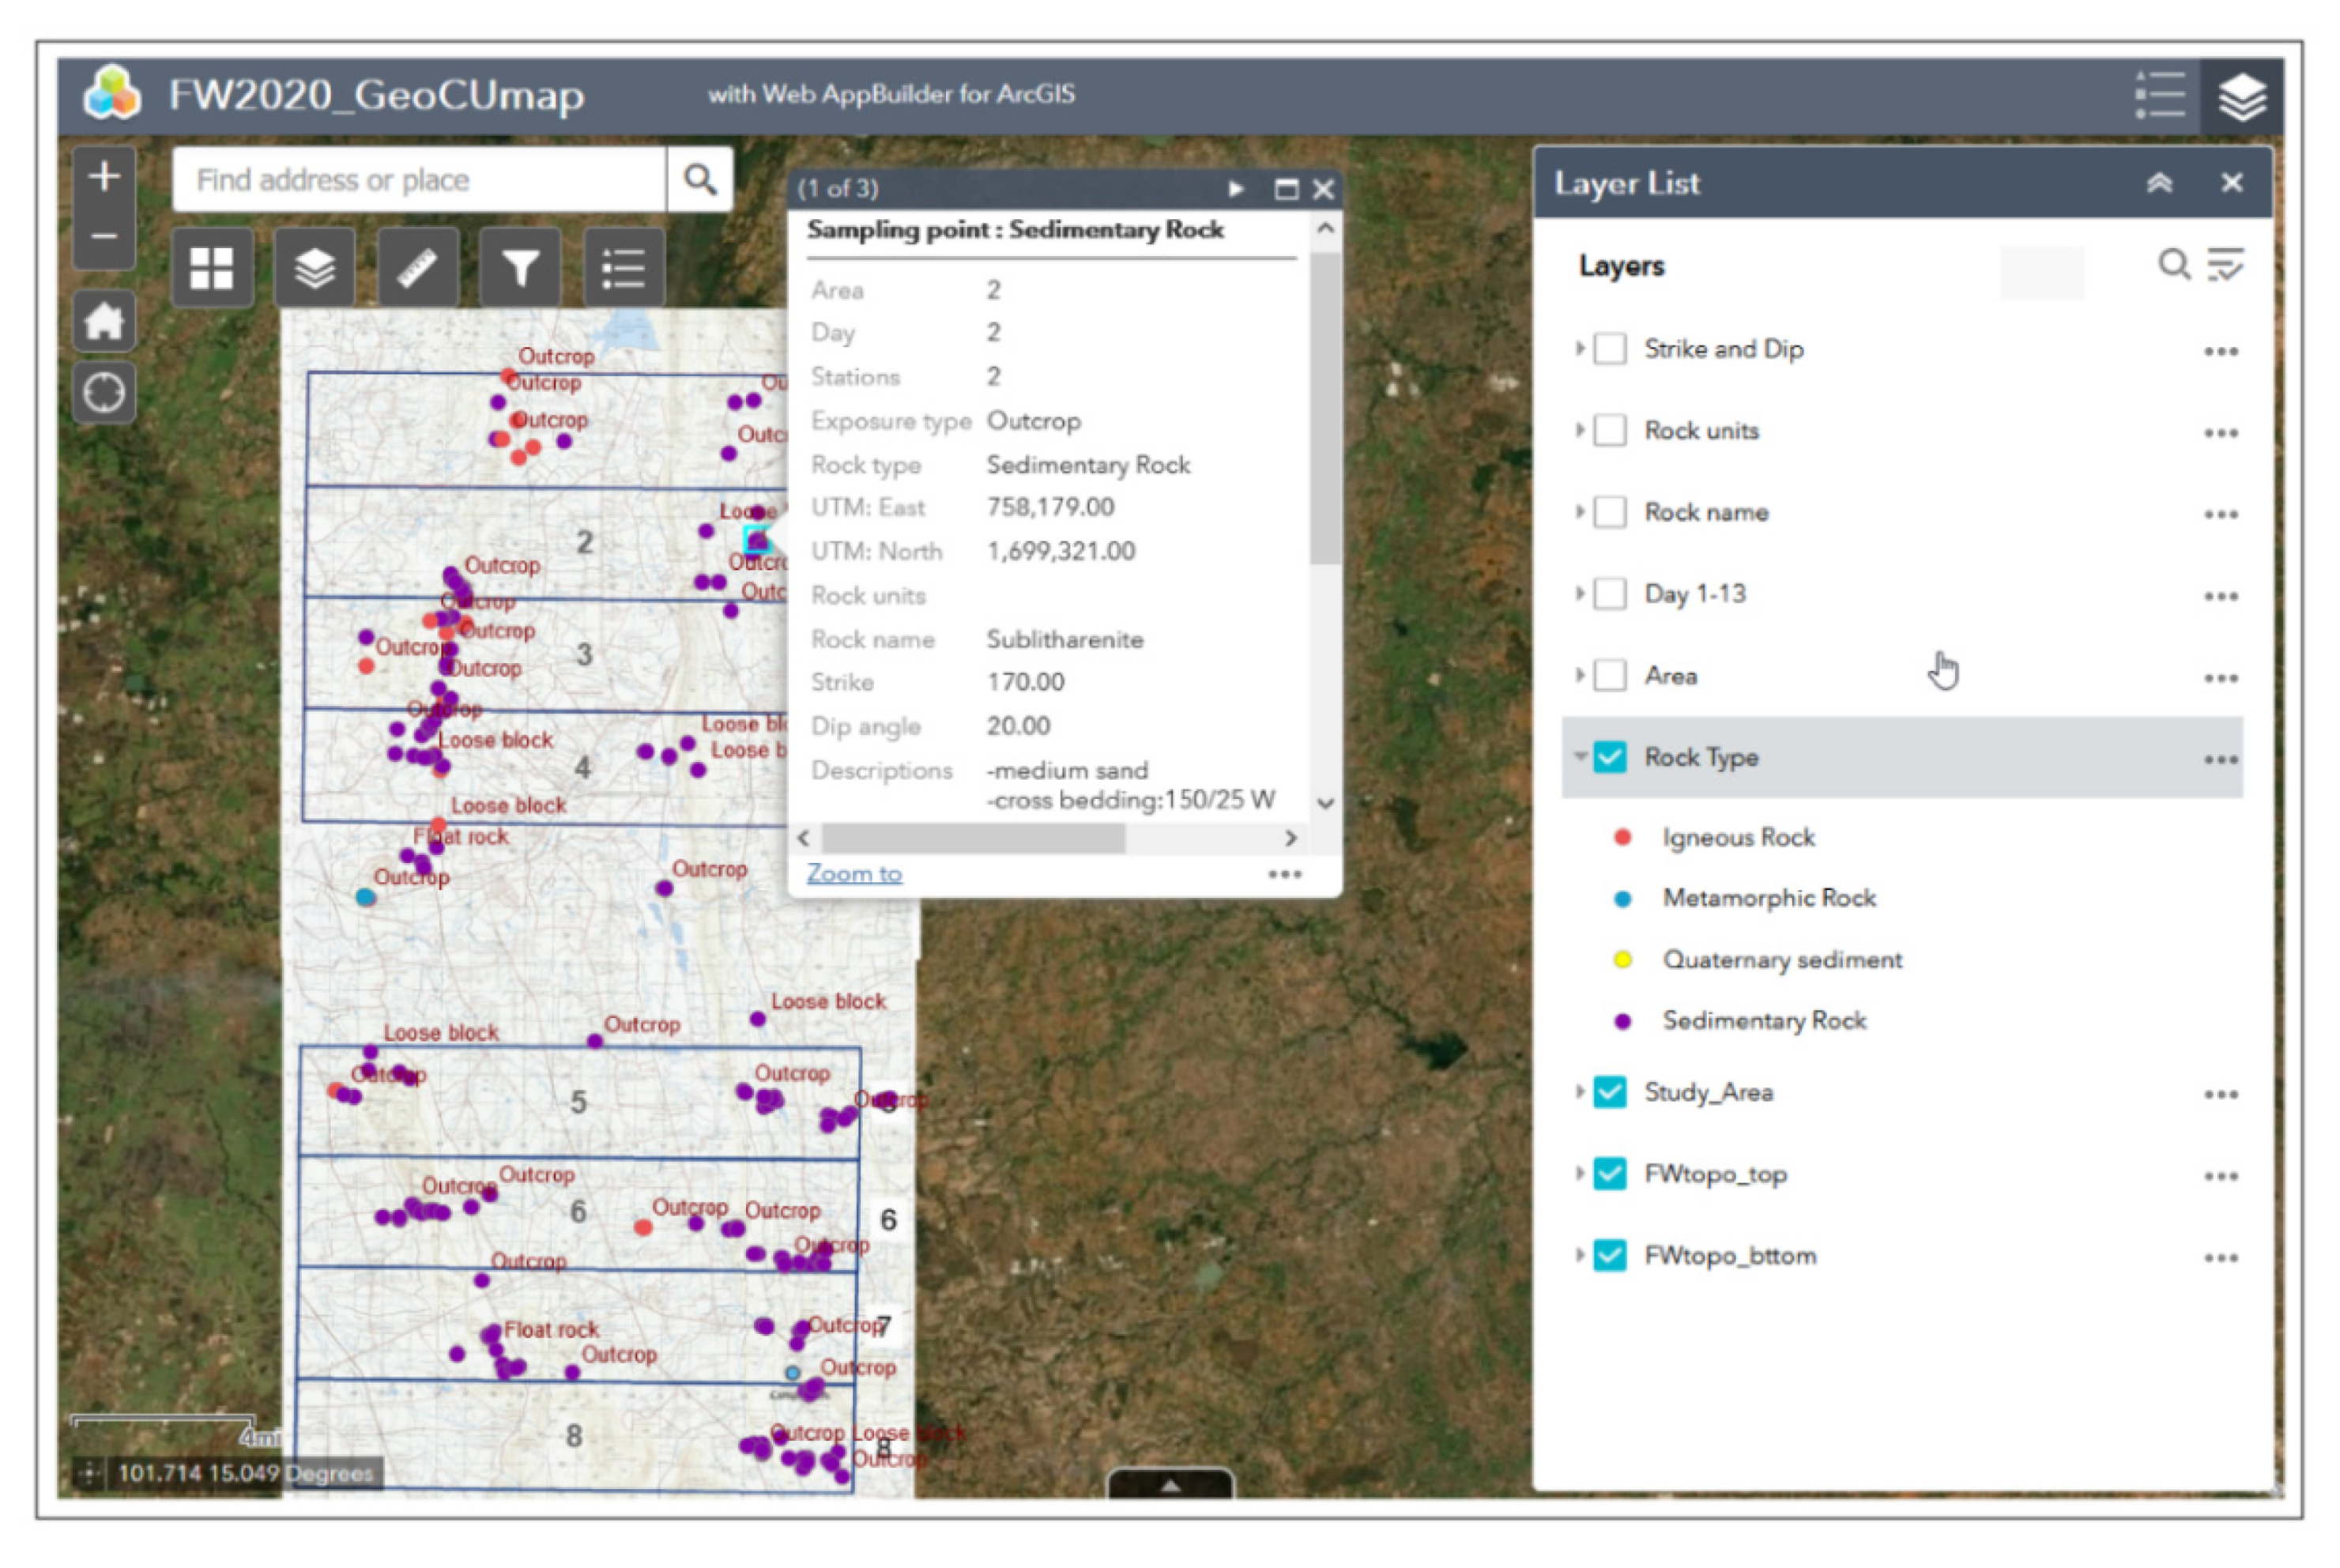
3. Findings and Discussion

The basic statistics from the pre- and post-test of fieldwork using ArcGIS Online from students in the treated and untreated groups are shown in Table 1 and Table 2. The average pre-test scores are nearly equal in both groups, representing that the students in both groups had similar basic knowledge in geological mapping and fieldwork. The average post-test score from the treated group was higher than the untreated group. This indicates that the new teaching method on fieldwork with the ArcGIS Online application can improve students’ learning effectiveness.
Examining the independent t-test scores, as shown in Table 2, reveals a significant difference between the pre- and post-test scores in the treated group (t(0.95,28) = 1.71). The average post-test score of the treated students was significantly higher than pre-test scores, at p = 0.05 level, after using ArcGIS Online in fieldwork designed from this study.
From fieldwork observations, the treated students seemed to be very concerned with the new teaching method in the fieldwork with the ArcGIS Online application. They appeared to be more interested in the acquisition and creation of field mapping with a digital tool or smart device. The students could check if they collect the data to coincide with other groups in real time. It seems that the treated students spent less time at the outcrops or geological sites, compared to the untreated students. Additionally, the treated students had a better interpretation of how geological structures connect through the study area, compared to the untreated students. This may be due to the fact that the students could see other group data in real time, after which they could dwell on the structure and deformation events as spatial continuity during acquisition data in the field. Thus, the ArcGIS Online application in fieldwork could enhance student learning about spatial thinking [25]. The geological mapping, interpretation, and discussion between students were usually performed after the students returned from the field and compiled the outcrop data with other groups. If the interpretation were incorrect, the students would have a problem connecting geological structure and boundary. Hence, they had to rethink and revisit the previous outcrop again the next day, and this problem usually occurred with the untreated students. The ArcGIS Online application and digital fieldwork helped to solve this problem. Moreover, the treated students also helped each other to solve and discuss problems during their acquisition in the fieldwork. The treated students seem to be influenced by the ability to record data faster and see real-time visualization.
Based on personal interviews, the treated students were positive with digital fieldwork using ArcGIS Online. The treated students felt that the benefit of a real-time visualization on their smart devices gave them time to plan and correct the necessary geological information more easily. They could also integrate observations from individual groups into the regional map during the acquisition and interpretation times. For example, the student from the treated group expressed on the note that the smart device was useful and convenient for data collection in the fieldwork and also reduced the time spent on the geological site. Another student response from the untreated group stated that the traditional method required more time to transfer field data from paper notes into digital format to create geological maps and reports. In addition, the benefit of cloud-based mobile applications used in this study was that the user-friendly interface of the web map and the survey form creating from ArcGIS online and Survey123 application were easy for teachers and students to use and operate with only basic GIS knowledge. This finding is similar to previous studies including [26] (pp. 201–205), [23] (p. 103), [24] (pp. 7–9), and [11] (pp. 12–13). Additionally, teachers could manage and observe the daily work progress of the student through the ArcGIS Online application.

4. Conclusions

This paper presents a convenient method for the development of innovative educational strategies in teaching fieldwork. In 2020, a pilot study was conducted in which student groups accomplished their 14-day field mapping project using the ArcGIS Online application on their smart devices. The students reported their experience through a geological map, report, and presentation at the end of the fieldwork. It can be summarized that the students were very enthusiastic about using digital tools in the field and strongly recommended that more such tools be implemented in fieldwork teaching. There was a consensus that this new fieldwork teaching method could reduce the cost of paper and writing utensils. Further implementations could extend this teaching method to a wider user including professional geoscientists and even the public. The new way of teaching in fieldwork using ArcGIS Online was successfully able to enhance students’ learning experience and learning effectiveness in this study and can be used in higher education at the university scale for students.

5. Limitations and Recommendations

5.1. Limitations and Requirements

The geological outcrop images for sharing with other classmates must be capable of showing representative geological structures or features. Some students may not know how to select the representative images and descriptions of the outcrops; therefore, it is useful for them to practice these skills before going into the field. The image file size of an outcrop or a rock sample directly influences the load time of data on the smartphone. An internet connection is important for sharing and sending data to the server. In addition, the teaching method proposed in this study requires teachers who are able to adapt and implement the innovations. Thus, computer and software skills may be limited in some teachers. The main disadvantages during digital note taking are poor battery life and software malfunction. In addition, an ArcGIS Online account is required to purchase a software license that could make it less accessible in some schools. Additionally, a comparable function may be accomplished by using open source or free license software; however, only well-trained GIS developers can operate it [23].

5.2. Further Applications

The digital tools using the ArcGIS Online application support students’ learning experience by recording and documenting field observations to improve the quality of fieldwork, geological mapping, and geological report. More studies targeting the development skill and proficiency of the impact of digital fieldwork in geoscience and geographical educations are needed as innovative educational strategies. Although the focus of this study was only on geological fieldwork, the choices of data input into this application could also benefit other disciplines that adopt similar learning methods.

Author Contributions

Conceptualization, S.P., P.C. and T.A.; methodology, S.P., P.C. and T.A.; software, S.P.; validation, S.P., P.C. and T.A.; formal analysis, S.P., P.C. and T.A.; investigation, S.P., P.C. and T.A.; resources, S.P.; writing—original draft preparation, S.P., P.C. and T.A.; writing—review and editing, P.C. and T.A.; visualization, S.P.; supervision, P.C.; project administration, P.C.; P.C. involved essentially intellectual contributor. All authors have read and agreed to the published version of the manuscript.

Funding

This research received no external funding.

Institutional Review Board Statement

The study did not require ethical approval.

Data Availability Statement

Not applicable.

Acknowledgments

The authors would like to thank the 2019 third-year undergraduate students who participated in this pilot study. Chulalongkorn University is acknowledged for supported the education institution license of ArcGIS Online and ArcGIS Survey123 used in this research. Anonymous reviewers are thanked for their useful and constructive comments.

Conflicts of Interest

The authors declare no conflict of interest.

References

  1. Elkins, J.T.; Elkins, N.M. Teaching geology in the field: Significant geoscience concept gains in entirely field-based introductory geology courses. J. Geosci. Educ. 2007, 55, 126–132. [Google Scholar] [CrossRef]
  2. Esteves, H.; Ferreira, P.; Vasconcelos, C.; Fernandes, I. Geological fieldwork: A study carried out with Portuguese secondary school students. J. Geosci. Educ. 2013, 61, 318–325. [Google Scholar]
  3. King, C. Geoscience education: An overview. Stud. Sci. Educ. 2008, 44, 187–222. [Google Scholar] [CrossRef]
  4. Martínez-Graña, A.M.; González-Delgado, J.; Pallarés, S.; Goy, J.L.; Llovera, J.C. 3D virtual itinerary for education using Google Earth as a tool for the recovery of the geological heritage of natural areas: Application in the “Las Batuecas Valley” nature park (Salamanca, Spain). Sustainability 2014, 6, 8567–8591. [Google Scholar] [CrossRef] [Green Version]
  5. Mogk, D.W.; Goodwin, C. Learning in the field: Synthesis of research on thinking and learning in the geosciences. In Earth and mind II: A Synthesis of Research on Thinking and Learning in the Geosciences; Kastens, K.A., Manduca, C.A., Eds.; Geological Society of America: Boulder, CO, USA, 2012; Volume 486, pp. 131–163. [Google Scholar] [CrossRef]
  6. Frodeman, R. Geological reasoning: Geology as an interpretive and historical science. Geol. Soc. Am. Bull. 1995, 107, 960–968. [Google Scholar] [CrossRef]
  7. House, P.K.; Clark, R.; Kopera, J. Overcoming the momentum of anachronism. In Rethinking the Fabric of Geology; Baker, V.R., Ed.; Geological Society of America: Boulder, CO, USA, 2013; Volume 502, p. 103. [Google Scholar] [CrossRef]
  8. Lundmark, A.M.; Augland, L.E.; Jørgensen, S.V. Digital fieldwork with Fieldmove-how do digital tools influence geoscience students’ learning experience in the field? J. Geogr. High. Educ. 2020, 44, 1–14. [Google Scholar] [CrossRef] [Green Version]
  9. Nowak, M.M.; Dziób, K.; Ludwisiak, Ł.; Chmiel, J. Mobile GIS applications for environmental field surveys: A state of the art. Glob. Ecol. Conserv. 2020, 23, e01089. [Google Scholar] [CrossRef]
  10. Dabove, P.; Pietra, V.D.; Piras, M. GNSS Positioning Using Mobile Devices with the Android Operating System. ISPRS Int. J. Geo-Inf. 2020, 9, 220. [Google Scholar] [CrossRef] [Green Version]
  11. Fargher, M. WebGIS for Geography Education: Towards a GeoCapabilities Approach. ISPRS Int. J. Geo-Inf. 2018, 7, 111. [Google Scholar] [CrossRef] [Green Version]
  12. Deadman, P.; Hall, G.B.; Elliot, E.; Dudycha, D. Interactive GIS instruction using a multimedia classroom. J. Geogr. High. Educ. 2000, 24, 365–380. [Google Scholar] [CrossRef]
  13. Drennon, C. Teaching geographic information systems in a problem-based learning environment. J. Geogr. High. Educ. 2005, 29, 385–402. [Google Scholar] [CrossRef]
  14. Zerger, A.; Bishop, I.D.; Escobar, F.; Hunter, G.J. A self-learning multimedia approach for enriching GIS education. J. Geogr. High. Educ. 2002, 26, 67–80. [Google Scholar] [CrossRef]
  15. Albert, W.S.; Golledge, R.G. The use of spatial cognitive abilities in geographic information systems: The map overlay operation. Tran. GIS. 1996, 3, 7–21. [Google Scholar] [CrossRef]
  16. Hall-Wallace, M.K.; McAuliffe, C.M. Design, implementation, and evaluation of GIS-based learning materials in an introductory geosciences. J. Geosci. Educ. 2002, 50, 5–14. [Google Scholar] [CrossRef]
  17. Lee, J.; Bednarz, R. Effect of GIS learning on spatial thinking. J. Geogr. High. Educ. 2009, 33, 183–198. [Google Scholar] [CrossRef]
  18. Kholoshyn, I.; Bondarenko, O.; Hanchuk, O.; Shmeltser, E. Cloud ArcGIS Online as an innovative tool for developing geoinformation competence with future geography teachers. arXiv 2019, arXiv:1909.04388. [Google Scholar]
  19. Jitmahantakul, S.; Chenrai, P. Applying virtual reality technology to geoscience classrooms. Rev. Int. Geogr. Educ. Online 2019, 9, 577–590. [Google Scholar] [CrossRef] [Green Version]
  20. Welsh, K.E.; Mauchline, A.L.; Park, J.R.; Whalley, W.B.; France, D. Enhancing fieldwork learning with technology: Practitioner’s perspectives. J. Geogr. High. Educ. 2013, 37, 399–415. [Google Scholar] [CrossRef]
  21. Pavlis, T.L.; Langford, R.; Hurtado, J.; Serpa, L. Computer-based data acquisition and visualization systems in field geology: Results from 12 years of experimentation and future potential. Geosphere 2010, 6, 275–294. [Google Scholar] [CrossRef]
  22. Bührdel, J.; Walter, M.; Campbell, R.E. Geodata Collection and Visualisation in Orchards: Interfacing Science-Grower Data Using a Disease Example (European Canker in Apple, Neonectria Ditissima). N. Z. Plant Prot. 2020, 73, 57–64. [Google Scholar] [CrossRef]
  23. Chmielewski, S.; Samulowska, M.; Lupa, M.; Lee, D.; Zagajewski, B. Citizen science and WebGIS for outdoor advertisement visual pollution assessment. Comput. Environ. Urban Syst. 2018, 67, 97–109. [Google Scholar] [CrossRef]
  24. Fornace, K.M.; Surendra, H.; Abidin, T.R.; Reyes, R.; Macalinao, M.; Stresman, G.; Luchavez, J.; Ahmad, R.A.; Supargiyono, S.; Espino, F.; et al. Use of mobile technology-based participatory mapping approaches to geolocate health facility attendees for disease surveillance in low resource settings. Int. J. Health Geogr. 2018, 17, 21. [Google Scholar] [CrossRef] [PubMed]
  25. Madsen, L.M.; Rump, C. Considerations of how to study learning processes when students use GIS as an instrument for developing spatial thinking skills. J. Geogr. High. Educ. 2012, 36, 97–116. [Google Scholar] [CrossRef]
  26. Strachan, C.; Mitchell, J. Teachers’ Perceptions of Esri Story Maps as Effective Teaching Tools. Rev. Int. Geogr. Educ. Online 2014, 4, 195–220. [Google Scholar]
Figure 1. A typical workflow for constructing a fieldwork teaching with ArcGIS Online application. In this workflow “teacher” is an administrator responsible for creating and publishing web map applications. “Students” are users that are responsible for data collection. The web map application allows all teachers and students to view and query data from anywhere with an internet signal.
Geosciences 11 00357 g001
Figure 2. Field survey information and data type for generating a survey form and image of the Survey123 application on the smartphone. The necessary geological information can be collected and recorded via smartphone through online and offline modes (left). A screenshot of the Survey123 application shows an example of the interface of the survey used in this study (right).
Geosciences 11 00357 g002
Figure 3. An interface and screenshot from a smartphone display of the web map application. Users can turn on/off feature layers by clicking on the layer names. On the attribute table panel, specific stations can be selected from the table, which will show the selected feature simultaneously on a map (a cyan dot corresponding to a selected attribute in cyan color). In addition, detailed survey information at each station can be shown as a pop-up window when the user clicks on a point feature on the map.
Geosciences 11 00357 g003
Figure 4. The interface of the web map application in ArcGIS Online on PC and tablet. On the PC and tablet versions, the separate layer list panel and pop-up window panel make the online map more convenient to use because it can show a legend, sampling point information, and a map all at once. Georeferenced maps of any kind can be imported as layers and shown on a smart device.
Geosciences 11 00357 g004
Table 1. Descriptive statistics of the untreated and treated groups.
GroupNumberMeanSDdft-Stat.
UntreatedPre-test1512.921.37145.585
Post-test1515.271.58
TreatedPre-test1512.651.55147.835
Post-test1517.601.88
Table 2. The independent t-test for comparing the score between the untreated and treated groups.
GroupNumberMeanSDdft-Stat.
Untreated1515.271.58283.678
Treated1517.601.88
Publisher’s Note: MDPI stays neutral with regard to jurisdictional claims in published maps and institutional affiliations.

