Article

SNR-Based GNSS-R for Coastal Sea-Level Altimetry

1
Faculty of Science, Technology, and Medicine, Belval Campus, University of Luxembourg, 4365 Esch-sur-Alzette, Luxembourg
2
Research Unit in Geoscience, State University of Haiti, Port-au-Prince HT 6110, Haiti
3
Maritime Service and Navigation of Haiti (SEMANAH), Port-au-Prince HT 1520, Haiti
*
Author to whom correspondence should be addressed.
Geosciences 2021, 11(9), 391; https://doi.org/10.3390/geosciences11090391
Submission received: 26 July 2021 / Revised: 26 August 2021 / Accepted: 10 September 2021 / Published: 16 September 2021

Abstract

:
Geodetic Global Navigation Satellite System reflectometry (GNSS-R) uses ground-based signals of opportunity to retrieve sea levels at an intermediate spatial scale. Geodetic GNSS-R is based on the simultaneous reception of Line-of-Sight (LoS) and its coherent GNSS sea surface reflection (non-LOS) signals. The scope of this paper is to present geodetic GNSS-R applied to sea level altimetry. Signal-to-Noise Ratio (SNR) measurements from a Commercial Off-The-Shelf (COTS) geodetic-quality GNSS station at the Haiti Coast Guard Base in Port-au-Prince is used to retrieve sea levels in the International Terrestrial Reference Frame 2014 (ITRF2014). The GNSS-R sea levels are compared with those of the OTT Radar Level Sensor (RLS) installed vertically below the GNSS antenna. The Root-Mean-Square Error (RMSE) between the geodetic GNSS-R sea levels and OTT RLS records is 3.43 cm, with a correlation of 0.96. In addition, the complex differences between the OTT RLS records and 15-min GNSS-R sea levels using Global Positioning System (GPS) and Globalnaya Navigazionnaya Sputnikovaya Sistema (or Global Navigation Satellite System; GLONASS) signals for all the eight major tidal constituents are in mm-level agreement. Therefore, geodetic GNSS-R can be used as a complementary approach to the conventional method for sea level studies in a stable terrestrial reference frame.

1. Introduction

The Global Navigation Satellite System (GNSS) signals in the microwave band (300 MHz to 300 GHz) propagate from satellite to receiver in a vacuum, at a constant speed, along the Line-of-Sight (LoS) path. Although the LoS path is routinely used for position determination [1,2,3], the error sources of Positioning, Navigation, and Timing (PNT) caused by physical effects in the actual environment have been used for Earth observation and remote sensing. GNSS-Reflectometry (GNSS-R) is a microwave remote sensing system that uses reflected or scattered signals of opportunity (non-LoS) to retrieve environmental variables such as sea surface height, ocean wind, and soil moisture. GNSS-R can take advantage of appropriate antenna configurations in order to study the relationships between geophysical variables and properties of the scattering surface.
Geodetic GNSS-R uses Signal-to-Noise Ratio (SNR) measurements from sensor platforms near the ground surface to estimate the sea level in a stable terrestrial reference frame. A geodetic GNSS station equipped with a Commercial Off-The-Shelf (COTS) receiver and an upright antenna can simultaneously record multiple surface reflections from different satellite navigation systems separated by several degrees in azimuthal angle around the GNSS antenna.
GNSS [4] reflected signals from a single antenna first were used to investigate specular ground reflections and dielectric properties [4]. The frequency and phase of the constructive and destructive interference between two coherent waves depend on the vertical distance from the reflecting surface to the antenna Phase Center Offset (PCO) and the surface reflectivity, respectively. A Root-Mean-Square Error (RMSE) of 4.8 cm was reported between GNSS-R sea levels and synthetic tide gauge records computed based on two tide gauge stations 18 km south and 33 km north of the Onsala GNSS-R tide gauge station over the three-month period from 16 September 2010 to December [5]. In that study, the authors also reported a larger RMSE (~10 cm) of the residual between GNSS-R sea level retrievals and the tide gauge records for the second station, the Friday Harbor GNSS tide gauge. Therefore, the need of a better model to take the reflector height-rate into account was reckoned.
The existing geodetic quality GNSS station at Peterson Bay, Alaska, was analyzed over a one-year time period by [6], correcting the GNSS-R sea levels for the moving planar surface. SNR-based GNSS-R sea levels were compared with co-located tide gauge records for five stations in different parts of the world [7]. The authors reported an RMSE of 6.2–43.2 cm, assuming time-dependent sea levels for each GNSS satellite arc. The performance of geodetic GNSS-R was further investigated using a tide gauge station about 345 m to the west of the Friday Harbor GNSS station [8]. An RMSE of about 12 cm between sea levels of the two sensors was reported over a ten-year period.
SNR-based GNSS-R tidal constituents in Antarctica and Greenland agreed at the mm level with those of co-located tide gauges for global and local ocean tide models [9]. Therefore, geodetic GNSS-R could be operational in difficult environments, such as the polar regions where conventional tide gauge sensors are difficult to install and maintain. In another study, 10 min GNSS-R water levels for a station where the water level abruptly changes up to 17 m every 4–8 h were compared with hydrostatic or pneumatic pressure measurements in Vianden, Luxembourg [10].
The first inter-comparison campaign on geodetic GNSS-R for sea level monitoring confirmed an RMSE smaller than 5 cm between GNSS-R–derived sea levels and tide gauge records at the Onsala GNSS-R tide gauge station [11]. The authors also demonstrated that the dominant tidal constituents were well captured by geodetic GNSS-R. More recently, [12] reported a 2.9 cm RMS for daily water levels at Guaiba Lake in Rio Grande do Sul by developing an open-source low-cost sensor for SNR-based GNSS reflectometry.
Geodetic GNSS-R is quickly maturing as a viable alternative for coastal sea level altimetry. SNR-based GNSS-R can be especially useful in regions with large land subsidence or uplift. This is because a COTS GNSS station can provide both vertical land motion and sea level variations. In this contribution, SNR observations from a newly installed GNSS station in the Haiti Coast Guard Base Port-au-Prince tide gauge station (Figure 1) are used to retrieve sea levels in the Caribbean Sea.
Haiti lies right on the boundary of the Caribbean and North American plates. [13] reported a 19   mm / yr left-lateral relative motion between the Caribbean and North American plates. Haiti, the most vulnerable country to climate change in Latin America and the Caribbean, is in the center of the hurricane belt and has experienced six major storms in the past 30 years [14]. The West and South Departments of this small island nation lie in the path of the strongest tropical storms [14]. Hurricane Matthew in 2016, with a Category 4 strength, devastated the Southwestern part of the country and caused the sea level to rise, flooding the bay of Port-au-Prince with up to 1 m of water [15]. A mean average of 1.8   mm / yr was reported as the sea level rise rate in the Caribbean region over the last 60 years [16]. A sea level rise of between 0.05 m and 0.22 m is estimated for 2030 in the Caribbean [14].
The accuracy and precision of SNR-based GNSS-R sea level altimetry in the Haiti Coast Guard Base Port-au-Prince tide gauge station (POPR) are evaluated using co-located radar tide gauge records. In addition, the performance of the in situ tide gauge station is assessed using pressure and radar sensors over 2014, when two tide gauge sensors were operational. Finally, the GNSS-R–derived tidal constituents are compared with those of the radar tide gauge sensor from 10 October 2020 to 1 March 2021.
The rest of the paper provides a general description of the geodetic GNSS-R footprint and physically-based forward model and statistically-rigorous inverse model in Section 2 and Section 3, respectively. Then, the study area is presented in Section 4. We proceed to assess the geodetic GNSS-R altimetry results in more detail in Section 5. Sea levels in ITRF2014 are explained in Section 6. Finally, the paper is ended by conclusions in Section 7.

2. Geodetic GNSS-R Footprint

The geometry of geodetic GNSS-R depends on the positions of the GNSS satellite and receiving antenna with respect to the reflecting surface. The extent and resolution of surface reflected GNSS multipath from a local horizontal plane covers an area around the specular reflection point. The first Fresnel zone (FFZ), as the sensing footprint of geodetic GNSS-R, is defined as a function of half-wavelength ( λ / 2 ) [17]. The FFZ is an elongated ellipse whose semi-minor and semi-major axes are defined as follows [18]:
b = λ h sin e + λ 2 4 sin 2 e a = b sin e
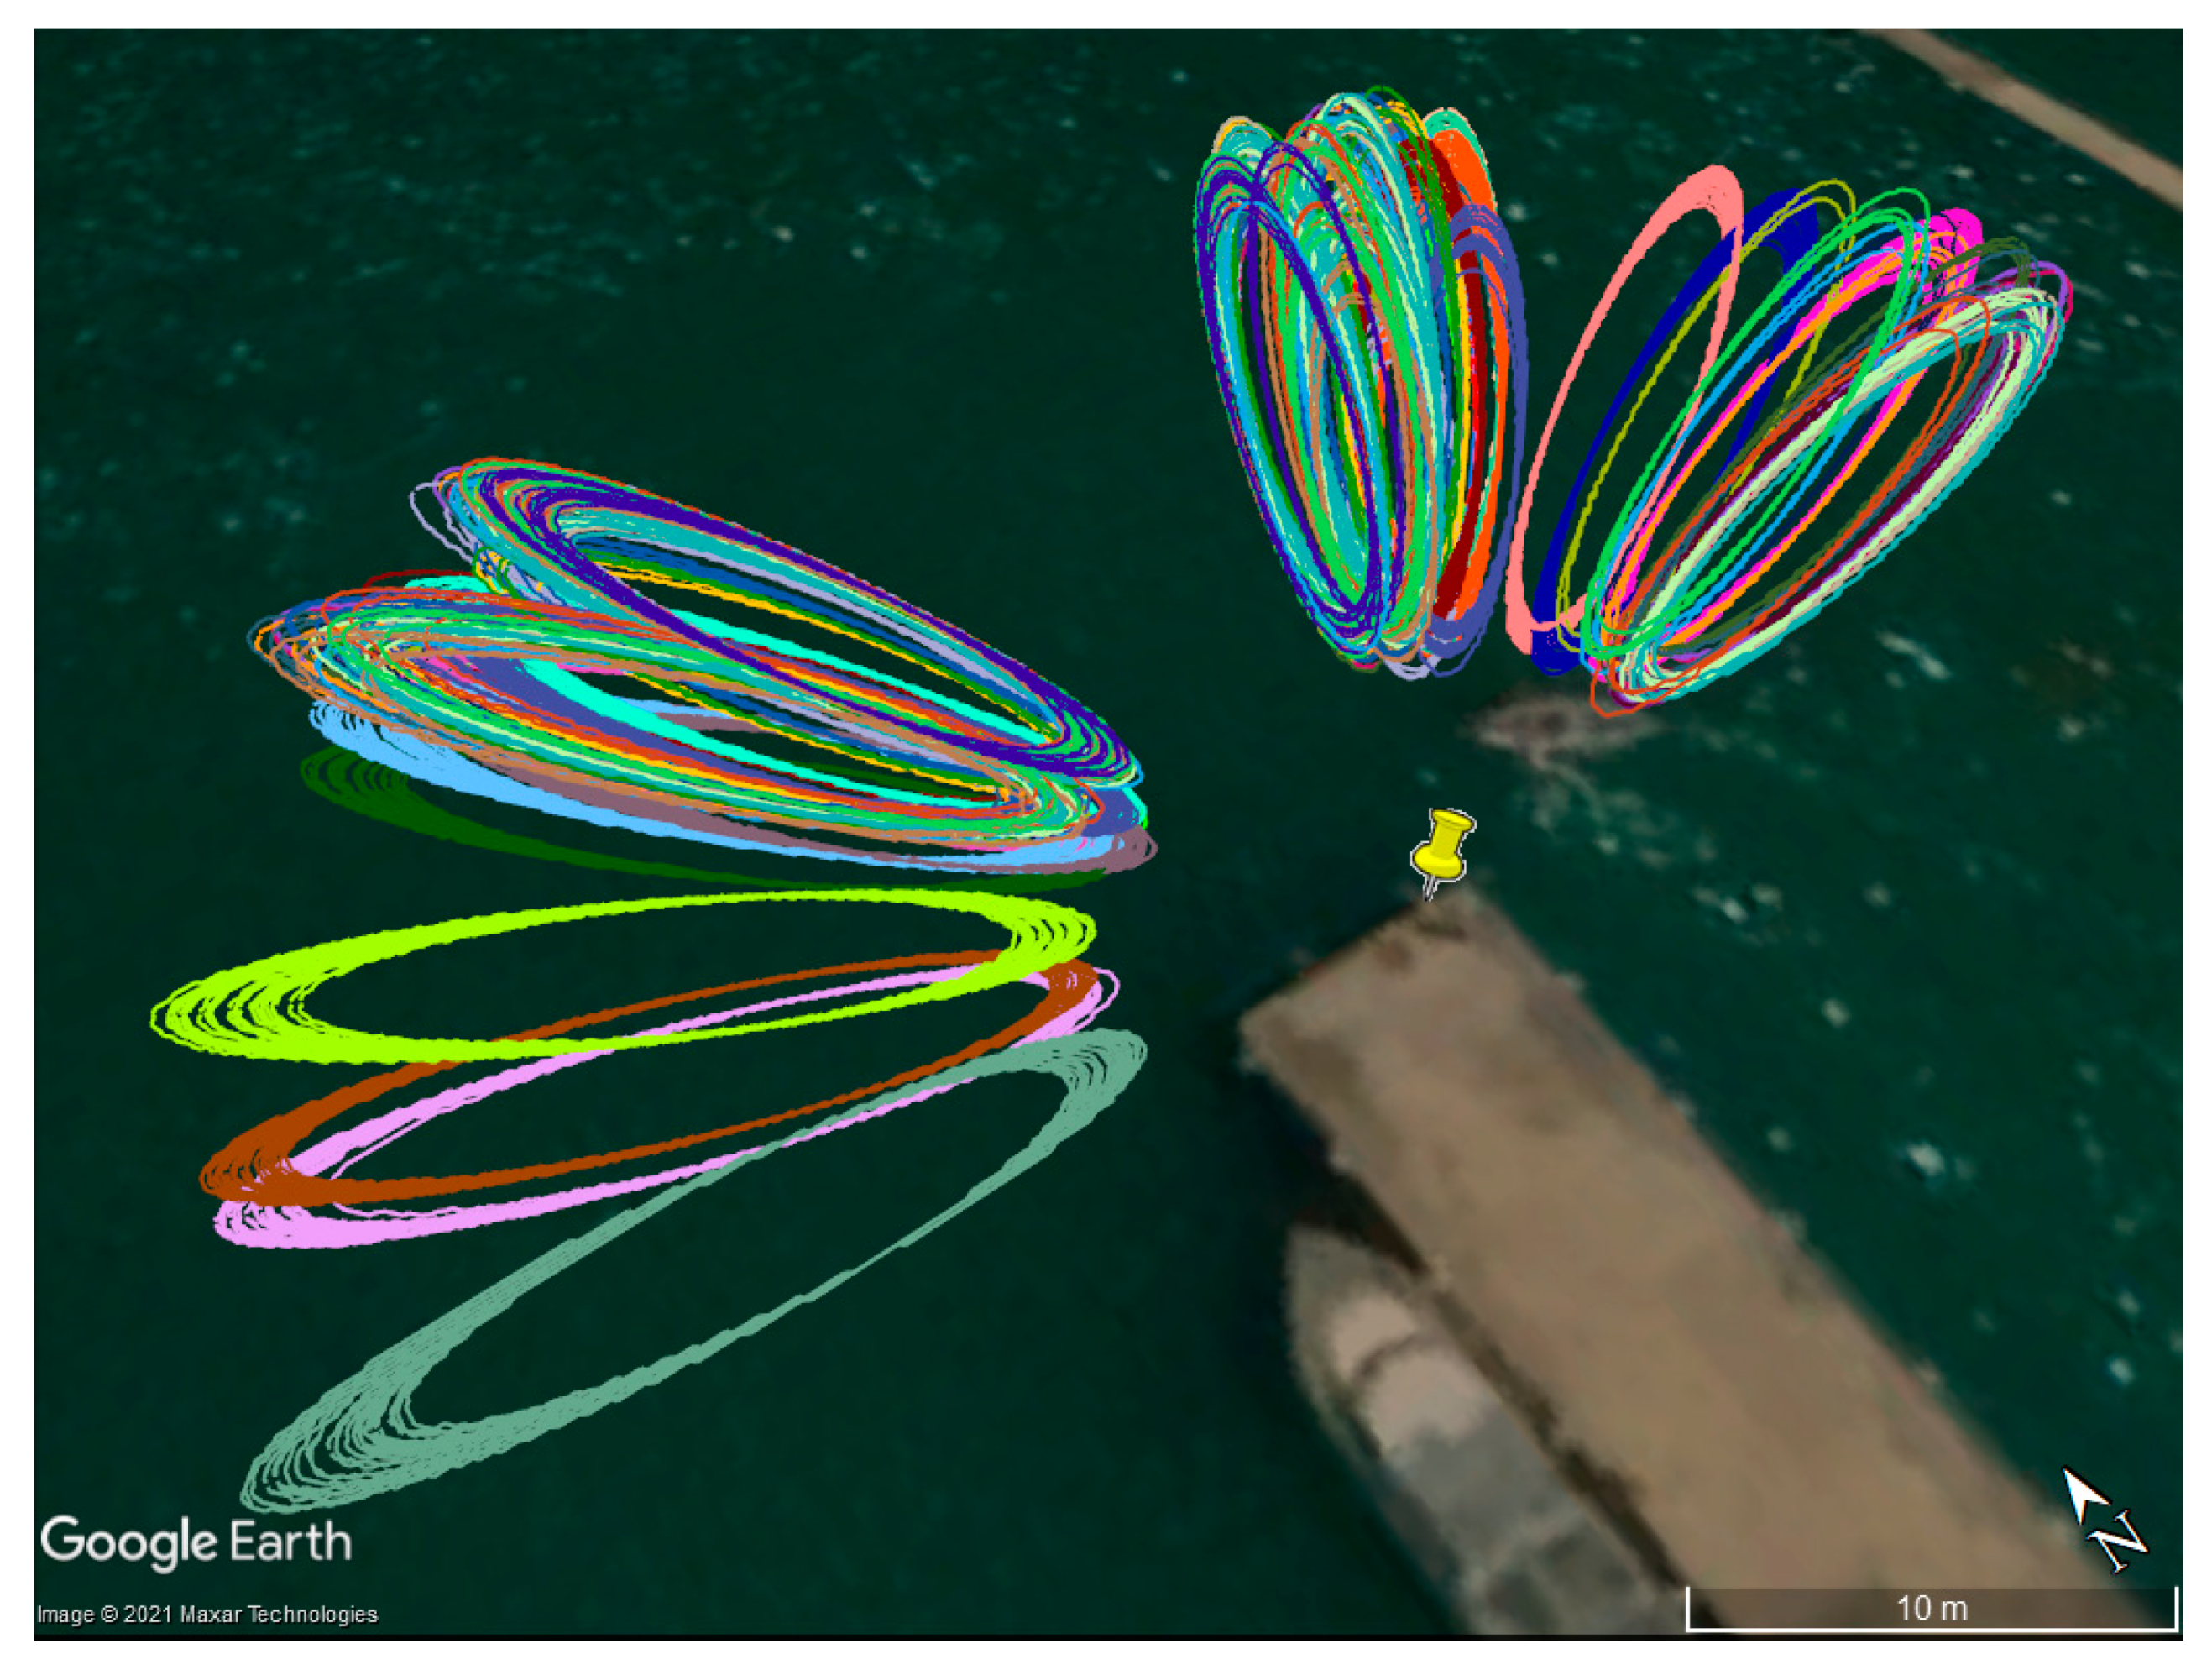
where h is the reflector height and e is the GNSS satellite elevation angle. The GNSS satellites repeat their ground track as a fraction of a sidereal day, i.e., the GPS orbital period is half a sidereal day. Therefore, the reflection points from rising and setting satellite arcs can be used to approximate the first Fresnel zone. Figure 2 shows the FFZs from the sea reflection for January 2021 at the POPR using the median elevation angles of each individual GNSS track. It should be noted that geodetic GNSS-R has a much larger and smaller spatial footprint than the tide gauge senor and radar altimeter, respectively.

3. Geodetic GNSS-R Model

SNR observations that are reported by GNSS receivers are a function of interferometric power ( P i = P r P d ) and interferometric phase ( ϕ i = ϕ r ϕ d ) [19]:
S N R = P d ( 1 + P i ) P n + 2 P d P i P n cos ϕ i
The incoherent power is neglected in geodetic GNSS-R, as it only impacts the SNR trend and not the interference fringes [20]. The first term on the right-hand side is the SNR trend, and the second term represents detrended interference fringes. P r , P d , and P n are reflected, direct, and noise powers, respectively. P r and P d can be expressed as a function of direction dependent Right-Handed Circular Polarization (RHCP) power component ( P d R ) and the complex-valued surface/antenna coupled coefficient ( X ) [20]:
P d = P d R G d R P r = P d R X 2 S 2 X = R S G r R exp ( ι Φ r R ) + R X G r L exp ( ι Φ r L )
where G d , r R , L represents the partial antenna power gains for RHCP and LHCP (Left-Handed Circular Polarization) evaluated in the direct and reflected directions. Φ r R , L is the respective antenna phase component. R S and R X are the complex-valued Fresnel reflection coefficients for same-sense and crossed polarization, respectively. The coherent power loss factor ( S 2 ) is a function of the carrier wavenumber ( k = 2 π / λ ) and can be directly linked to the standard deviation of surface height ( s ) [21]:
S 2 = exp ( k 2 s 2 sin 2 e )
The interferometric phase can be modeled as a function of coupled surface/antenna properties ( ϕ X ), the wavenumber and interferometric propagation delay ( τ i ), and the direct signal antenna phase contribution ( Φ d R ) [22]:
ϕ i = ϕ X + k τ i Φ d R
The latter can be approximated as a function of the height component of the Antenna Phase Center (APC) relative to the Antenna Reference Point (ARP) [20].
The interferometric propagation delay (Figure 3), while assuming a horizontal surface in vacuum, can be expressed as a function of antenna-to-surface reflector height ( H ) [23]:
τ i = 2 H sin e
Therefore, environmental variables such as snow depth and sea level can be retrieved using periodograms of the interference patterns observed by GNSS stations [24,25].
Including biases to compensate for deficiencies in the GNSS-R model, the forward model of SNR can be formulated as:
S N R = P d ( 1 + P i | B | 2 + 2 P i | B | cos ϕ i ^ ) / P n K 2   ϕ i ^ = ϕ i ϕ B
where K is the noise power bias, and B and ϕ B are interferometric power and phase biases, respectively.
The biases in the inverse model are fixed to their optimal a priori values and corrections for each parameter, and corresponding covariance matrices are estimated [25]. They can be expanded as a polynomial in terms of sine of elevation angle, e.g., [9],
ϕ B = j = 0 n   ϕ ( j ) sin j e = ϕ B ( 0 ) + ϕ B ( 1 ) sin e + ϕ B ( 2 ) sin 2 e +
where the superscript in parentheses (j) is an index; otherwise, it is a power exponent. The linear term of the interferometric phase bias that can be converted to a quantity with units of meters, known as height bias ( H B ), accounts for errors of the forward model reflector height a priori value ( H A ) [19]. Therefore, the total reflector height can be estimated as:
H = H A H B   H B = ϕ B ( 1 ) λ 4 π
A single GNSS signal is processed to retrieve the height bias based on the above-mentioned inversion algorithm. Then, satellite tracks are partitioned based on track azimuth and satellite PRN, as well as ascending or descending status of the arc. The Quality Control (QC) of sea levels as a necessary step is done to detect outliers resulting from anomalous conditions using robust estimators and statistical intervals [24,25].
It was found by [26] that tropospheric delay underestimates the reflector height retrievals. The interferometric atmospheric delay increases linearly with the reflector height and exponentially with the satellite elevation angle. Here, the Global Pressure and Temperature 3 model (GPT3) and Vienna Mapping Function 3 (VMF3) [27] are used to correct the sea level retrievals for the tropospheric delay corrections, as follows [28]:
H = ( H A H B ) + τ t 2 sin e
where τ t is the tropospheric delay and is defined as the difference between the radio length and the vacuum distance.
Due to the tides, the sea level changes and so does the reflector height. Therefore, the interferometric phase rate, assuming a variable reflector height, can be written as follows [10]:
ϕ i k z = H + k z H k z
where k z is the vertical wavenumber and can be interpreted as the sensitivity of the geodetic GNSS-R station [29]:
k z = 2 k sin e
Therefore, the GNSS-R sea levels will be biased if they are not corrected for the vertical velocity and acceleration of the tidal waves, as follows [9]:
H H ˙ + H ¨ = 1 e ˙ ( H ˙ tan e + H ¨ Δ t tan e )
where e ˙ , H ˙ , and H ¨ are elevation angle rate, sea vertical velocity, and sea vertical acceleration, respectively. Here, the elevation angle rate is derived from the GNSS precise ephemerides, while sea vertical velocity and acceleration are solved iteratively using the centered finite differences [9]. Finally, 15-min multi-GNSS corrected total reflector height is reported employing an 8 h moving window, as follows:
H = ( H A H B ) + τ t 2 sin e + H H ˙ + H ¨

4. Port-au-Prince Tide Gauge Station

The GNSS station at the Port-au-Prince tide gauge station (POPR) was installed in March 2019 at the Haiti Coast Guard Base in Port-au-Prince, with a collaboration between the University of Luxembourg, the Faculty of Sciences of the State University of Haiti, and the Haiti National Center for Geospatial Information (CNIGS). The GNSS station was equipped with a PolaR×5 receiver at 1 Hz sampling rate and a VP6050 high-precision full-spectrum GNSS antenna (Figure 1).
The antenna was installed about 3.23 m above the mean sea level and has clear reflections from the sea surface towards the north direction (Figure 2). SNR observations from GPS and GLONASS for the two-year period from 1 March 2019 to 26 March 2021 are processed to retrieve sea levels in the Caribbean Sea. An azimuthal mask and elevation mask of 180° (90–270°) and 20° (5–25°) are used at the POPR.
In addition, the retrieved reflector heights are corrected for offset of the APC relative to the APR [30]. The retrieved reflector heights at the Port-au-Prince tide gauge station are shown in Figure 4. The seasonal tidal sea-level variation and a reflector height envelope of 1.03 m is clear at the POPR.
The tide gauge station at Port-au-Prince (PTPR) is used to assess the performance of GNSS-R sea level altimetry. The PTPR, which is operated by the Maritime Service and Navigation of Haiti (SEMANAH) is a part of the Global Sea Level Observing System (GLOSS) network. The GLOSS network, with 287 tide gauge stations around the word, is for long-term climate change and oceanographic sea level monitoring [31]. The PTPR was equipped with a S12C hydrostatic submersible level transmitter having a piezo-resistive ceramic pressure sensor [32] and an OTT radar level sensor [33]. The S12C SDI-12 was retired at the beginning of 2017, and the OTT RLS was offline until 9 October 2020 due to the GPS week number rollover bug. The radar level sensor, with pulse radar technology that reports the sea level every minute with an accuracy of ± 3   mm , was installed 61.6 cm vertically below the GNSS antenna ARP.

5. GNSS-R Sea Level Altimetry

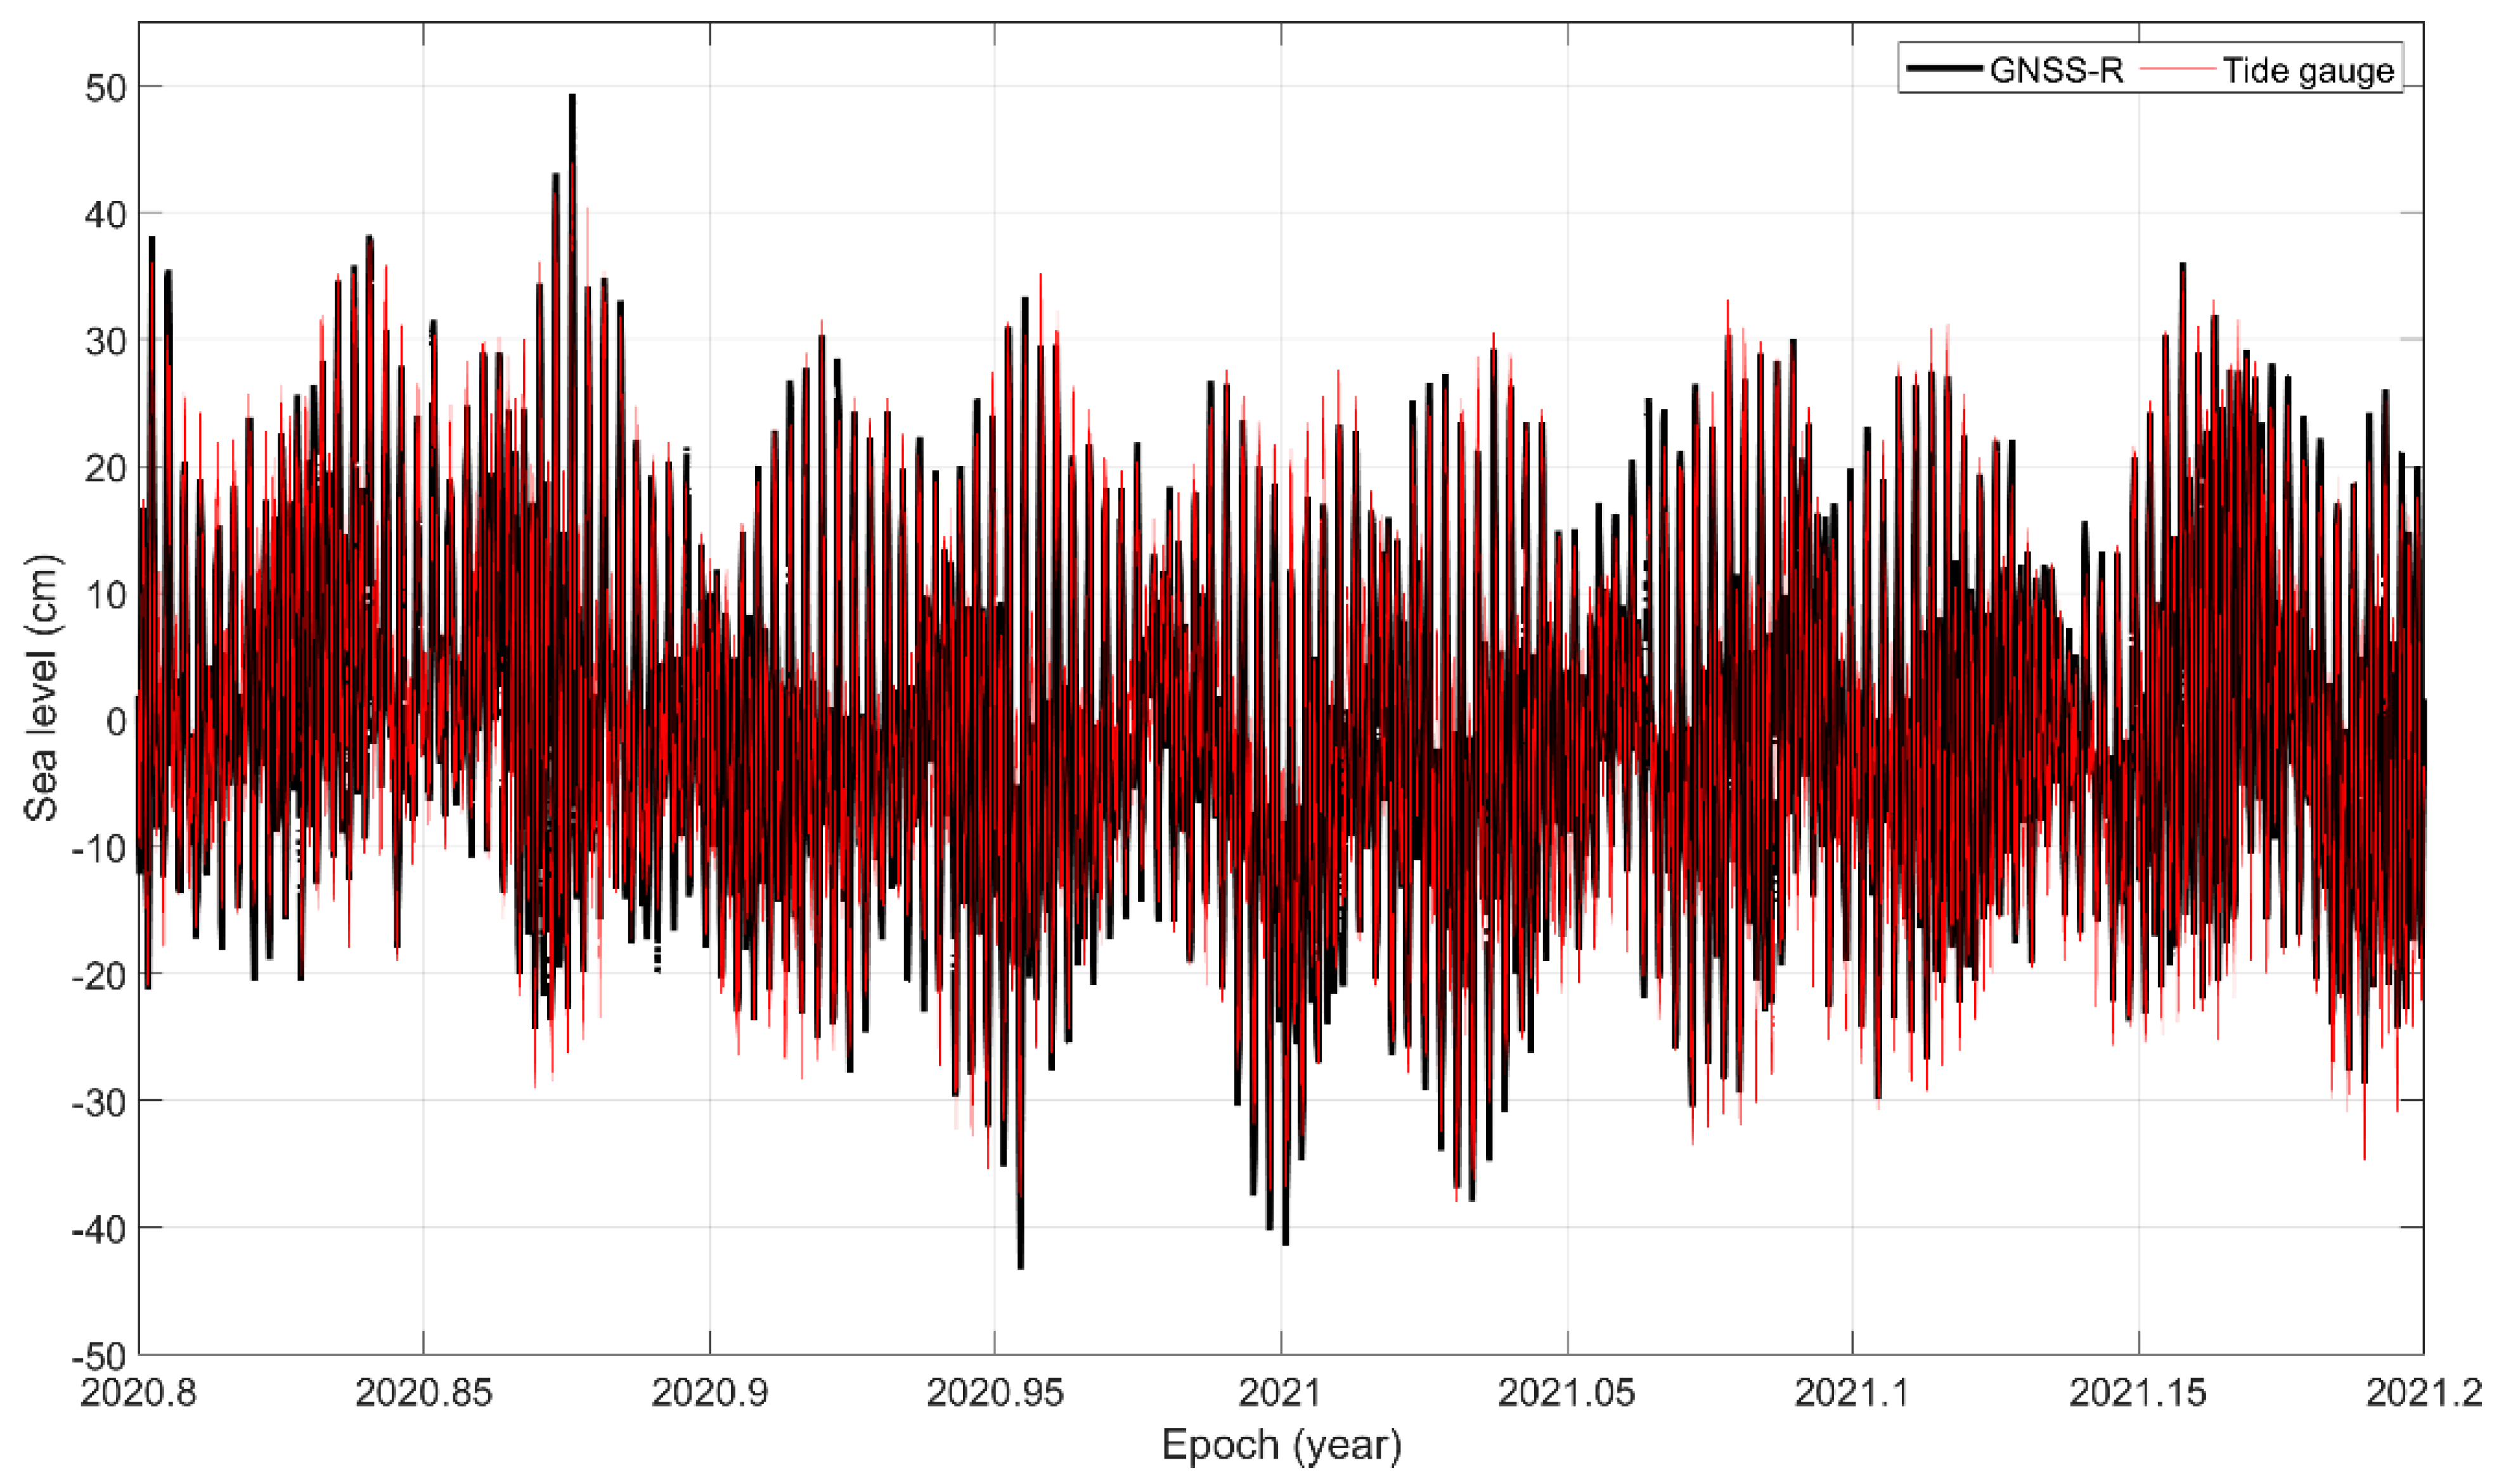
The 1-min OTT RLS records from 9 October 2020 are used to assess the performance of the 15-min GNSS-R sea level altimetry. The GNSS-R retrievals are interpolated at the tide gauge epochs; in order to minimize the interpolation errors, missing sea level periods are discarded in either OTT RLS or GNSS-R. The mean difference between tide gauge and GNSS-R is disregarded in this section to compare the two sensors. Figure 5 compares the OTT RLS records to the retrieved GNSS-R sea levels over 199 days.
On one hand, the RMSE of the residuals between GNSS-R sea level retrievals and the OTT RLS records at the Port-au-Prince tide gauge station is 3.43 cm. On the other hand, the RMSE between OTT RLS and S12C SDI-12 records over 2014, when both sensors were operational at the Haiti Coast Guard Base in Port-au-Prince is 3.67 cm, with a correlation coefficient exceeding 0.98. Therefore, geodetic GNSS-R sea levels are comparable with those of conventional tide gauge records.
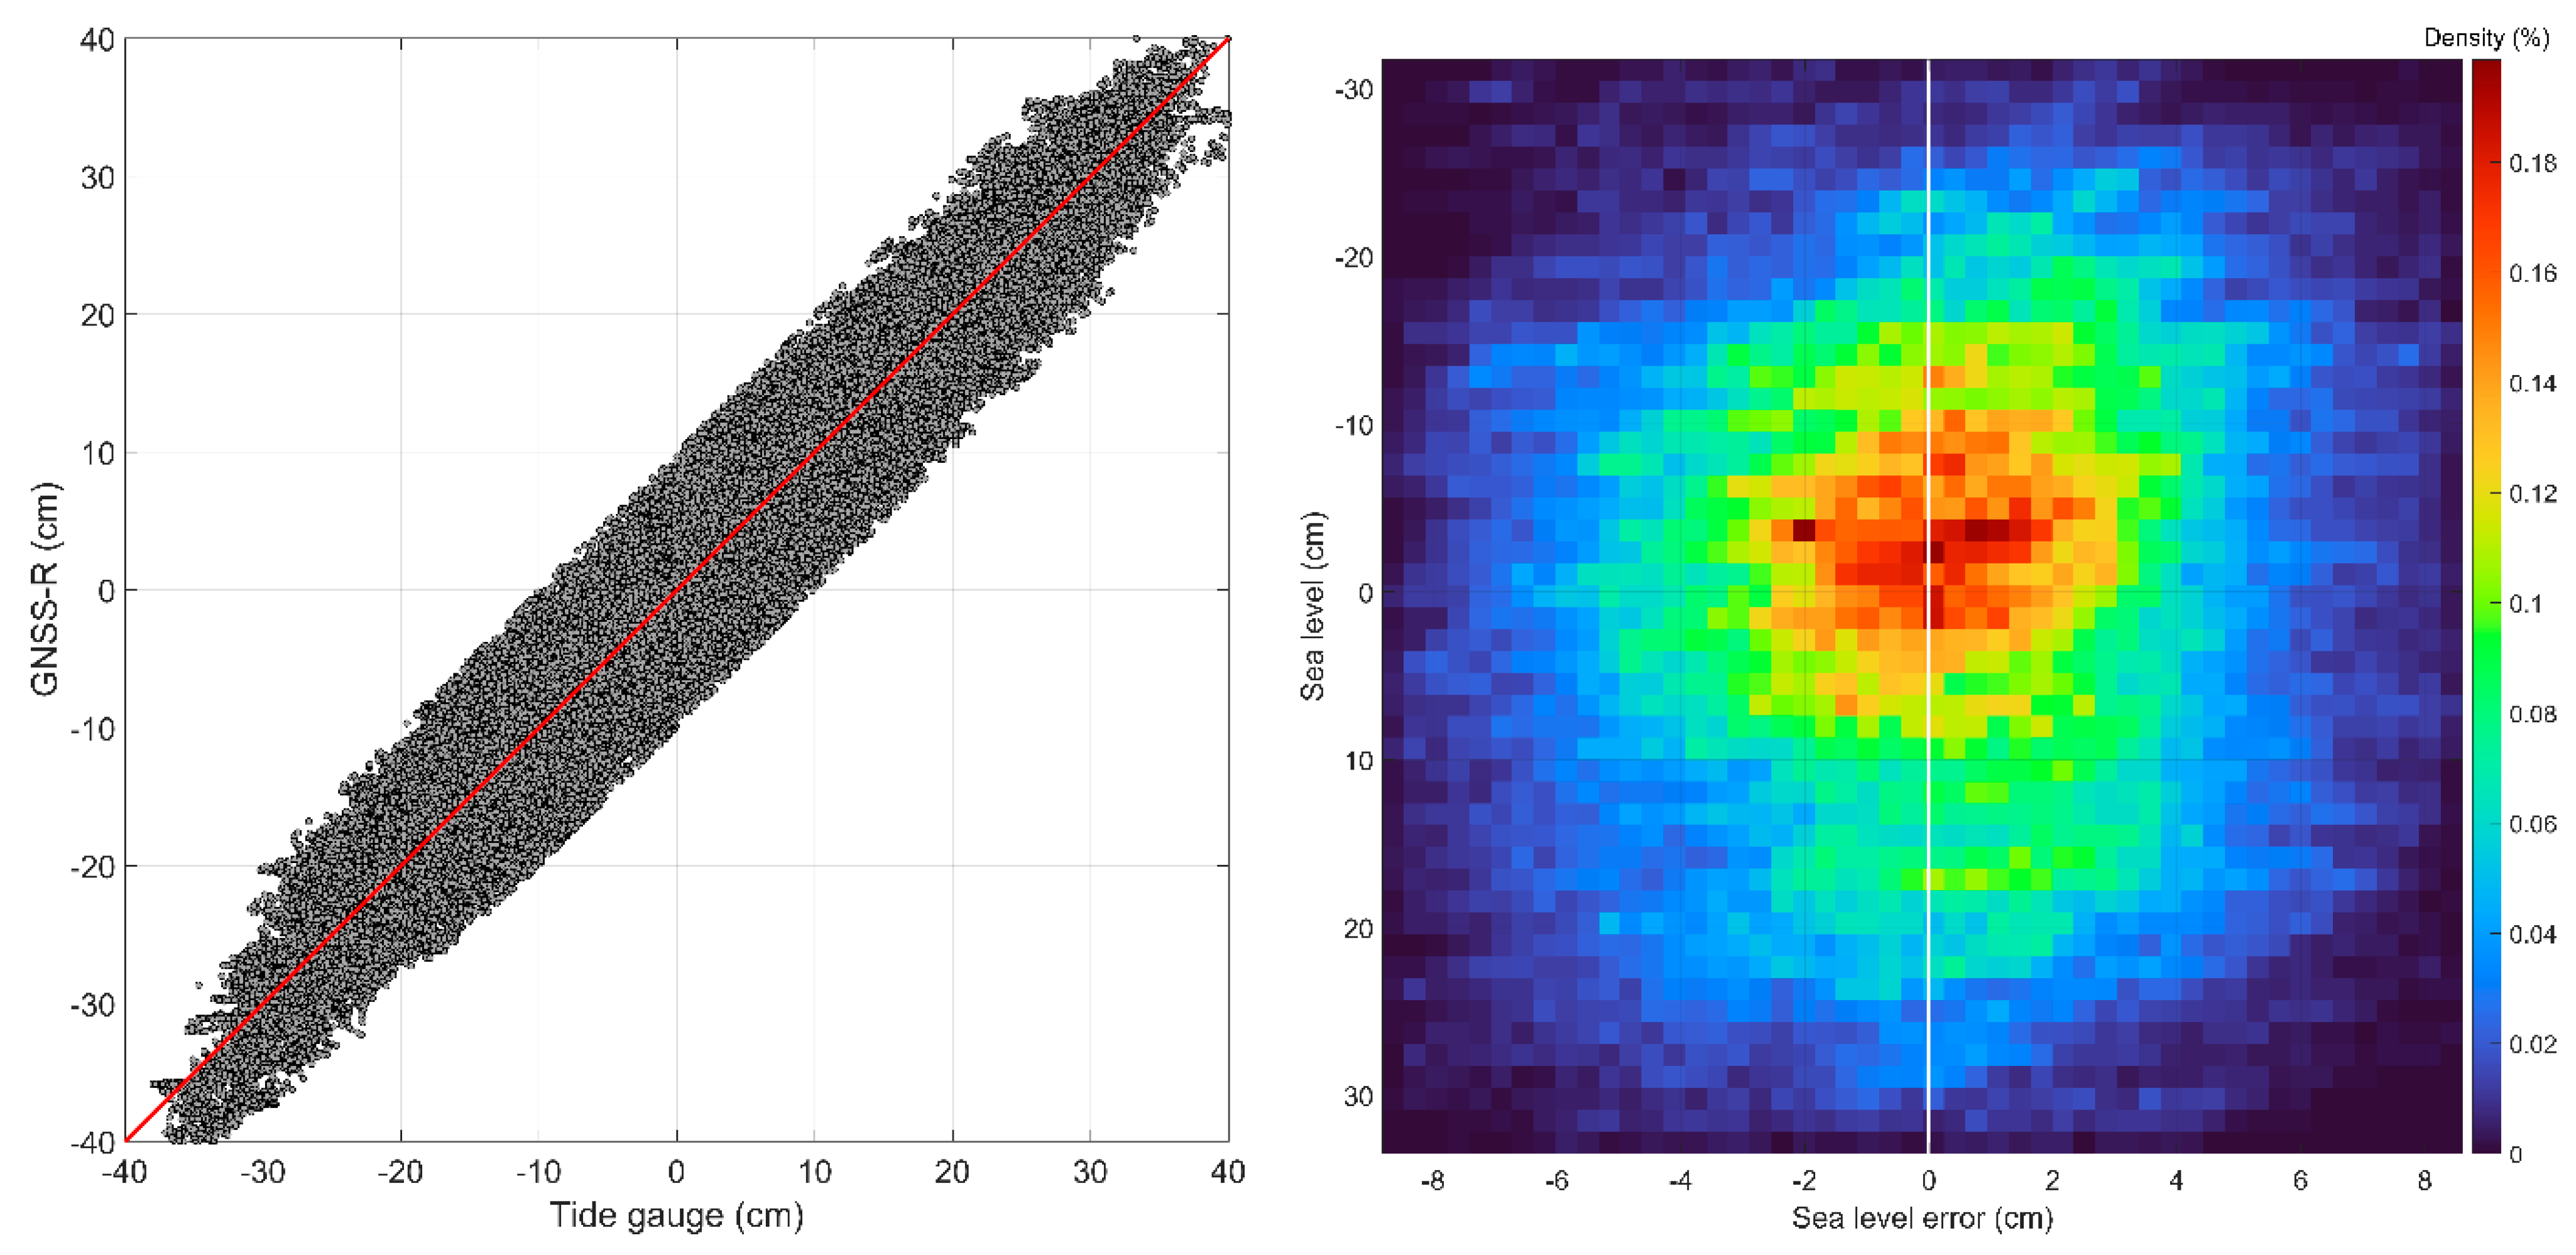
A scatterplot of sea levels shows an excellent agreement between tide gauge records and GNSS-R sea level retrievals, with a correlation coefficient exceeding 0.96 (Figure 6). A Van de Casteele diagram (y-axis presents the sea level error between the OTT RLS records and GNSS-R sea level retrievals and x-axis represents the OTT RLS records) shows there is no scale error between the two sensors (Figure 6). Carrying out a regression between the two sensors, the slope deviation of 0.01 m / m ± 0.02 m / m is not statistically significant vis-à-vis its 95% confidence interval.
To highlight the importance of the vertical velocity and vertical acceleration corrections for such a small tidal range, the uncorrected GNSS-R sea levels, assuming a static state for the sea surface, are compared with the OTT RLS records. The RMSE between uncorrected GNSS-R retrievals and tide gauge records is 6.73 cm, and the regression slope of 0.31 m / m ± 0.27 m / m indicates a scale error between the two sea levels. Therefore, the dynamic state of sea level correction, even for the small tidal range’s stations, should be applied when sub-hourly products are needed.
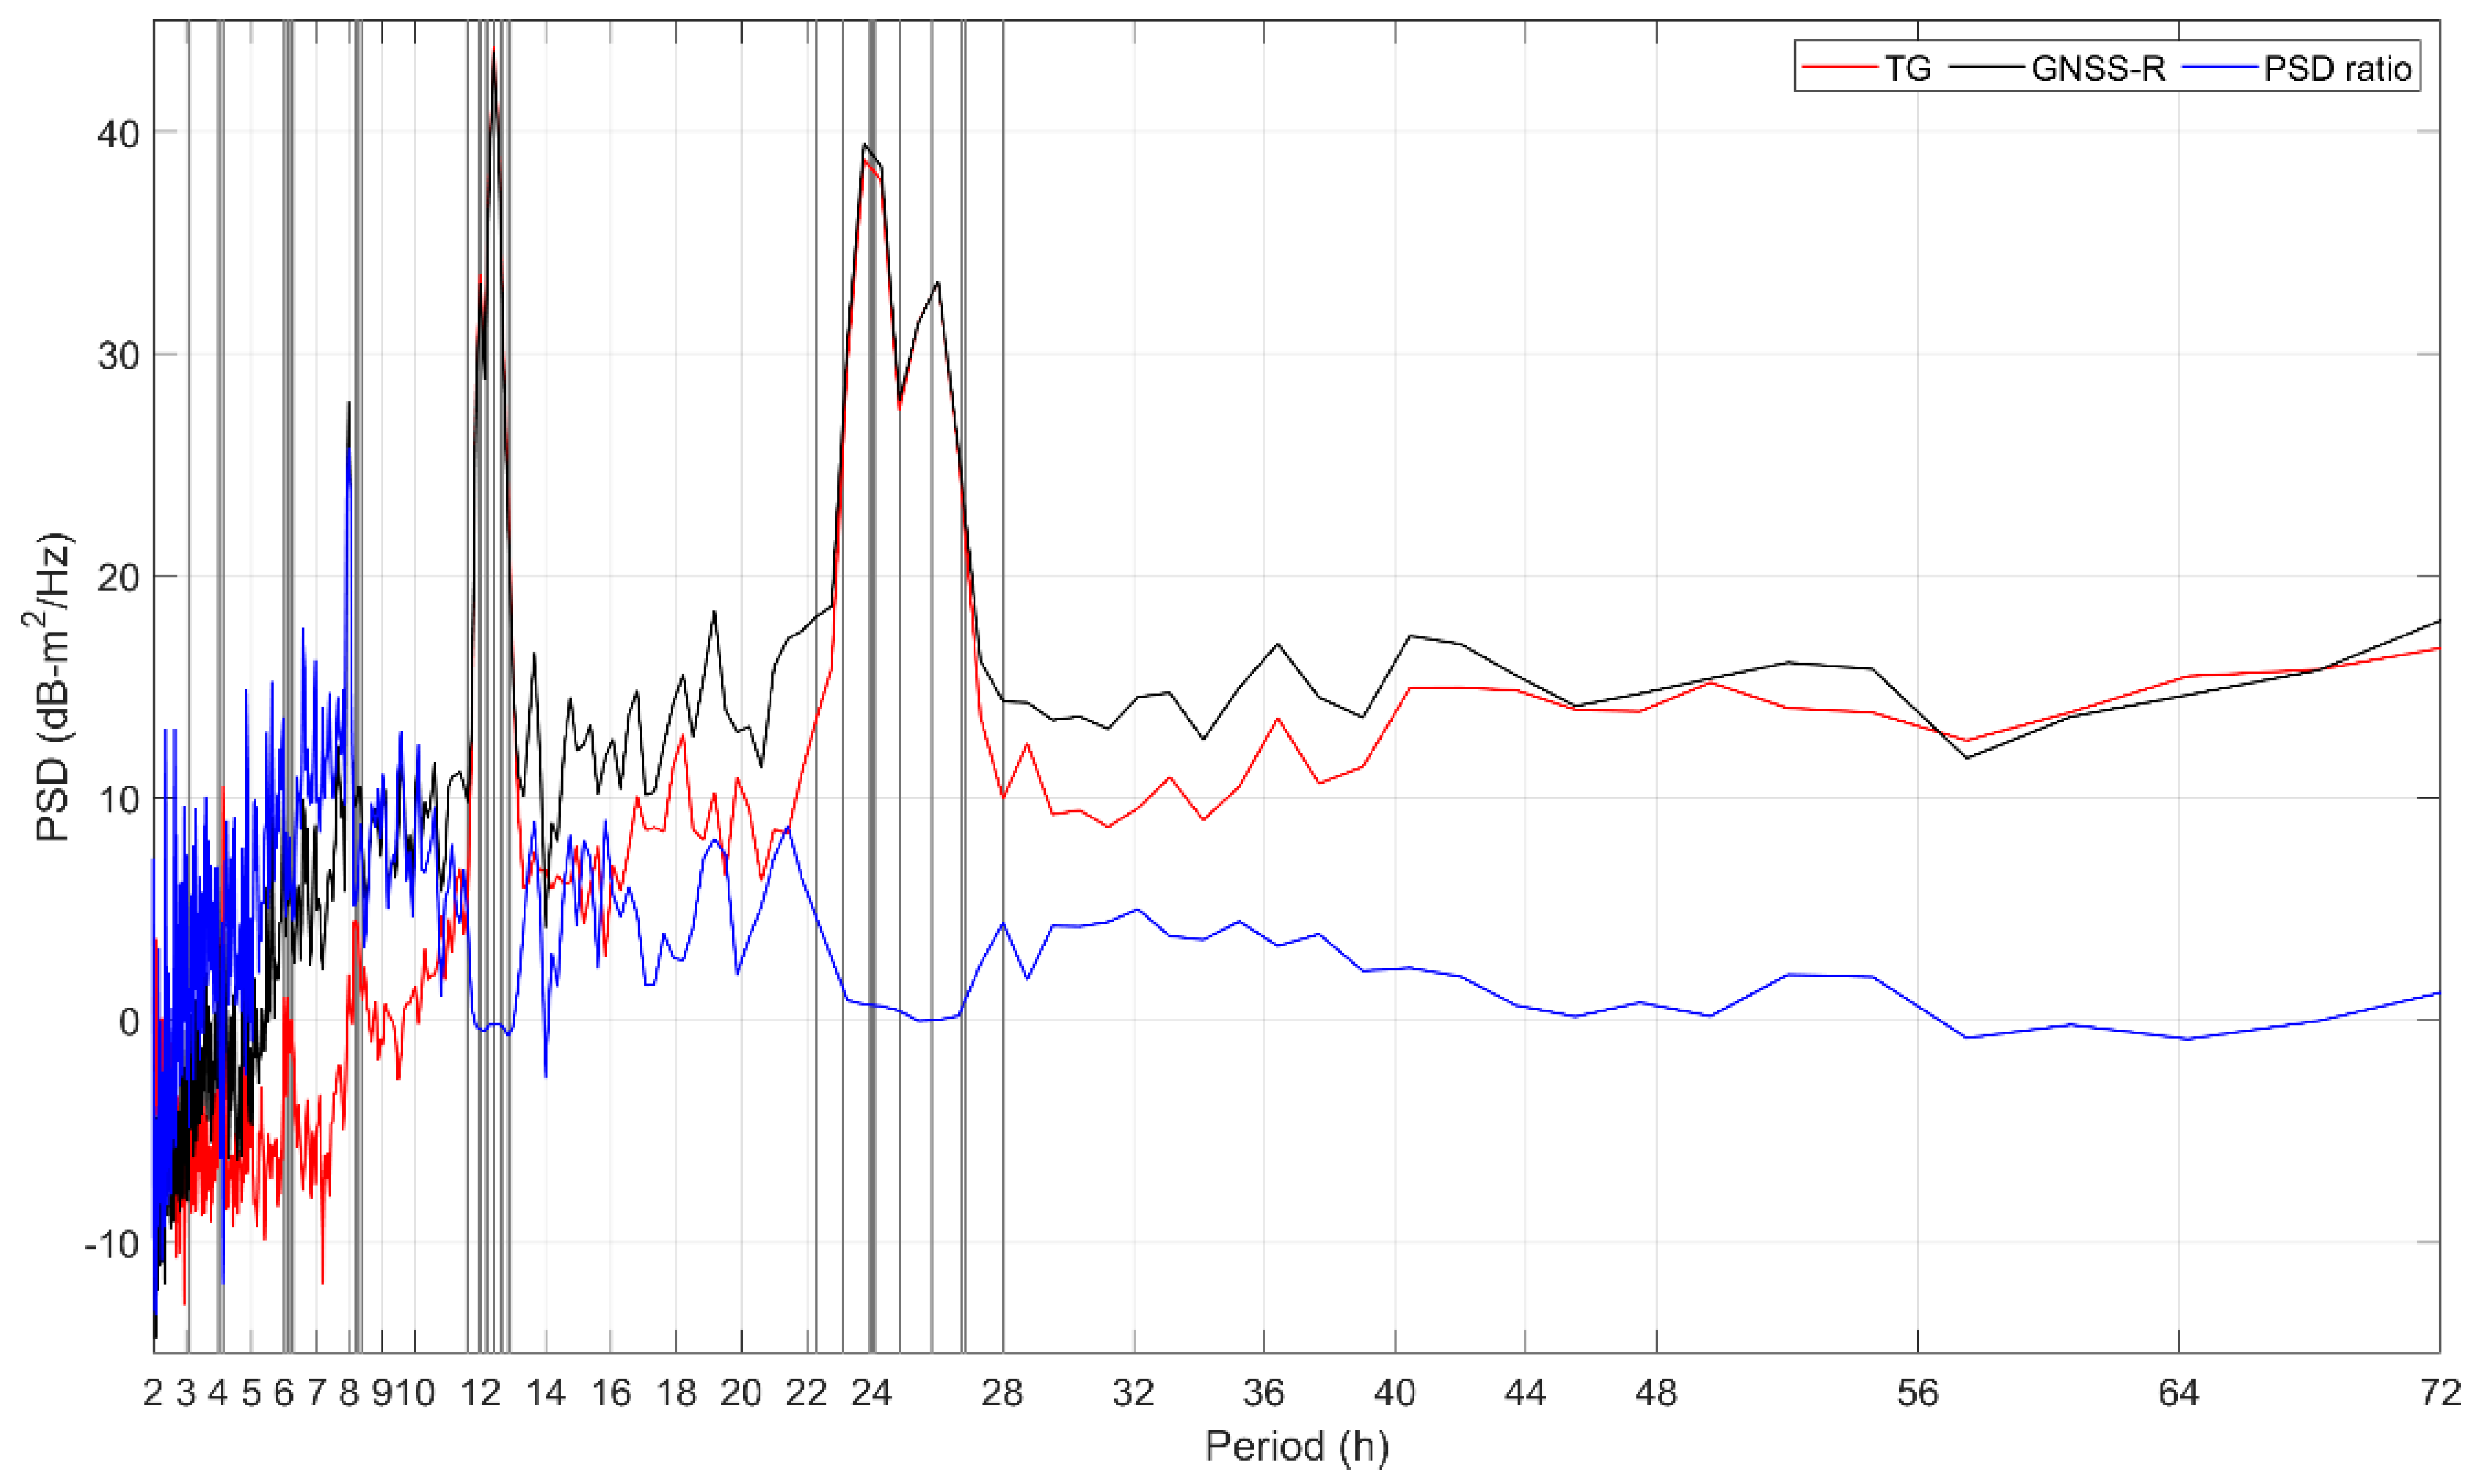
The OTT RLS records and GNSS-R sea levels are band-pass filtered, employing a 3-h, 4-h, 6 h, 12-h, and 24-h window. The results of each band are summarized in Table 1. On one hand, the slope deviation and correlation are worse for the highest frequency region (3-h). On the other hand, the performance of GNSS-R in periods greater than 6-h is good, and tidal variations are well captured by geodetic GNSS-R (Figure 7). This is due to the temporal resolution of the geodetic GNSS-R retrievals and can be improved either by using other GNSS constellations such as GALILEO or increasing the reflector height above the mean sea level.
Based on the length of the sea level time series, the amplitudes and phases of a set of harmonic tide components are determined based on [34] (Table 2). The complex differences between the OTT RLS records and GNSS-R sea levels for all the eight major tidal constituents are in mm-level agreement. Systematic biases for GNSS-R–derived luni-solar diurnal, principal solar, and luni-solar semidiurnal components were correlated with the GPS orbital period [9,11]. Here, the systematic effect is cancelled out using GLONASS, with an 11.25 h orbital period.

6. Absolute Sea Level Altimetry

Double-differenced GPS phase observables are processed using GAMIT/GLOBK software version 10.71 [35] in order to estimate daily GNSS station position in the International Terrestrial Reference Frame 2014 (ITRF2014) [36]. The POPR GNSS station, together with 18 permanent GNSS stations in Haiti and 26 GNSS stations in the Dominican Republic, are processed. The GNSS network in Haiti is operated by the National Center for Geospatial Information (CNIGS) and the Interministerial Committee for territorial development (CIAT) of Haiti; the GNSS data from the Dominican Republic are publicly available through UNAVCO. A total of 34 core GNSS stations of the International GPS Service for Geodynamics (IGS) served as ties with ITRF2014. Precise satellite orbits from the IGS and 30-s RINEX files using a 10-degree elevation cutoff angle are processed.
The Earth orientation parameters from the International Earth Rotation and Reference Systems Service (IERS) are considered. Corrections for solid Earth tides and pole tides are applied following the IERS conventions 2010 [37]. The Global Pressure and Temperature (GPT) model and Vienna Mapping function (VMF1) are used as a priori troposphere model to calculate hydrostatic and wet tropospheric delays [38]. The igs08× model of phase center variations and offsets is applied to correct azimuth-dependent and elevation-dependent absolute phase center variations [39]. Ocean tide loading is corrected for each station using the global FES2004 model [40]. We also applied corrections for the atmospheric pressure tide loading and the atmospheric pressure loading [41].
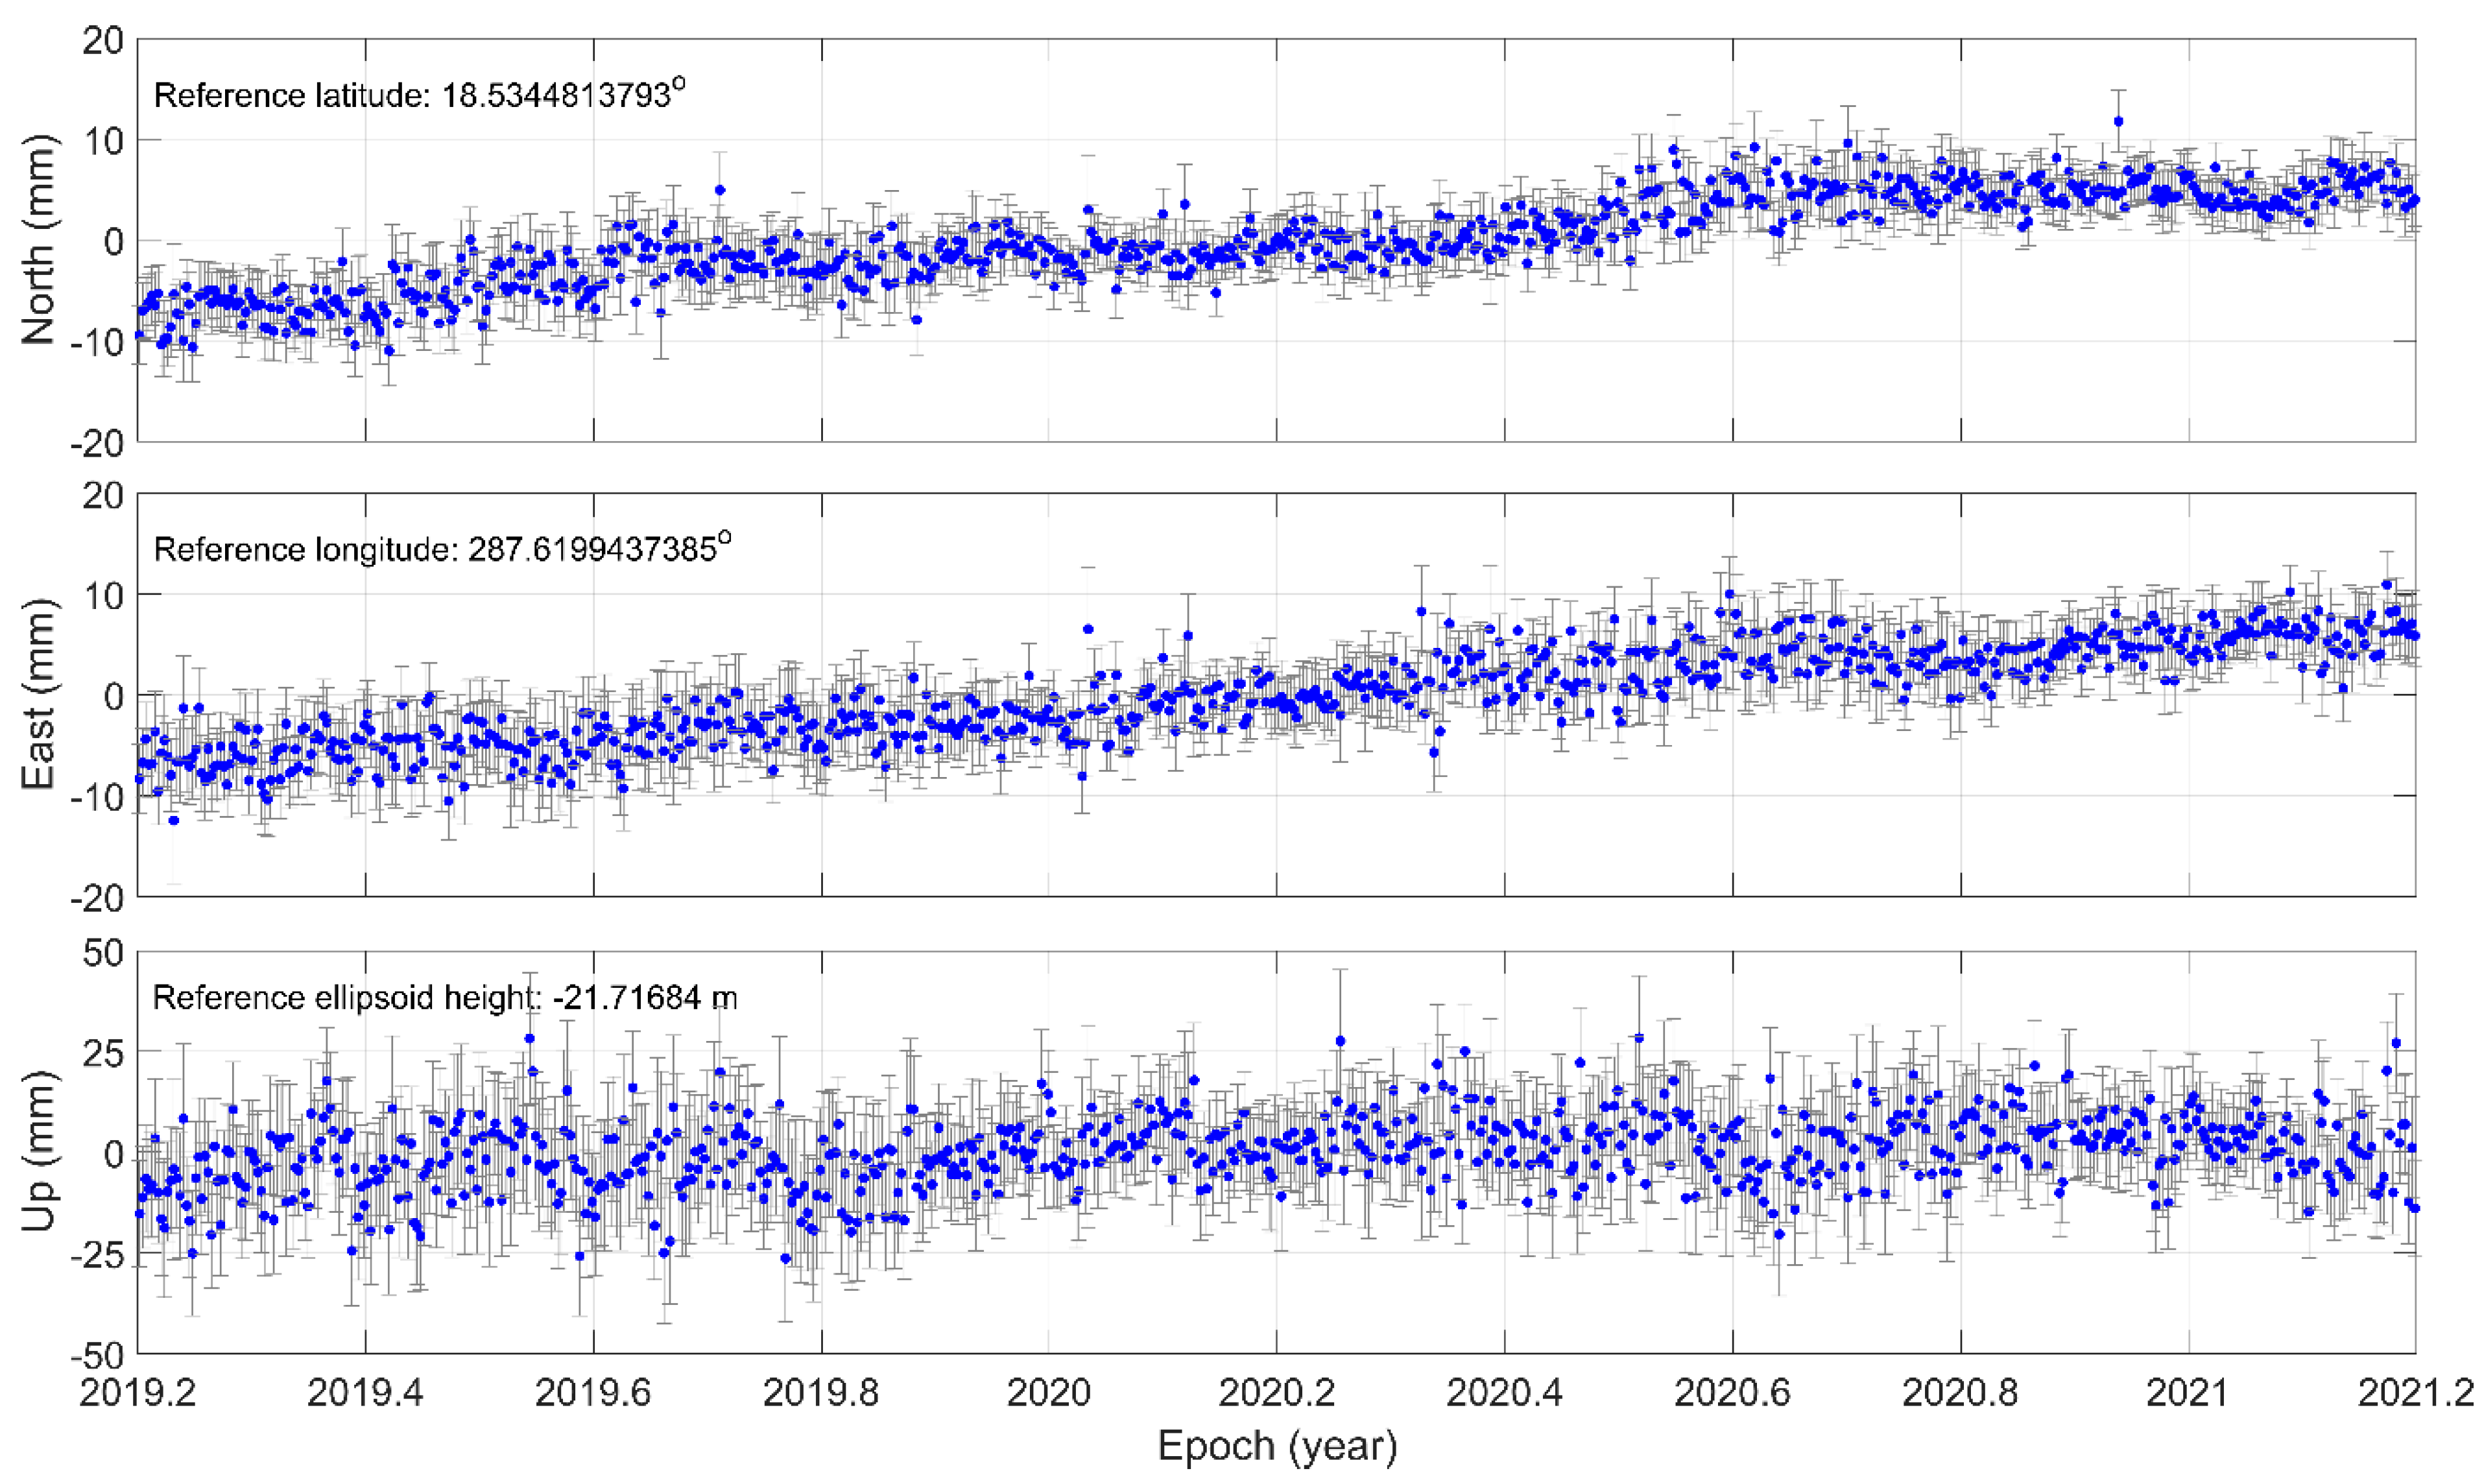
The GLOBK software package is used to generate daily station positions in ITRF2014 of the 79 stations used in this analysis [42]. The POPR coordinates are shown in Figure 8. The Median Interannual Difference Adjusted for Skewness (MIDAS) is used to automatically estimate the velocities from the GNSS coordinate time series [43]. The north, east, and up velocities at the POPR GNSS station are 6.45 mm / yr ± 0.63 mm / yr , 7.12 mm / yr ± 0.70 mm / yr , and 5.35 mm / yr ± 2.92 mm / yr , respectively, discarding outliers greater than two standard deviations.
The APC relative to the ARP was corrected in both GNSS-R inversion and GNSS coordinate time series analysis. Therefore, the absolute sea level in ITRF2014 could be retrieved (Figure 9). Three types of measurements—tide gauge records, GNSS coordinate time series, and levelling observations from the GNSS station to the tide gauge sensor—are conventionally needed to study sea level changes. Here, geodetic GNSS-R recording simultaneously LOS and non-LOS sea surface reflections using a COTS GNSS receiver and an upright antenna provided sea levels in a stable terrestrial reference frame. This could be helpful, especially for locations such as polar regions where conventional observing methods are difficult [44]. In addition, geodetic GNSS-R would provide sea level monitoring with neither the tide gauge senor nor levelling observations.

7. Conclusions

The Signal-to-Noise Ratio (SNR) observations from a GNSS station installed at the Haiti Coast Guard Base in Port-au-Prince is used to retrieve sea levels in the Caribbean Sea. GNSS-R sea levels are corrected for tropospheric delay and the dynamic state of the sea surface in the post-inversion processing. The geodetic GNSS-R sea levels are highly correlated with those of the collocated OTT radar level sensor installed vertically below the GNSS antenna, with a correlation coefficient exceeding 0.96.
Due to the temporal resolution of the geodetic GNSS-R, the performance of geodetic GNSS-R capturing tidal variations is good above 6-h periods. A mm-level agreement for the eight major tidal constituents from the 15-min geodetic GNSS-R retrievals employing an 8-h moving window and OTT radar records is found.
The GNSS coordinate time series at the POPR tide gauge station are estimated using GAMIT/GLOBK software. The GNSS-R–derived sea levels are corrected for the Antenna Phase Center (APC) relative to the Antenna Reference Point (ARP) in order to retrieve sea levels in the International Terrestrial Reference Frame 2014. Therefore, sub-daily sea levels at the Port-au-Prince tide gauge station are reported in ITRF 2014.
In the future, we plan to include other navigation signals from the European Galileo and the Chinese BeiDou to improve the temporal resolution of geodetic GNSS-R sea levels. Furthermore, we will investigate the bias in the GNSS-R sea levels by conducting research to calibrate the radar level sensor.

Author Contributions

Conceptualization, S.T.; methodology, S.T.; software, S.T.; validation, S.T. and O.F.; formal analysis, S.T. and R.S.; investigation, S.T.; resources, S.T., R.S., K.G., G.M. and O.F.; data curation, S.T. and R.S.; writing—original draft preparation, S.T. and R.S.; writing—review and editing, S.T.; visualization, S.T.; project administration, O.F. All authors have read and agreed to the published version of the manuscript.

Funding

This research was carried out at the Geophysics Laboratory of the University of Luxembourg and received no external funding.

Institutional Review Board Statement

Not applicable.

Informed Consent Statement

Not applicable.

Data Availability Statement

The data from the tide gauge in the Haiti Coast Guard Base Port-au-Prince is publicly available from the IOC. GNSS raw data are available from University of Luxembourg.

Acknowledgments

We would like to thank Gilbert Klein and Marc Seil from the University of Luxembourg, Becker Jean Neptune from CNIGS, and Karl-Henry Victor from the State University of Haiti for technical support on the project. We thank F.G. Nievinski for the valuable discussions.

Conflicts of Interest

The authors declare no conflict of interest.

References

  1. Misra, P.; Enge, P. Global Positioning System: Signals, Measurements, and Performance; Ganga-Jamuna Press: Lincoln, MA, USA, 2011. [Google Scholar]
  2. Gao, Z.; Ge, M.; Li, Y.; Shen, W.; Zhang, H.; Schuh, H. Railway irregularity measuring using Rauch–Tung–Striebel smoothed multi-sensors fusion system: Quad-GNSS PPP, IMU, odometer, and track gauge. GPS Solut. 2018, 22, 36. [Google Scholar] [CrossRef]
  3. Liu, W.; Shi, X.; Zhu, F.; Tao, X.; Wang, F. Quality analysis of multi-GNSS raw observations and a velocity-aided positioning approach based on smartphones. Adv. Space Res. 2019, 63, 2358–2377. [Google Scholar] [CrossRef]
  4. Kavak, A.; Vogel, W.; Xu, G. Using GPS to measure ground complex permittivity. Electron. Lett. 1998, 34, 254–255. [Google Scholar] [CrossRef]
  5. Larson, K.; Löfgren, J.; Haas, R. Coastal sea level measurements using a single geodetic GPS receiver. Adv. Space Res. 2013, 51, 1301–1310. [Google Scholar] [CrossRef] [Green Version]
  6. Larson, K.; Ray, R.D.; Geremia-Nievinski, F.; Freymueller, J. The Accidental Tide Gauge: A GPS Reflection Case Study from Kachemak Bay, Alaska. IEEE Geosci. Remote Sens. Lett. 2013, 10, 1200–1204. [Google Scholar] [CrossRef] [Green Version]
  7. Löfgren, J.S.; Haas, R.; Scherneck, H.-G. Sea level time series and ocean tide analysis from multipath signals at five GPS sites in different parts of the world. J. Geodyn. 2014, 80, 66–80. [Google Scholar] [CrossRef] [Green Version]
  8. Larson, K.M.; Ray, R.D.; Williams, S. A 10-Year Comparison of Water Levels Measured with a Geodetic GPS Receiver versus a Conventional Tide Gauge. J. Atmos. Ocean. Technol. 2017, 34, 295–307. [Google Scholar] [CrossRef] [Green Version]
  9. Tabibi, S.; Geremia-Nievinski, F.; Francis, O.; van Dam, T. Tidal analysis of GNSS reflectometry applied for coastal sea level sensing in Antarctica and Greenland. Remote Sens. Environ. 2020, 248, 111959. [Google Scholar] [CrossRef]
  10. Tabibi, S.; Francis, O. Can GNSS-R Detect Abrupt Water Level Changes? Remote Sens. 2020, 12, 3614. [Google Scholar] [CrossRef]
  11. Geremia-Nievinski, F.; Hobiger, T.; Haas, R.; Liu, W.; Strandberg, J.; Tabibi, S.; Vey, S.; Wickert, J.; Williams, S. SNR-based GNSS reflectometry for coastal sea-level altimetry: Results from the first IAG inter-comparison campaign. J. Geod. 2020, 94, 1–15. [Google Scholar] [CrossRef]
  12. Fagundes, M.A.R.; Mendonça-Tinti, I.; Iescheck, A.L.; Akos, D.M.; Geremia-Nievinski, F. An open-source low-cost sensor for SNR-based GNSS reflectometry: Design and long-term validation towards sea-level altimetry. GPS Solut. 2021, 25, 73. [Google Scholar] [CrossRef]
  13. Calais, E.; Symithe, S.; de Lépinay, B.M.; Prépetit, C. Plate boundary segmentation in the northeastern Caribbean from geodetic measurements and Neogene geological observations. Comptes Rendus Geosci. 2016, 348, 42–51. [Google Scholar] [CrossRef]
  14. GFDRR Climate Risk and Adaptation Country Profile: Haiti. Available online: https://www.gfdrr.org/en/publication/climate-risk-and-adaptation-country-profile-haiti (accessed on 26 August 2021).
  15. World Bank Rapidly Assessing the Impact of Hurricane Matthew in Haiti. World Bank. Available online: https://www.worldbank.org/en/results/2017/10/20/rapidly-assessing-the-impact-of-hurricane-matthew-in-haiti (accessed on 26 August 2021).
  16. Intergovernmental Panel on Climate. Small Islands. In Climate Change 2014—Impacts, Adaptation and Vulnerability: Part B: Regional Aspects: Working Group II Contribution to the IPCC Fifth Assessment Report; Cambridge University Press: Cambridge, UK, 2014; pp. 1613–1654. [Google Scholar]
  17. Hristov, H.D. Fresnal Zones in Wireless Links, Zone Plate Lenses and Antennas, 1st ed.; Artech House, Inc.: Norwood, MA, USA, 2000. [Google Scholar]
  18. Larson, K.M.; Geremia-Nievinski, F. GPS snow sensing: Results from the EarthScope Plate Boundary Observatory. GPS Solut. 2012, 17, 41–52. [Google Scholar] [CrossRef]
  19. Geremia-Nievinski, F.; Larson, K. Inverse Modeling of GPS Multipath for Snow Depth Estimation—Part I: Formulation and Simulations. IEEE Trans. Geosci. Remote Sens. 2014, 52, 6555–6563. [Google Scholar] [CrossRef]
  20. Nievinski, F.G.; Larson, K.M. Forward modeling of GPS multipath for near-surface reflectometry and positioning applications. GPS Solut. 2013, 18, 309–322. [Google Scholar] [CrossRef]
  21. Beckmann, P.; Spizzichino, A. The Scattering of Electromagnetic Waves from Rough Surfaces; Artech House, Inc.: Norwood, MA, USA, 1987; p. 511. [Google Scholar]
  22. Tabibi, S.; Nievinski, F.G.; van Dam, T.; Monico, J.F. Assessment of modernized GPS L5 SNR for ground-based multipath reflectometry applications. Adv. Space Res. 2014, 55, 1104–1116. [Google Scholar] [CrossRef] [Green Version]
  23. Georgiadou, P.Y.; Kleusberg, A. On carrier signal multipath effects in relative GPS positioning. Manuscrip-Ta Geod. 1988, 13, 172–179. [Google Scholar]
  24. Tabibi, S.; Geremia-Nievinski, F.; Van Dam, T. Statistical Comparison and Combination of GPS, GLONASS, and Multi-GNSS Multipath Reflectometry Applied to Snow Depth Retrieval. IEEE Trans. Geosci. Remote Sens. 2017, 55, 3773–3785. [Google Scholar] [CrossRef]
  25. Geremia-Nievinski, F.; Larson, K. Inverse Modeling of GPS Multipath for Snow Depth Estimation—Part II: Application and Validation. IEEE Trans. Geosci. Remote. Sens. 2014, 52, 6564–6573. [Google Scholar] [CrossRef]
  26. Nikolaidou, T.; Santos, M.C.; Williams, S.D.P.; Geremia-Nievinski, F. Raytracing atmospheric delays in ground-based GNSS reflectometry. J. Geod. 2020, 94, 1–12. [Google Scholar] [CrossRef]
  27. Landskron, D.; Böhm, J. VMF3/GPT3: Refined discrete and empirical troposphere mapping functions. J. Geod. 2017, 92, 349–360. [Google Scholar] [CrossRef]
  28. Williams, S.D.P.; Nievinski, F.G. Tropospheric delays in ground-based GNSS multipath reflectometry-Experimental evidence from coastal sites. J. Geophys. Res. Solid Earth 2017, 122, 2310–2327. [Google Scholar] [CrossRef] [Green Version]
  29. Garrison, J.; Zavorotny, V.U.; Egido, A.; Nievinski, F.G.; Martin, F.; Mollfulleda, A.; Ruffini, G.; Garrison, J.; Larson, K.M. GNSS Reflectometry for Earth Remote Sensing. In Position, Navigation, and Timing Technologies in the 21st Century; John Wiley & Sons, Ltd.: New York, NY, USA, 2020; pp. 1015–1114. [Google Scholar]
  30. Rebischung, P.; Schmid, R. IGS14/igs14.atx: A new Framework for the IGS Products. In Proceedings of the AGU Fall Meeting, San Francisco, CA, USA, 12–16 December 2016. [Google Scholar]
  31. Bradshaw, E.; Rickards, L.; Aarup, T. Sea level data archaeology and the Global Sea Level Observing System (GLOSS). GeoResJ 2015, 6, 9–16. [Google Scholar] [CrossRef] [Green Version]
  32. S12C SDI-12 Seawater Pressure & Temperature Transducer. Available online: https://www.sensorsone.com/s12c-sdi-12-seawater-pressure-and-temperature-transducer/ (accessed on 24 June 2021).
  33. OTT RLS—Radar Level Sensor—OTT Hydromet. Available online: https://www.ott.com/products/water-level-1/ott-rls-radar-level-sensor-861/ (accessed on 22 June 2021).
  34. Foreman, M.; Henry, R. The harmonic analysis of tidal model time series. Adv. Water Resour. 1989, 12, 109–120. [Google Scholar] [CrossRef]
  35. Herring, T.A.; King, R.W.; Floyd, M.A.; McClusky, S.C. GAMIT Reference Manual Release 10.7; Massachusetts Institute of Technology: Cambridge, MA, USA, 2018. [Google Scholar]
  36. Altamimi, Z.; Rebischung, P.; Métivier, L.; Collilieux, X. ITRF2014: A new release of the International Terrestrial Reference Frame modeling nonlinear station motions. J. Geophys. Res. Solid Earth 2016, 121, 6109–6131. [Google Scholar] [CrossRef] [Green Version]
  37. Petit, G.; Luzum, B. IERS Conventions; Verlag des Bundesamts für Kartographie und Geodäsie: Frankfurt am Main, Germany, 2010; 179p, ISBN 3-89888-989-6. [Google Scholar]
  38. Boehm, J.; Niell, A.; Tregoning, P.; Schuh, H. Global Mapping Function (GMF): A new empirical mapping function based on numerical weather model data. Geophys. Res. Lett. 2006, 33. [Google Scholar] [CrossRef] [Green Version]
  39. Schmid, R.; Steigenberger, P.; Gendt, G.; Ge, M.; Rothacher, M. Generation of a consistent absolute phase-center correction model for GPS receiver and satellite antennas. J. Geod. 2007, 81, 781–798. [Google Scholar] [CrossRef] [Green Version]
  40. Lyard, F.; Lefevre, F.; Letellier, T.; Francis, O. Modelling the global ocean tides: Modern insights from FES2004. Ocean Dyn. 2006, 56, 394–415. [Google Scholar] [CrossRef]
  41. Tregoning, P.; Van Dam, T. Atmospheric pressure loading corrections applied to GPS data at the observation level. Geophys. Res. Lett. 2005, 32. [Google Scholar] [CrossRef] [Green Version]
  42. Herring, T.A.; King, R.W.; Floyd, M.A.; McClusky, S.C. GLOBK Reference Manual Release 10.6; Massachusetts Institute of Technology: Cambridge, MA, USA, 2018. [Google Scholar]
  43. Blewitt, G.; Kreemer, C.; Hammond, W.C.; Gazeaux, J. MIDAS robust trend estimator for accurate GPS station velocities without step detection. J. Geophys. Res. Solid Earth 2016, 121, 2054–2068. [Google Scholar] [CrossRef] [PubMed]
  44. Intergovernmental Oceanographic Commission. Workshop on Sea-Level Measurements in Hostile Conditions, Moscow, Russian Federation, 13–15 March 2018; UNESCO: Paris, France, 2018; 28p. [Google Scholar]
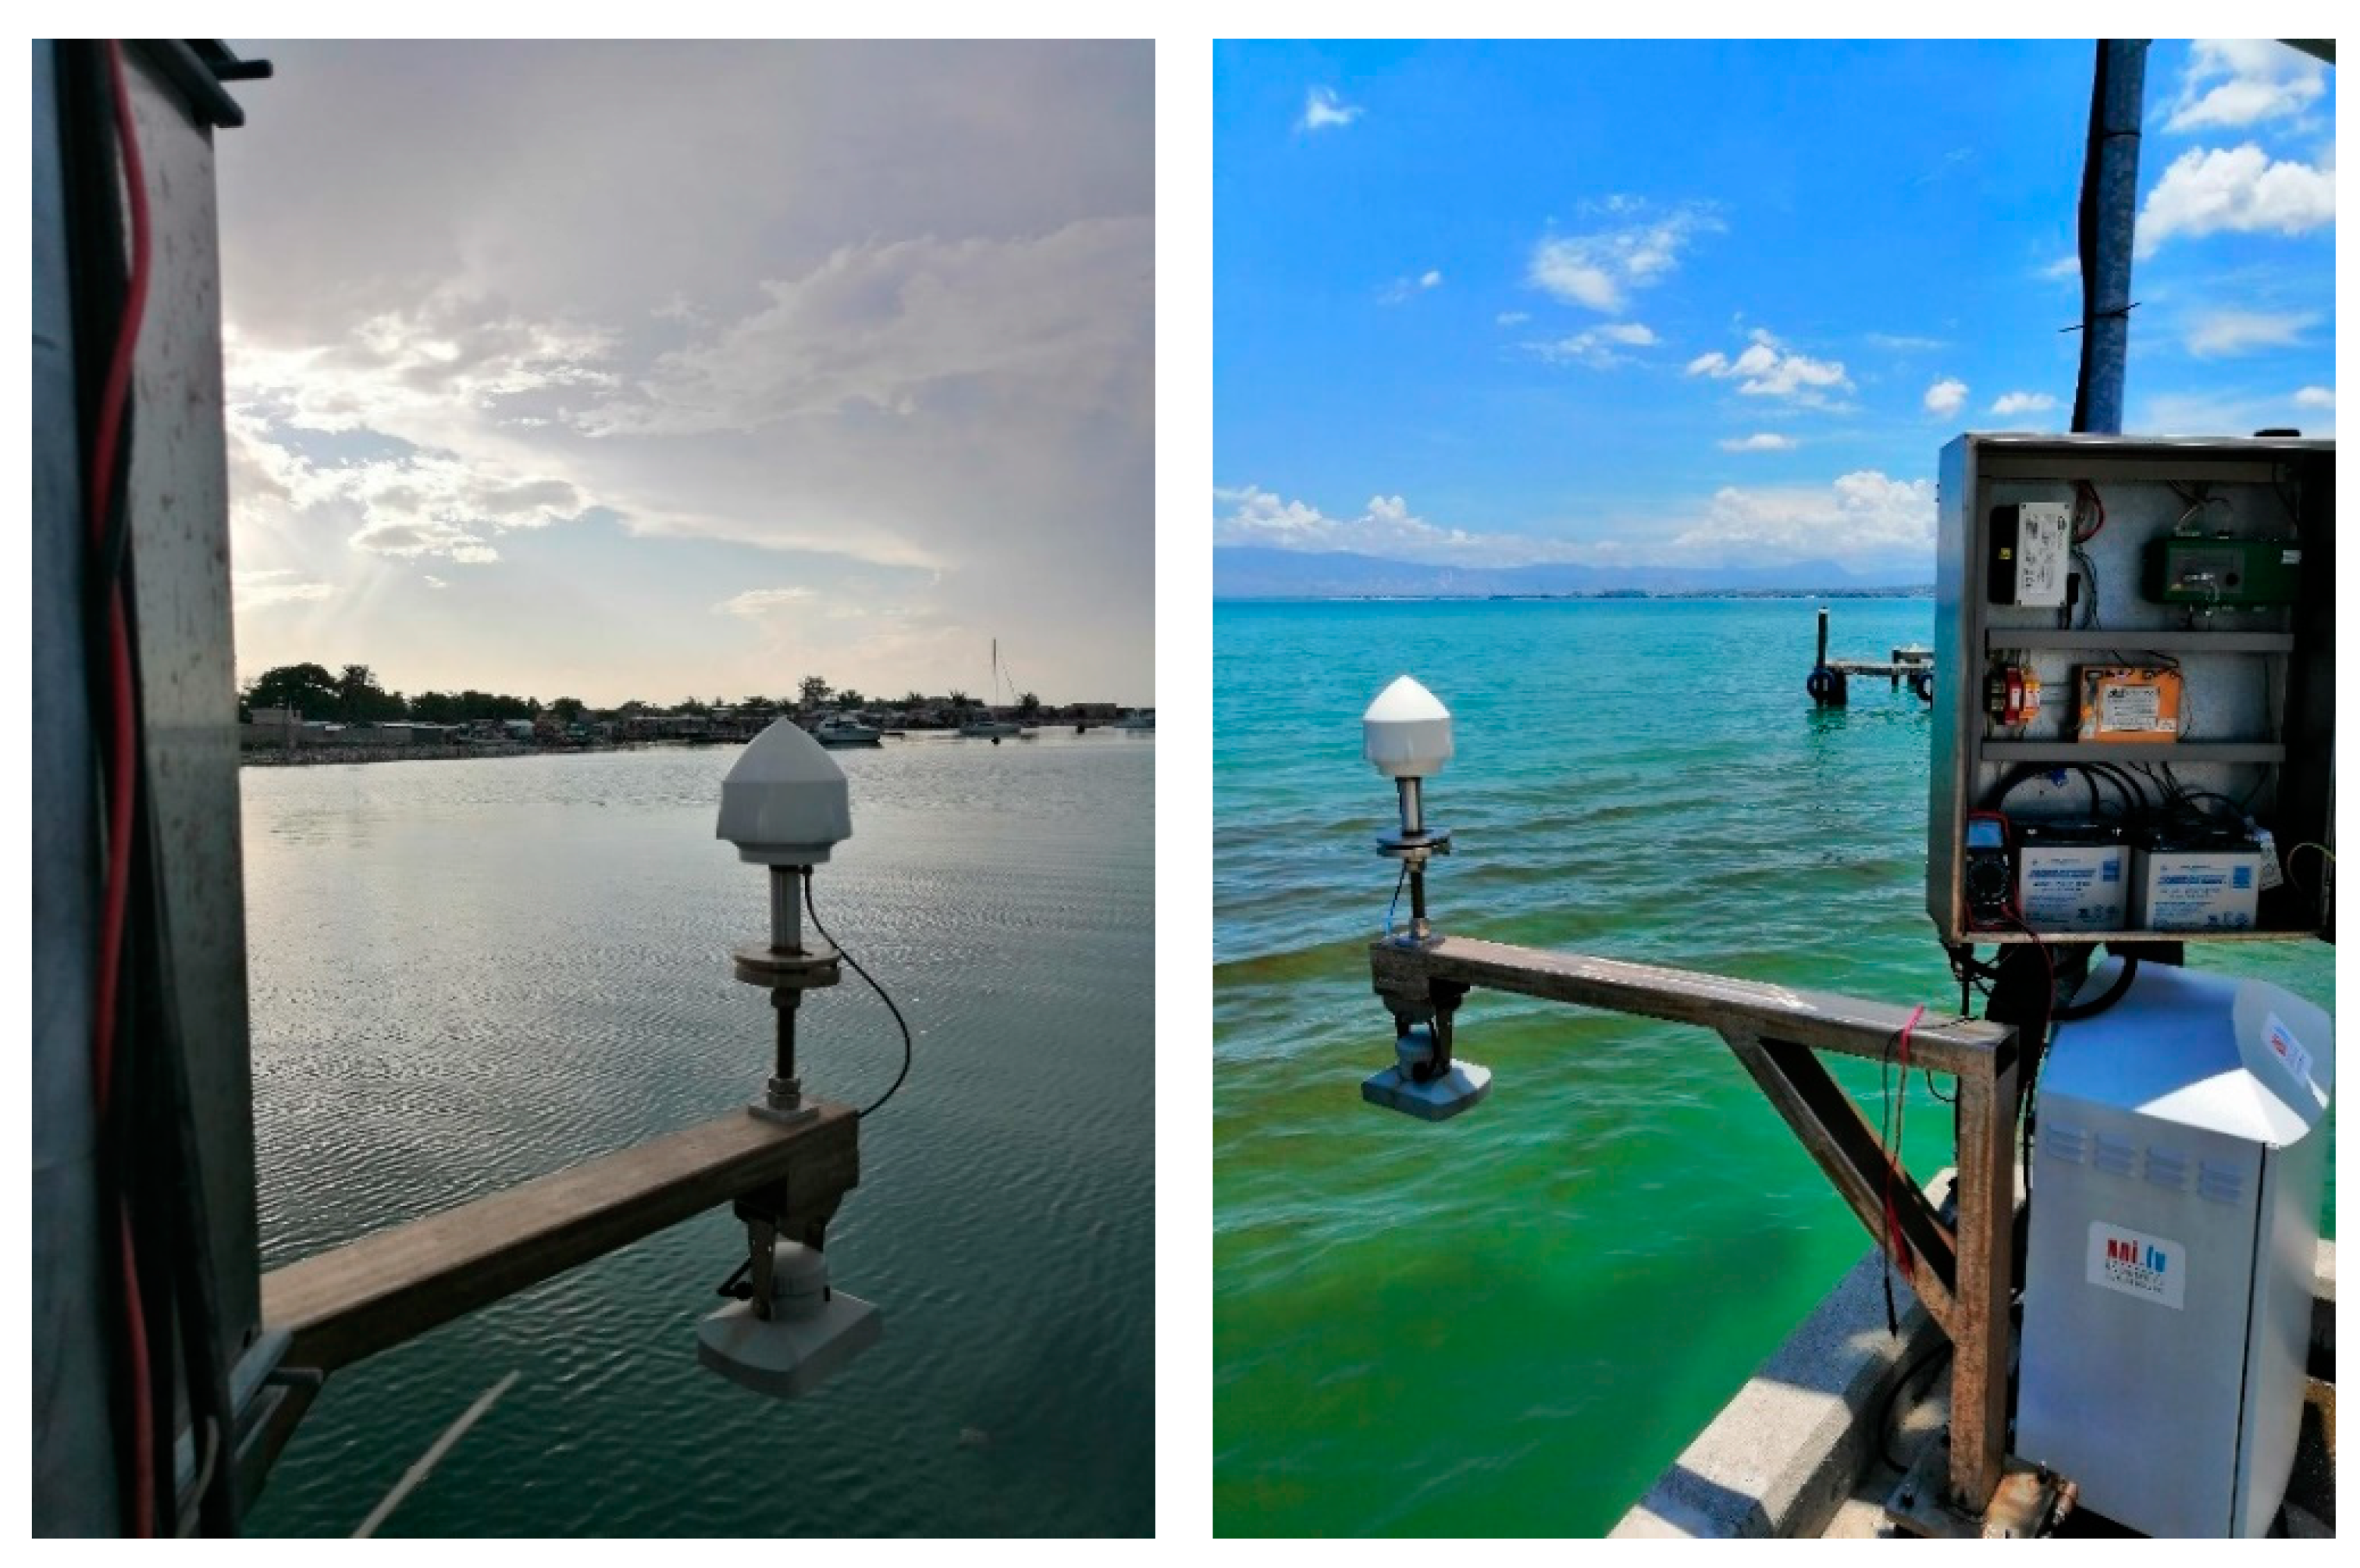
Figure 1. Tide gauge station at the Haiti Coast Guard Base in Port-au-Prince in the northwest (left panel) and northeast (right panel) directions.
Geosciences 11 00391 g001
Figure 2. Occurrences of FFZs in January 2021 at the POPR. Each color depicts a GNSS satellite, and the location of the Port-au-Prince tide gauge station is shown as a yellow pin.
Geosciences 11 00391 g002
Figure 3. Geometry of a geodetic GNSS-R in vacuum. The red lines show excess path delay traveled by the sea-surface reflection relative to the direct signal (blue).
Geosciences 11 00391 g003
Figure 4. Relative reflector height retrieved by GNSS-R at Port-au-Prince tide gauge station.
Geosciences 11 00391 g004
Figure 5. OTT RLS records and GNSS-R sea level retrievals at Port-au-Prince tide gauge station.
Geosciences 11 00391 g005
Figure 6. Scatterplot of sea levels shows an excellent agreement between OTT RLS records and GNSS-R sea level retrievals (left panel). Van de Casteele diagram shows no systematic errors between the two sensors at the Port-au-Prince tide gauge station (right panel).
Geosciences 11 00391 g006
Figure 7. Power spectral density distribution of OTT RLS records (red) and GNSS-R sea level (blue). Tidal constituents are shown as blue vertical lines.
Geosciences 11 00391 g007
Figure 8. Position time series at Port-au-Prince GNSS station.
Geosciences 11 00391 g008
Figure 9. Absolute sub-hourly sea level at the Haiti Coast Guard Base in Port-au-Prince.
Geosciences 11 00391 g009
Table 1. Statistics of OTT RLS records and GNSS-R sea level retrievals for each band.
3-h4-h6-h12-h24-h
Correlation0.430.660.940.970.97
RMSE (cm)1.812.282.743.103.17
Slope deviation ( m / m ) 0.66 ±   0.03 0.36 ±   0.04 0.08 ±   0.02 0.03 ±   0.02 0.02 ±   0.02
Table 2. Eight major tidal constituents at Port-au-Prince tide gauge station.
WavePeriod (h)OTT RLSGNSS-RVec. Diff (cm)
Amp. (cm)Phase (°)Amp. (cm)Phase (°)
Q 1 26.86830.43231.510.47229.140.04
O 1 25.81934.10214.624.09211.350.23
P 1 24.06582.81243.312.62240.670.23
K 1 23.93447.48232.848.25229.200.91
N 2 12.65833.1223.132.9521.490.19
M 2 12.420614.3534.2614.0332.850.47
S 2 12.00004.1851.463.9848.630.28
K 2 11.967236061.2948.821.3354.250.13
Publisher’s Note: MDPI stays neutral with regard to jurisdictional claims in published maps and institutional affiliations.