Article

Morphoneotectonics of the Abruzzo Periadriatic Area (Central Italy): Morphometric Analysis and Morphological Evidence of Tectonics Features

by
Enrico Miccadei
1,2,*,
Cristiano Carabella
1 and
Giorgio Paglia
1
1
Department of Engineering and Geology, Università degli Studi “G. d’Annunzio” Chieti-Pescara, Via dei Vestini 31, 66100 Chieti, Italy
2
Istituto Nazionale di Geofisica e Vulcanologia (INGV), Sezione Roma 1, Via di Vigna Murata 605, 00143 Rome, Italy
*
Author to whom correspondence should be addressed.
Geosciences 2021, 11(9), 397; https://doi.org/10.3390/geosciences11090397
Submission received: 25 June 2021 / Revised: 26 August 2021 / Accepted: 15 September 2021 / Published: 20 September 2021
(This article belongs to the Section Structural Geology and Tectonics)

Abstract

:
Drainage basin-scale morphometric analysis and morphological evidence of tectonics represent helpful tools to evaluate and investigate morphoneotectonic processes in tectonically active regions. In this perspective, we applied an integrated analysis to the Abruzzo Periadriatic Area, between the Tronto and Sinello rivers (Central Italy). It involved morphometric analysis, structural geomorphological field mapping, and detailed analysis of fluvial terraces. Geomorphic indexes and markers (e.g., Irta, SL index, ksn, and knickpoints) were used in this study to detect the response of landscapes to drainage systems’ unsteadiness and tectonic deformation processes, possibly induced by the ongoing activity of the buried tectonic structures. Furthermore, the investigation of morphological field evidence of tectonics, integrated with the analysis of fluvial terraces’ spatial and temporal arrangement, was performed to assign relative, geomorphologically-based, age constraints of the landscape evolution. The resulting data allowed us to define domains affected by different morphostructural and morphoneotectonic processes, related to the impact and ongoing activity of the five detected families of structural elements (S1, F1, F2, F3, and F4), mainly characterized by compressive, extensional, and transtensive kinematics. Finally, this study could represent a scientific basis for integrating morphometric, fluvial, and tectonic geomorphology analysis to better define the main phases of the landscape evolution and the impact of morphoneotectonic processes on fluvial environments in uplifting piedmont areas.

1. Introduction

The drainage basin-scale analysis and the investigation of morphological field evidence of tectonics provide insights for understanding both passive and active tectonic control prevailing in an area. Drainage networks evolve as dynamical systems, adjusting themselves in response to changes in the landscape, generally associated with tectonic activity [1,2]. Attempts to deduce tectonic information from landscape analyses have been performed for decades, e.g., [3,4,5,6,7,8,9,10], mostly concerning the quantitative measurement of the landscape through the calculation of geomorphic indexes using topographic maps or Digital Elevation Models (DEMs), aerial photographs or satellite imagery, and fieldwork. Moreover, in recent times, interactions between tectonics and drainage networks were widely investigated in natural examples [5,11,12,13,14,15,16,17,18,19], experimental modeling [20,21,22,23,24,25], and/or numerical modeling [26,27,28,29], and the rapid development of GIS techniques offered powerful and efficient tools to compute, calculate, and analyze geomorphic indexes across different geographical environments and scales of investigation, e.g., [30,31,32,33,34,35].
The Abruzzo Periadriatic Area is demarked by the eastern slope of the Apennine Chain, to the west, and the Adriatic Sea, to the east. Bedrock lithologies are constituted by siliciclastic deposits, pertaining to Plio–Pleistocene marine successions, unconformably overlain by a complex sequence of Upper Pleistocene–Holocene superficial continental deposits. In detail, the area is characterized by clayey–sandy and conglomeratic deposits related to the sin– and late–orogenic phases of the Central Apennines and by post-orogenic Quaternary continental deposits [36]. The present-day landscape configuration is the result of a long–term geomorphological evolution, controlled by the combination of different factors: Plio–Quaternary tectonics, regional uplift (connected to sub-lithospheric dynamics and responsible for the long-wavelength bulging of the Apennine chain—since Early Pleistocene), climate changes, and eustatic variations [37,38,39].
In such a tectonically active region, outcropping lithologies rarely preserve evidence of tectonic deformation; consequently, the morphometric analysis and the investigation of geomorphological features become significant tools in the assessment of the morphoneotectonic setting. In particular, morphological field evidence of tectonics (i.e., triangular facets, hanging and beheaded valleys, river bends, rectilinear fluvial segments, and 90° and counterflow confluences) outline the main morphotectonic features, even in areas where non-conservative lithologies (e.g., clays and sands) do not allow for a good in-field conservation of tectonic elements [40,41,42,43,44,45,46].
Previous studies highlighted the influence of neotectonics on the geomorphological development of this area [38,39,47,48,49,50,51,52,53,54,55]; however, most of them were carried out at a local scale, missing a geomorphological characterization at the drainage basin-scale. One of the first extensive studies, performed by Castiglioni [56], initially defined the main landscape features through detailed morphological analyses of the main fluvial valleys. Demangeot [57] described and identified a hilly relief landscape in the piedmont sectors, characterized by different levels of erosional surfaces and fluvial terraces, closely related to Quaternary climate changes. In the 1970s, the C.N.R. (Italian National Research Centre, Rome, Italy) project “Progetto Finalizzato Geodinamica (Neotectonic subproject)” was developed to analyze the area from a morphotectonic viewpoint. It discriminated landforms and related deposits that could be considered as evidence of tectonics [58]. Moreover, the foredeep–foreland system of the Abruzzo Region, belonging to the Adriatic petroleum province [59,60], is characterized by a complex geological–structural setting, as testified by deep-seated buried structures highlighted by the geophysical/geognostic investigations carried out within an extensive oil exploration since ‘70–‘80 [61].
Starting from this general framework, we selected this region to carry out a multidisciplinary analysis in order to better define its tectonic and morphoneotectonic evolution, by using a morphometric and geomorphological approach.
Several morphometric indexes have been involved and computed to support this kind of analysis, among which the Irta, SL index, and ksn seem to be the most helpful to identify tectonically-induced drainage systems’ unsteadiness/disequilibrium and tectonic deformation processes [7,62,63,64,65,66,67,68]. In detail, this work is based on the correlation of morphometric analysis of relief and drainage networks, investigation of morphological field evidence of tectonics, and analysis of the temporal and spatial arrangement of both erosional (e.g., knickpoint) and depositional (e.g., fluvial terraces) features within the lower reaches of the main drainage basins. Such an integrated approach helps to identify neotectonics lineaments and estimate their relative timing; in particular, fluvial terraces’ spatio-temporal distribution provides intriguing elements for the tectonic characterization of the study area, giving a chronological constraint to tectonic activity and uplift/incision rates at drainage basin-scale. The final aim of this work was to contribute to the study of the role played by active tectonics and uplift on fluvial environments in uplifting piedmont areas, characterized by Quaternary morphogenesis on erodible lithologies. The surface results may also provide a contribution to the geological hazard assessment by means of the comprehension of deep tectonic structures poorly evident but documented by recent active seismicity.

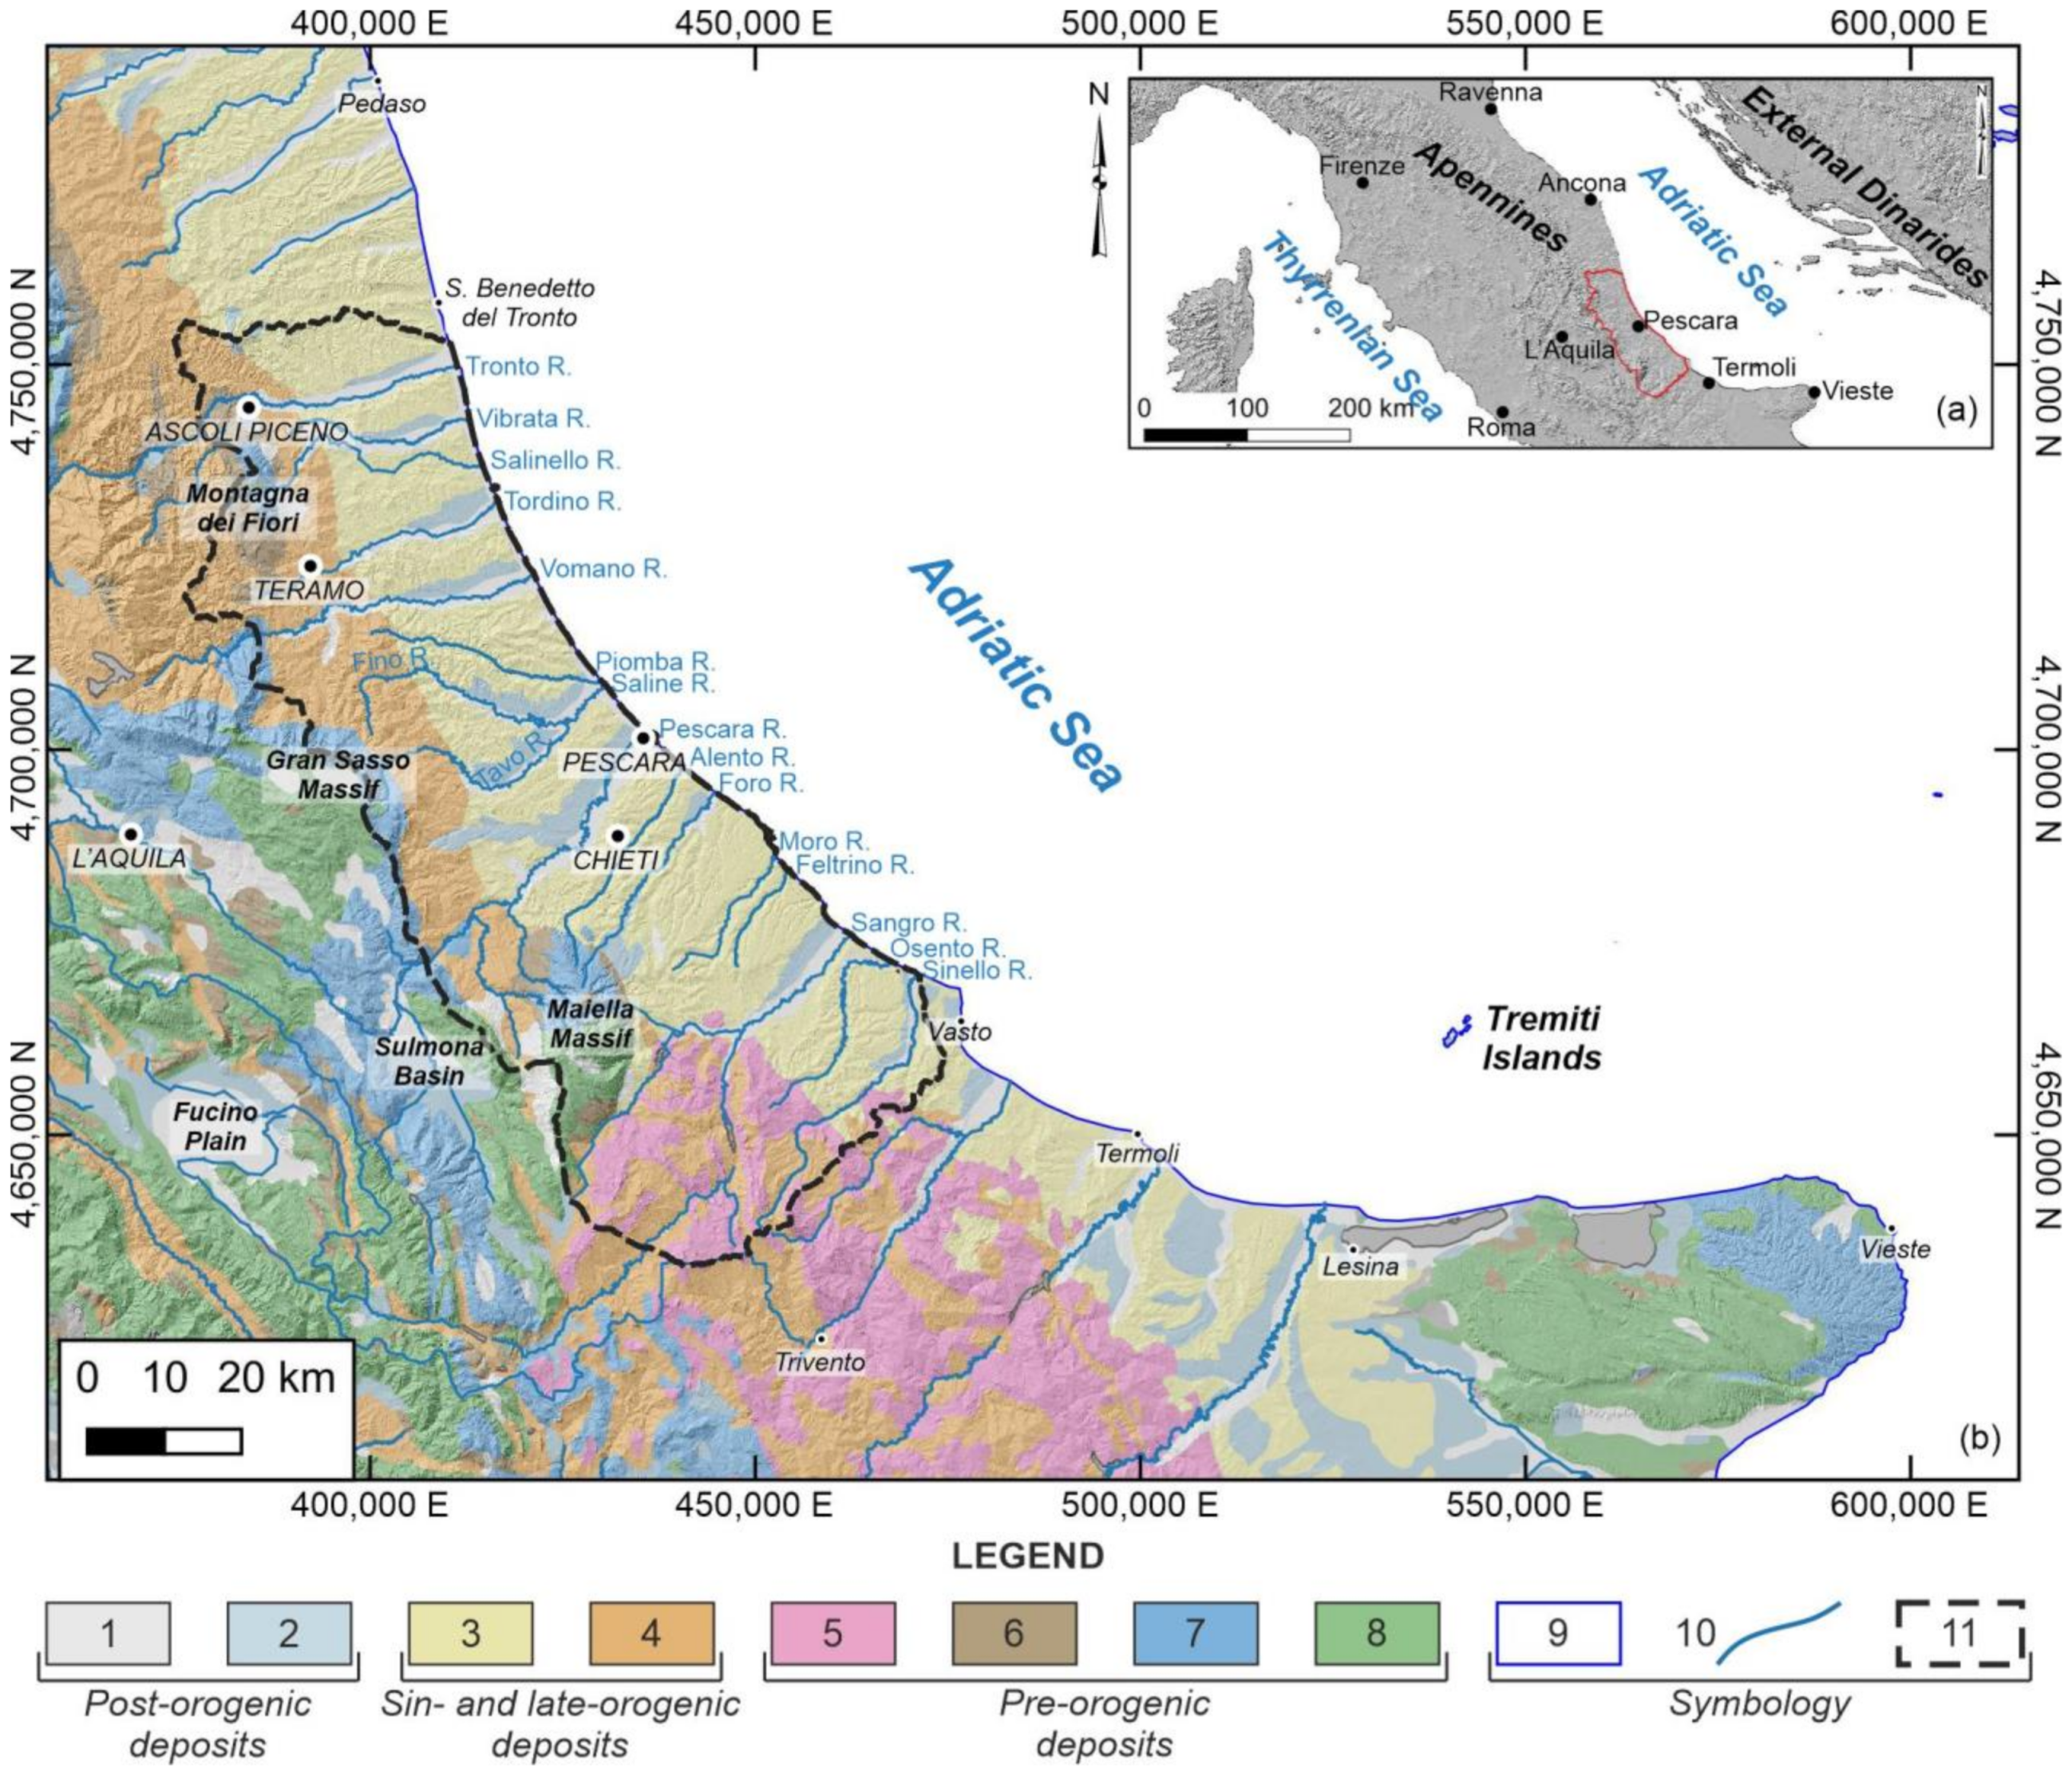
2. Geological, Seismotectonic, and Morphological Settings of the Study Area

The study area is framed in the central–eastern sector of the Italian peninsula, along with the Periadriatic Area of the Abruzzo Region (Figure 1a), between the Tronto and Sinello rivers. The general physiographic features are represented by the easternmost Apennine Chain’s mountainous landscape (with reliefs up to 2900 m a.s.l. high—i.e., Montagna dei Fiori, Gran Sasso Massif, and Maiella Massif; and intramontane basins—i.e., Fucino Plain and Sulmona Basin), which drops down to low relief areas (heights ranging from ~100 to 800 m a.s.l.) and coastal sectors, whose continuity is interrupted by urban areas and wide valleys. The study area includes the main fluvial valleys (mainly WSW–ENE-oriented) directly flowing towards the Adriatic Sea. In detail, the study area is located between the piedmont reliefs of the NE–verging Apennine orogen and the Adriatic continental shelf, mostly filled by sandy–silty depositional sequences [69,70,71,72,73] (Figure 1b).
Pre–orogenic deposits pertain to different Meso–Cenozoic palaeogeographical domains. Carbonate ramp and platform limestones, slope-to-pelagic limestones, and marls represent the backbone extending from Apennines’ ridges to Gargano Promontory, and clayey–marly allochthonous deposits characterize the eastern sectors of Molise Apennines [74,75]. Sin- and late-orogenic deposits belong to hemipelagic sequences (mainly clayey–sandy deposits), which unconformably overlay turbiditic foredeep sequences (mainly pelitic–arenaceous deposits) [49,76,77]. A complex sequence of post-orogenic Quaternary continental deposits is widely present in the alluvial valleys and plains. They mostly consist of fluvial, alluvial fan, and eluvial–colluvial deposits (Figure 1b). Fluvial deposits are organized in a sequence of at least four main orders of terraces, resulting from a strong interaction between the Quaternary tectonics, the lithostructural setting, and the high–frequency climatic oscillation [36,37,38,39,78].
The geological–structural evolution is closely connected with the Plio–Quaternary development of the Adriatic foredeep domain. In fact, the piedmont domain is characterized by the active external fronts of the fold-and-thrust belt, buried under clastic marine to transitional–continental sedimentary sequences [79,80,81,82,83,84,85]. Compressional tectonics, due to NW–SE- to N–S-oriented thrusts, affected the chain sector from the Late Miocene to the Early Pliocene. Strike–slip tectonics, along NW–SE- to NNW–SSE-oriented faults, followed this compressional phase, and it was largely masked by later extensional tectonics since the Early Pleistocene (Figure 2) [36,86,87].
The current morphostructural setting mainly reflects the articulated, tectonically controlled geomorphological evolution of the study area [86]. It is the result of dynamic regional uplift (with an average rate of about 0.2–1 mm/year [36,88]) and lowering phases, spanning from Pliocene to Quaternary [89,90]. Moving from the inland to the offshore areas, the chain, the piedmont–foredeep, and the foreland sectors were involved in impressive coeval and still active (Pliocene to Quaternary) processes of uplift, crustal shortening, and lowering, respectively (Figure 2). The resulting landscape is characterized by the presence of different landforms: the northern sector of the study area is mainly dominated by surface erosional–depositional (morphosculptural) processes with predominant fluvial and slope processes; on the other side, the southern sector (i.e., Maiella piedmont area) is characterized by the dominance of morphostructural landforms (such as mesa, cuesta, plateau, and hogback), shaped and incised by approximately SW–NE- and SSW–NNE-oriented consequent valleys, as well as by slope processes along their steep slopes (i.e., landslides) [39,40,87,91].
The present-day topographic setting is related to regional homoclines, gently dipping towards NE [92,93,94,95], modeled in consequence of the incision of major dip–stream and strike–stream valleys, and the formation of wide alluvial plains. It is highlighted by the spatial distribution of different landforms, whose geomorphological and structural features and evolution are related to a main morphogenetic factor (such as morphostructural, morphosculptural, and/or landforms related to selective erosional processes on inactive tectonic structures). This resulting landscape is shaped by fluvial and slope processes. Channel incisions and flooding are the main fluvial processes affecting the main river valleys. Slope processes are represented by minor landforms (such as rills, gullies, and mudflows) and major landslides (e.g., rotational–translational slides, earth flows, complex landslides), mostly characterizing the hilly piedmont sectors and, locally, the coastal areas [96,97,98].
The distribution of historical [101] and instrumental earthquakes [102] shows a significant amount of seismic activity all along the Periadriatic area, with recurrent seismic events of low or moderate intensity. The present–day regional tectonic setting is characterized by intense seismicity (up to Mw 7.0 [99]), with earthquakes mostly located in the chain sectors (i.e., 1915, Marsica; 2009, L’Aquila). The Periadriatic Area is characterized by moderate to strong seismicity generated by sources that may belong to the buried outer thrust fronts of the Central Apennines and of the External Dinarides (i.e., 27 March 2021, Mw 5.2, Central Adriatic Sea earthquake [100]), and to other families of inherited structures reactivated within the present-day stress regime. This area is also influenced by subsidence and by moderate compression and strike–slip–related tectonics, as documented by the recent seismicity (Figure 2) [49,103,104,105,106].

3. Materials and Methods

The landscape of the Abruzzo Periadriatic Area was investigated by performing (i) Digital Elevation Model (DEM)–based preliminary analysis, (ii) detailed morphometric analysis (e.g., sub-basins-derived indexes; drainage network-derived indexes, and markers), (iii) structural geomorphological field mapping, and (iv) detailed analysis and mapping of fluvial terraces.

3.1. DEM-Based Preliminary Analysis

This analysis, supported and implemented using GIS software (QGIS version 3.16, 2020, “Hannover”; ESRI® ArcGIS, version 10.6, 2018), was performed using topographic maps (1:25,000–1:10,000 scale) and a 10 m DEM (TINITALY, http://tinitaly.pi.ingv.it/ [107,108]—accessed on 8 January 2021), serving as a base map. Initially, we performed a preliminary morphometric analysis for the definition of the main hydrographic features of the study area; in particular, basin boundaries and drainage network, as hierarchized according to Strahler [109], were automatically extracted from the DEM using the MATLAB® software Topotoolbox (https://topotoolbox.wordpress.com;—accessed on 15 February 2021 [110,111]) and verified by means of 1:5000 aerial–photos (Flight Abruzzo Region 2018–2019). Sixteen main drainage basins have been extracted. Basic morphometric parameters of the main basins (such as area, perimeter, relief, length) were obtained from the DEM analysis. Several methods have been proposed to perform morphometric analysis, such as techniques based on the DEM’s cells (e.g., neighborhood tools) or based on grids with uniformly sized square windows [10,112,113]. Even if these kinds of approaches allowed for avoiding any possible effect related to the shape and size of the sampling area, they could depend on the scale of analysis. Starting from a regional scale-based conceptual and geomorphological approach, and in order to have a basic unit to which to refer in performing all the multidisciplinary analysis (e.g., morphometric analysis; investigation of morphological elements concerning slopes, valleys, and hydrography; analysis of fluvial terraces’ spatial and temporal arrangement), the drainage basins-scale was revealed as the most convenient choice [114,115]. For these reasons, our analysis involved the drainage basins starting from the eastern slope of the chain and moving towards the sea. We mainly focus on the mid-lower reaches of such of them; the related headwater sectors (i.e., Tronto R., Vomano R., Pescara R., and Sangro R.) were considered in the analysis for the extraction of the main geomorphic indexes and markers (i.e., SL index, ksn, and knickpoints), but they were not considered for discussions and conclusions since they are located in the Apennine Chain sector, reflecting a different physiographic, lithological, structural, and geomorphological framework. Several studies [116,117,118,119] have been carried out in the upper sectors of these basins showing that their geomorphic analysis could be affected by interactions between the topography of intramontane basins, the transitions between endorheic and exoreic conditions in the drainage evolution, as well as active normal faulting. Furthermore, taking into account the scale dependence between the hierarchical orders of drainage basins and the morphometric indexes’ computation, widely highlighted by previous studies [10,113,120,121,122,123], a set of 219 sub-basins, featuring at least a fourth-order stream, was extracted based on Strahler order [109]. In this regards, this choice was confident, since (i) the fourth–order size was qualitatively dimensioned taking into account the physiographic setting of the area and the extension of the main alluvial plains, and (ii) undersized sub-basins (i.e., III order) would measure only spotted sectors of 16 main drainage basins (being too small and not regularly spaced), while oversized sub-basins (i.e., V order) would provide an inadequate scale of analysis (being too large and not equally present in all the selected drainage basins).

3.2. Sub-Basins-Derived Indexes

This analysis was carried out by calculating in all the sub-basins five morphometric parameters—e.g., drainage basin slope (Sb), hypsometric integral (Hi), asymmetry factor (Af), relief ratio (Rh), and Melton’s ruggedness number (M).
They generally represent a quantitative approach to the differential geomorphic analysis of erosion and depositional processes, related to lithological and geomorphological elements as well as tectonically derived features [64,68,113]. In the present study, drainage basins represent reference units with clearly defined boundaries, to which sub-basins-derived indexes, can be unequivocally ascribed to investigate the possible relationships between the landscape setting and the long-term tectonic deformation. Considering that the morphometric properties of drainage basins might reflect lithological controls and variability, individual indexes were, here, derived from DEM-based analysis to mainly detect morphometric areal and relief aspects. This can be useful for detecting drainage systems’ unsteadiness, probably produced by local changes resulting from tectonic activity, uplift, and/or subsidence. Moreover, we focused on intriguing data deriving from their combination to evaluate the landscape in terms of potential tectonic activity [62,68], mainly in addition to the other performed multidisciplinary analysis (e.g., investigation of morphological evidence of tectonics; analysis of fluvial terraces’ arrangement).
The drainage basin slope (Sb) is used to localize, in rapidly uplifting areas, river incision as the main fluvial process. It results in steep hydrographic basins, which become progressively less steep proportionally with the decrease of the uplift [5,124]. Therefore, high values of Sb could correspond to topographic sectors with potential high tectonic activity. Sb was calculated using the following equation:
Sb = (e × ΣLc/Ab) × 100,
where e is the contour interval (10 m), Lc represents the total length of the 10 m contour lines within the catchments, and Ab is the sub-basin area.
The hypsometric integral (Hi) represents the normalized area vs. altitude distribution within a given area [125,126]. It was calculated for each sub-basin using the following equation:
Hi = (Hmean − Hmin)/(Hmax − Hmin) × 100.
The Hi can be correlated with the stage of geomorphic development of the landscape, giving information about the status of equilibrium between hillslope and fluvial erosion processes, as well as the level of erosion and/or maturity of basins. The Hi does not directly relate to active tectonics, and its values are affected by rock resistance as well as tectonic influences [68,122,127]. Low values of Hi (<0.45) are typical of highly eroded basins with low tectonic activity; intermediate values of Hi (0.45 < Hi < 0.55) are associated with basins with moderate erosion and an already developed dissection; finally, high values of Hi (>0.55) represent ‘young’ weakly eroded basins dominated by linear incision and initial dissection, resulting from a recent tectonic activity [6,54,122,128,129].
The asymmetry factor (Af) was developed to detect unstable settings that are transverse to river flow at drainage basin-scale [6,114,130,131]. Since its values can be affected by lithological and structural control, the Af works best if the drainage basins are developed on uniform and/or comparable lithologies [64,68,127]. It is defined as follows:
Af = (Ar/At) × 100,
where Ar is the right-side area of the basin (facing downstream of the main trunk stream) and At is the total basin area. The Af is also representative of tilting processes, showing values close to 50 indicatives for symmetrical basins with little or no tilting and values greater or lesser than 50 resulting from tilting or tectonic control. For the purpose of evaluating the relative active tectonics, it was calculated as its absolute value minus 50 with the following approach [64,68,127,132]:
Absolute Af = |(Ar/At) × 100−50|,
Absolute Af was divided into five classes: Af < 5 (symmetric basins), Af = 5–10 (gently asymmetric basins), Af = 10–15 (moderately asymmetric basins), Af = 15–20 (strongly asymmetric basins), and Af > 20 (extremely asymmetric basins).
The Relief Ratio (Rh) is the measure of the overall gradient aspects of a given catchment [133,134,135]. It is estimated using the following equation:
Rh = H/L,
where H represents the difference in height between the highest and lowest points of the catchment, and L is the basin length (calculated as the horizontal distance along the longest dimension of the basin parallel to the main trunk stream). High values of Rh could indicate areas affected by high tectonic activity.
Finally, Melton’s ruggedness number (M) offers a measure of the spatial distribution of the relief roughness within the catchment. It could be related to lithological control and is mainly indicative of hydro-geomorphic processes. Even if it does not directly relate to relative active tectonics, it is possible to hypothesize that basins with rough relief, characterized by high M values, are affected by tectonic disturbances, whereas low values usually indicate tectonic stability [62,136]. It could be estimated using the following equation:
M = H × Ab−0.5,
where H represents the difference in height between the highest and lowest points of the catchment and Ab is the sub-basin area.
As previously described, the quantitative calculation of geomorphic indexes evaluates the relative tectonic activity more accurately. Since each selected morphometric parameter (Sb, Hi, Af, Rh, M) can be estimated as an indicator of the tectonic activity, the five indexes were combined into an already existing index, applied by Valkanou et al. [62] in tectonically controlled areas in Greece. In addition, a similar approach was first adopted by El Hamdouni et al. [68], who determined the Iat (Index of relative active tectonic). It could be estimated as follows:
Irta = (Sb + Hi + Af + Rh + M)/5,
The analyzed sub-basins were classified into three classes (from 1 to 3) depending on the low, moderate, or high relative tectonic activity. According to the Quantile function in the GIS environment, a map depicting the spatial distribution of the values of this summarizing index was elaborated to derive preliminary information about the morphotectonic arrangement of the study area.

3.3. Drainage Network-Derived Indexes and Markers

Even if our analysis involved the drainage basins starting from the eastern slope of the chain and moving towards the sea, in order to avoid a distorted evaluation of main drainage network-derived indexes (SL index and ksn) and markers (knickpoints), we extended the analysis to the headwater sectors of the drainage basins to better create the SL index and ksn maps. Then, we focused our attention only on their mid–lower reaches. In detail, the stream length–gradient (SL) index has been proposed to underline the topographic fingerprints of surface and subsurface processes. It allows to highlight deviations from the concave-up shape of longitudinal river profiles and to mark knickpoints/knickzones where the stream gradient shows anomalous values. The stream length–gradient (SL) index [63] is defined using the following equation:
SL index = (ΔH/ΔL) × Lr,
where ΔH represents the difference of altitude between two points of the stream channel, ΔL is the distance between the same points, and Lr is the total length of the stream. By applying the above relation to a river long profile, it is possible to highlight knickpoints that, in the absence of lithostructural discontinuities or natural/man–made disturbances, may be related to tectonically induced ground deformations, such as geological structures (i.e., faults) [64,137,138]. In this work, the SL index was extracted using the GIS toolbox SLiX; it works in the ArcGIS software and is designed to derive SL index’ values from DEM data [65]. The SL index calculation was performed along the whole drainage network, considering a fixed stream segmentation (ΔL equal to 50 m, based on the DEM resolution), and the extension of the whole study area. To estimate and visualize the spatial distribution of SL, the obtained point dataset was interpolated using the Kriging method with specific settings (such as a search radius of 12 points, to be used for the interpolation, and an output cell size of 10 × 10 m, based on the DEM resolution).
Finally, to identify knickpoints in both main trunks and tributary streams, we mainly referred to the computation of the normalized channel steepness index (ksn) [7,9,66,139,140]. It is related to Flint’s law [66] as follows:
S = ks A−θ,
where S is the channel slope, ks is referred to as the steepness index, A is the upstream drainage area, and θ represents the concavity of the river channel profile. The ksn is derived from Equation (9) by normalizing the drainage area of a given reach and using a reference concavity (θref) that ranges between 0.3 and 0.8, and commonly takes on the value of 0.45 [7,141]. For the present study, the ksn was automatically obtained from the DEM using the MATLAB® software Topotoolbox [110,111]. According to several studies [7,9,138,140] that highlight the sensitivity of the steepness index to differences in rock uplift rate, base-level fall, climate, and/or substrate lithology at steady-state (provided such differences are uniform along the length of the channel), ksn can be used as a proxy of landscape’s transience (e.g., knickpoints along with the river profiles), suggestive, in the case of uniform climate and lithologies, of tectonic deformation [67,142,143].

3.4. Structural Geomorphological Field Mapping

Regarding the geomorphic evidence of tectonics, the morphotectonic approach originally proposed by Ambrosetti et al. [58], was improved by several recent works [41,42,43,46,53,54,144], and was followed in the present work. We strictly focused on the most representative geomorphic elements concerning slopes, valleys, and hydrography (e.g., triangular facets, hanging and beheaded valleys, river bends, rectilinear fluvial segments, and 90° and counterflow confluences). Moreover, the choice of mapping these specific geomorphic indicators was derived from the possibility to interpret them as the surface expression of tectonic structures. More in detail, their spatial distribution and alignments could represent evidence of the drainage system’s unsteadiness and tectonic deformations. All the possible alignments of the main elements along specific orientations were analyzed and validated through aerial-photos and DEM-derived shaded relief images. These connections and/or alignments of the mapped elements can be indicative of tectonic deformations, giving evidence of morphotectonic processes in the landscape evolution [39,54,145].
The detection of morphological field evidence of tectonic features was based on field analysis and stereoscopic aerial–photos interpretation; it was achieved using 1:33,000, 1:20,000, 1:13,000, and 1:5000 scale stereoscopic aerial–photos (Flight GAI 1954, Flight CASMEZ 1974, Flight Abruzzo Region 1981–1987, and Flight Abruzzo Region 2018–2019), 1:5000–scale orthophoto–color images (Flight Abruzzo Region 2010), and Google Earth® imagery; this analysis was also supported by the use of the 10 m DEM.

3.5. Detailed Analysis and Mapping of Fluvial Terraces

The analysis of fluvial terraces’ spatial and temporal distribution, analyzed through field surveys and stratigraphic observations, was used to reconstruct the tectonic activity of the study area. The planimetric distribution of fluvial terraces was investigated for each of the 16 major drainage basins. Moreover, the longitudinal distribution of terrace levels of four main drainage basins (Tronto River, Vomano River, Pescara River, and Sangro River, based on the availability of data and in order to fairly cover the study area) was analyzed by plotting them on longitudinal profiles [6,146]. The relationships between morphological evidence of tectonics and anomalies in the spatial distributions of fluvial terraces within the wide alluvial plains are likely to provide evidence of tectonic activity and relative geomorphological constraints in the timing of landscape evolution.
Fluvial terraces can be used to quantify vertical tectonic deformation and can also serve to assess the interactions between tectonics, climate, and sea-level changes [147,148,149,150]. Moreover, the terrace-derived incision rates are commonly used to determine spatio-temporal variations in long-term uplift rates [12,151,152,153]. Our basic approach to interpreting the tectonic control on fluvial terraces’ arrangement was to examine the spatial pattern of their elevations, deriving the uplift rate from the relative altitude of fluvial terraces with respect to the present-day valley bottom. We relied on the assumption proposed by [154,155], which considers that the valleys where the dated terraces formed had the same downstream curvature as the present-day alluvial plain. Such inferences implicitly assume that the geometry trend of the considered fluvial terrace’ bottom shows a similar shape present–day valley bottom. Simply put, it requires that fluvial incision equals rock uplift, allowing the computation of the vertical incision rates from the separation between the dated terrace surface and the modern stream level.
Starting from this assumption, rates of tectonic uplift were derived from river incision rates computed with the combination of terraces’ heights and associated dating available in the literature [39,46,53,156,157,158,159]. In detail, by comparing elevations of the fluvial terraces’ bottom with the same geochronological constraints (~50 ky; [39,156,157,158,159]) on the present–day valley bottom, we computed the incision rate (Ir) according to the following equation:
Ir = (HTb − HVb)/T,
where HTb is the height of the time-constrained fluvial terrace bottom, HVb represents the elevation of the present–day valley bottom, and T is the age of the fluvial terrace (~50 ky). Moreover, in order to verify the supposed similarity between the geometry trend of the considered fluvial terrace and the present–day valley bottom, the geometry trends (Gradient–G) of four main drainage basins (Tronto River, Vomano River, Pescara River, and Sangro River) were calculated using the equation:
G = ΔH/ΔL,
where ΔH represents the difference in altitude of the fluvial terrace bottom or of the present-day valley bottom between specific–site investigations, respectively. ΔL is the horizontal distance between the selected sites.

4. Results

4.1. Drainage Network

The analysis mainly focused on the 16 major drainage basins that developed across the Abruzzo Periadriatic Area, directly flowing towards the Adriatic Sea. Showing SW-NE to W–E directions, some of these catchments totally extend within the piedmont area (Vibrata R., Piomba R., Alento R., Foro R., Moro R., Feltrino R., Osento R., and Sinello R.), while others (Tronto R., Salinello R., Tordino R., Vomano R., Fino R., Tavo R., Pescara R., and Sangro R.) originate from the inner sectors of the chain, cross its front giving rise to transversal valleys, and flow in the piedmont area within wide alluvial plains. The inner sectors of these latter were not considered in the analysis, focusing on their mid–lower reaches extending from the easternmost slope of the chain towards the sea.
The main morphometric characteristics of the basins delineated in the study area are summarized in Table 1.

4.2. DEM–Based Morphometric Analysis

4.2.1. Sub-Basins-Derived Indexes

Morphometric indexes were computed to define the main morphometric areal and relief aspects of the study area. Since there is no standard method to describe the leading morphometric indexes that tell us tectonic control, we focused on their combination and superimposition, which may be useful for defining the possible co-presence of lithological and tectonic control, for detecting drainage systems’ unsteadiness, and for deriving intriguing data to evaluate the landscape in terms of potential tectonic activity. In detail, in all the sub-basins five morphometric parameters—e.g., drainage basin slope (Sb), hypsometric integral (Hi), asymmetry factor (Af), relief ratio (Rh), and Melton’s ruggedness number (M)—were calculated and combined into a summarizing index (Irta), which offers an attempt to describe the relative tectonic activity of the study area.
The spatial distribution of each index over the Abruzzo Periadriatic Area is graphically shown in Figure 3.
Drainage basin slope (Sb) values range from 6.03 to 90.60%, reflecting a heterogeneous distribution in the steepness of hydrographic basins over the study area. High values belong to the sub–basins located along the slopes of the main reliefs (Maiella, Gran Sasso, and Montagna dei Fiori). The highest values (>65) are located, with an anomalous distribution, within the Sangro River basin. The lowest Sb values are placed in all the sub-basins located in the piedmont and coastal sectors, with average values of 20 (Figure 3a).
Hypsometric integral (Hi) values are comprised between 16.01 and 74.19 giving information on the stage of geomorphic development of basins (e.g., level of erosion and/or maturity of each sub-basin). The highest values (>70) are located in correspondence with the easternmost slope of the Maiella Massif. High values can be detected also in the outer portion of the piedmont area, in correspondence with sub-basins showing high topography and younger landscape. In general, it is possible to denote an increasing trend of Hi values moving towards the southeastern sectors of the study area (Figure 3b).
Absolute asymmetry factor (Af) values range from 0.04 to 37.98, giving information about tilting processes linked to tectonic activity in each sub-basin. Regarding the spatial distribution, almost all the basins (73.5%) are characterized by tilting, of which 37% are typified by a left asymmetry and the latter 36.5% with a right asymmetry. Only 26.5% of the sub-basins show a stable and symmetric setting. Asymmetrical basins (especially right asymmetric ones) are present in the inner sectors of the study area and in the right-valley side of the main rivers; symmetrical watersheds are more scattered in the study area (Figure 3c).
Relief ratio (Rh) values range between 0.025 and 1.095. The spatial distribution mainly reflects (Figure 3d) that obtained for drainage basin slope (Sb), with sub-basins characterized by high values located in the innermost areas, at the transition zone between the chain and the piedmont area. High values of this index are also observed in the southern area, without anomalous and/or scattered distributions. Low values (<0.16) belong to sub-basins located in the piedmont and coastal sectors.
Melton’s ruggedness number (M) values vary from 0.048 to 0.896, showing a heterogeneous spatial distribution of this parameter over the study area. In general, it is possible to denote that the values gradually decrease from the inner to the outer areas. High values are present along the easternmost slopes of the main reliefs (Maiella, Gran Sasso, and Montagna dei Fiori) in correspondence of sub–basins with a rough morphological and topographic setting. Mean values are present in the inner piedmont area, while low values are present along the outer area moving towards the coastal sectors (Figure 3e).
A thematic map was realized to summarize, through a combination and overlay of the previous geomorphic indexes, the spatial distribution of the Index of Relative Tectonic Activity (Irta). Since it is difficult to state with certainty the role played by the lithologies on the arrangement of the geomorphic features that compose the index, probably because of the complexity of the system since most of the basins consist of many formations showing different resistance to erosion, Irta index served as a preliminary tool to highlight significant differences in relative tectonic activity among the drainage basins. Its values were labeled into three classes: Irta < 22.3 (low); 22.3 < Irta < 25.3 (medium); Irta > 25.3 (high) and the spatial distribution was identified over the different sub-basins in the study area (Figure 4). In detail, high values correspond to sub-basins located at the transition zone between the chain and the piedmont area, in correspondence of the easternmost slope of the main ridges (i.e., Montagna dei Fiori, Gran Sasso Massif, and Maiella Massif); other sub-basins show similar values with a spotted distribution reflecting their morphological and topographic settings. Moderate values are more homogeneously distributed over the study area in correspondence of sub-basins located in low relief areas. Finally, low values can be homogeneously detected in piedmont sectors of the study area, in correspondence of sub-basins mainly located in the left valley-side of the main drainage basins.

4.2.2. Stream Length-Gradient Index (SL Index)

The SL Index values range from 0 up to >1000 m, showing a peculiar distribution over the Abruzzo Periadriatic Area (Figure 5). Looking to the SL Index map, the values are grouped into five main classes (<100; 100 < SL < 200; 200 < SL < 300; 300 < SL < 400; SL > 400). Medium to high values are the most representative to deduce information for the quantitative landscape analysis. These values could suggest the occurrence of a geomorphic disequilibrium recorded along with the drainage network rather than the presence of a tectonic perturbation in that location, identifying areas where high levels of tectonic activity might be expected. The highest values (>400 m) can be found in the inner sectors, in correspondence with the steep slopes of the main ridges (Maiella Massif, Gran Sasso Massif, and Montagna dei Fiori), reflecting the overall morphostructural setting of the transition zone between the chain and the piedmont sectors, due to the presence of the main NNW–SSE and ~N–S-oriented thrust fronts. Some other high values are scattered in the southernmost sectors of the study area, coinciding with the outcropping of clayey–marly and marly–calcareous allochthonous deposits. This heterogeneous distribution indicates the existing relationship between rock resistance and SL Index, mainly related to tectonic and lithological control in the whole study area.

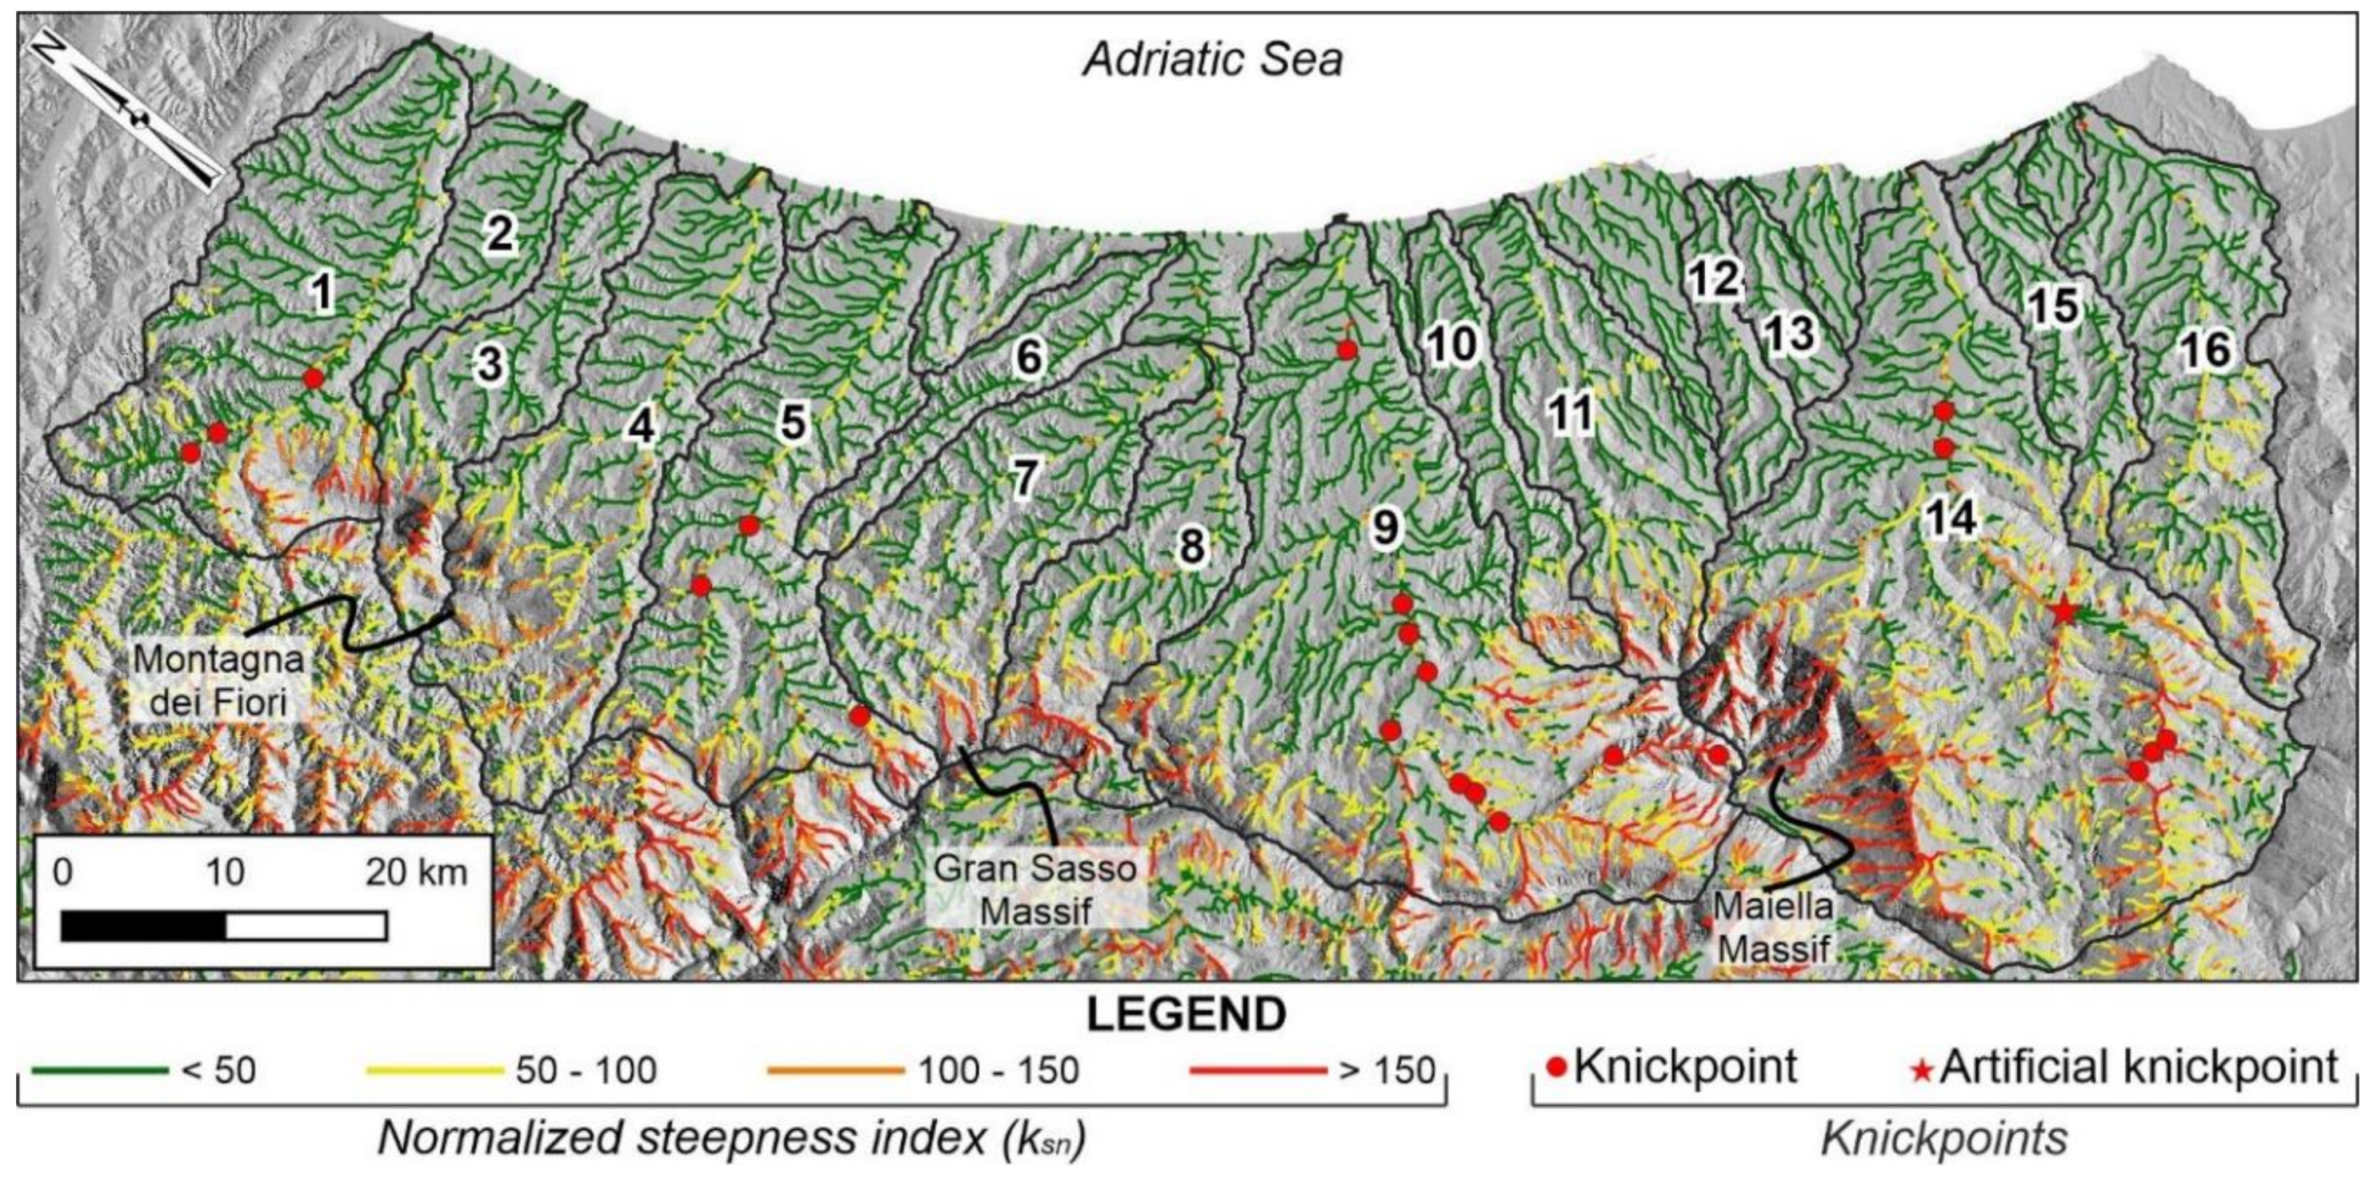
4.2.3. Normalized Channel Steepness Index (ksn)

The ksn values distribution (Figure 6) reflects that obtained for the SL index, describing the complexity of the drainage network development due to tectonic and lithological control. The distribution of this index in a catchment can be an extremely useful tool for delineating anomalies in channels’ organization, probably related to tectonic activity and/or regional–to–local uplift. In the study area, the normalized steepness index (ksn) exhibited values ranging from 0 up to ~1000, which we grouped into four classes from <50 to >150. Values are generally higher in upstream channel reaches closest to the mountain front (i.e., Maiella Massif); medium to low values are detected along the main channel of major basins and in the southernmost sectors, in correspondence to the outcropping of siliciclastic and turbiditic deposits. Finally, rivers exhibit the lowest steepness proximate to the coastal areas.

4.3. Morphological Field Evidence of Tectonics

The spatial distribution of morphological field evidence of tectonics over the Abruzzo Periadriatic Area was produced using GIS technology, and it was verified and integrated with field mapping and aerial photo interpretation (for more details, see Figure S1 in the Supplementary Material). This kind of analysis allowed us to label the morphological elements into three main categories concerning slopes, valleys, and hydrography. These landforms were investigated to delineate their peculiar distributions, orientations, and morphological anomalies. Moreover, selected landforms and significant indicators (e.g., triangular facets, hanging and beheaded valleys, river bends, rectilinear fluvial segments, and 90° and counterflow confluences) were analyzed with reference to the watershed scale for illustrating structural controls, geological and geomorphic history, and drainage network processes within each of the main 16 drainage basins. In detail, the alignments of these significant indicators were interpreted as the surface expression of tectonic structures influencing the most recent morphogenesis of the study area.
The landforms related to slopes (i.e., triangular facets) widely characterize all the basins of the study area. They are mainly located in the middle valley sectors characterized by the wide outcropping of clayey–sandy and pelitic–arenaceous deposits, generally making visible the analyzed landforms. Almost the totality of the triangular facets is positioned in the right valley side, except for the Vomano and Pescara rivers, which show a peculiar distribution of these elements also in the left valley side. These morphotectonic elements show a prevalent alignment in a ~N–S direction (varying from NNW–SSE to NNE–SSW).
Hanging and beheaded valleys represent the main morphological field evidence of tectonics related to valleys. Hanging valleys are broadly present both in the innermost and in the outermost sector of the study area. The innermost sector, reflecting the transition zone between the chain and the piedmont area, is characterized by morphological field evidence of tectonics showing an ~E–W direction, while the outermost one is dominated by elements, with a main NW–SE direction located in correspondence of the junctions between the secondary valleys and the main ones. Beheaded valleys are widespread along the watersheds, especially in the southernmost portion of the study area; they are mainly located in correspondence to the drainage divides and show prevalent SW–NE and SSW–NNE alignments.
In the zoomed frames of Figure 7, as in Figure S1 (for details see supplementary materials), triangular facets, hanging valleys, and beheaded valleys are not depicted with their specific symbology, but they are graphically shown with their related point of identification (PoI) to better report their spatial arrangement and their georeferenced locations in each drainage basin.
Finally, morphological field evidence of tectonics related to hydrography is well distributed all over the study area. They are represented by river bends, rectilinear fluvial segments, and 90° and counterflow confluences. The river bends are located in correspondence of the inner sectors of the main basins and along minor stream channels in showing variable orientations from ~N–S to ~E–W and/or from ~E–W to ~N–S, with a large number of alignments in an SSW–NNE and NW–SE direction. The rectilinear fluvial segments are present, especially in the lower sectors of the main valleys with a prevalent SSW–NNE and NNW–SSE direction. The 90° confluences are present in the whole study area, especially in the southern portion; their distribution is typically in the outermost area, except for the Sangro River basin where they are present also in the innermost areas. Their prevalent alignments show NNW–SSE, SSW–NNE, and ~E–W directions. Finally, the counterflow confluences are also abundant in all the analyzed basins, especially in the middle eastern portion; the main landforms are present along the confluences between the tributaries and the main stream, and they are aligned in SSW–NNE and NW–SE direction.

4.4. Fluvial Terraces’ Spatial and Temporal Arrangement

The analysis of fluvial terraces’ spatial and temporal arrangement allowed the grouping of terrace remnants and alluvial fan surfaces from a minimum of three to a maximum of seven distinct orders all over the Abruzzo Periadriatic Area (Figure 8). These terraces are characterized by gravelly, gravelly–sandy, and silty–sandy deposits with thicknesses reaching from a few meters to ~40 m. Their spatial distribution and height above the long river profile vary among and within valleys, and the oldest remnants of fluvial terraces are generally preserved on the left side of the river valleys.
Their relative ages have been constrained spanning from Middle Pleistocene to Holocene, in agreement with available geochronologic constraints and by means of direct comparisons with neighboring river basins [39,156,157,158,159]. Since no extensive direct geochronologic constraints have been so far provided on all the terraced deposits of each basin, the different orders of the terraces were defined individually for each drainage basin. Consequently, there is no guarantee that the river terraces of the same order in different basins are to be understood of the same age, due to extremely complex geological and geomorphological settings and to different incision/uplift rates affecting the study area.
Detailed drainage network analysis and investigations on the arrangement and distribution of these deposits were performed on the following rivers of the Abruzzo Periadriatica Area, regularly spaced from north to south and directly flowing towards the Adriatic Sea:
  • Tronto River;
  • Vomano River;
  • Pescara River;
  • Sangro River.
Furthermore, fluvial terraces were investigated, with reference to their long river profile, to detect possible perturbations in the river gradient moving towards the mouth. This analysis, integrated with the plotting of knickpoints, showed sharp long gradient changes at the transition between different areas, especially in the middle-lower sectors of the basins. In the lower part of the valleys, fluvial terraces are widely distributed and organized in different orders with convergent geometries.
The Tronto River hosts three orders of fluvial terraces (from T1 to T3; for detail, see Figure 8). The oldest deposits, T1 (Middle Pleistocene [39]), are found between 150 and 70 m above the actual river bottom and are preserved only in the left valley side; isolated remnants are present in scattered outcrops. The T2 fluvial terrace (late Middle Pleistocene [39]) is preserved between 80 and 30 m over the thalweg. Finally, the T3 fluvial deposits (Late Pleistocene [39]) represent the widest and most well–maintained terrace order (preserved both in the left and in the right valley side) with heights ranging between 25 and 10 m above the thalweg. In the longitudinal profile (Figure 9a), terrace treads show a general downstream convergence geometry, with an overall decrease of their slope. The lower knickpoint on the actual stream testify the presence of lithological change, which is found in the correspondence of the separation between the eastern sectors of the chain (with outcrops of carbonate and pelitic–arenaceous turbiditic units) and the outer parts of the basin (where more erodible clayey–sandy sequences outcrop); the upper two knickpoints, instead, are located in a uniform lithology, represented by the pelitic–arenaceous turbiditic deposits.
The Vomano River is characterized by six orders of fluvial terraced deposits (from T1 to T3 outcropping only in the left valley side; from T4 to T6 outcropping in both valley sides—for detail, see Figure 8). The oldest terrace (T1, Middle Pleistocene [157]) is preserved with scattered outcrops within the basin, at heights ranging from 190 to 160 m above the actual valley floor; the T2 fluvial terraces (late Middle Pleistocene [157]) are found between 140 and 100 m over the thalweg; the T3 deposits (late Middle Pleistocene [157]) are preserved at heights between 100 and 75 m above the valley bottom; the terraced deposits pertaining to T4 (Upper Pleistocene [157]) are located at an elevation ranging from 85 to 35 m above the thalweg; the widest and most well–conserved terrace order is the T5 (Upper Pleistocene [157]) which is preserved from 30 to 15 m above the actual valley floor; finally, the T6 alluvial deposits (Upper Pleistocene–Holocene [157]) are found between 20 and 7.5 m above the present-day thalweg. Plotting these deposits on the longitudinal profile (Figure 9b), it is possible to observe a clear downstream convergence geometry, with an important tilting of the treads, especially from T1 to T4. The lower knickpoints are found along the main course in a lithologically uniform sector (pelitic–arenaceous turbiditic deposits); the uppermost one could indicate a lithological change in correspondence of the separation between the carbonate and the turbiditic domains.
The Pescara River hosts five orders of terraced deposits (from T1 to T5); all these deposits are present on both valley sides, the initial two orders outcrop in isolated scattered remnants, while the others are more continuous (for detail, see Figure 8). Moreover, the distribution of fluvial terraces in the Pescara River basin results to be more articulated due to the presence of three main tributaries (Alba, Nora, and Cigno rivers). The deposits belonging to T1 (Middle Pleistocene [158]) are present at elevations ranging from 350 to 250 m above the actual Pescara valley floor; the T2 terraced order (late Middle Pleistocene [158]) are found between 75 and 150 m above the Pescara thalweg; T3 (Upper Pleistocene [158]) is present at heights ranging from 75 to 30 m over the present–day Pescara valley bottom; the T4 deposits (Upper Pleistocene [158]) are found from 40 to 10 m above the Pescara thalweg; finally, the terraced deposits pertaining to T5 (Upper Pleistocene–Holocene [158]) show elevation ranging from 20 to 5 m above the actual Pescara valley floor. The terrace treads analysis above the longitudinal profile (Figure 9c) clearly show the overall convergent geometry with a general increase in the gradient of terraced orders upstream; local anomalies are related to the presence of important tributaries (i.e., the apparent doubling of the T2 order). The presence of several knickpoints on the present-day valley could reflect both a tectonic and lithological control, highlighted by the outcropping of calcareous and turbiditic deposits, as well as base-level fall with a possible upstream migration through the basins.
The Sangro River is characterized by five orders of fluvial terraces (from T1 to T5, present in both valley sides (only small remnants are present on the right valley side), except for T1, which is present only on the left valley side (for detail, Figure 8). The oldest order of fluvial terraces (Middle Pleistocene [53]) is found at the summit of the hilly reliefs, at an elevation ranging from 340 to 300 m above the present-day Sangro thalweg; the T2 terrace (Middle Pleistocene [53]) is found between 220 and 150 m over the actual valley floor; the terraced fluvial deposits of T3 (Middle Pleistocene [53]) are present at heights between 150 and 50 m above the thalweg; the T4 terraced deposits (late Middle Pleistocene [53]) are found continuously in the final stretch of the Sangro valley, between 50 and 15 m above the present-day valley floor; finally, the T5 terrace (Middle Pleistocene [53]) appears as the most continuous and wide outcrop among terraced deposits, with an elevation ranging from 20 to 5 m above the thalweg. In the longitudinal profile (Figure 9d), as for the previous river basins, it is visible the downstream convergence geometry and the downstream decrease of the terrace treads’ gradient. The knickpoints on the actual stream could reflect a tectonic control indicated by the presence of tectonic alignments with ~N–S direction; moreover, it is possible to note a significant anomaly along the longitudinal profile related to the Bomba dam’s artificial knickpoint.
Starting from these initial results, it is possible to identify a general tilting process in the terrace treads, which could be related to a differential incision/uplift rate and tectonic tilting over the Abruzzo Periadriatic Area. Figure 10 graphically illustrates the results of the simplified estimation of incision rates. It demonstrates the general reduction of the incision rates of the analyzed rivers (Tronto, Vomano, Pescara, and Sangro rivers) moving downstream towards the sea mouth. In detail, the minor values are found in the Tronto River, which shows an incision rate ranging from 0.06 to 0.3 mm/year, while the major incision rate is shown by the Vomano River and is ranging between 0.32 and 0.78 mm/year. Moreover, we can observe that the reconstructed terrace gradient of the available geochronologic constrained deposits (in all the analyzed basins ~50 ky, Upper Pleistocene—[39,156,157,158,159]) is fairly comparable to the present–day valley gradient; hence, we can assume that the valleys where the older terraces formed had the same downstream curvature as the present–day valleys and thus the incision rate can be considered fairly equal to the uplift rate [147,148,153,154,155].

5. Discussion

In clayey–sandy regions, where significant discontinuities are absent or not clearly visible and more erodible lithologies rarely preserve evidence of active tectonic deformation, geomorphic features may represent valuable indicators of ongoing tectonic activity and can be used to describe drainage network evolution [5,46,63,151,160]. Terraced fluvial deposits and alluvial fan surfaces record spatio-temporal perturbations and/or anomalies, serving as fundamental elements to reveal and chronologically constrain the dynamic landscape evolution. Even if the reconstruction of drainage systems’ development is often hampered by the scattered distribution of poorly preserved outcrops of continental deposits, integrated morphometric and geomorphological investigations offer valuable insights for the analysis of fluvial environments.
For this purpose, the analysis of several geomorphometric indexes was followed by field-based structural and geomorphic analysis to detect the response of landscapes to drainage systems’ unsteadiness and tectonic deformation processes. The combination of geomorphometric indexes provided semi-quantitative information about the morphological setting of the Abruzzo Periadriatic Area. Morphometric areal and relief aspects were deduced from the computation of five morphometric indexes (e. g., drainage basin slope (Sb), hypsometric integral (Hi), asymmetry factor (Af), relief ratio (Rh), and Melton’s ruggedness number (M)) whose numerically supported distribution of values denote a decreasing trend moving towards the easternmost sectors of the study area, starting from the innermost ones and moving toward the sea. In fact, low values are located along the outer area moving towards the coastal sectors. In detail, the quantification of drainage basins’ topography was derived through the combination of the aforementioned indexes, in order to produce a single index (Irta) that can be used to characterize relative tectonic activity.
Among them, the hypsometric integral (Hi), the asymmetry factor (Af), the stream length–gradient index (SL index), and the normalized channel steepness index (ksn) are the most efficient for detecting anomalies on stream profiles possibly related to tectonically–induced ground deformation [5,6]. This kind of analysis allowed us to better characterize the drainage basins of the study area, defining an inner sector located at the transition between the chain and the piedmont area, which is characterized by an ancient but high degree of relative tectonic activity, related to the emplacement of the Apennine chain due to compressive fronts (thrusts). Moreover, the combination of quantitative measurements of the selected morphometric indexes suggests a progressive reduction in the tectonic activity moving towards the East (Adriatic Sea), with the lowest values in correspondence of coastal sub-basins.
Moreover, in order to attempt the detection of tectonic features also in the outer portion of the study area, the investigation of morphological field evidence of tectonics, together with fluvial terraces analysis, was carried out. Geomorphological features, labeled into three main categories concerning slopes, valleys, and hydrography, were analyzed in detail. Peculiar distributions and alignments of these elements provide a geomorphological contribution to the morphotectonic reconstruction of the area and significant suggestions of Quaternary tectonic deformations. Furthermore, starting from the available literature data [48,54,89,105,161] and integrating the analysis of geomorphic indices and morphological field evidence of tectonics with the analysis of drainage network and fluvial terraces, it was possible to outline the spatial distribution and the timing of five families of structural elements (Figure 11), acting within the study area from Miocene to Upper Pleistocene times:
  • S1 (Miocene–Pliocene)—compressive thrust front responsible for the emplacement of the Abruzzo Apennine chain area, marking the transition between the chain and the piedmont area. This family shows a prevalent NNW–SSE, NW–SE, and ~N–S direction. Its spatial arrangement results from the analyses of the main geomorphic indices (i.e., Irta, SL index, and ksn), indicating an area dominated by inherited tectonic structures with high tectonic activity.
  • F1 (Upper Pliocene–Lower Pleistocene)—normal fault system which affected the outer part of the chain area and the inner sectors of the piedmont one. They show almost the same orientation as the S1 family (NNW–SSE-, NNE–SSW, and ~N–S-oriented). The detection of this family derives from the alignment of several morphological field evidence of tectonics, especially triangular facets, 90° confluences, and river bends.
  • F2 (Upper Pliocene–Lower Pleistocene)—normal fault system with a main strike–slip component, located in the inner and axial part of the piedmont area. This family shows a ~N–S direction (from NNW–SSE to NNE–SSW) and was detected both from morphological field evidence of tectonics and from fluvial terraces analysis. Several river bends, triangular facets, and 90° and counterflow confluences lining up in these directions; moreover, these structural elements can be considered responsible for the dissection and NE-ward tilting of the ancient fluvial terraces.
  • F3 (Middle Pleistocene–lower Middle Pleistocene)—normal fault system with a prevalent NNE–SSW and NW–SE trend. The detection of this family was derived from the alignments of triangular facets, rectilinear fluvial segments, hanging and beheaded valleys, counterflow confluences, and river bends. They are placed along the main river valleys, and they can be considered responsible for the migration towards the South of the main river valleys (in good agreement with the main asymmetry of the basins) and for the inclination of the terraced fluvial deposits. These tectonic structures also suggest the presence of differentiated tilting processes with differential uplift rates, as reported in several previous studies, i.e., [70,116,162,163], and testified, confirmed, and quantified by this study. Taking into account this analysis, it is possible to testify the difficulty in making an exact and direct correlation of the terraced deposits all over the basins present in the study area as they are subject to tilting, uplift rates, and depositional/erosive processes fairly different from each other.
  • F4 (Upper Pleistocene)— transtensive fault system mainly located in the central–outer part of the Abruzzo Periadriatic Area. These tectonic structures show a ~NNW–SSE (varying from NW–SE to E–W) direction. Their mapping was derived from the connections and/or alignments of several morphological field evidence (i.e., rectilinear fluvial segments, river bends, and 90° confluences) detected in the study area. This family could be associated with deep and blind structures, which do not show superficial evidence but can be considered currently active as confirmed by several works [54,105,164,165] and historical and recent seismicity (i.e., Central-southern Apennines 1456, Mw 7.2; Capitanata 1627, Mw 6.7; Gran Sasso 1950, Mw 5.7; San Giuliano di Puglia 2012, Mw 5.2; Abruzzo Coast 2020, Mw 3.1).
In conclusion, the sum and combination of obtained results allowed us to define the morphotectonic and morphoneotectonic setting of the whole Abruzzo Periadriatic Area (Figure 11). An updating of the distribution of the morphotectonic domains was performed also, considering the prevalence of morphostructural and/or morphosculptural processes, as follows:
  • Central–Eastern Apennine Chain (CE–AC)—chain area affected by intense Plio–Quaternary uplift (about 1 mm/year [38,88]). The area was involved by compressive tectonics (thrust fronts) up to Pliocene. In this area, there is a clear prevalence of structural-related (morphostructural) elements with the presence of exhumed thrusts.
  • Outer Apennine Chain (Ou–AC)—chain area affected by Plio–Quaternary uplift (rate > 0.7 mm/year [163]) and involved by extensional tectonics between the Pliocene and the Lower Pleistocene. Erosional and depositional (morphosculptural) landforms dominate the area with active processes induced by the regional uplift and are locally influenced by tectonic control (minor faults) and/or rock control (hard rock outcropping).
  • Inner Piedmont (In–P)—the inner portion of the piedmont area is affected by moderate Pleistocene uplift (0.7–0.5 mm/year) with evidence of predominantly extensional tectonics without superficial evidence; furthermore, the morphotectonic setting is influenced also by the presence of blind thrusts [161,166]. As in the previous area, the major landforms refer to morphosculptural ones and are represented by erosional processes (fluvial and slope processes) locally influenced by tectonic and lithologic control.
  • South–Eastern Piedmont (Ea–P1)—piedmont zone located in the central–southern portion of the Abruzzo Periadriatic Area, with a medium Pleistocene uplift rate (0.5–0.3 mm/year) and evidence of main extensional tectonics without superficial evidence; also in this sector, the emplacement of deep blind thrusts influences its morphotectonic setting. In this morphotectonic area, the major landforms are represented by structure–controlled (morphostructural) elements with flat hills (mesa landforms) characterized by gentle to steep slopes; locally, NE-ward tilting processes gave rise to cuesta or hogback (especially in the southernmost area) landforms.
  • North–Eastern Piedmont (Ea–P2)—sector located in the central–northern sector of the Abruzzo Periadriatic Area, with a medium Pleistocene uplift rate (0.5–0.3 mm/year) and evidence of extensional and transtensive tectonics and influences of deep blind thrusts. In this sector, the major landforms are represented by erosional and depositional (morphosculptural) landforms, locally influenced by lithological and tectonic control.
  • Outer South–Eastern Piedmont (Ea–P3)—sector corresponding to the southeastern portion of the study area, with a low uplift rate (0.3–0.15 mm/year). It is affected by extensional Pleistocene (from Middle to Upper) tectonics with no superficial evidence and still active deep compressive (offshore blind thrusts [161,166]). In this area, as for Ea–P1, prevail structure-related (morphostructural) elements with the presence of mesa and cuesta landforms.
  • Northern Coastal Piedmont (Co–P1)—sector located in the external northeastern portion of the study area and characterized by very low Pleistocene uplift (rate < 0.15 mm/year). The evolution of the area is controlled by deep and blind thrusts. This landscape is dominated by a gentle NE–dipping homocline, incised by the main river valleys and by minor coastal basins.
  • Southern Coastal Piedmont (Co–P2)—sectors located in the external southeastern part of the study area, dominated by very low Pleistocene uplifting (rate < 0.15 mm/year). It is influenced by offshore deep and blind thrusts and strike-slip faults (pertaining to the F4 tectonic family). Its landscape is mainly related to the presence of flat or gently inclined surfaces (mesa and cuesta landforms).
The morphotectonic domains and the structural elements thus defined appear to be closely related to each other, also regarding the planimetric distribution, developing almost exclusively within the same morphotectonic domain and/or limited to the drainage basin–scale, excepting for the structural elements belonging to S1 and F4 families which appear clearly perpendicular to the planimetric development of morphotectonic domains and extending with a spatial arrangement through neighboring drainage basins. This peculiar arrangement may reflect the complex geological and tectonic framework, and it could be related to the historical and recent seismicity of deep and buried tectonic structures [161,162,163,164,165,166,167].

6. Conclusions

The integrated analysis presented in this paper allowed us to better evaluate and investigate morphoneotectonic processes in a tectonically active region, such as the Abruzzo Periadriatic Area (Central Italy). Its tectonic and morphoneotectonic evolution was analyzed by a morphometric and geomorphological approach, involving morphometric analysis of relief and drainage network, investigation of morphological field evidence of tectonics, and analysis of fluvial terraces’ spatial and temporal arrangement at the drainage basin–scale all over the piedmont and coastal sectors of Abruzzo Region (between the Tronto and Sinello rivers).
DEM–based morphometric analysis and the calculation of geomorphic indexes and markers (e.g., Irta, SL index, ksn, and knickpoints) led to a quantitative measurement of the landscape features and a better characterization of the drainage basins all over the study area. Moreover, the combination with the performed multidisciplinary analysis (e.g., investigation of morphological evidence of tectonics; analysis of fluvial terraces’ arrangement) was used to detect the response of landscapes to drainage systems’ unsteadiness and tectonic deformation processes, possibly induced by the ongoing activity of the buried tectonic structures.
This kind of analysis defined an inner sector (easternmost portion of the chain area) characterized by an ancient but high rate of tectonic activity, related to the emplacement of the Apennine chain, and controlled by NNW–SSE- and ~N–S-oriented thrust (S1 family) and a progressive reduction in the tectonic activity moving towards the East (Adriatic Sea), with lowest values in correspondence of coastal sub-basins. Moreover, these clues also give some information about the ongoing deformation of the study area, linked to more recent tectonic structures and external deep and blind thrusts [100,166,168].
The investigation of morphological field evidence of tectonics supported by the analysis of fluvial terraces’ spatial and temporal arrangement allowed us the detection of families of tectonic structures. Landforms were divided into three main categories concerning slopes, valleys, and hydrography, and their spatial distributions and alignments provided a geomorphological contribution to the morphotectonic reconstruction of the area. Fluvial terraces’ detailed analysis identified a general NE-ward tilting process in the terrace treads, which could be related to a differential incision/uplift rate and tectonic NE-ward tilting all over the study area. By combining obtained results, it was possible to outline the spatial distribution of other families of structural elements, in addition to the aforementioned one: F1 and F2 families (NNW–SSE- and NNE–SSW-trending poorly constrained to Upper Pliocene and Lower Pleistocene) are connected to morphostructural elements confirming both passive and active tectonic control in the landscape shaping; F3 and F4 families (from SW–NE- to ~E–W-trending) show an active role in the landscape evolution, particularly evident considering the reorganization and emplacement of the drainage network, the asymmetry of the sub-basins, and the inclination of the fluvial terrace. It is also possible to suggest the presence of differentiated tilting processes with differential uplift rates (from 0.8–0.6 mm/year in the inner portion of the piedmont area to 0.3–0.06 mm/year along with the coastal areas) since Early Pleistocene. Moreover, these families can be associated with deep and blind structures with no superficial evidence but currently active as confirmed by historical and recent seismicity [54,100,161].
Through the combination and overlay of resulting data, it was possible to better define the morphotectonic and morphoneotectonic setting of the whole Abruzzo Periadriatic Area, defining eight morphotectonic domains whose geomorphological evolution related to the predominance of morphostructural or morphosculptural (erosional–depositional processes) landforms and controlled by five detected families of structural elements (S1, F1, F2, F3, and F4). Finally, this work could represent a scientific and methodological tool for any geomorphological study that integrates morphometry, morphological evidence of tectonics, and fluvial deposits to better define the main phases of the landscape evolution and the impact of active tectonics and uplift on fluvial landscapes in uplifting piedmont areas. It will also provide a contribution to the geological hazard assessment increasing the understanding about the deep tectonic structures, poorly evident in the Abruzzo Periadriatic Area but widely documented by recent and active seismicity.

Supplementary Materials

The following are available online at https://www.mdpi.com/article/10.3390/geosciences11090397/s1, Figure S1: Morphological field evidence of tectonics over the study area. Black lines represent the watershed of the main 16 basins analyzed; red squares represent the zoom-in frames shown in Figure 7. Note: PoI stands for Point-of-Identification.

Author Contributions

Conceptualization, E.M.; methodology, E.M., C.C. and G.P.; software, C.C. and G.P.; validation, E.M.; investigation, E.M., C.C. and G.P.; data curation, C.C. and G.P.; writing—original draft preparation, C.C. and G.P.; writing—review and editing, E.M., C.C. and G.P.; supervision, E.M.; project administration, E.M.; funding acquisition, E.M. All authors have read and agreed to the published version of the manuscript.

Funding

This research was funded by Enrico Miccadei, grant provided by Università degli Studi “G. d’Annunzio” Chieti-Pescara.

Institutional Review Board Statement

Not applicable.

Informed Consent Statement

Not applicable.

Data Availability Statement

The data presented in this study are available on request from the author. The data are not publicly available due to privacy. Images employed for the study will be available online for readers.

Acknowledgments

The authors would like to thank the anonymous reviewers that helped to greatly improve the manuscript for their precious and constructive comments. The authors wish to thank the Cartographic Office of the Abruzzo Region by means of the Open Geodata Portal (http://opendata.regione.abruzzo.it/, accessed on 8 January 2021), the Istituto Nazionale di Geofisica e Vulcanologia (INGV) (http://tinitaly.pi.ingv.it/, accessed on 8 January 2021), and the Istituto Geografico Militare Italiano (IGMI) for providing topographic data, Digital Elevation Model (DEM), aerial photos, and orthophotos used for this work.

Conflicts of Interest

The authors declare no conflict of interest.

References

  1. Struth, L.; Garcia-Castellanos, D.; Viaplana-Muzas, M.; Vergés, J. Drainage network dynamics and knickpoint evolution in the Ebro and Duero basins: From endorheism to exorheism. Geomorphology 2019, 327, 554–571. [Google Scholar] [CrossRef]
  2. Venkatesan, A.; Jothibasu, A.; Anbazhagan, S. GIS Based Quantitative Geomorphic Analysis of Fluvial System and Implications on the Effectiveness of River Basin Environmental Management. In Environmental Management of River Basin Ecosystems; Ramkumar, M., Kumaraswamy, K., Mohanraj, R., Eds.; Springer Earth System Sciences: Cham, Switzerland, 2015; pp. 201–225. [Google Scholar]
  3. Bull, W.B.; McFadden, L.D. Tectonic geomorphology north and south of the Garlock fault, California. In Proceedings of the Geomorphology in Arid Regions Process 8th Binghamton Symposium in Geomorphology, Binghamton, NY, USA, 23–24 September 1977; pp. 115–138. [Google Scholar]
  4. Merritts, D.J.; Vincent, K.R. Geomorphic response of coastal streams to low, intermediate, and high rates of uplift, Medocino triple junction region, northern California. Geol. Soc. Am. Bull. 1989, 101, 1373–1388. [Google Scholar] [CrossRef]
  5. Burbank, D.W.; Anderson, R.S. Tectonic Geomorphology, 2nd ed.; Wiley-Blackwell: Hokken, NJ, USA, 2011. [Google Scholar]
  6. Keller, E.A.; Pinter, N. Active Tectonics: Earthquakes, Uplift, and Landscape, 2nd ed.; Prentice Hall: Upper Saddle River, NJ, USA, 2002. [Google Scholar]
  7. Wobus, C.; Whipple, K.X.; Kirby, E.; Snyder, N.; Johnson, J.; Spyropolou, K.; Crosby, B.; Sheehan, D. Tectonics from topography: Procedures, promise, and pitfalls. Spec. Pap. Geol. Soc. Am. 2006, 398, 55–74. [Google Scholar] [CrossRef] [Green Version]
  8. Maroukian, H.; Gaki-Papanastassiou, K.; Karymbalis, E.; Vouvalidis, K.; Pavlopoulos, K.; Papanastassiou, D.; Albanakis, K. Morphotectonic control on drainage network evolution in the Perachora Peninsula, Greece. Geomorphology 2008, 102, 81–92. [Google Scholar] [CrossRef]
  9. Kirby, E.; Whipple, K.X. Expression of active tectonics in erosional landscapes. J. Struct. Geol. 2012, 44, 54–75. [Google Scholar] [CrossRef]
  10. Pavano, F.; Catalano, S.; Romagnoli, G.; Tortorici, G. Hypsometry and relief analysis of the southern termination of the Calabrian arc, NE-Sicily (southern Italy). Geomorphology 2018, 304, 74–88. [Google Scholar] [CrossRef]
  11. Jackson, J.; Norris, R.; Youngson, J. The structural evolution of active fault and fold systems in central Otago, New Zealand: Evidence revealed by drainage patterns. J. Struct. Geol. 1996, 18, 217–234. [Google Scholar] [CrossRef]
  12. Burbank, D.W.; Leland, J.; Fielding, E.; Anderson, R.S.; Brozovic, N.; Reid, M.R.; Duncan, C. Bedrock incision, rock uplift and threshold hillslopes in the northwestern Himalayas. Nature 1996, 379, 505–510. [Google Scholar] [CrossRef]
  13. Avouac, J.P.; Peltzer, G. Active tectonics in southern Xinjiang, China: Analysis of terrace riser and normal fault scarp degradation along the Hotan-Qira Fault System. J. Geophys. Res. 1993, 98, 21773–21807. [Google Scholar] [CrossRef] [Green Version]
  14. Molnar, P. Quaternary climate change and the formation of river terraces across growing anticlines on the north flank of the Tien Shan, China. J. Geol. 1994, 102, 583–602. [Google Scholar] [CrossRef]
  15. Keller, E.A.; Gurrola, L.; Tierney, T.E. Geomorphic criteria to determine direction of lateral propagation of reverse faulting and folding. Geology 1999, 27, 515–518. [Google Scholar] [CrossRef]
  16. Ramsey, L.A.; Walker, R.T.; Jackson, J. Fold evolution and drainage development in the Zagros mountains of Fars province, SE Iran. Basin Res. 2008, 20, 23–48. [Google Scholar] [CrossRef]
  17. Keller, E.A.; DeVecchio, D.E. Tectonic Geomorphology of Active Folding and Development of Transverse Drainages. In Treatise on Geomorphology; Shroder, J.F., Owen, L.A., Eds.; Elsevier Inc.: London, UK, 2013; pp. 129–147. [Google Scholar]
  18. Collignon, M.; Yamato, P.; Castelltort, S.; Kaus, B.J.P. Modeling of wind gap formation and development of sedimentary basins during fold growth: Application to the Zagros Fold Belt, Iran. Earth Surf. Process. Landf. 2016, 41, 1521–1535. [Google Scholar] [CrossRef] [Green Version]
  19. Lu, H.; Wu, D.; Cheng, L.; Zhang, T.; Xiong, J.; Zheng, X.; Li, Y. Late Quaternary drainage evolution in response to fold growth in the northern Chinese Tian Shan foreland. Geomorphology 2017, 229, 12–23. [Google Scholar] [CrossRef]
  20. Graveleau, F.; Dominguez, S. Analogue modelling of the interaction between tectonics, erosion and sedimentation in foreland thrust belts. Comptes Rendus Geosci. 2008, 340, 324–333. [Google Scholar] [CrossRef]
  21. Graveleau, F.; Hurtrez, J.E.; Dominguez, S.; Malavieille, J. A new experimental material for modeling relief dynamics and interactions between tectonics and surface processes. Tectonophysics 2011, 513, 68–87. [Google Scholar] [CrossRef]
  22. Guerit, L.; Dominguez, S.; Malavieille, J.; Castelltort, S. Deformation of an experimental drainage network in oblique collision. Tectonophysics 2016, 693, 210–222. [Google Scholar] [CrossRef] [Green Version]
  23. Lague, D.; Davy, P. Constraints on the long-term colluvial erosion law by analyzing slope-area relationships at various tectonic uplift rates in the Siwaliks Hills (Nepal). J. Geophys. Res. Solid Earth 2003, 108, 2129. [Google Scholar] [CrossRef]
  24. Viaplana-Muzas, M.; Babault, J.; Dominguez, S.; Van Den Driessche, J.; Legrand, X. Drainage network evolution and patterns of sedimentation in an experimental wedge. Tectonophysics 2015, 664, 109–124. [Google Scholar] [CrossRef]
  25. Viaplana-Muzas, M.; Babault, J.; Dominguez, S.; Van Den Driessche, J.; Legrand, X. Modelling of drainage dynamics influence on sediment routing system in a fold-and-thrust belt. Basin Res. 2019, 31, 290–310. [Google Scholar] [CrossRef]
  26. Tomkin, J.H.; Braun, J. Simple models of drainage reorganisation on a tectonically active ridge system. N. Z. J. Geol. Geophys. 1999, 42, 1–10. [Google Scholar] [CrossRef]
  27. Champel, B.; van der Beek, P.; Mugnier, J.-L.; Leturmy, P. Growth and lateral propagation of fault-related folds in the Siwaliks of western Nepal: Rates, mechanisms, and geomorphic signature. J. Geophys. Res. 2002, 107, ETG-2. [Google Scholar] [CrossRef]
  28. van der Beek, P.; Champel, B.; Mugnier, J.L. Control of detachment dip on drainage development in regions of active fault-propagation folding. Geology 2002, 30, 471–474. [Google Scholar] [CrossRef]
  29. Humphrey, N.F.; Konrad, S.K. River incision or diversion in response to bedrock uplift. Geology 2000, 28, 43–46. [Google Scholar] [CrossRef]
  30. Ramírez-Herrera, M.T. Geomorphic assessment of active tectonics in the acambay graben, Mexican volcanic belt. Earth Surf. Process. Landf. 1998, 23, 317–332. [Google Scholar] [CrossRef]
  31. Gürbüz, A.; Gürer, Ö.F. Tectonic geomorphology of the north anatolian fault zone in the Lake Sapanca basin (eastern Marmara Region, Turkey). Geosci. J. 2008, 12, 215–225. [Google Scholar] [CrossRef]
  32. Arrowsmith, J.R.; Zielke, O. Tectonic geomorphology of the San Andreas Fault zone from high resolution topography: An example from the Cholame segment. Geomorphology 2009, 113, 70–81. [Google Scholar] [CrossRef]
  33. Gasparini, N.M.; Whipple, K.X. Diagnosing climatic and tectonic controls on topography: Eastern flank of the northern Bolivian Andes. Lithosphere 2014, 6, 230–250. [Google Scholar] [CrossRef] [Green Version]
  34. Gaidzik, K.; Ramírez-Herrera, M.T. Geomorphic indices and relative tectonic uplift in the Guerrero sector of the Mexican forearc. Geosci. Front. 2017, 8, 885–902. [Google Scholar] [CrossRef] [Green Version]
  35. Polidori, L.; Hage, M. El Digital elevation model quality assessment methods: A critical review. Remote Sens. 2020, 12, 3522. [Google Scholar] [CrossRef]
  36. Miccadei, E.; Piacentini, T.; Buccolini, M. Long-term geomorphological evolution in the Abruzzo area, Central Italy: Twenty years of research. Geol. Carpathica 2017, 68, 19–28. [Google Scholar] [CrossRef] [Green Version]
  37. Parlagreco, L.; Mascioli, F.; Miccadei, E.; Antonioli, F.; Gianolla, D.; Devoti, S.; Leoni, G.; Silenzi, S. New data on Holocene relative sea level along the Abruzzo coast (central Adriatic, Italy). Quat. Int. 2011, 232, 179–186. [Google Scholar] [CrossRef]
  38. D’Alessandro, L.; Miccadei, E.; Piacentini, T. Morphotectonic study of the lower Sangro River valley (Abruzzi, Central Italy). Geomorphology 2008, 102, 145–158. [Google Scholar] [CrossRef]
  39. Della Seta, M.; Del Monte, M.; Fredi, P.; Miccadei, E.; Nesci, O.; Pambianchi, G.; Piacentini, T.; Troiani, F. Morphotectonic evolution of the Adriatic piedmont of the Apennines: An advancement in the knowledge of the Marche-Abruzzo border area. Geomorphology 2008, 102, 119–129. [Google Scholar] [CrossRef]
  40. Currado, C.; Fredi, P. Morphometric parameter of drainage basin and morphotectonic setting of eastern Abruzzo. Mem. della Soc. Geol. Ital. 2000, 55, 411–420. [Google Scholar]
  41. Lupia Palmieri, E.; Ciccacci, S.; Civitelli, G.; Corda, L.; D’Alessandro, L.; Del Monte, M.; Fredi, P.; Pugliese, F. Geomorfologia quantitativa e morfodinamica del territorio abruzzese: I-il bacino idrografico del Fiume Sinello. Geogr. Fis. Din. Quat. 1995, 18, 31–46. [Google Scholar]
  42. Lupia Palmieri, E.; Centamore, E.; Ciccacci, S.; D’Alessandro, L.; Del Monte, M.; Fredi, P.; Pugliese, F. Geomorfologia quantitativa e morfodinamica del territorio abruzzese: II-il bacino idrografico del Fiume Tordino. Geogr. Fis. Din. Quat. 1998, 21, 113–129. [Google Scholar]
  43. Lupia Palmieri, E.; Biasini, A.; Caputo, C.; Centamore, E.; Ciccacci, S.; Del Monte, M.; Fredi, P.; Pugliese, F. Geomorfologia Quantitativa e Morfodinamica del Territorio Abruzzese: III-Il Bacino Idrografico del Fiume Saline. Geogr. Fis. Din. Quat. 2001, 24, 157–176. [Google Scholar]
  44. Panizza, M.; Castaldini, D.; Bollettinari, G.; Carton, A.; Mantovani, F. Neotectonic research in applied geomorphological studies. Z. Geomorphol. Suppl. 1987, 63, 173–211. [Google Scholar]
  45. Panizza, M. Breviario dei rapporti fra geomorfologia e neotettonica. Quat. Ital. J. Quat. Sci. 1997, 10, 267–272. [Google Scholar]
  46. Carabella, C.; Buccolini, M.; Galli, L.; Miccadei, E.; Paglia, G.; Piacentini, T. Geomorphological analysis of drainage changes in the NE Apennines piedmont area: The case of the middle Tavo River bend (Abruzzo, Central Italy). J. Maps 2020, 16, 222–235. [Google Scholar] [CrossRef] [Green Version]
  47. Rapisardi, L. Tratti di Neotattonica al Confine Molisano-Abruzzese; CNR—Progetto finalizzato Geodinamica: Rome, Italy, 1982. [Google Scholar]
  48. Coltorti, M.; Farabollini, P.; Gentili, B.; Pambianchi, G. Geomorphologic evidence for anti-Apennine faults in the Umbro–Marchean Apennines and in the peri-Adriatic basin, Italy. Geomorphology 1996, 15, 33–45. [Google Scholar] [CrossRef]
  49. Bigi, S.; Cantalamessa, G.; Centamore, E.; Didaskalou, P.; Dramis, F.; Farabollini, P.; Gentili, B.; Invernizzi, C.; Micarelli, A.; Nisio, S.; et al. La fascia periadriatica marchigiano-abruzzese dal pliocene medio ai tempi attuale: Evoluzione tettonico-sedimentaria e geomorfologica. Stud. Geol. Camerti 1995, Speciale 1995/1, 37–49. [Google Scholar]
  50. Mayer, L.; Menichetti, M.; Nesci, O.; Savelli, D. Morphotectonic approach to the drainage analysis in the North Marche region, central Italy. Quat. Int. 2003, 101–102, 157–167. [Google Scholar] [CrossRef]
  51. Frankel, K.L.; Pazzaglia, F.J. Tectonic geomoomorphology, drainage basin metrics, and active mountain fronts. Geogr. Fis. Din. Quat. 2005, 28, 7–21. [Google Scholar]
  52. Molin, P.; Fubelli, G. Morphometric evidence of the topographic growth of the central Apennines. Geogr. Fis. Din. Quat. 2005, 28, 47–61. [Google Scholar]
  53. Miccadei, E.; Piacentini, T.; Pozzo, A.D.; Corte, M.L.; Sciarra, M. Morphotectonic map of the Aventino-Lower Sangro valley (Abruzzo, Italy), scale 1:50,000. J. Maps 2013, 9, 390–409. [Google Scholar] [CrossRef] [Green Version]
  54. Miccadei, E.; Carabella, C.; Paglia, G.; Piacentini, T. Paleo-drainage network, morphotectonics, and fluvial terraces: Clues from the verde stream in the middle Sangro river (central italy). Geoscience 2018, 8, 337. [Google Scholar] [CrossRef] [Green Version]
  55. Sembroni, A.; Molin, P.; Soligo, M.; Tuccimei, P.; Anzalone, E.; Billi, A.; Franchini, S.; Ranaldi, M.; Tarchini, L. The uplift of the Adriatic flank of the Apennines since the Middle Pleistocene: New insights from the Tronto River basin and the Acquasanta Terme Travertine (central Italy). Geomorphology 2020, 352, 106990. [Google Scholar] [CrossRef]
  56. Castiglioni, B. Ricerche morfologiche nei terreni pliocenici dell’Italia Centrale. Pubblicazioni dell’Istituto di Geografia della R. Università di Roma: Rome, Italy, 1935; pp. 1–81. [Google Scholar]
  57. Demangeot, J. Geomorphologie des Abruzzes Adriatiques. Cent. Rech. Doc. Cartogr. Mem. Doc. 1965, 403. [Google Scholar] [CrossRef]
  58. Ambrosetti, P.; Bonadonna, F.P.; Bosi, C.; Carraro, F.; Cita, B.M.; Giglia, G.; Manetti, P.; Martinis, B.; Merlo, C.; Panizza, M.; et al. Proposta di un Progetto Operativo per L’elaborazione Della Carta Neotettonica D’Italia; CNR—Progetto finalizzato Geodinamica: Rome, Italy, 1976; pp. 1–49. [Google Scholar]
  59. Cazzini, F.; Zotto, O.D.; Fantoni, R.; Ghielmi, M.; Ronchi, P.; Scotti, P. Oil and gas in the adriatic foreland, Italy. J. Pet. Geol. 2015, 38, 225–279. [Google Scholar] [CrossRef]
  60. Casero, P.; Bigi, S. Structural setting of the Adriatic basin and the main related petroleum exploration plays. Mar. Pet. Geol. 2013, 42, 135–147. [Google Scholar] [CrossRef]
  61. Videpi Project, A. Progetto ViDEPI-Visibilità dei dati afferenti all’attività di esplorazione petrolifera in Italia. Available online: https://www.videpi.com/videpi/pozzi/pozzi.asp (accessed on 23 April 2021).
  62. Valkanou, K.; Karymbalis, E.; Papanastassiou, D.; Soldati, M.; Chalkias, C.; Gaki-Papanastassiou, K. Μorphometric Analysis for the Assessment of Relative Tectonic Activity in Evia Island, Greece. Geophys. Sci. 2020, 10, 264. [Google Scholar] [CrossRef]
  63. Hack, J.T. Stream-Profile Analysis and Stream-Gradient Index. J. Res. US Geol. Surv. 1973, 1, 421–429. [Google Scholar]
  64. Buczek, K.; Górnik, M. Evaluation of tectonic activity using morphometric indices: Case study of the Tatra Mts. (Western Carpathians, Poland). Environ. Earth Sci. 2020, 79, 176. [Google Scholar] [CrossRef] [Green Version]
  65. Piacentini, D.; Troiani, F.; Servizi, T.; Nesci, O.; Veneri, F. SLIX: A GIS toolbox to support along-stream knickzones detection through the computation and mapping of the stream length-gradient (SL) index. ISPRS Int. J. Geo-Inform. 2020, 9, 69. [Google Scholar] [CrossRef] [Green Version]
  66. Flint, J.J. Stream gradient as a function of order, magnitude, and discharge. Water Resour. Res. 1974, 10, 969–973. [Google Scholar] [CrossRef]
  67. Spagnolo, M.; Pazzaglia, F.J. Testing the geological influences on the evolution of river profiles: A case from the northern Apennines (Italy). Geogr. Fis. Din. Quat. 2005, 28, 103–113. [Google Scholar]
  68. El Hamdouni, R.; Irigaray, C.; Fernández, T.; Chacón, J.; Keller, E.A. Assessment of relative active tectonics, southwest border of the Sierra Nevada (southern Spain). Geomorphology 2008, 96, 150–173. [Google Scholar] [CrossRef]
  69. Ori, G.; Serafini, G.; Visentin, C.; Ricci Lucchi, F.; Casnedi, R.; Colalongo, M.L.; Mosna, S. The Pliocene-Pleistocene Adriatic foredeep (Marche and Abruzzo, Italy): An integrated approach to surface and subsurface geology. In Proceedings of the 3rd E.A.P.G. Conference, Adriatic Foredeep Field Trip, Guide Book, Firenze, Italy, 26–30 May 1991; p. 85. [Google Scholar]
  70. Di Celma, C.; Pieruccini, P.; Farabollini, P. Major controls on architecture, sequence stratigraphy and paleosols of middle Pleistocene continental sediments (“Qc Unit”), eastern central Italy. Quat. Res. 2015, 83, 565–581. [Google Scholar] [CrossRef]
  71. Trincardi, F.; Correggiari, A.; Roveri, M. Late Quaternary transgressive erosion and deposition in a modern epicontinental shelf: The Adriatic semienclosed basin. Geo-Mar. Lett. 1994, 14, 41–51. [Google Scholar] [CrossRef]
  72. Trincardi, F.; Asioli, A.; Cattaneo, A.; Correggiari, A.; Vigliotti, L.; Accorsi, C.A. Transgressive offshore deposits on the Central Adriatic shelf: Architecture complexity and the record of the Younger Dryas short-term event. Alp. Mediterr. Quat. 1996, 9, 753–761. [Google Scholar]
  73. Ridente, D.; Trincardi, F.; Piva, A.; Asioli, A.; Cattaneo, A. Sedimentary response to climate and sea level changes during the past~ 400 ka from borehole PRAD1-2 (Adriatic margin). Geochem. Geophys. Geosys. 2008, 9, Q09R04. [Google Scholar] [CrossRef]
  74. Vezzani, L.; Festa, A.; Ghisetti, F.C. Geology and tectonic evolution of the Central-Southern Apennines, Italy. Spec. Pap. Geol. Soc. Am. 2010, 469, 1–58. [Google Scholar] [CrossRef]
  75. Patacca, E.; Scandone, P.; Di Luzio, E.; Cavinato, G.P.; Parotto, M. Structural architecture of the central Apennines: Interpretation of the CROP 11 seismic profile from the Adriatic coast to the orographic divide. Tectonics 2008, 27, 36. [Google Scholar] [CrossRef]
  76. Santilano, A.; Trumpy, E.; Gola, G.; Donato, A.; Scrocca, D.; Ferrarini, F.; Brozzetti, F.; De Nardis, R.; Lavecchia, G.; Manzella, A. A methodology for assessing the favourability of geopressured-geothermal systems in sedimentary basin plays: A case study in Abruzzo (Italy). Geofluids 2019, 2019, 28. [Google Scholar] [CrossRef]
  77. Farabollini, P.; Nisio, S. Evoluzione geomorfologica Quaternaria del Bacino del fiume Vomano (Abruzzo). Alp. Mediterr. Quat. 1997, 10, 101–104. [Google Scholar]
  78. Crescenti, U.; D’Amato, C.; Balduzzi, A.; Tonna, M. Il Plio-Pleistocene del sottosuolo abruzzese-marchigiano tra Ascoli Piceno e Pescara. Geol. Rom. 1980, 19, 63–84. [Google Scholar]
  79. Casnedi, R. L’avanfossa abruzzese fra i fiumi Vomano e Pescara nel Pliocene inferiore: Rapporti fra sedimentazione e tettonica. Stud. Geol. Camerti 1991, 1991, 375–379. [Google Scholar]
  80. Ricci Lucchi, F. The foreland basin system of the Northern Apennines and related clastic wedges: A preliminary outline. Giornale di Geologia 1986, 3, 165–185. [Google Scholar]
  81. Carruba, S.; Casnedi, R.; Perotti, C.R.; Tornaghi, M.; Bolis, G. Tectonic and sedimentary evolution of the lower Pliocene Periadriatic foredeep in Central Italy. Int. J. Earth Sci. 2006, 95, 665–683. [Google Scholar] [CrossRef]
  82. Parotto, M.; Cavinato, G.P.; Miccadei, E.; Tozzi, M. Line CROP 11: Central Apennines. In CROP Atlas: Seismic Reflection Profiles of the Italian Crust; Scrocca, D., Doglioni, C., Innocenti, F., Manetti, P., Mazzotti, A., Bertelli, L., Burbi, L., D’Offizi, S., Eds.; Memorie Descrittive della Carta Geologica d’Italia: Rome, Italy, 2004; pp. 145–153. [Google Scholar]
  83. Ori, G.G.; Roveri, M.; Vannoni, F. Plio-Pleistocene sedimentation in the Apenninic- Adriatic foredeep (central Adriatic Sea, Italy). Forel Basins 1986, 8, 183–198. [Google Scholar] [CrossRef]
  84. Cantalamessa, G.; Di Celma, C. Sequence response to syndepositional regional uplift: Insights from high-resolution sequence stratigraphy of late Early Pleistocene strata, Periadriatic Basin, central Italy. Sediment. Geol. 2004, 164, 283–309. [Google Scholar] [CrossRef]
  85. Bigi, S.; D’Ambrogi, C.; Carminati, E. The Geology of the Periadriatic basin and of the Adriatic Sea. Mar. Pet. Geol. 2013, 42, 1–3. [Google Scholar] [CrossRef]
  86. Ascione, A.; Cinque, A.; Miccadei, E.; Villani, F.; Berti, C. The Plio-Quaternary uplift of the Apennine chain: New data from the analysis of topography and river valleys in Central Italy. Geomorphology 2008, 102, 105–118. [Google Scholar] [CrossRef] [Green Version]
  87. D’Alessandro, L.; Miccadei, E.; Piacentini, T. Morphostructural elements of central-eastern Abruzzi: Contributions to the study of the role of tectonics on the morphogenesis of the Apennine chain. Quat. Int. 2003, 101–102, 115–124. [Google Scholar] [CrossRef]
  88. Papanikolaou, I.D.; Roberts, G.P.; Michetti, A.M. Fault scarps and deformation rates in Lazio-Abruzzo, Central Italy: Comparison between geological fault slip-rate and GPS data. Tectonophysics 2005, 408, 147–176. [Google Scholar] [CrossRef]
  89. C.N.R. Neotectonic Map of Italy (Scale 1:500.000). In Progetto Finalizzato Geodinamica; Ambrosetti, P., Bartolini, C., Bosi, C., Carraro, F., Ciaranfi, N., Panizza, M., Papani, G., Vezzani, L., Zanferrari, A., Eds.; Consiglio Nazionale delle Ricerche (CNR): Rome, Italy, 1987. [Google Scholar]
  90. Centamore, E.; Nisio, S. Effects of uplift and tilting in the Central-Northern Apennines (Italy). Quat. Int. 2003, 101–102, 93–101. [Google Scholar] [CrossRef]
  91. Currado, C.; D’Ambrogi, C. Plio-Pleistocene morphostructural evolution of Chieti sector in the Periadriatic Basin: An example of integrated analysis. Mem. Della Soc. Geol. Ital. 2002, 57, 501–508. [Google Scholar]
  92. Artoni, A. The Pliocene-Pleistocene stratigraphic and tectonic evolution of the Central sector of the Western Periadriatic Basin of Italy. Mar. Pet. Geol. 2013, 42, 82–106. [Google Scholar] [CrossRef]
  93. Aucelli, P.P.C.; Cavinato, G.P.; Cinque, A. Indizi geomorfologici di tettonica plio-quaternaria sul piedimonte adriatico dell’Appenmino Abruzzese. Alp. Mediterr. Quat. 1996, 9, 299–302. [Google Scholar]
  94. Bolis, G.; Carruba, S.; Casnedi, R.; Perotti, C.R.; Ravaglia, A.; Tornaghi, M. Compressional tectonics overprinting extensional structures in the Abruzzo Periadriatic Foredeep (Central Italy) during Pliocene times. Boll. Della Soc. Geol. Ital. 2003, 122, 251–266. [Google Scholar]
  95. Centamore, E.; Dramis, F.; Fubelli, G. Plio-Pleistocene tectonics in the Marche-Abruzzi peri-Adriatic belt. Rend. Online Soc. Geol. Ital. 2012, 21, 69–70. [Google Scholar]
  96. Piacentini, T.; Galli, A.; Marsala, V.; Miccadei, E. Analysis of soil erosion induced by heavy rainfall: A case study from the NE Abruzzo Hills Area in Central Italy. Water 2018, 10, 1314. [Google Scholar] [CrossRef] [Green Version]
  97. Carabella, C.; Boccabella, F.; Buccolini, M.; Ferrante, S.; Pacione, A.; Gregori, C.; Pagliani, T.; Piacentini, T.; Miccadei, E. Geomorphology of landslide–flood-critical areas in hilly catchments and urban areas for EWS (Feltrino Stream and Lanciano town, Abruzzo, Central Italy). J. Maps 2021, 17, 40–53. [Google Scholar] [CrossRef]
  98. Esposito, G.; Carabella, C.; Paglia, G.; Miccadei, E. Relationships between morphostructural/geological framework and landslide types: Historical landslides in the hilly piedmont area of abruzzo region (central Italy). Land 2021, 10, 287. [Google Scholar] [CrossRef]
  99. Rovida, A.; Locati, M.; Camassi, R.; Lolli, B.; Gasperini, P.; Antonucci, A. The Italian earthquake catalogue CPTI15-Version 3.0. 2021. Available online: https://emidius.mi.ingv.it/CPTI15-DBMI15/description_CPTI15_en.htm (accessed on 8 January 2021). [CrossRef]
  100. ISIDe Working Group Italian Seismological Instrumental and Parametric Database (ISIDe). 2007. Available online: http://terremoti.ingv.it/iside (accessed on 8 January 2021).
  101. Gruppo di lavoro Gruppo di Lavoro CPTI Catalogo Parametrico dei Terremoti Italiani. 2004. Available online: https://emidius.mi.ingv.it/CPTI04/ (accessed on 8 January 2021).
  102. Chiarabba, C.; Jovane, L.; DiStefano, R. A new view of Italian seismicity using 20 years of instrumental recordings. Tectonophysics 2005, 395, 251–268. [Google Scholar] [CrossRef]
  103. Miccolis, S.; Filippucci, M.; de Lorenzo, S.; Frepoli, A.; Pierri, P.; Tallarico, A. Seismogenic Structure Orientation and Stress Field of the Gargano Promontory (Southern Italy) From Microseismicity Analysis. Front. Earth Sci. 2021, 9, 589332. [Google Scholar] [CrossRef]
  104. Mantovani, E.; Tamburelli, C.; Babbucci, D.; Viti, M.; Cenni, N. Tectonics and Seismicity in the periAdriatic Zones: Implications for Seismic Hazard in Italy. In Earthquakes-From Tectonics to Buildings; IntechOpen: London, UK, 2020; pp. 1–20. [Google Scholar]
  105. Kastelic, V.; Vannoli, P.; Burrato, P.; Fracassi, U.; Tiberti, M.M.; Valensise, G. Seismogenic sources in the Adriatic Domain. Mar. Pet. Geol. 2013, 42, 191–213. [Google Scholar] [CrossRef] [Green Version]
  106. Di Bucci, D.; Angeloni, P. Adria seismicity and seismotectonics: Review and critical discussion. Mar. Pet. Geol. 2013, 42, 182–190. [Google Scholar] [CrossRef]
  107. Tarquini, S.; Isola, I.; Favalli, M.; Battistini, A. Tinitaly, A Digital Elevation Model. of Italy with a 10 Meters Cell Size (Version 1.0) [Data Set]; Istituto Nazionale di Geofisica e Vulcanologia (INGV): Rome, Italy, 2007. [CrossRef]
  108. Tarquini, S.; Vinci, S.; Favalli, M.; Doumaz, F.; Fornaciai, A.; Nannipieri, L. Release of a 10-m-resolution DEM for the Italian territory: Comparison with global-coverage DEMs and anaglyph-mode exploration via the web. Comput. Geosci. 2012, 38, 168–170. [Google Scholar] [CrossRef] [Green Version]
  109. Strahler, A.N. Quantitative classification of watershed geomorphology. Trans. Am. Geophys. Union 1957, 38, 913–920. [Google Scholar] [CrossRef] [Green Version]
  110. Schwanghart, W.; Kuhn, N.J. TopoToolbox: A set of Matlab functions for topographic analysis. Environ. Model. Softw. 2010, 25, 770–781. [Google Scholar] [CrossRef]
  111. Schwanghart, W.; Scherler, D. Short Communication: TopoToolbox 2-MATLAB-based software for topographic analysis and modeling in Earth surface sciences. Earth Surf. Dyn. 2014, 2, 1–7. [Google Scholar] [CrossRef] [Green Version]
  112. Oguchi, T. Drainage density and relative relief in humid steep mountains with frequent slope failure. Earth Surf. Process. Landforms 1997, 22, 107–120. [Google Scholar] [CrossRef]
  113. Pavano, F.; Romagnoli, G.; Tortorici, G.; Catalano, S. Morphometric evidences of recent tectonic deformation along the southeastern margin of the Hyblean Plateau (SE-Sicily, Italy). Geomorphology 2019, 342, 1–19. [Google Scholar] [CrossRef]
  114. Bhat, M.A.; Dar, T.; Bali, B.S. Morphotectonic analysis of Aripal Basin in the North-Western Himalayas (India): An evaluation of tectonics derived from geomorphic indices. Quat. Int. 2020, 568, 103–115. [Google Scholar] [CrossRef]
  115. Romshoo, S.A.; Bhat, S.A.; Rashid, I. Geoinformatics for assessing the morphometric control on hydrological response at watershed scale in the upper Indus Basin. J. Earth Syst. Sci. 2012, 121, 659–686. [Google Scholar] [CrossRef] [Green Version]
  116. D’Agostino, N.; Jackson, J.A.; Dramis, F.; Funiciello, R. Interactions between mantle upwelling, drainage evolution and active normal faulting: An example from the central Appennines (Italy). Geophys. J. Int. 2001, 147, 475–497. [Google Scholar] [CrossRef]
  117. Piacentini, T.; Miccadei, E. The role of drainage systems and intermontane basins in the Quaternary landscape of the Central Apennines chain (Italy). Rend. Lincei 2014, 25, 139–150. [Google Scholar] [CrossRef]
  118. Geurts, A.H.; Cowie, P.A.; Duclaux, G.; Gawthorpe, R.L.; Huismans, R.S.; Pedersen, V.K.; Wedmore, L.N.J. Drainage integration and sediment dispersal in active continental rifts: A numerical modelling study of the central Italian Apennines. Basin Res. 2018, 30, 965–989. [Google Scholar] [CrossRef]
  119. Geurts, A.H.; Whittaker, A.C.; Gawthorpe, R.L.; Cowie, P.A. Transient landscape and stratigraphic responses to drainage integration in the actively extending central Italian Apennines. Geomorphology 2020, 353, 107013. [Google Scholar] [CrossRef]
  120. Chen, Y.C.; Sung, Q.; Cheng, K.Y. Along-strike variations of morphotectonic features in the Western Foothills of Taiwan: Tectonic implications based on stream-gradient and hypsometric analysis. Geomorphology 2003, 56, 109–137. [Google Scholar] [CrossRef]
  121. Walcott, R.C.; Summerfield, M.A. Scale dependence of hypsometric integrals: An analysis of southeast African basins. Geomorphology 2008, 96, 174–186. [Google Scholar] [CrossRef]
  122. Pérez-Peña, J.V.; Azañón, J.M.; Booth-Rea, G.; Azor, A.; Delgado, J. Differentiating geology and tectonics using a spatial autocorrelation technique for the hypsometric integral. J. Geophys. Res. Earth Surf. 2009, 114, 1–15. [Google Scholar] [CrossRef]
  123. Prasicek, G.; Otto, J.C.; Montgomery, D.R.; Schrott, L. Multi-scale curvature for automated identification of glaciated mountain landscapes. Geomorphology 2014, 209, 53–65. [Google Scholar] [CrossRef] [PubMed] [Green Version]
  124. Langbein, W.B. Topographic Characteristics of Drainage Basins. US Geol. Soc. Water Supply Pap. 1947, 968, 125–157. [Google Scholar]
  125. Strahler, A.N. Hypsometric (area-altitude) analysis of erosional topography. Bull. Geol. Soc. Am. 1952, 63, 1117–1142. [Google Scholar] [CrossRef]
  126. Pike, R.J.; Wilson, S.E. Elevation-relief ratio, hypsometric integral, and geomorphic area-altitude analysis. Bull. Geol. Soc. Am. 1971, 82, 1079–1084. [Google Scholar] [CrossRef]
  127. Ji, Y.; Su, S.; Liu, Z.; Huang, Q. Assessment of tectonic activity based on the geomorphic indices in the middle reaches of the upstream of Jinsha River, China. Geol. J. 2021, 1–18. [Google Scholar] [CrossRef]
  128. Giaconia, F.; Booth-Rea, G.; Martínez-Martínez, J.M.; Azañón, J.M.; Pérez-Peña, J.V. Geomorphic analysis of the Sierra Cabrera, an active pop-up in the constrictional domain of conjugate strike-slip faults: The Palomares and Polopos fault zones (eastern Betics, SE Spain). Tectonophysics 2012, 580, 27–42. [Google Scholar] [CrossRef]
  129. Balla Ateba, C.; Owona, S.; Nsangou Ngapna, M.; Manga Tsimi, V.; Minyem, D.; Mvondo Ondoa, J. Lithostructural controls in Douala-Buea Region landscape (SW Cameroon margin): Insights from morphometric analysis. J. Mt. Sci. 2021, 18, 68–87. [Google Scholar] [CrossRef]
  130. Argyriou, A.V.; Teeuw, R.M.; Soupios, P.; Sarris, A. Neotectonic control on drainage systems: GIS-based geomorphometric and morphotectonic assessment for Crete, Greece. J. Struct. Geol. 2017, 104, 93–111. [Google Scholar] [CrossRef] [Green Version]
  131. Anand, A.K.; Pradhan, S.P. Assessment of active tectonics from geomorphic indices and morphometric parameters in part of Ganga basin. J. Mt. Sci. 2019, 16, 1943–1961. [Google Scholar] [CrossRef]
  132. Pérez-Peña, J.V.; Azor, A.; Azañón, J.M.; Keller, E.A. Active tectonics in the Sierra Nevada (Betic Cordillera, SE Spain): Insights from geomorphic indexes and drainage pattern analysis. Geomorphology 2010, 119, 74–87. [Google Scholar] [CrossRef]
  133. Pánek, T. The use of morphometric parameters in tectonic geomorphology (on the example of the Western Beskydy Mts). Acta Univ. Carol. Geogre 2004, 1, 111–126. [Google Scholar]
  134. Rai, P.K.; Mohan, K.; Mishra, S.; Ahmad, A.; Mishra, V.N. A GIS-based approach in drainage morphometric analysis of Kanhar River Basin, India. Appl. Water Sci. 2017, 7, 217–232. [Google Scholar] [CrossRef] [Green Version]
  135. Psomiadis, E.; Charizopoulos, N.; Soulis, K.X.; Efthimiou, N. Investigating the correlation of tectonic and morphometric characteristics with the hydrological response in a Greek river catchment using earth observation and geospatial analysis techniques. Geoscience 2020, 10, 377. [Google Scholar] [CrossRef]
  136. Melton, M.A. The geomorphic and palaeoclimatic significance of alluvial deposits in Southern Arizona. J. Geol. 1965, 73, 1–38. [Google Scholar] [CrossRef]
  137. Molin, P.; Pazzaglia, F.J.; Dramis, F. Geomorphic expression of active tectonics in a rapidly-deforming forearc, Sila Massif, Calabria, southern Italy. Am. J. Sci. 2004, 304, 559–589. [Google Scholar] [CrossRef]
  138. Menier, D.; Mathew, M.; Pubellier, M.; Sapin, F.; Delcaillau, B.; Siddiqui, N.; Ramkumar, M.; Santosh, M. Landscape response to progressive tectonic and climatic forcing in NW Borneo: Implications for geological and geomorphic controls on flood hazard. Sci. Rep. 2017, 7, 457. [Google Scholar] [CrossRef] [PubMed] [Green Version]
  139. Siddiqui, S.; Castaldini, D.; Soldati, M. DEM-based drainage network analysis using steepness and Hack SL indices to identify areas of differential uplift in Emilia–Romagna Apennines, northern Italy. Arab. J. Geosci. 2017, 10, 3. [Google Scholar] [CrossRef]
  140. Pavano, F.; Pazzaglia, F.J.; Catalano, S. Knickpoints as geomorphic markers of active tectonics: A case study from northeastern Sicily (southern Italy). Lithosphere 2016, 8, 633–648. [Google Scholar] [CrossRef] [Green Version]
  141. Castillo, M.; Muñoz-Salinas, E.; Ferrari, L. Response of a landscape to tectonics using channel steepness indices (ksn) and OSL: A case of study from the Jalisco Block, Western Mexico. Geomorphology 2014, 221, 204–214. [Google Scholar] [CrossRef]
  142. Kirby, E.; Whipple, K. Quantifying differential rock-uplift rates via stream profile analysis. Geology 2001, 29, 415–418. [Google Scholar] [CrossRef]
  143. Roe, G.H.; Montgomery, D.R.; Hallet, B. Effects of orographic precipitation variations on the concavity of steady-state river profiles. Geology 2002, 30, 143–146. [Google Scholar] [CrossRef]
  144. Miccadei, E.; Piacentini, T.; Gerbasi, F.; Daverio, F. Morphotectonic map of the Osento River basin (Abruzzo, Italy), scale 1:30,000. J. Maps 2012, 8, 62–73. [Google Scholar] [CrossRef]
  145. Gioia, D.; Schiattarella, M.; Giano, S.I. Right-angle pattern of minor fluvial networks from the ionian terraced belt, southern Italy: Passive structural control or foreland bending? Geoscience 2018, 8, 331. [Google Scholar] [CrossRef] [Green Version]
  146. Merritts, D.J.; Vincent, K.R.; Wohl, E.E. Long river profiles, tectonism, and eustasy: A guide to interpreting fluvial terraces. J. Geophys. Res. Solid Earth 2004, 99, 31–50. [Google Scholar] [CrossRef]
  147. Maddy, D. Uplift-driven valley incision and river terrace formation in southern England. J. Quat. Sci. 1997, 12, 539–545. [Google Scholar] [CrossRef]
  148. Kiden, P.; Törnqvist, T.E. Can river terrace flights be used to quantify Quaternary tectonic uplift rates? J. Quat. Sci. 1998, 13, 573–575. [Google Scholar] [CrossRef]
  149. Lavé, J.; Avouac, J.P. Active folding of fluvial terraces across the Siwaliks Hills, Himalayas of central Nepal. J. Geophys. Res. Solid Earth 2000, 105, 5735–5770. [Google Scholar] [CrossRef] [Green Version]
  150. Wegmann, K.W.; Pazzaglia, F.J. Late Quaternary fluvial terraces of the Romagna and Marche Apennines, Italy: Climatic, lithologic, and tectonic controls on terrace genesis in an active orogen. Quat. Sci. Rev. 2009, 28, 137–165. [Google Scholar] [CrossRef]
  151. Personius, S.F. Late Quaternary stream incision and uplift in the forearc of the Cascadia subduction zone, western Oregon. J. Geophys. Res. 1995, 100, 20193–20210. [Google Scholar] [CrossRef]
  152. Pazzaglia, F.J.; Brandon, M.T. A fluvial record of long-term steady-state uplift and erosion across the Cascadia forearc high, western Washington State. Am. J. Sci. 2001, 301, 385–431. [Google Scholar] [CrossRef]
  153. Ramírez-Herrera, M.T.; Gaidzik, K.; Forman, S.L. Spatial Variations of Tectonic Uplift-Subducting Plate Effects on the Guerrero Forearc, Mexico. Front. Earth Sci. 2021, 8, 573081. [Google Scholar] [CrossRef]
  154. Lavé, J.; Avouac, J.P. Fluvial incision and tectonic uplift across the Himalayas of central Nepal. J. Geophys. Res. Solid Earth 2001, 106, 26561–26591. [Google Scholar] [CrossRef] [Green Version]
  155. Vannoli, P.; Basili, R.; Valensise, G. New geomorphic evidence for anticlinal growth driven by blind-thrust faulting along the northern Marche coastal belt (central Italy). J. Seismol. 2004, 8, 297–312. [Google Scholar] [CrossRef]
  156. Agostini, S.; Di Canzio, E.; Rossi, M.A. Abruzzo (Italy): The Plio-Pleistocene proboscidean-bearing sites. In Proceedings of the The World of Elephants-International Congress; Cavarretta, G., Gioia, P., Mussi, M., Palombo, M.R., Eds.; Consiglio Nazionale delle Ricerche (CNR): Rome, Italy, 2001; pp. 163–166. [Google Scholar]
  157. ISPRA Geological Map of Italy, Scale 1:50,000, Sheet 339 Teramo. Available online: https://www.isprambiente.gov.it/Media/carg/339_TERAMO/Foglio.html (accessed on 28 March 2021).
  158. ISPRA Geological Map of Italy, Scale 1:50,000, Sheet 361 Chieti. Available online: http://www.isprambiente.gov.it/Media/carg/361_CHIETI/Foglio.html (accessed on 15 March 2021).
  159. Ricci, F. Evoluzione Geomorfologica Tardo-Quaternaria della zona costiera Abruzzese. Ph.D. Thesis, University G. d’Annunzio of Chieti, Chieti, Italy, 2005. [Google Scholar]
  160. Tucker, G.E.; Whipple, K.X. Topographic outcomes predicted by stream erosion models: Sensitivity analysis and intermodel comparison. J. Geophys. Res. Solid Earth 2002, 107, 1–16. [Google Scholar] [CrossRef] [Green Version]
  161. DISS Working Group Database of Individual Seismogenic Sources (DISS). Version 3.2.1: A Compilation of Potential Sources for Earthquakes Larger than M 5.5 in Italy and Surrounding Areas. 2018. Available online: http://diss.rm.ingv.it/diss/index.php/DISS321 (accessed on 25 January 2021).
  162. Bigi, S.; Centamore, E.; Nisio, S. Caratteri geologico-strutturali dell’area pedeappenninica marchigiano-abruzzese durante il Pleistocene. Stud. Geol. Camerti 1999, 14, 193–200. [Google Scholar]
  163. Pizzi, A. Plio-Quaternary uplift rates in the outer zone of the central Apennines fold-and-thrust belt, Italy. Quat. Int. 2003, 101–102, 229–237. [Google Scholar] [CrossRef]
  164. Ciotoli, G.; Lombardi, S.; Morandi, S.; Zarlenga, F. A multidisciplinary, statistical approach to study the relationships between helium leakage and neotectonic activity in a gas province: The Vasto basin, Abruzzo-Molise (central Italy). Am. Assoc. Pet. Geol. Bull. 2004, 88, 335–372. [Google Scholar] [CrossRef]
  165. Di Bucci, D.; Ravaglia, A.; Seno, S.; Toscani, G.; Fracassi, U.; Valensise, G. Seismotectonics of the southern Apennines and Adriatic foreland: Insights on active regional E-W shear zones from analogue modeling. Tectonics 2006, 25, TC4015. [Google Scholar] [CrossRef] [Green Version]
  166. Racano, S.; Fubelli, G.; Centamore, E.; Bonasera, M.; Dramis, F. Geomorphological detection of surface effects induced by active blind thrusts in the southern Abruzzi peri-Adriatic belt (Central Italy). Geogr. Fis. Din. Quat. 2020, 43, 3–13. [Google Scholar] [CrossRef]
  167. Scisciani, V.; Calamita, F.; Tavarnelli, E.; Rusciadelli, G.; Ori, G.G.; Paltrinieri, W. Foreland-dipping normal faults in the inner edges of syn-orogenic basins: A case from the Central Apennines, Italy. Tectonophysics 2001, 330, 211–224. [Google Scholar] [CrossRef]
  168. Burrato, P.; Vannoli, P.; Fracassi, U.; Basili, R.; Valensise, G. Is blind faulting truly invisible? Tectonic-controlled drainage evolution in the epicentral area of the May 2012, Emilia-Romagna earthquake sequence (northern Italy). Ann. Geophys. 2012, 55, 525–531. [Google Scholar] [CrossRef]
Figure 1. (a) Location map of the study area in Central Italy. The red line indicates the study area; (b) Geological sketch map of the central-eastern Apennines and Periadriatic areas. Legend: Post–orogenic deposits—(1) fluvial and eluvial-colluvial deposits (Holocene), (2) fluvial and alluvial fan terraced deposits (Middle-Late Pleistocene); sin- and late-orogenic deposits—(3) clayey–sandy hemipelagic deposits (Late Pliocene–Early Pleistocene), (4) pelitic–arenaceous turbiditic deposits (Late Miocene–Early Pliocene); Pre–orogenic deposits—(5) clayey–marly allochthonous deposits of the Molise sequences (Oligocene–Miocene), (6) limestones of carbonate ramp sequences (Early Miocene–Early Pliocene), (7) limestones and marls of slope-to-pelagic basin sequences (Cretaceous–Miocene), (8) limestones of carbonate platform sequences (Jurassic–Miocene); (9) coastline; (10) major rivers; (11) study area.
Geosciences 11 00397 g001
Figure 2. Main morphotectonic domains, tectonics (modified from [89]), and seismicity [99,100] of the central-eastern Apennines and Periadriatic areas.
Geosciences 11 00397 g002
Figure 3. Thematic maps of the main morphometric parameters. (a) drainage basin slope (Sb); (b) hypsometric integral (Hi); (c) absolute asymmetry factor (Af); (d) relief ratio (Rh); (e) Melton’s ruggedness number. Black lines represent the watershed of the main 16 basins analyzed. Numbers refer to the basins in Table 1.
Geosciences 11 00397 g003
Figure 4. Index of Relative Tectonic Activity (Irta) map. Black lines represent the watershed of the main 16 basins analyzed. Numbers refer to the basins in Table 1.
Geosciences 11 00397 g004
Figure 5. Stream length-gradient index map. Black lines represent the watershed of the main 16 basins analyzed. Numbers refer to the basins in Table 1.
Geosciences 11 00397 g005
Figure 6. Normalized steepness index (ksn) map. Red dots represent the knickpoint of the analyzed basins (i.e., Tronto R., Vomano R., Pescara R., and Sangro R.); red star represents the artificial knickpoint. Black lines represent the watershed of the main 16 basins analyzed. Numbers refer to the basins in Table 1.
Geosciences 11 00397 g006
Figure 7. Morphological field evidence of tectonics over the study area (for the location of the frames, see Figure S1 in Supplementary material). Legend: (1) triangular facets (point of identification), (2) hanging valleys, (3) beheaded valleys, (4) river bends, (5) rectilinear fluvial segments, (6) 90° confluences, and (7) counterflows confluences. (a) Frame in the left valley side of the middle Tronto River valley; (b) triangular facets along a secondary stream of the Tronto River; (c) frame in the left valley side of the middle Pescara River valley; (d) panoramic view of a stream characterized by rectilinear fluvial segments, counterflow confluences, hanging valleys, and triangular facets; (e) frame in the left valley side of the middle Sangro River valley; (f) panoramic view of a stream characterized by river bends and triangular facets. Note: a main map of these morphological field evidence is provided as Supplementary material (Figure S1).
Geosciences 11 00397 g007
Figure 8. (a) Fluvial terraces scheme over the Abruzzo Periadriatic Area. The order of the river terraces was defined individually for each basin. Black lines represent the watershed of the main 16 basins analyzed. (b) Panoramic view of the distribution of the fluvial terraces near the confluence between Cigno and Pescara rivers. (c) Panoramic view of the distribution of the fluvial terraces in the lower reach of the Sangro River.
Geosciences 11 00397 g008
Figure 9. Altimetric and spatial arrangement of terrace remnants along with the longitudinal profiles of analyzed river basins: (a) Tronto River; (b) Vomano River; (c) Pescara River; (d) Sangro River. Each longitudinal profile is compared with the along-course lithological configuration (colored bar at the top). For the location of knickpoints see Figure 6. Note: colors and numbers of bedrock lithologies refer to Figure 1.
Geosciences 11 00397 g009
Figure 10. On the left column, the estimated incision rate of the analyzed river basins. On the right column, the comparison between the terrace and the river gradient. Note: the solid line represents the present-day gradient; the dashed line indicates the best fitting curve (orange curves represent the analyzed fluvial terrace bottom; green curves show the present-day valley bottom gradient).
Geosciences 11 00397 g010
Figure 11. Morphotectonic domains and structural elements of the Abruzzo Periadriatic Area. Black lines represent the watershed of the main 16 basins analyzed. Note: S1—compressive thrusts; F1, F2, and F3—normal fault systems; F4—transtensive fault systems.
Geosciences 11 00397 g011
Table 1. Main morphometric parameters of the basins in the study area.
N.°BasinArea
(km2)
Perimeter
(km)
Max. Elevation
(m a.s.l.)
Length
(km)
N. Sub–Basins
(4th–Order)
1Tronto River416.99139.731790.5834.5118
2Vibrata River101.7479.70436.7823.094
3Salinello River187.01118.951812.8834.485
4Tordino River389.73153.821709.9642.3825
5Vomano River402.42171.122543.9139.5415
6Piomba River105.9984.94747.5430.623
7Fino River279.3396.652467.5830.7211
8Tavo River202.36110.802021.3828.7311
9Pescara River821.06209.262791.1141.6139
10Alento River120.86103.331402.1729.983
11Foro River241.47110.591981.2431.698
12Moro River72.8368.56532.1721.363
13Feltrino River51.0547.96411.8314.731
14Sangro River1001.16203.162792.1149.9951
15Osento River126.1899.631007.8827.044
16Sinello River311.62142.751412.1439.9218
Publisher’s Note: MDPI stays neutral with regard to jurisdictional claims in published maps and institutional affiliations.

