Perspective

Inclusions of Amorphous and Crystalline SiO2 in Minerals from Itrongay (Madagascar) and Other Evidence for the Natural Occurrence of Hydrosilicate Fluids

by
Daniil V. Popov
1,2,*,
Richard A. Spikings
2 and
Théodore Razakamanana
3
1
School of Environment, Earth and Ecosystem Sciences, The Open University, Walton Hall, Milton Keynes MK7 6AA, UK
2
Department of Earth Sciences, University of Geneva, 13 Rue des Maraichers, CH-1205 Geneva, Switzerland
3
Département des Sciences de la Terre, Université de Toliara, BP 185, Toliara 601, Madagascar
*
Author to whom correspondence should be addressed.
Geosciences 2022, 12(1), 28; https://doi.org/10.3390/geosciences12010028
Submission received: 30 September 2021 / Revised: 13 December 2021 / Accepted: 4 January 2022 / Published: 7 January 2022
(This article belongs to the Section Geochemistry)

Abstract

:
Experimental studies increasingly often report low-temperature (200–800 °C) and low-pressure (0.05–3 kbar) hydrosilicate fluids with >40 wt.% of SiO2 and >10 wt.% of H2O. Compositionally similar fluids were long suggested to potentially exist in natural systems such as pegmatites and hydrothermal veins. However, they are rarely invoked in recent petrogenetic models, perhaps because of the scarcity of direct evidence for their natural occurrence. Here we review such evidence from previous works and add to this by documenting inclusions of hydrosilicate fluids in quartz and feldspar from Itrongay. The latter comprise opal-A, opal-CT, moganite and quartz inclusions that frequently contain H2O and have negative crystal shapes. They coexist with inclusions of CO2- and H2O-rich fluids and complex polycrystalline inclusions containing chlorides, sulphates, carbonates, arsenates, oxides, hydroxides and silicates, which we interpret as remnants of saline liquids. Collectively, previous studies and our new results indicate that hydrosilicate fluids may be common in the Earth’s crust, although their tendency to transform into quartz upon cooling and exhumation renders them difficult to recognise. These data warrant more comprehensive research into the nature of such hydrosilicate fluids and their distribution across a wide range of pressure and temperature conditions and geological systems.

1. Introduction

Any model of chemical and isotopic differentiation of rocks relies on the knowledge of which mineralising substances are involved in this process. These could be, for example, aluminosilicate melts in magmatic chambers, supercritical fluids in hydrothermal systems or aqueous solutions in evaporating lakes. In principle, there are three direct sources of information about what kinds of mineralising substances might be present in geological systems, which include observations of how minerals grow in places that can be accessed by humans, studies of inclusions in minerals, and petrological experiments. Our present work is concerned with an array of mineralising substances that are increasingly documented in petrological experiments, but have almost never been reported among inclusions in minerals or in natural settings where they could be directly observed. This array includes low-temperature (200–800 °C) and low-pressure (0.05–3 kbar) hydrosilicate fluids with >40 wt.% of SiO2 and >10 wt.% of H2O, which have been variably referred to as heavy fluids, silicothermal fluids, hydrosilicate liquids, silica gels or colloidal silica [1,2,3,4,5,6,7,8,9,10,11,12,13,14,15]. Fluids with similar compositions were long invoked in petrogenetic models of a wide range of geological systems, such as agates [16], quartz veins [17], greisens [3,18,19], pegmatites [20,21,22,23,24] and porphyry-type deposits [25,26]. However, many of these models have received little attention in the recent literature [27,28,29,30,31,32,33,34,35,36], probably because they were generally derived by interpretation of mineral and rock textures and lacked supporting evidence from inclusions in minerals and human-accessible environments. The aim of our work is to document evidence for the natural occurrence of hydrosilicate fluids, which includes a review of previous reports combined with our new observations, and thereby highlight the importance of the potential presence of hydrosilicate fluids in a wide range of pressure–temperature conditions and geological settings.

2. Previous Work

2.1. Experimental Evidence

A growing number of experimental studies were able to synthesise hydrosilicate fluids at 200–800 °C and 0.05–3 kbar in systems that contain H2O and SiO2 with the addition of carbonates, fluorides, borates, sulphates, hydroxides and oxides of alkali elements, and sometimes Al2O3 [1,2,3,4,5,6,7,8,9,10,11,12,13,14,15]. These fluids have high concentrations of H2O, which somewhat correlate with temperature, and range from 10–20 wt.% at 800–500 °C to 30–45 wt.% at 300–200 °C [1,2,3,4,5,6,7,8,10,13,14,15]. Depending on the experimental conditions and the composition of experimental loads, dry residues of these fluids have 60–90 wt.% of SiO2, while the remaining 10–40 wt.% consists of Na2O, K2O, Al2O3 and other available components [1,2,3,4,5,6,7,8,10,13,14,15]. Most of the reported compositions are clearly peralkaline, meaning that the (K + Na + Li + Rb + Cs)/Al molecular ratio is above 1, even when Al2O3 was intentionally added to the experimental loads [1,2,3,4,5,6,7,8,10,13,14,15]. However, in some cases hydrosilicate fluids had concentrated Al2O3 that was not intentionally added to the experimental loads but was presumably present as a trace component to the extent making them peraluminous, meaning the Al/(Ca + K + Na + Li + Rb + Cs) molecular ratio was above 1 [10].
The physical nature of hydrosilicate fluids is not well established, but they reportedly differ from regular aluminosilicate melts in several respects. Hydrosilicate fluids were synthesised at temperatures nearing 200 °C, which is significantly lower than the wet granite solidus of ≳640 °C [37]. Hydrosilicate fluids have higher concentrations of H2O than regular meta- to peraluminous aluminosilicate melts, which can only dissolve up to 8 wt.% of H2O at 3 kbar and even less at lower pressures [37,38] (Figure 1a). This difference narrows, though still remains, when hydrosilicate fluids are compared with peralkaline aluminosilicate melts, which have higher solubilities of H2O [4,39] (Figure 1a). It is only at ≳10 kbar that most regular aluminosilicate melts with comparable temperatures can have the same ranges of H2O and SiO2 concentrations as hydrosilicate fluids [40,41], although lower critical pressures were reported for some peralkaline compositions [42]. Hydrosilicate fluids further differ from regular aluminosilicate melts by having a lower viscosity, which amounts to 1–2 Pa·s at 600 °C [15] and remains sufficiently low to allow immiscibility phenomena and bubble migration within quartz-hosted synthetic inclusions at 200–350 °C [3,7,8,9,10,11,12] (Figure 1b). This is orders of magnitude less than expected for aluminosilicate melts of meta- to peraluminous affinity according to the model of [43], and only a few examples of H2O-rich peralkaline aluminosilicate melts were reported to have similar viscosities at 600 °C [44] (Figure 1b).
Quenching products of hydrosilicate fluids also differ from those of regular aluminosilicate melts. After cooling to room temperature, hydrosilicate fluids form either a vitreous phase or a soft rubbery matter, which stiffens and shrinks with time and transforms into a vitreous phase or a white powder [1,2,6,13,14,15]. Some of the vitreous phases were reported to be variably soluble [1,2]. If not soluble, the vitreous phases are capable of dehydration when exposed to air and rehydration when immersed in H2O [6,13,14]. In such cases they are also capable of ion exchange when immersed in H2O [6,13,14]. One study reports that interaction of a vitreous phase with regularly renewed H2O over a period of 6 months increased its SiO2/(SiO2 + B2O3 + Na2O) weight ratio from an average of 0.67 to 0.93, i.e., transformed it to a nearly pure silica gel [6]. When heated, quenched hydrosilicate fluids considerably dehydrate at lower temperatures than regular aluminosilicate glasses [6,14]. Quartz-hosted synthetic inclusions of hydrosilicate fluids are hard to prepare for analysis, as they are frequently lost during sample preparation due to incomplete solidification or decomposition in air [7,8,10]. Some of these inclusions were found to partially crystallise over periods of years after the experiments [10] (Figure 2a–c).
The observations summarised above led previous studies to explicitly suggest or seemingly imply that the quenching products of hydrosilicate fluids represent gels rather than glasses [3,4,5,6,7,8,9,10,11,12,13,14,15]. There is less unanimity regarding the physical nature of these fluids at experimental temperatures; some studies advocate a colloidal state [6,10,13,14,15], while other studies discuss the possibility that they may be true solutions [4,7,9]. It is also unclear what the exact relationships are between hydrosilicate fluids and regular aluminosilicate melts. These are immiscible with each other in some cases [4] (Figure 2h), although it has also been suggested that hydrosilicate fluids can gradually fractionate from regular aluminosilicate melts [45] or precipitate from saturated aqueous fluids [14]. Regardless, hydrosilicate fluids can coexist with one low-salinity aqueous fluid [1,2,3,13,14,15] or multiple aqueous fluids of variable salinity and composition [9,10,11] (Figure 2a–g).

2.2. Evidence from Inclusions in Minerals

The assumed colloidal state of hydrosilicate fluids at low and potentially elevated temperatures [3,4,5,6,7,8,9,10,11,12,13,14,15] is likely to decrease the chances of both recognising their relics among inclusions in minerals and transforming them into their original state by reheating. Even simple fluid and melt inclusions can be irreversibly modified after their entrapment by crystallisation and diffusive re-equilibration with the host mineral and its surroundings [51,52,53,54,55,56]. In the case of colloid systems such modifications can be further complicated by ageing, which on its own can be irreversible [17,57,58]. Nevertheless, several studies report inclusions that were inferred to be hydrosilicate fluids, including SiO2-rich colloids, at the time of entrapment. Here we review these studies moving from higher- to lower-temperature systems.
Most recent pertinent works have focused on granitic pegmatites, and these can be separated into two sets of occasionally contradictory studies. The first set of studies is related to inclusions of hydrosilicate fluids with complex compositions. One group of researchers described inclusions in quartz from the Malkhan pegmatites (Russia) that contain a mixture of micas with other silicates and a fluid with a vapour bubble (akin to those in Figure 3a–c) [5,59,60,61]. They initially classified these as melt or fluid-melt inclusions [59,60] but later suggested that these are inclusions of recrystallised gels that represent remnants of higher-temperature hydrosilicate fluids [5,61]. They also proposed that so-called type-B melt inclusions from elsewhere probably represent something similar [5]. This resonates with the suggestion of another group of researchers that a vitreous phase in a rehomogenised type-B melt inclusion from elsewhere is a gel rather than a glass, because a mica crystal grew within it over a week spent at room temperature [21]. However, the latter group classified quartz-hosted inclusions from the Malkhan pegmatites that are akin to the aforementioned ones as peralkaline to peraluminous type-A melt inclusions (those in Figure 3a–c) [62]. These authors also reported quartz-hosted peralkaline type-B and type-C melt inclusions from the same locality, which consist of a large sassolite crystal, sometimes a few small silicate crystals, and a fluid with a vapour bubble (Figure 3d,e) [62]. The former group identified such inclusions as fluid inclusions [60,61]. It has also been suggested that all of these inclusions trapped boundary layer liquids between the growing minerals and aluminosilicate melts of relatively simple granitic composition [33,63].
The second set of pertinent studies from pegmatites reports inclusions that were inferred to contain silica gels. In addition to quartz-hosted type-A, type-B and type-C melt inclusions, one of the aforementioned studies of the Malkhan pegmatite describes inclusions of recrystallised silica gels in tourmaline, which consist of flaky quartz, sometimes moganite and cristobalite, and sometimes a fluid with a vapour bubble and a sassolite crystal (Figure 3f) [21,62]. The same researchers reported similar inclusions from elsewhere, including quartz- and plagioclase-hosted inclusions from the Rønne pegmatite (Denmark) that consist of flaky quartz, sometimes cristobalite, moganite and goethite, and sometimes a fluid with a vapor bubble and a calcite crystal; cleavelandite-hosted inclusions from the Naipa pegmatite (Mozambique) that consist of a ‘gel-like’ matter; and inclusions from Borborema (Brazil), Ehrenfriedersdorf (Germany), Königshain (Germany) and Muiane (Mozambique) pegmatites that lack pictures or descriptions [22]. Our own pegmatite-related study describes potential inclusions of hydrosilicate fluids in the Itrongay feldspar (Madagascar) that consist of opal and have negative crystal shapes [64] (see Section 3). Finally, quartz from the Volyn pegmatites (Ukraine) reportedly contains mm-scale inclusions that have opal, chalcedony and quartz deposits on the walls, which were interpreted as relics of gels that precipitated from trapped sols [51] and therein.
A series of papers reports inclusions of hydrosilicate fluids from greisens of the St. Austell intrusion (UK) [3,18,19]. These comprise topaz- and tourmaline-hosted inclusions that consist of one or several rounded crystals of quartz and sometimes several voids with irregular shapes and crystalline metal-rich fillings, which were interpreted to be vapour bubbles (Figure 3g) [3,18,19]. Similar inclusions were reported in an earlier study of quartz-topaz rocks of the New England batholith (Australia), where they were interpreted as inclusions of silicate melts [65]. However, as discussed in [18], such an interpretation is unlikely to be accurate because they are predominantly made of quartz.
Inclusions of hydrosilicate fluids were also described in agate and quartz from various low-temperature hydrothermal environments, such as massive sulphide deposits of the Central Urals (Russia) [51] and therein, alpine-type veins of the Southern Urals (Russia) [66], Iceland spar deposits on the Nizhnyaya Tunguska river (Russia) [51,67], and chalcedony veins in volcanic rocks from around Ijevan (Armenia) [68]. The earliest pertinent works classified these inclusions into spongy and fringed types and experimentally showed that the latter type can form by ageing of a sodium silicate gel (there is also a reference to double-shelled inclusions that were only obtained in experiments and globular inclusions that only contain aqueous fluids and have a secondary origin, which we therefore do not consider here) [51] and therein. In natural systems, spongy inclusions were suggested to form by the coagulation of gel flakes from sols followed by their deposition on growing mineral faces and entrapment [51]. Fringed inclusions were suggested to mainly form by entrapment and ageing of sols, which led to the deposition of gels on the walls of the inclusions in a process of coagulation followed by their contraction and the expulsion of liquids from them in a process of syneresis [51]. A slightly different mechanism was used to explain inclusions in chalcedony from the Iceland spar deposits on the Nizhnyaya Tunguska river (Figure 3h). These were suggested to form by the expulsion of syneresis liquids from an initially homogeneous gel that resulted in scattered spherical globules with vapour bubbles [51]. A broadly similar mechanism was proposed by a recent study that described identical inclusions from the same locality [67].

2.3. Evidence from Human-Accessible Environments

An important issue in the context of our study is that hydrosilicate fluids were almost never reported in natural environments. Although natural silica or silica-rich gels were reported from systems such as hot springs and lake deposits, they were generally suggested to be immobile or have very limited mobility and precipitate by various reactions or coagulation of sols that formed shortly before from true solutions [69,70,71]. Therefore, these gels do not necessarily represent natural analogues of experimental hydrosilicate fluids. However, the reviewed experimental evidence suggests that it may be difficult to recognise hydrosilicate fluids or their quenching products at surface conditions. Higher-temperature variants of hydrosilicate fluids are expected to rapidly quench to a vitreous phase [6,13,14,15] that may be routinely identified as volcanic glass. Lower-temperature variants of hydrosilicate fluids may remain unsolidified for some time before turning into a vitreous phase or a siliceous powder [13,14]. Their observation in the unsolidified state would probably require a special sampling procedure, while their solidification or decomposition products may be routinely identified as opaline silica. Nevertheless, one study described a natural material that resembles some of the lower-temperature variants of hydrosilicate fluids.
A silica gel was collected 300 m into the Italian side of the Simplon tunnel during its excavation in the late 19th century, where it filled a 10 cm-wide fracture in gneiss [72]. The specimen contained abundant crystals of quartz, less frequent crystals of ankerite and rare pyrite and mica crystals, all of which are shorter than 1 mm in their longest dimension. Drying in air followed by heating to 100 °C drove the loss of ~66 wt.% (inferred to be H2O loss), while a subsequent temperature increase to ‘calor rosso’ (until glowing red?) caused the loss of additional ~1.5 wt.% (inferred to be CO2 loss). The residue was predominantly composed of SiO2 (~93 wt.%) and contained Ca, Fe, Mg, Al, K and Li. The fracture discovered in the Simplon tunnel was suggested to host a quartz vein that is in the process of formation via the crystallisation of a silica gel precursor. Notably, the same mechanism for the formation of quartz veins was discussed in [17] with some additional references that date back to the late 19th century.

3. New Evidence

3.1. Materials

Our new observations were made on two samples from the Itrongay locality in southern Madagascar. One is a yellow gem-quality crystal of K-rich feldspar that we previously studied by combining petrological characterisation with 40Ar/39Ar dating [64]. The other is a blocky pegmatite composed of quartz and green gem-quality K-rich feldspar. The former sample was picked up from the ground near S 23°35′33″ E 45°34′06″, while the latter sample was collected from a tailings pile near an abandoned pit at S 23°35′10.1″ E 45°34′13.7″. The geological relationships between these samples are therefore not known, although several lines of evidence indicate the former probably postdates the latter [64].
Both samples are derived from a high-grade metamorphic domain that reached 7–9 kbar and 800–950 °C [73,74] as it formed during the Ediacaran to early Cambrian assembly of East and West Gondwana [74,75,76]. Most studies suggest that the high-grade metamorphism and associated magmatism in southern Madagascar ceased at ~520–500 Ma [74,75,76,77,78,79,80,81,82,83], and that rocks in the area cooled below ~400 °C between ~530–490 Ma [75,83,84], below ~300 °C between ~500–300 Ma [83,84,85,86] and through ~150–60 °C between ~400–200 Ma [84,85,87,88]. Published 40Ar/39Ar and K-Ca dates of gem-quality K-feldspar from the Itrongay locality span from ~477 to ~375 Ma [64,89,90,91], which we previously interpreted to mostly reflect crystallisation age variations [64]. Thus, the studied samples can be assumed to have formed in a series of events on a cooling path from peak metamorphic conditions when the temperature of the ambient rocks was between ~400–150 °C. These events cannot be linked to any magmatic activity using the available data.

3.2. Methods

The chosen samples were characterised by optical microscopy, cathodoluminescence (CL) and backscattered electron (BSE) imaging, Raman spectroscopy and semiquantitative chemical microanalysis. CL images were obtained using an ERI-MRTech stage at the University of Geneva on uncoated samples. Raman spectra were acquired at the Open University using a Horiba Jobin Yvon LabRam HR instrument with a 514.53 nm laser and a 600 groves per mm grating. The instrument was calibrated using a silicon crystal. Example Raman spectra of undermentioned phases other than varieties of SiO2 and those reported in [64] are provided as supplementary Figure S1. Reference spectra to identify these phases were taken from the RRUFF database [92]. BSE imaging and semiquantitative chemical microanalysis were carried out at the Open University on a FEI Quanta 200 3D FIB-SEM instrument with an Oxford Instruments INCA energy dispersive X-ray (EDS) detector. The instrument was operated at an acceleration voltage of 20 kV, and the probe current was typically held at 2.3 nA. The samples were coated with carbon.

3.3. Results

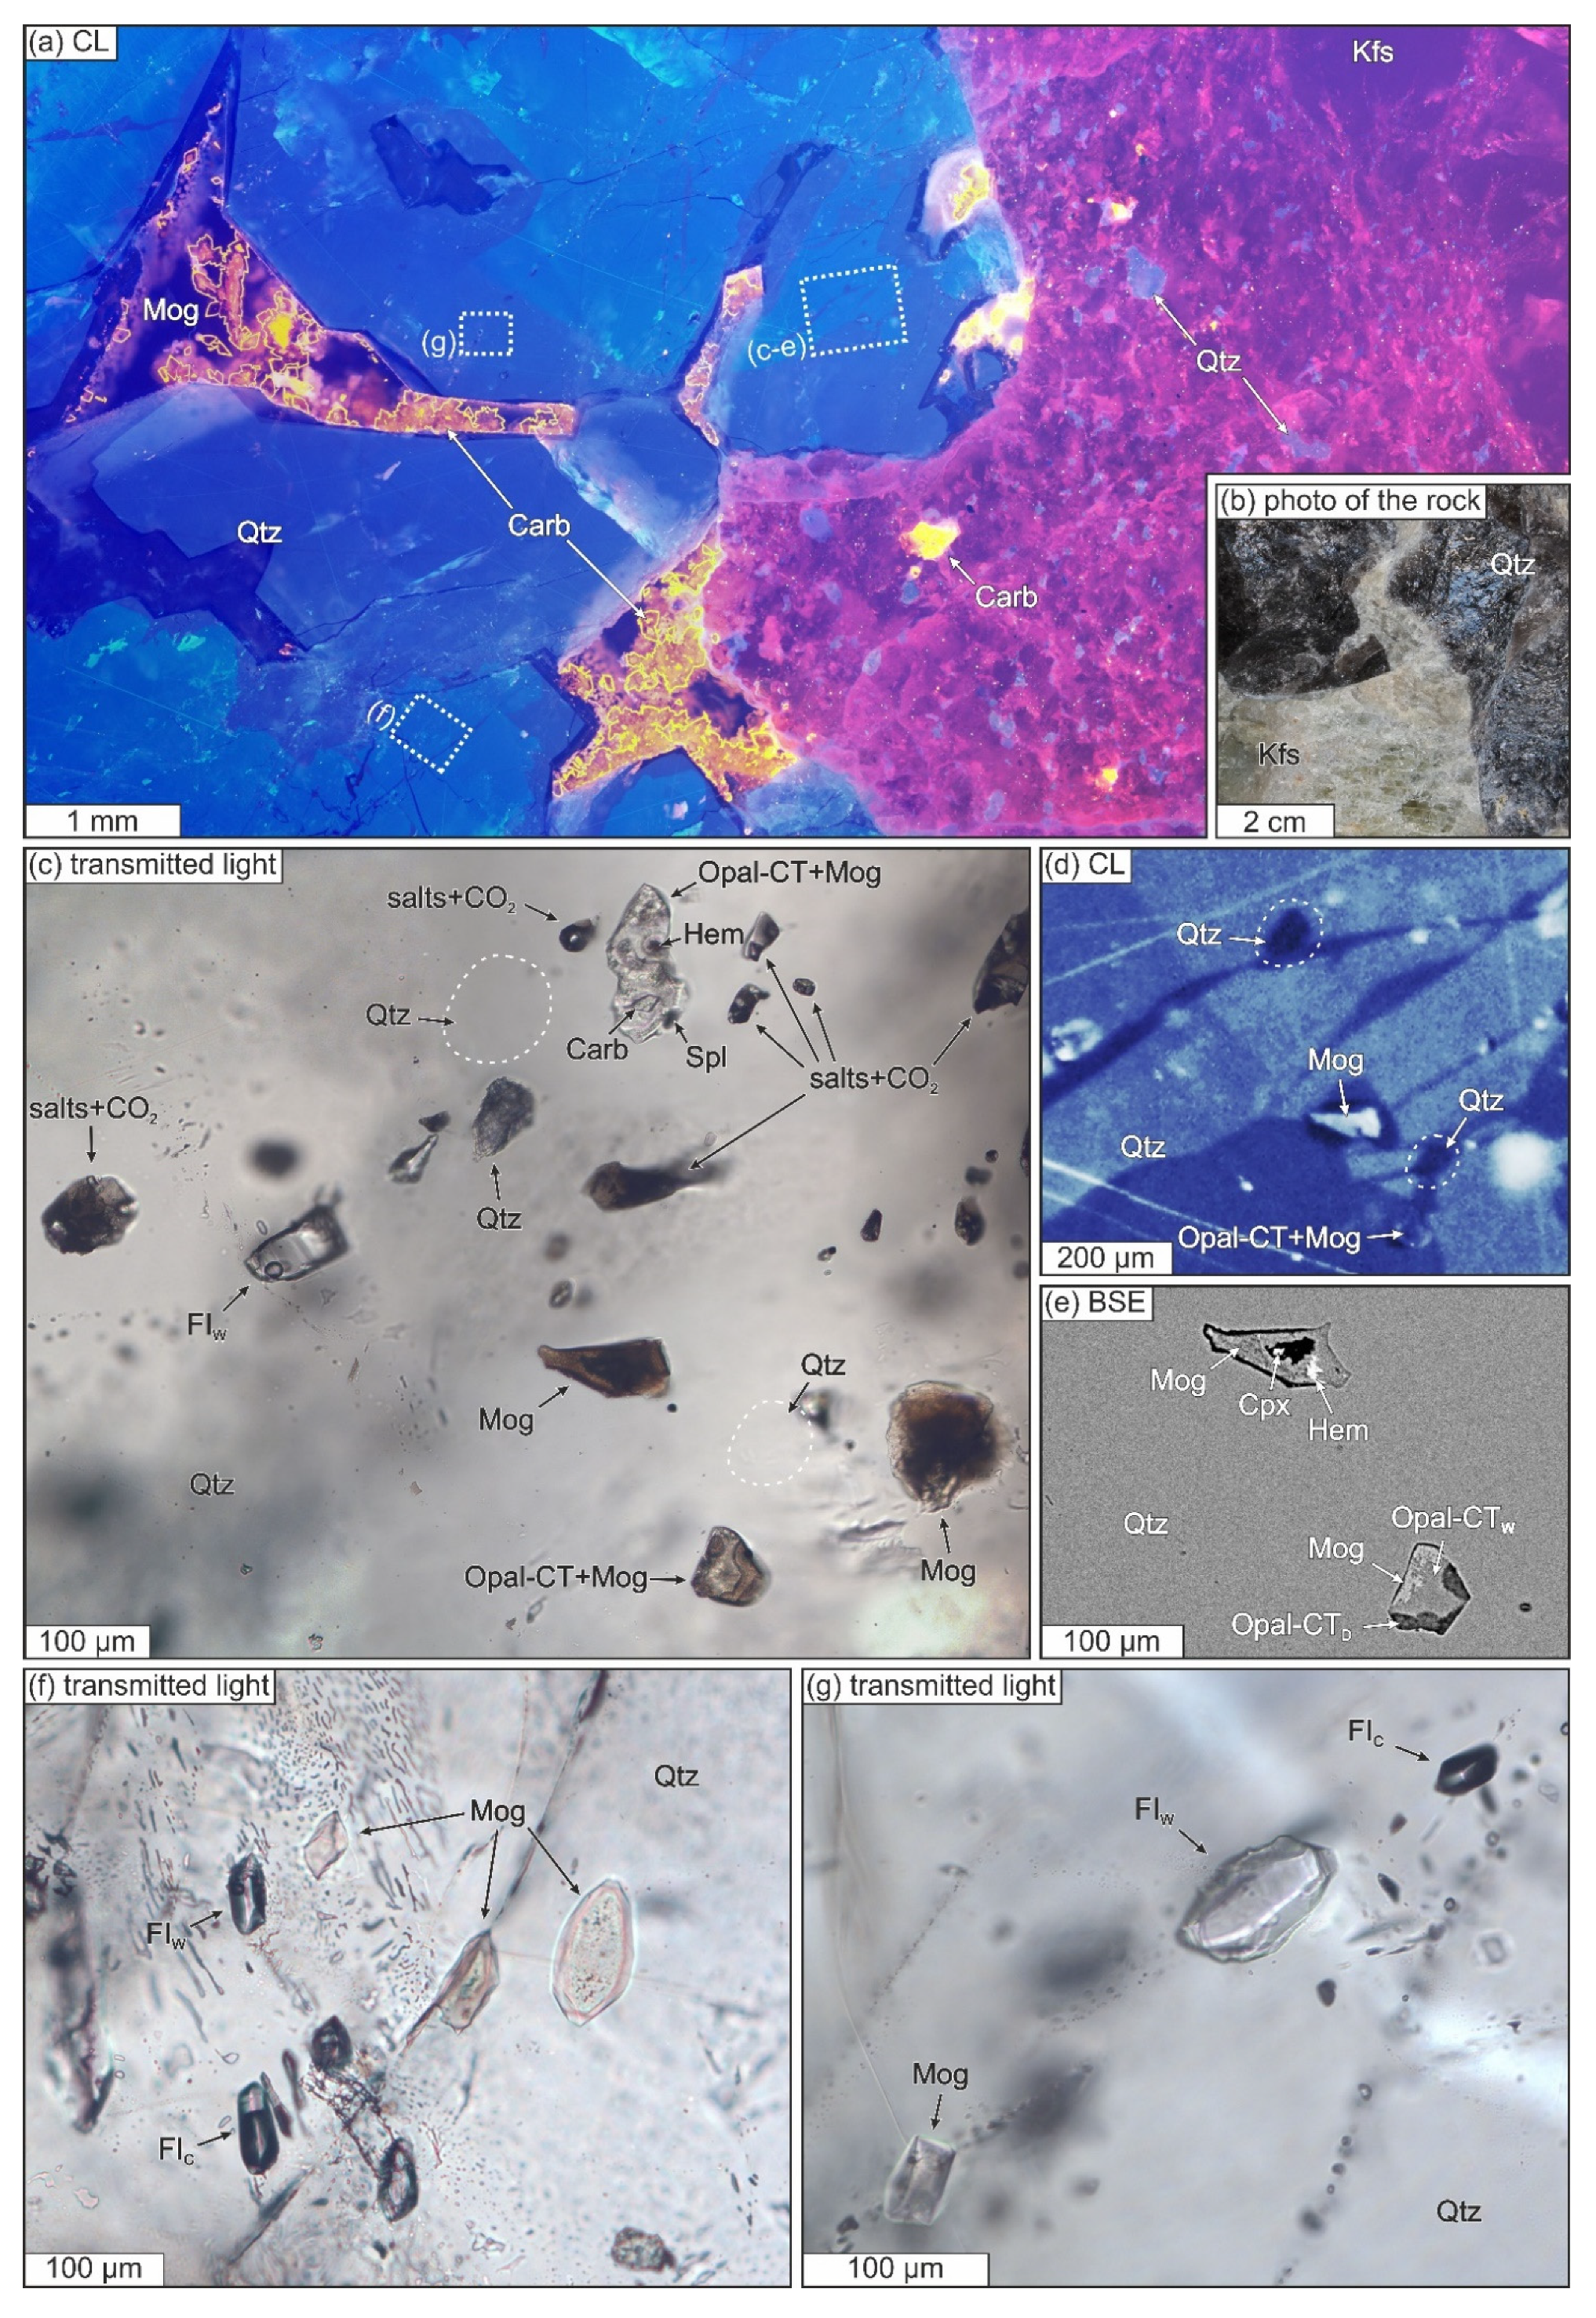
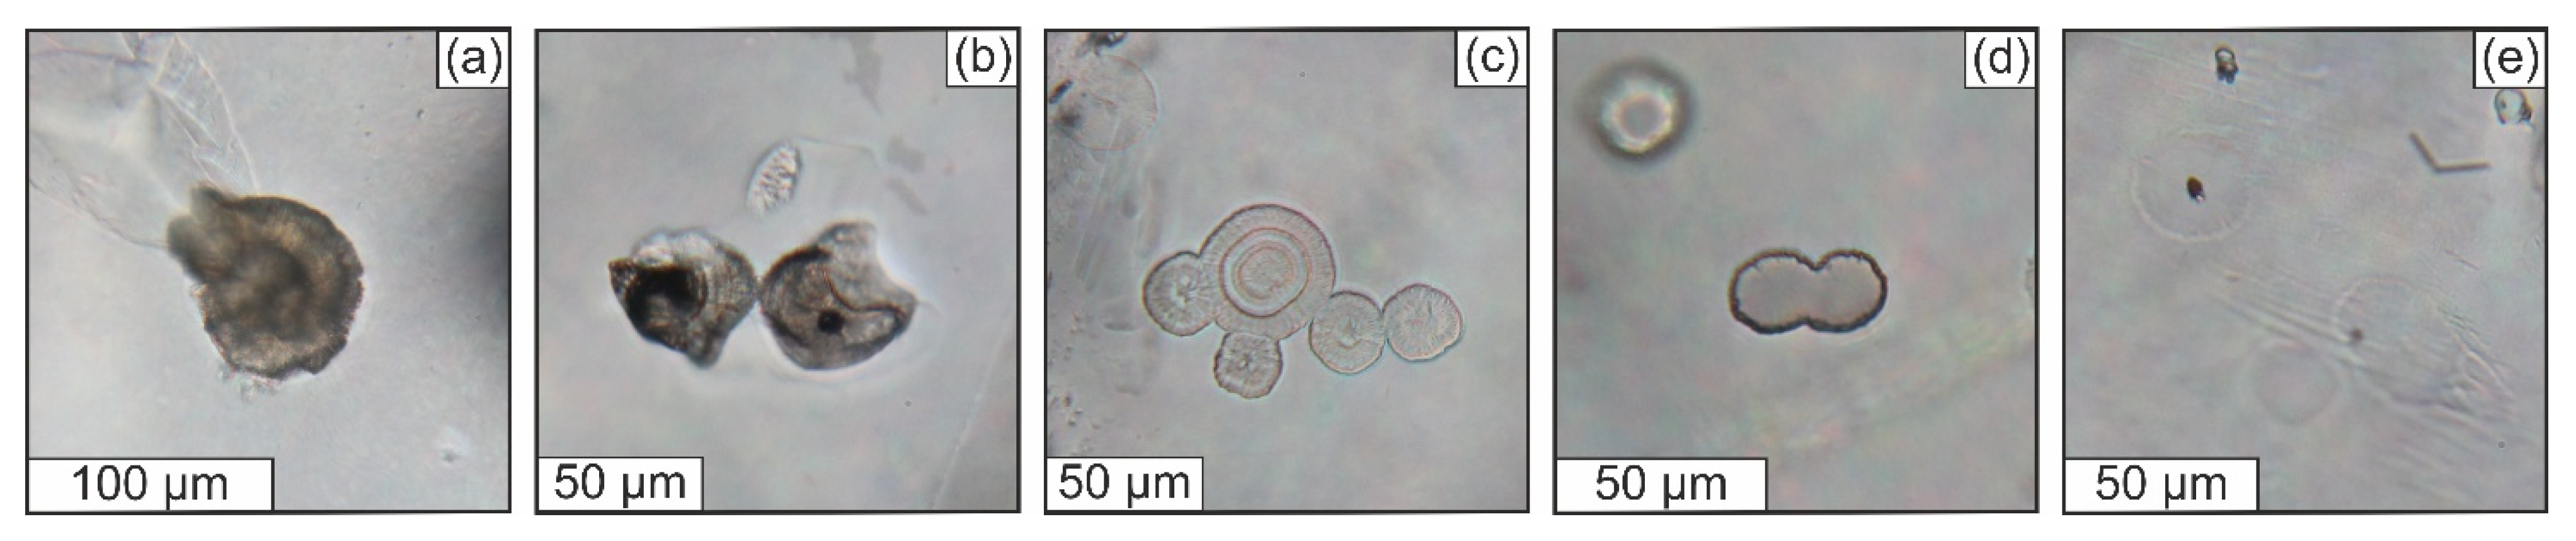
3.3.1. General Description of the Studied Samples

As previously reported [64], the yellow gem-quality K-feldspar crystal (Figure 4b) grew in five distinct episodes that were separated by tens to hundreds of millions of years. The first episode corresponds to the formation of the crystal core with very weak CL (Figure 4a), and its crystallisation age is estimated to be ~477 Ma. Two subsequent growth episodes were dated at ~402 and ~375 Ma, and both formed K-feldspar with bright blue CL (Figure 4a). All three of these episodes produced transparent gem-quality K-feldspar. The final two growth episodes produced ≲0.1 mm thick coatings of turbid K-feldspar with very weak CL (Figure 4a) that give the crystal a translucent appearance (Figure 4b). The older of these two episodes was dated at ~176 Ma, while the younger one could not be dated.
The core of the studied K-feldspar crystal contains primary inclusions of opal with negative crystal shapes (Figure 4c–e), which we previously interpreted as relics of a dense SiO2-rich colloid solution akin to the hydrosilicate fluids from the experiments in [3,11]. The core also contains primary inclusions of liquid CO2 with negative crystal shapes and daughter carbonate and apatite (Figure 4d,e), turbid carbonate inclusions (Figure 4d,e), and inclusions of pyroxene and apatite, some of which are xenocrysts (further images and details on phase identification are provided in [64]). We previously suggested that the turbid carbonate inclusions are xenocrysts with etched surfaces, which was partly due to their somewhat similar appearance to the apatite xenocrysts. However, a more careful examination of the inclusion shown in Figure 4d,e suggests that it has a negative crystal shape similar to the surrounding inclusions of opal and liquid CO2. Therefore, it probably represents a primary inclusion of a crystallised carbonate melt whose turbidity is related to the fine-grained texture of the material inside.
We have now acquired some additional petrological evidence with the initial aim to better understand the relationships between the studied K-feldspar crystal and the quartzofeldspathic pegmatites exposed in the area. The studied pegmatite sample (Figure 5b) consists of centimetre- to decimetre-scale crystals of smoky quartz and green gem-quality K- feldspar that share irregular boundaries (Figure 5a,b). Both minerals exhibit abundant evidence for a protracted history of interaction with fluids, although here we will only focus on that from quartz.
Optical microscopy revealed that quartz from the studied pegmatite sample contains numerous pockets of moganite-bearing chalcedony with suspended aggregates of carbonate rhombohedra (Figure 5a). In some cases, all quartz that surrounds these pockets has simultaneous extinction and thus may represent a single crystal. Many pockets have angular shapes, defined by the well-formed faces and tips of the surrounding quartz crystals that project into them. CL images reveal that quartz is zoned around the pockets (Figure 5a). At the very contact with chalcedony, it often has weak blue CL and sometimes forms zones with sharp straight boundaries. Moving away from the contact, these dark zones are followed by one or several zones with brighter CL and undulating boundaries, indicating that their crystallisation was preceded by quartz dissolution. Such resorption zones were only found within a few mm distance from the pockets, and the boundaries marking them were increasingly diffuse with increasing distance from the pockets. Quartz is intersected by numerous veins of quartz or chalcedony throughout the sample. Some of these veins can be readily identified in CL images, where they appear darker than the surrounding quartz, while others are easier to recognise by seeking secondary inclusions using an optical microscope.
Quartz is packed with inclusions of what we identify as at least four coexisting immiscible fluids (Figure 5c–g). The vast majority of inclusions occur in veins and are clearly secondary (Figure 5g). Isolated individual inclusions or three-dimensional groups of inclusions that could be classified as primary are rare and mostly occur near the aforementioned resorption zones (Figure 5c–f). The first two fluids are CO2- and H2O-rich fluids (Figure 5c,f,g). Inclusions of these fluids are typically well-faceted and have different bulk compositions in different groups and veins as indicated by the variations in the bubble to inclusion volumetric ratios. The third fluid in the system was a dense SiO2-rich fluid, inclusions of which currently contain various combinations of opal, moganite and quartz (Figure 5c–g). Their mineral composition was identified by Raman spectroscopy, which also typically revealed the presence of H2O (see next subsection for details). The only elements that we detected by EDS analysis of well-polished inclusions of this kind are Si and O. Such inclusions often have conspicuous faceting (Figure 5f,g), indicating that they indeed contained a fluid that allowed post-entrapment modification of their shape. The system also contained saline melts that currently form inclusions with multiple crystals of various salts and CO2 bubbles (Figure 5c). The salts include simple and complex chlorides, sulphates, carbonates, arsenates, oxides, hydroxides and silicates of Na, K, Ca, Ba, Sr, Cs, Pb, Fe, Zn and perhaps other elements, which we identified by a non-exhaustive Raman spectroscopy survey and EDS analysis of inclusions that we could crack open. Notably, neighbouring inclusions of this kind can have very different mineral and chemical compositions (e.g., those in the upper part of Figure 5c), suggesting that several immiscible saline melts may have existed in the system simultaneously.
The studied quartz has two further textural features that are notable in the context of our work. Firstly, CL images from regions with abundant inclusions of SiO2-rich fluids sometimes have areas with a relatively weak signal that are similar in size and shape to the inclusions (Figure 5d). However, when inspected in transmitted light, these areas appear as transparent quartz and are indistinguishable from the surrounding region. Are these inclusions of SiO2-rich fluids that were completely transformed to quartz and dehydrated? Secondly, a peculiar textural similarity exists between quartz and chalcedony in the aforementioned pockets and veins. Chalcedony contains abundant turbid spherulites that probably represent a growth texture of quartz (Figure 6a). Quartz also has such turbid spherulites (Figure 6b) and contains less turbid spherulites that range from translucent with conspicuous radiating fibres (Figure 6c) to completely transparent (Figure 6d) to faint and barely noticeable (Figure 6c,e). Many of these spherulites occur far from any obvious replacement textures such as veins or resorption zones. Does their presence imply that the surrounding quartz was formed by recrystallisation of chalcedony?

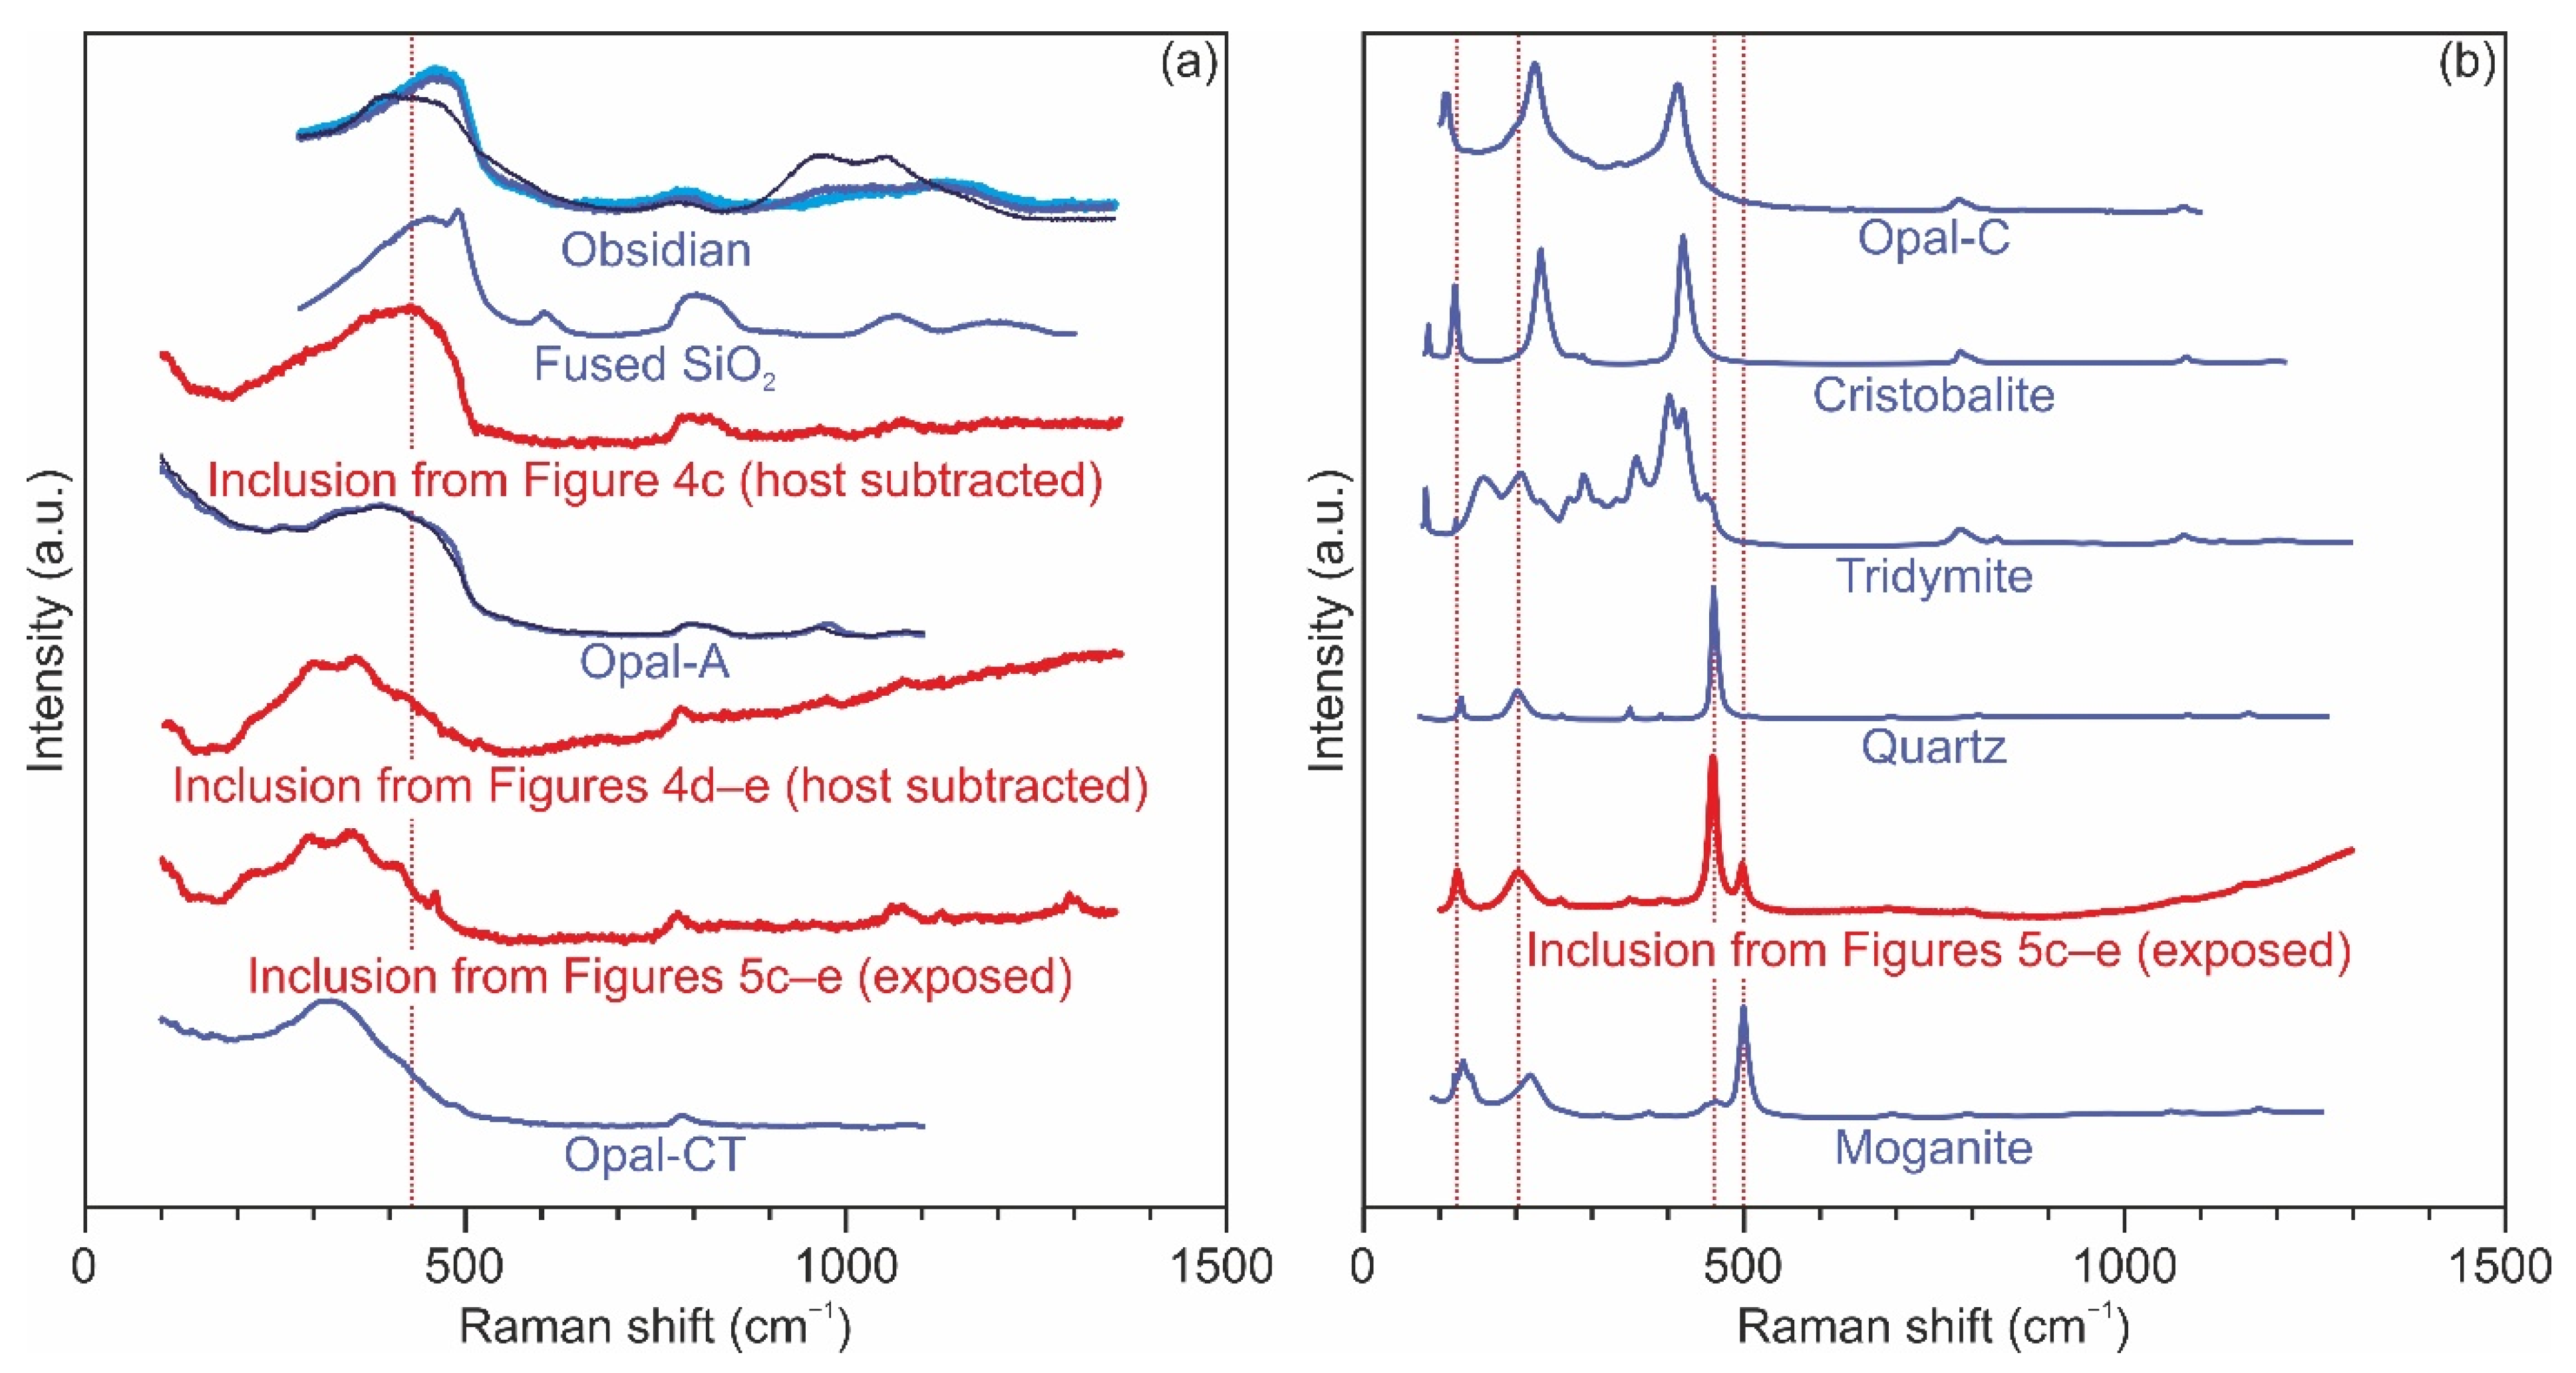
3.3.2. Structural State of SiO2-Rich Fluid Inclusions

Raman spectroscopy reveals variable crystallinity of the studied SiO2-rich fluid inclusions. The least crystallised matter was found inside the two K-feldspar-hosted inclusions, which we previously identified as opal-CT [64]. This inference was made because their spectra have broad hump-shaped bands at low frequencies, and that in the spectrum of the larger inclusion clearly reaches its maximum intensity at ~350 cm−1 (Figure 7). However, removing peaks of the host K-feldspar yields different spectra for these two inclusions (Figure 8a). The spectrum of the larger inclusion displays a prominent symmetric hump-shaped band that peaks at ~350 cm−1 and a smaller peak at ~780 cm−1. In contrast, the spectrum of the smaller inclusion has a prominent asymmetric hump-shaped band peaking at ~430 cm−1 and a smaller symmetric hump-shaped band peaking at ~800 cm−1. While the former spectrum is indeed very similar to spectra of opal-CT, the latter closely mimic those of less crystalline opal-A [93,94]. The more intensive bands in both of these spectra are shifted to lower frequencies compared to similar bands in the spectra of SiO2-rich glasses and fused SiO2, which typically have apices at >430 cm−1 [95]. They also lack peaks at ~490 cm−1 and ~600 cm−1 that are typical for fused SiO2, as well as any significant bands between ~850–1350 cm−1 that are typical for SiO2-rich glasses [95]. Notably, both inclusions have little to no H2O as indicated by the absence of its characteristic band between 3000–3700 cm−1 in their spectra (Figure 7).
The quartz-hosted inclusions generally contain more crystallised matter. None of them have opal-A, while opal-CT represents only one of the constituent phases if at all present (Figure 7 and Figure 8a). Many of these inclusions yield spectra with a peak at ~502 cm−1 (Figure 7 and Figure 8b), suggesting that they contain moganite [96]. Quartz appears as a constituent phase at least in some of these inclusions, which is indicated by spectra with no peaks other than those of quartz (Figure 7). No other SiO2 polymorphs were detected. Most of the inclusions contain H2O as indicated by a hump-shaped band between 3000–3700 cm−1 in their spectra (Figure 7). However, this band was not present in some spectra obtained from opal-CT and moganite that were exposed at the surface. Instead, these spectra either lacked any peaks near these frequencies or had a band with a jigsaw profile between 2700–3000 cm−1 (Figure 7), which is typical of hydrocarbons. A potential explanation is that the analysed volumes of opal-CT and moganite have relatively large pores that could lose H2O and absorb oil from the polishing paste that was used during sample preparation.

3.4. Discussion

While our current petrological observations are clearly insufficient to fully unravel the timescales and physicochemical conditions of mineralisation near the Itrongay locality, they do provide some useful insights into this process and have some wider implications. As we have shown above, the studied samples of gem-quality K-feldspar and quartzofeldspathic pegmatite have both experienced recurring episodes of growth from immiscible CO2-, H2O- and SiO2-rich fluids and saline liquids (hereafter sensu lato, including saline and carbonate melts observed in our work and various brines, hydrosaline liquids, hypersaline fluids and type-B melts from the literature). CO2-rich fluids were the only fluids documented in gem-quality K-feldspar from the area prior to our work [97,98]. Given that broadly similar inclusion assemblages occur in several different samples with perfectly transparent K-feldspar and no clear genetic link between them (including ours and those described in [97,98]), it seems reasonable to assume that all gem-quality K-feldspar in the vicinity of Itrongay formed from similar immiscible fluids. With this assumption in mind and considering previous geochronological data [64,89,90,91], we can infer that such fluids circulated in the area for a very long period of time, spanning between ~477–375 Ma.
Inclusions of various H2O-CO2 fluids and saline liquids are often documented in pegmatites [21,22,33,51,52,59,60,62,99,100] and thus their presence without any quantitative thermometric and chemical data does not warrant a detailed discussion. However, we note that the variations in the bubble to inclusion volumetric ratios in the H2O-CO2 fluid inclusions indicate that their entrapment occurred in a wide range of pressure and temperature conditions, and that the presence of exsolved H2O- and CO2-rich fluids is consistent with entrapment at temperatures near those of the ambient crust, which was somewhere on a cooling path between ~400–150 °C (see Section 3.1). As shown in our previous work, CO2-rich fluids in yellow gem-quality K-feldspar were likely trapped at pressures of <3 kbar [64].
In contrast, the presence of SiO2-rich fluid inclusions is significant because only a few previous studies have reported similar inclusions [3,18,19,21,22,51,62,65,66,67,68]. These inclusions have pronounced faceting and currently contain variably crystallised and hydrated SiO2, including opal-A and opal-CT that were never properly documented before. Variations in crystallinity and hydration are probably caused by a maturation process that converts the matter inside these inclusions from an amorphous state to quartz and leads to H2O loss. Opal-A, opal-CT and moganite probably represent intermediate products in this process, and the bottom right inclusion in Figure 5e can be interpreted as a snapshot of the transition of opal-CT to moganite. The fact that CL images of perfectly transparent quartz sometimes reveal areas with weak signal that are similar in size and shape to neighbouring inclusions of SiO2-rich fluids probably suggests that the final products of their crystallisation are not always visible. Previous studies reporting similar inclusions with various crystalline SiO2 polymorphs inside have suggested that the trapped SiO2-rich fluid was a silica gel [3,18,19,21,22,62], and we can only concur with this suggestion.
Silica gels can have >40% of SiO2 and >10% of H2O and thus do resemble synthetic hydrosilicate fluids [1,2,3,4,5,6,7,8,9,10,11,12,13,14,15]. Another similarity is that silica gels observed in inclusions in this and many previous studies [18,21,22,51,62,65,66] coexisted with saline liquids, just like some experimental hydrosilicate fluids [9,10,11]. This indicates that the silica gel inclusions occur in settings where relics of such hydrosilicate fluids are expected to be found. Therefore, we conclude that the silica gels in these inclusions represent natural analogues of the synthetic hydrosilicate fluids, thus reiterating the suggestions of [3,18,19]. One counterargument to this idea is that the silica gel inclusions are compositionally different from the experimental hydrosilicate fluids; dry residues of the former consist of only SiO2, while dry residues of the latter normally contain >10 wt.% of Na2O, K2O, Al2O3 and other components added to the loads [1,2,3,4,5,6,7,8,10,13,14,15]. However, we argue that this difference could be a consequence of the natural evolution of hydrosilicate fluids subsequent to their emplacement.
The compositional difference between the silica gel inclusions and the experimental hydrosilicate fluids could be related to the tendency of the latter to form gels rather than glasses during rapid cooling [3,4,5,6,7,8,9,10,11,12,13,14,15]. Even higher-temperature variants of hydrosilicate fluids quench to gels that can appreciably change their composition by ion exchange with H2O at room temperature, which in some cases turns them into almost pure silica gels [6,13,14]. Therefore, it seems possible that minerals can grow in such gels over geological timescales at any realistic temperature. This possibility is supported by observations of crystal growth at room temperature in synthetic inclusions of hydrosilicate fluids [10] and in a reheated inclusion of a saline liquid [21]. Furthermore, some literature on crystal growth in gels suggests that pegmatites may represent a natural example of such a process [101,102]. Crystallisation of minerals other than quartz is expected to remove their constituent components from the residual gels and thereby increase the proportion of SiO2 in them. The silica gels in the inclusions documented in our work and elsewhere [3,18,19,21,22,51,62,65,66,67,68] may represent the end product of this process. What was described as recrystallised gel inclusions in [5,61] and elsewhere as type-A melt inclusions [21,22,62] may represent inclusions of hydrosilicate fluids that were not affected by this process (as proposed in [13,14,15]).
Overall, the formation of the studied quartzofeldspathic pegmatite and yellow gem-quality K-feldspar from the Itrongay area may be explained by the following recurring sequence of events. The starting point is the emplacement of a mixture of immiscible fluids that comprise hydrosilicate, CO2- and H2O-rich fluids and saline liquids. The emplacement of such a heterogeneous substance was invoked to explain the internal zonation of pegmatites elsewhere [103,104], and it is also supported by experiments that produced similar collections of coexisting fluids [9,10,11] and theoretical analyses of experimental evidence [4,24]. The next step is the gelation of the hydrosilicate fluid, which allows minerals to slowly form in it via the reactions between various components within it and other fluids in the system, as in technical applications of crystal growth in gels [101,102]. The sequence concludes as these reactions turn the gelatinised hydrosilicate fluid to a silica gel, and it slowly crystallises to quartz.
A silica gel precursor for quartz from the studied pegmatite sample is supported by several of our observations. Firstly, quartz clearly grew with its natural faces into chalcedony pockets while having universally irregular boundaries at the contact with K-feldspar. This relationship is expected if quartz formed after K-feldspar by crystallisation of a silica gel whose remnants are represented by chalcedony. Secondly, individual carbonate crystals and their aggregates often ‘hang’ in chalcedony and show very symmetric zoning in CL images. This is expected if carbonate formed in a silica gel whose remnants are represented by chalcedony and therefore had a uniform supply of CL activators to every side; similar textures are obtained by crystal growth in gels [101,102]. Thirdly, similar spherulites were found in chalcedony and quartz, which would be unsurprising if both formed from a silica gel precursor and represented various stages of its crystallisation. We also note that silica gels were previously considered as potential precursors for quartz cores of pegmatites [20,21,22]. Furthermore, it has been asserted that quartz cores were partially squeezed out from some pegmatites of the Central Urals (Russia) to form radiating quartz veins that serve as vectors to mineralised cavities [105], which can be readily explained by invoking a silica gel precursor.
The proposed model of mineralisation around Itrongay contradicts the widely accepted model that pegmatites form by crystallisation of undercooled H2O-underatured aluminosilicate melts of broadly granitic composition [31,32,33]. It has been suggested in support of the latter model that what appear as primary inclusions of mineral-forming substances in pegmatites actually represent primary inclusions of boundary layer liquids, potentially with some prisoner minerals, which do not characterise the bulk composition of aluminosilicate melts that form pegmatites [33,63]. In our opinion, the available evidence cannot completely invalidate either model, the formation of the entire diversity of pegmatites may not be explained by a single model, and these models are not necessarily mutually exclusive even in the context of a single pegmatite. For example, it seems unlikely that the crystallisation of any mineral can form a boundary layer that is composed of only SiO2, which furthermore transforms into opal rather than SiO2 glass on cooling. Therefore, the arguments of [33,63] probably do not apply to the studied samples (consider also the argumentation against the boundary layer hypothesis in [106]). The model proposed here could only be applicable to a limited number of rocks represented by the sampled pegmatites near Itrongay, which, for example, lack graphic textures [64] that are common in other pegmatites [31,32,33]. Alternatively, our proposed model could only be relevant for some late-stage processes that occur after crystallisation from aluminosilicate melts. We think that these possibilities need to be further investigated before reliable conclusions and generalisations can be made.
The formation of pegmatites and associated mineralisation is generally considered to occur in connection with granitic magmatism, although clear links to magmatic rocks are often missing [21,31,32,33,104]. However, the available geochronological evidence indicates that fluids described here circulated in the Itrongay area for ~100 Ma (see above), and thus it seems improbable that they had a magmatic origin. Perhaps these fluids were generated by metamorphic reactions that occurred while the crust of southern Madagascar cooled and exhumed following the Ediacaran to early Cambrian high-temperature metamorphism. They could represent successors of the aluminosilicate melts and saline liquids that produced geographically proximal syenites and coarse-grained (pegmatitic) rocks made of phlogopite, diopside, calcite, apatite and anhydrite at 515–510 Ma [107,108]. It has been previously suggested that those aluminosilicate melts and saline liquids formed by anatexis at the end of the Ediacaran to early Cambrian high-temperature metamorphism [107,108].

4. Implications

The evidence described here supports previous views about the involvement of low-temperature (200–800 °C) and low-pressure (0.05–3 kbar) hydrosilicate fluids in various mineralisation processes [2,3,4,5,6,7,8,9,10,11,12,13,14,15,16,17,18,19,20,21,22,23,24,25,26,45]. The compositional difference between the currently recognised natural and experimental counterparts of such hydrosilicate fluids may be a consequence of their physical properties. Their experimental counterparts are typically assumed to quench to gels rather than glasses [3,4,5,6,7,8,9,10,11,12,13,14,15]. Crystallisation of minerals in such gels in natural environments may at some point purify them to silica gels, which were trapped in inclusions reported here and some previous works [3,18,19,21,22,51,62,65,66,67,68]. Subsequent crystallisation of the trapped silica gels may ultimately convert them to quartz, as suggested by our current observations and in other studies [3,18,19,21,22,51,62,67,68]. Silica gels in inclusions may also lose syneresis liquids, and this process was invoked to explain the origin of chalcedony-hosted SiO2 sol inclusions with symmetric SiO2 deposits on their walls [51,67]. These post-entrapment modifications may significantly complicate the recognition of silica gel inclusions. Such inclusions in quartz may completely disappear or appear as inclusions of H2O-CO2 fluids that actually represent syneresis liquids, while in other minerals they may appear as inclusions of quartz or quartz and H2O-CO2 fluids, where the latter are syneresis liquids. Inclusions of hydrosilicate fluids that were not affected by these processes may be routinely identified as melt inclusions [5,13,14,15,61].
Many of the previous studies that have advocated the presence of hydrosilicate fluids focused on processes that are typically regarded as marking the magmatic-hydrothermal transition, such as the formation of greisens [3,18,19], pegmatites [20,21,22,23] and porphyry-type deposits [25,26]. In these cases, hydrosilicate fluids could exsolve [4] or gradually fractionate [45] from aluminosilicate melts, or precipitate from H2O–CO2 fluids of magmatic origin [14]. However, it appears that these magmatism-related modes of generation of hydrosilicate fluids are not unique. The example of the Itrongay locality indicates that hydrosilicate fluids may form by the interaction of rocks with H2O–CO2 fluids and saline liquids that result from metamorphic reactions in the crusts; the available geochronological data can hardly be explained by assuming a magmatic origin for these. Comparable sets of geochronological data that were or could be interpreted as reflecting multiple growth episodes separated by millions to hundreds of millions of years were previously reported from pegmatites elsewhere [109,110]. Such protracted episodic growth has also been documented for alpine clefts [111,112], whose formation may be related to the infiltration of hydrosilicate fluids, as indicated by the observation of a silica gel vein in the Alps [72]. The potential for metamorphic origins of hydrosilicate fluids is further supported by the observations of silica gel inclusions in alpine-type veins in the Southern Urals [66] and, arguably, in chalcedony from volcanic rocks [51,67,68].
Inclusion assemblages documented here and in several previous studies [18,21,22,51,65,66] combined with some experimental results [9,10,11] show that hydrosilicate fluids frequently coexist with various saline liquids. This relationship suggests that the presence of more easily identifiable inclusions of saline liquids may serve as a signal for the potential presence of hydrosilicate fluids. Inclusions of saline liquids have been documented in a very wide range of geological settings and can have genetic links with magmatism or form due to metamorphic processes in the crust. Examples include volcanic and plutonic magmatic rocks [52,113,114,115,116], metamorphic rocks [52,117], pegmatites [21,22,33,51,52,59,60,62,99,100] and various ore deposits [25,26,29,34,35,52]. Hydrosilicate fluids can also occur independently of saline liquids, as exemplified by the silica gel vein in the Alps [72] and other previously reported inclusion assemblages [51,67,68]. Experimental studies suggest that this may be due to the separation of hydrosilicate fluids from saline liquids with their subsequent independent evolution [9] or due to their formation in systems with no coexisting saline melts [1,2,3,13,14,15]. Therefore, the presence of hydrosilicate fluids may also be suspected where there is evidence for significant mobility of SiO2. For example, they could be involved in the formation of various quartz-bearing veins; a silica gel precursor for these has been invoked before [17,66,72]. They could also be involved in silicification of volcanic rocks that were reported to contain opal [118,119,120], cristobalite [119,121,122] and quartz [47,119,123]. They could further contribute to large-scale SiO2 redistribution, such as that associated with the formation of continental crust [124,125]. In addition, the presence of hydrosilicate fluids could partly account for spherulitic and devitrification textures in volcanic rocks [126,127,128,129], some of which were reproduced by fluid-glass interaction in experiments where such fluids could be generated [130], while others appear to indicate the occurrence of liquid immiscibility (V. Kamenetsky, personal communication; consider also [16]). The presence of hydrosilicate fluids in any of these settings and processes would have profound ramifications for how we understand them.

5. Conclusions

Feldspar and quartz from the Itrongay locality in Madagascar contain well-faceted inclusions of variably crystallised silica gels that are currently filled with opal-A, opal-CT, moganite, quartz or combinations of these. They occur together with inclusions of CO2- and H2O-rich fluids and saline liquids. Several previous studies report similar silica gel inclusions that sometimes have similar paragenetic contexts [3,18,19,21,22,62], inclusions that were identified as gels of more complex composition [5,61] and inclusions of syneresis liquids expelled from the surrounding silica gel that crystallised to chalcedony [51,67]. Furthermore, one previous study described a silica gel that formed a gneiss-hosted vein [72]. All of these gels probably represent natural counterparts of synthetic hydrosilicate fluids that are increasingly documented in experiments at low temperatures (200–800 °C) and low pressures (0.05–3 kbar) [1,2,3,4,5,6,7,8,9,10,11,12,13,14,15]. The latter have a range of peculiar properties, such as high contents of SiO2 (>40 wt.%) and H2O (>10 wt.%), relatively low viscosities and a tendency to quench to gels [3,4,5,6,7,8,9,10,11,12,13,14,15] that are sometimes capable of ion exchange and reversible H2O loss at room temperature [6,13,14].
One important difference between natural silica gels and synthetic hydrosilicate fluids is that dry residues of the latter are not pure SiO2 but also contain >10 wt.% Na2O, K2O, Al2O3 and other available components. We speculate that this difference results from a two-stage crystallisation process after the emplacement of hydrosilicate fluids, in which they first turn to gels and then slowly grow minerals that eventually exhaust components other than SiO2. The resulting silica gels may further crystallise to quartz, such that traces of this process become largely eradicated. The same process may convert inclusions of hydrosilicate fluids to quartz, hindering their identification.
We tentatively suggest that hydrosilicate fluids may be common in the Earth’s crust and occur where there is evidence for the presence of saline liquids and/or significant mobility of SiO2. Therefore, we encourage future studies to carefully consider the potential presence of hydrosilicate fluids in a wide range of pressure and temperature conditions and geological systems, as well as provide better experimental constraints on the nature of hydrosilicate fluids, their properties and the conditions of their formation.

Supplementary Materials

The following supporting information can be downloaded at: https://www.mdpi.com/article/10.3390/geosciences12010028/s1, Figure S1: Additional Raman spectra for phases mentioned in Section 3.

Author Contributions

This work was conceptualised and carried out by D.V.P. using samples that were collected by D.V.P., R.A.S. and T.R. It benefited from funding acquired first by R.A.S. and later by D.V.P. The manuscript was prepared by D.V.P. with contributions from R.A.S. and T.R. All authors have read and agreed to the published version of the manuscript.

Funding

Our work benefited from the support of the Swiss National Science Foundation through research grant 200021_160052 awarded to R.A.S. followed by Early Postdoc.Mobility fellowship P2GEP2_191478 awarded to D.V.P.

Institutional Review Board Statement

Not applicable.

Informed Consent Statement

Not applicable.

Data Availability Statement

Data are provided in the manuscript and Supplementary Figure S1.

Acknowledgments

We are grateful to V. Prokofiev for providing a good-quality image of inclusions from [67]. We are also grateful to B. Williamson for providing a good-quality image of inclusions described in [3,18,19] and a discussion about silica gels. Many thanks to V. Kamenetsky for an enlightening discussion about different fluids and fluid inclusions. Another much appreciated discussion is that about pegmatites with M.-L. Sirbescu. K. Kouzmanov is acknowledged for his useful thoughts about the inclusions described here in the early stages of this work. J. Davies is thanked for accompanying us in the field, while G. Degli-Alessandrini is thanked for her assistance with the laboratory work at the Open University. Three anonymous reviewers are thanked for their comments that allowed to improve our manuscript. We appreciate the invitation from the editorial office of Geosciences to write a paper on the subject of our choice, which resulted in this contribution.

Conflicts of Interest

The authors declare no conflict of interest. The funders had no role in the design of the study; in the collection, analyses, or interpretation of data; in the writing of the manuscript, or in the decision to publish the results.

References

  1. Tuttle, O.F.; Friedman, I.I. Liquid Immiscibility in the System H2O—Na2O—SiO2. J. Am. Chem. Soc. 1948, 70, 919–926. [Google Scholar] [CrossRef]
  2. Kravchuk, K.G.; Valyashko, V.M. The equilibrium diagram of the system Na₂O–SiO₂–H₂O. In Methods of Experimental Study of Hydrothermal Equilibria; Godovikov, A.A., Ed.; Nauka: Novosibirsk, Russia, 1979; pp. 105–117. [Google Scholar]
  3. Wilkinson, J.J.; Nolan, J.; Rankin, A.H. Silicothermal fluid: A novel medium for mass transport in the lithosphere. Geology 1996, 24, 1059–1062. [Google Scholar] [CrossRef]
  4. Veksler, I.V. Liquid immiscibility and its role at the magmatic–hydrothermal transition: A summary of experimental studies. Chem. Geol. 2004, 210, 7–31. [Google Scholar] [CrossRef]
  5. Peretyazhko, I.S.; Smirnov, S.Z.; Thomas, V.G.; Zagorsky, V.Y. Gels and Melt-like Gels in High-Temperature Endogeneous Mineral Formation. In Proceedings of the Metallogeny of the Pacific Northwest: Tectonics, Magmatism and Metallogeny of Active Continental Margin; Dalnauka: Vladivostok, Russia, 2004; pp. 306–309. [Google Scholar]
  6. Smirnov, S.Z.; Thomas, V.G.; Demin, S.P.; Drebushchak, V.A. Experimental study of boron solubility and speciation in the Na₂O–B₂O₃–SiO₂–H₂O system. Chem. Geol. 2005, 223, 16–34. [Google Scholar] [CrossRef]
  7. Kotelnikova, Z.A.; Kotelnikov, A.R. NaF-bearing fluids: Experimental investigation at 500–800 °C and P = 2000 bar using synthetic fluid inclusions in quartz. Geochem. Int. 2008, 46, 48–61. [Google Scholar] [CrossRef]
  8. Kotel’Nikova, Z.A.; Kotel’Nikov, A.R. Experimental study of heterogeneous fluid equilibria in silicate-salt-water systems. Geol. Ore Depos. 2010, 52, 154–166. [Google Scholar] [CrossRef]
  9. Kotel’Nikova, Z.A.; Kotel’Nikov, A.R. Immiscibility in sulfate-bearing fluid systems at high temperatures and pressures. Geochem. Int. 2010, 48, 381–389. [Google Scholar] [CrossRef]
  10. Peretyazhko, I.S.; Smirnov, S.Z.; Kotel’Nikov, A.R.; Kotel’Nikova, Z.A. Experimental study of the system H₃BO₃–NaF–SiO₂–H₂O at 350–800 °C and 1–2 kbar by the method of synthetic fluid inclusions. Russ. Geol. Geophys. 2010, 51, 349–368. [Google Scholar] [CrossRef]
  11. Kotel’Nikova, Z.A.; Kotel’Nikov, A.R. Na2CO3-bearing fluids: Experimental study at 700 °C and under 1, 2, and 3 kbar pressure using synthetic fluid inclusions in quartz. Geol. Ore Depos. 2011, 53, 156–170. [Google Scholar] [CrossRef]
  12. Kotel’Nikova, Z.A.; Kotel’Nikov, A.R. Unusual phase transformations in synthetic NaF-bearing fluid inclusions in quartz. Dokl. Earth Sci. 2011, 439, 967–969. [Google Scholar] [CrossRef]
  13. Smirnov, S.Z.; Thomas, V.G.; Kamenetsky, V.S.; Kozmenko, O.A.; Large, R. Hydrosilicate liquids in the system Na2O-SiO2-H2O with NaF, NaCl and Ta: Evaluation of their role in ore and mineral formation at high T and P. Petrology 2012, 20, 271–285. [Google Scholar] [CrossRef]
  14. Thomas, V.G.; Smirnov, S.Z.; Kozmenko, O.A.; Drebushchak, V.A.; Kamenetsky, V.S. Formation and properties of hydrosilicate liquids in the systems Na2O-Al2O3-SiO2-H2O and granite-Na2O-SiO2-H2O at 600 °C and 1.5 kbar. Petrology 2014, 22, 293–309. [Google Scholar] [CrossRef]
  15. Smirnov, S.Z.; Thomas, V.G.; Kamenetsky, V.; Kozmenko, O.A. Hydrosilicate liquids in the system rare-metal granite–Na2O–SiO2–H2O as accumulators of ore components at high pressure and temperature. Petrology 2017, 25, 625–635. [Google Scholar] [CrossRef]
  16. Kigai, I.N. The genesis of agates and amethyst geodes. Can. Miner. 2019, 57, 867–883. [Google Scholar] [CrossRef]
  17. Chukhrov, F.V. Colloids in the Earth’s Crust; USSR Academy of Sciences: Moscow, Russia, 1955. [Google Scholar]
  18. Williamson, B.J.; Stanley, C.J.; Wilkinson, J.J. Implications from inclusions in topaz for greisenisation and mineralisation in the Hensbarrow topaz granite, Cornwall, England. Contrib. Miner. Pet. 1997, 127, 119–128. [Google Scholar] [CrossRef]
  19. Williamson, B.J.; Wilkinson, J.J.; Luckham, P.F.; Stanley, C.J. Formation of coagulated colloidal silica in high-temperature mineralizing fluids. Miner. Mag. 2002, 66, 547–553. [Google Scholar] [CrossRef]
  20. Brotzen, O. Outline of Mineralization in Zoned Granitic Pegmatites: A Qualitative and Comparative Study. Geol. Föreningen Stockh. Förhandlingar 1959, 81, 1–98. [Google Scholar] [CrossRef]
  21. Thomas, R.; Davidson, P. Water and Melt/Melt Immiscibility, the Essential Components in the Formation of Pegmatites; Evidence from Melt Inclusions. Z. Geol. Wiss. 2008, 36, 347–364. [Google Scholar]
  22. Thomas, R.; Davidson, P. Evidence of a water-rich silica gel state during the formation of a simple pegmatite. Miner. Mag. 2012, 76, 2785–2801. [Google Scholar] [CrossRef] [Green Version]
  23. Peterková, T.; Dolejš, D. Magmatic-hydrothermal transition of Mo-W-mineralized granite-pegmatite-greisen system recorded by trace elements in quartz: Krupka district, Eastern Krušné hory/Erzgebirge. Chem. Geol. 2019, 523, 179–202. [Google Scholar] [CrossRef]
  24. Smirnov, S.Z. The fluid regime of crystallization of water-saturated granitic and pegmatitic magmas: A physicochemical analysis. Russ. Geol. Geophys. 2015, 56, 1292–1307. [Google Scholar] [CrossRef]
  25. Vasyukova, O.V. Types and Origin of Quartz and Quartz-Hosted Fluid Inclusions in Mineralised Porphyries. Ph.D. Thesis, University of Tasmania, Hobart, Tasmania, 2011. [Google Scholar]
  26. Vasyukova, O.V.; Kamenetsky, V.S.; Goemann, K.; Davidson, P. Diversity of primary CL textures in quartz from porphyry environments: Implication for origin of quartz eyes. Contrib. Miner. Pet. 2013, 166, 1253–1268. [Google Scholar] [CrossRef]
  27. Moxon, T.; Palyanova, G. Agate Genesis: A Continuing Enigma. Minerals 2020, 10, 953. [Google Scholar] [CrossRef]
  28. Götze, J.; Möckel, R.; Pan, Y. Mineralogy, Geochemistry and Genesis of Agate—A Review. Minerals 2020, 10, 1037. [Google Scholar] [CrossRef]
  29. Korges, M.; Weis, P.; Lüders, V.; Laurent, O. Depressurization and boiling of a single magmatic fluid as a mechanism for tin-tungsten deposit formation. Geology 2017, 46, 75–78. [Google Scholar] [CrossRef]
  30. Monnier, L.; Salvi, S.; Jourdan, V.; Sall, S.; Bailly, L.; Melleton, J.; Béziat, D. Contrasting fluid behavior during two styles of greisen alteration leading to distinct wolframite mineralizations: The Echassières district (Massif Central, France). Ore Geol. Rev. 2020, 124, 103648. [Google Scholar] [CrossRef]
  31. Simmons, W.B.S.; Webber, K.L. Pegmatite genesis: State of the art. Eur. J. Miner. 2008, 20, 421–438. [Google Scholar] [CrossRef]
  32. London, D.; Morgan, V.G.B. The Pegmatite Puzzle. Elements 2012, 8, 263–268. [Google Scholar] [CrossRef]
  33. London, D. A petrologic assessment of internal zonation in granitic pegmatites. Lithos 2014, 184–187, 74–104. [Google Scholar] [CrossRef]
  34. Monecke, T.; Monecke, J.; Reynolds, T.J.; Tsuruoka, S.; Bennett, M.; Skewes, W.B.; Palin, R.M. Quartz Solubility in the H2O-NaCl System: A Framework for Understanding Vein Formation in Porphyry Copper Deposits. Econ. Geol. 2018, 113, 1007–1046. [Google Scholar] [CrossRef]
  35. Mernagh, T.P.; Leys, C.; Henley, R.W. Fluid inclusion systematics in porphyry copper deposits: The super-giant Grasberg deposit, Indonesia, as a case study. Ore Geol. Rev. 2020, 123, 103570. [Google Scholar] [CrossRef]
  36. Lee, C.-T.A.; Tang, M. How to make porphyry copper deposits. Earth Planet. Sci. Lett. 2020, 529, 115868. [Google Scholar] [CrossRef]
  37. Holtz, F.; Johannes, W.; Tamic, N.; Behrens, H. Maximum and minimum water contents of granitic melts generated in the crust: A reevaluation and implications. Lithos 2001, 56, 1–14. [Google Scholar] [CrossRef]
  38. Newman, S.; Lowenstern, J. VolatileCalc: A silicate melt–H2O–CO2 solution model written in Visual Basic for excel. Comput. Geosci. 2002, 28, 597–604. [Google Scholar] [CrossRef]
  39. Dingwell, D.B.; Holtz, F.; Behrens, H. The solubility of H2O in peralkaline and peraluminous granitic melts. Am. Miner. 1997, 82, 434–437. [Google Scholar] [CrossRef] [Green Version]
  40. Bureau, H. Complete miscibility between silicate melts and hydrous fluids in the upper mantle: Experimental evidence and geochemical implications. Earth Planet. Sci. Lett. 1999, 165, 187–196. [Google Scholar] [CrossRef]
  41. Kennedy, G.C.; Wasserburg, G.J.; Heard, H.C.; Newton, R.C. The upper three-phase region in the system SiO2–H2O. Am. J. Sci. 1962, 260, 501–521. [Google Scholar] [CrossRef]
  42. Sowerby, J.R.; Keppler, H. The effect of fluorine, boron and excess sodium on the critical curve in the albite–H2O system. Contrib. Miner. Pet. 2002, 143, 32–37. [Google Scholar] [CrossRef]
  43. Giordano, D.; Russell, J.K.; Dingwell, D.B. Viscosity of magmatic liquids: A model. Earth Planet. Sci. Lett. 2008, 271, 123–134. [Google Scholar] [CrossRef]
  44. Bartels, A.; Vetere, F.; Holtz, F.; Behrens, H.; Linnen, R.L. Viscosity of flux-rich pegmatitic melts. Contrib. Miner. Pet. 2011, 162, 51–60. [Google Scholar] [CrossRef]
  45. Tuttle, O.F.; Bowen, N.L. Origin of Granite in the Light of Experimental Studies in the System NaAlSi3O8–KAlSi3O8–SiO2–H2O; The Geological Society of America Memoir; Geological Society of America: New York, NY, USA, 1958; Volume 74. [Google Scholar]
  46. Di Matteo, V.; Carroll, M.; Behrens, H.; Vetere, F.; Brooker, R. Water solubility in trachytic melts. Chem. Geol. 2004, 213, 187–196. [Google Scholar] [CrossRef]
  47. Popov, D.V.; Nekrylov, N.; Plechov, P.; Shcherbakov, V.D.; Portnyagin, M.; Serova, M.S. Composition and conditions of formation of the parental melts of Jurassic dolerites of southwestern Crimea: Evidence from melt inclusions in olivine phenocrysts. Petrology 2017, 25, 272–303. [Google Scholar] [CrossRef] [Green Version]
  48. Hess, K.-U.; Dingwell, D.B. Viscosities of Hydrous Leucogranitic Melts: A Non-Arrhenian Model. Am. Mineral. 1996, 81, 1297–1300. [Google Scholar]
  49. Dingwell, D.; Hess, K.-U.; Romano, C. Extremely fluid behavior of hydrous peralkaline rhyolites. Earth Planet. Sci. Lett. 1998, 158, 31–38. [Google Scholar] [CrossRef]
  50. Sirbescu, M.-L.C.; Schmidt, C.; Veksler, I.V.; Whittington, A.G.; Wilke, M. Experimental Crystallization of Undercooled Felsic Liquids: Generation of Pegmatitic Texture. J. Pet. 2017, 58, 539–568. [Google Scholar] [CrossRef]
  51. Ermakov, N.P. Geochemical Systems of Inclusions in Minerals; Nedra: Moscow, Russia, 1972. [Google Scholar]
  52. Roedder, E. Fluid Inclusions. Rev. Mineral. 1984, 12, 1–644. [Google Scholar]
  53. Bakker, R.; Jansen, J.H. Experimental post-entrapment water loss from synthetic CO₂–H₂O inclusions in natural quartz. Geochim. Cosmochim. Acta 1991, 55, 2215–2230. [Google Scholar] [CrossRef]
  54. Bodnar, R.J. Reequilibration of Fluid Inclusions. In Fluid Inclusions: Analysis and Interpretation; Samson, I., Anderson, A., Marshall, D., Eds.; Short Course Series; Mineralogical Association of Canada: Quebec, QC, Canada, 2003; pp. 213–230. [Google Scholar]
  55. Danyushevsky, L.; Della-Pasqua, F.N.; Sokolov, S. Re-equilibration of melt inclusions trapped by magnesian olivine phenocrysts from subduction-related magmas: Petrological implications. Contrib. Miner. Pet. 2000, 138, 68–83. [Google Scholar] [CrossRef] [Green Version]
  56. Portnyagin, M.; Mironov, N.; Botcharnikov, R.; Gurenko, A.; Almeev, R.; Luft, C.; Holtz, F. Dehydration of melt inclusions in olivine and implications for the origin of silica-undersaturated island-arc melts. Earth Planet. Sci. Lett. 2019, 517, 95–105. [Google Scholar] [CrossRef]
  57. Iler, R.K. The Chemistry of Silica; John Wiley & Sons: New York, NY, USA, 1979. [Google Scholar]
  58. Scherer, G.W. Aging and drying of gels. J. Non-Cryst. Solids 1988, 100, 77–92. [Google Scholar] [CrossRef]
  59. Smirnov, S.Z.; Peretyazhko, I.S.; Zagorsky, V.E.; Mikhailov, M.Y. Inclusions of Unusual Late Magmatic Melts in Quartz from the Oktyabr’skaya Pegmatite Vein, Malkhan Field (Central Transbaikal Region). Dokl. Earth Sci. 2003, 392, 999–1003. [Google Scholar]
  60. Peretyazhko, I.; Zagorsky, V.Y.; Smirnov, S.Z.; Mikhailov, M.Y. Conditions of pocket formation in the Oktyabrskaya tourmaline-rich gem pegmatite (the Malkhan field, Central Transbaikalia, Russia). Chem. Geol. 2004, 210, 91–111. [Google Scholar] [CrossRef]
  61. Touret, J.L.R.; Smirnov, S.Z.; Peretyazhko, I.S.; Zagorsky, V.Y.; Thomas, V.G. Magmatic-Hydrothermal Transition in Tourmaline-Bearing Miarolitic Pegmatites: Hydrosaline Fluids or Silica Gels? In Proceedings of the International Symposium. Granitic Pegmatites: The State of the Art, Porto, Portugal, 6–12 May 2007. [Google Scholar]
  62. Thomas, R.; Davidson, P.; Badanina, E. Water- and Boron-Rich Melt Inclusions in Quartz from the Malkhan Pegmatite, Transbaikalia, Russia. Minerals 2012, 2, 435–458. [Google Scholar] [CrossRef]
  63. London, D. Reply to Thomas and Davidson on “A petrologic assessment of internal zonation in granitic pegmatites” (London, 2014a). Lithos 2015, 212–215, 469–484. [Google Scholar] [CrossRef]
  64. Popov, D.V.; Spikings, R.A.; Scaillet, S.; O’Sullivan, G.; Chew, D.; Badenszki, E.; Daly, J.S.; Razakamanana, T.; Davies, J.H.F.L. Diffusion and fluid interaction in Itrongay pegmatite (Madagascar): Evidence from in situ 40Ar/39Ar dating of gem-quality alkali feldspar and U Pb dating of protogenetic apatite inclusions. Chem. Geol. 2020, 556, 119841. [Google Scholar] [CrossRef]
  65. Eadington, P.J.; Nashar, B. Evidence for the magmatic origin of quartz-topaz rocks from the New England batholith, Australia. Contrib. Miner. Pet. 1978, 67, 433–438. [Google Scholar] [CrossRef]
  66. Granovskaya, N.V.; Kobzareva, J.S. An importance of thermobarochemistry for sedimentary basins katagenesis study; the Bashkirskij Meganticlinorium as example. In Proceedings of the XIII International conference on thermobarogeochemistry and IVth APIFIS Symposium, Moscow, Russia, 22–25 September 2008; Volume 2, pp. 214–217. [Google Scholar]
  67. Prokofiev, V.; Kamenetsky, V.S.; Selektor, S.L.; Rodemann, T.; Kovalenker, V.A.; Vatsadze, S.Z. First direct evidence for natural occurrence of colloidal silica in chalcedony-hosted vacuoles and implications for ore-forming processes. Geology 2017, 45, 71–74. [Google Scholar] [CrossRef]
  68. Khakimov, A.K. Genetic types of inclusions of agate amygdales and veins of the Idzhebanskii deposit in Armenia. In Mineralogical Thermometry and Barometry. Volume II. New Methods and Results of Study of Parameters of Ore Formation; Ermakov, N.P., Sobolev, V.S., Smirnov, V.I., Khitarov, N.I., Kuznetsov, V.A., Dolgov, Y.A., Eds.; Nauka: Moscow, USSR, 1968; pp. 230–236. [Google Scholar]
  69. Eugster, H.P.; Jones, B.F. Gels Composed of Sodium-Aluminum Silicate, Lake Magadi, Kenya. Science 1968, 161, 160–163. [Google Scholar] [CrossRef]
  70. White, D.E.; Brannock, W.; Murata, K. Silica in hot-spring waters. Geochim. Cosmochim. Acta 1956, 10, 27–59. [Google Scholar] [CrossRef]
  71. Renaut, R.W.; Owen, R.B.; Lowenstein, T.K.; De Cort, G.; Mcnulty, E.; Scott, J.J.; Mbuthia, A. The role of hydrothermal fluids in sedimentation in saline alkaline lakes: Evidence from Nasikie Engida, Kenya Rift Valley. Sedimentology 2020, 68, 108–134. [Google Scholar] [CrossRef]
  72. Spezia, G. Sopra un deposito di quarzo e di silice gelatinosa trovato nel traforo del Sempione. Atti R. Accad. Sci. Torino 1899, 34, 705–713. [Google Scholar]
  73. Markl, G.; Bäuerle, J.; Grujic, D. Metamorphic evolution of Pan-African granulite facies metapelites from Southern Madagascar. Precambrian Res. 2000, 102, 47–68. [Google Scholar] [CrossRef]
  74. Tucker, R.D.; Roig, J.Y.; Moine, B.; Delor, C.; Peters, S.G. A geological synthesis of the Precambrian shield in Madagascar. J. Afr. Earth Sci. 2014, 94, 9–30. [Google Scholar] [CrossRef]
  75. De Wit, M.J.; Bowring, S.A.; Ashwal, L.D.; Randrianasolo, L.G.; Morel, V.P.I.; Rambeloson, R.A. Age and tectonic evolution of Neoproterozoic ductile shear zones in southwestern Madagascar, with implications for Gondwana studies. Tectonics 2001, 20, 1–45. [Google Scholar] [CrossRef]
  76. Collins, A.S.; Kinny, P.D.; Razakamanana, T. Depositional age, provenance and metamorphic age of metasedimentary rocks from southern Madagascar. Gondwana Res. 2012, 21, 353–361. [Google Scholar] [CrossRef]
  77. Martelat, J.-E.; Lardeaux, J.-M.; Nicollet, C.; Rakotondrazafy, R. Strain pattern and late Precambrian deformation history in southern Madagascar. Precambrian Res. 2000, 102, 1–20. [Google Scholar] [CrossRef]
  78. Collins, A.S. Madagascar and the amalgamation of Central Gondwana. Gondwana Res. 2006, 9, 3–16. [Google Scholar] [CrossRef]
  79. Niels, J.; Schenk, V. The ultrahigh temperature granulites of southern Madagascar in a polymetamorphic context: Implications for the amalgamation of the Gondwana supercontinent. Eur. J. Miner. 2011, 23, 127–156. [Google Scholar] [CrossRef] [Green Version]
  80. Horton, F.; Hacker, B.; Kylander-Clark, A.; Holder, R.; Jöns, N. Focused radiogenic heating of middle crust caused ultrahigh temperatures in southern Madagascar. Tectonics 2016, 35, 293–314. [Google Scholar] [CrossRef] [Green Version]
  81. Horton, F.; Holder, R.M.; Swindle, C.R. An extensive record of orogenesis recorded in a Madagascar granulite. J. Metamorph. Geol. 2021, jmg.12628. [Google Scholar] [CrossRef]
  82. Holder, R.M.; Hacker, B.R.; Horton, F.; Rakotondrazafy, A.F.M. Ultrahigh-temperature osumilite gneisses in southern Madagascar record combined heat advection and high rates of radiogenic heat production in a long-lived high-T orogen. J. Metamorph. Geol. 2018, 36, 855–880. [Google Scholar] [CrossRef]
  83. Holder, R.M.; Hacker, B.R. Fluid-driven resetting of titanite following ultrahigh-temperature metamorphism in southern Madagascar. Chem. Geol. 2019, 504, 38–52. [Google Scholar] [CrossRef]
  84. Emmel, B.; Jöns, N.; Kröner, A.; Jacobs, J.; Wartho, J.-A.; Schenk, V.; Razakamanana, T.; Austegard, A. From Closure of the Mozambique Ocean to Gondwana Breakup: New Evidence from Geochronological Data of the Vohibory Terrane, Southwest Madagascar. J. Geol. 2008, 116, 21–38. [Google Scholar] [CrossRef]
  85. Emmel, B.; Jacobs, J.; Razakamanana, T. Titanite and apatite fission track analyses on basement rocks of central-southern Madagascar: Constraints on exhumation and denudation rates along the eastern rift shoulder of the Morondava basin. J. Afr. Earth Sci. 2004, 38, 343–361. [Google Scholar] [CrossRef]
  86. Montel, J.-M.; Razafimahatratra, D.; de Parseval, P.; Poitrasson, F.; Moine, B.; Seydoux-Guillaume, A.-M.; Pik, R.; Arnaud, N.; Gibert, F. The giant monazite crystals from Manangotry (Madagascar). Chem. Geol. 2018, 484, 36–50. [Google Scholar] [CrossRef]
  87. Seward, D.; Grujic, D.; Schreurs, G. An insight into the breakup of Gondwana: Identifying events through low-temperature thermochronology from the basement rocks of Madagascar. Tectonics 2004, 23. [Google Scholar] [CrossRef] [Green Version]
  88. Emmel, B.; Boger, S.; Jacobs, J.; Daszinnies, M. Maturity of central Madagascar’s landscape—Low-temperature thermochronological constraints. Gondwana Res. 2012, 21, 704–713. [Google Scholar] [CrossRef]
  89. Arnaud, N.O.; Kelley, S.P. Argon behaviour in gem-quality orthoclase from Madagascar: Experiments and some consequences for 40Ar39Ar geochronology. Geochim. Cosmochim. Acta 1997, 61, 3227–3255. [Google Scholar] [CrossRef]
  90. Nägler, T.; Villa, I.M. In pursuit of the 40K branching ratios: K-Ca and 39Ar–40Ar dating of gem silicates. Chem. Geol. 2000, 169, 5–16. [Google Scholar] [CrossRef]
  91. Flude, S.; Halton, A.M.; Kelley, S.P.; Sherlock, S.C.; Schwanethal, J.; Wilkinson, C.M. Observation of centimetre-scale argon diffusion in alkali feldspars: Implications for 40Ar/39Ar thermochronology. Geol. Soc. Lond. Spéc. Publ. 2014, 378, 265–275. [Google Scholar] [CrossRef] [Green Version]
  92. Lafuente, B.; Downs, R.S.; Yang, H.; Stone, N. The Power of Databases: The RRUFF Project. In Highlights in Mineralogical Crystallography; Armbruster, T., Danisi, R.M., Eds.; W. De Gruyter: Berlin, Germany, 2015; pp. 1–30. [Google Scholar]
  93. Curtis, N.J.; Gascooke, J.R.; Johnston, M.R.; Pring, A. A Review of the Classification of Opal with Reference to Recent New Localities. Minerals 2019, 9, 299. [Google Scholar] [CrossRef] [Green Version]
  94. Ostrooumov, M.; Fritsch, E.; Lasnier, B.; Lefrant, S. Spectres Raman des opales: Aspect diagnostique et aide à la classification. Eur. J. Miner. 1999, 11, 899–908. [Google Scholar] [CrossRef]
  95. Cicconi, M.R.; Neuville, D.R. Natural Glasses. In Springer Handbook of Glass; Musgraves, J.D., Hu, J., Calvez, L., Eds.; Springer International Publishing: Cham, Switzerland, 2019; pp. 771–812. ISBN 978-3-319-93726-7. [Google Scholar]
  96. Kingma, K.J.; Hemley, R.J. Raman Spectroscopic Study of Microcrystalline Silica. Am. Mineral. 1994, 79, 269–273. [Google Scholar]
  97. Touret, J. The Significance of Fluid Inclusions in Metamorphic Rocks. In Thermodynamics in Geology; Fraser, D.G., Ed.; D. Reidel Publishing Company: Dordrecht, Germany, 1977; pp. 203–227. [Google Scholar]
  98. Touret, J. Faciès Granulite et Fluides Carboniques. Ann. Soc. Géol. Belg. Publ. Spéc. Géol. Domaines Cristal. Centen. Soc. Géol. Belg. 1974, 267–287. [Google Scholar]
  99. Sirbescu, M.-L.C.; Nabelek, P.I. Crustal melts below 400 °C. Geology 2003, 31, 685. [Google Scholar] [CrossRef]
  100. Sirbescu, M.-L.C.; Nabelek, P.I. Crystallization conditions and evolution of magmatic fluids in the Harney Peak Granite and associated pegmatites, Black Hills, South Dakota—Evidence from fluid inclusions. Geochim. Cosmochim. Acta 2003, 67, 2443–2465. [Google Scholar] [CrossRef]
  101. Henisch, H.K. Crystal Growth in Gels. Helv. Phys. Acta 1968, 41, 888–897. [Google Scholar] [CrossRef]
  102. Henisch, H.K. Crystals in Gels and Liesegang Rings: In Vitro Veritas; Cambridge University Press: Cambridge, UK; New York, NY, USA, 1988; ISBN 978-0-521-34503-3. [Google Scholar]
  103. Zagorsky, V. Mineralogy of pockets of the Malkhan tourmaline deposit (Transbaikalia): Feldspars of the Sosedka vein. Russ. Geol. Geophys. 2012, 53, 522–534. [Google Scholar] [CrossRef]
  104. Zagorsky, V.Y. Sosedka pegmatite body at the Malkhan deposit of gem tourmaline, Transbaikalia: Composition, inner structure, and petrogenesis. Petrology 2015, 23, 68–92. [Google Scholar] [CrossRef]
  105. Talantsev, A.S. Chamber Pegmatites of the Urals; Nedra: Moscow, Russia, 1988. [Google Scholar]
  106. Hulsbosch, N.; Boiron, M.-C.; Thomas, R.; van Daele, J.; Dewaele, S.; Muchez, P. Evaluation of the petrogenetic significance of melt inclusions in pegmatitic schorl-dravite from graphic tourmaline-quartz assemblages: Application of LA-ICP-QMS analyses and volume ratio calculations. Geochim. Cosmochim. Acta 2019, 244, 308–335. [Google Scholar] [CrossRef]
  107. Morteani, G.; Kostitsyn, Y.A.; Gilg, H.A.; Preinfalk, C.; Razakamanana, T. Geochemistry of phlogopite, diopside, calcite, anhydrite and apatite pegmatites and syenites of southern Madagascar: Evidence for crustal silicocarbonatitic (CSC) melt formation in a Panafrican collisional tectonic setting. Acta Diabetol. 2012, 102, 627–645. [Google Scholar] [CrossRef]
  108. Martin, R.F.; Randrianandraisana, A.; Boulvais, P. Ampandrandava and similar phlogopite deposits in southern Madagascar: Derivation from a silicocarbonatitic melt of crustal origin. J. Afr. Earth Sci. 2014, 94, 111–118. [Google Scholar] [CrossRef]
  109. Smith, S.R.; Kelley, S.P.; Tindle, A.G.; Breaks, F.W. Compositional controls on 40Ar/39Ar ages of zoned mica from a rare-element pegmatite. Contrib. Miner. Pet. 2005, 149, 613–626. [Google Scholar] [CrossRef]
  110. Schaltegger, U.; Ulianov, A.; Müntener, O.; Ovtcharova, M.; Peytcheva, I.; Vonlanthen, P.; Vennemann, T.; Antognini, M.; Girlanda, F. Megacrystic zircon with planar fractures in miaskite-type nepheline pegmatites formed at high pressures in the lower crust (Ivrea Zone, southern Alps, Switzerland). Am. Miner. 2015, 100, 83–94. [Google Scholar] [CrossRef]
  111. Bergemann, C.; Gnos, E.; Berger, A.; Whitehouse, M.; Mullis, J.; Wehrens, P.; Pettke, T.; Janots, E. Th-Pb ion probe dating of zoned hydrothermal monazite and its implications for repeated shear zone activity: An example from the Central Alps, Switzerland. Tectonics 2017, 36, 671–689. [Google Scholar] [CrossRef]
  112. Ricchi, E.; Bergemann, C.A.; Gnos, E.; Berger, A.; Rubatto, D.; Whitehouse, M.J. Constraining deformation phases in the Aar Massif and the Gotthard Nappe (Switzerland) using Th-Pb crystallization ages of fissure monazite-(Ce). Lithos 2019, 342–343, 223–238. [Google Scholar] [CrossRef] [Green Version]
  113. Fulignati, P.; Kamenetsky, V.S.; Marianelli, P.; Sbrana, A.; Meffre, S. First insights on the metallogenic signature of magmatic fluids exsolved from the active magma chamber of Vesuvius (AD 79 “Pompei” eruption). J. Volcanol. Geotherm. Res. 2011, 200, 223–233. [Google Scholar] [CrossRef]
  114. Kamenetsky, V.S.; Kamenetsky, M.B. Magmatic fluids immiscible with silicate melts: Examples from inclusions in phenocrysts and glasses, and implications for magma evolution and metal transport. Geofluids 2010, 10, 293–311. [Google Scholar] [CrossRef]
  115. Fiedrich, A.M.; Heinrich, C.A.; Bachmann, O. Evolution from magmatic to hydrothermal activity beneath the Cerro Escorial volcano (NW Argentina) as sampled by erupted quartz and brines. Lithos 2020, 374–375, 105706. [Google Scholar] [CrossRef]
  116. Kamenetsky, V.S.; Naumov, V.B.; Davidson, P.; van Achterbergh, E.; Ryan, C.G. Immiscibility between silicate magmas and aqueous fluids: A melt inclusion pursuit into the magmatic-hydrothermal transition in the Omsukchan Granite (NE Russia). Chem. Geol. 2004, 210, 73–90. [Google Scholar] [CrossRef]
  117. Ferrero, S.; Wunder, B.; Ziemann, M.A.; Wälle, M.; O’Brien, P.J. Carbonatitic and granitic melts produced under conditions of primary immiscibility during anatexis in the lower crust. Earth Planet. Sci. Lett. 2016, 454, 121–131. [Google Scholar] [CrossRef]
  118. Lowenstern, J.B.; Van Hinsberg, V.; Berlo, K.; Liesegang, M.; Iacovino, K.; Bindeman, I.N.; Wright, H.M. Opal-A in Glassy Pumice, Acid Alteration, and the 1817 Phreatomagmatic Eruption at Kawah Ijen (Java), Indonesia. Front. Earth Sci. 2018, 6, 11. [Google Scholar] [CrossRef] [Green Version]
  119. Saunders, J.A. Silica and gold textures in bonanza ores of the Sleeper Deposit, Humboldt County, Nevada; evidence for colloids and implications for epithermal ore-forming processes. Econ. Geol. 1994, 89, 628–638. [Google Scholar] [CrossRef]
  120. Martin, E.; Gaillou, E. Insight on gem opal formation in volcanic ash deposits from a supereruption: A case study through oxygen and hydrogen isotopic composition of opals from Lake Tecopa, California, USA. Am. Miner. 2018, 103, 803–811. [Google Scholar] [CrossRef]
  121. Ivanova, D.A.; Shcherbakov, V.D.; Plechov, P.Y.; Nekrylov, N.A.; Davydova, V.O.; Turova, M.A.; Stepanov, O.V. Cristobalite in extrusive rocks of Bezymianny volcano. New Data Miner. 2018, 52, 51–59. [Google Scholar] [CrossRef]
  122. Horwell, C.J.; Williamson, B.J.; Llewellin, E.W.; Damby, D.E.; Le Blond, J.S. The nature and formation of cristobalite at the Soufrière Hills volcano, Montserrat: Implications for the petrology and stability of silicic lava domes. Bull. Volcanol. 2013, 75, 696. [Google Scholar] [CrossRef] [Green Version]
  123. Popov, D.V.; Brovchenko, V.D.; Nekrylov, N.A.; Plechov, P.Y.; Spikings, R.A.; Tyutyunnik, O.A.; Krigman, L.V.; Anosova, M.O.; Kostitsyn, Y.A.; Soloviev, A.V. Removing a mask of alteration: Geochemistry and age of the Karadag volcanic sequence in SE Crimea. Lithos 2019, 324–325, 371–384. [Google Scholar] [CrossRef]
  124. André, L.; Abraham, K.; Hofmann, A.; Monin, L.; Kleinhanns, I.C.; Foley, S. Early continental crust generated by reworking of basalts variably silicified by seawater. Nat. Geosci. 2019, 12, 769–773. [Google Scholar] [CrossRef]
  125. Collins, W.J.; Murphy, J.B.; Johnson, T.E.; Huang, H.-Q. Critical role of water in the formation of continental crust. Nat. Geosci. 2020, 13, 331–338. [Google Scholar] [CrossRef]
  126. Clay, P.L.; O’Driscoll, B.; Gertisser, R.; Busemann, H.; Sherlock, S.C.; Kelley, S.P. Textural characterization, major and volatile element quantification and Ar–Ar systematics of spherulites in the Rocche Rosse obsidian flow, Lipari, Aeolian Islands: A temperature continuum growth model. Contrib. Miner. Pet. 2013, 165, 373–395. [Google Scholar] [CrossRef]
  127. Breitkreuz, C. Spherulites and lithophysae—200 years of investigation on high-temperature crystallization domains in silica-rich volcanic rocks. Bull. Volcanol. 2013, 75, 705. [Google Scholar] [CrossRef]
  128. Seaman, S.J. Microtexture development during rapid cooling in three rhyolitic lava flows. Am. Miner. 2013, 98, 304–318. [Google Scholar] [CrossRef]
  129. Bullock, L.A.; Gertisser, R.; O’Driscoll, B. Spherulite formation in obsidian lavas in the Aeolian Islands, Italy. Period. Mineral. 2017, 86. [Google Scholar] [CrossRef]
  130. Lofgren, G. Experimentally Produced Devitrification Textures in Natural Rhyolitic Glass. GSA Bull. 1971, 82, 111. [Google Scholar] [CrossRef]
Figure 1. A comparison of hydrosilicate fluids with aluminosilicate melts with respect to possible H2O concentrations and viscosities. (a) A comparison of H2O concentrations reported for hydrosilicate fluids with H2O solubility data for aluminosilicate melts. The orange box shows the range of H2O contents and synthesis pressures for hydrosilicate fluids [1,2,3,4,5,6,7,8,9,10,11,12,13,14,15]. The thick red line shows the H2O-saturated granite solidus, which has the lowest temperature of ~640 °C [37]. The blue field counters H2O solubility curves obtained using the rhyolite option of VolatileCalc [38] for temperatures ranging from 640 to 1000 °C. The green squares show experimental H2O solubility data for a metaluminous trachyte [46]. The purple diamonds show H2O contents in close-to-saturation peralkaline aluminosilicate melts [44]. (b) A comparison of viscosities reported for hydrosilicate fluids with model and experimental data for aluminosilicate melts. The orange square shows the only quantitative viscosity estimate for hydrosilicate fluids with ~11 wt. % of H2O [15]. The grey field shows the range of viscosities calculated for the same hydrosilicate fluids using the model of [43] for aluminosilicate melts. Note that this model fails when applied to hydrosilicate fluids. Question marks show the potential range of viscosities at 200–350 °C that could explain the observation of immiscibility phenomena and bubble migration within quartz-hosted synthetic inclusions of hydrosilicate fluids at these temperatures [3,7,8,9,10,11,12]. This inference is based on the fact that during reheating of melt inclusions in [47] bubbles migrated only in conditions for which the model of [43] yielded viscosities of <104 Pa·s. The dark blue lines show viscosities calculated using the model of [43] for a peraluminous andesite composition given in their work and H2O concentrations ranging from 0.1 to 10 wt.% as indicated in the plot. Similar viscosities are obtained using the model of [48] for metaluminous granites. The purple diamonds [44] and lilac squares [49] show experimental data for some of the least viscous peralkaline aluminosilicate melts with 7.0, 8.6 and 9.0 wt.% of H2O. The green triangles [50] show experimental data for some of the least viscous nearly-peraluminous aluminosilicate melts with an Al/(Li + Na + K) molecular ratio of 1 and 6.6 wt.% of H2O.
Geosciences 12 00028 g001
Figure 2. Examples of synthetic inclusions of hydrosilicate and associated fluids. (ag) Quartz-hosted inclusions obtained in experiments at 800 °C and 2 kbar in a system H3BO3-NaF-SiO2-H2O [10] (reproduced with a permission from Russian Geology and Geophysics). NaF: villiaumite crystal; S: sassolite crystal (H3BO3); c: crystals of other minerals; L: aqueous solution; g: vapour bubble; Gl: gel-like vitreous phase (quenched hydrosilicate fluid); Vf: gel-like viscous phase (quenched hydrosilicate fluid). (ad) Inclusions containing hydrosilicate fluids (ac) and aqueous solutions (a,d) representative of the assemblages obtained in experiments with lower contents of H3BO3 and NaF. Hydrosilicate fluids were sometimes heterogeneously trapped with aqueous solutions (such as in the inclusion in (a)). Some inclusions of hydrosilicate fluids became turbid and grew relatively large daughter crystals after being kept for 2 to 4 years at room temperature (such as that in (c)). (e,f) Coexisting inclusions of hydrosilicate fluids (e) and H3BO3-rich (f) and NaF-rich (g) aqueous solutions obtained in a single experiment with higher contents of H3BO3 and NaF. (h) A globule of a hydrosilicate fluid within an aluminosilicate glass obtained at 770 °C and 1 kbar in a peralkaline system SiO2-Al2O3-Na2O-K2O-H2O [4] (reproduced with a permission from Elsevier). Such globules were described as containing a “viscous, transparent material with characteristic distorted shrinkage bubbles”.
Geosciences 12 00028 g002
Figure 3. Examples of supposed inclusions of hydrosilicate fluids and some associated inclusions. (af) Inclusions in minerals from the Malkhan pegmatites (Russia) reported in [62]. (ac) Quartz-hosted type-A melt inclusions in the interpretation of [62]. Identical inclusions were classified as melt or fluid–melt inclusions in [59,60], and as inclusions of recrystallised gels that represent remnants of hydrosilicate fluids in [5,61]. (d,e) Quartz-hosted type-B (d) and type-C (e) melt inclusions according to [62]. Such inclusions were classified as fluid inclusions by [59,60,61]. S: solution; H3BO3: sassolite crystal; Sil: silicate minerals; V: vapour bubble. (f) A tourmaline-hosted gel-like inclusion according to [62]. Everything except the sassolite crystal and vapour bubble in these inclusions consists of SiO2 phases comprising quartz, cristobalite and moganite. V: vapour bubble. (g) An inclusion of quartz in topaz from greisens of the St. Austell granite (UK) that was interpreted to represent remnants of a SiO2-rich colloid [3,18,19]. The arrow highlights a proposed shrinkage bubble. The image was kindly provided by B. Williamson. (h) Inclusions in chalcedony from the Iceland spar deposits on the Nizhnyaya Tunguska river reported in [67], which are identical to inclusions described in [51]. According to both studies, the entire field of view was initially a silica gel, and the inclusion in the middle was formed by expulsion of a syneresis liquid from that gel (which on its own represents a silica sol [67]). Arrows indicate the outer boundary of a dehydrated SiO2 layer that represents part of the inclusion. The image was kindly provided by V. Prokofiev and reproduced with a permission from the editorial office of Geology.
Geosciences 12 00028 g003
Figure 4. The crystal of gem-quality K-feldspar from our previous study [64] and its inclusions. (a) CL image of the crystal. (b) Photograph of the crystal with illumination from below. (c) Transmitted light image of an opal-A inclusion with prisoner crystals of apatite (Ap) and baddeleyite (Bad). (d,e) Transmitted light (d) and dark field (e) images of a group of inclusions with one opal-CT inclusion, one carbonate (Carb) inclusion and two CO2-rich fluid (Flc) inclusions with daughter carbonate (Carb) and apatite (Ap). Pronounced faceting of all the inclusions in (ce) indicates that their content remained fluid after the entrapment at least for time sufficient to allow K-feldspar to recrystallise. Details concerning the identification of phases other than varieties of opal can found in [64].
Geosciences 12 00028 g004
Figure 5. The studied pegmatite sample and its quartz-hosted inclusions. (a) CL image of the sample. (b) Photograph of the sample. (ce) Transmitted light image of one group of inclusions (c) with a CL image of the same field of view (d) and a BSE image of the inclusions that are exposed at the surface (e). (f,g) Transmitted light images of two other groups of inclusions. Kfs: K-feldspar; Qtz: quartz; Mog: moganite, or moganite-bearing chalcedony or quartz; FlW: H2O-rich fluid; FLC: CO2-rich fluid; Cpx: clinopyroxene; Spl: spinel; Hem: hematite; Carb: carbonate. The subscript ‘W’ and ‘D’ next to Opal-CT indicate wet and dry varieties as constrained by Raman spectroscopy. Pronounced faceting of many inclusions of each type indicates that their content was fluid for sufficient time after the entrapment such that quartz could recrystallise. Variations in bubble to inclusion volumetric ratios observed for CO2- and H2O-rich fluid inclusions in different groups indicate variable entrapment conditions. Note that some areas that look like inclusions in the CL image in (d) are indistinguishable from the surrounding transparent quartz in (c). Example Raman spectra of various SiO2 phases are given in Figures 7 and 8, while those of other phases are provided in the supplementary Figure S1.
Geosciences 12 00028 g005
Figure 6. Transmitted light images of spherulites in chalcedony (a) and quartz (be). Note that spherulites in quartz range from almost identical to those in chalcedony, such as the ones in (b), to very faint and barely visible, such as the ones in (e) and in the top left corner in (c).
Geosciences 12 00028 g006
Figure 7. Representative Raman spectra of SiO2-rich fluid inclusions. Spectra labelled as opal and moganite are from the exposed inclusions in Figure 5c–e. The upper spectrum labelled as moganite was acquired after BSE imaging when the sample surface was coated with carbon, which explains the presence of the band between 1100–1700 cm−1. The locations of the diagnostic Raman bands for moganite, opals, hydrocarbons and water are highlighted.
Geosciences 12 00028 g007
Figure 8. A comparison of selected Raman spectra from SiO2-rich fluid inclusions with those of various SiO2-rich amorphous phases and crystalline SiO2 polymorphs from previous work [93,95,96]. (a) Spectra from amorphous phases (multiple spectra of obsidian and opal-A are shown). The vertical line at 430 cm−1 shows the approximate location of the primary bands in these spectra. Note that the primary bands in the spectra of SiO2-rich glasses typically reach their maximum at higher frequencies, while those in the spectra of opals peak near this line or at lower frequencies. (b) Spectra from opal-C and crystalline phases. The vertical lines highlight the main peaks from the spectrum measured in this study.
Geosciences 12 00028 g008
Publisher’s Note: MDPI stays neutral with regard to jurisdictional claims in published maps and institutional affiliations.

