Abstract
Interpreting the paleoecosystems of ancient microbialites relies on our understanding of how modern microbialites form in relation with the bio-physico-chemical conditions of their environment. In this study, we investigated the formation of modern carbonate microbialites in the hydrothermal system of La Salsa in Laguna Pastos Grandes (Bolivia), which spans a wide range of physicochemical conditions and associated microbial communities. By combining dissolved inorganic carbon (DIC) isotope mass balance modeling, analysis of carbonates solubility diagram, and imaging of the microorganisms–mineral assemblages within microbial mats, we found that several modes of carbonate precipitation dominate in distinct portions of the hydrothermal system. (1) In high-[DIC] waters, undersaturated to slightly saturated with respect to calcite, cyanobacterial calcification is promoted by CO2 degassing and photosynthetic activity within the microbial mats. (2) In alkaline waters undergoing sustained evaporation, the precipitation of an amorphous calcium carbonate phase seems to control the water a(Ca2+)/a(CO32−) ratio and to serve as a precursor to micritic calcite formation in microbial mats. (3) In saline ephemeral ponds, where the carbonate precipitation is the highest, calcite precipitation probably occurs through a different pathway, leading to a different calcite texture, i.e., aggregates of rhombohedral crystals.
1. Introduction
Microbialites are organo-sedimentary structures resulting from the mineralization of benthic microbial mats and/or trapping and binding of sedimentary particles [1]. Being formed by interactions between microbial mat communities and their geochemical environment, microbialites (and among them, the laminated ones called stromatolites) constitute the most conspicuous fossil record of ancient ecosystems since 3.5 Ga, in the early Archean [2]. Understanding modern microbialites and their environment is essential to interpreting the paleoecosystems of the ancient microbialites.
Modern continental microbialites form in a broad range of environments, i.e., hot springs (e.g., [3,4,5]), freshwater rivers and lakes (e.g., [6,7,8]), and hypersaline and/or alkaline lakes (e.g., [9,10,11]). In association with these different environmental settings, microbialites vary in morphology, fabric, and mineralogical and chemical composition (e.g., [11,12,13]). Chagas et al. [13] compiled geochemical data from microbialites and surrounding waters from 21 lakes and identified key physicochemical parameters that may control the diversity of chemical and mineralogical compositions observed in lacustrine microbialites. These include alkalinity, salinity, (Mg/Ca)aq ratio, and dissolved Mg2+ and H4SiO4 concentrations. More recently, Zeyen et al. [11] reported new data from 11 Mexican crater lakes and showed that the abundance and mineralogy of microbialites evolve possibly in response to changes in the evaporation rate as the main control on lake water chemistry. Besides the importance of the physico-chemistry of the environment, microorganisms likely play a central role in biogeochemical cycles (e.g., [14]) and have been shown to control, or at least influence, mineralization through their metabolisms (e.g., cyanobacteria, sulfate-reducing bacteria, sulfide-oxidizing bacteria, and iron-reducing bacteria) [15,16,17]. For example, cyanobacteria promote carbonate precipitation within microbial mats through photosynthesis by inducing a local pH increase (e.g., [16,18,19,20]). By contrast, several other microorganisms, such as aerobic heterotrophs or fermenters, promote carbonate dissolution by acidification [15,21]. In addition, some species have been described as systematically associated with specific mineral precipitates, possibly because of their sheath properties in which cations can accumulate [16,22,23], or because of exopolymeric substances (EPS), produced in abundance by diverse microorganisms, which contain highly reactive acidic groups capable of binding divalent cations, such as Ca2+ and Mg2+ (e.g., [24]). Accordingly, both sheath properties and EPS are likely to promote or inhibit mineral precipitation, and to influence the mineralogy and shape of mineral products [25,26]. Therefore, because numerous processes may contribute to the formation of microbialites, identifying the key drivers of precipitation under various environmental conditions remains an ongoing challenge.
In order to gain more information on precipitation processes and their relation with microbialite structure, we focused this study on the hydrothermal system of La Salsa in Laguna Pastos Grandes. This hydrothermal system is characterized by a wide range of physicochemical conditions and associated microbialite structures. Previous studies documented both the morphologies of microbialites and their strong variations in carbon and oxygen isotope compositions. They were interpreted as reflecting an evolution of the water chemistry along the hydrothermal transect [27,28]. Here, we characterize and quantify the physical and biogeochemical processes controlling carbonate precipitation in this hydrothermal environment. To do so, we investigated the three main parameters controlling carbonate precipitation: dissolved inorganic carbon (DIC) concentration, Ca concentration, and biological activity (e.g., creation of micro-environments, template and metabolic effects). While DIC and Ca concentrations can be determined via chemical measurements, biological activities must be studied in situ by small-scale observations. Therefore, we characterized the water chemistry (including Ca2+ and alkalinity) and measured, among other things, the DIC carbon isotope composition. By a simple mass and isotope balance modeling of the various fluxes of carbon to and from the DIC reservoir, we semi-quantify the processes controlling changes in the size of the DIC reservoir. In parallel, in situ observations of the calcifying mats provide information on possible biological controls on carbonatation.
2. Geological Setting
With an area of about 120 km2, Laguna Pastos Grandes is one of the largest salars on the southern Bolivian Altiplano (Figure 1a; [29]). It culminates at 4450 m in a volcanic caldera, resulting from two ignimbritic eruptions dated at 5.45 ± 0.02 and 2.89 ± 0.01 Ma using the 40Ar/39Ar method on sanidine [30]. Laguna Pastos Grandes is probably the remnant of a larger lake that once occupied the caldera moat [31]. The southern Bolivian Altiplano is characterized by a cold and dry climate [32]. Most of the precipitations, with an annual mean of 100 mm, occur as rainfalls during the austral summer, from December to March. During the rest of the year, dry conditions dominate, with a high evaporation rate of approximately 1400 mm/yr. Air temperature can range from −30 °C in winter to +25 °C during summer with a daily temperature range up to 40 °C [33].
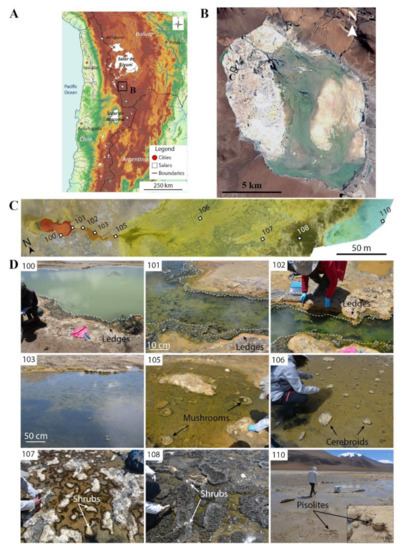
Figure 1.
“La Salsa” hydrothermal system in Laguna Pastos Grandes, Bolivia. (a) Topographic map of the Central Andes showing the location of Laguna Pastos Grandes in Bolivia (modified from [38]). (b) Satellite view of Laguna Pastos Grandes with the location of “La Salsa” hydrothermal system on the carbonate platform (image provided by Zoom Earth website, ©2018 Microsoft Corporation Earthstar Geographics (SIO)). (c) Stitched air-drone views of La Salsa showing its hydrothermal discharge. The pool is colored in red, the outflow channel in orange, the spreading area in yellow, and the ephemeral ponds in blue. Water samples are numbered from 100 to 110 (modified from [27]). (d) Overview of the sampling zones along La Salsa spring. Samples 100–102: The white dotted line delimits the calcifying green filamentous microbial mat covering the border of the pool and the main channel hereafter called ledge microbialites. Sample 103: The channel, flanked by ledge microbialites, widens. Sample 105: Mushroom-like microbialites associated with green filamentous microbial mats appear in the middle of the stream flow. Sample 106: Cerebroid microbialites precipitate in the stream flow, they expand laterally at the air–water interface, and form planar-to-columnar structures. Sample 107: Snake-like structures are surrounded by discontinuous black microbial mats. Sample 108: Patchwork of white calcitic shrubs and black pustular microbial mats. Sample 110: Ephemeral ponds showing 1–5 cm-large isolated and fused pisolites.
Laguna Pastos Grandes is divided into three main sedimentary domains previously identified by [34]: the eastern part exhibits a wide playa-lake environment with muds containing gypsum, diatoms, clays, and fine volcanoclastics; the central lacustrine area is composed of gypsiferous muds associated with ulexite, a borate mineral (NaCaB5O9·8H2O) currently extracted for borate production [35]; and the western part corresponds to a vast 40 km2 palustrine, carbonate-rich platform, highly fragmented by cryoturbation and mainly composed of ooids, micritic deposits, bushy structures, and pisolites reaching up to 20 cm in diameter [29,34,36,37]. Numerous small-to-big hydrothermal springs discharge over this platform producing present-day carbonate deposits. These springs are enriched in Ca due to the alteration of the volcanic bedrock by aqueous fluids heated at ∼225 °C and enriched in magmatic mantle-derived CO2 [38]. The biggest hydrothermal springs are composed of a central pool (from 200 to 13,000 m2), located on a flat mound (<2 m high), from which thermal waters flow through one or more shallow channels before spreading on and eventually seeping through the fragmented carbonate crust of the platform.
3. Previous Results on La Salsa Spring
Figure 1 shows the location and structure of the hydrothermal system of La Salsa, which is quite stable through seasons (based on satellite images from 2004 to 2020). In the hydrothermal system of La Salsa, hot and slightly acidic (pH between 5.8 and 6.9) waters with CO2 bubbles emerge in the central pool (Figure 1c,d). The water then evolves until complete evaporation along a 300 m-long transect through an outflow channel and a spreading area. The pH increases from 5.8 to 8.8, the temperature decreases from 43.4 °C to 20.7 °C (daytime values during the austral summer) and the salinity increases from slightly saline water (11.5 g/L) to saturation with gypsum and finally halite [27]. The oxygen saturation is globally above 100% along the spring except at the beginning of the spreading area where it decreases to 69% (i.e., 3.2 mg/L in PG106). The maximum oxygen saturation of 426% is observed at the end of the channel in PG105 [27]. Bougeault et al. [27] showed that in situ measurements of pH, conductivity, and temperature are similar along the spring during dry and wet seasons. Although dissolved oxygen may fluctuate, it is globally above 100% in both dry and wet seasons.
The diversity of microbialite morphologies along this hydrothermal system has been described by Bougeault et al. [27] and is summarized hereafter (Figure 1c,d). The borders of the central pool and the channel are rimmed by a few centimeter-thick green microbial mats (samples 100 to 103 in Figure 1 and Figure 2) promoting the formation of ledge microbialites. These microbialites are composed of alternations of micritic laminae, bundles of microbial sheaths (up to 500 μm-thick), and diatom clusters. It is worth noting that mineralization mainly occurs within microbial mats, at the air–water interface, and under vadose conditions, where capillary pumping favors strong evaporation, modifying the porewater chemistry [27]. In the stream flow, at sample PG105, a second type of microbialite grows. It presents the same microstructure organization as ledges, but expands laterally at the air–water interface and above, as flat-topped structures hence defined as mushroom-like microbialites (105 in Figure 1 and Figure 2).
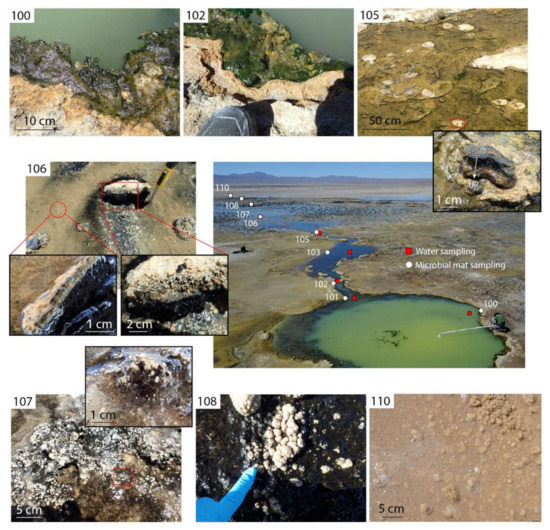
Figure 2.
Distribution and morphology of microbialites along La Salsa spring. Samples 100–102: Ledge microbialites covered by a green filamentous microbial mat. Sample 105: Mushroom-like microbialites scattered in the stream flow. The close-up image shows the upside-down structure of a mushroom composed of a dark green–red layer topped by the carbonate. Sample 106: Cerebroid microbialites scattered in the stream flow. The close-up images show the different layers of the mud lying on a thick black horizon that covers the area (on the left) and the calcitic shrubs that precipitate in association with thin black microbial mat (on the right). Sample 107: Black microbial mats and their associated calcitic shrubs. The close-up image shows the structure of a calcitic shrub. Sample 108: Calcitic shrubs in a thick black pustular microbial mat. Sample 110: 1 to 5 cm pisolites in a shallow ephemeral pond. From 106 to 110, location of water and microbial mat sampling are merged.
At the end of the main channel, the flow spreads on the flat mound flanks (spreading area), covered by soft, muddy sediments, and becoming anastomosed. Associated with these muddy sediments, cerebroid microbialites with similar microstructures to ledges and mushroom-like structures grow from reworked clasts such as pedogenic packstones and floatstones or fragments inherited from the underlying and surrounding carbonate platform (106 in Figure 1 and Figure 2). However, they are scarce and slightly differ in organization, with planar-laminated micritic-rich layers locally transitioning to columnar-laminated layers.
A narrow belt separates the spreading area (PG106) and the distal zone (PG108). Muddy soft sediments cover most of the surface, forming numerous small pudgy or “snake-like” shapes (5 to 10 cm-wide and up to 1 m-long; as defined in [27]) surrounded by discontinuous black microbial mats (107 in Figure 1 and Figure 2). They are composed of densely or loosely packed layers of clotted micrite, displaying microbial sheaths and diatoms. Associated to the black microbial mats, a few isolated (1 to 5 cm) structures composed of a dense network of millimetric branches can be found (Figure 2). These structures are composed of alternations of opal-A and micritic and sparitic calcite laminae, include rare diatoms, and are referred to as calcitic shrubs.
Further on, the distal zone of the hydrothermal system is subjected to a strong evaporation (conductivity increasing up to 48 mS/cm during the wet season). There, calcitic shrubs become more abundant and form both isolated (1 to 5 cm) and planar structures (5 to 50 cm) sometimes aligned in rims, surrounding large, shallow ponds, colonized by black pustular mats (108 in Figure 1 and Figure 2).
In the most distal part of the hydrothermal system, halite and gypsum precipitate from the residual brines and form halite crusts during the dry season. This saline peripheral crust is ephemeral and dissolves during the wet season occurring between February and April. During this period, hydrothermal waters mixed with meteoric inputs invade numerous parts of the surrounding carbonate platform. This results in the formation of ephemeral shallow ponds with pisolites (1–5 cm-large; 110 in Figure 1 and Figure 2). These spherical concretions are composed of an alternation of micritic, sparitic, and amorphous silica laminae [27,29,34].
Recently, the diversity of carbonate microbialites from Laguna Pastos Grandes and their isotopic compositions were described in relation to water temperature, pH, conductivity, and oxygen saturation measured in January 2016 and March 2017 [27,28]. These studies highlighted the link between the microbialite distribution and morphology and the environmental characteristics (i.e., substrate, hydrodynamics, climatic effects) [27,28]. The high ranges of isotope variations recorded in microbialites, reaching 13.9‰ in δ13C and 11.1‰ in δ18O, were explained by rapid CO2 degassing and temperature decrease along hydrothermal discharges and strong evaporation favored by the arid high-altitude Andean climate, locally enhanced by capillary water rise within microbial mats [28].
4. Materials and Methods
4.1. Sampling and Analytical Methods
We collected nine water and microbialite samples with their living microbial mats. The water samples were collected at the same time and place as those previously studied by Bougeault et al. [27] for temperature, pH, conductivity, and dissolved O2 (Table 1, noted in italics). Two samples were collected in the central pool (100, 101), three in the outflow channel (102, 103, 105), three in the spreading area (106, 107, 108), and one in an ephemeral pond in the distal part of the system (110; Figure 1 and Figure 2). The field campaign was conducted in March 2017 during the wet season.

Table 1.
In situ measurements and laboratory analyses performed on water samples collected along La Salsa spring. <dl, below detection limit. Previous data from [27] are in italics. The ionic balance (NICB) is calculated with measured alkalinity values, except in PG107, for which it is calculated with the [DIC]mes.
Water samples were filtered at 0.2 µm (0.1 µm for cations) with sterile acrylic filter (Sartorius Minisart®) fixed at the end of 50 mL syringes, and cation samples were acidified with 3 drops of HNO3 (16N) in the field. Chemical analyses, summarized in Table 1, were carried out at the Total laboratory (Pau, CSTJF, France) using ion chromatography (Cl, Br, and SO4), inductively coupled plasma-atomic emission spectroscopy (Li, B, and Sr), inductively coupled plasma-mass spectrometry (Ca and Mg), and flame emission spectrometry (Na, K, Ca, and SiO2). The accuracy of the determination of major species was better than ± 5% and verified by repeated measurements of standard materials: namely, Ion96–3 and LGC6020 for cations and anions, and Li and B diluted standard solutions (Merck) for Li and B determinations. Saline samples were analyzed either after dilution (to minimize matrix effects during measurement) or by using the technique of the standard addition (to match the matrixes of the standard materials). The check of matrix effects was conducted on at least 3 dilutions (500, 1000, 2000). The total alkalinity was determined by end-point titration with HCl (1 N or 0.1 N) with an automatic titrimeter (Metrohm) at the Total laboratory (France, error below 1%) 3 months after sampling. In our system, it can be approximated as:
Alk = [HCO3−] + 2[CO32−] + [B(OH)4−] + [OH−] − [H+]
Analyses of water oxygen and hydrogen isotopes were performed at the BRGM Stable Isotope laboratory using a Finnigan MAT 252 mass spectrometer, after one night of equilibration between 1 mL of water and gas mixtures of H2–He and CO2–He, respectively, for δD and δ18O [39]. The external precision was ± 0.1‰ for δ18O and ± 0.8‰ for δD vs. SMOW.
The dissolved inorganic carbon concentration [DIC] and its carbon isotopic composition were analyzed on solutions stored in 12 mL Exetainer® vials at the Institut de physique du globe de Paris (IPGP, France) in April 2017 following the analytical protocol detailed in Assayag et al. [40]. An aliquot of the water sample was injected into a Labco Exetainer tube pre-loaded with H3PO4 and He-flushed. After the dissolved CO2 had equilibrated with the headspace gas (for one night), gases (i.e., He and CO2) were sampled and introduced into a gas chromatography–isotope ratio mass spectrometer (AP2003). The measurements of the carbon isotope ratio of the released CO2(g) were calibrated using CaCO3 standards to yield the δ13CDIC versus the PDB scale. The δ13CDIC values were determined with a precision (1σ) better than ±0.23‰, for DIC concentrations between 0.1 and 16 mM (Table 1). The analytical uncertainties on [DIC] measurements were about 10%.
The isotopic composition of the solid carbonates (δ13Ccarb and δ18Ocarb) was determined after removing the microbial mat organic matter following the NaOCl method recommended by Lebeau et al. [41]. Ten to twenty milligrams of surficial microbialites was powdered in an agate mortar and reacted with NaOCl 3.5% in excess (20–30 mL) at room temperature (20–22 °C) for 3 days with agitation to remove the organic matter. After removing the supernatant, the residues were rinsed 6 times with deionized distilled water, centrifuged, and dried at 50 °C for 3 days. Then, 2–3 mg of powder was introduced into a Labco Exetainer tube priorly He-flushed to be reacted with H3PO4. After complete dissolution of the carbonate, the headspace gases (i.e., He and CO2) were sampled and introduced into a gas chromatography–isotope ratio mass spectrometer (AP2003). The measurements of the carbon and oxygen isotope ratio of the released CO2(g) were calibrated using CaCO3 internal standards to yield the δ13Ccarb versus the V-PDB and δ18Ocarb versus SMOW. The δ13Ccarb values were determined with a precision (1σ) better than ±0.1‰ and δ18Ocarb better than ±0.3‰ based on duplicate measurements of the samples (Table 1).
Finally, ~100 mg of living microbial mats collected from the top of microbialites, preserved at −20 °C since collection (in a camping freezer during the campaign), were dried at 60 °C overnight, powdered with an agate mortar, and reacted with excess HCl (6 N) at room temperature in glass beakers for one night. After removing the supernatant, samples were acidified again with HCl (6 N) at 80 °C and agitated for 2 h. After decantation, the residues were rinsed with deionized distilled water until neutral, centrifuged, and dried at 60 °C overnight. Aliquots of dried decarbonated samples (~1 mg) were then weighed into tin capsules (IVA Analysentechnik). The carbon isotopic composition of the organic matter (δ13Corg) was measured with a Flash EA1112 elemental analyzer coupled to a Thermo Finnigan DELTA plus XP isotope ratio mass spectrometer interfaced with a ConFlo IV interface, at the Institut de physique du globe de Paris (IPGP, France). Reproducibility of the δ13Corg, based on duplicate measurements of the samples, is usually of ±0.1‰ and better than ±0.3‰ (1σ).
4.2. PHREEQC Thermodynamic Modeling
Due to the large analytical uncertainties associated with [DIC] measurements (±10%) in comparison with those associated with alkalinity measurements (1%), [DIC] was recalculated using alkalinity and pH data (Table 2). However, in PG107, the alkalinity measurement was underestimated (perhaps due to carbonate precipitation in the tube), as shown by the internal inconsistency of pH, alkalinity, and [DIC] measurements presented in Table S1. Therefore, modeling of carbonate speciation at thermodynamic equilibrium, mineral saturation state, and pCO2 at each sampling point was undertaken using the measured alkalinity (or [DIC] for PG107) and the in situ pH measurements presented in Table 1 with the software PHREEQC 3 [42] and the thermodynamic database “thermoddem.dat” [43]. Degassed CO2 values correspond to the difference in pCO2 in equilibrium with the water between two consecutive sampling point. The saturation index (SI) is defined as the logarithm of the ratio of the ion activity product (IAP) over the solubility constant (Ks) as follows:
SI = log (IAP/Ks)
Table 2.
PHREEQC modeling results at thermodynamic equilibrium. Carbonate speciation and saturation indexes (SI) were calculated using the database Thermoddem and measured alkalinity, except in PG107, where we used the measured [DIC].
A solution is supersaturated with respect to a mineral phase when SI is positive.
The evaporation extent was calculated based on the dissolved Cl concentration at PG102, and changes in Cl concentration at each successive sampling point, assuming a unique water input (i.e., the vent within the central pool) for this transect. In the distal ponds where the hydrothermal input is potentially mixed with meteoric water, the evaporation extent is probably underestimated.
4.3. Workflow of DIC Isotopic Mass Balance Calculations
Step 1. To quantify the net effect of CO2 degassing (deg)/CO2 pumping (pump), photosynthesis (photo)/respiration (resp), and carbonate precipitation (carb)/dissolution (diss), on [DIC] and its isotopic composition along the transect, we used a system of two equations: the mass balance of the DIC and the isotopic mass balance of the DIC, as follows:
[DIC]i = [DIC]i + 1 + [DIC]deg − [DIC]pump + [DIC]photo − [DIC]resp + [DIC]carb − [DIC]diss
δ13Ci = δ13Ci + 1 × Ptrans + δ13Cdeg × Pdeg − δ13Catm × Ppump + δ13Corg × (Pphoto − Presp) + δ13Ccarb × (Pcarb − Pdiss)
Px are the net proportions of DIC transported by the water flow between two consecutive sampling points i and i + 1 (Ptrans), CO2 degassed in the atmosphere (Pdeg) or pump from it (Ppump), fixed by photosynthetic activity (Pphoto) or liberated by respiration (Presp), and trapped by carbonate precipitation (Pcarb) or released by dissolution (Pdiss), expressed as:
Px = [DIC]x/[DIC]i
The sum of all proportions Px is equal to 1 and the DIC concentrations [DIC]i and [DIC]i + 1 are calculated with PHREEQC using in situ pH and measured alkalinity ([DIC]mes for PG107), and are given in Table 3. The unknowns are: [DIC]deg, [DIC]pump, [DIC]photo, and [DIC]resp. To reduce the number of unknowns, we simplified these equations by combining the geochemically opposite reactions in a unique term:
[DIC]i = [DIC]i + 1 + [DIC]deg–pump + [DIC]photo–resp + [DIC]carb–diss
δ13Ci = δ13Ci + 1 × Ptrans + δ13Cdeg × Pdeg–pump + δ13Corg × Pphoto–resp + δ13Ccarb × Pcarb–diss
Table 3.
DIC isotope and mass balance model forcing and results along the hydrological profile of La Salsa. PG101 is considered as the initial point. Ptransf: net proportion of C transferred; Pdeg–pump; net proportion of CO2 degassing (positive value) or pumping (negative value); Pphoto–resp: net proportion of photosynthesis (positive value) or respiration (negative value); Pcarb–diss: net proportion of carbonate precipitation (positive value) or dissolution (negative value). Values in brackets are calculated using δ13Catm instead of δ13Cdeg.
In this simplified system, there are only two unknowns, [DIC]deg–pump and [DIC]photo–resp, the precipitation/dissolution of carbonate being calculated hereafter (see Step 3). When the proportions are positive, the net output process is dominant (i.e., degassing, photosynthesis, and carbonate precipitation), whereas when they are negative, the opposite process prevails. The major assumption for this simplification is that the isotope compositions of the fluxes extracting and adding DIC via photosynthesis/respiration, degassing/pumping, and precipitation/dissolution of CaCO3 are the same. We evaluate the robustness of this assumption as follows: (i) for photosynthesis/respiration, there is a large fractionation associated with carbon fixation, but only a very minor fractionation associated to heterotrophic respiration [44], so that the isotopic composition of the two fluxes can be considered similar; (ii) for precipitation/dissolution, there is only a small fractionation during precipitation, and no fractionation during dissolution. As a result, as for photosynthesis/respiration, the isotopic composition of the two fluxes can be considered similar; and (iii) for degassing/pumping, the isotopic composition of the CO2 degassed into the atmosphere or pumped from it is calculated at equilibrium with the dissolved CO2 in the initial sampling point i (see Step 4). Therefore, it assumes that when the atmospheric CO2 pumping is dominant, i.e., from PG107 to PG110, δ13Catm is equivalent to δ13Cdeg. Between PG107 and PG110, δ13Cdeg values (of −6.14‰ and −7.31‰) are close to δ13Catm (of −8‰) so that the modeling results obtained are similar when using δ13Catm instead of δ13Cdeg (Table 3).
Step 2. In these equations and further, the concentrations of DIC and major elements are corrected from the evaporation effect, using equation 6, assuming that the increasing Cl concentration along the transect is only controlled by evaporation (Table S2):
with [X] the concentration of each major element, the DIC content or the alkalinity, [Cl]i the initial concentration of Cl (in PG102), and [Cl]x the Cl concentration at each point of the transect thereafter. Indeed, Cl can be considered conservative in La Salsa because the evaporation is not high enough to either significantly increase the concentration of Cl complexes (such as MgCl+, KCl, CaCl+, and CaCl2) which, according to PHREEQC modeling, remain two orders of magnitude less concentrated than Cl−, or reach NaCl precipitation. As a complement, we obtained similar evaporation extent using Na concentration (Figure S1). As the central pool is heterogeneous, the Cl concentration in the main channel (PG102) was selected as the initial value, after which it continuously increases along the transect because of evaporation (Table 1). This initial value is equal to the average concentration of the central pool (226 mM).
[X]’ = [X] × [Cl]i/[Cl]x
Step 3. Assuming that the variation of the Ca concentration corrected for the evaporation (Ca′; Table S2) is only due to the precipitation or dissolution of carbonates following the reaction 7:
the carbon content involved in the carbonate precipitation or dissolution can be calculated with Equation (8), as the variation of the corrected Ca concentration between two consecutive sampling points:
Ca2+ + 2HCO3− –> CaCO3 + CO2aq + H2O
[DIC]carb–diss = Ca′i + 1 − Ca′i
We assume that the Ca is precipitated along the transect only in carbonates and that the amount of Ca stored in biofilms is more than one order of magnitude smaller on the basis of direct measurements in analogous systems [4]. Alternatively, the [DIC] involved in carbonate precipitation/dissolution can be calculated, following the stoichiometry of process 7, as half of the change in evaporation-corrected alkalinity between two consecutive sampling points. The comparison of the two methods of calculation is discussed in Step 7.
Step 4. Based on fractionation factors ε from Mook [45], the measured δ13CDIC, the in situ temperature, and the concentrations of [DIC], [CO2]aq, [HCO3−], and [CO32−] determined with PHREEQC based on alkalinity and pH measurements (Table 2), δ13CHCO3, and δ13CCO2aq are estimated at each sampling point as follows [46]:
with:
δ13CHCO3 = [δ13CDIC × [DIC] − ([CO2]aq × εCO2aq-HCO3 + [CO32−] × εCO3-HCO3)]/[(1 + εCO2aq-HCO3 × 10−3) × [CO2]aq + [HCO3−] + (1 + εCO3-HCO3 × 10−3) × [CO32−]]
δ13CCO2aq = δ13CHCO3 − (1 + εCO2aq-HCO3 × 10−3) + εCO2aq-HCO3
εCO2aq-HCO3 = −9866/T + 24.12
εCO3-HCO3 = −867/T + 2.52
Then, the isotopic composition of the degassed CO2 at equilibrium with the dissolved CO2 is calculated at each sampling point as:
with:
δ13Cdeg = δ13CCO2aq − ε CO2aq-CO2g
εCO2aq-CO2g = −373/T + 0.19
In the central pool, where degassing is maximum (Table 2), the isotopic composition of the hydrothermal CO2 gas (δ13C value of −11.2‰; [38]) is nonetheless close to that at equilibrium with the DIC (δ13CDIC value of −5.5 ± 0.1‰ versus −6.1‰ at equilibrium with the gas at 43.4 °C). This justifies the calculation of δ13Cdeg using an equilibrium fractionation in the other locations where degassing is lower (Table 2).
Step 5. δ13Corg and δ13Ccarb used in the model calculations have been measured on samples (see Table 3).
Step 6. Uncertainties associated with the DIC isotope mass balance were calculated using the Monte Carlo method [47]. Each measured parameter (temperature, δ13CDIC, δ13Corg, δ13Ccarb, alkalinity) was randomly drawn 1000 times within ±1 sigma of the mean value. For each draw, the parameters of Steps 1–5 used in the model (εCO2aq-HCO3, εCO3-HCO3, εCO2aq-CO2g, [DIC], [CO2]aq, [HCO3−], [CO32−], δ13CHCO3, δ13CCO2aq, δ13Cdeg, [DIC]deg–pump, [DIC]photo–resp, [DIC]carb–diss, Px) were calculated to obtain 1000 DIC isotope mass balances. The errors associated with the model results correspond to the standard deviation over 1000 calculations and are given in Table S3.
Step 7. The robustness of the DIC isotope mass balance modeling was tested by using various combinations of the three parameters measured independently ([Ca], [DIC], and alkalinity): (1) using Ca concentration to estimate carbonate precipitation and the measured alkalinity and pH to estimate the [DIC] (presented in the main text); (2) using Ca concentration to estimate carbonate precipitation, and the measured [DIC]; (3) using only the measured [DIC] to estimate both the carbonate precipitation (via estimated alkalinity) and the [DIC]; and (4) using the measured alkalinity and pH to estimate both the carbonate precipitation and the [DIC]. The results of the four models agree quite well along the transect with differences in the minor processes in the channel (photosynthesis/respiration and carbonate precipitation/dissolution; Table S4, Figure S2). These four calculations show both the robustness of the model and its limits. Further on, we will present the results of the model based on the most precise measurements, i.e., Ca concentration and alkalinity, the precision of our DIC measurements being of only ±10% of the measured value.
4.4. Microbial Mat Fixation and Microscopy Methods
Microbial mats at the top of microbialites were fixed immediately in the field in three different solutions: (i) RNAlater® (Thermo Fisher Scientific, Waltham, MA, USA) to preserve the pigmentation of cyanobacteria and purple bacteria [16,23]; (ii) ethanol 50% in phosphate-buffered saline solution (PBS; Merck KGa, Darmstadt, Germany); and (iii) formaldehyde 4% in PBS for at least 2 h, and then ethanol 50% in PBS after two washings in PBS. Fixed samples were transferred in a camping freezer at −10 °C during field missions.
Confocal laser scanning microscope (CLSM) analyses were performed with an Olympus FluoView FV1000 confocal microscope (Olympus Tokyo, Japan). Samples (fixed with formaldehyde or RNAlater®) were observed using an oil-immersion objective (Olympus UPSLAPO X60). DNA staining of microorganisms was performed either with Syto9® Green Fluorescent Nucleic Acid Stain at 10 μM (Thermo Fisher Scientific, Waltham, MA, USA) or DAPI (4′,6-diamidino−2-phenylindole) at 1 to 10 μg/mL for 10 min at room temperature in the dark, followed by two washings with sterile Milli-Q water. Calcein (2,4-bis-[N,N0-di(carbomethyl)-aminomethyl]-flluorescein) staining at 0.1 mg/mL, which binds divalent cations, was used to detect accumulations of Ca2+ and Mg2+ in biofilms. Fluorescence image stacks were obtained with concomitant excitation at wavelengths of 405, 488, and 543 nm by collecting the emitted fluorescence, respectively, in the ranges 425–475, 500–530, and 560–660 nm.
Scanning electron microscopy (SEM) was performed at the Plateforme de Microscopie Electronique, IPGP (France) using a Zeiss Auriga FEG-FIB microscope. Images were collected using secondary electron detectors (Everhart–Thornley for high-voltage mode, and InLens for low-voltage mode) and a backscattered electron detector (NST BSD). Accelerating voltage ranged from 3 to 15 kV at variable pressures and high current (up to 1 nA) or was fixed at 3 kV under high vacuum and low current (down to 10 pA). Elemental microanalyses and mapping were performed using energy dispersive x-ray (EDX) spectrometers (Bruker Quanta 200). For concomitant CLSM and SEM observations, samples fixed in formaldehyde and ethanol were stained in the laboratory with calcein and DAPI, before being embedded in LR-White resin (Polysciences, Warrington, PA, USA), cut into 1 mm-thick slices, and polished, as previously described in Gérard et al. [16,23].
5. Results
5.1. Water Chemistry along La Salsa Spring
The [DIC] decreases along the spring from 16.3 ± 0.2 mM in PG101 to 2.0 ± 0.1 mM in PG110, whereas the δ13CDIC values increase from −6.4 ± 0.1‰ in PG101 to 15.69 ± 0.01‰ in PG110 (Figure 3g). Concomitantly, the microbialites δ13Corg and δ13Ccarb values globally increase from the central pool (PG100) to the distal ephemeral ponds (PG110) from −31.3 ± 0.3‰ to −21.2 ± 0.1‰ and from −1.11 ± 0.02‰ to 8.11 ± 0.01‰, respectively (Figure 3f). Along the transect (from PG100 to PG110), δ18O values progressively increase from −12‰ to 1.2‰ and δD from −94‰ in PG100 to −25‰ (Table 1, Figure S3).

Figure 3.
Geochemical profiles along La Salsa hydrothermal system on the 15th of March 2017. (a) Schematic of La Salsa showing the different sedimentary zones with water sampling points (see geological setting for details). PG100, on the border of the pool, exhibits different values than PG101 (at the exit of the pool) and is indicated in each profile in pale colors (modified from [27]). (b) Evolution of temperature (black), pH (grey), and (c) dissolved oxygen (blue) measured in the field (data from [27]). (d) Calculated pCO2 normalized to the atmospheric value (black) and evaporation extent (grey). (e) Alkalinity’ (black) and Ca′ concentration (mM, grey). The prime indicates that these values were corrected from the effect of evaporation. (f) Carbon isotopic composition of microbialite carbonates (black) and associated organic matter (grey). (g) DIC concentration corrected for the effect of evaporation (grey) and its carbon isotopic composition (black). (h) Relative proportions Px of CO2 degassing (red), photosynthesis (green), water transfer (white), and carbonate precipitation (blue) to the DIC balance predicted by isotopic mass balance along the hydrothermal profile of La Salsa. Their sum equals 1. When the values are negative, the inverse process occurs (striped). PG101, at the exit of the central pool, has been selected as the starting point of the profile.
In the outflow channel, the water flow is high and evaporation is negligible (i.e., less than 6%). The pCO2 in the water, normalized to the atmospheric pressure at 4500 m (see legend of the Table 2), was calculated using PHREEQC modeling of the water chemistry (pH, T, major elements) and is used as an indicator of the degassing rate along the hydrothermal discharge. The maximum pCO2 of 484 mbar was observed at the exit of the main pool (PG101), where the water flow from the hydrothermal source is maximum. This pCO2 value is 2100-fold the atmospheric level, due to the volcanic CO2 input [38]. From this point, the pCO2 of the water samples decreases rapidly along the channel (at PG105: pCO2 wt/pCO2 atm = 98). On the border of the pool (PG100), the pCO2 value of 227 is well below the maximum recorded at the exit of the pool and similar to what is observed in the main channel (Figure 3d). Therefore, the pool is laterally chemically inhomogeneous and PG101 is closer to the initial composition of the hydrothermal source than PG100.
The evolution of the water saturation with respect to various carbonate phases along La Salsa spring is illustrated in a solubility diagram, where the logarithm of a(Ca2+) is plotted against the log of a(CO32−) (Figure 4). In this diagram, waters from the exit of the pool (PG101) and the main channel (PG102) are located below the solubility line of the calcite. Waters lie just above the calcite solubility line in PG103 and are supersaturated with respect to calcite at the end of the main channel (PG105) and on the border of the pool (PG100). Saturation indices are also defined as log (IAP/Ks), where IAP is the ionic product of calcium and carbonate and Ks is the solubility constant of calcite. They are reported in Table 2.
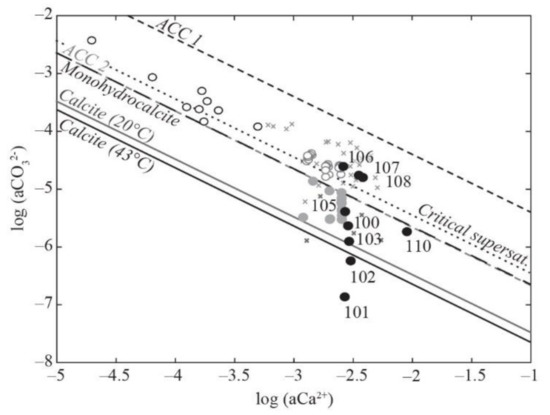
Figure 4.
Solubility diagram in the log[a(CO32−)] — log[a(Ca2+)] space. La Salsa waters are represented by black filled circles. Mexican alkaline lakes (black open circles; [11]) and non-calcifying (grey filled circles) and calcifying (grey open circles) waters from karstwater streams [7], hot-spring vents (dark grey crosses), and downstream calcifying waters (light grey crosses; [4]) are also given for comparison. The solubilities of calcite at 20 °C and 43 °C (temperature range of La Salsa spring) were determined with SUPCRT using the log(Ks) of −8.45 defined by Plummer and Busenberg [52]; the solubilities of amorphous Ca carbonates ACC1 and ACC2 were measured at 25 °C by Brecevic et al. [49] and Kellermeier et al. [50], respectively; the solubility of monohydrocalcite was determined at 25 °C by Fukushi and Matsumiya [51]. The critical supersaturation defined by Arp et al. [53] is also represented by a dotted line.
In the spreading area, the water residence time increases drastically as the flowing surface area increases (Figure 1) and the water depth decreases (to ~5 cm). The pCO2 of the water samples still decreases to reach a value close to the equilibrium the atmospheric pCO2 in PG107 (pCO2 wt/pCO2 atm = 0). In parallel, evaporation (i.e., percentage of water loss) estimated from increasing Cl concentration rises from 5.4% at the end of the channel (PG105) to 89.6% at the last sampling point in the ephemeral ponds (PG110) (Figure 3d). It is consistent with the water δ18O and δD values, which progressively increase and co-vary along a trend line with a slope of 5.2 (R2 = 0.99, n = 7), characteristic of isotopic enrichment of water driven by evaporation (Table 1, Figure S3; [48]). When corrected from the effect of evaporation, evolutions of the major element concentrations are indicative of mineral precipitation or dissolution. Ca′ concentration and alkalinity’ (primes indicate evaporation correction) decrease in the spreading area with a ratio Alk’:Ca′~2 indicating CaCO3 precipitation (Figure 3e, Table S2). The SiO2 concentration also decreases from 116 to 11 mg/L; the Mg concentration, which is stable at 5.1 mM until PG106, decreases slightly to 4.5 mM at the end of the spreading area in PG108; the Li concentration follows the same trend as Mg. The other major elements are relatively stable (Table S2). In the solubility diagram, where the logarithm of a(Ca2+) is plotted against the log of a(CO32−), waters of the spreading area lie on a trend parallel and between the solubility lines of monohydrocalcite and amorphous Ca carbonates (ACC) as defined by Brecevic et al. [49], Kellermeier et al. [50], and Fukushi and Matsumiya [51]. By contrast, water is undersaturated with respect to monohydrocalcite (MHC) in the ephemeral ponds (PG110) (Figure 4). Solutions all along the hydrothermal pathway are undersaturated with evaporite minerals such as gypsum and halite, which precipitate during dry periods only.
5.2. DIC Isotope Mass Balance
Based on carbon stable isotope mass balance, the relative net contributions of CO2 degassing or pumping, photosynthesis or respiration, water transfer, and carbonate precipitation or dissolution to the DIC variations were calculated at each point of the transect (Table 3). In this model, we assume that no other hydrothermal sources from below are adding DIC with a different isotopic composition. However, the good agreement between the DIC isotope mass balance, field observations, and other geochemical measurements shows that, if there are indeed other water sources, they have a negligible effect on the evolution of the DIC isotope mass balance.
From the central pool to the main channel (PG100 to PG105), the contribution of water transfer to the DIC balance is dominant. The model also predicts a high DIC loss by CO2 degassing and a small DIC gain by respiration and carbonate dissolution in the pool. The relative contribution of the photosynthetic activity to the DIC loss progressively increases in that section of the hydrothermal system.
In the spreading area and the ephemeral ponds (PG106 to PG110), the contribution of water transfer to the DIC balance decreases compared with that in the main channel. The model shows a high contribution of carbonate precipitation to the DIC balance together with CO2 degassing and respiration between PG106 and PG107, and with photosynthesis and atmospheric CO2 dissolution between PG107 and PG110. However, between PG107 and PG110, the model was not able to accurately predict the different C contributions to the DIC, as shown by the increasing associated errors (Table S3). At PG108, the model predicts a high contribution of DIC transfer, whereas the water flow is particularly low (based on observation on the field). The proportion of DIC transfer is calculated as the ratio of the [DIC] between two consecutive points. In this case, [DIC]108/[DIC]107 = 1.25 (meaning 125 ± 2% transfer) because the [DIC] obtained in PG107 and PG108 after correction from evaporation are equivalent. This shows that we attained the limit of the calculation, which is highly sensitive to the small variations in DIC concentrations that are within the analytical errors. Moreover, at PG110, by running the model 1000 times by randomly drawing each parameter in their respective error bars, we obtain variable proportions of photosynthesis (+114 ± 10%), atmospheric CO2 pumping (−192 ± 22%), and carbonate precipitation (150 ± 12%). These results are similar to those obtained with the four modes of calculation of the DIC isotope mass balance, suggesting that, despite the high uncertainties, the results are quite robust (Table S4). However, it also shows that the model is unprecise, in this case perhaps due to the simplifications adopted (see methods) or to unidentified sources/sink of Ca and DIC.
5.3. Morphology-Based Assessment of Dominant Cyanobacteria
CLSM imaging was performed on samples fixed with formaldehyde (RNAlater® for PG102) and stained with Syto9® in order to characterize the evolution of the populations of major microorganisms along La Salsa spring: (i) the green microbial mats close to the hydrothermal vent; (ii) the black-colored mineralized microbial mats that developed in the spreading area; (iii) the black pustular mats associated with shrub-shaped calcite; and (iv) the mats associated with pisolites in the ephemeral ponds. Cyanobacteria and diatoms were abundantly detected in all observed microbial mats (Figure 5, Figure 6 and Figure 7). The morphology of cyanobacteria varies along the transect. At least ten morphotypes of filamentous cyanobacteria and three morphotypes of unicellular cyanobacteria were detected (Figure 5). In all these samples, numerous unidentified microorganisms devoid of chlorophyll a and stained with Syto9® were also detected but are not identifiable by microscopy solely.
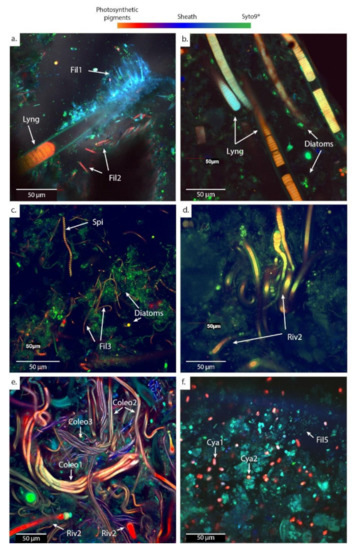
Figure 5.
CLSM images showing the main morphotypes of cyanobacteria observed in microbial mats fixed with formaldehyde (RNAlater® for PG102) and stained with Syto9®. Microbial mats were sampled from (a) calcifying ledges at PG102; (b) mushrooms microbialites at PG105; (c,d) cerebroids at PG106; (e) shrubs at PG107; and (f) pisolites at PG110. After Syto9® staining, microorganisms containing chlorophyll a appear in red while those lacking it appear in green. Abbreviations for the cyanobacterial morphologies: Lyng., Lyngbya; Fil., Filamentous; Spi., Spirulina; Riv., Rivulariaceae; Coleo., Coleofasciculus; Cya., Cyanothece. Numbers are given to differentiate the different species based on the size of the trichomes.

Figure 6.
Images of CLSM (left) and SEM (right) of calcifying ledges at PG102 (a–d) and mushroom-like microbialites at PG105 (e,f), embedded in LR-White resin and stained with DAPI and calcein, showing the mineral distribution in the microbial mat. The green staining marks the presence of Ca and/or Mg in the biofilm. Abbreviations for the cyanobacterial morphologies: Lyng., Lyngbya; Riv., Rivulariaceae.
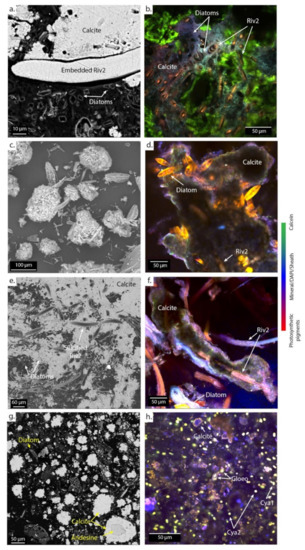
Figure 7.
SEM (left) and CLSM (right) images of microbial mats associated with cerebroids at PG106 (a,b) and the surrounded I (c), shrubs at PG107 (d,e,f), and pisolites at PG110 (g,h) embedded in LR-white resin and stained with DAPI (blue) and calcein (green). The green staining marks the presence of Ca and/or Mg in the biofilm. Abbreviations for the cyanobacterial morphologies: Riv., Rivulariaceae; Cya., Cyanothece; Gloeo., Gloeocapsa. Numbers are given to differentiate the different species based on the size of the trichomes.
The dominant cyanobacteria in the main channel (PG102 and PG105) have a morphology typical of the cyanobacteria belonging to the Lyngbya genus [54], i.e., 20 µm-wide sheathed trichrome with disk-shaped cells. Different types of smaller filamentous cyanobacteria measuring approximately 2 µm in width are also abundant, particularly in PG102. Other sheathed filamentous cyanobacteria (Fil 1) grow around the Lyngbya filaments inducing a dense network of cyanobacteria (Figure 5a). In addition, cyanobacteria belonging to the Rivulariaceae family appear as sheathed trichomes with a pronounced tapering [54] and are abundant in PG102 too. They are organized as pallisadic colonies, all trichomes being oriented in the same direction at the surface of the ledge microbialites with a basal heterocyst (Figure 6c,d). In PG105, cyanobacteria with a morphology similar to the mat-forming euhalobic cyanobacteria of the genus Coleofasciculus [55], i.e., with several trichomes assembled in the same sheath, were increasingly detected (Figure 5e). A sheathed filamentous cyanobacteria measuring about 5 µm in width becomes particularly abundant in PG105.
In the spreading area (PG106 to PG108), representatives of the Lyngbya genus are no longer observed and the cell abundances of Rivulariaceae in addition to Coleofasciculus species increase (Figure 5c–e). In this zone, Rivulariaceae cells are wider than those detected in the channel (less than 5 µm in PG102 and up to 12 µm from PG106 to PG108) as well as longer (about 80 µm in PG102 and more than 140 µm from PG106 to PG108). They likely belong to different species (Figure 5d). Coleofasciculus is particularly abundant in PG107 and PG108 and different species of this genus probably coexist as at least three different sizes of trichomes were detected (Figure 5e). Finally, the dominant cyanobacteria detected in the ephemeral ponds (PG110) at the end of the transect are unicellular with a morphology similar to Cyanothece, i.e., 5 µm-long oval cells with vesicles, known to be able to grow at very high salinities of up to 25% NaCl ([54]; Figure 5f or Figure 7h).
5.4. Mineral–Microorganism Interactions
In each sample, at least two fragments of up to 1 cm each, representative of the mineralized microbial mats, were observed using CLSM and SEM. These combined techniques were applied on the same sample zones at micrometer scale in order to characterize the assemblages of microorganisms and minerals. Calcium carbonate is the only mineral phase identified by SEM and corresponds to the calcite described by Bougeault et al. [27]. High contents of S, As, and Fe were detected by EDX analyses in all samples. Moreover, silica layers interbedded with calcite and silica coating around cyanobacteria were observed in distal samples (PG107 and PG108; Figure S4).
Close to the hydrothermal vent, calcite is systematically found around the Lyngbya morphotypes, as shown in PG102 (Figure 6a,b). These filamentous cyanobacteria as well as diatoms are then encrusted in carbonates, as revealed by relics of cellular pigments detected by CLSM and footprints within the mineral matrix observed with SEM (Figure 6c). Rivulariaceae morphotypes (Riv1) are scattered at the surface of the ledge microbialites in PG102, partly embedded in it (Figure 6c,d). In sample PG105, carbonates are observed in the vicinity of the Lyngbya and Fil1 morphotypes and diatoms (in green in Figure 6e,f).
In the spreading area (PG106), calcite is systematically found around wide Rivulariaceae cyanobacteria (Riv2) and diatoms (Figure 7a–c). Footprints of filamentous cyanobacteria and remnants of diatoms are observed within the mineral matrix. In PG107 and PG108, SEM images show that the Riv2 cyanobacteria are covered by silica and then encrusted in carbonates (Figure 7d–f; Figure S4). Finally, in the ephemeral ponds (PG110), calcite forms aggregates of rhombohedral-to-scalenohedral crystals around detrital grains and diverse microorganisms, as revealed by footprints in the center of calcite precipitates (Figure 7g,h).
6. Discussion
Aqueous geochemistry analyses provide an overview of the physicochemical conditions prevailing in the environment at the time of sampling, i.e., in March 2017 during daytime. By contrast, microbialites form over longer timescales and therefore probably integrate undocumented variations of the water chemistry such as diurnal and seasonal fluctuations. Chemical conditions may also vary locally within microbial mats in ways that cannot be retrieved from the bulk water chemistry data. Yet, along La Salsa spring, the isotopic composition of calcite and organic matter follows the same trend as that of the DIC (Figure 3 and Figure 8). Therefore, we assume here that the main processes that we show here as controlling the DIC isotope mass balance, i.e., calcite precipitation, photosynthesis, and degassing, represent quite faithfully the global functioning of the system, except for ephemeral ponds (PG110). In these ponds, the calcite δ13C value reaches a maximum of 8.11 ± 0.01‰, which is well below the δ13CDIC value of 15.7 ± 0.05‰ measured in March 2017. Water chemistry and carbonate precipitation in these ponds are probably strongly influenced by seasonal variations, as previously suggested by Bougeault et al. [27]. Hereafter, we discuss the three main successive modes of carbonate precipitation that can be distinguished along La Salsa hydrothermal system based on the evolution of the DIC isotope mass balance, the analysis of the solubility diagrams, and microscopy observations of the mineralizations within microbial mats (Figure 8).
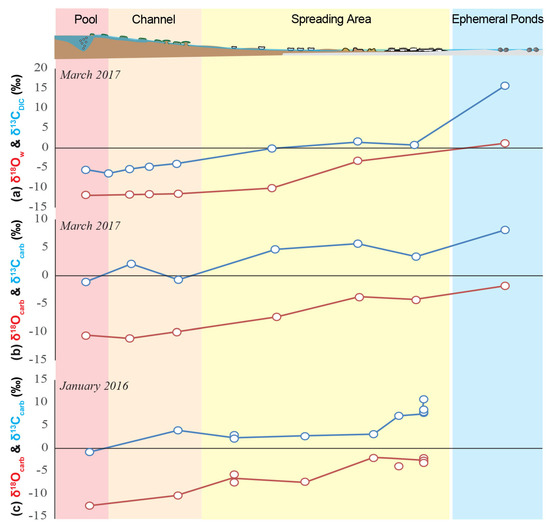
Figure 8.
Downstream evolution of the oxygen and carbon isotope composition of (a) the water, and (b) the carbonates sampled in March 2017 (this study), and (c) the carbonates sampled in January 2016 and previously published by Bougeault et al. [27].
6.1. Calcification of Microbial Mats in Solutions Undersaturated with Calcite
Close to the hydrothermal source of La Salsa in the central pool (from PG100 to PG102), the DIC isotope mass balance indicates high DIC transfer and CO2 degassing and a small contribution of respiration and carbonate dissolution (Figure 3h). Accordingly, Ca concentration and alkalinity increase from the source in PG101 to the border of the pool in PG100 and the entrance of the main channel in PG102. This suggests carbonate dissolution (Figure 3e). Moreover, the water is undersaturated with respect to calcite in most of the main flow (PG101–PG102) and shows local oversaturation, possibly enhanced by water swirling on the edges (PG100; Figure 4).
Although carbonate precipitation is not thermodynamically favorable in waters close to the hydrothermal source (PG101 and PG102), ledge carbonate microbialites form at the air–water interface around the pool and along the channel borders (Figure 1 and Figure 2; [27]). In the microbial mats of PG102, we observed that calcite precipitates in association with Lyngbya morphotypes surrounded by a consortium of smaller Fil1 morphotype filamentous cyanobacteria, diatoms, and other non-identified microorganisms (Figure 6a,b). It suggests that the calcification of these cyanobacteria may be driven by photosynthetic CO2 uptake, leading to a pH rise in the microenvironment of the cells and in turn to significant CaCO3 supersaturation within their sheath, followed by CaCO3 precipitation (e.g., [18,19,20,52,56]). High photosynthetic activity of cyanobacteria and diatoms was previously evidenced in the main channel of La Salsa by water O2 saturation >200% [27]. However, Arp et al. [53] proposed that at high DIC concentration as in PG102, cyanobacterial photosynthesis may not induce local CaCO3 precipitation on cells due to the large buffering of pH by DIC. Bougeault et al. [27] suggested that, in this section of La Salsa, carbonate mineralization occurs from capillary waters of the microbial mats at the microbial mat/air interface where evaporation induces CO2 degassing. Therefore, one explanation for the carbonate precipitation here may be that CO2 degassing enhanced by evaporation lowered the DIC concentration within microbial mats sufficiently for cyanobacteria and diatom photosynthetic activity to induce a significant increase in calcite supersaturation and promote calcite precipitation. In addition, heterogeneous nucleation on the sheath of cyanobacteria and/or associated other microorganisms may also play an important role in localizing calcite precipitation around cells [56]. Besides that, we also observed, located at the surface of the ledge microbialites (PG102), filamentous cyanobacteria Riv1 with a typical morphology of Rivulariaceae (Figure 6c,d). The accumulation of Ca2+ at the base of the Rivulariaceae colonies, as evidenced by calcein staining, reflects intense precipitation and/or dissolution of carbonates at the interface between the base of the Rivulariaceae filaments and the carbonate surface. Some cyanobacteria (euendoliths) are able to dig in the carbonates, in particular to protect themselves from UV radiation (e.g., [57]). However, this has never been described thus far for Rivulariaceae species. In addition, the abiotic dissolution predicted by our model could weaken carbonate ledges and allow these Rivulariacea colonies to bind more easily at the surface of the microbialites. Overall, close to the hydrothermal source, the model, which relies on the evolution of the open-water-body composition, does not account for the carbonate precipitation occurring in microenvironments inside microbial mats, i.e., 5 cm away from the contact between the top of the mat and the water (Figure 2). In the future, higher-resolution water sampling including pore water would allow the model to resolve the effects of locally controlled CO2 degassing, evaporation, and photosynthesis processes on carbonate precipitation.
In the outflow channel (from PG102 to PG106), the model shows that a large proportion of the DIC is transferred into the stream, which is consistent with the high water flow observed on the field. The model also indicates that DIC is progressively consumed by carbonate precipitation, photosynthesis, and degassing. As the contribution of degassing decreases, that of photosynthesis increases (Figure 3). Consistently, δ13CDIC values increase from −6.4‰ to −0.1‰, and the saturation index SIcalcite becomes positive and reaches 1.3 in PG106 (Figure 3 and Figure 4). These results are consistent with the increasing abundance of microbialites (Figure 1 and Figure 2) and the high levels of dissolved oxygen (up to 426%; Figure 3c) previously described by [27] in the main stream. This section of the transect is similar to other springs (e.g., [4,58,59]) and CO2-degassing karstwater creeks (e.g., [7,18,19,20,60]), where calcareous travertine and/or tufa formation is triggered concurrently by CO2 degassing and photosynthesis [18,19,20,61]. However, due to the nucleation barrier, mat calcification generally does not start significantly until a supersaturation of 0.9–1.1 (Figure 4; [60]). In PG103 and PG105, the calcite saturation index is still low (SIcalcite = 0.2 and 0.6), and yet calcite is observed in the vicinity of both Lyngbya morphotypes and diatoms, which are as abundant as in PG102 microbial mats (Figure 6e,f). Therefore, we propose that CO2 degassing enhanced by evaporation, and the high photosynthetic activity of cyanobacteria and diatoms, induce local oversaturations and drive the calcification in microbial mats. As in other systems exhibiting calcifying microbial mats, EPS abundantly produced by cyanobacteria and diatoms may also provide diffusion-limited microenvironments (e.g., [62]).
Overall, these results imply that calcification of the microbial mats can occur in a CO2 degassing solution showing low saturation index below the critical supersaturation of 1 proposed by [53], to the extent that it contributes to the DIC balance. Although degassing appears to be one of the main drivers for carbonate precipitation in this system, our microscopy observations show that cyanobacteria and diatoms, either through their photosynthetic activity or by heterogeneous nucleation on their sheath and EPS, also influence the calcification of the mat.
6.2. Pervasively Calcified Microbial Mats in Calcite Supersaturated Waters
In the spreading area (from PG106 to PG108), the DIC isotope mass balance shows that carbonate precipitation becomes a dominant process influencing DIC evolution (Figure 3). Consistently, the physicochemical conditions are more favorable to carbonate precipitation than in the pool and outflow channel. Indeed, we observe increased concentrations in Ca2+ and CO32− driven by sustained evaporation, leading to an SIcalcite > 1 in PG106 and PG108 (Table 1 and Table 2). The decrease in Ca′ concentration and alkalinity’ (corrected from the evaporation effect) from PG106 to PG108 also illustrates the massive carbonate precipitation (Figure 3e).
Between PG106 and PG107, carbonate precipitation is accompanied by CO2 degassing (Figure 3). This corresponds to the CO2 salting-out effect triggered by evaporation, which promotes carbonate precipitation by increasing (1) the salinity (reducing the CO2 solubility) and (2) the concentration of dissolved CO2 relative to its equilibrium with the atmosphere (and so CO2 degassing) (e.g., [63]). Interestingly, the model also predicts that the respiration activity exceeds that of photosynthesis and contributes to the DIC balance (Figure 3). The surface of this spreading zone is mainly covered by a yellowish mud layer composed of calcite fragments inherited from the carbonate platform [27] and aggregates of calcite and diatoms. This layer overlies a 5 mm-thick stratified microbial mat, itself resting on a thick black horizon with a distinct sulfurous odor (Figure 2). The black sedimentary deposits under the surface are probably enriched in organic matter. Therefore, organic matter remineralization via sulfate reduction is likely to contribute to the input of DIC by respiration calculated by the model between PG106 and PG107.
Surprisingly, although the DIC isotope mass balance is dominantly controlled by carbonate precipitation, Bougeault et al. [27] observed the lowest abundance of microbialites in the PG106 sampling zone. Microbialites consist of scattered cerebroids growing on reworked clasts in association with thin brownish microbial mats, rich in diatoms and cyanobacteria (Figure 2 and Figure 5; [27]). These authors proposed that this low abundance of microbialites could be explained by the lack of hard substrate to settle on, this area being mainly covered by soft mud. Moreover, the yellowish mud which covers this entire area is composed of calcite fragments inherited from the underlying and surrounding carbonate platform [27] and aggregates of micritic calcite and diatoms (Figure 7c). Similar aggregates have been observed in the microbial mats of Laguna Negra, another high-altitude hypersaline Andean lake in Argentina, where the abundant EPSs produced by diatoms were shown to serve as precipitation nuclei for anhedral micritic calcite [17]. Therefore, we propose that the precipitation of micritic calcite aggregates in mud, perhaps via heterogeneous nucleation on the EPSs, may participate in the carbonate precipitation contribution predicted by the model. Detailed analysis of the EPS composition and structure would enable confirmation of their role in the microenvironments and the resulting carbonate precipitation.
From PG107 to PG108, the DIC isotope mass balance shows that photosynthesis and atmospheric CO2 pumping are the dominant processes influencing the evolution of the DIC (Figure 3h). Consistently, this zone presents increasingly thicker waterlogged black pustular mats producing high levels of O2 (O2 saturation of 215% in PG108; Figure 1, Figure 2 and Figure 3; [27]). The same mats were found in Laguna Negra, where similar physicochemical conditions (pH~7, low [SO4], high [Ca], and salinity) with increased carbonate saturation (up to 1.37) are partly driven by sustained evaporation [64]. The black pustular mats of Laguna Negra are mainly composed of cyanobacteria belonging to the Rivularia genus, diatoms, and proteobacteria [65]. In these mats, carbonates nucleate within the EPS located in the vicinity of diatoms. In PG107–PG108, cyanobacteria are first coated by silica and secondarily encrusted by carbonates (Figure 7 and Figure S4). Overall, this suggests that photosynthesis contributes to the DIC balance, maintaining high pH, and so creates favorable conditions at least during the day. However, there is no evidence of cyanobacterial calcification within the microbial mats. Carbonates rather seem to nucleate in the EPSs, similar to PG106 and Laguna Negra. Nonetheless, many other microorganisms were detected by Syto9® staining in the microbial mats and may also contribute to the mineral precipitation (Figure 5e).
In the solubility diagram of Figure 4, waters from PG106 and PG108 are located between the solubility lines of monohydrocalcite (MHC; [51]) and amorphous Ca carbonates (ACC; [49,50]). They plot along a trend parallel to these solubility lines, suggesting that the a(Ca2+)/a(CO32−) ratio in these waters might be controlled by the precipitation of a Ca carbonate phase more soluble than calcite, similarly to what Fukushi and Matsumiya [51] and Zeyen et al. [11] evidenced in alkaline lakes. Interestingly, other calcifying systems such as karstwater creeks and hot springs lie on the same trend, which is also consistent with the critical supersaturation reached by non-marine settings, where calcifying cyanobacterial mats are detected and corresponding to an SIcalcite = 1 (Figure 4; [53] and references therein). Previous studies have shown that anhydrous carbonates such as calcite are unlikely to precipitate directly from a solution in this range of temperature (20–45 °C; [13,66,67]). When the conditions are thermodynamically favorable, as is the case in the spreading area, the most soluble phases, which are kinetically favored, precipitate [68]. Then, following an Ostwald step rule, they transform to less soluble, more thermodynamically stable phases, by dissolution–precipitation or solid transformation. Therefore, as already done in other calcifying systems, we propose that, in the spreading area, the co-evolution of the a(Ca2+) and a(CO32−) of the water indicates the precipitation of ACC through homogeneous and/or heterogenous nucleation. These ACCs then serve as a precursor to the formation of calcite in the microbialites, perhaps via decreasingly soluble intermediates.
6.3. Calcite Precipitation in Hypersaline Saturated Waters
In the ephemeral ponds (PG110), carbonate precipitation and photosynthetic activity still contribute largely to the DIC balance together with atmospheric CO2 pumping, as in PG107–PG108 (Figure 3h). However, our model does not consider the effect of evaporation, which is corrected to distinguish the effects of the other processes, i.e., photosynthesis, carbonate precipitation, and degassing. We are therefore unable to compare the effect of photosynthesis with that of evaporation, which is particularly high in these ponds (salinity = 128 g/L). In microbial mats, the cyanobacterial diversity has changed and is mainly composed of unicellular cyanobacteria (Figure 5). In parallel, the calcite forms aggregates of rhombohedral-to-scalenohedral crystals, sometimes surrounding detrital grains (Figure 7g). As experimentally showed by [69], the difference in calcite texture may reflect different modes of precipitation (Figure 7g). Indeed, the pond water is located below the solubility lines of ACCs, suggesting that the a(Ca2+)/a(CO32−) of water is not controlled by the precipitation of ACC but possibly by the formation of a less-hydrated crystalline carbonate phase (Figure 4). During the formation of crystalline CaCO3 phases from ACC precursors, Ca2+, and CO32− ions are removed from the reactive solution, resulting in a decrease in water saturation state relative to calcite and undersaturation with respect to ACC [70]. Therefore, the a(Ca2+)/a(CO32−) of pond water, which is located between the solubility lines of the monohydrocalcite and calcite, may reflect the transformation of ACC to a more crystalline phase. The precipitation of branching rhombohedric calcite is probably abiotic, as suggested by [69] and promoted in these ponds by the high level of evaporation (up to 89%) and associated CO2 salting-out.
In addition, δ13CDIC values increase from 0.76 ± 0.04‰ in PG108 to 15.69 ± 0.05‰ in PG110. Such positive δ13CDIC values are common in hypersaline lakes and are usually attributed to non-equilibrium gas-transfer kinetic fractionations associated with CO2 degassing during evaporation, with a C-isotope fractionation factor value of up to 19.3‰ (instead of 8.14‰ in the case of isotope equilibrium at 23 °C) [71,72]. However, the DIC isotope mass balance in PG110 modeled with the maximum gas-transfer kinetic fractionation instead of the equilibrium fractionation leads to increased photosynthesis and CO2 pumping (not degassing as expected under high evaporation). In addition, DIC isotope mass balance without photosynthesis (considering only CO2 degassing due to evaporation and carbonate precipitation) predicts high degassing contribution but a lower carbonate precipitation than estimated with [Ca]. This suggests that either evaporation does not drive the observed increase in δ13CDIC, or this model is too simplified to explain the DIC balance in the ephemeral ponds. Non-considered underground water inputs and/or seasonal variations may play a role in their DIC isotope mass balance. Despite that, geochemical data, i.e., dissolved Cl and O2 concentrations, show that both evaporation and photosynthetic activity are high in these ponds. It is therefore reasonable to assume that these two processes contribute to the DIC balance. The effect of photosynthesis on C isotope signatures has already been discussed in other calcifying systems (e.g., [61,73]) but is rarely identified and invoked in the interpretation of carbonate isotope signatures in paleoenvironmental reconstructions. When photosynthesis is responsible for the precipitation of carbonates through the generation of microgradients in microbial mats, as in the proximal part of La Salsa, its effect on carbonates δ13C values is not detectable (see also [19]). The δ13Ccarb is therefore considered to reflect variations in the environment δ13CDIC, as shown by Arp et al. [61] in the case of karstwater streams. However, it is difficult to distinguish the influence of photosynthesis from that of CO2 degassing forced by evaporation, as both produce a 12C-depletion in DIC from which carbonates precipitate. Most of the time, a simultaneous increase in δ18O and δ13C values in carbonates is considered to derive from evaporation [71,72]. In La Salsa, however, the water δ18O linearly increases downstream as a result of evaporation, whereas the δ13CDIC (and δ13Ccarb) increase is initially controlled by magmatic CO2 degassing and then mainly by photosynthesis and evaporation-induced CO2 degassing, as shown by our model (Figure 3 and Figure 8). It is therefore important to mention that photosynthesis not only plays an important role in water chemistry and carbonate precipitation along the stream, but also in water and carbonate isotopic signatures.
7. Conclusions
La Salsa is a 300 m-long hydrothermal system in which physicochemical conditions, saturation with calcite, and microbial communities drastically change downstream, along with the morphology and abundance of calcitic microbialites (Figure 7). This spatially contrasted system, as opposed to more homogeneous ones (e.g., lakes), has provided us with the opportunity to investigate the carbonate precipitation pathways and the requirements for the development of microbialites in a system that spans a wide range of chemical compositions. Combining DIC isotope mass balance modeling with the analysis of solubility diagrams and microscopy imaging of the microorganisms–mineral assemblages within microbial mats, we constrained the effects of key physicochemical (e.g., magmatic CO2 degassing, atmospheric CO2 pumping, water fluxes, evaporation) and biological (e.g., photosynthesis, bacterial respiration) processes on the evolution of the C balance and found that several modes of CaCO3 precipitation dominate in distinct sections of the hydrothermal system (Figure 9).
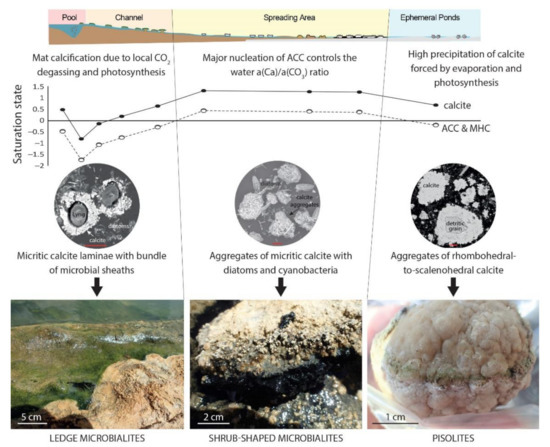
Figure 9.
Constraints on carbonate precipitation along La Salsa hydrothermal system. Microbialites vary in textures and morphologies in relation to a diversity of bio-physico-chemical parameters and processes that depend on the distance to the hydrothermal source and lead to oversaturation with respect to amorphous Ca carbonate (ACC) and hydrated carbonate phases such as monohydrocalcite (MHC).
Close to the hydrothermal vent, although waters are undersaturated with respect to calcite (SIcalcite between –0.8 and 0.6), cyanobacterial calcification is observed within microbial mats and carbonate precipitation starts to contribute to the DIC balance. Development of microbial mats creates microenvironments with physicochemical conditions that evolve independently of the bulk water body due to the effect of local CO2 degassing enhanced by evaporation and photosynthetic activity of cyanobacteria and diatoms. These are likely the main drivers of calcification in this high-DIC system.
In the spreading area, where the physicochemical conditions driven by sustained evaporation are more favorable for calcification of microbial mats (SIcalcite > 1), the precipitation of ACC-type carbonates in mud, probably by heterogeneous nucleation on EPS as suggested in similar calcifying lakes [17], controls the a(Ca2+)/a(CO32−) ratio of the water. ACCs may serve as a precursor to the formation of micritic calcite aggregates, leading to the formation of calcitic cerebroid and shrub microbialites. Interestingly, precipitation of ACCs seems to be widespread in non-marine environments, where calcifying microbial mats are detected, i.e., alkaline lakes, hot springs, and tufa-forming streams (Figure 4). Finally, in the ephemeral ponds where the evaporation extent and the carbonate precipitation are the highest, the a(Ca2+)/a(CO32−) ratio of the water is not controlled by the precipitation of an ACC-type carbonate phase but likely by the formation of a crystalline phase, perhaps monohydrocalcite. In addition, calcite has a different texture, i.e., aggregates of rhombohedral-to-scalenohedral crystals leading to the formation of pisolites, which is consistent with the idea of a different precipitation pathway. Overall, this study thus highlighted that the great diversity of textures and morphologies of the microbialites described at La Salsa is related to a diversity of bio-physico-chemical processes that depend on the distance to the hydrothermal source (Figure 9). This may help to better interpret the origin of such diversity in ancient outcrops.
Supplementary Materials
The following supporting information can be downloaded at: https://www.mdpi.com/article/10.3390/geosciences12020088/s1, Figure S1: Evaporation extent (%) calculated with Na and Cl concentration along La Salsa transect. Figure S2: Results of the four modes of calculation of the DIC isotope mass balance modeling relying on (a) Ca concentration to estimate carbonate precipitation and the measured alkalinity and pH to estimate the DIC (presented in the main text); (b) Ca concentration to estimate carbonate precipitation and the measured DIC; (c) the measured DIC to estimate the carbonate precipitation and the DIC; and (d) the measured alkalinity and pH to estimate the carbonate precipitation and the DIC. In (a) and (d), the values of PG108 are divided by 10. As the alkalinity measurement in PG107 was underestimated perhaps due to carbonate precipitation in the tube, and the model relying on alkalinity measurement (d) gives different results for PG108 than the three other models. Figure S3: Downstream evolution of the δ18O-δD composition of the water. The local meteoric water line (LMWL [74]) and rainwater composition [38] are given for comparison. Figure S4. Backscattered electron (BSE) image and corresponding EDX maps of Ca (dark blue), S (orange), Si (green), Fe (light blue), and As (yellow) of the microbial mat associated with shrubs of PG108 embedded in LR-White resin. Table S1: Internal consistency of pH, alkalinity, and DIC measurements calculated on PHREEQC. Table S2: Alkalinity, DIC, and major element concentrations corrected from the evaporation effect and used for the isotopic mass balance calculations. Table S3: Errors of the DIC isotope mass balance along the hydrological profile of La Salsa obtained using the Monte Carlo method [47]. Each parameter was calculated 1000 times by random drawing within ±1 sigma around the mean value. Table S4: Comparison of the results obtained with the four modes of calculation of the DIC isotope mass balance modeling.
Author Contributions
Conceptualization, E.C.G., A.V., C.D. and E.G.; methodology, E.M., E.C.G. and E.G.; sample acquisition, E.M., E.C.G., C.D., A.V., C.B., M.C. and E.G.; formal analysis, E.M., E.G., G.A., M.A., E.C.G., E.V. and K.B.; investigation, E.M., E.G., M.A. and E.C.G.; resources, E.C.G., A.V., C.D., M.A. and E.G.; data curation, E.M.; writing—original draft preparation, E.M., E.G. and M.A.; writing—review and editing, all authors; visualization, E.M., E.G. and C.B.; supervision, E.G., M.A. and E.C.G.; project administration, E.M., E.C.G., A.V., E.G. and M.A.; funding acquisition, E.C.G., A.V., P.S., E.G. and M.A. All authors have read and agreed to the published version of the manuscript.
Funding
This work was supported by Total EP R&D Carbonate Project (E. Poli), by the IPGP’s multidisciplinary program PARI, and by the Paris–IdF region SESAME Grant no. 12015908. This is IPGP contribution No. 4262.
Institutional Review Board Statement
Not applicable.
Informed Consent Statement
Not applicable.
Data Availability Statement
Data is contained within the article and Supplementary Materials.
Acknowledgments
We would like to than S. Borensztajn (IPGP) for SEM analyses, C. Chaduteau (IPGP) for DIC isotope measurements, V. Rojas (IPGP) for organic carbon analyses, N. Assayag (IPGP) for carbonate analyses, and Total Lab (CSTJF, Pau, France; Carole Bortelle, Josiane Sentenac, Valérie Burg) for water chemistry analysis. Particular thanks go to Total EP Bolivia (M. Chavez, O.D. Moreau, J.P. Meunier, R. Cuellar, and S. Nicoletis) for support in Bolivia.
Conflicts of Interest
The authors declare no conflict of interest.
References
- Burne, R.V.; Moore, L.S. Microbialites; organosedimentary deposits of benthic microbial communities. Palaios 1987, 2, 241–254. [Google Scholar] [CrossRef]
- Grotzinger, J.P.; Knoll, A.H. Stromatolites in Precambrian carbonates: Evolutionary mileposts or environmental dipsticks? Annu. Rev. Earth Planet. Sci. 1999, 27, 313–358. [Google Scholar] [CrossRef] [PubMed]
- Fouke, B.W.; Farmer, J.D.; Des Marais, D.J.; Pratt, L.; Sturchio, N.C.; Burns, P.C.; Discipulo, M.K. Depositional facies and aqueous-solid geochemistry of travertine-depositing hot springs (Angel Terrace, Mammoth Hot Springs, Yellowstone National Park, USA). J. Sed. Res. 2000, 70, 565–585. [Google Scholar] [CrossRef] [PubMed]
- Shiraishi, F.; Hanzawa, Y.; Nakamura, Y.; Eno, Y.; Morikawa, A.; de Mattos, R.F.; Asada, J.; Cury, L.F.; Bahniuk, A.M. Abiotic and biotic processes controlling travertine deposition: Insights from eight hot springs in Japan. Sedimentology 2021, 69, 592–623. [Google Scholar] [CrossRef]
- Della Porta, G.; Hoppert, M.; Hallmann, C.; Schneider, D.; Reitner, J. The influence of microbial mats on travertine precipitation in active hydrothermal systems (Central Italy). Depos. Rec. 2021, 1–45. [Google Scholar] [CrossRef]
- Laval, B.; Cady, S.L.; Pollack, J.C.; McKay, C.P.; Bird, J.S.; Grotzinger, J.P.; Ford, D.C.; Bohm, H.R. Modern freshwater microbialite analogues for ancient dendritic reef structures. Nature 2000, 407, 626–629. [Google Scholar] [CrossRef] [PubMed]
- Arp, G.; Wedemeyer, N.; Reitner, J. Fluvival tufa formation in a hard-water creek (Deinschwanger Bach, Franconian Alb, Germany). Facies 2001, 44, 1–22. [Google Scholar] [CrossRef]
- Roche, A.; Vennin, E.; Bundeleva, I.; Bouton, A.; Payandi-Rolland, D.; Amiotte-Suchet, P.; Gaucher, E.C.; Courvoisier, H.; Visscher, P.T. The role of the substrate on the mineralization potential of microbial mats in a modern freshwater River (Paris Basin, France). Minerals 2019, 9, 359. [Google Scholar] [CrossRef] [Green Version]
- Arp, G.; Helms, G.; Karlinska, K.; Schumann, G.; Reimer, A.; Reitner, J.; Trichet, J. Photosynthesis versus exopolymer degradation in the formation of microbialites on the atoll of Kiritimati, Republic of Kiribati, Central Pacific. Geomicrobiol. J. 2012, 29, 29–65. [Google Scholar] [CrossRef]
- Pace, A.; Bourillot, R.; Bouton, A.; Vennin, E.; Galaup, S.; Bundeleva, I.; Patrier, P.; Dupraz, C.; Thomazo, C.; Sansjofre, P.; et al. Microbial and diagenetic steps leading to the mineralisation of Great Salt Lake microbialites. Sci. Rep. 2016, 6, 31495. [Google Scholar] [CrossRef] [Green Version]
- Zeyen, N.; Benzerara, K.; Beyssac, O.; Daval, D.; Muller, E.; Thomazo, C.; Tavera, R.; López-García, P.; Moreira, D.; Duprat, E. Integrative analysis of the mineralogical and chemical composition of modern microbialites from ten Mexican lakes: What do we learn about their formation? GCA 2021, 305, 148–184. [Google Scholar] [CrossRef]
- Harris, P.M.M.; Ellis, J.; Purkis, S.J. Assessing the extent of carbonate deposition in early rift settings Carbonate Deposition in Early Rift Settings. AAPG Bull. 2013, 97, 27–60. [Google Scholar] [CrossRef]
- Chagas, A.A.P.; Webb, G.E.; Burne, R.V.; Southam, G. Modern lacustrine microbialites: Towards a synthesis of aqueous and carbonate geochemistry and mineralogy. Earth-Sci. Rev. 2016, 162, 338–363. [Google Scholar] [CrossRef]
- Falkowski, P.G.; Fenchel, T.; Delong, E.F. The microbial engines that drive Earth’s biogeochemical cycles. Science 2008, 320, 1034–1039. [Google Scholar] [CrossRef] [Green Version]
- Dupraz, C.; Visscher, P.T. Microbial lithification in marine stromatolites and hypersaline mats. Trends Microbiol. 2005, 13, 429–438. [Google Scholar] [CrossRef] [PubMed] [Green Version]
- Gérard, E.; Ménez, B.; Couradeau, E.; Moreira, D.; Benzerara, K.; Tavera, R.; López-García, P. Specific carbonate–microbe interactions in the modern microbialites of Lake Alchichica (Mexico). ISME J. 2013, 7, 1997. [Google Scholar] [CrossRef] [PubMed] [Green Version]
- Gomez, F.J.; Mlewski, C.; Boidi, F.J.; Farías, M.E.; Gérard, E. Calcium carbonate precipitation in diatom-rich microbial mats: The Laguna Negra hypersaline lake, Catamarca, Argentina. J. Sediment. Res. 2018, 88, 727–742. [Google Scholar] [CrossRef]
- Shiraishi, F.; Bissett, A.; de Beer, D.; Reimer, A.; Arp, G. Photosynthesis, respiration and exopolymer calcium-binding in biofilm calcification (Westerhöfer and Deinschwanger Creek, Germany). Geomicrobiol. J. 2008, 25, 83–94. [Google Scholar] [CrossRef]
- Shiraishi, F.; Reimer, A.; Bissett, A.; de Beer, D.; Arp, G. Microbial effects on biofilm calcification, ambient water chemistry and stable isotope records in a highly supersaturated setting (Westerhöfer Bach, Germany). Palaeogeogr. Palaeoclimatol. Palaeoecol. 2008, 262, 91–106. [Google Scholar] [CrossRef]
- Bissett, A.; Reimer, A.; de Beer, D.; Shiraishi, F.; Arp, G. Metabolic microenvironmental control by photosynthetic biofilms under changing macroenvironmental temperature and pH conditions. Appl. Environ. Microbiol. 2008, 74, 6306–6312. [Google Scholar] [CrossRef] [Green Version]
- Dupraz, C.; Reid, R.P.; Braissant, O.; Decho, A.W.; Norman, R.S.; Visscher, P.T. Processes of carbonate precipitation in modern microbial mats. Earth-Sci. Rev. 2009, 96, 141–162. [Google Scholar] [CrossRef]
- Couradeau, E.; Benzerara, K.; Gérard, E.; Moreira, D.; Bernard, S.; Brown, G.E.; López-García, P. An early-branching microbialite cyanobacterium forms intracellular carbonates. Science 2012, 336, 459–462. [Google Scholar] [CrossRef] [Green Version]
- Gérard, E.; De Goeyse, S.; Hugoni, M.; Agogué, H.; Richard, L.; Milesi, V.; Guyot, F.; Lecourt, L.; Borensztajn, S.; Joseph, M.-B.; et al. Key role of alphaproteobacteria and cyanobacteria in the formation of stromatolites of Lake Dziani Dzaha (Mayotte, Western Indian Ocean). Front. Microbiol. 2018, 9, 796. [Google Scholar] [CrossRef] [Green Version]
- Decho, A.W. Microbial exopolymer secretions in ocean environments: Their role(s) in food webs and marine processes. Oceanogr. Mar. Biol. Annu. Rev. 1990, 28, 73–153. [Google Scholar]
- Benzerara, K.; Menguy, N.; López-García, P.; Yoon, T.H.; Kazmierczak, J.; Tyliszczak, T.; Guyot, F.; Brown, G.E., Jr. Nanoscale detection of organic signatures in carbonate microbialites. Proc. Natl. Acad. Sci. USA 2006, 103, 9440–9445. [Google Scholar] [CrossRef] [PubMed] [Green Version]
- Braissant, O.; Decho, A.W.; Przekop, K.M.; Gallagher, K.L.; Glunk, C.; Dupraz, C.; Visscher, P.T. Characteristics and turnover of exopolymeric substances in a hypersaline microbial mat. FEMS Microbiol. Ecol. 2009, 67, 293–307. [Google Scholar] [CrossRef] [PubMed] [Green Version]
- Bougeault, C.; Vennin, E.; Durlet, C.; Muller, E.; Mercuzot, M.; Chavez, M.; Gérard, E.; Ader, M.; Virgone, A.; Gaucher, E.C. Biotic–Abiotic Influences on Modern Ca–Si-Rich Hydrothermal Spring Mounds of the Pastos Grandes Volcanic Caldera (Bolivia). Minerals 2019, 9, 380. [Google Scholar] [CrossRef] [Green Version]
- Bougeault, C.; Durlet, C.; Vennin, E.; Muller, E.; Ader, M.; Ghaleb, B.; Gérard, E.; Virgone, A.; Gaucher, E.C. Variability of Carbonate Isotope Signatures in a Hydrothermally Influenced System: Insights from the Pastos Grandes Caldera (Bolivia). Minerals 2020, 10, 989. [Google Scholar] [CrossRef]
- Risacher, F.; Eugster, H.P. Holocene pisoliths and encrustations associated with spring-fed surface pools, Pastos Grandes, Bolivia. Sedimentology 1979, 26, 253–270. [Google Scholar] [CrossRef]
- Salisbury, M.J.; Jicha, B.R.; de Silva, S.L.; Singer, B.S.; Jiménez, N.C.; Ort, M.H. 40Ar/39Ar chronostratigraphy of Altiplano-Puna volcanic complex ignimbrites reveals the development of a major magmatic province. Bulletin 2011, 123, 821–840. [Google Scholar] [CrossRef]
- De Silva, S.L.; Francis, P.W. Volcanoes of the Central Andes; Springer: Berlin, Germany, 1991. [Google Scholar]
- Peel, M.C.; Finlayson, B.L.; McMahon, T.A. Updated world map of the Köppen-Geiger climate classification. Hydrol. Earth Syst. Sci. 2007, 4, 439–473. [Google Scholar] [CrossRef] [Green Version]
- Risacher, F.; Fritz, B. Geochemistry of Bolivian salars, Lipez, southern Altiplano: Origin of solutes and brine evolution. Geochim. Cosmochim. Acta 1991, 55, 687–705. [Google Scholar] [CrossRef]
- Jones, B.; Renaut, R.W. Crystal fabrics and microbiota in large pisoliths from Laguna Pastos Grandes, Bolivia. Sedimentology 1994, 41, 1171–1202. [Google Scholar] [CrossRef]
- Kasemann, S.A.; Meixner, A.; Erzinger, J.; Viramonte, J.G.; Alonso, R.N.; Franz, G. Boron isotope composition of geothermal fluids and borate minerals from salar deposits (central Andes/NW Argentina). J. S. Am. Earth Sci. 2004, 16, 685–697. [Google Scholar] [CrossRef]
- Ahlfeld, F. Sodaseen in Lipez (Bolivien). Neues Jb. Miner. Mh. 1956, 6, 128–136. [Google Scholar]
- Ballivian, O.; Risacher, F. Los Salares del Altiplano Boliviano: Métodos de Estudio y Estimación Económica; ORSTOM: Paris, France, 1981; 246p. [Google Scholar]
- Muller, E.; Gaucher, E.C.; Durlet, C.; Moquet, J.; Moreira, M.; Rouchon, V.; Louvat, P.; Bardoux, G.; Noirez, S.; Bougeault, C.; et al. The Origin of Continental Carbonates in Andean Salars: A Multi-Tracer Geochemical Approach in Laguna Pastos Grandes (Bolivia). Geochim. Cosmochim. Acta 2020, 279, 220–237. [Google Scholar] [CrossRef] [Green Version]
- Assayag, N.; Jézéquel, D.; Ader, M.; Viollier, E.; Michard, G.; Prévot, F.; Agrinier, P. Hydrological budget, carbon sources and biogeochemical processes in Lac Pavin (France): Constraints from δ18O of water and δ13C of dissolved inorganic carbon. Appl. Geochem. 2008, 23, 2800–2816. [Google Scholar] [CrossRef]
- Assayag, N.; Rivé, K.; Ader, M.; Jézéquel, D.; Agrinier, P. Improved method for isotopic and quantitative analysis of dissolved inorganic carbon in natural water samples. Rapid Commun. Mass Spectrom. 2006, 20, 2243–2251. [Google Scholar] [CrossRef]
- Lebeau, O.; Busigny, V.; Chaduteau, C.; Ader, M. Organic matter removal for the analysis of carbon and oxygen isotope compositions of siderite. Chem. Geol. 2014, 372, 54–61. [Google Scholar] [CrossRef]
- Parkhurst, D.L.; Appelo, C.A.J. Description of input and examples for PHREEQC version 3–a computer program for speciation, batch-reaction, one-dimensional transport, and inverse geochemical calculations. US Geol. Surv. Tech. Methods 2013, 6, 497. [Google Scholar]
- Blanc, P.; Lassin, A.; Piantone, P.; Azaroual, M.; Jacquemet, N.; Fabbri, A.; Gaucher, E.C. Thermoddem: A geochemical database focused on low temperature water/rock interactions and waste materials. Appl. Geochem. 2012, 27, 2107–2116. [Google Scholar] [CrossRef]
- Blair, N.E.A.L.; Leu, A.; Olsen, J.; Kwong, E.; Des Marais, D. Carbon isotopic fractionation in heterotrophic microbial metabolism. Appl. Environ. Microbiol. 1985, 50, 996–1001. [Google Scholar] [CrossRef] [Green Version]
- Mook, W.G. 13C in atmospheric CO2. Neth. J. Sea Res. 1986, 20, 211–223. [Google Scholar] [CrossRef]
- Zeebe, R.E.; Wolf-Gladrow, D. CO2 in Seawater: Equilibrium, Kinetics, Isotopes; Halpern, D., Ed.; Elsevier Oceanography Series No. 65; Elsevier: Amsterdam, The Netherlands, 2001. [Google Scholar]
- Anderson, G.M. Error propagation by the Monte Carlo method in geochemical calculations. Geochim. Cosmochim. Acta 1976, 40, 1533–1538. [Google Scholar] [CrossRef]
- Beeler, S.R.; Gomez, F.J.; Bradley, A.S. Controls of extreme isotopic enrichment in modern microbialites and associated abiogenic carbonates. Geochim. Cosmochim. Acta 2020, 269, 136–149. [Google Scholar] [CrossRef]
- Brecevic, L.; Nielsen, A.E. Solubility of amorphous calcium carbonate. J. Cryst. Growth 1989, 98, 504–510. [Google Scholar] [CrossRef]
- Kellermeier, M.; Picker, A.; Kempter, A.; Cölfen, H.; Gebauer, D. A straightforward treatment of activity in aqueous CaCO3 solutions and the consequences for nucleation theory. J. Adv. Mater. 2014, 26, 752–757. [Google Scholar] [CrossRef] [PubMed]
- Fukushi, K.; Matsumiya, H. Control of Water Chemistry in Alkaline Lakes: Solubility of Monohydrocalcite and Amorphous Magnesium Carbonate in CaCl2–MgCl2–Na2CO3 Solutions. ACS Earth Space Chem. 2018, 2, 735–744. [Google Scholar] [CrossRef]
- Plummer, L.N.; Busenberg, E. The solubilities of calcite, aragonite and vaterite in CO2-H2O solutions between 0 and 90 °C, and an evaluation of the aqueous model for the system CaCO3-CO2-H2O. Geochim. Cosmochim. Acta 1982, 46, 1011–1040. [Google Scholar] [CrossRef]
- Arp, G.; Reimer, A.; Reitner, J. Photosynthesis-induced biofilm calcification and calcium concentrations in Phanerozoic oceans. Science 2001, 292, 1701–1704. [Google Scholar] [CrossRef] [Green Version]
- Castenholz, R.W.; Wilmotte, A.; Herdman, M.; Rippka, R.; Waterbury, J.B.; Iteman, I.; Hoffmann, L. Phylum BX. cyanobacteria. In Bergey’s Manual® of Systematic Bacteriology; Springer: New York, NY, USA, 2001; pp. 473–599. [Google Scholar]
- Siegesmund, M.A.; Johansen, J.R.; Karsten, U.; Friedl, T. Coleofasciculus gen. nov. (Cyanobacteria): Morphological and Molecular Criteria for Revision of the Genus Microcoleus Gomont1. J. Phycol. 2008, 44, 1572–1585. [Google Scholar] [CrossRef] [PubMed]
- Giuffre, A.J.; Hamm, L.M.; Han, N.; De Yoreo, J.J.; Dove, P.M. Polysaccharide chemistry regulates kinetics of calcite nucleation through competition of interfacial energies. Proc. Natl. Acad. Sci. USA 2013, 110, 9261–9266. [Google Scholar] [CrossRef] [PubMed] [Green Version]
- Schneider, J.; Le Campion-Alsumard, T. Construction and destruction of carbonates by marine and freshwater cyanobacteria. Eur. J. Phycol. 1999, 34, 417–426. [Google Scholar] [CrossRef]
- Golubić, S. The relationship between blue-green algae and carbonate deposits. In The Biology of Blue-Green Algae; Carr, N.G., Whitton, B.A., Eds.; University of California Press: Oakland, CA, USA, 1973; Volume 9, pp. 434–472. [Google Scholar]
- Fouke, B.W. Hot-spring Systems Geobiology: Abiotic and biotic influences on travertine formation at Mammoth Hot Springs, Yellowstone National Park, USA. Sedimentology 2011, 58, 170–219. [Google Scholar] [CrossRef]
- Arp, G.; Bissett, A.; Brinkmann, N.; Cousin, S.; De Beer, D.; Friedl, T.; Mohr, K.I.; Neu, T.R.; Reimer, A.; Shiraishi, F.; et al. Tufa-forming biofilms of German karstwater streams: Microorganisms, exopolymers, hydrochemistry and calcification. Geol. Soc. London Spec. Publ. 2010, 336, 83–118. [Google Scholar] [CrossRef]
- Arp, G.; Hofmann, J.; Reitner, J. Microbial fabric formation in spring mounds (“microbialites”) of alkaline salt lakes in the Badain Jaran sand sea, PR China. Palaios 1998, 13, 581–592. [Google Scholar] [CrossRef] [Green Version]
- Obst, M.; Dynes, J.J.; Lawrence, J.R.; Swerhone, G.D.W.; Benzerara, K.; Karunakaran, C.; Kaznatcheeva, K.; Tyliszczak, T.; Hitchcock, A.P. Precipitation of amorphous CaCO3 (aragonite-like) by cyanobacteria: A STXM study of the influence of EPS on the nucleation process. Geochim. Cosmochim. Acta 2009, 73, 4180–4198. [Google Scholar] [CrossRef]
- Messabeb, H.; Contamine, F.; Cézac, P.; Serin, J.P.; Pouget, C.; Gaucher, E.C. Experimental Measurement of CO2 Solubility in Aqueous CaCl2 Solution at Temperature from 323.15 to 423.15 K and Pressure up to 20 MPa Using the Conductometric Titration. J. Chem. Eng. Data 2017, 62, 4228–4234. [Google Scholar] [CrossRef]
- Gomez, F.J.; Kah, L.C.; Bartley, J.K.; Astini, R.A. Microbialites in a high-altitude Andean lake: Multiple controls on carbonate precipitation and lamina accretion. Palaios 2014, 29, 233–249. [Google Scholar] [CrossRef]
- Mlewski, E.C.; Pisapia, C.; Gomez, F.; Lecourt, L.; Soto Rueda, E.; Benzerara, K.; Menez, B.; Borensztajn, S.; Jamme, F.; Réfrégiers, M.; et al. Characterization of pustular mats and related rivularia-rich laminations in oncoids from the Laguna Negra lake (Argentina). Front. Microbiol. 2018, 9, 996. [Google Scholar] [CrossRef] [PubMed]
- Rodriguez-Blanco, J.D.; Shaw, S.; Bots, P.; Roncal-Herrero, T.; Benning, L.G. The role of Mg in the crystallization of monohydrocalcite. Geochim. Cosmochim. Acta 2014, 127, 204–220. [Google Scholar] [CrossRef]
- Blue, C.R.; Giuffre, A.; Mergelsberg, S.; Han, N.; De Yoreo, J.J.; Dove, P.M. Chemical and physical controls on the transformation of amorphous calcium carbonate into crystalline CaCO3 polymorphs. Geochim. Cosmochim. Acta 2017, 196, 179–196. [Google Scholar] [CrossRef] [Green Version]
- Mergelsberg, S.T.; De Yoreo, J.J.; Miller, Q.R.S.; Marc Michel, F.; Ulrich, R.N.; Dove, P.M. Metastable solubility and local structure of amorphous calcium carbonate (ACC). Geochim. Cosmochim. Acta 2020, 289, 196–206. [Google Scholar] [CrossRef]
- Mercedes-Martín, R.; Rogerson, M.; Prior, T.J.; Brasier, A.T.; Reijmer, J.J.; Billing, I.; Matthews, A.; Love, T.; Lepley, S.; Pedley, M. Towards a morphology diagram for terrestrial carbonates: Evaluating the impact of carbonate supersaturation and alginic acid in calcite precipitate morphology. Geochim. Cosmochim. Acta 2021, 306, 340–361. [Google Scholar] [CrossRef]
- Purgstaller, B.; Mavromatis, V.; Immenhauser, A.; Dietzel, M. Transformation of Mg-bearing amorphous calcium carbonate to Mg-calcite–In situ monitoring. Geochim. Cosmochim. Acta 2016, 174, 180–195. [Google Scholar] [CrossRef]
- Buongiorno, J.; Gomez, F.J.; Fike, D.A.; Kah, L.C. Mineralized microbialites as archives of environmental evolution, Laguna Negra, Catamarca Province, Argentina. Geobiology 2019, 17, 199–222. [Google Scholar] [CrossRef] [PubMed]
- Valero-Garcés, B.L.; Delgado-Huertas, A.; Ratto, N.; Navas, A. Large 13C enrichment in primary carbonates from Andean Altiplano lakes, northwest Argentina. Earth Planet. Sci. Lett. 1999, 171, 253–266. [Google Scholar] [CrossRef] [Green Version]
- Pentecost, A.; Spiro, B. Stable carbon and oxygen isotope composition of calcites associated with modern freshwater cyanobacteria and algae. Geomicrobiol. J. 1990, 8, 17–26. [Google Scholar] [CrossRef]
- Chaffaut, I.; Coudrain-Ribstein, A.; Michelot, J.L.; Pouyaud, B. Précipitations d’altitude du Nord-Chili, origine des sources de vapeur et données isotopiques. Bull. Inst. Fr. Etudes Andin. 1998, 27, 367–384. (In French) [Google Scholar]


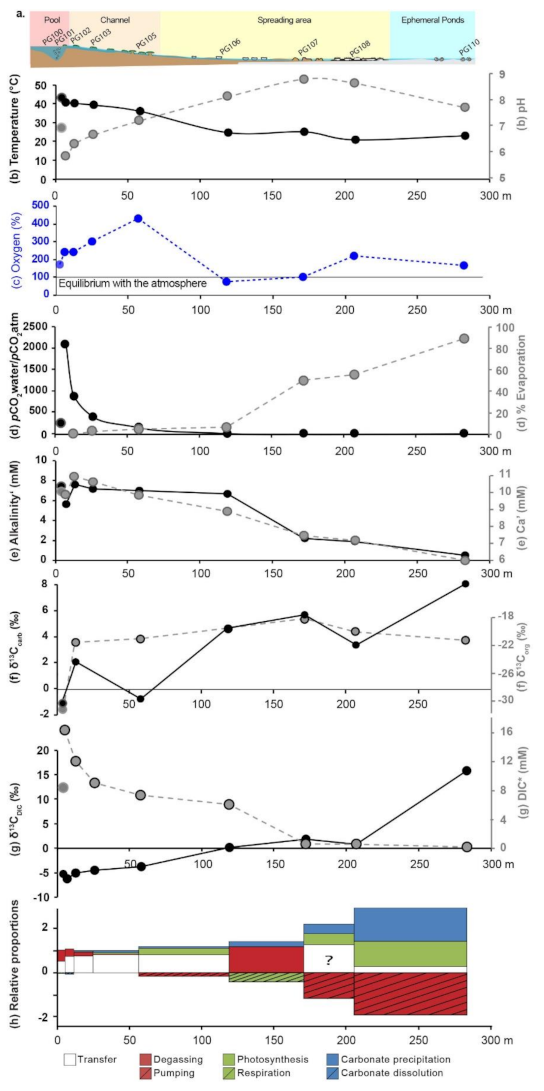
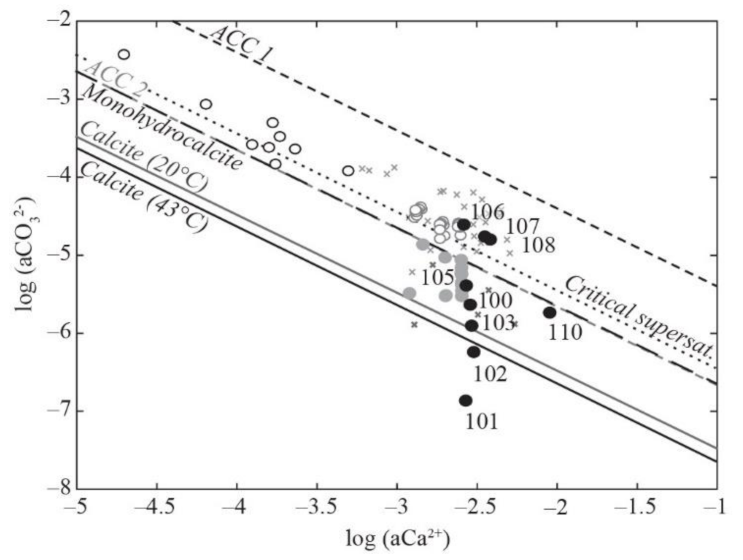
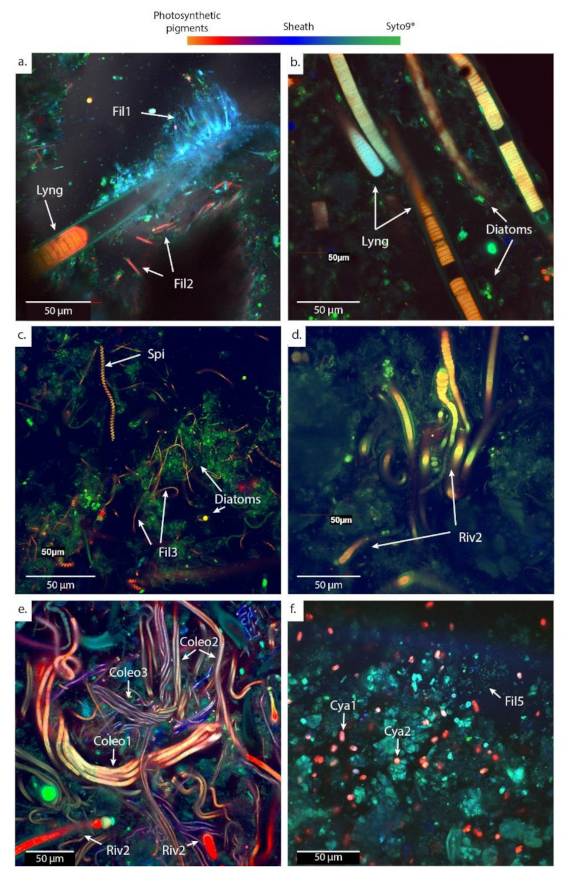
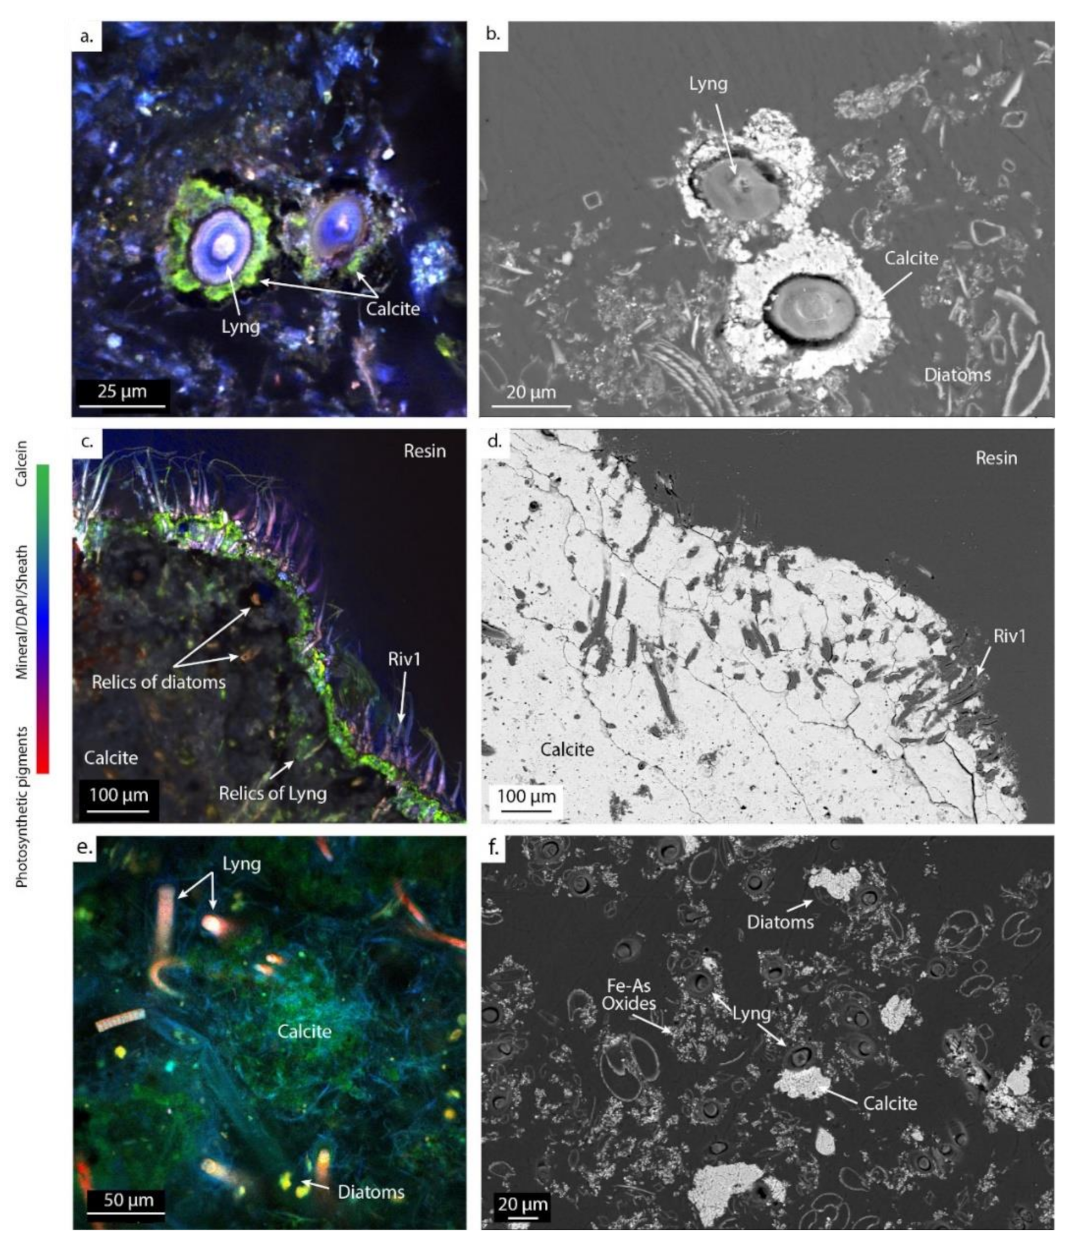

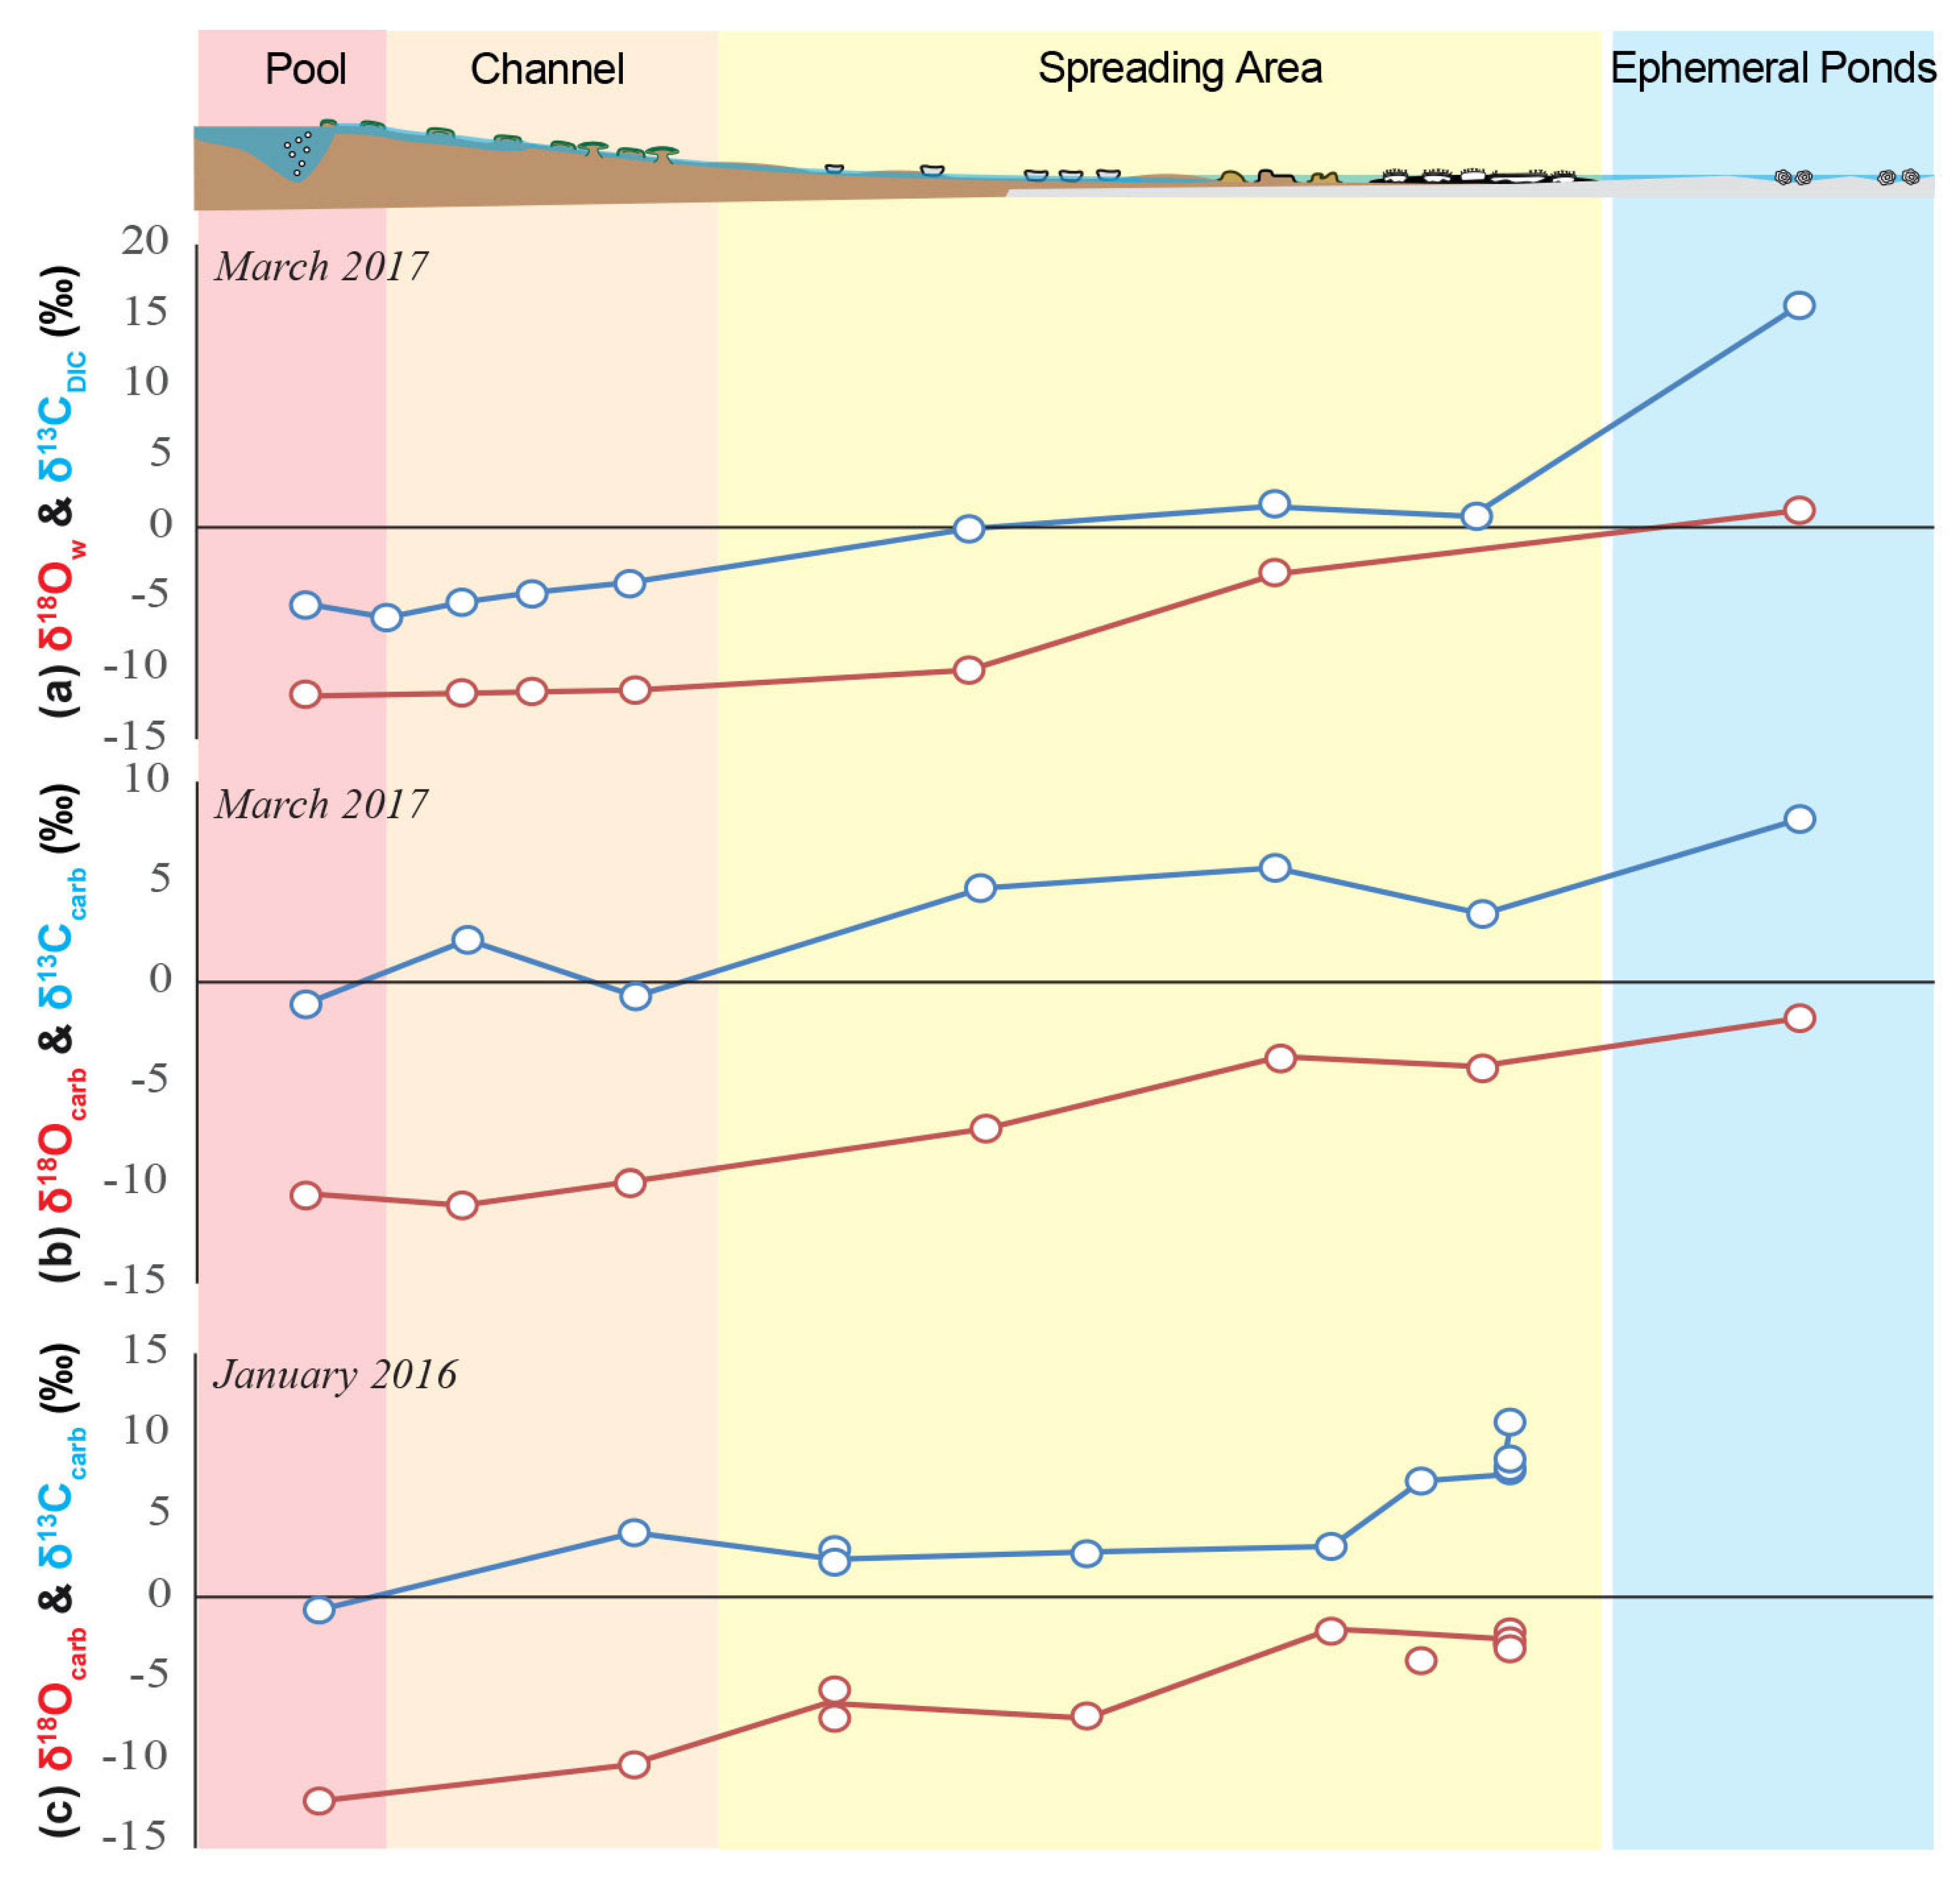
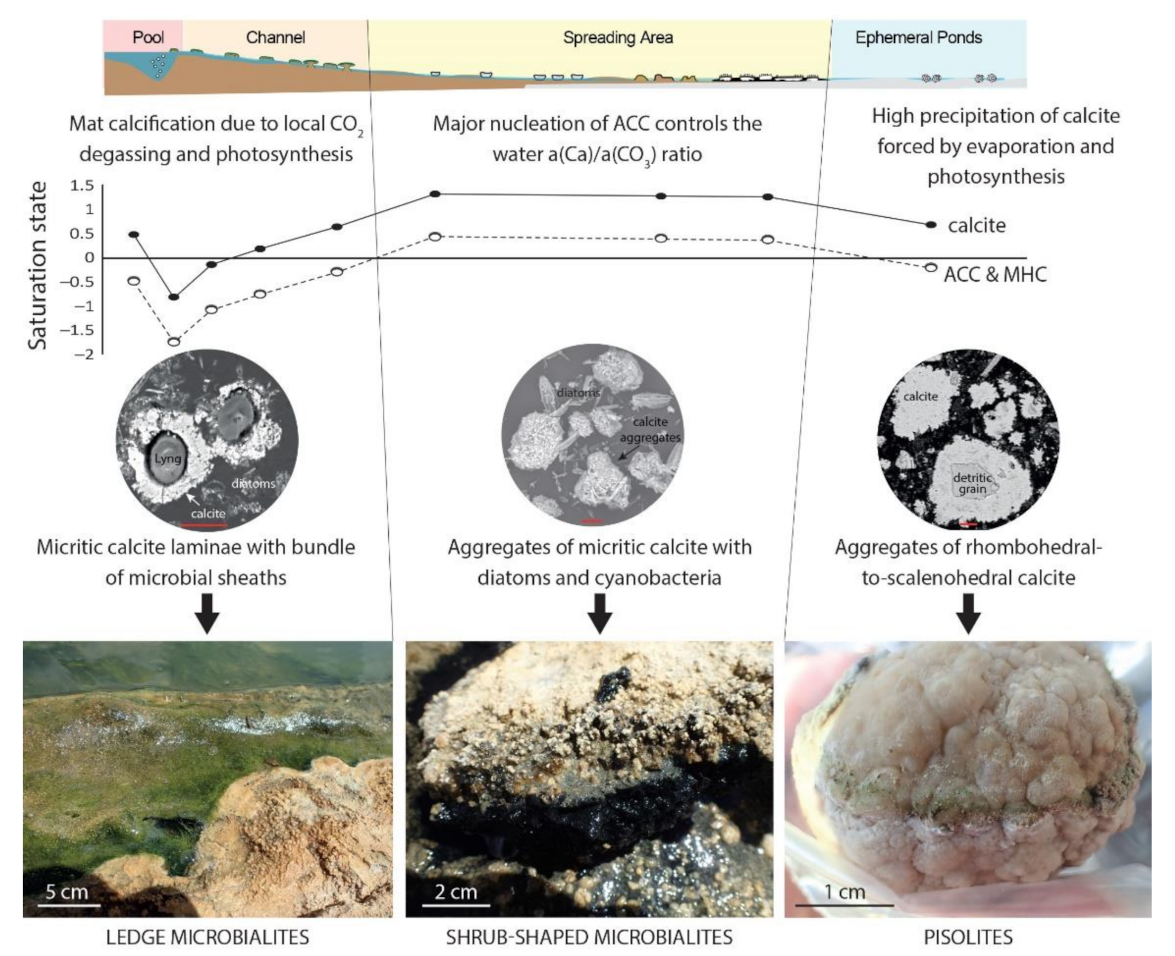
Publisher’s Note: MDPI stays neutral with regard to jurisdictional claims in published maps and institutional affiliations. |
© 2022 by the authors. Licensee MDPI, Basel, Switzerland. This article is an open access article distributed under the terms and conditions of the Creative Commons Attribution (CC BY) license (https://creativecommons.org/licenses/by/4.0/).