Article

Stereolithography 3D Printer for Micromodel Fabrications with Comprehensive Accuracy Evaluation by Using Microtomography

1
Department of Mechanical Engineering, Tokyo Institute of Technology, Tokyo 152-8550, Japan
2
Mechanical Engineering, Institut Teknologi Nasional Bandung, Bandung 40124, Indonesia
3
Mechanical and Industrial Engineering Department, Universitas Gadjah Mada, Jalan Grafika No.2, Yogyakarta 55281, Indonesia
*
Author to whom correspondence should be addressed.
Geosciences 2022, 12(5), 183; https://doi.org/10.3390/geosciences12050183
Submission received: 15 March 2022 / Revised: 12 April 2022 / Accepted: 21 April 2022 / Published: 24 April 2022
(This article belongs to the Special Issue Digital Rock Analysis)

Abstract

:
Micromodels are important for studying various pore-scale phenomena in hydrogeology. However, the fabrication of a custom micromodel involves complicated steps with cost-prohibitive equipment. The direct fabrication of micromodels with a 3D printer can accelerate the fabrication steps and reduce the cost. A stereolithography (SLA) 3D printer is one of the best options because it has sufficient printing performance for micromodel fabrication and is relatively inexpensive. However, it is not without drawbacks. In this report, we explored the capability of an SLA 3D printer for micromodel fabrication. Various parameters affecting the printing results, such as the effects of geometries, dimensions, printing axis configurations, printing thickness resolutions, and pattern thicknesses were investigated using microtomography for the first time. Eventually, the most optimal printing configuration was then also discussed. In the end, a complete micromodel was printed, assembled, and used for fluid displacement experiments. As a demonstration, viscous and capillary fingerings were successfully performed using this micromodel design.

1. Introduction

Studies of multiphase flow in porous media are important in various hydrogeology applications, such as petroleum production [1,2,3], groundwater contamination [4,5,6,7,8,9], geological carbon sequestration [10,11,12,13], and geological energy storage [14,15]. Various phenomena, such as fluid displacement [16,17,18,19,20], dispersion [21], capillary trapping [8,22,23], dissolution [4,5,6,7,12,13,24], and precipitation [25], affect various processes in these applications. Therefore, a further understanding of these phenomena can improve productivity and sustainability in managing the related applications.
To elucidate the underlying mechanisms of these phenomena, pore-scale studies are usually required because they offer detailed observation of the mechanisms. Moreover, by understanding the pore-scale processes, upscaling to core-scale and field-scale can be explained from the pore-scale studies [26,27,28]. Thus, with the recent development in measurement technologies, pore-scale studies have become the staple research investigation in the field of multiphase flow in porous media.
To perform pore-scale experimental studies, in general, two kinds of approaches, which are microtomography and micromodeling, are possible. The first approach is performed using microtomography, such as X-ray microcomputed tomography (micro-CT) [1,4,10,16,23,24] and magnetic resonance imaging [6,7,8]. However, although it offers the possibility to study 3D porous media systems, the temporal resolution is still limited, and the equipment is rather expensive. The second approach is performed by using a micromodel [3,4,9,12,13,15,17]. By fabricating micromodels resembling porous media, various multiphase flow experimental simulations can be performed for studying various phenomena. Although this method is limited to a 2D porous media system, it offers high temporal resolutions due to direct observation with a digital camera. As a result, swift-occurring phenomena, such as a snap-off [29] and a Hainess jump [30], can be observed directly. However, the main drawback of this method lies in the complexity of the fabrication method because it involves complicated and time-consuming processes. In addition, because the uses of micromodels are dominated by application in chemistry, biochemistry, nanotechnology, and biotechnology [31,32,33], most of the available micromodel designs provided by fabricating companies are for these applications. Ordering for a custom model leads to an expensive research budget.
The common fabrication method of a micromodel is by using a combination of photolithography, soft lithography, and plasma treatment [31]. In short, photolithography is used to generate the mold or template of the micromodel inside a cleanroom facility. The mold is then used as the pattern for micromodel fabrication by using polydimethylsiloxane through soft lithography. Finally, the formed micromodel pattern is bonded to a glass plate through plasma treatment. In particular, this process is time-consuming, has poor repeatability, and cannot be automated [32,33]. As a result, changing the micromodel design is not a simple task. Moreover, because it requires expensive and complicated facilities, such as a cleanroom and a plasma generator, not all researchers have access to this fabrication method.
Several attempts have been made to reduce the complexity and cost of micromodel fabrication. To reduce the required resources for photolithography and eliminate the photolithography mask, Behm et al. [30,34] and Love et al. [35] developed a microscope projection technique. However, a cleanroom, which is one of the most complicated and cost-prohibitive facilities, was still required for coating and development procedures. Comina et al. [36,37], on the other hand, developed a method to make the mold or template by using a 3D printer instead of photolithography, removing the necessity of a cleanroom.
Given the current progress of 3D printer technology, this interest in the direct fabrication of micromodels with a 3D printer is now rising [32,33]. 3D printing is highly automated, which means it does not need an operator, removing training time and operating time. Therefore, it is suitable for prototyping various designs in various engineering fields, such as mechanical tools [38], mechanical components [39], and bioengineering [40], including micromodels [41,42,43,44,45,46]. This idea of incorporating 3D printers in micromodel fabrication has captured the attention of other researchers in hydrogeology. One of the advantages of micromodel fabrication in the field of hydrogeology is that the channel dimension does not need to be as small as in chemistry, biochemistry, nanotechnology, and biotechnology, resulting in a larger tolerance for the fabrication. Beauchamp et al. [32] categorized micromodels based on minimum channel dimension: millifluidic (>1000 μm), sub-millifluidic (500–1000 μm), large microfluidic (100–500 μm), and true microfluidics (<100 μm). Most of the reported works of micromodel fabrication in the field of hydrogeology [41,42,43,44,45,46] are in the category of large microfluidic, which is enough to investigate the pore-scale phenomena in hydrogeology.
Watson et al. [41] fabricated a three-channel micromodel directly using a 3D printer and performed dispersion experiments. Yang et al. [42] 3D printed various micromodels of channels and reservoirs to investigate fluid displacement in a fracture-vug medium. Dimou et al. [43] further explored this method by printing micromodels resembling homogeneous and heterogeneous porous media. Osei-Bonsu et al. [44] also fabricated a micromodel resembling homogenous porous media directly from a 3D printer and investigated foam flow. Ahkami et al. [45] fabricated a micromodel resembling fractured porous media and investigated the fluid flow by incorporating particle imaging velocimetry (PIV). Mousavi et al. [46] fabricated a micromodel with an enlarged network of rock and demonstrated fluid displacement phenomena.
Given the reported works of micromodel fabrication in the field of hydrogeology [41,42,43,44,45,46], two types of 3D printers have mainly been used for the fabrication of micromodels. The first type is based on the selective curing of photosensitive polymer, stereolithography (SLA) [41,43], and digital light projection (DLP) [46], and the second type is based on polymer droplet jetting: multijet [45] and polyjet [42,44]. In terms of popularity, as mentioned by Beauchamp et al. [32] and Gyimah et al. [33] in their comprehensive reviews, SLA is the most popular 3D-printing type for micromodel fabrication. It is easy to use, produces smooth surfaces, has a high resolution (~25–100 μm), and is affordable (~6000 USD). Although DLP uses a similar method, SLA produces a better surface finish and is less complex technologically, resulting in a lower price and less complexity. Multijet and polyjet, on the other hand, are much more expensive (~60,000 USD) even though they offer similar results with SLA. However, the lower price of SLA 3D printers is not without drawbacks. Although the printing resolutions among multijet, polyjet, and SLA are similar (~25–100 μm), SLA prints the object under resin immersion, whereas multijet and polyjet print the object by jetting resin droplets. As a result, the escape route for the immersing resin of the SLA 3D printer needs to be considered. Because the resin possesses a relatively high viscosity and interfacial tension [47], it could remain during the printing process, resulting in defects and low accuracy.
Though SLA printing is suitable for printing micromodels, comprehensive accuracy checks on the fabricated micromodels have never been reported. The only performed accuracy check was by Watson et al. [41], which was just a point accuracy check performed on some parts of the channels. The best techniques to fabricate and assemble micromodels with the optimum accuracy and minimum leakage are rarely discussed as well. Most of the reported works [42,43] have only demonstrated the capability of the SLA 3D printer to fabricate a micromodel, followed by experimental demonstrations.
In this work, we fabricated a micromodel with a consumer-grade SLA 3D printer and, for the first time, performed a comprehensive accuracy evaluation by using micro-CT. Comprehensive accuracy evaluations, including the effects of geometries, dimensions, printing axis configurations, printing thickness resolutions, and pattern thicknesses, were performed. In the end, a micromodel printed with the most optimal settings was printed, assembled, and used for fluid displacement experiments of capillary and viscous fingerings. Because leakage is also one of the major problems in 3D-printed micromodels [46], this micromodel design was also addressed to overcome this key problem. Therefore, we believe that this paper could become a reference for other researchers in fabricating micromodels using an SLA 3D printer.

2. Materials and Methods

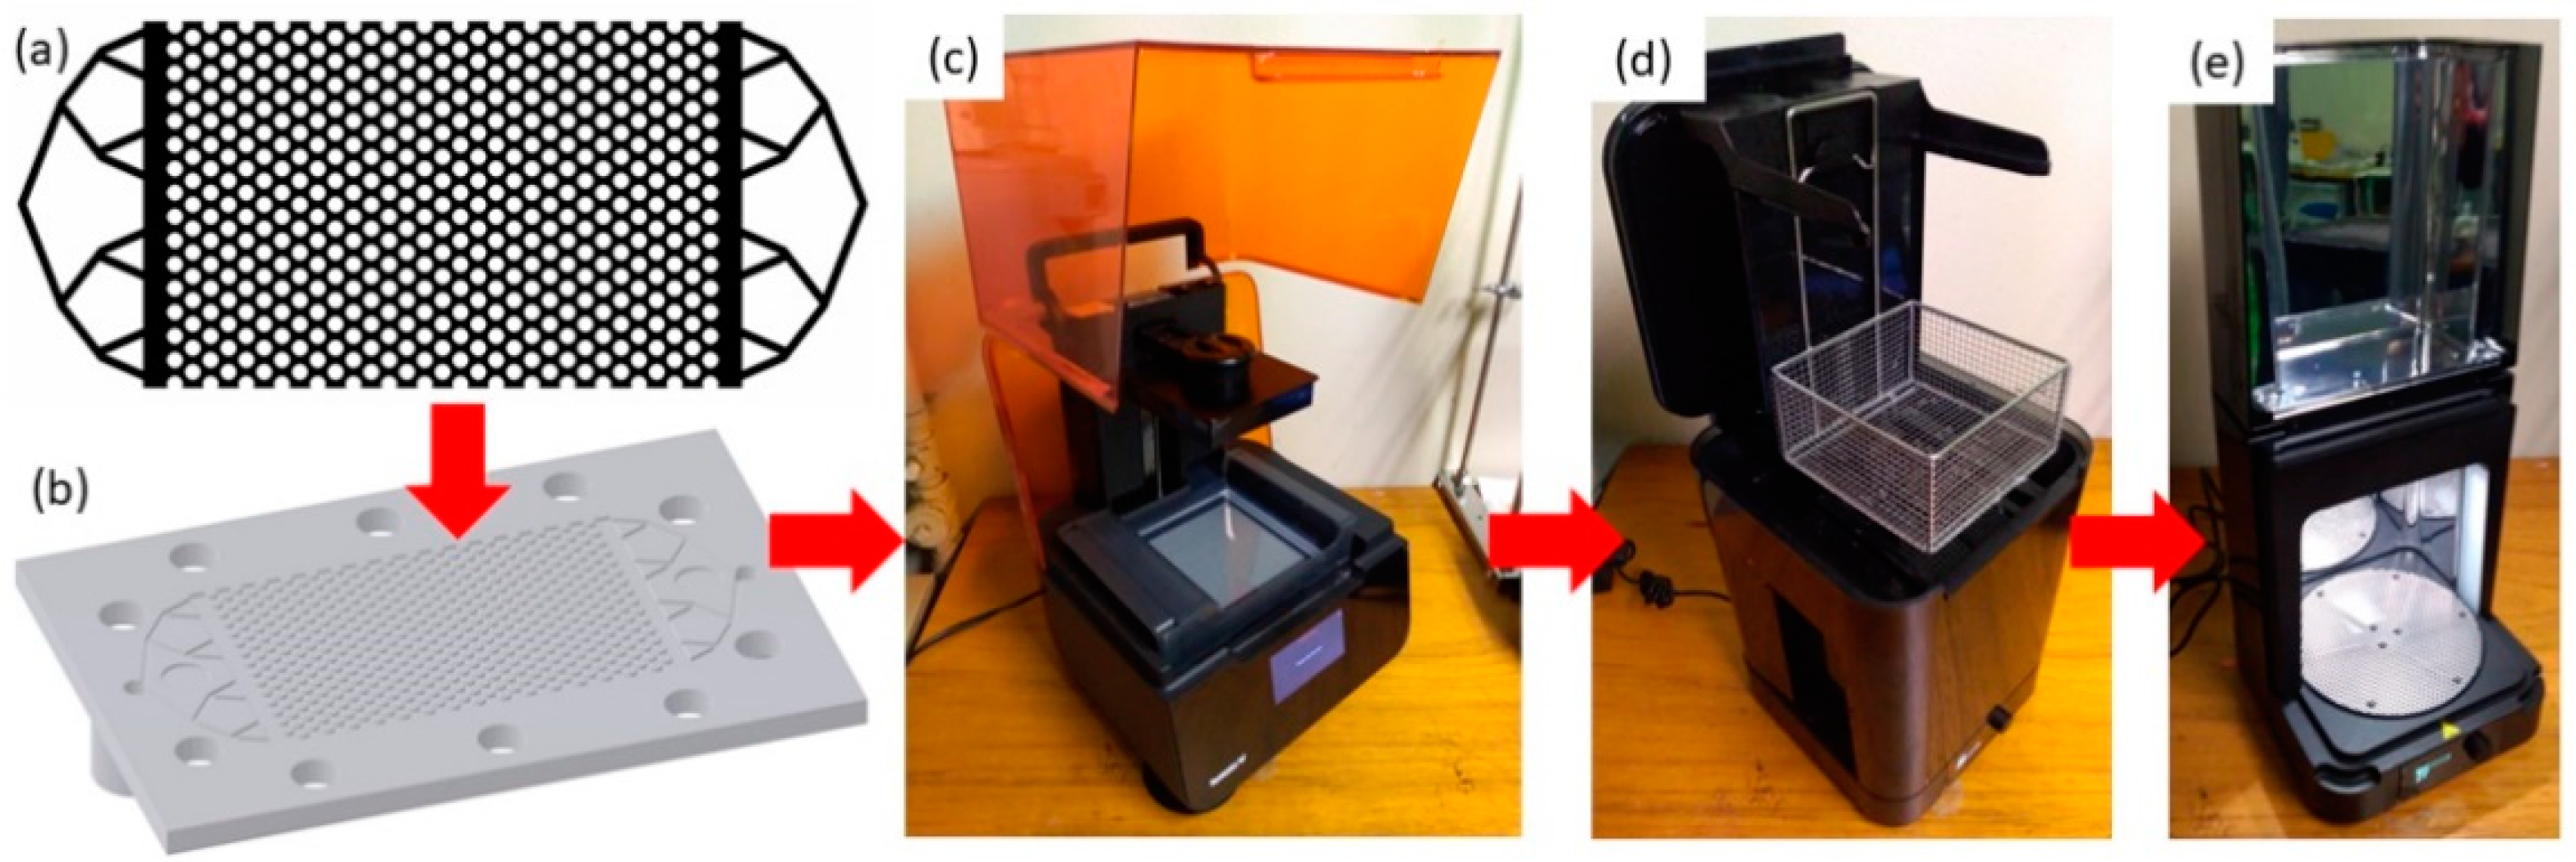
2.1. Printing with an SLA 3D Printer

In short, printing with an SLA 3D printer can be described in four steps: digital design, printing, washing, and curing. The workflow of printing with an SLA 3D printer is shown in Figure 1.
The first step is to generate a 3D image of the object. To generate the 3D image, we utilized Fiji software (version 1.53c) [48], which is an open-source software. With Fiji, the 3D image could be generated from a stack of cross-sectional images (Figure 1a). By incorporating a programming code, each cross-sectional image could be made based on a coordinate design, resulting in an accurate result. The 3D image was then generated by converting the stacked image of the micromodel design to a stereolithography file (STL) (Figure 1b). This STL file was then uploaded to the 3D printer for printing.
For the 3D printer, a Form 3 SLA 3D printer (Figure 1c) from Formlabs (Somerville, MA, USA), was used. This 3D printer utilized low-force stereolithography and consisted of two main components: a flexible resin tank and a scalable light-processing unit. Low-force stereolithography is mainly designed to reduce the exerted force on the freshly solidified resin, which is still delicate and easily torn. By using a flexible resin tank, which will deform when the printing platform moves in and out, the exerted force can be reduced, resulting in a lower possibility of torn, solidified resin. A scalable light-processing unit is used to minimize the error from the radiation light area. By utilizing a series of laser reflections delivered from a galvanometer, a fold mirror, and a parabolic mirror, it ensures a perpendicular laser radiation to the resin tank, leading to pinpoint precision with high accuracy. This 3D printer utilized a single violet diode laser source with a wavelength of 405 nm and a laser power of 250 mW. Given that the laser spot size was 85 μm, the XY printing resolution was 25 μm, whereas the thickness resolution could be changed to 25, 50, and 100 μm. The maximum build dimension was 145 × 145 mm2 horizontal area with a height of 185 mm.
The resin used in this work was a standard clear resin provided by Formlabs (Somerville, MA, USA). The resin composition was proprietary to the company. However, according to Ishutov [47], the main compositions of the resin are methacrylate monomers and oligomers, acrylate monomers, and photoinitiators. At 25 °C, which is the heated temperature during printing, the density and viscosity of the resin are 1090–1120 kg/m3 and 850–900 mPa·s, respectively, whereas the contact angle of the printed resin is 87.1 degrees [47]. Throughout this work, only this resin was used because it was the only resin with a transparent or clear color.
In short, SLA printing utilizes a photopolymerization process of resin by laser radiation. Through successive solidification from the photopolymerization process, the desired 3D object is printed layer-by-layer (Figure 2). First, a sweeper arm was used to uniformly attach the resin from the tank to the print platform (Figure 2a). Afterward, the print platform was pushed down to the resin tank, causing a slight deformation to the bottom layer of the flexible resin tank. The LPU was then moved horizontally to sweep the deformed bottom layer while irradiating the resin, resulting in a layer of solidified resin (Figure 2b). This solidified resin was then lifted out from the resin tank. A new layer of resin was then attached to the solidified resin using the sweeper arm (Figure 2c), and the process was repeated to build successive, solidified layers resembling the 3D design.
The last two stages are washing and curing. After the printing, the printed object should be washed immediately in isopropyl alcohol for 20 min. Leaving the printed object too long without washing could affect the accuracy of the sample due to the solidification of the remaining resin on the surface. The effect of this prewashing time after printing is also given in the supplementary material document S1. By using an automated cleaning chamber, FormWash, from Formlabs (Somerville, MA, USA) (Figure 1d), the sample was washed automatically under stirring to ensure the removal of the remaining IPA and to provide a clean surface finish.
Lastly, for the curing, the printed sample was cured either by using a curing chamber, FormCure, from Formlabs (Somerville, MA, USA) (Figure 1e), or naturally by leaving it open at room conditions. These post-processing methods resulted in more optimal material mechanical properties and smooth surface finishes. Inside the curing chamber, the sample was heated up to 60 °C and was irradiated by 13 light emitting diodes using the same light source as the printing (405 nm wavelength) while rotating at 1 revolution per minute. However, if the micromodel design was too thin, the 3D-printed sample tended to bend due to the fast curing rate. Therefore, depending on the sample thickness, we chose between these two methods. The effect of this rapid curing process is also given in the supplementary material document S2.

2.2. Printed Design

To investigate the 3D printer accuracy, the capabilities of the 3D printer to print holes, channels, and porous media structures with different sizes and geometry were evaluated. Two main accuracy test designs were used to evaluate them.
The first design was a chip with a row of holes and channels printed on it. The row of holes consisted of 2 mm deep circular holes with varied diameters from 0.1 to 0.8 mm. On the other hand, the row of channels consisted of 10 mm long square channels with varied square sides from 0.1 to 1.0 mm. These channels were printed parallelly on top of the chip (Figure 3a,b) with the same printing thickness resolution of 25 μm. The limitation of the printer to print a channel and hole with the smallest size could be evaluated from this design. In addition, this simple geometry design was also used to check the effect of printing axis configuration on the printing results. Because it printed the object under the immersion of the resin, the escape route of the resin could play an important role in the accuracy of the printing result. Therefore, four configurations of the printing axis, called wide, tall, flat, and tilted (Figure 3c), were used to print this design.
The second design was a chip with a uniform porous media pattern on it (Figure 4a–c). As shown in Figure 4b, a simple geometrical design was used in this design to ensure the uniformity of the porous media. By varying the values of GapX and GapY of the isosceles triangle, the GapR could be controlled. Setting GapX to D/2, GapY to D/8, and D to 1.2 mm led to a Gap R of 0.422 mm. Similar with the definition of the porous media pore-throat network, this GapX and GapR were identical with the definition of a throat [49,50,51], which is the constriction between pores. This uniform porous media pattern design was used to evaluate the 3D printer in printing a structure of porous media networks. In addition, this second design was used to check the effect of printer thickness resolution, depth of pattern, and gap of the pattern. For the printed thickness resolution, this design was printed under printing thickness resolutions of 25, 50, and 100 μm but with a constant pattern depth of 0.5 mm. For the depth of the pattern (Figure 4c), this design was also printed with different pattern depths of 0.3, 0.5, and 1.0 mm but with the same printing thickness resolution of 50 μm. For the gap of the pattern, another variant of this geometrical design was generated by changing the values of GapX to D/4 and GapY to D/16 but keeping the value of D to 1.2 mm, resulting in a GapR of 0.274 mm. Therefore, this also demonstrated porous media with different pore–throat network structures.
Lastly, the complete design of the micromodel, including the porous media pattern, inlet, outlet, cover design, and tightening component, was made (Figure 5). Because fluid leakage is a critical problem in micromodel fabrication, this design was also mainly made to overcome this key problem [46]. Through trial and error, this design was found to be the most optimal design.
For the porous media pattern, the first variant of the porous media pattern in Figure 4 with a GapX of D/2, a GapY of D/8, and a D of 1.2 mm was used. This pattern was printed with a pattern depth of 0.5 mm and a printing thickness resolution of 50 μm. As a result, the porosity of this porous media pattern was 0.536.
For the inlet and outlet, the open triangle shape in Figure 5a was used instead of a branching-off pattern, as shown in Figure 1a,b. The branching-off pattern often results in channel blockage by some trapped phases, causing a non-uniform flow. This inlet and outlet design has also been used by other researchers in experiments to control fluid displacement instability [52,53], which is a flow-sensitive experiment.
For the cover, a thin, clear, plexiglass plate was used. This cover was then placed on top of the micromodel and was tightened by using bolts and nuts surrounding the pattern. However, because the center part of the micromodel was not tightened, leakage at the porous media pattern often occurred. Therefore, a tightening module was introduced to overcome this leakage. This module mainly consisted of two plates: smaller and larger plates. The larger plate was also fixed to the micromodel by using bolts and nuts surrounding the pattern. In addition, bolts and nuts were also used at the center of this plate. By setting the height of the bolts, it could be used to tighten the middle part of the micromodel. To distribute the force uniformly, the smaller plate was put between the micromodel and the bolts. By choosing an opaque-colored plate, it acted as the background for the micromodel pattern. To make it more leakproof, grease was added surrounding the micromodel pattern to block any fluid flow.
This micromodel design was then used for fluid displacement experiments to demonstrate viscous and capillary fingerings. A solution of methylene blue with a viscosity of 0.89 mPa·s and a silicone oil with a viscosity of 90 mPa·s were used for the fluids. The interfacial tension between these fluids was 35.9 mN·m. To demonstrate viscous fingering, the micromodel was saturated with the silicone oil, and then the MB solution was injected into the silicone-oil-saturated micromodel at a flow rate of 300 μL/h, corresponding to an interstitial velocity [54] of 11.27 μm/s. For the capillary fingering, the silicone oil was injected into an MB-solution-saturated micromodel at the same flow rate. All of the injection processes were performed using a Terumo syringe and a KD scientific syringe pump; a EOS 60D from Canon (Tokyo, Japan) digital camera was used to capture the fluid displacement throughout the experiment.

2.3. Measuring Accuracy with Microtomography

To check the accuracy of the printed sample, a micro-CT (Comscantechno Co. ScanXmate-CF110TSS300) from Comscan (Kanagawa, Japan), was used in this work. The same X-ray intensity (65 kV and 116 μA) and power (7.5 W) were used throughout the experiment to provide identical brightness and contrast. The scanning method was the static mode in which the sample remained still while the X-ray source and panel rotated around it. To obtain high-quality images, the sample was scanned with 2400 projections throughout a 360-degree angle rotation. By using a projection rate of 2 frames per second, the whole scan was finished in 1200 s (20 min). These projections were then used to generate 3D images with a resolution of 2304 × 2304 × 1300 voxels. Depending on the case, the voxel size, which represents the magnification, was changed accordingly. To evaluate the holes and channels (Figure 3), a voxel size of 8 μm/voxel was used, whereas 10 μm/voxel was used to evaluate the uniform porous media micromodel (Figure 4).
After the sample was scanned with the micro-CT, an image-processing series was carried out to extract the quantitative data. Figure 6a shows an example of a cross-sectional image of the uniform porous media obtained with the micro-CT. Dark indicates the voids, whereas bright indicates the solids. The distribution of the voxel gray value is shown in Figure 6b as a histogram. The peak with a lower gray value corresponds to voids, whereas the peak with a high gray value corresponds to solids. To improve the contrast and remove noises, median filtering was also carried out, resulting in higher peaks and a wider valley between the peaks. To differentiate between the void and the solid, a direct thresholding method based on Otsu’s algorithm [55] was performed, resulting in the binarized image in Figure 6c. After the binarized images were obtained, various data analyses were performed to extract quantitative data for accuracy evaluation.
First, the cross-sectional area of the printed geometry was measured. Figure 7a shows the 3D binarized image of a 0.7 mm diameter printed hole. The measured cross-sectional area was then plotted with the distance in Figure 7b to demonstrate the profiles of the printed object. This analysis was performed on each of the printed holes and channels. Both the equivalent diameter and equivalent side were described as follow:
D e = A m e a s 4 π
s e = A m e a s
where D e as the equivalent diameter, s e as the equivalent square side, and A m e a s as the measured area, were used as parameters to represent the cross-sectional area.
Second, using a z-projection method, a depth map was generated. Z-projection is a digital-image-processing method of analyzing a stack of images by applying projections to each of the pixels of an image in the direction of the stack, which is the z-direction (Figure 7c). By projecting the number of void pixels in a cross-sectional image to the stack direction, the depth of the object can be calculated in each pixel. As a result, a depth map showing the structure of the printed object could be generated. This depth map was suitable for displaying the structure of the printed channels and porous media patterns in 2D images.
Third, the measured printed geometry from the binarized 3D image was compared with the actual 3D image design to calculate the overall error of the printing. The volume error was calculated as follow:
η = | V d e s V m e a s V d e s |
where η is the overall volume error, V d e s is the volume of the 3D image design, and V m e a s is the volume of the measured printed object.

3. Results and Discussions

3.1. Accuracy Check

3.1.1. Holes and Channel Rows

The cross-sectional profiles and 3D binarized images of the holes generated from four different axis configurations are shown in Figure 8. Only holes from 0.8 mm to 0.4 mm are shown because smaller holes failed to be printed in any axis configurations. This limitation can be attributed to the high viscosity and interfacial tension of the resin. As the hole diameter grew smaller, it became easier for the resin to stick inside the hole and was then solidified by indirect printer radiation or curing radiation. This observation is also consistent with the observation by Ishutov et al. [56]. They found that the SLA 3D printer could print a hole with a diameter of 0.39 mm but could not print a hole with a diameter of 0.29 mm or smaller.
For the effect of printing axis configuration, as shown in Figure 8a–e, the flat configuration generated the best outcome because it could print holes with diameters of 0.8 to 0.4 mm. The tilted configuration was the second-best. It could print holes with diameters down to 0.6 mm, but not smaller. The wide and tall configurations, however, failed to print any holes successfully at all. The effect of the printing axis configuration can also be observed clearly from the 3D binarized image in Figure 8f–i. Because the movement of the resin was strongly affected by gravity, the printing results were strongly affected by it. For the wide and tall orientations, because gravity was perpendicular to the holes, resin tended to be trapped in the middle of the holes due to the difficulty for the resin to flow out. The flat orientation, in contrast, generated the best results due to the parallel direction between the holes and gravity, which led to an easy escape route for the resin. However, some resin remained trapped near the resin outlet passage, resulting in some error at the outlet. The tilted orientation, on the other hand, generated mediocre results. Because the holes and gravity were not fully parallel, resin could still be trapped at the side of the holes and near the resin outlet, which was the combination of the wide, tall, and flat orientations.
For the printed channels, the cross-sectional profiles of a channel and the depth maps of the channel are shown in Figure 9 and Figure 10, consecutively. The channels with square sides of 0.2 and 0.1 mm are not given because they failed to be printed in any axis configuration. Similar with the holes, this limitation could be caused by the high viscosity and interfacial tension of the resin, causing the resin to be stuck inside. As a result, the minimum size of the printed hole was similar with the minimum size of the printed channel. However, although it could print down to a channel size of 0.3 mm, as shown in Figure 9h, the possibility of error in this channel size was much higher than larger channel sizes. From Figure 10, some defects were also found in this channel size due to some trapped resin.
For the effect of printing axis configuration, similar to the printed holes, the flat orientation demonstrated the best result, followed by the wide, tilted, and, lastly, the tall orientations. The reason for this result can be explained with the depth map of the channels in Figure 10. Similar to the printed holes, gravity direction also strongly affected the outcomes. In the case of the flat configuration (Figure 10a), gravity was parallel to the channel length. As a result, the resin accumulated at one of the channel edges with the direction of gravity, resulting in an error at the edge. For the tall configuration (Figure 10b), because gravity was perpendicular to the channel length, the resin accumulated along the channel side with the direction of gravity. This, consequently, resulted in a large error because it occurred along the channel of the flat configuration (Figure 10c). Because the gravity direction was normal to the channel length and micromodel, it led to an easy escape route for the resin. The tilted configuration (Figure 10d), on the other hand, demonstrated an error combination of both the wide and tall configurations. The trapped resin accumulated both at the channel-end edge and along the channel side with the direction of gravity, leading to a medium error. Watson et al. [41] printed a three-channel micromodel with a 45-degree printing angle, which was similar to this tilted configuration, and found that the depths of the channels were non-uniform from a point accuracy check. We believe that this non-uniform depth was affected by the movement of the resin to the gravity direction, similar to this finding.
The overall volume error of all the holes and channels generated with four different printing axis configurations can be observed in Figure 11a,b. The flat configuration demonstrated the best outcome, whereas the tall configuration demonstrated the worst outcome in both holes and channels. The wide and tilted configurations were in the middle. The wide configuration showed better results for holes, whereas the tilted configuration showed better results for channels. In both holes and channels with all of the printing configurations, a smaller hole diameter and channel size led to a larger overall volume error. The error increased significantly when the hole diameter and channel side were smaller than 0.6 mm. Nevertheless, by using the flat configuration, the overall volume error of the holes was in the range of 0.2 to 0.5, whereas the overall volume error of the channels was in the range of 0.05 to 0.3.

3.1.2. Uniform Porous Media Pattern

For the effect of printing thickness resolution, Figure 12 shows the depth map of uniform porous media generated from printing thickness resolutions of 25, 50, and 100 μm. The occurrence of throat blockage, defined as a depth disturbance at the throat in which the depth of the throat is lower than half of the pattern depth, and the pillar diameter were also used for evaluation. All of these data are shown in Table 1.
A printing thickness resolution of 50 μm generated the best result with no throat blockage at all. On the other hand, the printing thickness resolutions of 25 and 100 μm showed 29 and 126 throat blockages, respectively. All of these throat blockages occurred at the GapR of 0.422 mm, which was the smallest gap in the porous media network. In addition, given the color bar, while the error of the 25 and 50 μm thickness resolutions was lower than 50 μm, the error of the 100 μm thickness resolution was larger at around 50 and 100 μm depths.
This observation was the opposite of the observation by Dimou et al. [43]. They found that the printing thickness resolution of 100 μm showed the least throat blockage, whereas the printing thickness resolution of 25 μm generated more throat blockage. However, because they observed the blockage only from the top by using a digital camera, the throat blockage observation could not be performed as the same detail as using micro-CT. Furthermore, these results demonstrated that a smaller printing resolution does not always generate more accurate outcomes, which was probably due to a technical error from the radiation for the printing.
The thickness resolution of 50 μm demonstrated the best results with an overall volume error of 0.163, followed by the thickness resolutions of 25 and 100 μm with overall volume errors of 0.316 and 0.517, respectively. Additionally, the pillar average diameter was also measured and compared. The most accurate pillar average diameter was consistent with the overall volume error, with the printing thickness of 50 μm as the best result, followed by 25 and 100 μm, respectively.
For the effects of structure height and pattern gap, similarly, the depth map, the overall volume error, the occurrence of throat blockage, and the pillar diameter were also used for evaluation. All these data are also shown in Figure 13 and Table 1.
For the pattern depth, as shown in Figure 13a,b, changing the pattern depth to 0.3 mm still resulted in no throat blockage, with a depth error of about 25 and 50 μm, whereas changing the pattern depth to 1.0 mm generated less accurate results, with 29 throat blockages and a depth error of 100 μm. In addition, the throat blockages did not only occur at GapR but also at some GapX locations, and they were concentrated at the center area of the pattern. Reducing the GapR to 0.274 mm and the GapX to 0.3 mm resulted in a much worse outcome (Figure 13c). Most of the throats were blocked at both GapR and GapX, especially at the center of the pattern.
From the overall volume error in Table 1, the pattern depths of 0.3 and 1.0 μm generated an overall volume error of 0.199 and 0.315, respectively. The pillar average diameter was also consistent with this trend of the overall volume error with a value of 1270 μm for the pattern depth of 300 μm and a value of 1303 μm for the pattern depth of 1000 μm. For the smaller GapR and GapX, the overall volume error was the highest at 0.442, and the pillar average diameter was also the largest at 1305 μm.
These results demonstrated that a deeper pattern resulted in a larger error than a shallower pattern and could result in a larger chance of throat blockages. Reducing the throat gaps also increased the risk of throat blockages. This sudden increase of throat blockages was consistent with the observation of the printed square channels in Section 3.1.1. A channel with a square side of 0.3 mm was the limitation for printing. Therefore, throat gaps lower than 0.3 mm were susceptible to blockages due to the higher possibility of trapped resin. As a result, some of the GapX of 0.3 mm were also blocked. In addition, these results also demonstrated that the limiting geometry was the gap or width of the channel instead of the depth.

3.2. Fluid Displacement Experiments in the Fabricated Micromodel

To predict the generation of viscous and capillary fingerings, nondimensional numbers of viscosity ratio and capillary number were described as follows:
M = µ i µ d
C a = µ i v σ
where M as the viscosity ratio, C a as the capillary number, µ i as the invading fluid viscosity, µ d as the defending fluid viscosity, v as the interstitial velocity, and σ as the interfacial tension were used. The viscosity ratio and capillary number of the viscous fingering setup in this work were 9.89 × 10⁻³ and 2.793 × 10⁻⁷, whereas for the capillary fingering setup, the viscosity ratio and capillary number were 1.01 × 10² and 2.824 × 10⁻⁵. By using the fluid displacement map [18,19], the viscous fingering setup in this work fell into the category of viscous–capillary transition [16], while the capillary fingering setup in this work fell into the category of capillary–stable transition.
The results of the viscous fingering setup are shown in Figure 14a–c, and the results of the capillary fingering setup are shown in Figure 14d–f. In addition, animations of the sequential fluid injections in binarized images are also included as supplementary material animations S3 and S4. As the quantitative parameter, invading fluid saturation was defined as follows:
S i = V i V t o t ϕ = V i V v o i d
where S i as the invading fluid saturation, V i as the volume of the invading fluid, ϕ as the porosity, V t o t as the total volume of the micromodel, and V v o i d as the void volume were used.
As shown in Figure 14a–c and supplementary material animation S3, the fluid displacement pattern displayed a forward-progressing pattern with a streak-like structure resembling some branches. For this condition, the viscous force was dominant over the capillary force, and a pressure gradient was generated in the flow direction. Therefore, after the displacement front became unstable, it created a positive feedback condition to the preferential invading fluid displacement due to the low viscosity of the invading fluid. As a result, the invading fluid generated a streak-like structure, which is a typical pattern characteristic of viscous fingering. Due to this pattern, the invading fluid saturation tended to be low. When the invading fluid broke through the micromodel, the invading fluid saturation was only 0.149, which is consistent with other reports of viscous fingering studies [16,17,18,19].
For the capillary fingering, as shown in Figure 14d–f and supplementary material animation S4, the fluid displacement structure demonstrated a more compact structure. In this condition, the capillary force was dominant over the viscous force. As a result, the fluid displacement was more controlled by the capillary force. Although the displacement was more compact, some defending phase remained as a trapped phase. This trapped phase is one of the characteristics of capillary fingering. Another characteristic of capillary fingering is the backward direction of the invading fluid, which occurred on several occasions during this injection. However, because the previous viscous fingering case was in the regime of a viscous–capillary fingering transition, this phenomenon was also observed in the previous viscous fingering. At the breakthrough, the invading fluid saturation was around 0.577, which is also a common value in capillary fingering studies [16,17,18,19].

4. Conclusions

In this report, comprehensive accuracy check evaluations on the printed objects from an SLA 3D printer were performed using micro-CT followed by a series of image-processing methods. The effects of geometries, dimensions, printing axis configurations, printing thickness resolutions, and pattern thicknesses were evaluated. The smallest hole that could be printed was 0.4 mm in diameter, whereas the smallest square channel that could be printed had a 0.3 mm square side. However, with the decrease in hole and channel size, a higher error was expected. Printing with a flat configuration and a thickness resolution of 50 μm was found to produce the most accurate results. Increasing the depth of the porous media pattern escalated the possibility of throat blockage and vice versa. Printing a uniform porous media pattern with pattern depths down to 0.3 mm produced results with less error, but they were still less accurate than printing with a pattern depth of 0.5 mm. Decreasing the throat gap of the porous media pattern lower than 0.3 mm led to a high chance of throat blockage.
The design of a complete micromodel, including a porous media pattern, inlet, outlet, cover, and tightening module, generated with an SLA 3D printer was also given in this work. This design could overcome the leakage problem and generated a uniform flow. With this design, fluid displacement experiments depicting capillary and viscous fingerings were also successfully performed as a demonstration.
We believe that the results of this investigation can become a reference for other researchers using not only SLA but also DLP 3D printers because the working concept of DLP is also similar. Given the low-cost option of this SLA 3D printer, it can be a solution to increase the availability of micromodels for other researchers around the world by reducing the cost of micromodel fabrication. This work can also be used as a reference for the fabrication of 3D artificial porous media using an SLA 3D printer, which is the future work and development of 3D printer implementation in various fields, including hydrogeology [47,57], chemical engineering [54,55,58,59], and bioengineering [40].

Supplementary Materials

The following supporting information can be downloaded at: https://www.mdpi.com/article/10.3390/geosciences12050183/s1, Document S1: effects of prewashing time after printing, Document S2: effects of rapid curing in curing chamber, Animation S3: viscous fingering sequential animations; Animation S4: capillary fingering sequential animations.

Author Contributions

Conceptualization, A.P. and M.A.M. (Mohammmad Azis Mahardika); methodology, A.P., M.A.M. (Mohammmad Azis Mahardika), and M.N.; software, A.P. and M.A.M. (Mohammmad Azis Mahardika); validation, Y.S. and W.W.; formal analysis, A.P.; investigation, A.P. and M.A.M. (Mohammmad Azis Mahardika); writing—original draft preparation, A.P., M.A.M. (Muhammad Akhsin Muflikhun), and T.S.; writing—review and editing, A.P., M.A.M. (Muhammad Akhsin Muflikhun), and T.S.; funding acquisition, A.P. and T.S. All authors have read and agreed to the published version of the manuscript.

Funding

This work was supported by JSPS KAKENHI with grant numbers 20J14975 and 21K13999.

Institutional Review Board Statement

Not applicable.

Informed Consent Statement

Not applicable.

Data Availability Statement

The data presented in this study are available on request from the corresponding author.

Conflicts of Interest

The authors declare no conflict of interest.

References

  1. She, Y.; Zhang, C.; Mahardika, M.A.; Patmonoaji, A.; Hu, Y.; Matsushita, S.; Suekane, T. Pore-scale study of in-situ surfactant flooding with strong oil emulsification in sandstone based on X-ray microtomography. J. Ind. Eng. Chem. 2021, 98, 247–261. [Google Scholar] [CrossRef]
  2. Wang, J.; Dong, M. Optimum effective viscosity of polymer solution for improving heavy oil recovery. J. Pet. Sci. Eng. 2009, 67, 155–158. [Google Scholar] [CrossRef]
  3. Osei-Bonsu, K.; Shokri, N.; Grassia, P. Fundamental investigation of foam flow in a liquid-filled Hele-Shaw cell. J. Colloid Interface Sci. 2016, 462, 288–296. [Google Scholar] [CrossRef] [PubMed]
  4. Hu, Y.; Patmonoaji, A.; Xu, H.; Kaito, K.; Matsushita, S.; Suekane, T. Pore-scale investigation on nonaqueous phase liquid dissolution and mass transfer in 2D and 3D porous media. Int. J. Heat Mass Transf. 2021, 169, 120901. [Google Scholar] [CrossRef]
  5. Imhoff, P.T.; Jaffé, P.R.; Pinder, G.F. An experimental study of complete dissolution of a nonaqueous phase liquid in saturated porous media. Water Resour. Res. 1994, 30, 307–320. [Google Scholar] [CrossRef]
  6. Zhang, C.; Werth, C.J.; Webb, A.G. A magnetic resonance imaging study of dense nonaqueous phase liquid dissolution from angular porous media. Environ. Sci. Technol. 2002, 36, 3310–3317. [Google Scholar] [CrossRef]
  7. Johns, M.L.; Gladden, L.F. Magnetic resonance imaging study of the dissolution kinetics of octanol in porous media. J. Colloid Interface Sci. 1999, 210, 261–270. [Google Scholar] [CrossRef]
  8. Johns, M.; Gladden, L. Probing ganglia dissolution and mobilization in a water-saturated porous medium using MRI. J. Colloid Interface Sci. 2000, 225, 119–127. [Google Scholar] [CrossRef]
  9. Corapcioglu, M.Y.; Yoon, S.; Chowdhury, S. Pore-scale analysis of NAPL blob dissolution and mobilization in porous media. Transp. Porous Media 2009, 79, 419–442. [Google Scholar] [CrossRef]
  10. Patmonoaji, A.; Zhang, Y.; Xue, Z.; Park, H.; Suekane, T. Experimental and numerical simulation of supercritical CO2 microbubble injection into a brine-saturated porous medium. Int. J. Greenh. Gas Control. 2019, 91, 102830. [Google Scholar] [CrossRef]
  11. Chang, C.; Zhou, Q.; Xia, L.; Li, X.; Yu, Q. Dynamic displacement and non-equilibrium dissolution of supercritical CO2 in low-permeability sandstone: An experimental study. Int. J. Greenh. Gas Control. 2013, 14, 1–14. [Google Scholar] [CrossRef]
  12. Chang, C.; Zhou, Q.; Oostrom, M.; Kneafsey, T.J.; Mehta, H. Pore-scale supercritical CO2 dissolution and mass transfer under drainage conditions. Adv. Water Resour. 2016, 100, 14–25. [Google Scholar] [CrossRef] [Green Version]
  13. Chang, C.; Zhou, Q.; Kneafsey, T.J.; Oostrom, M.; Wietsma, T.W.; Yu, Q. Pore-scale supercritical CO2 dissolution and mass transfer under imbibition conditions. Adv. Water Resour. 2016, 92, 142–158. [Google Scholar] [CrossRef] [Green Version]
  14. Heinemann, N.; Alcalde, J.; Miocic, J.M.; Hangx, S.J.T.; Kallmeyer, J.; Ostertag-Henning, C.; Hassanpouryouzband, A.; Thaysen, E.M.; Strobel, G.J.; Schmidt-Hattenberger, C.; et al. Enabling large-scale hydrogen storage in porous media-the scientific challenges. Energy Environ. Sci. 2021, 14, 853–864. [Google Scholar] [CrossRef]
  15. Lysyy, M.; Ersland, G.; Fernø, M. Pore-scale dynamics for underground porous media hydrogen storage. Adv. Water Resour. 2022, 163, 104167. [Google Scholar] [CrossRef]
  16. Patmonoaji, A.; Muharrik, M.; Hu, Y.; Zhang, C.; Suekane, T. Three-dimensional fingering structures in immiscible flow at the crossover from viscous to capillary fingering. Int. J. Multiph. Flow 2020, 122, 103147. [Google Scholar] [CrossRef]
  17. Wang, Y.; Zhang, C.; Wei, N.; Oostrom, M.; Wietsma, T.W.; Li, X.; Bonneville, A. Experimental study of crossover from capillary to viscous fingering for supercritical CO-water displacement in a homogeneous pore network. Environ. Sci. Technol. 2013, 47, 212–218. [Google Scholar] [CrossRef]
  18. Zhang, C.; Oostrom, M.; Wietsma, T.W.; Grate, J.W.; Warner, M.G. Influence of Viscous and Capillary Forces on Immiscible Fluid Displacement: Pore-Scale Experimental Study in a Water-Wet Micromodel Demonstrating Viscous and Capillary Fingering. Energy Fuels 2011, 25, 3493–3505. [Google Scholar] [CrossRef]
  19. Lenormand, R.; Touboul, E.; Zarcone, C. Numerical models and experiments on immiscible displacements in porous media. J. Fluid Mech. 1988, 189, 165. [Google Scholar] [CrossRef]
  20. Lin, W.; Xiong, S.; Liu, Y.; He, Y.; Chu, S.; Liu, S. Spontaneous imbibition in tight porous media with different wettability: Pore-scale simulation. Phys. Fluids 2021, 33, 032013. [Google Scholar] [CrossRef]
  21. Zhang, C.; Suekane, T.; Minokawa, K.; Hu, Y.; Patmonoaji, A. Solute transport in porous media studied by lattice Boltzmann simulations at pore scale and x-ray tomography experiments. Phys. Rev. E 2019, 100, 063110. [Google Scholar] [CrossRef] [PubMed]
  22. Al Mansoori, S.K.; Iglauer, S.; Pentland, C.H.; Blunt, M.J. Three-phase measurements of oil and gas trapping in sand packs. Adv. Water Resour. 2009, 32, 1535–1542. [Google Scholar] [CrossRef]
  23. Al-Raoush, R.I. Experimental investigation of the influence of grain geometry on residual NAPL using synchrotron microtomography. J. Contam. Hydrol. 2014, 159, 1–10. [Google Scholar] [CrossRef] [PubMed]
  24. Patmonoaji, A.; Hu, Y.; Nasir, M.; Zhang, C.; Suekane, T. Effects of Dissolution Fingering on Mass Transfer Rate in Three-Dimensional Porous Media. Water Resour. Res. 2021, 57, e2020WR029353. [Google Scholar] [CrossRef]
  25. Miri, R.; Hellevang, H. Salt precipitation during CO2 storage—A review. Int. J. Greenh. Gas Control. 2016, 51, 136–147. [Google Scholar] [CrossRef]
  26. Vogel, H. Scale Issues in Soil Hydrology. Vadose Zone J. 2019, 18, 1–10. [Google Scholar] [CrossRef] [Green Version]
  27. Blunt, M.J. Multiphase Flow in Permeable Media: A Pore Scale Perspective; Cambridge University Press: London, UK, 2017. [Google Scholar] [CrossRef]
  28. Blunt, M.J.; Bijeljic, B.; Dong, H.; Gharbi, O.; Iglauer, S.; Mostaghimi, P.; Paluszny, A.; Pentland, C. Pore-scale imaging and modelling. Adv. Water Resour. 2013, 51, 197–216. [Google Scholar] [CrossRef] [Green Version]
  29. Roman, S.; Abu-Al-Saud, M.O.; Tokunaga, T.; Wan, J.; Kovscek, A.R.; Tchelepi, H.A. Measurements and simulation of liquid films during drainage displacements and snap-off in constricted capillary tubes. J. Colloid Interface Sci. 2017, 507, 279–289. [Google Scholar] [CrossRef] [PubMed] [Green Version]
  30. Sun, Z.; Santamarina, J.C. Haines jumps: Pore scale mechanisms. Phys. Rev. E 2019, 100, 023115. [Google Scholar] [CrossRef] [PubMed] [Green Version]
  31. Mitra, S.K.; Chakraborty, S. Microfluidics and Nanofluidics Handbook: Fabrication, Implementation, and Applications, 1st ed.; CRC Press: Boca Raton, FL, USA, 2018. [Google Scholar] [CrossRef]
  32. Beauchamp, M.J.; Nordin, G.P.; Woolley, A.T. Moving from millifluidic to truly microfluidic sub-100-μm cross-section 3D printed devices. Anal. Bioanal. Chem. 2017, 409, 4311–4319. [Google Scholar] [CrossRef] [PubMed]
  33. Gyimah, N.; Scheler, O.; Rang, T.; Pardy, T. Can 3d printing bring droplet microfluidics to every lab?—a systematic review. Micromachines 2021, 12, 339. [Google Scholar] [CrossRef] [PubMed]
  34. Behm, J.M.; Lykke, K.R.; Pellin, M.J.; Hemminger, J.C. Projection Photolithography Utilizing a Schwarzschild Microscope and Self-Assembled Alkanethiol Monolayers as Simple Photoresists. Langmuir 1996, 12, 2121–2124. [Google Scholar] [CrossRef]
  35. Love, J.C.; Wolfe, D.B.; Jacobs, H.O.; Whitesides, G.M. Microscope projection photolithography for rapid prototyping of masters with micron-scale features for use in soft lithography. Langmuir 2001, 17, 6005–6012. [Google Scholar] [CrossRef]
  36. Comina, G.; Suska, A.; Filippini, D. Low cost lab-on-a-chip prototyping with a consumer grade 3D printer. Lab Chip 2014, 14, 2978–2982. [Google Scholar] [CrossRef] [PubMed]
  37. Comina, G.; Suska, A.; Filippini, D. PDMS lab-on-a-chip fabrication using 3D printed templates. Lab Chip 2014, 14, 424–430. [Google Scholar] [CrossRef]
  38. Muflikhun, M.A.; Sentanu, D.A. Characteristics and performance of carabiner remodeling using 3D printing with graded filler and different orientation methods. Eng. Fail. Anal. 2021, 130, 105795. [Google Scholar] [CrossRef]
  39. Alfarisi, N.A.S.; Santos, G.N.C.; Norcahyo, R.; Sentanuhady, J.; Azizah, N.; Muflikhun, M.A. Model optimization and performance evaluation of hand cranked music box base structure manufactured via 3D printing. Heliyon 2021, 7, e08432. [Google Scholar] [CrossRef]
  40. Daly, A.C.; Pitacco, P.; Nulty, J.; Cunniffe, G.M.; Kelly, D.J. 3D printed microchannel networks to direct vascularisation during endochondral bone repair. Biomaterials 2018, 162, 34–46. [Google Scholar] [CrossRef]
  41. Watson, F.; Maes, J.; Geiger, S.; Mackay, E.; Singleton, M.; McGravie, T.; Anouilh, T.; Jobe, T.D.; Zhang, S.; Agar, S.; et al. Comparison of Flow and Transport Experiments on 3D Printed Micromodels with Direct Numerical Simulations. Transp. Porous Media 2019, 129, 449–466. [Google Scholar] [CrossRef] [Green Version]
  42. Yang, W.; Zhang, D.; Lei, G. Experimental study on multiphase flow in fracture-vug medium using 3D printing technology and visualization techniques. J. Pet. Sci. Eng. 2020, 193, 107394. [Google Scholar] [CrossRef]
  43. Dimou, A.P.; Menke, H.P.; Maes, J. Benchmarking the Viability of 3D Printed Micromodels for Single Phase Flow Using Particle Image Velocimetry and Direct Numerical Simulations. Transp. Porous Media 2021, 141, 279–294. [Google Scholar] [CrossRef]
  44. Osei-Bonsu, K.; Grassia, P.; Shokri, N. Investigation of foam flow in a 3D printed porous medium in the presence of oil. J. Colloid Interface Sci. 2017, 490, 850–858. [Google Scholar] [CrossRef] [PubMed]
  45. Ahkami, M.; Roesgen, T.; Saar, M.O.; Kong, X.Z. High-Resolution Temporo-Ensemble PIV to Resolve Pore-Scale Flow in 3D-Printed Fractured Porous Media. Transp. Porous Media 2019, 129, 467–483. [Google Scholar] [CrossRef]
  46. Mousavi, S.M.; Sadeghnejad, S.; Ostadhassan, M. Evaluation of 3D printed microfluidic networks to study fluid flow in rocks. Oil Gas Sci. Technol. 2021, 76, 50. [Google Scholar] [CrossRef]
  47. Ishutov, S. Establishing Framework for 3D Printing Porous Rock Models in Curable Resins. Transp. Porous Media 2019, 129, 431–448. [Google Scholar] [CrossRef]
  48. Schindelin, J.; Arganda-Carreras, I.; Frise, E.; Kaynig, V.; Longair, M.; Pietzsch, T.; Preibisch, S.; Rueden, C.; Saalfeld, S.; Schmid, B.; et al. Fiji: An open-source platform for biological-image analysis. Nat. Methods 2012, 9, 676–682. [Google Scholar] [CrossRef] [Green Version]
  49. Patmonoaji, A.; Tsuji, K.; Suekane, T. Pore-throat characterization of unconsolidated porous media using watershed-segmentation algorithm. Powder Technol. 2020, 362, 635–644. [Google Scholar] [CrossRef]
  50. Lindquist, W.B.; Lee, S.-M.; Coker, D.A.; Jones, K.W.; Spanne, P. Medial axis analysis of void structure in three-dimensional tomographic images of porous media. J. Geophys. Res. Solid Earth 1996, 101, 8297–8310. [Google Scholar] [CrossRef] [Green Version]
  51. Gostick, J.T. Versatile and efficient pore network extraction method using marker-based watershed segmentation. Phys. Rev. E 2017, 96, 023307. [Google Scholar] [CrossRef] [Green Version]
  52. Rabbani, H.S.; Or, D.; Liu, Y.; Lai, C.Y.; Lu, N.B.; Datta, S.S.; Stone, H.A.; Shokri, N. Suppressing viscous fingering in structured porous media. Proc. Natl. Acad. Sci. USA 2018, 115, 4833–4838. [Google Scholar] [CrossRef] [Green Version]
  53. Lu, N.B.; Browne, C.A.; Amchin, D.B.; Nunes, J.K.; Datta, S.S. Controlling capillary fingering using pore size gradients in disordered media. Phys. Rev. Fluids 2019, 4, 084303. [Google Scholar] [CrossRef] [Green Version]
  54. Haitjema, H.M.; Anderson, M.P. Darcy velocity is not a velocity. Ground Water 2016, 54, 1. [Google Scholar] [CrossRef]
  55. Otsu, N. A Threshold Selection Method from Gray-Level Histograms. IEEE Trans. Syst. Man. Cybern. 1979, 6, 62–66. [Google Scholar] [CrossRef] [Green Version]
  56. Ishutov, S.; Hasiuk, F.J.; Jobe, D.; Agar, S. Using Resin-Based 3D Printing to Build Geometrically Accurate Proxies of Porous Sedimentary Rocks. Groundwater 2018, 56, 482–490. [Google Scholar] [CrossRef]
  57. Ju, Y.; Xi, C.; Zheng, J.; Gong, W.; Wu, J.; Wang, S.; Mao, L. Study on three-dimensional immiscible water–Oil two-phase displacement and trapping in deformed pore structures subjected to varying geostress via in situ computed tomography scanning and additively printed models. Int. J. Eng. Sci. 2022, 171, 103615. [Google Scholar] [CrossRef]
  58. Fee, C. 3D-printed porous bed structures. Curr. Opin. Chem. Eng. 2017, 18, 10–15. [Google Scholar] [CrossRef]
  59. Fee, C.; Nawada, S.; Dimartino, S. 3D printed porous media columns with fine control of column packing morphology. J. Chromatogr. A 2014, 1333, 18–24. [Google Scholar] [CrossRef]
Figure 1. (a) Binarized slice image of micromodel pattern, (b) 3D CAD image of micromodel design, (c) Form 3 SLA 3D printer, (d) FormWash Washing Chamber, and (e) FormCure Curing Chamber.
Geosciences 12 00183 g001
Figure 2. The schematic of Form 3 SLA printing method: (a) attachment of resin to print platform using a sweeper, (b) downward movement of print platform followed by horizontal movement of LPU to irradiate the resin, and (c) re-attachment of resin to the solidified resin on the build platform.
Geosciences 12 00183 g002
Figure 3. (a) The holes and channels micromodel design with the numbers corresponding to the hole diameter and channel equilateral side in millimeters, (b) the 3D image of the micromodel design accompanied by the dimensions, and (c) four printing-axis configurations used for printing the test chip: wide, tall, flat, and tilted.
Geosciences 12 00183 g003
Figure 4. (a) The uniform porous media pattern design, (b) the geometrical design of the uniform porous media pattern, and (c) the 3D design of the micromodel.
Geosciences 12 00183 g004
Figure 5. The complete design of the micromodel with (a) all parts before assembly; (b) 3D isometric view of the assembled parts; and (c) side view of the assembled parts.
Geosciences 12 00183 g005
Figure 6. (a) A cross sectional image sample from micro-CT observation of uniform porous media, (b) gray value histogram of the cross-sectional image before and after median filtering with the yellow line as the thresholding value, and (c) binarized image of the cross-sectional image.
Geosciences 12 00183 g006
Figure 7. (a) A cross-sectional area measurement of a 0.7 mm diameter printed hole, (b) the hole profile graph projected as an equivalent diameter and distance from top, (c) the z-projection method concept.
Geosciences 12 00183 g007
Figure 8. (ae) The cross-sectional equivalent diameter profiles and (fi) the 3D binarized image of the printed holes for diameters 0.4–0.8 mm; the red arrow indicates the gravity direction and the red diamond indicates the gravity direction normal to the paper.
Geosciences 12 00183 g008
Figure 9. (ah) The cross-sectional equivalent side profiles of the printed channels with equilateral sides of 0.3–1.0 mm.
Geosciences 12 00183 g009
Figure 10. Depth map of the channel rows printed with four different printing axis configurations: (a) wide, (b) tall, (c) flat, and (d) tilted; the red arrow indicates the gravity direction and the red diamond indicates the gravity direction normal to the paper.
Geosciences 12 00183 g010
Figure 11. The overall volume error of (a) the holes with diameters of 0.4–0.8 mm and (b) channels with equilateral sides of 0.3–1.0 mm printed in four different axis configurations.
Geosciences 12 00183 g011
Figure 12. Depth map of uniform porous media generated from different printing thickness resolutions of (a) 25, (b) 50, and (c) 100 μm.
Geosciences 12 00183 g012
Figure 13. Depth map of uniform porous media with different pattern depths of (a) 300 μm and (b) 1000 μm, as well as (c) a smaller gap with GapR = 0.274 mm and GapX = 0.3 mm.
Geosciences 12 00183 g013
Figure 14. Binarized images of the viscous fingering experiments during MB solution saturations of (a) 0.052, (b) 0.104, and (c) 0.149, and the capillary fingering experiments during silicone oil saturations of (d) 0.088, (e) 0.368, and (f) 0.577.
Geosciences 12 00183 g014
Table 1. The overall volume error and pillar average diameter of the printed uniform porous media under different printing conditions and geometrical designs.
Printing DesignOverall Volume ErrorThroat BlockagesPillar Average Diameter (μm)
Thickness resolution 25 μm0.31601378
Thickness resolution 50 μm0.163291278
Thickness resolution 100 μm0.5171261431
Pattern depth 300 μm0.19901270
Pattern depth 1000 μm0.315251303
GapX 300 μm GapR 274 μm0.442most1305
Publisher’s Note: MDPI stays neutral with regard to jurisdictional claims in published maps and institutional affiliations.

