Article

The Arkalochori Mw = 5.9 Earthquake of 27 September 2021 Inside the Heraklion Basin: A Shallow, Blind Rupture Event Highlighting the Orthogonal Extension of Central Crete

by
Athanassios Ganas
1,*,
Yariv Hamiel
2,
Anna Serpetsidaki
3,
Pierre Briole
4,
Sotiris Valkaniotis
5,
Charalampos Fassoulas
6,
Oksana Piatibratova
2,
Haralambos Kranis
7,
Varvara Tsironi
1,3,
Ioannis Karamitros
1,
Panagiotis Elias
8 and
Emmanuel Vassilakis
7
1
National Observatory of Athens, Institute of Geodynamics, 11810 Athens, Greece
2
The Geological Survey of Israel, Jerusalem 9692100, Israel
3
Department of Geology, Seismological Laboratory, University of Patras, 26504 Rio, Greece
4
Ecole Normale Supérieure de Paris, Laboratoire de Géologie—UMR CNRS 8538, PSL Research University, 24 rue Lhomond, 75005 Paris, France
5
Department of Civil Engineering, Risk and Resilience Assessment Center, Democritus University of Thrace, 67132 Xanthi, Greece
6
Natural History Museum of Crete, University of Crete, Knossou Ave., P.O. Box 11810 Athens, 71409 Heraklion, Greece
7
Department of Geology & Geoenvironment, National & Kapodistrian University of Athens, Panepistimiopolis Zographou, 15784 Athens, Greece
8
National Observatory of Athens, Institute of Astronomy, Astrophysics, Space Applications and Remote Sensing, Vas. Pavlou and I. Metaxa, 15236 Penteli, Greece
*
Author to whom correspondence should be addressed.
Geosciences 2022, 12(6), 220; https://doi.org/10.3390/geosciences12060220
Submission received: 11 March 2022 / Revised: 18 May 2022 / Accepted: 20 May 2022 / Published: 24 May 2022
(This article belongs to the Special Issue Morphogenic Faulting: Current Practices and Future Challenges)

Abstract

:
A strong, shallow earthquake occurred near Heraklion (Crete, Greece) on 27 September 2021. The earthquake produced significant ground deformation in the vicinity of Arkalochori village but without any evidence for surface ruptures of primary origin. We used geodetic (InSAR and GNSS) data to map motions of the Earth’s surface that occurred during and shortly after the earthquake. A 14 cm subsidence of the GNSS station ARKL and a maximum of 19 cm distance from the SAR satellite were recorded. The measured surface displacements were used to constrain the rupture geometry and slip distribution at depth. Our best-fitting inversion model suggests that the rupture occurred on a 13 km-long planar normal fault striking N195° E dipping 55° to the northwest, with major slip occurring to the east and updip of the hypocentre. The fault tip is located 1.2 km beneath the surface. The maximum coseismic slip occurred in the uppermost crust, in the depth interval of 4–6 km. A decrease in the fault offsets toward the Earth’s surface is likely caused by an increased frictional resistance of the shallow layers to rapid coseismic slip. Satellite observations made in the first month after the earthquake detected no post-seismic deformation (i.e., below one fringe or 2.8 cm). The seismic fault may be identified with the Avli (Lagouta) segment of the NNE-SSW striking, west-dipping, 23 km-long neotectonic Kastelli Fault Zone (KFZ). Part of the rupture occurred along the Kastelli segment, indicating a fault segment linkage and a history of overlapping ruptures along KFZ. Based on geological data and footwall topography we estimate an average slip rate between 0.17–0.26 mm/yr for the KFZ. The Arkalochori earthquake is a paradigm example for the on-going extension of Heraklion basin (central Crete) in the WNW-ESE direction, which is almost orthogonal to the E-W Messara graben and other active faults along the south coast of Crete.

1. Introduction

A strong earthquake with magnitude ML(NOA) = 5.8 (MwNOA = 5.9; USGS Mw = 6.0) occurred on 27 September 2021 06:17 UTC near the village of Arkalochori about 25 km SSE of Heraklion, Crete, (Figure 1; [1,2,3]). The event was shallow (the slip centroid of the NOA moment tensor solution was at 6.4 km; https://bbnet.gein.noa.gr/HL/seismicity/mts Event ID: noa2021sybnk accessed on 10 March 2022) and generated large vertical ground acceleration (0.8 g; [4]), that was recorded by a strong motion instrument in Arkalochori (Figure 1). One person was killed and several were wounded. Information on the impact of this event is available at https://en.wikipedia.org/wiki/2021_Arkalochori_earthquake (accessed on 1 December 2021). The earthquake occurred in a location of central Crete where information on previous seismicity is very limited [5]. Strong previous events within a distance of 20–30 km from Arkalochori were reported by Papadopoulos [5,6] to have occurred in 1508, 1779 and 1810.
The 27 September 2021 M5.9 event was preceded by a sequence of foreshocks that started to gain attention on 4 June 2021, when an event of magnitude M = 4.6 occurred (see Table S1; [1,2]). In fact, microseismic activity around Arkalochori had been recorded about one year before the mainshock (this study; [1]). Thus, the Mw = 5.9 27 September 2021, Arkalochori event occurred as a culmination of the foreshock sequence. The European Mediterranean Seismological Centre, EMSC, https://www.emsc-csem.org (accessed on 1 December 2021)) reported testimonies on intensities for several foreshocks (see Figure S1 and Table S1). In Table S1 and Figure S1 we present the testimonies, their number and location for the seven of them of magnitude larger than M = 4.0, the mainshock and the main aftershock of ML(NOA) = 5.3 that occurred one day after the mainshock on September 28, 2021 at 04:48 UTC. The distribution of severe damage was around the village of Arkalochori (Figure 1 and Figure S2). Table 1 reports the various available moment tensor solutions for the mainshock. The mainshock hypocentre depth range reported in Table 1 is between 6–16 km. This difference appears as depth can be estimated from moment tensor inversions by fitting the spatial variation in surface or body waveform amplitudes. Then, the moment tensor inversion is performed for a range of focal depths and the best solution is assumed to be the one with the lowest misfit. However, as different institutes use different stations and different seismic frequencies it is evident that the depths will vary. We note that the NOA solution indicates a centroid depth of 6.4 km, which is close to the depth range of the main slip patch as determined in [2].
The location and depth of the 27 September 2021 M5.9 earthquake onshore Crete highlights the ongoing extensional deformation of the overriding Aegean Plate (e.g., [7,8,9,10,11,12,13,14,15,16]) in tandem with ongoing compression along the subduction front [17,18,19,20,21,22]. According to the latest GNSS results by Briole et al. ([23]; see their Figure 9) there is extension in the ~NW-SE direction of the order of ~0.5–1 mm/yr near Heraklion. This process is also manifested in the orientation of the local active faults and the topography of this region [9,13,16,24,25,26].
In this study, we present an analysis of seismological, geological, and geodetic data that constrain the location and geometry of the activated fault that ruptured with the M5.9 earthquake of 27 September 2021. In Section 3.1 we describe the method of relocation of hundreds of aftershocks. Due to the shallow depth of the earthquake rupture (hypocentre depths range from 6 to 16 km; see Table 1) and the good phase coherence of the area, it was possible to accurately map the surface deformation using InSAR (Section 3.3). The interferograms showed one main lobe of subsidence, elongated with an NNE-SSW orientation. The geodetic displacement data (InSAR & GNSS) were jointly inverted (Section 4) to model the dislocation source, assuming a homogeneous elastic half space. Our field survey showed that the earthquake generated secondary phenomena, with several areas on alluvial deposits exhibiting opening cracks. No tectonic surface ruptures were found in the field, in agreement with the modelled rupture. Our study highlights the WNW-ESE orientation of the stress field in this key region of central Crete and the particular type of strain release, which is by occurrence of earthquakes along normal faults that ruptured a large patch (10+ km long segment) of a longer (20+ km) neotectonic structure.

2. Tectonic Setting

The Heraklion basin is located in the central part of the Hellenic Arc and is characterised by extensional faulting, mainly along N-S and NW-SE directions [9,25,26]. Extensional features (intrabasinal highs, axial drainage etc.) are also manifested near the active faults [9,13,16,27,29] and the present-day topography of this region. The basin is found to the north of the Messara Basin, between Mts Psiloritis and Dikti in the west and east, respectively and Mt Asteroussia in the south (Figure 2). Both basins (Heraklion and Messara) are related to the back-arc extensional tectonic regime established in the Hellenic Arc since the Lower Miocene. The sedimentary fill in these basins includes a thick succession of 600–800 m of sediments which represent successive stages in their post-Lower Miocene evolution. The older basin sediments suggest lacustrine conditions in the Middle Miocene (Ano Viannos formation). Marine conditions were established in the Middle-Upper Miocene (Profitis Ilias, Ambelouzos and Agia Varvara formations); this marine environment continued in the Lower–Middle Pliocene (Foinikia fm). In the Pleistocene, the depositional environments are diversified, with marine bioclastic limestones and sandstones in the Heraklion Basin (Iraklio fm.) and fluvial–fluviolacustrine sediments in the Messara Basin [9,10,24]. The evolution of the Heraklion and Messara basins is thus characterized by diverse depositional environments, ranging from marine to fluviolacustrine and fluvial, since the Middle Miocene [30]. This alternation of depositional environments can be attributed both to climate-driven (eustatic) and tectonic factors, the interplay of which has led to the formation of numerous intra-basinal grabens and horsts.
The structural fabric within the Heraklion and Messara basins follows a pattern that reflects their evolution since their inception in the Lower-Middle Miocene; the former is dominated by NNE-SSW and NE-SW normal or oblique-normal faults, which appear to crosscut and overprint N-S and E-W faults that are believed to represent earlier deformation phases [9], including the south-dipping Psiloritis detachment [37]. The structures that control the geometry of the Messara basin, on the other hand, are mainly E-W and ENE-WSW faults. However, there appears to be considerable interaction and structural overprint between the two basins, at the eastern edge of the Messara basin (Kastelliana—Ano Viannos; Figure 2). This complex deformation pattern was also manifested in the 2005 Asimi and 2013 Houdetsi earthquake sequences, respectively, which confirmed the occurrence of both NE-SW normal and N-S strike-slip intra-basinal faulting, compatible with overall NW-SE crustal extension [25].
The village of Arkalochori is built on a topographic intra-basinal high, which is the result of both the occurrence of the erosion-resistant Agia Varvara bioclastic limestones and the fact that it is part of the footwall block of the N-S, west-throwing Arkalochori fault (see ALF in Figure 2), whose trace runs along the western edge of the hill. The cumulative throw of the Arkalochori fault is in the order of a few to several tens of meters, as is also the case of another minor fault in the east (Roussohori; see RF in Figure 2; this is fault GR2485 in the NOAFaults database http://doi.org/10.5281/zenodo.4304613 with a length of ~4 km). We have not studied these faults in detail, but certainly the geological data imply that their ages could be around 3–5 Ma, and assuming a preliminary throw of 100-m (implying a dip-slip of 140 m) the average slip rate is about 0.02–0.04 mm/yr. This value is expected for minor structures that do not accommodate most of the deformation. Both faults are characteristic of the ~N-S structural grain in this part of the basin and run sub-parallel to the marginal Kastelli normal fault (Figure 2).
The meizoseismal area of the 27 Sep. 2021, earthquake includes the villages Arkalochori, Avli, Nipiditos and Kastelli (Figure 1) including the aforementioned intra-basinal high, which corresponds to an eastward-tilted fault block, controlled by the intra-basinal N-S Arkalochori fault. The latter is one of a series of N-S to NNE-SSW normal faults that develop in the hanging wall of the major Kastelli Fault, which marks the eastern boundary of the Heraklion basin (KF in Figure 2). The SSW-ward segment of the Kastelli fault is the Lagouta Fault (LF in Figure 2), whose morphological expression is subdued, compared to the Kastelli fault. According to Vassilakis [27], this is due to the nature of the juxtaposed formations, as the Lagouta Fault juxtaposes the erodible footwall lacustrine marls (Ano Viannos fm.) against the Miocene marine sediments (Ambelouzos fm.) in the hanging wall. Nonetheless, this fault is characterized by a possible earlier strike–slip phase, in the Late Miocene, while later it acts as a pure extensional fault, in accordance with the suggested NW-SE extension in the broader area [25].
In terms of fault nomenclature, we note that in this paper, the neotectonic fault zone bounding the Kastelli Neogene basin is named as the Kastelli Fault zone (KFZ; following [9,26]) comprising two segments, the Kastelli Fault (KF in Figure 1) and the Avli-Lagouta Fault (AF in Figure 1). The normal fault in the footwall of KFZ is named the Geraki Fault Zone (GFZ in Figure 2). Two minor faults are also examined: the west-dipping Arkalochori Fault (ALF in Figure 2) and the west-dipping Roussohoria Fault (RF in Figure 2), respectively. In the literature, the above faults are named as follows: (1) in the NOAFAULTs v4.0 database https://arcg.is/04Haer and in Ganas et al. [25], the two segments of KFZ are named as Agnos (code GR2467), and Avli (GR2465), while the normal faults in the footwall of KFZ as Kastelli (GR2468; west dipping) and Panagia (GR2464; south dipping) (2) in Caputo et al. [13,29] the normal fault in the footwall of KFZ is identified as Kastelli Fault (3) in Nicol et al. [16] the KFZ is reported as Kastelli Fault, the normal faults in the footwall of KFZ as Geraki Fault, and Nipiditos Fault (4) in Vassilakis et al. [3] the two segments of KFZ are reported as Kastelli Fault and Lagouta Fault, the NW-SE normal fault at the footwall of KFZ as Nipiditos Fault and (5) in Triantafyllou et al. [2] the two segments of KFZ as North Kastelli and South Kastelli Fault; the normal faults in the footwall of KFZ as Geraki Fault zone (GFZ) and Nipiditos Fault.

3. Data & Methods

3.1. The 2021 Seismic Sequence of Arkalohori

In the present study, we have collected catalogue data (arrival times of events and seismic phases) from the online database of Institute of Geodynamics (National Observatory of Athens—NOA) for earthquakes that occurred in the study area during the period between November 2020 and October 2021. The mainshocks and aftershocks of the sequence were recorded by the broad-band and strong motion stations of the Hellenic Unified Seismological Network (HUSN; http://eida.gein.noa.gr/ (accessed on 1 December 2021); [38]); moreover, four (4) stations, named as CRE1-4, were installed on 28 September 2021, in the epicentral area by NOA (HL network). The available manually picked, P- and S-wave arrival-time data form a dataset of 1062 events with magnitude ML between 0.5 and 5.8. The local velocity model and the value 1.78 for the Vp/Vs ratio of Delibasis et al. [39] were adopted. The initial location was performed using the HypoInverse algorithm [40]. The applied distance weighting was set to nullify the influence of stations at epicentral distances further than ~100 km. The average absolute location errors reported by HypoInverse were: mean RMS travel-time error 0.14 s, ERH = 0.74 km and ERZ = 0.98 km for horizontal and vertical uncertainties, respectively.
Subsequently, to improve the initial events locations, the double-difference relocation HYPODD [41] procedure was performed. HYPODD determines relative locations within clusters, using a double difference algorithm, developed by [42]. It improves relative location accuracy by strongly reducing the influence of the velocity structure on locations and uncertainties caused by arrival-time reading errors. The algorithm minimizes the double-difference between observed and calculated travel times through iterative weighted least-squares using the conjugate gradients method. The relocation procedure takes into account both waveform cross-correlation and catalogue differential travel-time data to provide an enhanced picture of the seismic activity.
Multiplets were detected, for the closest stations, followed by the calculation of the cross-correlation maximum and time-delay measurements for P-waves, which were used as differential travel-time data input for the double-difference relocation algorithm, HYPODD [41]. Full waveforms were cropped in windows containing both P and S waves, filtered between 0.5 and 6 Hz, and a threshold of 70% was set concerning the waveform coherency. The process mainly implicated two groups and the results were then imported, along with catalogue travel-time data, into the double-difference for the relocation process. The relocation procedure is mainly divided in two stages, the first with stronger a priori weights to the catalogue data and the latter with higher weight to the cross-correlation data, as suggested by [41]. Distance thresholds were applied to ensure that no links were formed between unrelated events within the bigger groups. The velocity model used in the relocation was the same with the model used in the initial location process [39] and 19 stations within 100 km distance were used.
In total, 1056 events were relocated and clustered in two groups (Figure 3); the main cluster (1), oriented NNE-SSW) with 951 events that occurred at the vicinity of the mainshock and a smaller cluster (2), with 95 events, located towards the NE of the cluster (1). The HYPODD final results include the 98% of the initial dataset (absolute cross-correlation root-mean-square: 0.3860 s, absolute catalogue rms: 0.335 s). The relocated hypocentres have an estimated mean rms residual of 4 milliseconds (ms) and the mean location formal uncertainties x, y, z and t were 17.4 m, 19.3 m, 23.4 m and 5.6 ms, respectively. The clustering of the aftershocks is a robust feature of the aftershock sequence, activated in diverse times [2,3].
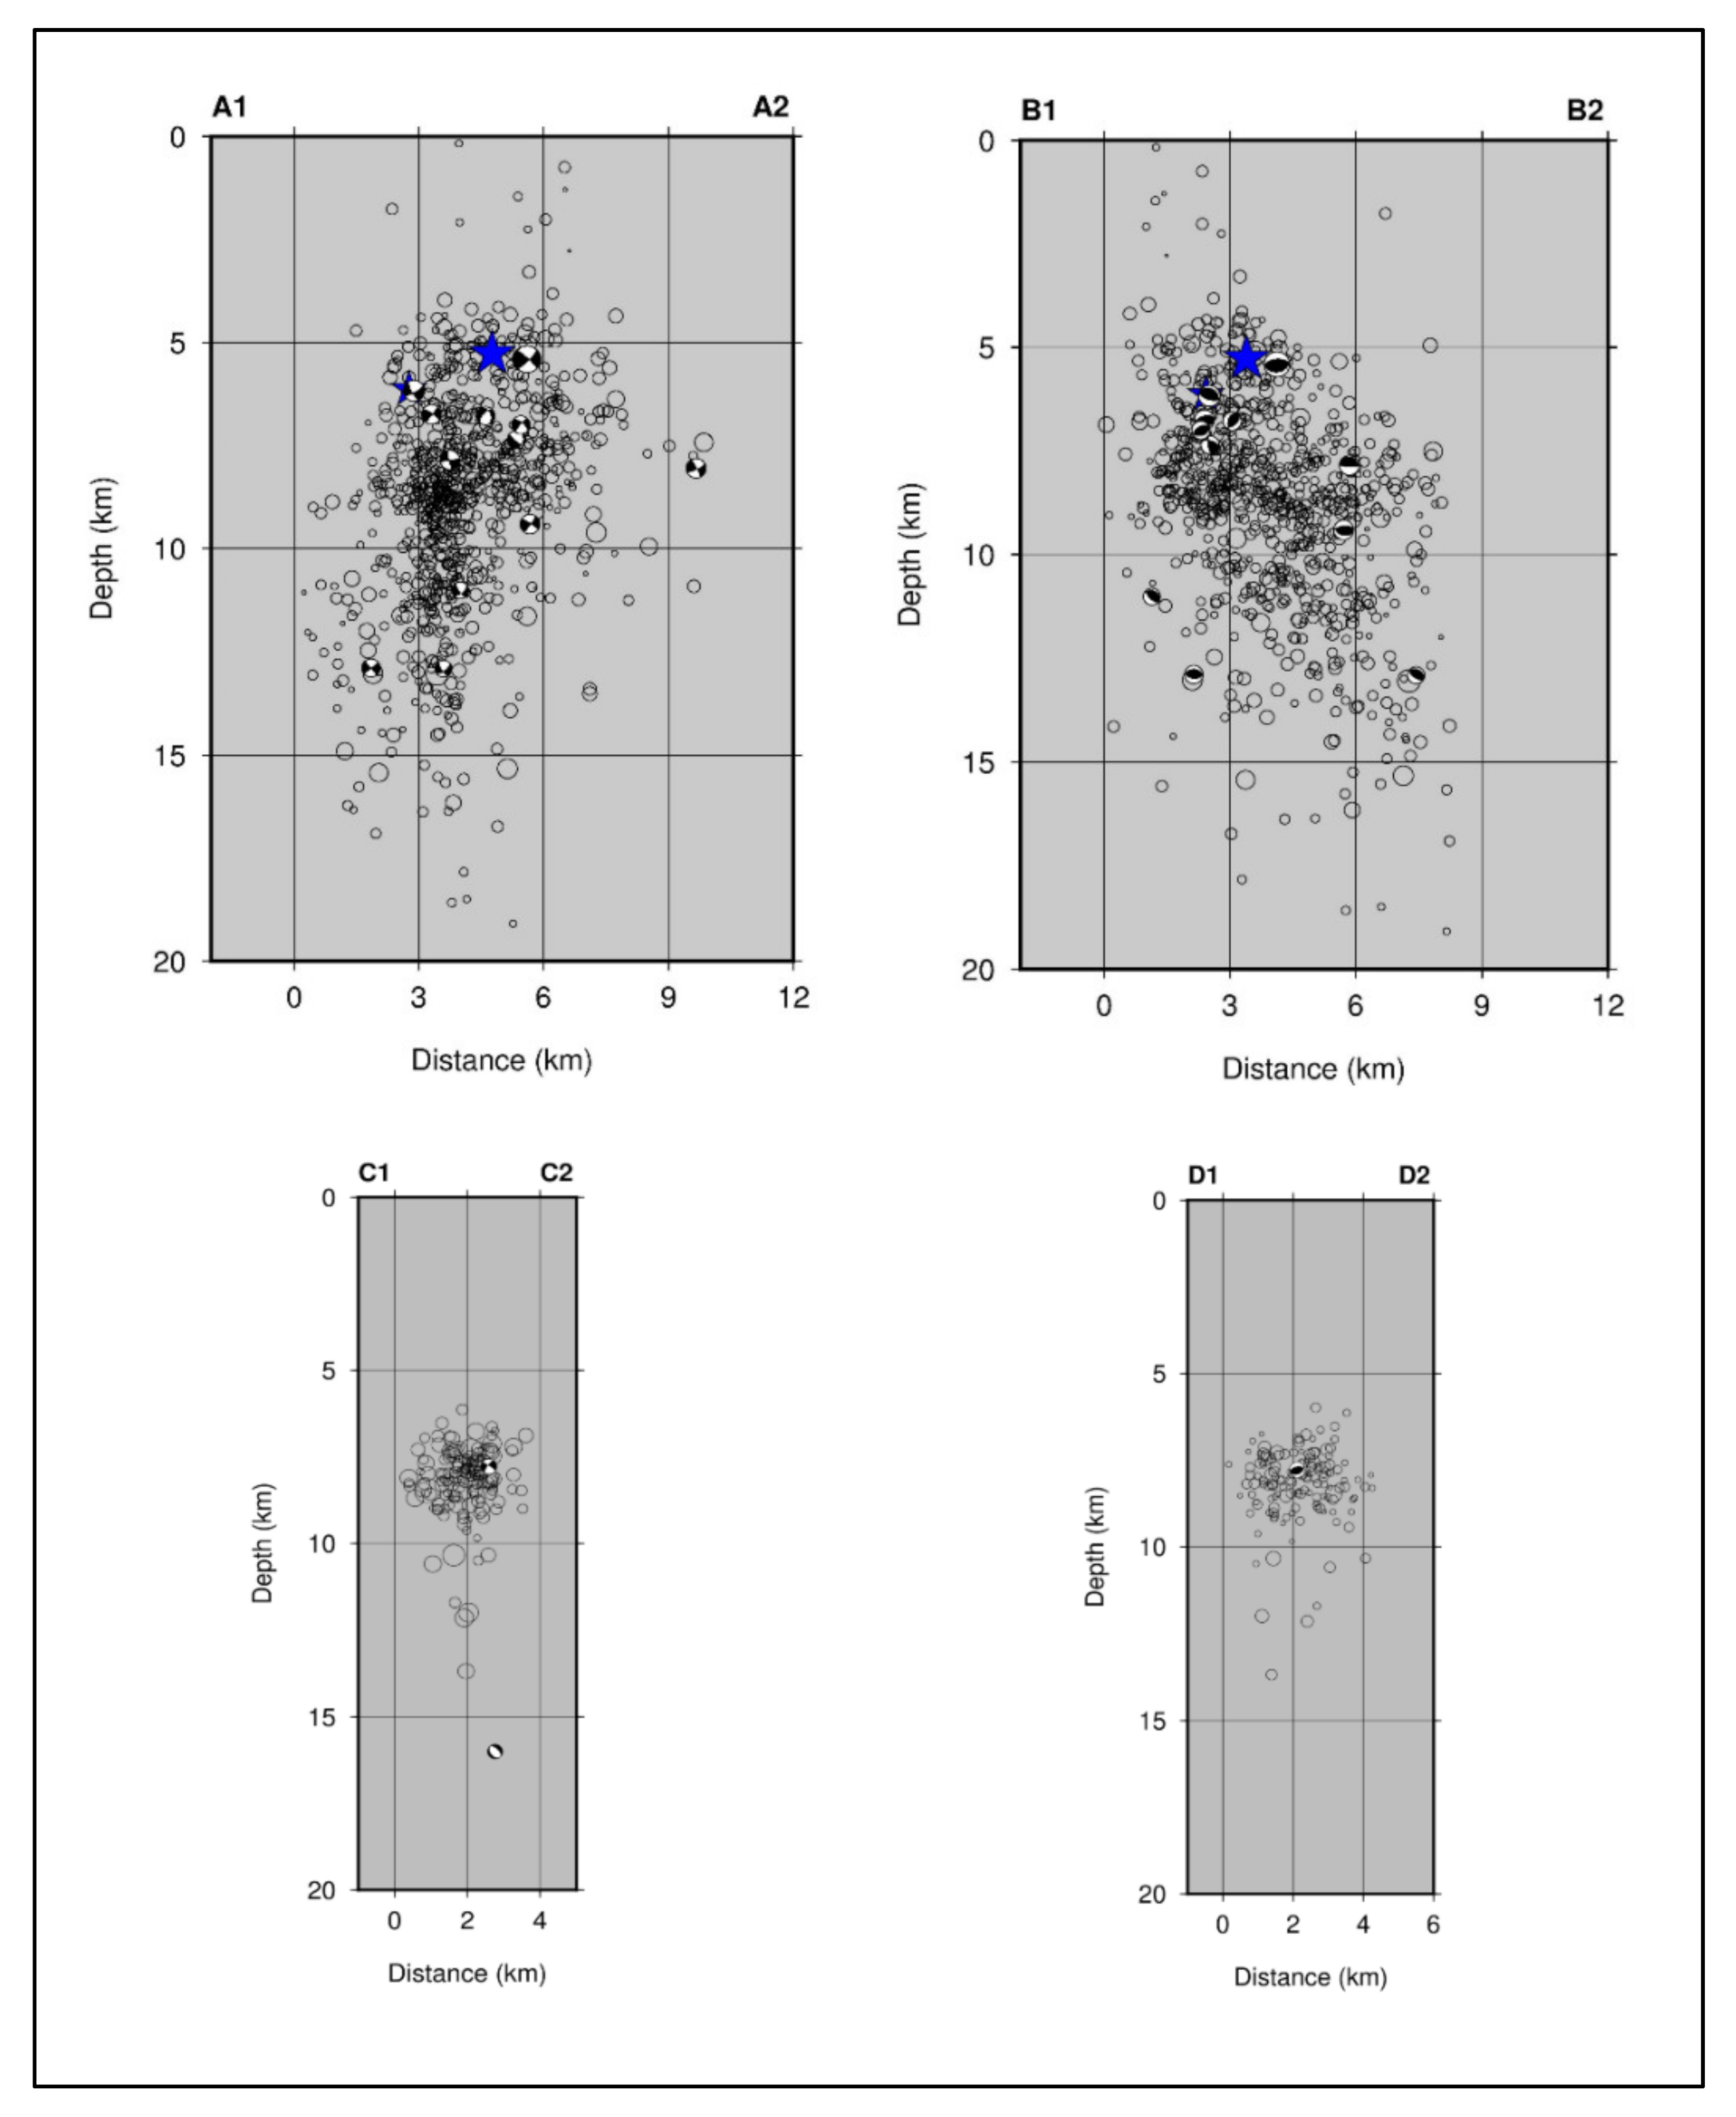
We made four cross-sections, oriented NE-SW and NW-SE in order to examine the geometry of the distribution of events. A NW-SE cross-section through the main cluster shows that the distribution of the hypocentres indicates a NW-dipping structure (cross-Section A1-A2, Figure 3 and Figure 4; as also imaged by [3]). We can infer the position of the fault plane dipping towards northwest between depths 5–15 km. The inferred dip direction is similar to the dip direction of the northwest-dipping nodal plane of the moment tensor solutions of NOA and GFZ (see Table 1; the median value of the northwest plane is 49°). The northern cluster (cross section C1-C2, Figure 3 and Figure 4) was activated at shallower depths (6–10 km;) however, the distribution of the hypocentres is not conclusive on the dip direction of the seismic fault.
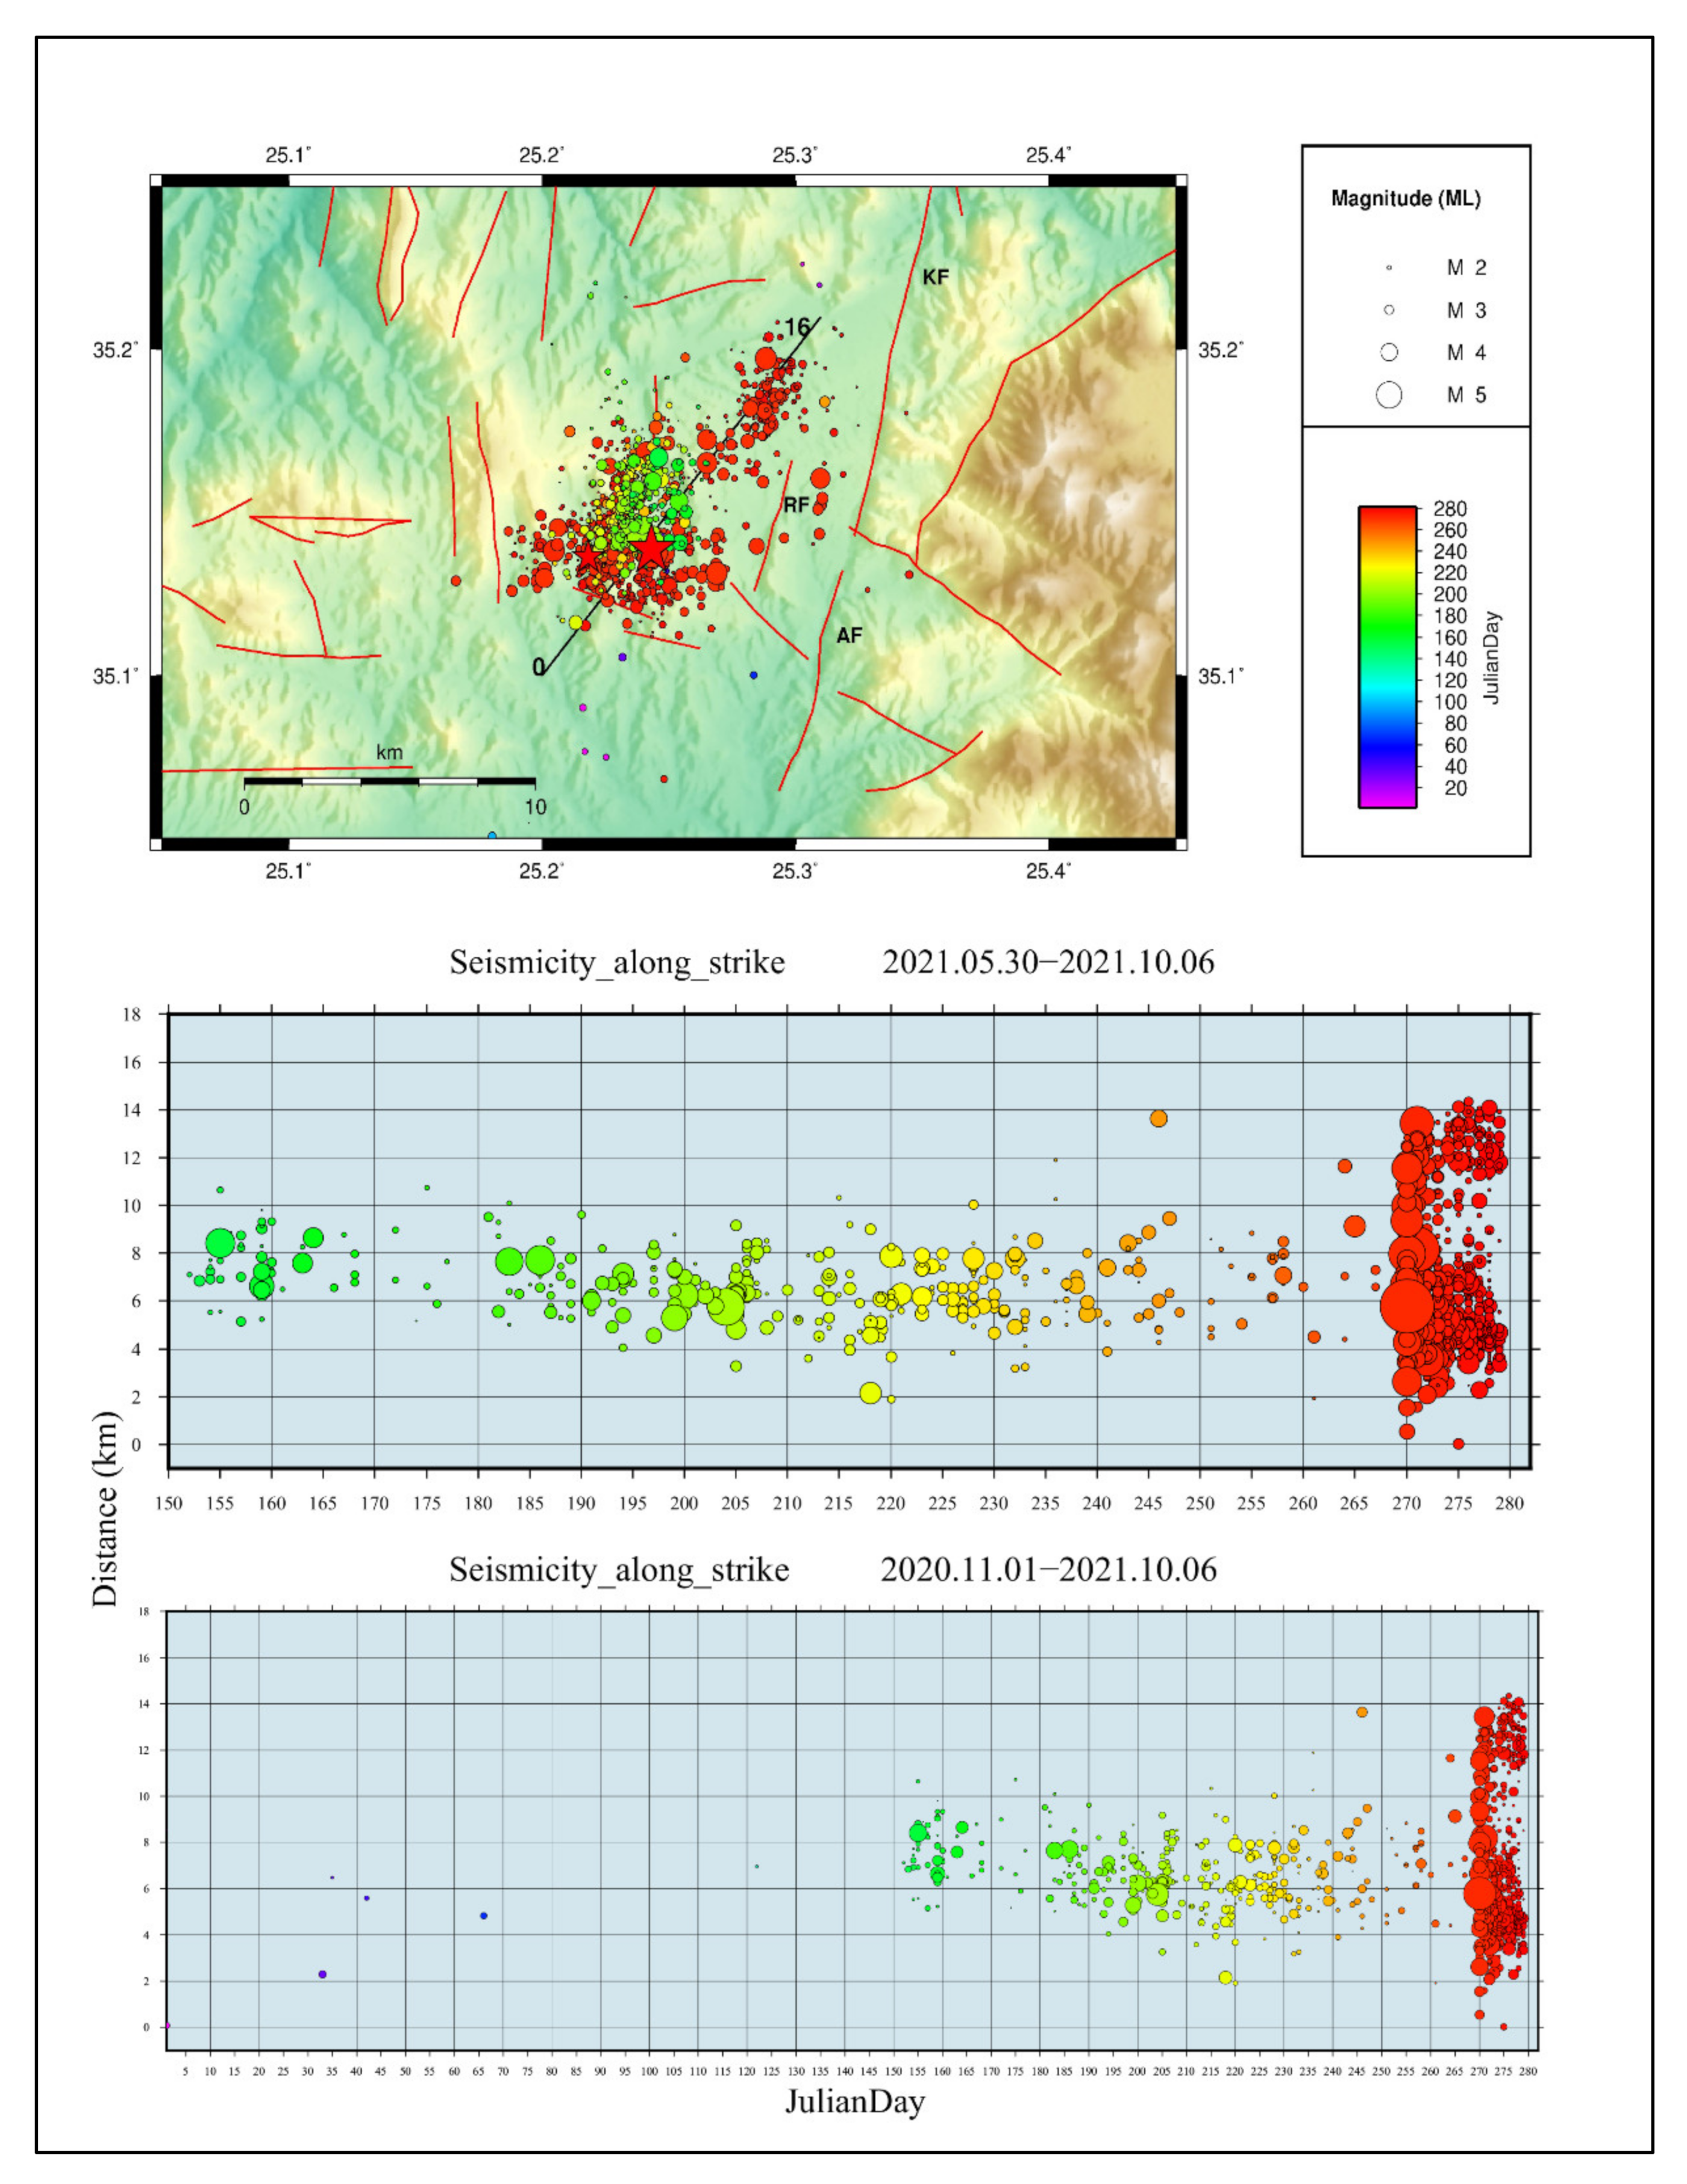
Sparse events had already taken place at the same area since November 2020, while the activity seems to become denser by the end of May 2021 and more intense by the end of June 2021 (Figure 5); a majority of the foreshock events were restricted within the vicinity of the mainshock (±2 km; Figure 5 middle panel). In particular, the May–July 2021 events occurred immediately to the north (± 30°) of the mainshock within a distance of 4 km (Figure 5). The foreshock activity was intense; two earthquakes of magnitude Mw >= 4.0 took place while the largest foreshock (Mw = 4.6) occurred on 24 July 2021. A noticeable pause of seismicity appeared on September 26, 2021, followed by the mainshock during the 27th of September. The aftershock sequence was intense, while twelve of the aftershocks were of magnitude Mw > 4.0; the strongest one (Mw(NOA) = 5.1; ML = 5.3) took place on 28 September 2021, in shallow depth, as well. Another characteristic of the aftershocks’ distribution was the bilateral occurrence of seismic events with respect to the mainshock hypocentre, already during the 27th of September 2021, including a tight cluster 5–10 km towards the NE of the mainshock (Figure 5). During the next few days, it was evident (Figure 5) that the northern cluster remained an isolated feature of the aftershock sequence. Its occurrence is due to either aftershocks occurring at the termination of the rupture or off-fault aftershocks occurring on a neighbouring structure (or even structures), indicating the strong interaction between the faults of the area close to Arkalochori.

3.2. GNSS Data Processing

Dual-frequency data from three (3) permanent (continuously recording) Global Navigation Satellite System (GNSS) stations were processed. We used GNSS observations covering several days before and after the earthquake (Figure 6) in order to obtain position time series and their static offsets due to the earthquake. The sampling interval was 30 s, and the data comprise 24 hr daily files. All station records were complete (rejected epochs 0.00%) and included in our processing, thus providing substantial observations for mapping the co-seismic displacement field. The stations belong to the HxGN SmartNET and Uranus private networks of Greece. The azimuthal distribution of the GNSS stations is very good, extending uniformly around the epicentral area (Figure 1). However, most of the GNSS stations are located more than 20 km away from the epicentre and therefore captured only small displacements of the order of a few mm.
The GNSS data of local continuous stations ARKL, HERA and MOI1 together with the data of four regional continuous stations (BSHM, DYNG, IZMI, MERS) were processed using the GAMIT/GLOBK/TRACK software version 10.71 [43]. The TRACK module is used to process kinematic GPS data. Our TRACK processing uses 30s resolution data from local ARKL, HERA and MOI1 stations. We obtained co-seismic and early post-seismic deformation (hours) only in the nearby ARKL station (Figure 6). The displacements of HERA and MOI1 stations (Figure 1) during the earthquakes were negligibly small. The presented data in Figure 6A–C show ARKL displacements relative to MOI1 station using the TRACK module. We also obtained a daily solution using the GAMIT/GLOBK moduli. GAMIT uses a priori data of satellite and station locations and obtains daily position and baseline solutions. GLOBK combines all data and creates a multi-day time-series solution for the position of stations. Our processing procedure included runs of both GAMIT and GLOBK. Then, outliers were detected and removed from the data. The final sets of locations are obtained with respect to the International Terrestrial Reference Frame 2014 (ITRF2014; [44]).
The only GNSS station located in the near field and showing large displacements is the station ARKL located just above the fault plane (Figure 1). The antenna of this station is located on top of an industrial building south of the village (Figure S3). Figure 6D–F shows the relative displacements of ARKL station days after the earthquake. The offsets indicate cm-size motion along the N, E and Up-down directions. Station ARKL (Figure 6) moved 7 cm to northward and 5 cm eastward. In terms of Up-Down (vertical) displacement, we obtained clear trends of co-seismic motion with amplitude −14.3 cm. The vertical downwards displacement at the GNSS station enhances the robustness of the west-dipping fault model as they allow discrimination between the two conjugate focal planes (see also forward model of Okada-type dislocations; [45]) in Figure S4. Regarding the large aftershock on 28 September. 2021, 04:48 UTC (Mw = 5.1; located 4 km to the W of Arkalochori, Figure 3), we could not find any evidence of this aftershock in the GNSS time series. Furthermore, the GNSS time series of the ARKL station show the existence of a small post-seismic motion (~2 cm of subsidence) following the mainshock with a relaxation period of 75 days (Figure S5). The processing of high-rate 1 s data (Figure S7; Brendan Crowell personal communication) show some motion preceding the co-seismic offset.

3.3. Geodetic Data from Sentinel-1 SAR Interferometry

Synthetic Aperture Radar (SAR) data from different directions are used to explore surface displacements due to the 27 September 2021 central Crete earthquake. SAR data that tightly bracket the earthquake dates were acquired using the Sentinel-1A and 1B satellites (see Table 2) from the European Space Agency (ESA). Sentinel-1A/B satellites operate using C-band (radar wavelength of 56 mm) in the Terrain Observation by Progressive Scan (TOPS) mode, which allows for wide swaths and short repeat intervals. Each TOPS image consists of three sub-swaths, with a total swath width of ∼250 km, providing a complete coverage of the earthquake-struck region from two opposite directions. Image pairs that span the earthquake dates are available from both the ascending and descending satellite orbits. The Sentinel-1 radar remote sensing data was downloaded from the Copernicus Open Access Hub (https://scihub.copernicus.eu/ (accessed on 1 December 2021)) and processed using the Generic Mapping Tools Synthetic Aperture Radar (GMTSAR) package [46]. The topography contribution to the radar phase was calculated and removed using digital elevation data from the Shuttle Radar Topography Mission (SRTM) with 30 m resolution https://www2.jpl.nasa.gov/srtm (accessed on 1 December 2021). Accurate orbital data of the satellites are available via https://qc.sentinel1.eo.esa.int/aux_poeorb/ (accessed on 1 December 2021).
The differential interferograms (unwrapped) are shown in Figure 7A–D, which indicate clear coseismic displacements in line of sight (LOS) caused by the 2021 Arkalochori event. The negative LOS displacement indicates the ground motion away from the satellite. The main deformation zone depicts an elliptical shape with a size of 10 km × 7 km along the NNE-SSW direction (Figure 7A,D). The interferograms indicate a similar main feature of surface subsidence, although their maximum values are different because of their opposing satellite views. The fact that in both LOS imaging geometries the negative vertical component displacement is dominant, this implies a normal-slip event. The rupture may be related to the west-dipping normal fault on the eastern side of the Kastelli graben (see blue line in Figure 7).

4. Inversion for Coseismic Slip Model

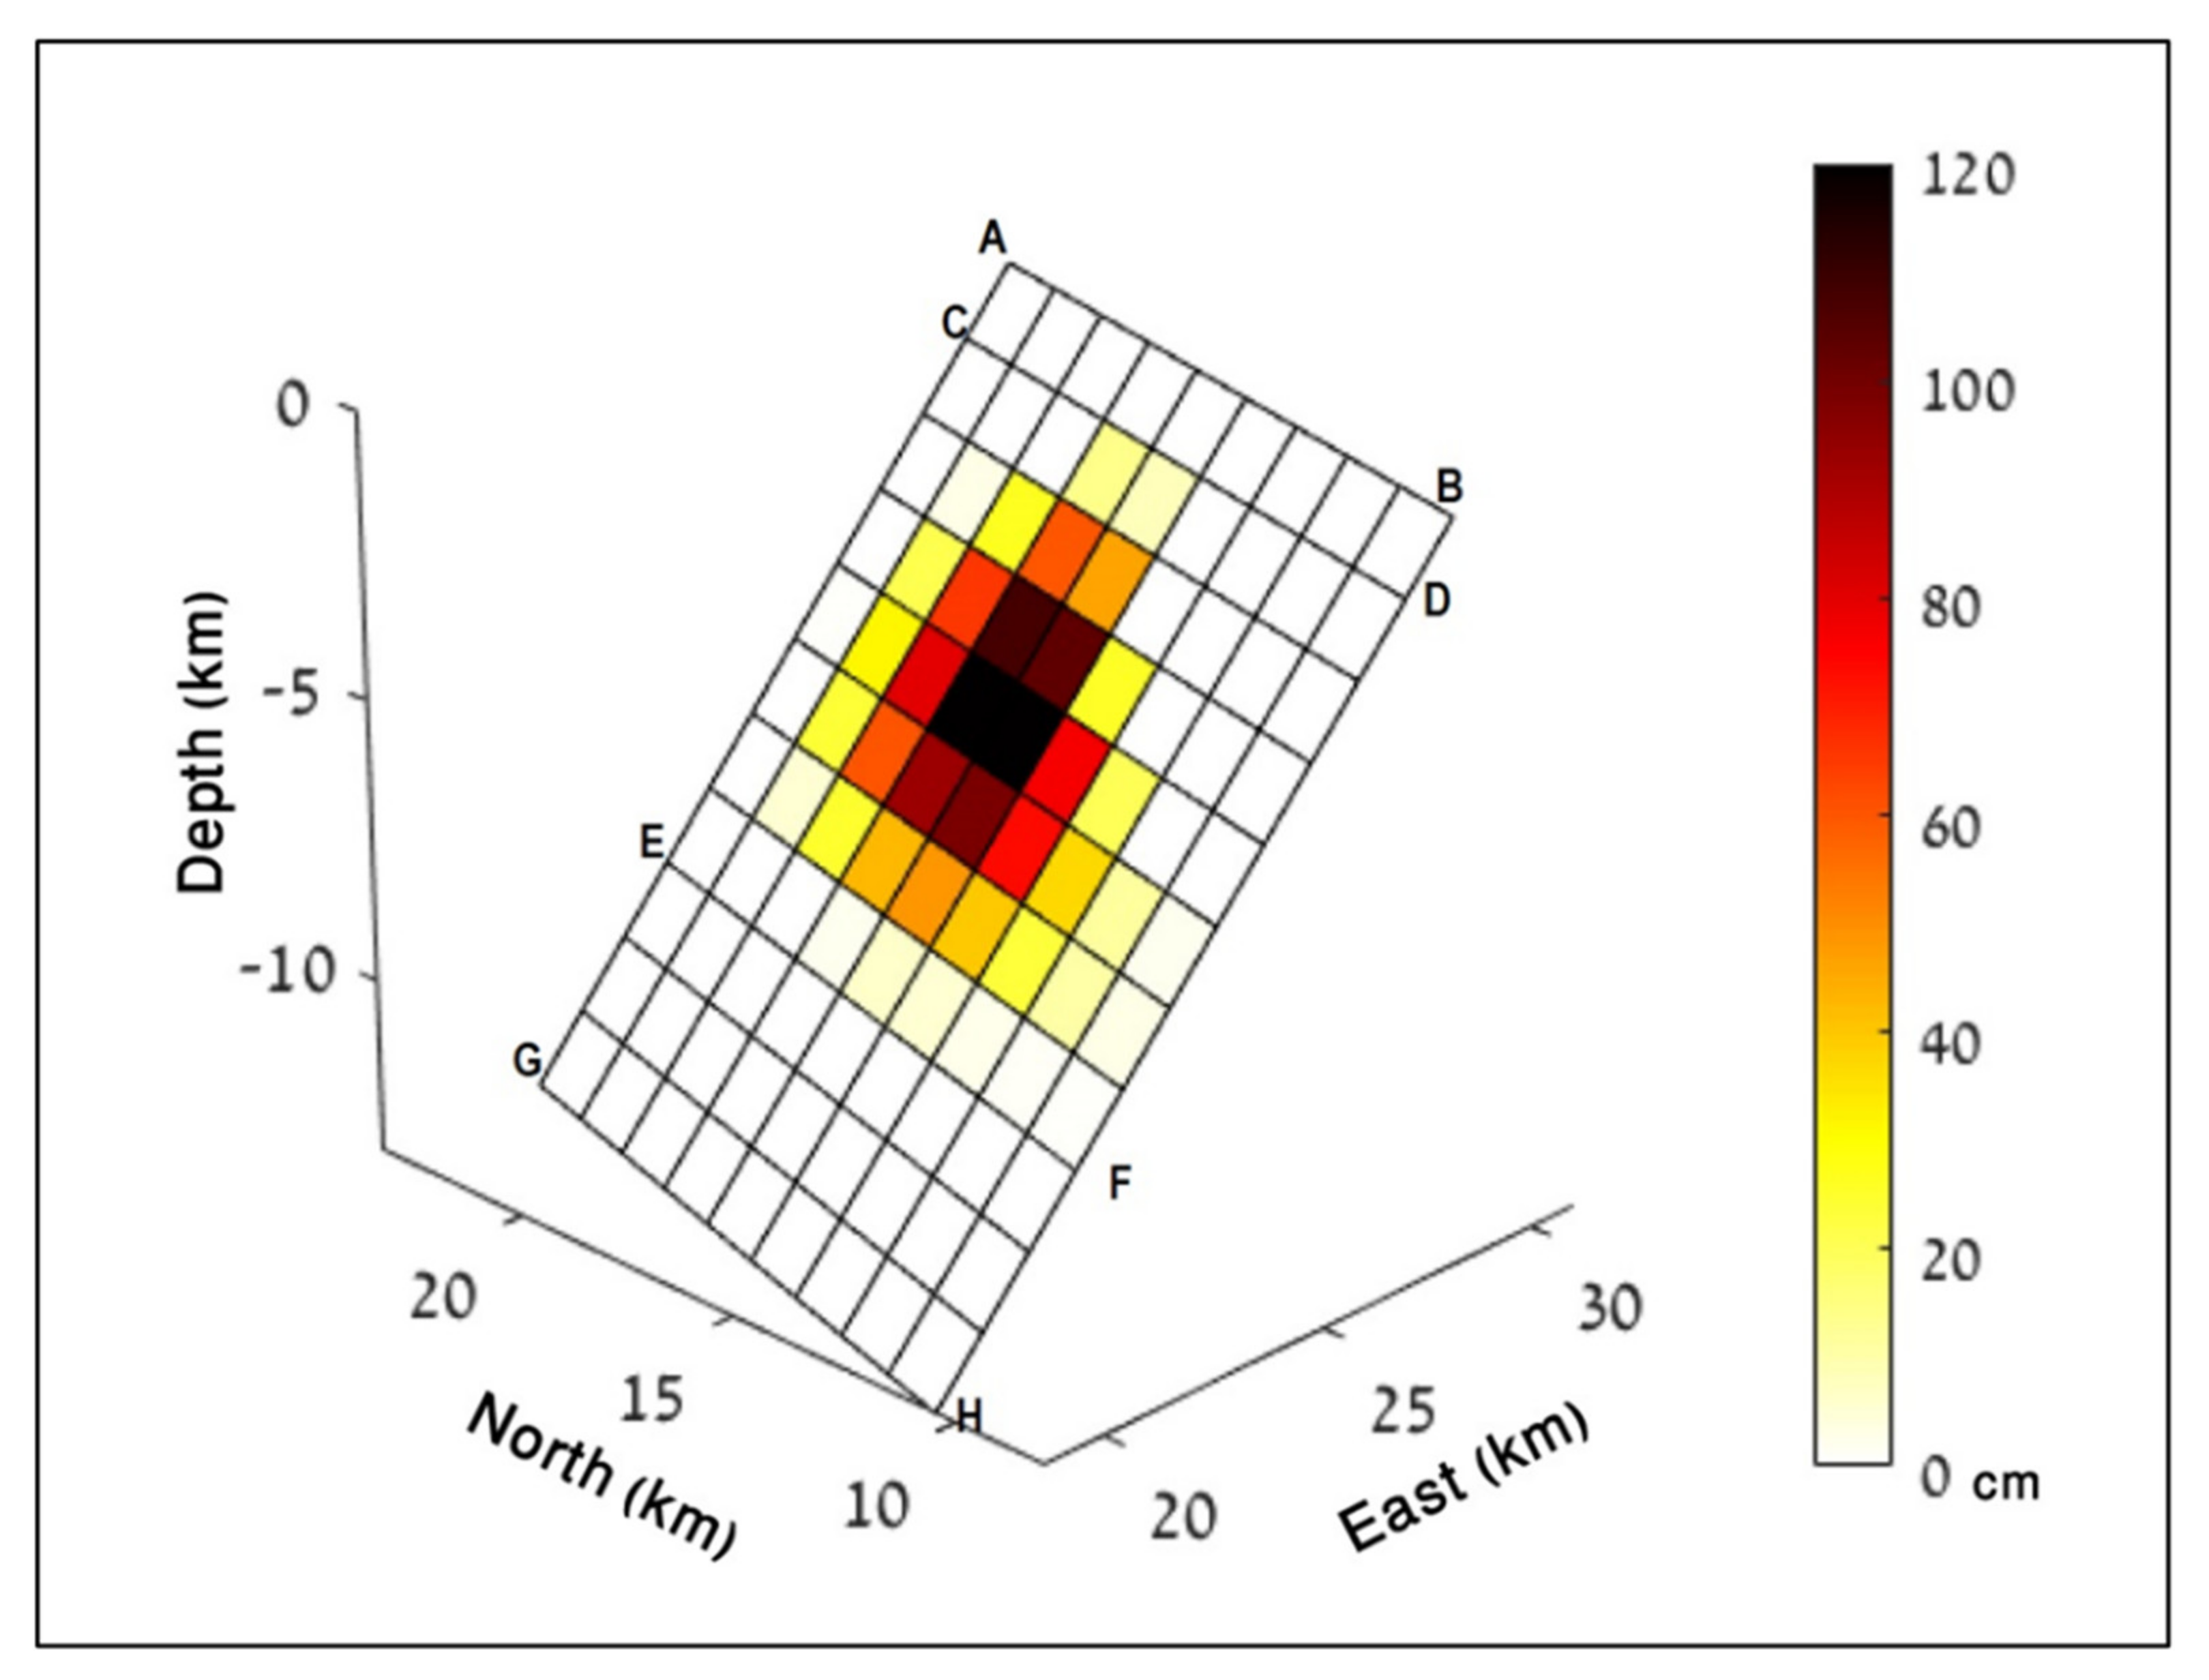
The observed geodetic deformation can be modelled by slip along a rectangular dislocation plane in a homogeneous elastic half-space [45]. To assess the fault slip distribution during the earthquake we performed an integrated inversion model for the coseismic ascending and descending interferograms (Table 2) and displacements of the ARKL GNSS station (Figure 6). The inversions of near-field InSAR data from more than one direction are capable of better resolving shallow slip distribution. The applied inversion scheme [48,49,50] is based on a least-squares minimization of the displacement misfit with iterations for the fault geometry. The initial geometry trace is chosen using the linear phase discontinuities in the wrapped InSAR data. We refined the fault plane geometry by allowing changes in the fault dip, strike and location in order to minimize the data misfit in a least-squares inversion. To account for spatial variations in the slip distribution, the fault plane was subdivided into 1.5 × 1.5 km, constant-slip patches, allowing only normal slip mode throughout the inversion. The slip model was smoothed in order to minimize the slip gradients produced by fault. Finally, we choose the slip model that was the smoothest and with the lowest RMS value.
Our best-fit inversion model (Figure 8) accounts for 97% of the observed deformation from both InSAR interferograms and GNSS data with an RMS value of 1.3 cm (Figure 7). The model indicates coseismic dip-slip displacements during the 27 September 2021, an earthquake on a 13 km length of a fault plane that dips 55° to the west and strike of N195° E. The geometrical characteristics of the modelled fault plane (strike, dip-angle, dip-direction) better fit the moment tensor solutions of NOA/UOA/KOERI (see Table 1, ranging N185° E to N207° E) than those of global networks (GFZ, UGSG etc.). We attribute this difference to the use of regional network data (distances up to 500 km; periods less than 125 s) from the local networks than the use of teleseismic data used by global networks. The strike of the modelled fault N195° E differs by about 20° from the modelled fault of Triantafyllou et al. (2022; N216° E); the reason probably found in the method of geodetic inversion used.
The modelled fault parameters are presented in Table 3. The fault tip is located 1.2 km beneath the surface. Most of the slip is distributed between 1.2 and 10 km depth, with maximum slip of about 1.2 m at 4.9–6.2 km depth. The geodetic inversion results are compatible to the hypocentre of the relocated mainshock (5 km; Figure 4) and the aftershock distribution which is also concentrated in depth up to 10 km (Figure 4). The major slip at a depth of ~5–6 km coincides with a less dense concentration of aftershocks (Figure 4), implying a higher energy release by the mainshock at this depth. We note that the top edge of the modelled fault plane (line AB in Figure 8) aligns with the eastern margin of the Kastelli basin, which is fault-controlled [9,16] (Figure 9). Therefore, our inversion modelling suggests the activation of one normal fault, which may be identified as the west-dipping Avli (or Lagouta) normal fault (fault GR2465 in the NOAFAULTS v4.0 database; [47]; AF in Figure 1; LF in Figure 2), to the south of the Kastelli Fault (KF in Figure 1).
Moreover, the modelled slip above 1.2 km (Figure 8; patches from AC to BD) is negligibly small which indicates that the rupture did not reach the ground surface. The total calculated geodetic moment release is Mo = 1.1 × 10¹⁸ N·m (corresponding to a magnitude Mw = 5.96), which is comparable to the reported seismic moment release of Mw = 5.9 or 6.0 (see Table 1). With the uniform slip model, the fitting model displacement for both orbits and residuals are shown in Figure 7B,C,E,F, respectively). It shows that the model obtained by the inversion fits well with the InSAR data sets, and the residuals are also relatively small. A postseismic interferogram of the image pair 1–13 October 2021 (descending orbit; 3–16 days after the earthquake; Figure S6) shows no detectable signal for surface deformation, thus we conclude that the postseismic surface deformation during the 1–13 October interval is small (less than one fringe) compared to the coseismic signal. This result was confirmed by the small postseismic motion detected in the GNSS time series of station ARKL (see Figure S5).

5. Discussion

5.1. The Arkalochori Rupture Characteristics

The obtained slip distribution of the mainshock from the inversion of the geodetic data can be visualised in relation to the distribution of relocated aftershocks and the location of the hypocentre of the mainshock (Figure 9). The aftershock data are plotted in the perimeter of the mainshock slip patches carrying the largest amount of slip, at depths larger than 4–5 km (the NE cluster is deeper than 6 km, see cross-section C1-C2 in Figure 4). Thus, the aftershock pattern is arranged around the main rupture area (see red and brown patches in Figure 9) while most aftershocks occurred mostly down-dip of the slip patches (at depths larger than 8 km). In particular, we observe that at depths of 3–6 km there is a seismicity gap that extends about 5 km in the N-S direction, i.e., along strike (Figure 9). This gap may be due to the complete rupture of the main asperity along the fault plane and subsequent aftershock activity triggering around the co-seismic slip patches (e.g., [51,52,53,54,55]). In addition, a small post-seismic deformation (~2 cm on the vertical component) was detected on the GNSS data (Figure S5) but not on InSAR images (Figure S6). The small post-seismic signal may be due to afterslip along the fault plane and not to a gravitational instability of the ground hosting the GNSS antenna. Unfortunately, we do not have additional GNSS data to model the post-seismic deformation and related afterslip.
Given the shallow depth of the hypocentre (~5 km; Figure 4) in relation to (a) the earthquake magnitude (M5.9) (b) the high dip-angle of the fault, well-constraint by geodetic data (55°; 53° obtained by [2]) and (c) the shallow depth of the main slip patch (~5 km; Figure 8) it was reasonable to expect that surface ruptures could be found in the area towards the east of Arkalochori, near the villages Avli and Nipiditos (Figure 9 and Figure 10; allowing for small uncertainties in the intersection of the seismic fault with the Earth’s surface). However, our field surveys around Arkalochori Kastelli, and Nipiditos (Figure 10) did not show any evidence of tectonic ruptures, i.e., formation of fresh scarps with normal step in colluvium along the mountain front or reactivation of limestone scarps such as those found in several shallow events in Greece, e.g., in Thessaloniki 1978 [56], Pissia—Kaparelli in 1981 [57], in Kalamata (1986; [58]), in Atalanti (1894; [59]) etc. Instead, we found a lot of secondary cracks (both on natural and artificial surfaces, i.e., tarmac roads) and rock-falls due to the strong ground motion. This lack of shallow coseismic slip on the fault plane (uppermost 1–2 km) may be due to velocity-strengthening fault frictional characteristics [60,61] of the fault plane as it emerges towards the Earth’s surface. A decrease in the fault offsets toward the Earth’s surface is likely caused by an increased frictional resistance of the shallow layers to rapid coseismic slip that allows it to arrest the rupture. This is not always the case, off course, as there are numerous examples of tectonic surface breaks along normal faults [56,57,58,59,62,63,64] which indicates the influence of other factors, among them most important the size (magnitude) of the event related to the amount of elastic strain accumulation over the geological time.
In relation to previous studies on this event we note that [2] used geodetic data inversion (only InSAR) and catalogue events for their analysis as opposed to our data (InSAR, GNSS and relocated events). As a conclusion, they obtained a double-fault structure with listric geometry (their Figure 12) which is not supported by our findings (one planar fault; Figure 9). The study by [3] used geological data and seismicity relocation to model the seismic fault. They processed InSAR data, but they did not invert the geodetic data set. In this way, they obtained a NW-dipping fault plane imaged at depths of 5–12 km (their Figure 10), i.e., deeper than our geodetic inversion fault model (1–7 km).
Ground and road cracks/fractures were observed in the field in two clusters mainly: one located near Nipiditos village (Figure 10) and one along the highway south of Arkalochori. Note that the Nipiditos cluster is found close to the projected intersection of the seismic fault with the ground surface (see blue line in Figure 10). At one locality we observed an open fracture, oriented N-S with a length of 27 m, but no shear displacement along it (Figure 11a). It is likely that it is related to strong ground motion that caused “spreading” of the uppermost soil layers. This is also observed in the descending co-seismic interferogram (Figure S7a) where it is shown to occur also in the footwall of the Avli-Lagouta Fault. The second cluster (near Kalo Chorio in Figure 10 and Figure 11c) is probably related to triggered secondary slip [65] along a series of small faults occurring on the hanging wall of the seismic fault (Figure 11d), clearly observable on both interferograms (Figure S7b). Triggered shallow slip (TSS) traces (black dashed lines in Figure S7a are visible as discontinuities in both descending and ascending track phase interferograms (Figure S7a–c). Moreover, landslide locations were mapped in the field (west of Arkalochori) and by comparing pre- and post-event Sentinel-2 optical imagery (image dates 19 September 2021 and 29 September 2021), by tracing the changes in land cover between the two dates. Moreover, at both co-seismic interferograms (ascending & descending), we mapped several distinct surficial deformation areas (see red polygons in Figure 10) with small or incoherent displacement signals. These areas are interpreted as minor surficial displacement of triggered pre-existing large landslides, and in some locations may be linked to deep-seated gravitational displacements (DSGD) [53,66].

5.2. Normal Fault Segmentation and the 27 September 2021 Rupture

We identified the seismic fault as mostly rupturing the southern segment of the Kastelli Fault Zone (KFZ; Figure 9 and Figure 10), so it is of interest to look at the geometric relation of the earthquake rupture to the long-term (neotectonic) geological structures. To map relief due to cumulative offsets along the Kastelli Fault Zone, we used the Copernicus GLO-30 Digital Elevation Model (DEM) with 30 m resolution https://spacedata.copernicus.eu/web/cscda/dataset-details?articleId=394198 (accessed on 1 December 2021). Footwall topography can be used as a proxy for fault throw distribution [67,68,69] and the distribution of the fault throw along the strike may be indicative of the maturity of a fault [59,69]. The Kastelli (“Agnos-Avli”) fault Zone shows geomorphic evidence for recent activity, such as prominent range-front escarpments, V-shaped valleys, triangular facets, and axial drainage (Figure 10 and Figure 11e). In terms of footwall topography shape, which is commonly used as a criterion for fault segmentation [59,67,69], the KFZ comprises two segments, the northern (Kastelli) segment and the southern Avli-Lagouta segment (Figure 10). The Kastelli (also known as Agnos) Fault is an 11 km-long normal fault, west-dipping, with most relief (~200 m) developed towards its terminations (Figure 11b,e and Figure 12). The hanging wall topography increases systematically from North to South. The northern termination of Agnos F. may be associated with an NNS-SSW cluster of microseismicity recorded by a local network in Delibasis et al. ([39]; south of Gouves, see Figure 1). The southern Avli (Lagouta) segment is also of similar length (~12 km), but with less relief (~150 m; Figure 12). Both footwall and hanging wall topography diminish toward its southern termination. The structural boundary between the two segments is marked by the change in the direction of axial drainage on either side of the village of Agia Paraskevi (Figure 10). Given that the depth to bedrock exceeds 350 m in the Kastelli basin (I. Bouloukakis, pers. commun.) we could assume a throw of ~500 ± 100 m for the main part of the Kastelli Fault zone (Figure 12) accumulated over Late Pliocene—Quaternary times (~3 Ma). These displacement data (assuming a 50-degree dip angle of the fault plane) yield an average slip rate between 0.17–0.26 mm/yr for the Kasteli fault, thus similar to the active faults of central Greece ([59,70,71]). The estimated slip rate is close to the post-glacial rate estimated by Nicol et al. ([16]; 0.21 mm/yr) for KFZ which implies that slip rates did not change much over the Quaternary. Incidentally, this result matches the observation by Robertson et al. [15] that uplift rates in couth-central Crete were constant throughout Quaternary. Furthermore, the KFZ 0.17–0.26 mm/yr rate is in the same order with the slip rate estimate by Caputo et al. [13,29] (0.5 mm/yr) of the normal fault in the footwall of the KFZ (Geraki fault; see GFZ in Figure 2). It is reasonable to suggest that KFZ is the main NNE-SSW structure now in central Crete and accommodates most of the accumulated elastic strain. It seems that the Geraki Fault zone becomes progressively inactive with late Quaternary slip rates less than KFZ; GFZ is now located on the footwall of KFZ (Figure 1 and Figure 2) without almost any syn-rift deposits occurring along its trace [9].
The 27 September. 2021 rupture extent (Figure 9) indicates that the structural boundary along KFZ (hanging wall high; Figure 12) was breached. The co-seismic slip attained its highest value west of Nipiditos where both the footwall and hanging wall have their highest elevations. It follows that the KFZ and the NW-SE-striking Nipiditos fault (Figure 2 and Figure 9) do not intersect as suggested by [2]. The coseismic slip continued to the north of the village of Agia Paraskevi (Figure 9 and Figure 10), where long-term geomorphology shows drainage towards the north and west. The rupture caused permanent offsets of the NOA campaign GNSS point AS15 (Figure S8; see Figure 1 for location) that is located near the projected intersection of the modelled rupture with the free surface. Therefore, we suggest that the 23 km-long KFZ comprises a single fault segment that hosts overlapping ruptures. To find a pattern in the seismic behaviour of KFZ, we need more data (trenching or 36CL cosmogenic dating of fault scarps, e.g., [64,72,73]). The size of the 2021 rupture indicates the existence of a locked 10 km patch of the KFZ, towards the north (Agnos; Figure 1) which was loaded with tectonic stress following the Arkalochori event. It is well known that earthquakes with a strong or moderate moment magnitude size (Mw > 5.8) transfer static stresses upon other fault segments which are located near the main shock [52,53,74,75] thus changing recurrence intervals by modifying times to failure (advancing or delaying).
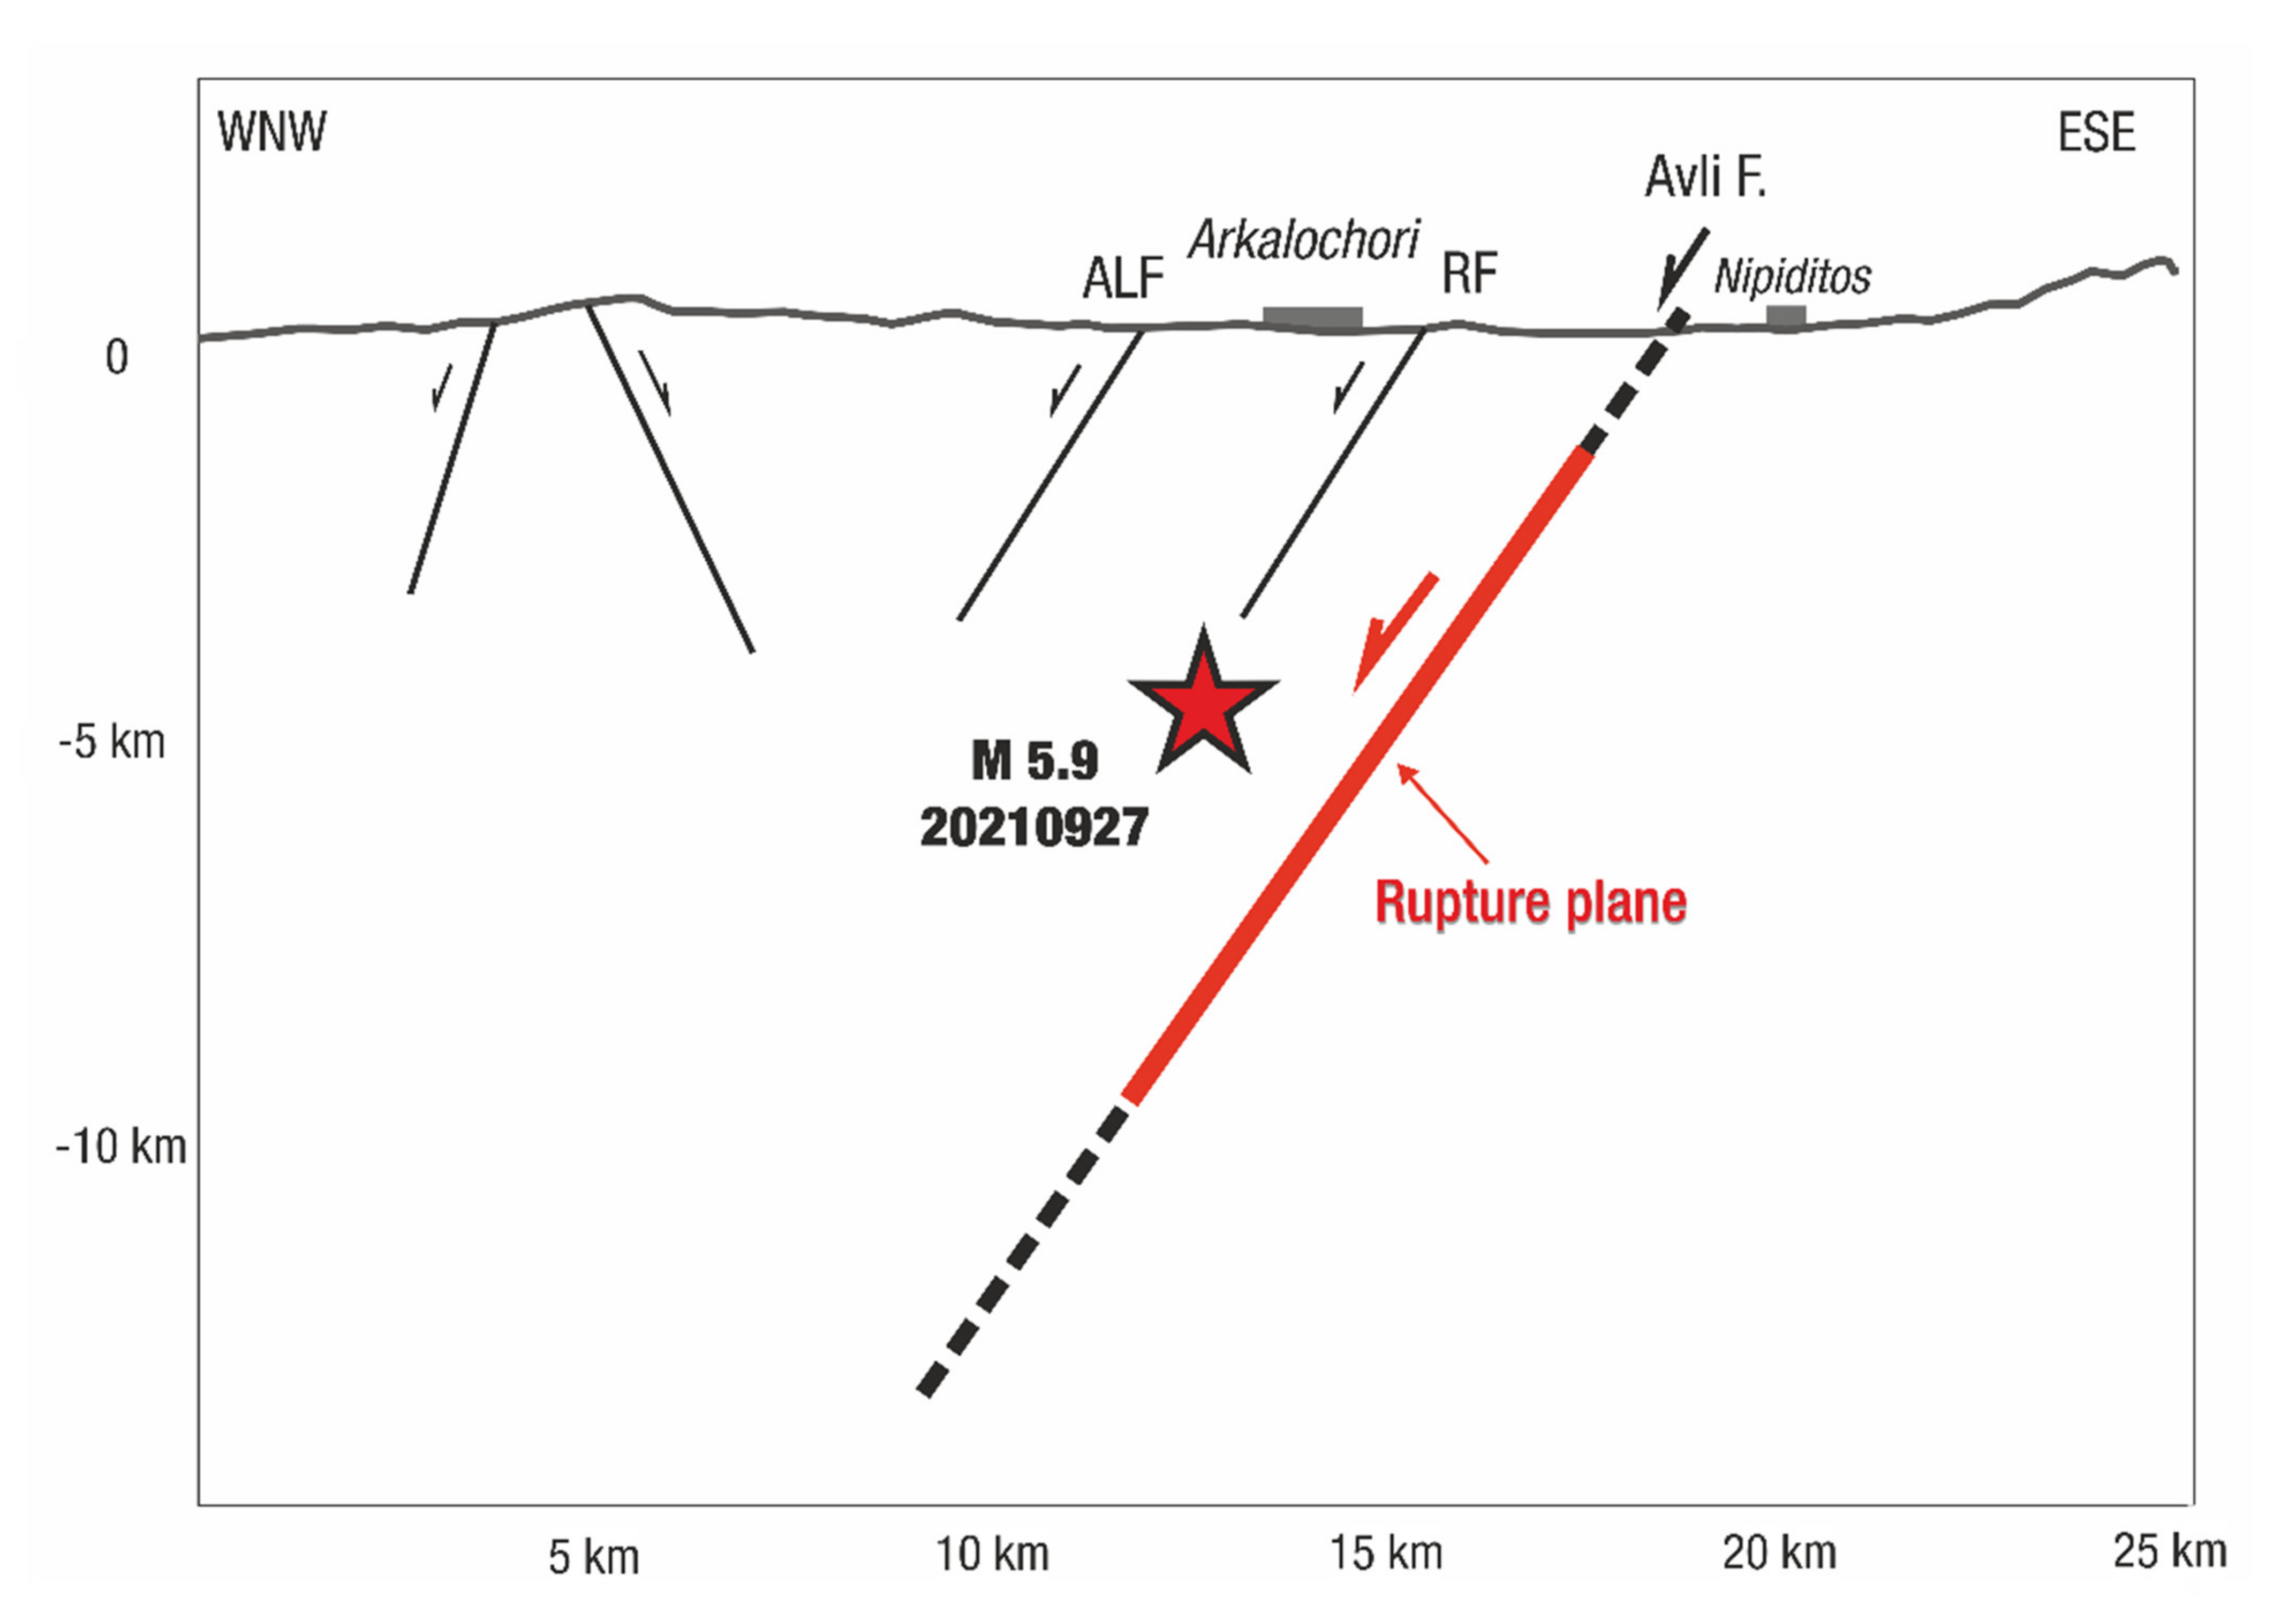
The strike-orthogonal distribution of the 2021 co-seismic displacement as seen in the cross-section (Figure 13) does not indicate a relation with long-term topography, as well. This happened because all coseismic deformation occurred on the hanging wall of Avli-Lagouta Fault (Figure 14). The displacement profile is skewed towards east, as expected since the fault dip-direction is towards the west. The surface projection of the modelled fault fits well with the Avli fault segment of the Kastelli Fault Zone, outcropping west of the village of Nipiditos (Figure 11e). The modelled ground deformation also fits well with the Plio-Pleistocene basin located east of Arkalochori (Figure 2). To match the top of the modelled fault (1.2 km beneath the surface) with the scarp of the Avli fault, in the vicinity of the village of Nipiditos, requires a dip angle of ~55° throughout the upper crust of central Crete, in agreement with the modelled fault plane (Figure 8 and Figure 9) and cancelling the need for listric geometries updip the hypocentre as implied by [2,3]. It also requires a small (~1 km) shift in location of the relocated mainshock towards east, which is an offset feature that we have seen in several earthquake sequences in Greece (e.g., [53,76]) likely caused by heterogeneities in the crustal structure not captured by the 1-D velocity model.
The Arkalochori earthquake along the Kastelli Fault Zone highlights the nearly arc-parallel (E-W to WNW-ESE) extension of the Heraklion basin in central Crete as opposed to the neighbouring E-W Messara basin, to the south (Figure 2). The Messara basin was formed due to N-S extension [10] which is active today further east [15,16,18]. However, the extension direction also switches NW-SE eastwards, on-shore Crete [3,7,8,9,13,14,16,24,26,27,29,58,64] highly oblique to the subduction direction (N5° W; [77,78]). Therefore, despite its proximity to the subduction front, Crete is deforming by extension along shallow normal faults of almost orthogonal orientations (N195° E in Arkalochori; East-west in Messara and along the south coast; [9,15,64,78]). The cause of the block-like onshore extension of Crete is the mechanical response of the brittle Aegean crust, which is quickly overriding a nearly stalled Nubian (African) subducting plate with a funnel shape [77].

5.3. The Relative Value of InSAR vs. GNSS Observations

Nowadays, InSAR technology is mature and provides reliable, spatially dense information on coseismic & postseismic displacements after shallow earthquakes [49,50,53,55,79,80,81,82,83,84,85,86,87,88]. What is evident with InSAR, when the quality is very high, as is the case over Arkalochori, is that the InSAR-based displacement of proximal campaign GPS stations (such as AS15; Figure 1) is nearly as accurate as GNSS measurements in the field. The added value of campaign GPS after events is almost zero when high-quality interferograms exists (which is not always the case, especially when the events are offshore such as the 2017 Kos earthquake; [52]). Moreover, fieldwork costs time and money. So, why do we need to make campaign GPS observations there while InSAR allows us to map ground displacements with an accuracy comparable to what we can achieve with GPS in the field?
If we want to make new contributions on earthquake rupture mechanics, what is important is to deploy GPS stations quickly after earthquakes (within the first few hours) in the near field of the epicentre area, and when possible, place instruments even in advance of peculiar seismic crises starting, as it was the case around Arkalochori since June 2021 and even earlier ([1,2,3]; see earthquake time-series in Figure 5). This will allow us to monitor the dynamics of the ground deformation immediately after earthquakes (and sometimes before), capture the postseismic deformation earlier and better understand how the stress/strain migrates during aftershocks sequences, especially when large aftershocks occur in the days/weeks following the first main shock.
Certainly, GPS observations are useful or needed before and after earthquakes in the near field of earthquakes, for example to assess the secular deformations (see [23,52,76,79]) but when they are outperformed by InSAR for the assessment of the co-seismic displacement, the motivation for performing those measurements must be established. We believe there is a real value in the assessment of the secular deformations; therefore, the selection of the GPS points, their direct connection to the bedrock, their long-term stability and preservation over decades, if not centuries, should be central in the design of the benchmarks and their maintenance. This need makes it necessary to apply very strict rules for the design, observation and maintenance of geodetic networks tailored for the long and very long term. This approach could be central to the way of thinking inside Geophysical Observatories in particular because both short-term and long-term observation is their mission.

6. Conclusions

  • The 27 September 2021 M5.9 earthquake produced significant ground deformation in the vicinity of the village of Arkalochori, but no surface ruptures of primary (tectonic) origin.
  • The distribution of the relocated aftershocks revealed a west-dipping fault with activity limited to depth up to 12 km. The clustering of aftershocks indicates that another shallow structure or a neighbouring segment of the same fault zone was activated right after the occurrence of the mainshock, to the NE of the rupture.
  • We used geodetic data (InSAR & GNSS) to derive a finite fault model. The along-strike averaged coseismic slip has a maximum at depth of 4–6 km, with a maximum amplitude of 1.2 m.
  • The geodetic moment of this earthquake was found in the order of 1.1 × 10¹⁸ N·m, which corresponds to an earthquake moment magnitude Mw = 5.96.
  • Our data (seismological and geodetic) support the activation of a 13 km-long planar fault striking N195° E and dipping 55° towards WNW which intersects the free surface along the mountain front of the Kastelli basin.
  • The seismic fault may be identified with the neotectonic Avli Fault segment (AF) of the NNE-SSW striking, west-dipping, 23 km-long Kastelli Fault zone (KFZ). Part of the rupture propagated along the Kastelli Fault segment (KF) indicating a possible fault segment linkage and, therefore, a history of overlapping ruptures along the KFZ.
  • Based on geological data and footwall topography, we estimate an average Quaternary slip rate between 0.17–0.26 mm/yr for the KFZ.
  • We found no tectonic surface breaks. The decrease in the fault offsets toward the Earth’s surface is likely caused by an increased frictional resistance of the shallow layer to rapid coseismic slip.
  • Satellite observations made in the first month after the earthquake detected no post-seismic deformation (i.e., below one fringe or 2.8 cm) but the GNSS station ARKL recorded a 2 cm postseismic motion with a relaxation period of 75 days.

Supplementary Materials

The following supporting information can be downloaded at: https://www.mdpi.com/article/10.3390/geosciences12060220/s1, Figures S1–S8 Arkalochori Supplementary Data. Tables S1 and S2 Arkalochori Supplementary Data.

Author Contributions

Conceptualization, A.G.; Data curation, A.S., O.P. and V.T.; Formal analysis, Y.H., A.S., P.B. and O.P.; Investigation, A.G., P.B., S.V., C.F., H.K., V.T., I.K., P.E. and E.V.; Methodology, A.G. and C.F.; Software, Y.H., A.S., P.B., O.P., V.T. and P.E.; Validation, A.G., S.V., C.F. and I.K.; Visualization, S.V., I.K. and P.E.; Writing—original draft, A.G., Y.H., A.S., I.K. and E.V.; Writing—review & editing, A.G. All authors have read and agreed to the published version of the manuscript.

Funding

This research received no external funding.

Data Availability Statement

All data products generated in this study (earthquake catalogues, InSAR images, GNSS time series) is available from the authors upon request.

Acknowledgments

We thank three anonymous reviewers for constructive reviews. We are indebted to ESA and Copernicus for providing access to SAR images. We thank Efthimios Lekkas, Efthimios Sokos, Brendan Crowell, George Papathanassiou, Iraklis Bouloukakis, Thekla Thoma, Ilektra Karasante and Haralambos Gouvas for comments and discussions. GNSS data were provided by NOANET, HxGN Smartnet, and Uranus networks. We are indebted to the local authorities for their help. We used data from the following seismic networks, HL (Institute of Geodynamics, National Observatory of Athens, doi: 10.7914/SN/HL), HP (University of Patras, doi: 10.7914/SN/HP), HT (Aristotle University of Thessaloniki, doi: 10.7914/SN/HT), HA (National and Kapodistrian University of Athens, doi: 10.7914/SN/HA), HC (Seismological Network of Crete, doi:10.7914/SN/HC) and HI Institute of Engineering Seismology and Earthquake Engineering, doi: 10.7914/SN/HI) networks. Several figures were created by use of GMT (Wessel et al. 2019, [89]).

Conflicts of Interest

The authors declare no conflict of interest.

References

  1. Vallianatos, F.; Michas, G.; Hloupis, G.; Chatzopoulos, G. The Evolution of Preseismic Patterns Related to the Central Crete (Mw6.0) Strong Earthquake on 27 September 2021 Revealed by Multiresolution Wavelets and Natural Time Analysis. Geosciences 2022, 12, 33. [Google Scholar] [CrossRef]
  2. Triantafyllou, I.; Karavias, A.; Koukouvelas, I.; Papadopoulos, G.A.; Parcharidis, I. The Crete Isl. (Greece) Mw6.0 Earthquake of 27 September 2021: Expecting the Unexpected. Geo Hazards 2022, 3, 6. [Google Scholar] [CrossRef]
  3. Vassilakis, E.; Kaviris, G.; Kapetanidis, V.; Papageorgiou, E.; Foumelis, M.; Konsolaki, A.; Petrakis, S.; Evangelidis, C.P.; Alexopoulos, J.; Karastathis, V.; et al. The 27 September 2021 Earthquake in Central Crete (Greece)—Detailed Analysis of the Earthquake Sequence and Indications for Contemporary Arc-Parallel Extension to the Hellenic Arc. Appl. Sci. 2022, 12, 2815. [Google Scholar] [CrossRef]
  4. Karakostas, C.; Lekidis, V.; Makra, K.; Margaris, B.; Morfidis, K.; Papaioannou, C.; Petala, Z.; Rovithis, E.; Salonikios, T.; Theodoulidis, N. OΙ ΣΕΙΣΜOΙ ΤOΥ AΡΚAΛOΧΩΡΙOΥ-Μ6.0, 27 Σεπτεμβρίου 2021 και Μ5.3, 28 Σεπτεμβρίου 2021. Προκαταρκτική έκθεση. Zenodo 2021. [Google Scholar] [CrossRef]
  5. Papadopoulos, G.A. A Seismic History of Crete: Earthquakes and Tsunamis, 2000 B.C.–A.D. 2010, 1st ed.; Ocelotos Publ.: Athens, Greece, 2011; p. 415. ISBN 978-960-9499-68-2. [Google Scholar]
  6. Papadopoulos, G.A. Earthquake sources and seismotectonics in the area of Crete. In Minoan Earthquakes-Breaking the Myth through Interdisciplinarity, 1st ed.; Jusseret, S., Sintubin, M., Eds.; Leuven University Press: Leuven, Belgium, 2017; pp. 165–190. [Google Scholar]
  7. Angelier, J.; Lyberis, N.; Le Pichon, X.; Barrier, E.; Huchon, P. The tectonic development of the Hellenic arc and the sea of Crete: A synthesis. Tectonophysics 1982, 86, 159–196. [Google Scholar] [CrossRef]
  8. Armijo, R.; Lyon-Caen, H.; Papanastassiou, D. East-west extension and Holocene normal-fault scarps in the Hellenic arc. Geology 1992, 20, 491–494. [Google Scholar] [CrossRef]
  9. Fassoulas, C. The tectonic development of a Neogene basin at the leading edge of the active European margin: The Heraklion basin, Crete, Greece. J. Geodyn. 2001, 31, 49–70. [Google Scholar] [CrossRef]
  10. Peterek, A.; Schwarze, J. Architecture and Late Pliocene to recent evolution of outer-arc basins of the Hellenic subduction zone (south-central Crete, Greece). J. Geodyn. 2004, 38, 19–55. [Google Scholar] [CrossRef]
  11. Monaco, C.; Tortorici, L. Faulting and effects of earthquakes on Minoan archaeological sites in Crete (Greece). Tectonophysics 2004, 382, 103–116. [Google Scholar] [CrossRef]
  12. Tsimi, C.; Ganas, A.; Ferrier, G.; Drakatos, G.; Pope, R.J.; Fassoulas, C. Morphotectonics of the Sfakia normal fault, south-western Crete, Greece. In Proceedings of the 8th Pan-Hellenic Geographical Conference, Athens, Greece, 4–7 October 2007; Volume 1, pp. 186–194. [Google Scholar]
  13. Caputo, R.; Catalano, S.; Monaco, C.; Romagnoli, G.; Tortorici, G.; Tortorici, L. Active faulting on the island of Crete (Greece). Geophys. J. Int. 2010, 183, 111–126. [Google Scholar] [CrossRef]
  14. Veliz, V.; Mouslopoulou, V.; Nicol, A.; Fassoulas, C.; Begg, J.; Oncken, O. Millennial to million year normal-fault interactions in the forearc of a subduction margin, Crete, Greece. J. Struct. Geol. 2018, 113, 225–241. [Google Scholar] [CrossRef]
  15. Robertson, J.; Meschis, M.; Roberts, G.; Ganas, A.; Gheorghiu, D. Temporally constant quaternary uplift rates and their relationship with extensional upper-plate faults in South Crete (Greece), constrained with 36Cl cosmogenic exposure dating. Tectonics 2019, 38, 1189–1222. [Google Scholar] [CrossRef] [Green Version]
  16. Nicol, A.; Mouslopoulou, V.; Begg, J.; Oncken, O. Displacement Accumulation and Sampling of Paleoearthquakes on Active Normal Faults of Crete in the Eastern Mediterranean. Geochem. Geophys. Geosystems 2020, 21, e2020GC009265. [Google Scholar] [CrossRef]
  17. Meier, T.; Rische, M.; Endrun, B.; Vafidis, A.; Harjes, H.-P. Seismicity of the Hellenic subduction zone in the area of western and central Crete observed by temporary local seismic networks. Tectonophysics 2004, 383, 149–169. [Google Scholar] [CrossRef]
  18. Kreemer, C.; Chamot-Rooke, N. Contemporary kinematics of the southern Aegean and the Mediterranean Ridge. Geophys. J. Int. 2004, 157, 1377–1392. [Google Scholar] [CrossRef] [Green Version]
  19. Papadimitriou, E.; Karakostas, V.; Mesimeri, M.; Vallianatos, F. The Mw6.7 12 October 2013 western Hellenic Arc main shock its aftershock sequence: Implications for the slab properties. Int. J. Earth Sci. (Geol. Rundsch.) 2016, 105, 2149–2160. [Google Scholar] [CrossRef]
  20. Görgün, E. Source Mechanisms and Stress Fields of the 15–16 June 2013 Crete Earthquake Sequence Along Hellenic Subduction Zone. Pure Appl. Geophys. 2017, 174, 1181–1199. [Google Scholar] [CrossRef]
  21. Kapetanidis, V.; Kassaras, I. Contemporary crustal stress of the Greek region deduced from earthquake focal mechanisms. J. Geodyn. 2019, 123, 55–82. [Google Scholar] [CrossRef]
  22. Kkallas, C.; Papazachos, C.; Scordilis, E.; Margaris, B. Active stress field of the Southern Aegean Sea subduction area from fault-plane solutions on the basis of different stress inversion approaches. J. Geodyn. 2021, 143, 101813. [Google Scholar] [CrossRef]
  23. Briole, P.; Ganas, A.; Elias, P.; Dimitrov, D. The GPS velocity field of the Aegean. New observations, contribution of the earthquakes, crustal blocks model. Geophys. J. Int. 2021, 226, 468–492. [Google Scholar] [CrossRef]
  24. Ganas, A.; Palyvos, N.; Mavrikas, G.; Karastathis, V.; Drakatos, G.; Makropoulos, K. Recognition and Characterisation of Neotectonic Faults in Heraklion City area (Crete, Greece): A multidisciplinary approach. Geophys. Res. Abstr. 2011, 13, EGU2011-4824. [Google Scholar]
  25. Ganas, A.; Fassoulas, C.; Moschou, A.; Bozionelos, G.; Papathanassiou, G.; Tsimi, C.; Valkaniotis, S. Geological and seismological evidence for NW-SE crustal extension at the southern margin of Heraklion Basin, Crete. Bull. Geol. Soc. Greece 2017, 51, 52–75. [Google Scholar] [CrossRef] [Green Version]
  26. Zygouri, V.; Koukouvelas, I.; Ganas, A. Palaeoseismological analysis of the East Giouchtas fault, Heraklion basin, Crete (preliminary results). Bull. Geol. Soc. Greece 2016, 50, 563–571. [Google Scholar] [CrossRef] [Green Version]
  27. Vassilakis, E. Study of the Tectonic Structure of the Messara Basin, Central Crete, With the AID of Remote Sensing Techniques and G.I.S. Ph. D. Thesis, National and Kapodistrian University of Athens, Athens, Greece, 2006; p. 564. [Google Scholar]
  28. Ekström, G.; Nettles, M.; Dziewonski, A.M. The global CMT project 2004–2010: Centroid-moment tensors for 13,017 earthquakes. Phys. Earth Planet. Inter. 2012, 200–201, 1–9. [Google Scholar] [CrossRef]
  29. Caputo, R.; Monaco, C.; Tortorici, L. Multiseismic cycle deformation rates from Holocene normal fault scarps on Crete (Greece). Terra Nova 2006, 18, 181–190. [Google Scholar] [CrossRef]
  30. Meulenkamp, J.E.; Dermitzakis, M.; Georgiadou-Dikaioulia, E.; Jonkers, H.A.; Boger, H. Field Guide to the Neogene of Crete; Series A, No. 32; Publications of the Department of Geology and Paleontology, University of Athens: Athens, Greece, 1979. [Google Scholar]
  31. Bonneau, M. Geological Map of Greece 1:50,000 Scale. Akhendrias Sheet; I.G.M.E.: Athens, Greece, 1984. [Google Scholar]
  32. Davi, E.; Bonneau, M. Geological Map of Greece 1:50,000 Scale. Andiskarion Sheet; I.G.M.E.: Athens, Greece, 1984. [Google Scholar]
  33. Vidakis, M.; Meulenkamp, J.E. Geological Map of Greece 1:50,000 Scale. Heraklion Sheet; I.G.M.E.: Athens, Greece, 1996. [Google Scholar]
  34. Vidakis, M.; Meulenkamp, J.E.; Jonkers, A. Geological Map of Greece 1:50,000 Scale. Ano Viannos Sheet; I.G.M.E.: Athens, Greece, 1989. [Google Scholar]
  35. Vidakis, M.; Jonkers, A.; Meulenkamp, J.E. Geological Map of Greece 1:50,000 Scale. Epano Arhanai Sheet; I.G.M.E.: Athens, Greece, 1994. [Google Scholar]
  36. Alexopoulos, A. Geological Hydrogeological Conditions in the Area of Mohos Topographical Sheet (Central-Eastern Crete). Ph.D. Thesis, National and Kapodistrian University of Athens, Athens, Greece, 1990; p. 598. [Google Scholar]
  37. Papanikolaou, D.; Vassilakis, E. Thrust faults and extensional detachment faults in Cretan tectono-stratigraphy: Implications for Middle Miocene extension. Tectonophysics 2010, 488, 233–247. [Google Scholar] [CrossRef]
  38. Evangelidis, C.P.; Triantafyllis, N.; Samios, M.; Boukouras, K.; Kontakos, K.; Ktenidou, O.-J.; Fountoulakis, I.; Kalogeras, I.; Melis, N.S.; Galanis, O.; et al. Seismic Waveform Data from Greece and Cyprus: Integration, Archival, and Open Access. Seismol. Res. Lett. 2021, 92, 1672–1684. [Google Scholar] [CrossRef]
  39. Delibasis, N.; Ziazia, M.; Voulgaris, N.; Papadopoulos, T.; Stavrakakis, G.; Papanastassiou, D.; Drakatos, G. Microseismic activity and seismotectonics of Heraklion Area (central Crete Island, Greece). Tectonophysics 1999, 308, 237–248. [Google Scholar] [CrossRef] [Green Version]
  40. Klein, F.W. User’s Guide to HYPOINVERSE-2000, A Fortran Program to Solve for Earthquake Locations and Magnitudes; U.S. Geological Survey: Reston, VA, USA, 2002; Volume 171, p. 123. [Google Scholar] [CrossRef] [Green Version]
  41. Waldhauser, F. hypoDD—A Program to Compute Double-Difference Hypocenter Locations: U.S. Geological Survey Open-File Report 01-113, 25p. 2001. Available online: https://pubs.usgs.gov/of/2001/0113/ (accessed on 1 December 2021).
  42. Waldhauser, F.; Ellsworth, W.L. A Double-Difference Earthquake Location Algorithm: Method and Application to the Northern Hayward Fault. California. Bull. Seismol. Soc. Am. 2000, 90, 1353–1368. [Google Scholar] [CrossRef]
  43. Herring, T.A.; King, R.W.; Floyd, M.A.; McCluskey, S.C. Introduction to GAMIT/GLOBK, Release 10.7; Massachusetts Institute of Technology: Cambridge, UK, 2018; p. 54. [Google Scholar]
  44. Altamimi, Z.; Rebischung, P.; Métivier, L.; Collilieux, X. ITRF2014: A new release of the International Terrestrial Reference Frame modeling nonlinear station motions. J. Geophys. Res. 2016, 121, 6109–6131. [Google Scholar] [CrossRef] [Green Version]
  45. Okada, Y. Internal deformation due to shear and tensile faults in a half space. Bull. Seism. Soc. America 1992, 82, 1018–1040. [Google Scholar] [CrossRef]
  46. Sandwell, D.T.; Xu, R.X.; Mellors, M.W.; Tong, X.; Wessel, P. GMTSAR: An InSAR Processing System Based on Generic Mapping Tools, 2nd ed. 2016. Available online: http://topex.ucsd.edu/gmtsar/tar/GMTSAR_2ND_TEX.pdf (accessed on 1 December 2019).
  47. Ganas, A. NOAFAULTS KMZ layer Version 4.0 (V4.0) [Data set]. Zenodo. 2022. Available online: https://zenodo.org/record/6326260#.Yoy6xlRBxN0 (accessed on 13 January 2022).
  48. Fialko, Y. Probing the mechanical properties of seismically active crust with space geodesy: Study of the co-seismic deformation due to the 1992 Mw 73 Landers (southern California) earthquake. J. Geophys. Res. 2004, 109, B03307. [Google Scholar]
  49. Hamiel, Y.; Fialko, Y. Structure mechanical properties of faults in the North Anatolian Fault system from InSAR observations of coseismic deformation due to the 1999 Izmit (Turkey) earthquake. J. Geophys. Res. 2007, 112, B07412. [Google Scholar] [CrossRef] [Green Version]
  50. Hamiel, Y.; Baer, G.; Kalindekafe, L.; Dombola, K.; Chindandali, P. Seismic and aseismic slip evolution and deformation associated with the 2009–2010 northern Malawi earthquake swarm, East African Rift. Geophys. J. Int. 2012, 191, 898–908. [Google Scholar] [CrossRef] [Green Version]
  51. Chiaraluce, L.; Valoroso, L.; Piccinini, D.; Di Stefano, R.; De Gori, P. The anatomy of the 2009 L’Aquila normal fault system (central Italy) imaged by high resolution foreshock aftershock locations. J. Geophys 2011, 116, B12311. [Google Scholar] [CrossRef]
  52. Ganas, A.; Elias, P.; Kapetanidis, V.; Valkaniotis, S.; Briole, P.; Kassaras, I.; Argyrakis, P.; Barberopoulou, A.; Moshou, A. The 20 July 2017 M6.6 Kos Earthquake: Seismic and Geodetic Evidence for an Active North-Dipping Normal Fault at the Western End of the Gulf of Gökova (SE Aegean Sea). Pure Appl. Geophys. 2019, 176, 4177–4211. [Google Scholar] [CrossRef]
  53. Ganas, A.; Valkaniotis, S.; Briole, P.; Serpetsidaki, A.; Kapetanidis, V.; Karasante, I.; Kassaras, I.; Papathanassiou, G.; Karamitros, I.; Tsironi, V.; et al. Domino-style earthquakes along blind normal faults in Northern Thessaly (Greece): Kinematic evidence from field observations seismology SAR interferometry, G.N.S.S. Bull. Geol. Soc. Greece 2021, 58, 37–86. [Google Scholar] [CrossRef]
  54. Melgar, D.; Ganas, A.; Geng, J.; Liang, C.; Fielding, E.J.; Kassaras, I. Source characteristics of the 2015 Mw6.5 Lefkada, Greece, strike-slip earthquake. J. Geophys. Res. Solid Earth 2017, 122, 2260–2273. [Google Scholar] [CrossRef]
  55. Melgar, D.; Ganas, A.; Taymaz, T.; Valkaniotis, S.; Crowell, B.W.; Kapetanidis, V.; Tsironi, V.; Yolsal-Çevikbilen, S.; Öcalan, T. Rupture kinematics of 2020 January 24 Mw 6.7 Doğanyol-Sivrice, Turkey earthquake on the East Anatolian Fault Zone imaged by space geodesy. Geophys. J. Int. 2020, 223, 862–874. [Google Scholar] [CrossRef]
  56. Mercier, J.L.; Mouyaris, N.; Simeakis, C.; Roundoyannis, T.; Angelidhis, C. Intraplate deformation: A quantitative study of the faults activated by the 1978 Thessaloniki earthquakes. Nature 1979, 278, 45–48. [Google Scholar] [CrossRef]
  57. Jackson, A.J.; Gagnepain, J.; Houseman, G.; King, G.C.P.; Papadimitriou, P.; Soufleris, C.; Virieux, J. Seismicity, normal faulting, and the geomorphological development of the Gulf of Corinth (Greece): The Corinth earthquakes of February and March. Earth Planet. Sci. Lett. 1981, 57, 377–397. [Google Scholar] [CrossRef]
  58. Lyon-Caen, H.; Armijo, R.; Drakopoulos, J.; Baskoutas, J.; Delibassis, N.; Gaulon, R.; Kouskouna, V.; Latoussakis, J.; Makropoulos, K.; Papadimitriou, P.; et al. The 1986 Kalamata (south Peloponnesus) earthquake: Detailed study of a normal fault. Evidences for east-west extension in the Hellenic arc 1988. J. Geophys. Res.-Solid Earth 1988, 93, 14967–15000. [Google Scholar] [CrossRef]
  59. Ganas, A.; Roberts, G.P.; Memou, T.Z. Segment boundaries, the 1894 ruptures and strain patterns along the Atalanti Fault, Central Greece. J. Geodyn. 1998, 26, 461–486. [Google Scholar] [CrossRef]
  60. Scholz, C.H. Earthquakes and friction laws. Nature 1998, 391, 37–42. [Google Scholar] [CrossRef]
  61. Kaneko, Y.; Fialko, Y. Shallow slip deficit due to large strike-slip earthquakes in dynamic rupture simulations with elasto-plastic off-fault response. Geophys. J. Int. 2011, 186, 1389–1403. [Google Scholar] [CrossRef] [Green Version]
  62. Pucci, S.; De Martini, P.M.; Civico, R.; Villani, F.; Nappi, R.; Ricci, T.; Azzaro, R.; Brunori, C.A.; Caciagli, M.; Cinti, F.R.; et al. Coseismic ruptures of the 24 August 2016, Mw 6.0 Amatrice earthquake (central Italy). Geophys. Res. Lett. 2017, 44, 2138–2147. [Google Scholar] [CrossRef]
  63. Civico, R.S.; Pucci, F.; Villani, L.; Pizzimenti, P.M.; De Martini, R.; Nappi the Open EMERGEO Working Group. Surface ruptures following the 30 October 2016 Mw 6.5 Norcia earthquake, central Italy. J. Maps 2018, 14, 151–160. [Google Scholar] [CrossRef] [Green Version]
  64. Mechernich, S.; Reicherter, K.; Deligiannakis, G.; Papanikolaou, I. Tectonic geomorphology of active faults in Eastern Crete (Greece) with slip rates and earthquake history from cosmogenic 36Cl dating of the Lastros and Orno faults. Quat. Int. 2022. [Google Scholar] [CrossRef]
  65. Fujiwara, S.; Nakano, T.; Morishita, Y. Detection of triggered shallow slips caused by large earthquakes using L-band SAR interferometry. Earth Planets Space 2020, 72, 119. [Google Scholar] [CrossRef]
  66. Moro, M.; Chini, M.; Saroli, M.; Atzori, S.; Stramondo, S.; Salvi, S. Analysis of large, seismically induced, gravitational deformations imaged by high-resolution COSMO-SkyMed synthetic aperture radar. Geology 2011, 39, 527–530. [Google Scholar] [CrossRef]
  67. Roberts, G.P.; Ganas, A. Fault-slip directions in central and southern Greece measured from striated and corrugated fault planes: Comparison with focal mechanism and geodetic data. J. Geophys. Res. 2000, 105, 23443–23462. [Google Scholar] [CrossRef]
  68. Roberts, G.P.; Michetti, A.M.; Cowie, P.; Morewood, N.C.; Papanikolaou, I. Fault slip-rate variations during crustal-scale strain localisation central Italy. Geophys. Res. Lett. 2002, 29, 1168. [Google Scholar] [CrossRef] [Green Version]
  69. Ganas, A.; Pavlides, S.B.; Sboras, S.; Valkaniotis, S.; Papaioannou, S.; Alexandris, G.A.; Plessa, A.; Papadopoulos, G.A. Active Fault Geometry and Kinematics in Parnitha Mountain, Attica, Greece. J. Struct. Geol. 2004, 26, 2103–2118. [Google Scholar] [CrossRef]
  70. Ganas, A.; Pavlides, S.; Karastathis, V. DEM-based morphometry of range-front escarpments in Attica, central Greece, and its relation to fault slip rates. Geomorphology 2005, 65, 301–319. [Google Scholar] [CrossRef]
  71. Kokkalas, S.; Pavlides, S.; Koukouvelas, I.; Ganas, A.; Stamatopoulos, L. Paleoseismicity of the Kaparelli fault (eastern Corinth Gulf): Evidence for earthquake recurrence and fault behaviour. Boll. Della Soc. Geol. Ital. 2007, 126, 387–395. [Google Scholar]
  72. Iezzi, F.; Roberts, G.; Faure Walker, J.; Papanikolaou, I.; Ganas, A.; Deligiannakis, G.; Beck, J.; Wolfers, S.; Gheorghiu, D. Temporal and spatial earthquake clustering revealed through comparison of millennial strain-rates from 36Cl cosmogenic exposure dating and decadal GPS strain-rate. Sci. Rep. 2021, 11, 23320. [Google Scholar] [CrossRef]
  73. Mozafari, N.; Özkaymak, Ç.; Sümer, Ö.; Tikhomirov, D.; Uzel, B.; Yeşilyurt, S.; Ivy-Ochs, S.; Vockenhuber, C.; Sözbilir, H.; Akçar, N. Seismic history of western Anatolia during the last 16 kyr determined by cosmogenic 36Cl dating. Swiss J. Geosci. 2022, 115, 5. [Google Scholar] [CrossRef]
  74. Stein, R.S.; Barka, A.A.; Dieterich, J.H. Progressive failure on the North Anatolian fault since 1939 by earthquake stress triggering. Geophys. J. Int. 1997, 128, 594–604. [Google Scholar] [CrossRef] [Green Version]
  75. King, G.C.P.; Cocco, M. Fault Interaction By Elastic Stress Changes: New Clues From Earthquake Sequences; Dmowska, R., Saltzman, B., Eds.; Advances in Geophysics, Elsevier: Amsterdam, The Netherlands, 2001; Volume 44, pp. 1–38. [Google Scholar] [CrossRef]
  76. Valkaniotis, S.; Briole, P.; Ganas, A.; Elias, P.; Kapetanidis, V.; Tsironi, V.; Fokaefs, A.; Partheniou, H.; Paschos, P. The Mw = 5.6 Kanallaki Earthquake of 21 March 2020 in West Epirus, Greece: Reverse Fault Model from InSAR Data and Seismotectonic Implications for Apulia-Eurasia Collision. Geosciences 2020, 10, 454. Available online: https://www.mdpi.com/2076-3263/10/11/454/htm (accessed on 13 January 2022). [CrossRef]
  77. Ganas, A.; Parsons, T. Three-dimensional model of Hellenic Arc deformation and origin of the Cretan uplift. J. Geophys. Res. 2009, 114, B06404. [Google Scholar] [CrossRef] [Green Version]
  78. Gallen, S.F.; Wegmann, K.W.; Bohnenstiehl, D.R.; Pazzaglia, F.J.; Brandon, M.T.; Fassoulas, C. Active simultaneous uplift and margin-normal extension in a forearc high, Crete, Greece. Earth Planet. Sci. Lett. 2014, 398, 11–24. [Google Scholar] [CrossRef]
  79. Briole, P.; Elias, P.; Parcharidis, I.; Bignami, C.; Benekos, G.; Samsonov, G.; Kyriakopoulos, C.; Stramondo, S.; Chamot-Rooke, N.; Drakatou, M.L.; et al. The seismic sequence of January-February 2014 at Cephalonia Island (Greece): Constraints from SAR interferometry. G.P.S. Geophys. J. Int. 2015, 203, 1528–1540. [Google Scholar] [CrossRef] [Green Version]
  80. Ilieva, M.; Briole, P.; Ganas, A.; Dimitrov, D.; Elias, P.; Mouratidis, A.; Charara, R. Fault plane modelling of the 2003 August 14 Lefkada Island (Greece) earthquake based on the analysis of ENVISAT SAR interferograms. Tectonophysics 2016, 693, 47–65. [Google Scholar] [CrossRef]
  81. Avallone, A.; Cirella, A.; Cheloni, D.; Tolomei, C.; Theodoulidis, N.; Piatanesi, A.; Briole, P.; Ganas, A. Near-source high-rate GPS, strong motion and InSAR observations to image the 2015 Lefkada (Greece) Earthquake rupture history. Sci. Rep. 2017, 7, 10358. [Google Scholar] [CrossRef] [Green Version]
  82. Ganas, A.; Kourkouli, P.; Briole, P.; Moshou, A.; Elias, P.; Parcharidis, I. Coseismic Displacements from Moderate-Size Earthquakes Mapped by Sentinel-1 Differential Interferometry: The Case of February 2017 Gulpinar Earthquake Sequence (Biga Peninsula, Turkey). Remote Sens. 2018, 10, 1089. [Google Scholar] [CrossRef] [Green Version]
  83. De Novellis, V.; Convertito, V.; Valkaniotis, S.; Casu, F.; Lanari, R.; Monterroso Tobar, M.F.; Pino, N.A. Coincident locations of rupture nucleation during the 2019 Le Teil earthquake, France and maximum stress change from local cement quarrying. Commun. Earth Environ. 2020, 1, 20. [Google Scholar] [CrossRef]
  84. Elias, P.; Spingos, I.; Kaviris, G.; Karavias, A.; Gatsios, T.; Sakkas, V.; Parcharidis, I. Combined Geodetic and Seismological Study of the December 2020 Mw = 4.6 Thiva (Central Greece) Shallow Earthquake. Appl. Sci. 2021, 11, 5947. [Google Scholar] [CrossRef]
  85. Song, C.; Yu, C.; Meldebekova, G.; Li, Z. Normal Fault Slips of the March 2021 Greece Earthquake Sequence from InSAR Observations. J. Geod. Geoinf. Sci. 2022, 5, 50–59. [Google Scholar] [CrossRef]
  86. Ganas, A.; Elias, P.; Valkaniotis, S.; Tsironi, V.; Karasante, I.; Briole, P. Petrinja earthquake moved crust 10 feet. Temblor 2021. [Google Scholar] [CrossRef]
  87. Atzori, S.; Manunta, M.; Fornaro, G.; Ganas, A.; Salvi, S. Postseismic displacement of the 1999 Athens earthquake retrieved by the Differential Interferometry by Synthetic Aperture Radar time series. J. Geophys. Res. 2008, 113, B09309. [Google Scholar] [CrossRef]
  88. Taymaz, T.; Ganas, A.; Yolsal-Çevikbilen, S.; Vera, F.; Eken, T.; Erman, C.; Keleş, D.; Kapetanidis, V.; Valkaniotis, S.; Karasante, I.; et al. Source mechanism and rupture process of the 24 January 2020 Mw 6.7 Doĝanyol-Sivrice earthquake obtained from seismological waveform analysis and space geodetic observations on the East Anatolian fault Zone (Turkey). Tectonophysics 2021, 804, 228745. [Google Scholar] [CrossRef]
  89. Wessel, P.; Luis, J.F.; Uieda, L.; Scharroo, R.; Wobbe, F.; Smith, W.H.F.; Tian, D. The Generic Mapping Tools version 6. Geochem. Geophys. Geosystems 2019, 20, 5556–5564. [Google Scholar] [CrossRef] [Green Version]
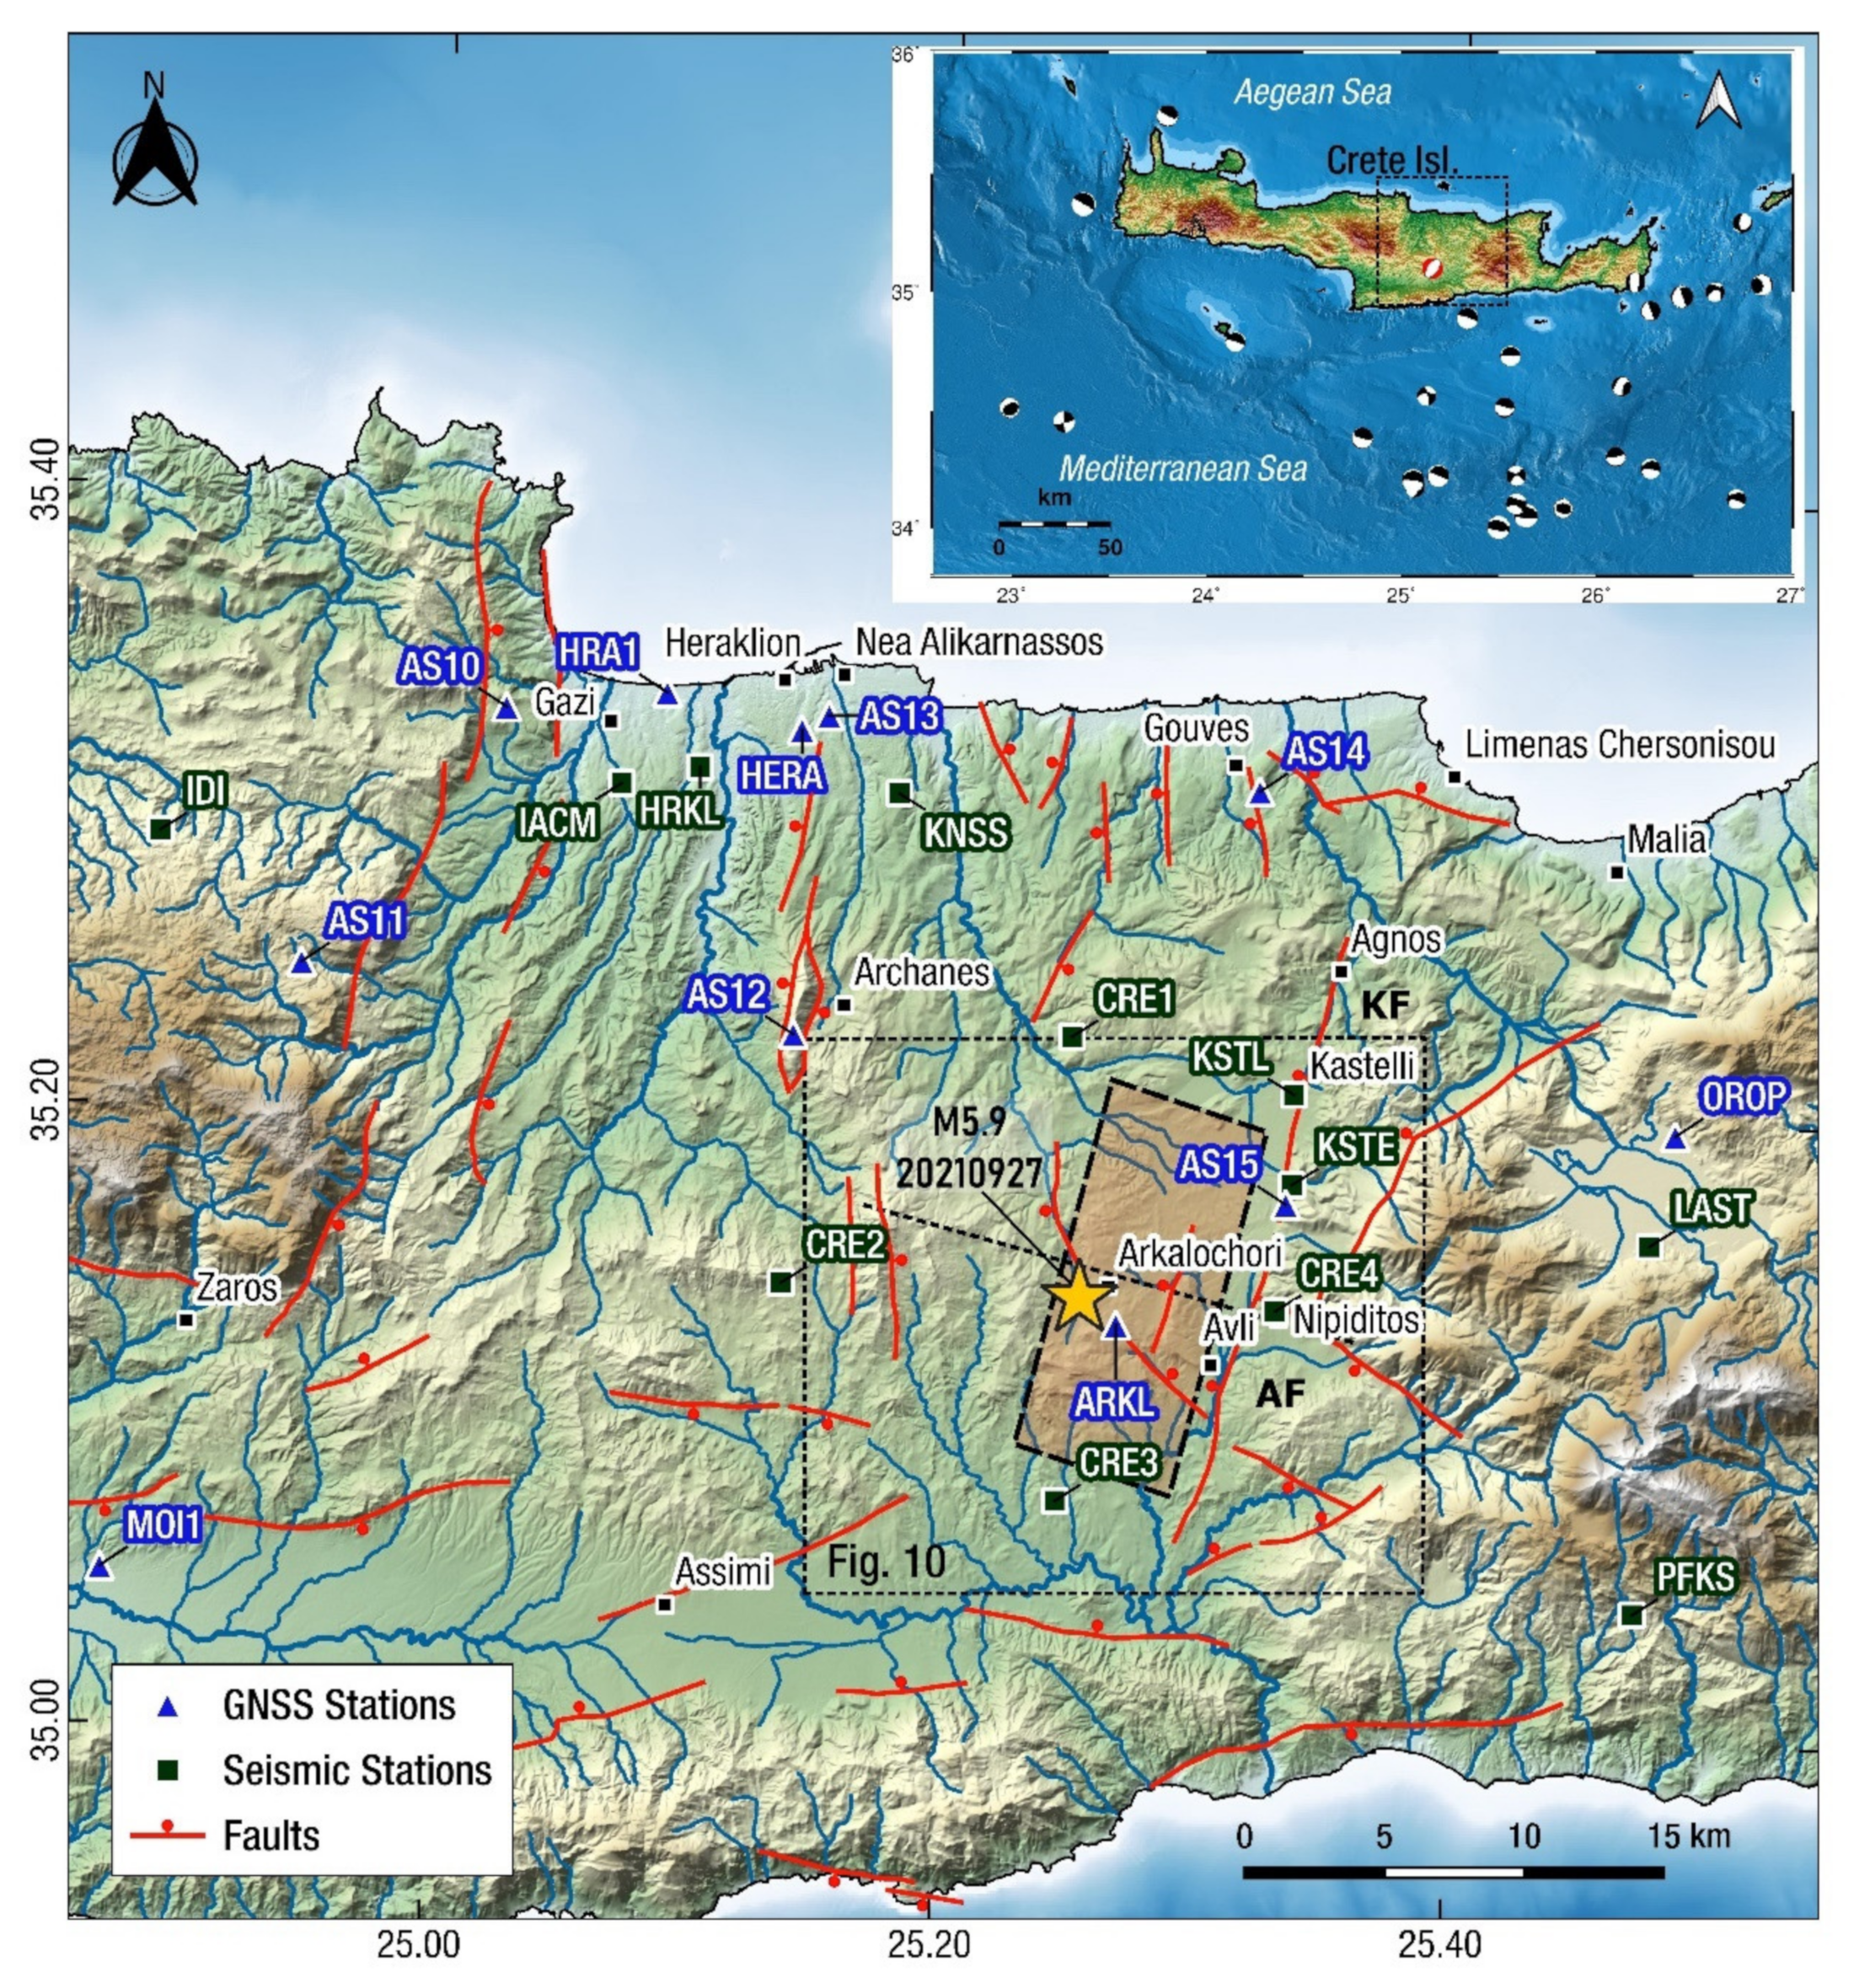
Figure 1. Shaded relief map of the 27 September 2021, Arkalochori Mw = 5.9 earthquake area in central Crete (Greece). Solid yellow star indicates the relocated mainshock epicentre (this study). Shaded rectangle indicates surface projection of the fault plane (this study). Blue triangles indicate GNSS stations. Black squares indicate seismic stations. Thin black box shows extent of Figures 9 and 10. Black dashed line indicates profile location shown in Figures 13 and 14. Red lines are active faults from the NOAFAULTs database https://doi.org/10.5281/zenodo.6326260 (accessed on 1 December 2021) and [27] with modifications; ticks indicate downthrown side. Inset box at upper right shows study area within Crete and focal mechanisms (1976–2021) from the GCMT database [28].
Geosciences 12 00220 g001
Figure 2. Neotectonic map of the broader Heraklion-Messara basins compiled after the IGME geological map sheets [31,32,33,34,35] and geological mapping of [27,36]. KF: Kastelli Fault; ALF: Arkalochori f.; RF: Roussochori f.; LF: Lagouta F.; GFZ Geraki Fauth Zone.
Geosciences 12 00220 g002
Figure 3. Shaded relief map showing the relocated seismicity, during the period 1 November 2020–6 October 2021, distributed in two main clusters. The events are coloured with respect to depth. The beach balls represent the lower-hemisphere projections of moment tensor solutions of the events with Mw >4.0 (source: NOA; see Table S2 for solutions). The focal mechanisms show normal-slip kinematics.
Geosciences 12 00220 g003
Figure 4. Relocated seismicity cross-sections. Beachballs show focal mechanisms (projected to the plane of the cross-sections). See map in Figure 3 for locations.
Geosciences 12 00220 g004
Figure 5. (top panel) Map showing the relocated seismicity record around Arkalochori, (middle panel) events are projected on time vs distance section from 1 November 2020 to 6 October 2021, (bottom panel) from 30 May to 6 October 2021. Colour of events corresponds to the Julian day of occurrence.
Geosciences 12 00220 g005
Figure 6. Position time series showing co-seismic and early post-seismic displacements in the north (A), east (B) and vertical (C) components of ARKL GNSS station. Panels (AC) show the results of early post-seismic deformation (hours) relative to MOI1 station using the TRACK module. Panels (DF) show early post-seismic deformation (days) using the daily solution time-series of GAMIT/GLOBK moduli. Red line indicates the time of the earthquake and blue lines indicate our best-fit model results.
Geosciences 12 00220 g006
Figure 7. InSAR unwrapped data (A), model (B) and residual (Data-Model; C) for ascending and descending (DF) orbits. GPS solution (green arrows) and model (blue arrows) for ARKL station are also presented. Panel B shows the horizontal displacement and panel E shows the amount of subsidence of ARKL GNSS station. Thin dotted lines are active faults [47]. Thick blue line indicates the intersection of the seismic fault with the Earth’s surface.
Geosciences 12 00220 g007
Figure 8. Best-fit inverted fault slip model for both ascending and descending interferograms and displacements of the ARKL GNSS station. Colour scale indicates normal-slip displacements in cm. Distance is in km from the origin point (25° E, 35° N).
Geosciences 12 00220 g008
Figure 9. Relief map showing aftershock distribution and the surface projection of the modelled fault plane (coloured rectangle). Note that the aftershocks are distributed around the main asperity (coloured squares; see Figure 8 for fault model). Also note that the aftershock depth increases toward the west, in the vicinity of the epicentre (up to 4 km in map view). The dashed blue line indicates the projected intersection of the modelled fault plane with the Earth’s surface.
Geosciences 12 00220 g009
Figure 10. Relief map showing earthquake effects mapped by field surveys during the period September–November 2021 (by CF, AG, SV, IK) and satellite imagery (InSAR wrapped interferogram disruptions and features on Sentinel-2 optical imagery). Yellow star is relocated epicentre of the mainshock. Blue rectangle is the surface projection of the modelled fault. Dashed blue line indicates the intersection of the seismic fault with the Earth’s surface. KF is Kastelli Fault, AF is Avli-Lagouta Fault. Orange line is the Heraklion-Arkalochori motorway.
Geosciences 12 00220 g010
Figure 11. Field photographs (a,c) showing earthquake effects mapped by field surveys during the period September–November 2021 (by CF, AG, SV, IK) and panoramic views of the Kastelli Fault footwall (b,e) and hanging wall, respectively (d). The Nipiditos village is visible in (e). Elevation range 300–600 m.
Geosciences 12 00220 g011
Figure 12. Along-strike DEM swaths and extraction of topographic profiles. The resultant relief is assumed to represent long-term fault-throw distribution. Upper-panel: Agnos–Kastelli fault segment, South-panel: Avli fault segment. Swath is 500 m wide.
Geosciences 12 00220 g012
Figure 13. Cross-section (heading N110° E) showing ground deformation from LOS unwrapped data of the Arkalochori earthquake of 27 September 2021. Topography is shown with grey line. See Figure 1 for profile location.
Geosciences 12 00220 g013
Figure 14. Cross-section (heading N110° E) showing the projected seismic fault of the Arkalochori earthquake of 27 September 2021. The surface projection of the fault plane meets the trace of the neotectonic Avli Fault. Topography is shown with grey line and red arrow indicates sense of displacement, respectively. Other minor normal faults (ALF, RF) are also shown. See Figure 1 for profile location.
Geosciences 12 00220 g014
Table 1. Moment tensor solutions calculated by various agencies. In the last line, the values of our best fitting geodetic model (see Section 4).
AgencyLATLONStrikeDipRakeStrikeDipRakeDepthMwMoment
°°°°°°°°km ×1018 Nm
GCMT35.1225.184043−8521447−94125.91.01
USGS35.2525.275557−7921535−106126.01.08
ERD35.3925.353547−9722544−83105.70.76
INGV35.1025.182253−10823041−68106.01.2
GFZ35.1825.253032−9621857−85166/01.1
CPPT35.2425.372068−10723928−55166.01.23
IPGP35.2525.262438−11122955−7566.01.16
KOERI35.1225.214441−7620750−101106.01.13
OCA35.1325.261145−3524560−56105.9
NOA35.1425.262533−8119557−956.45.90.86
UOA35.1425.272125−7518566−97145.90.91
Median 2543−9621850−8510 1.09
Mean 3044−9521849−8311 1.04
r.m.s. scatter 1214131312163.7 0.18
Model (this study)35.1525.28 19555−905.15.961.1
Table 2. Characteristics of the interferometric pairs of Sentinel-1 data that were used in this study.
Interferometric Pairs (yyyy/mm/dd)SatellitesRelativeIncidence Mid AngleComments
Orbit Number
Ascending2021/09/17–2021/09/29Sentinel-1A10244Co-seismic (Figure 7)
Descending2021/09/18–2021/09/30Sentinel-1A10933.93Co-seismic (Figure 7)
Descending2021/10/01–2021/10/13Sentinel-1B3643.87Post-seismic (Figure S6)
Table 3. Parameters of the modelled fault based on the combined inversion of both InSAR and GNSS data.
Centre of the Top-FaultSize of The FaultFault OrientationFault Slip
Long.Lat.TopLengthWidthAzimuthDipRakeMax.Slip
°°kmkmkm°°°m
25.30935.1381.213.410.519555-901.2
Publisher’s Note: MDPI stays neutral with regard to jurisdictional claims in published maps and institutional affiliations.