
Landslides and Gullies Interact as Sources of Lake Sediments in a Rifting Context: Insights from a Highly Degraded Mountain Environment

 , , , , ,
Abstract
:1. Introduction
2. Materials and Methods
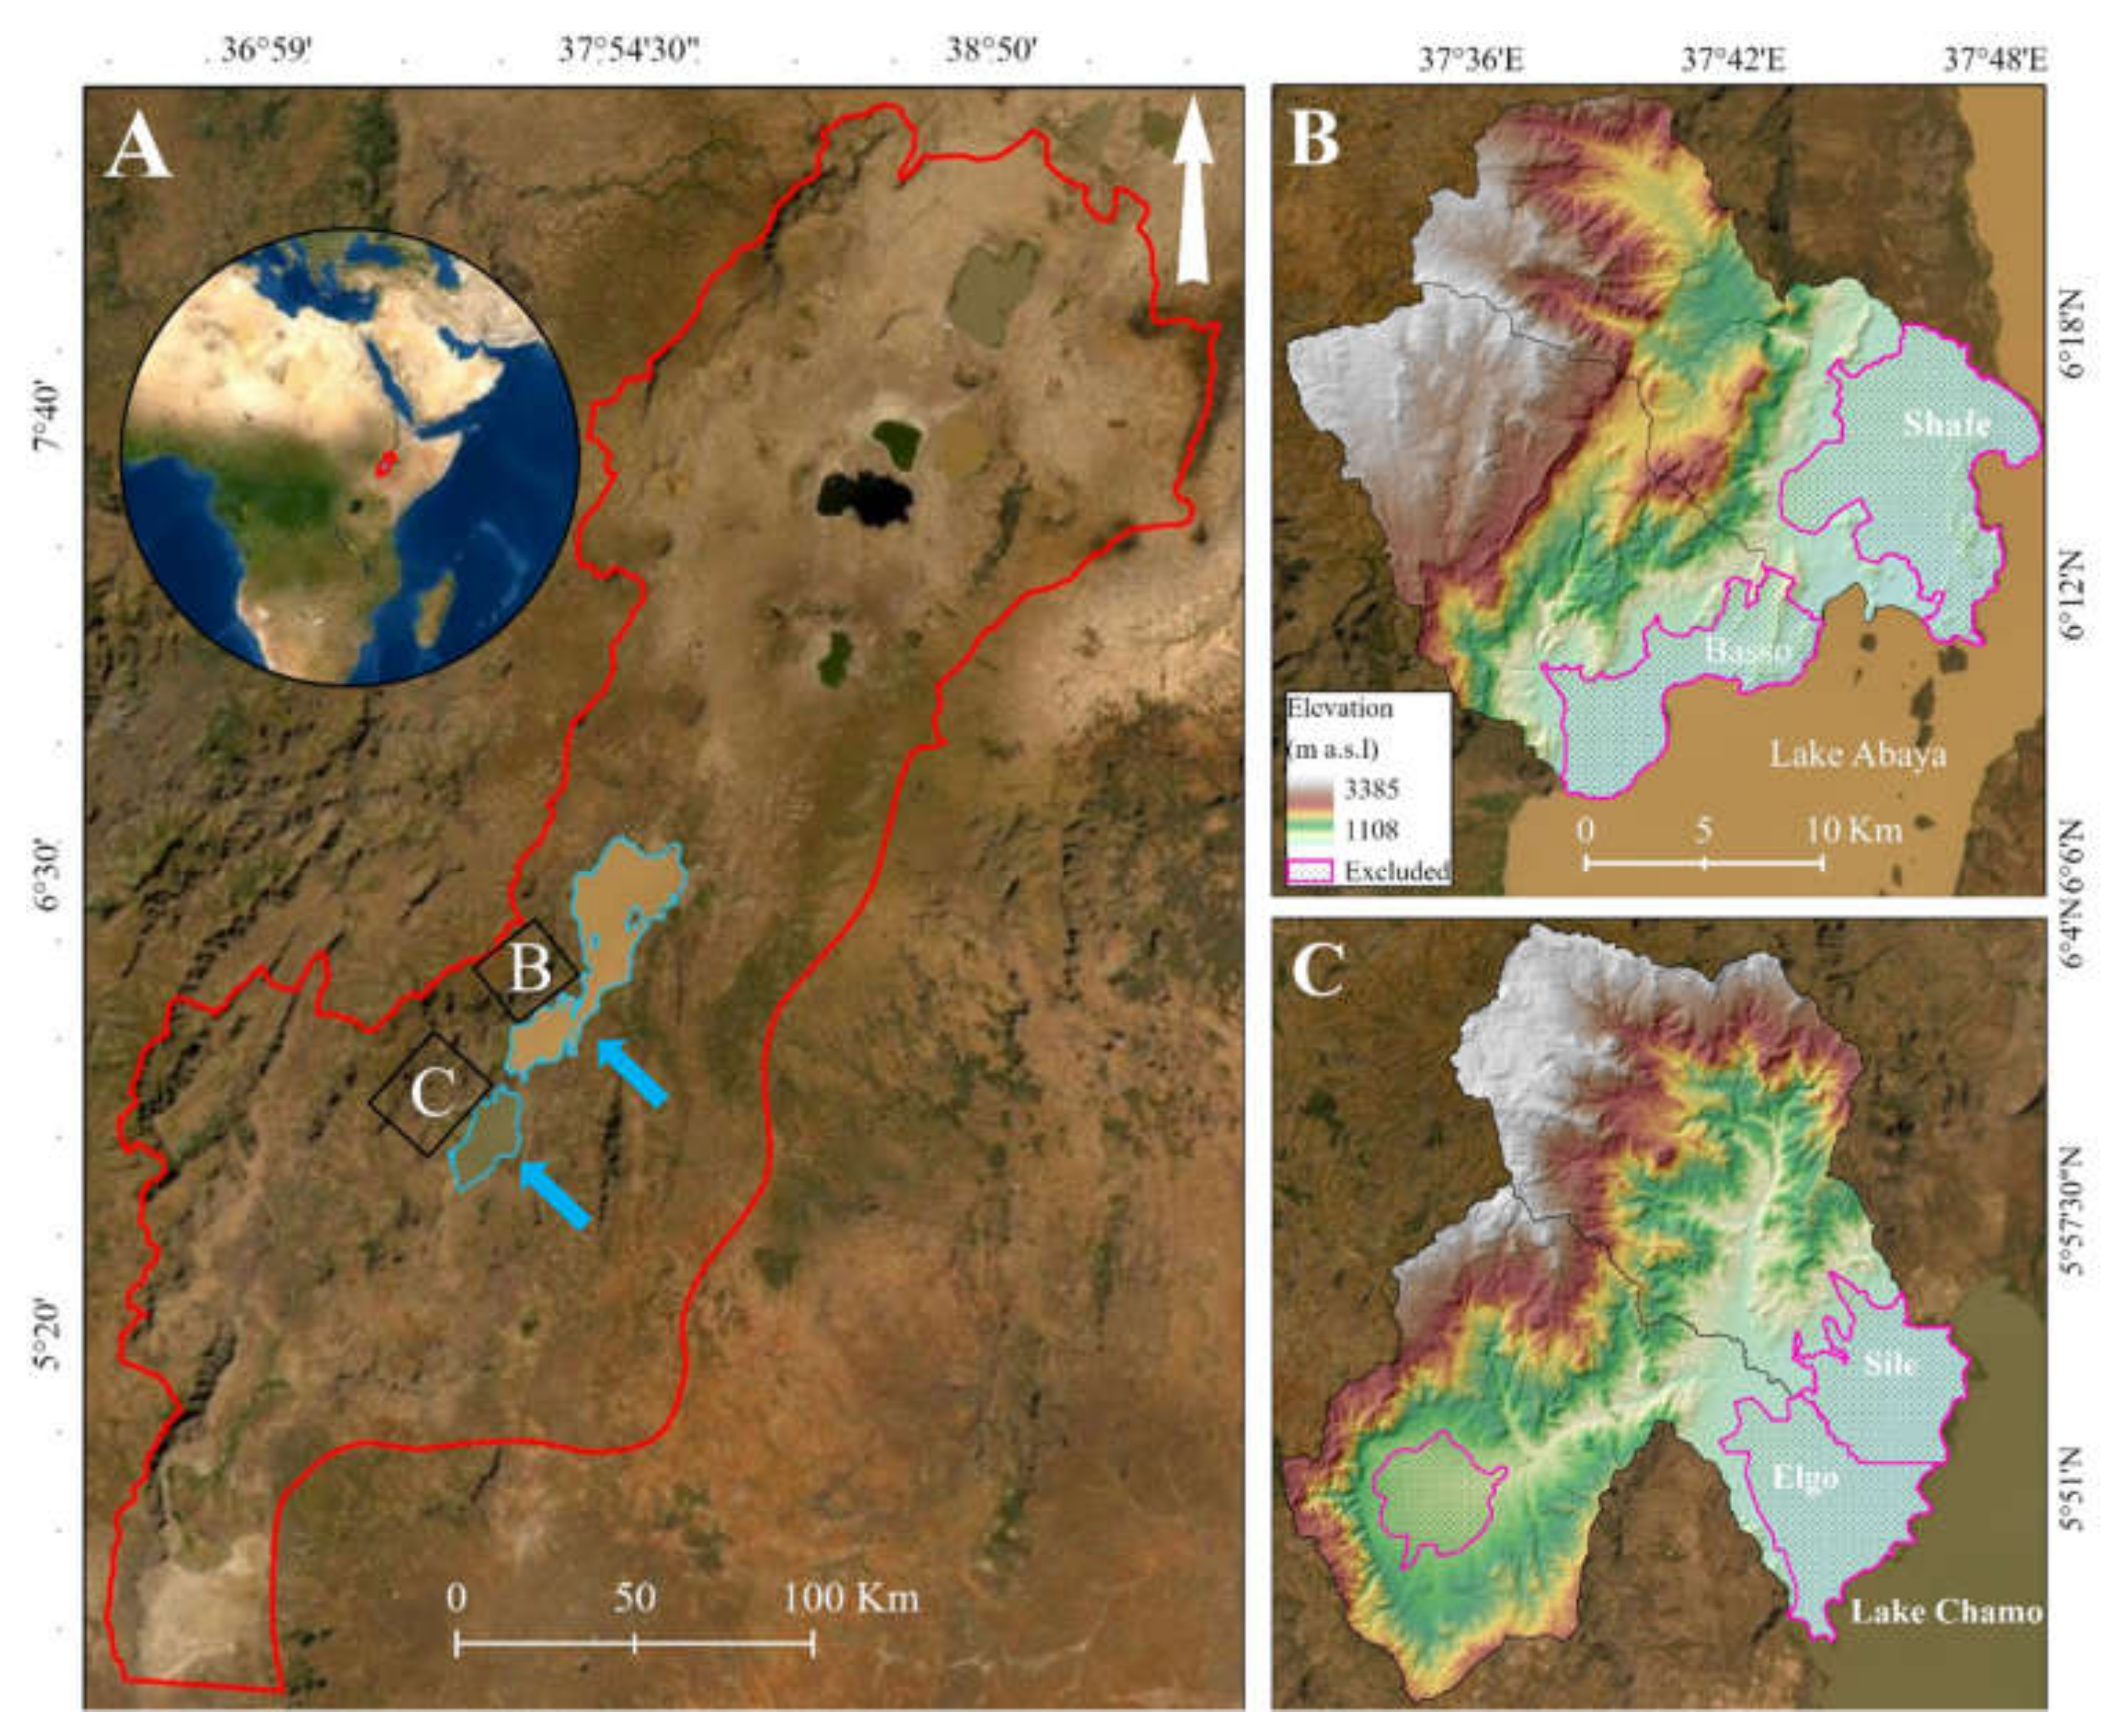
2.1. Study Area
2.2. Data and Methods
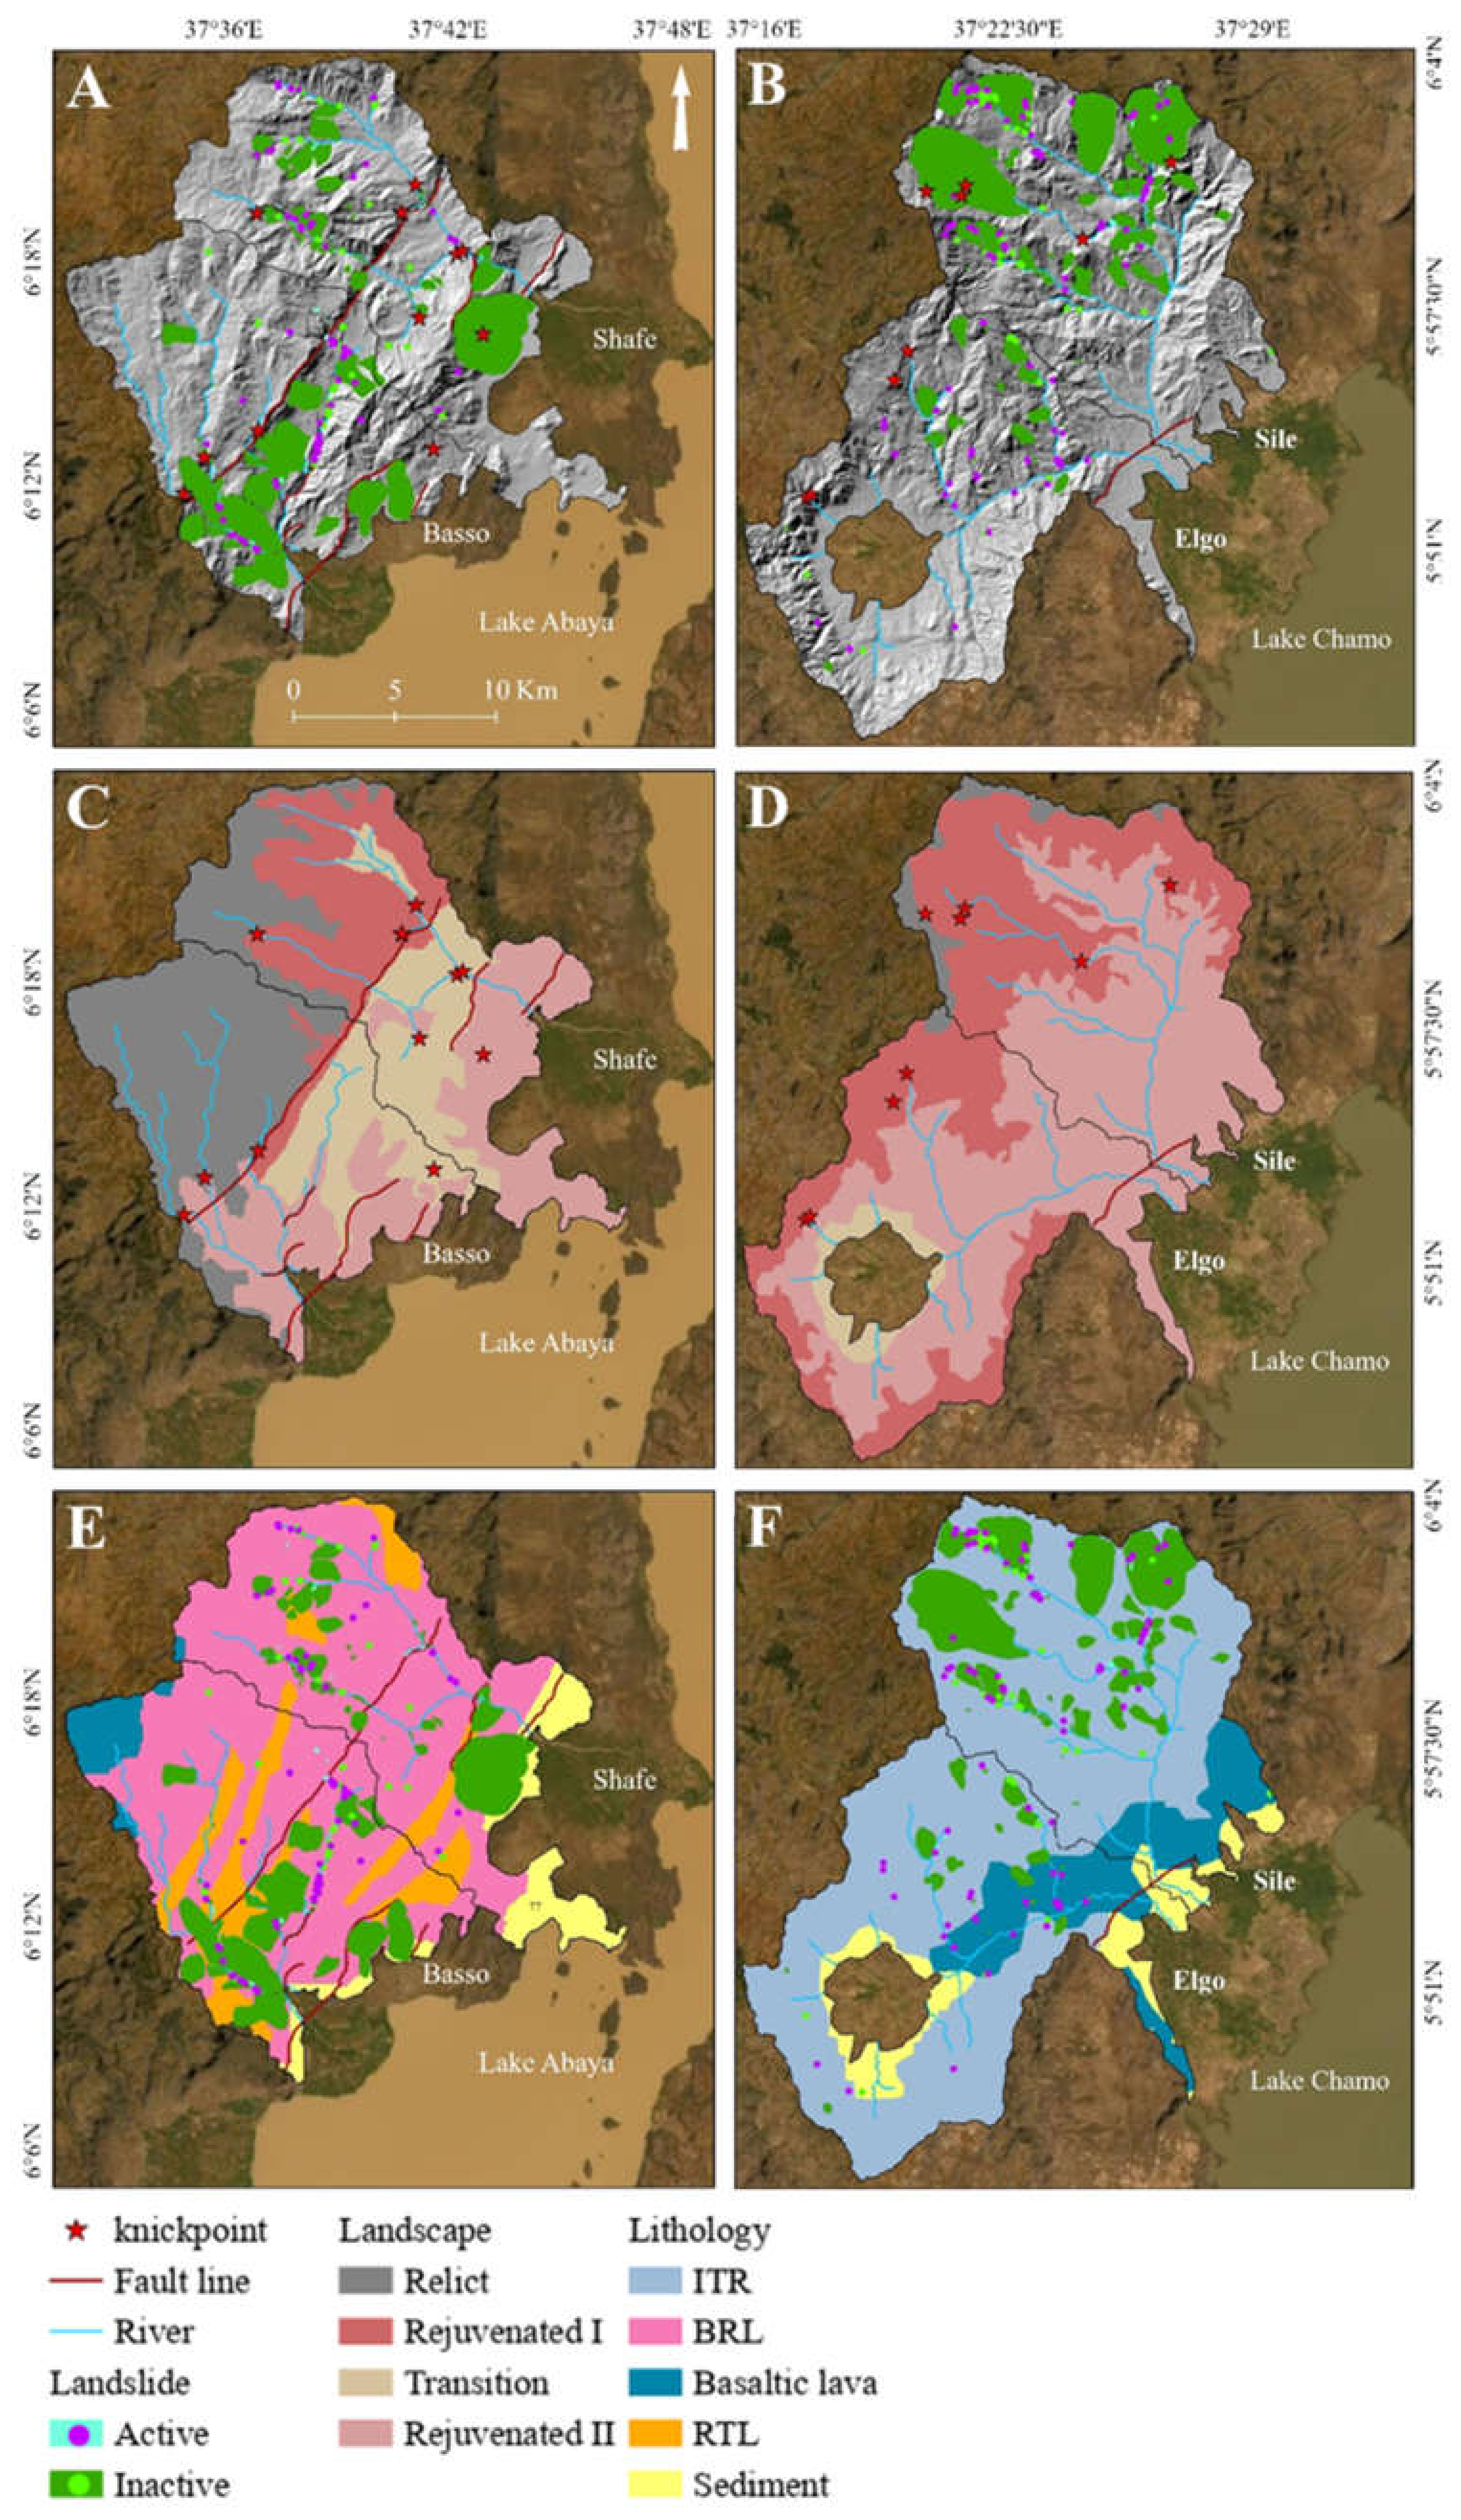
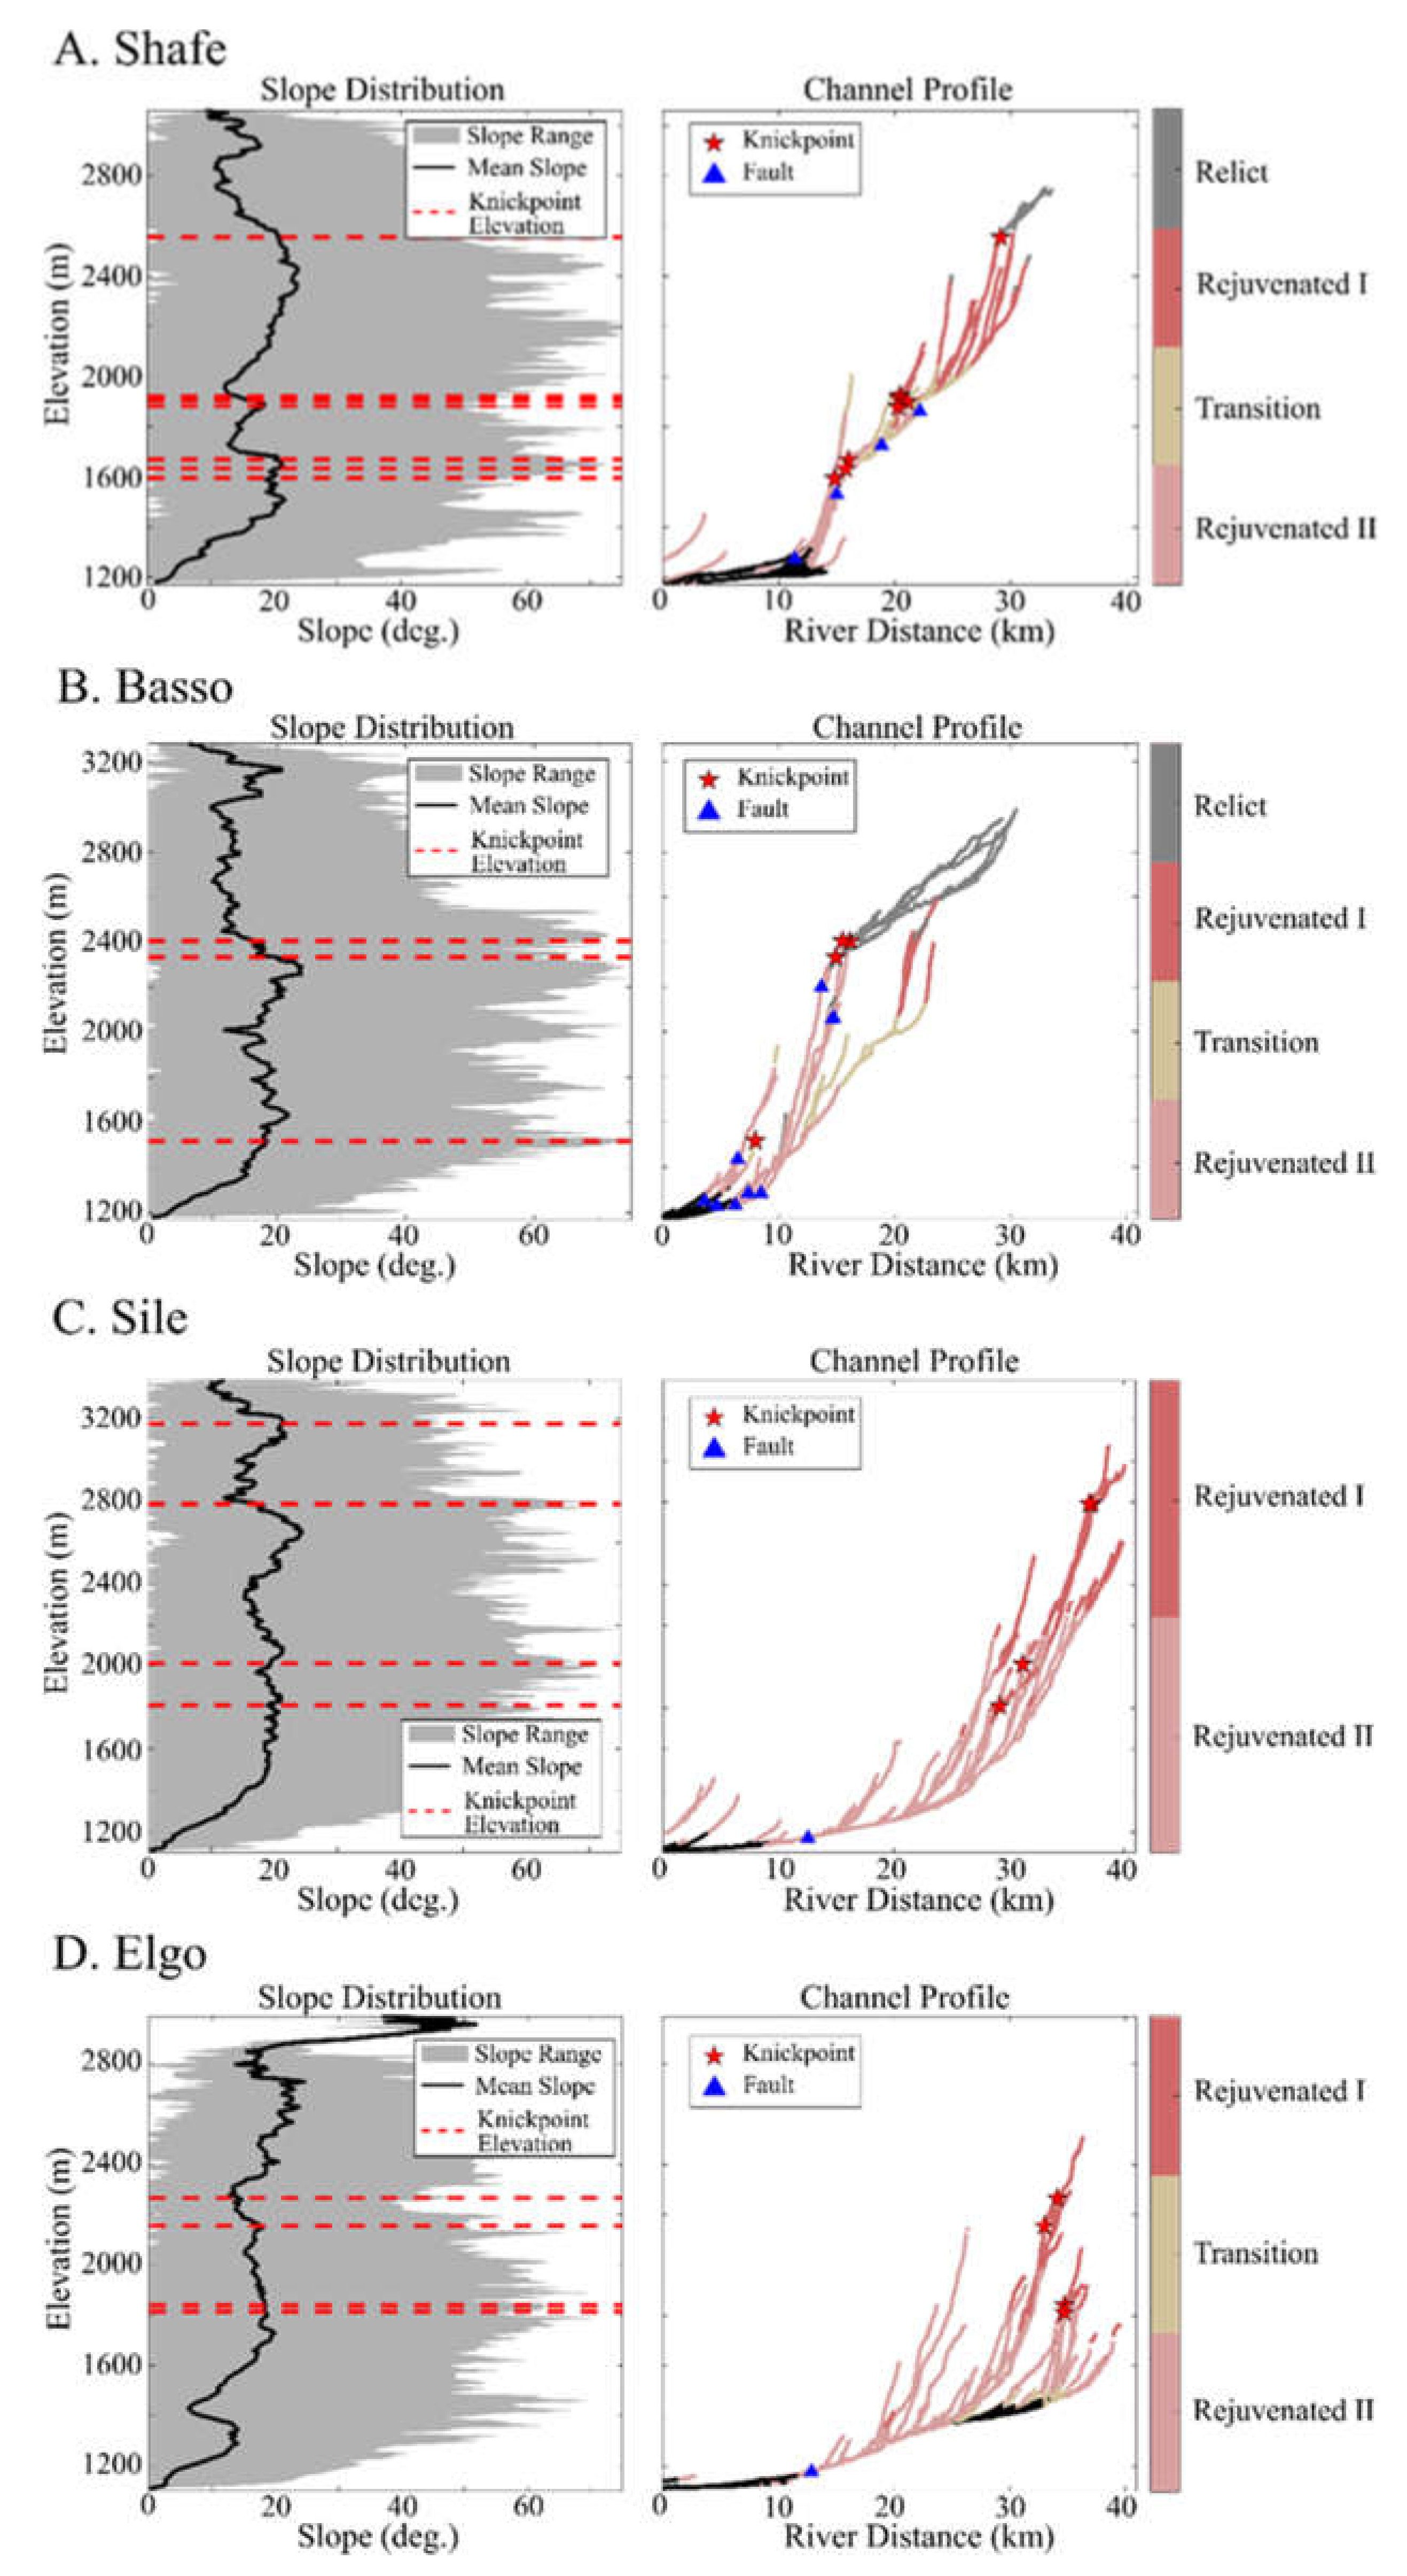
- The nature of the topography: knickpoints and landscape rejuvenation, elevation, slope angle, distance to river, and the presence of landslides;
- The nature of the lithology and the regolith: obtaining information on the spatial distribution of the regolith, its nature and its depth can be challenging [35,62,63]. Here, we used information on the lithology and soil properties as proxy, together with the relative age of the topography inferred from presence of landscape rejuvenation.
- The anthropogenic factors: LULC and its dynamics, population density, and road density.
3. Results
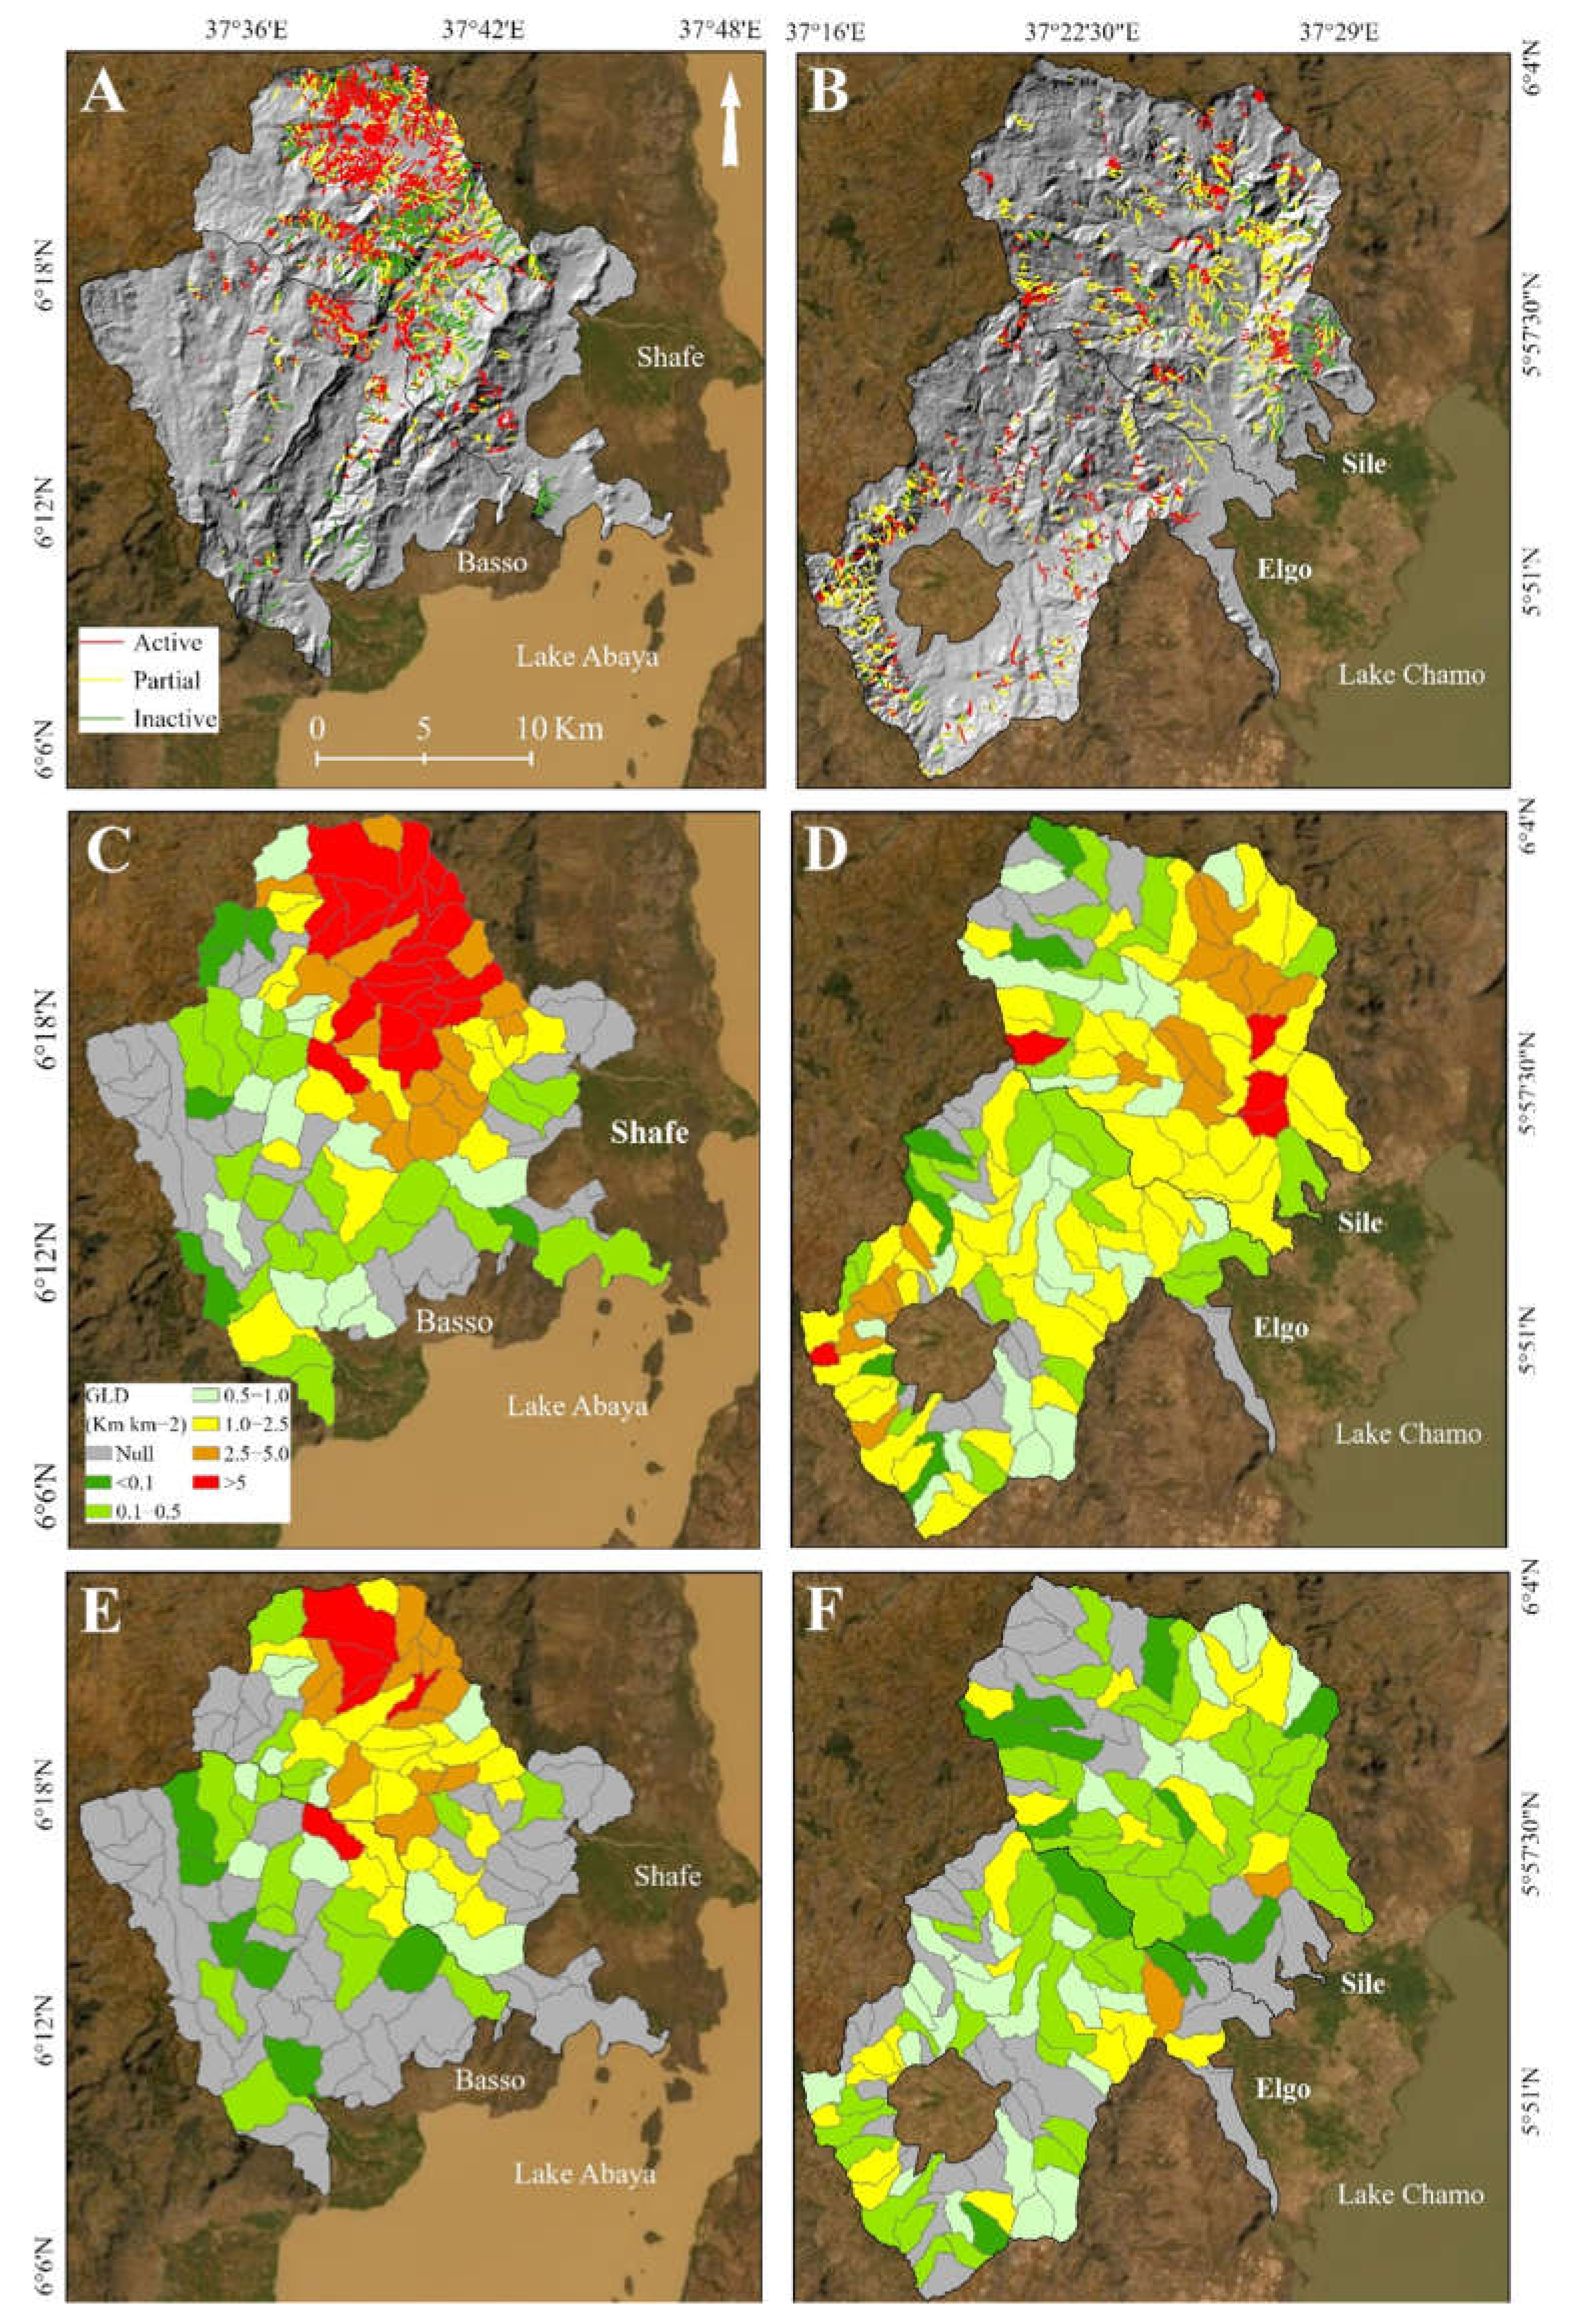
3.1. Inventory, Spatial Distribution and Characteristics of Gullies
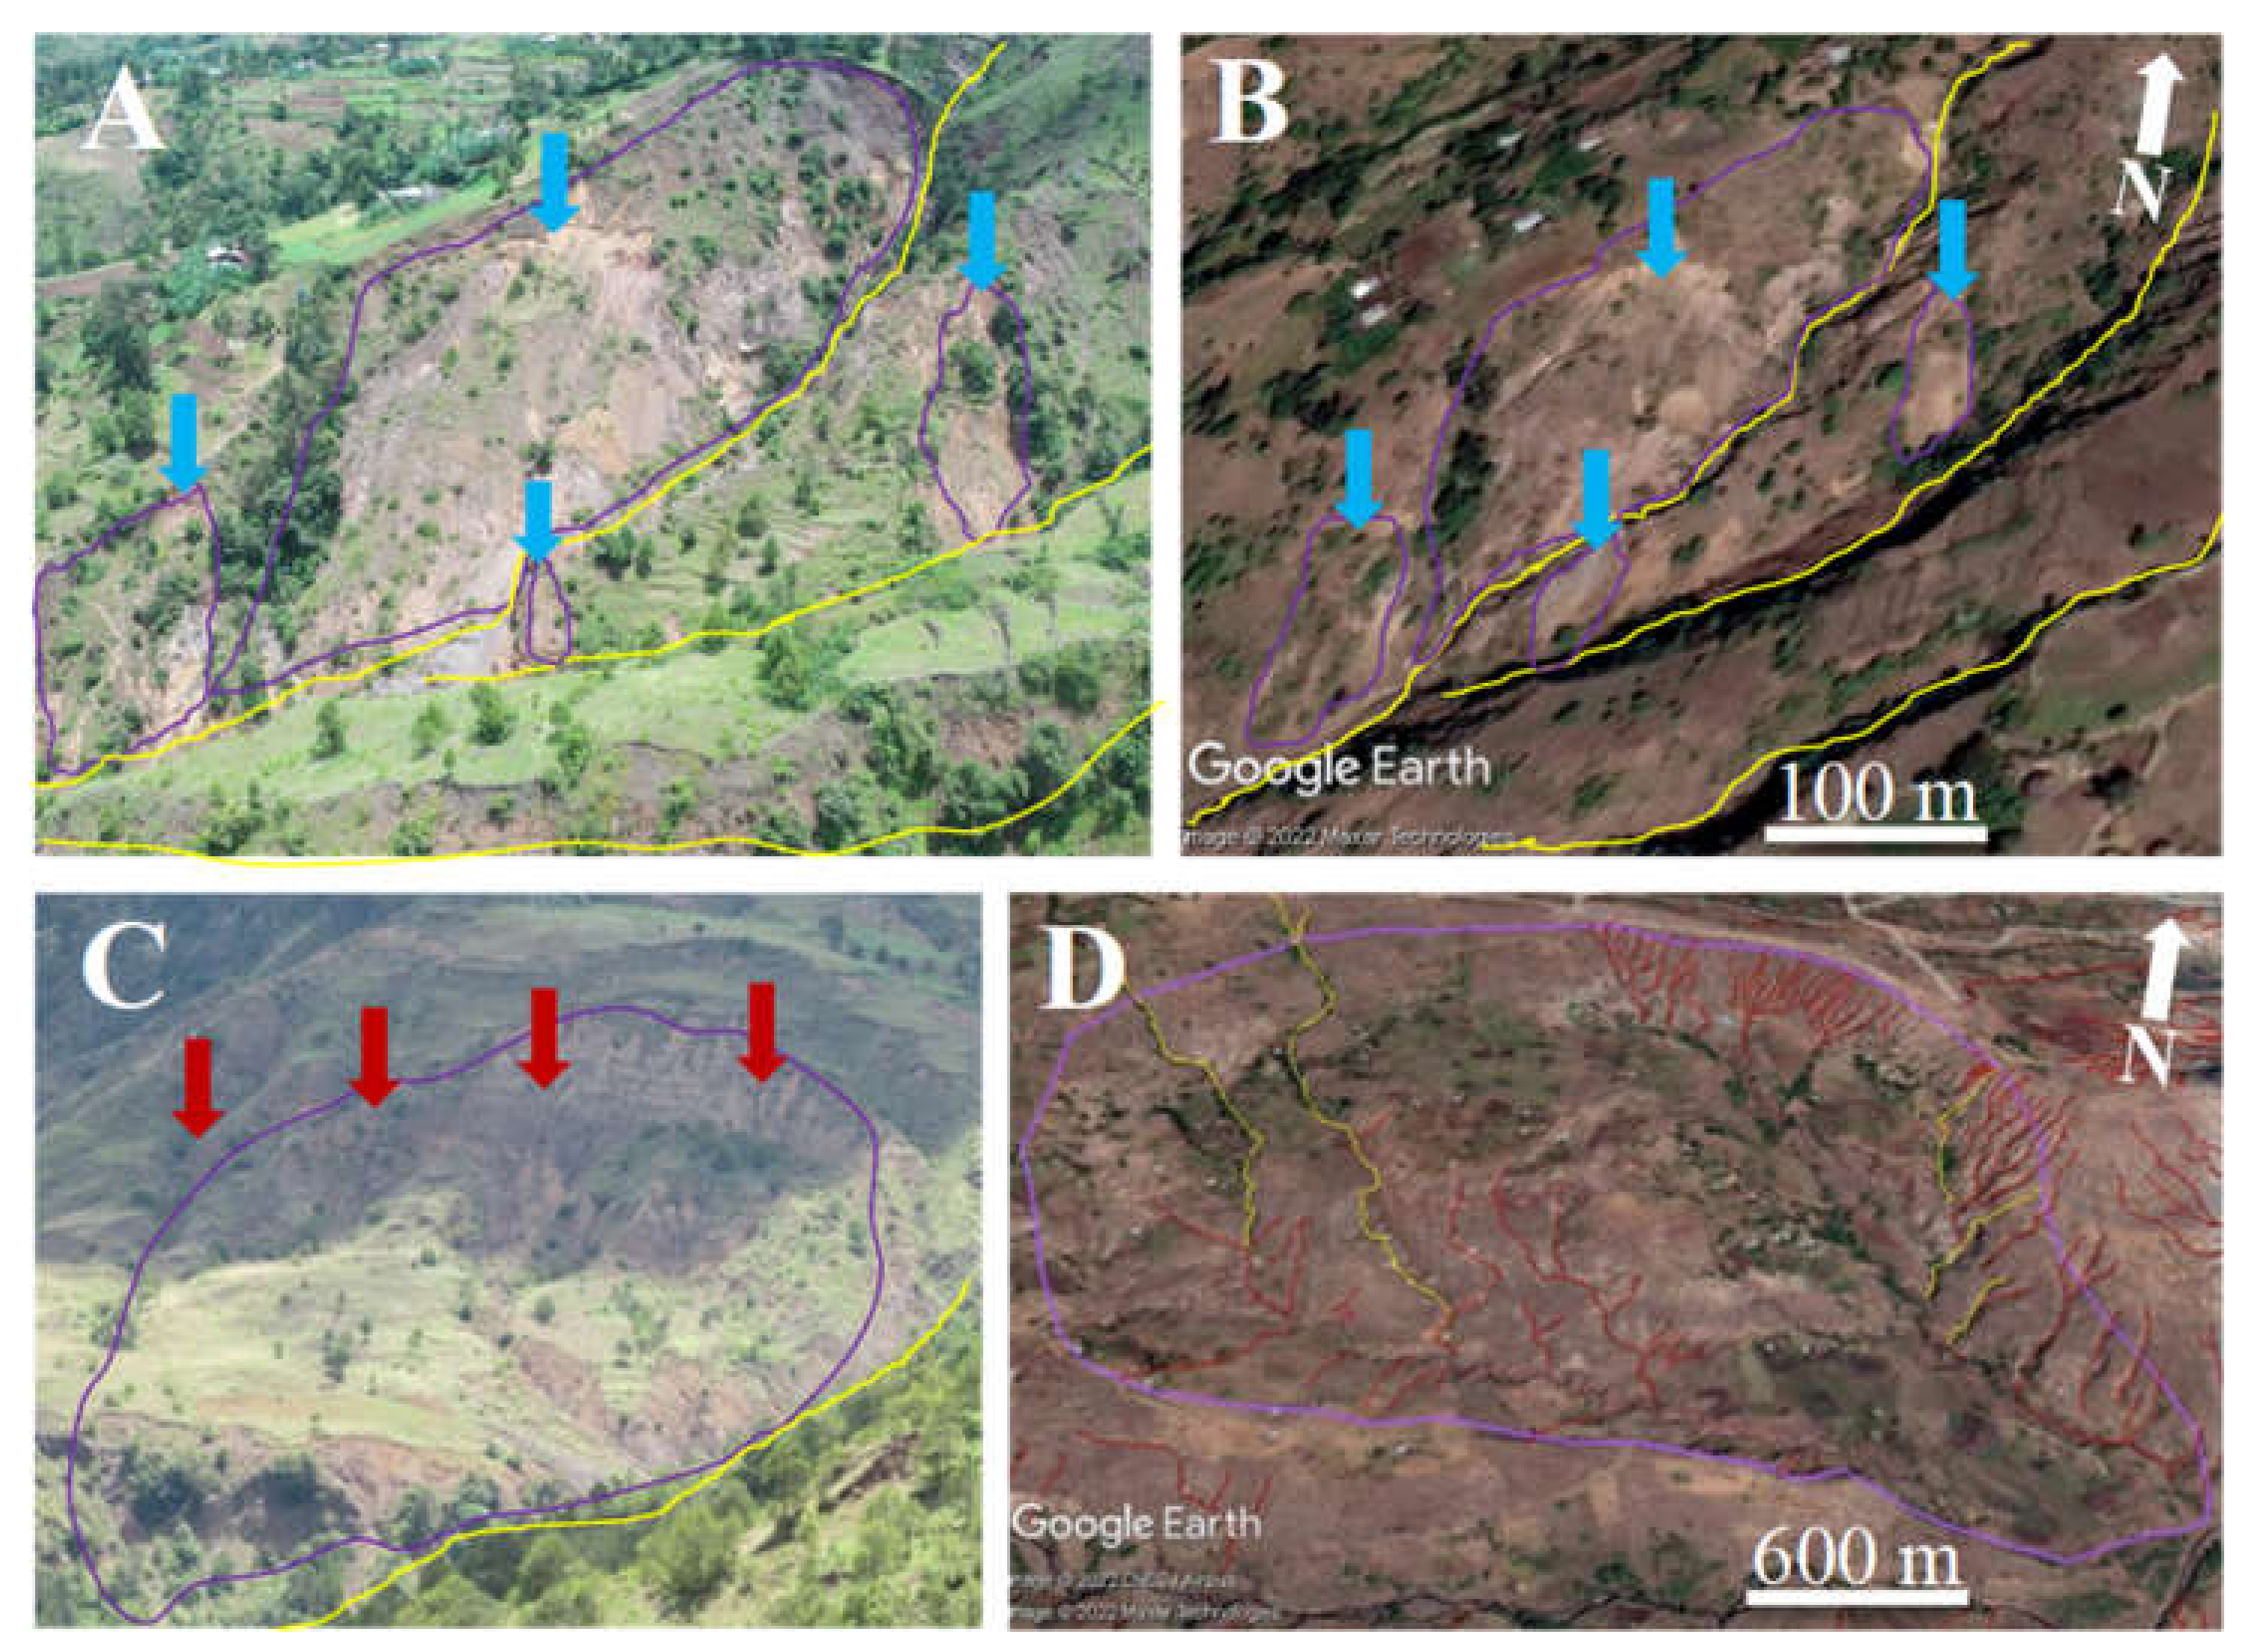
3.2. Inventory, Spatial Distribution and Characteristics of Landslides
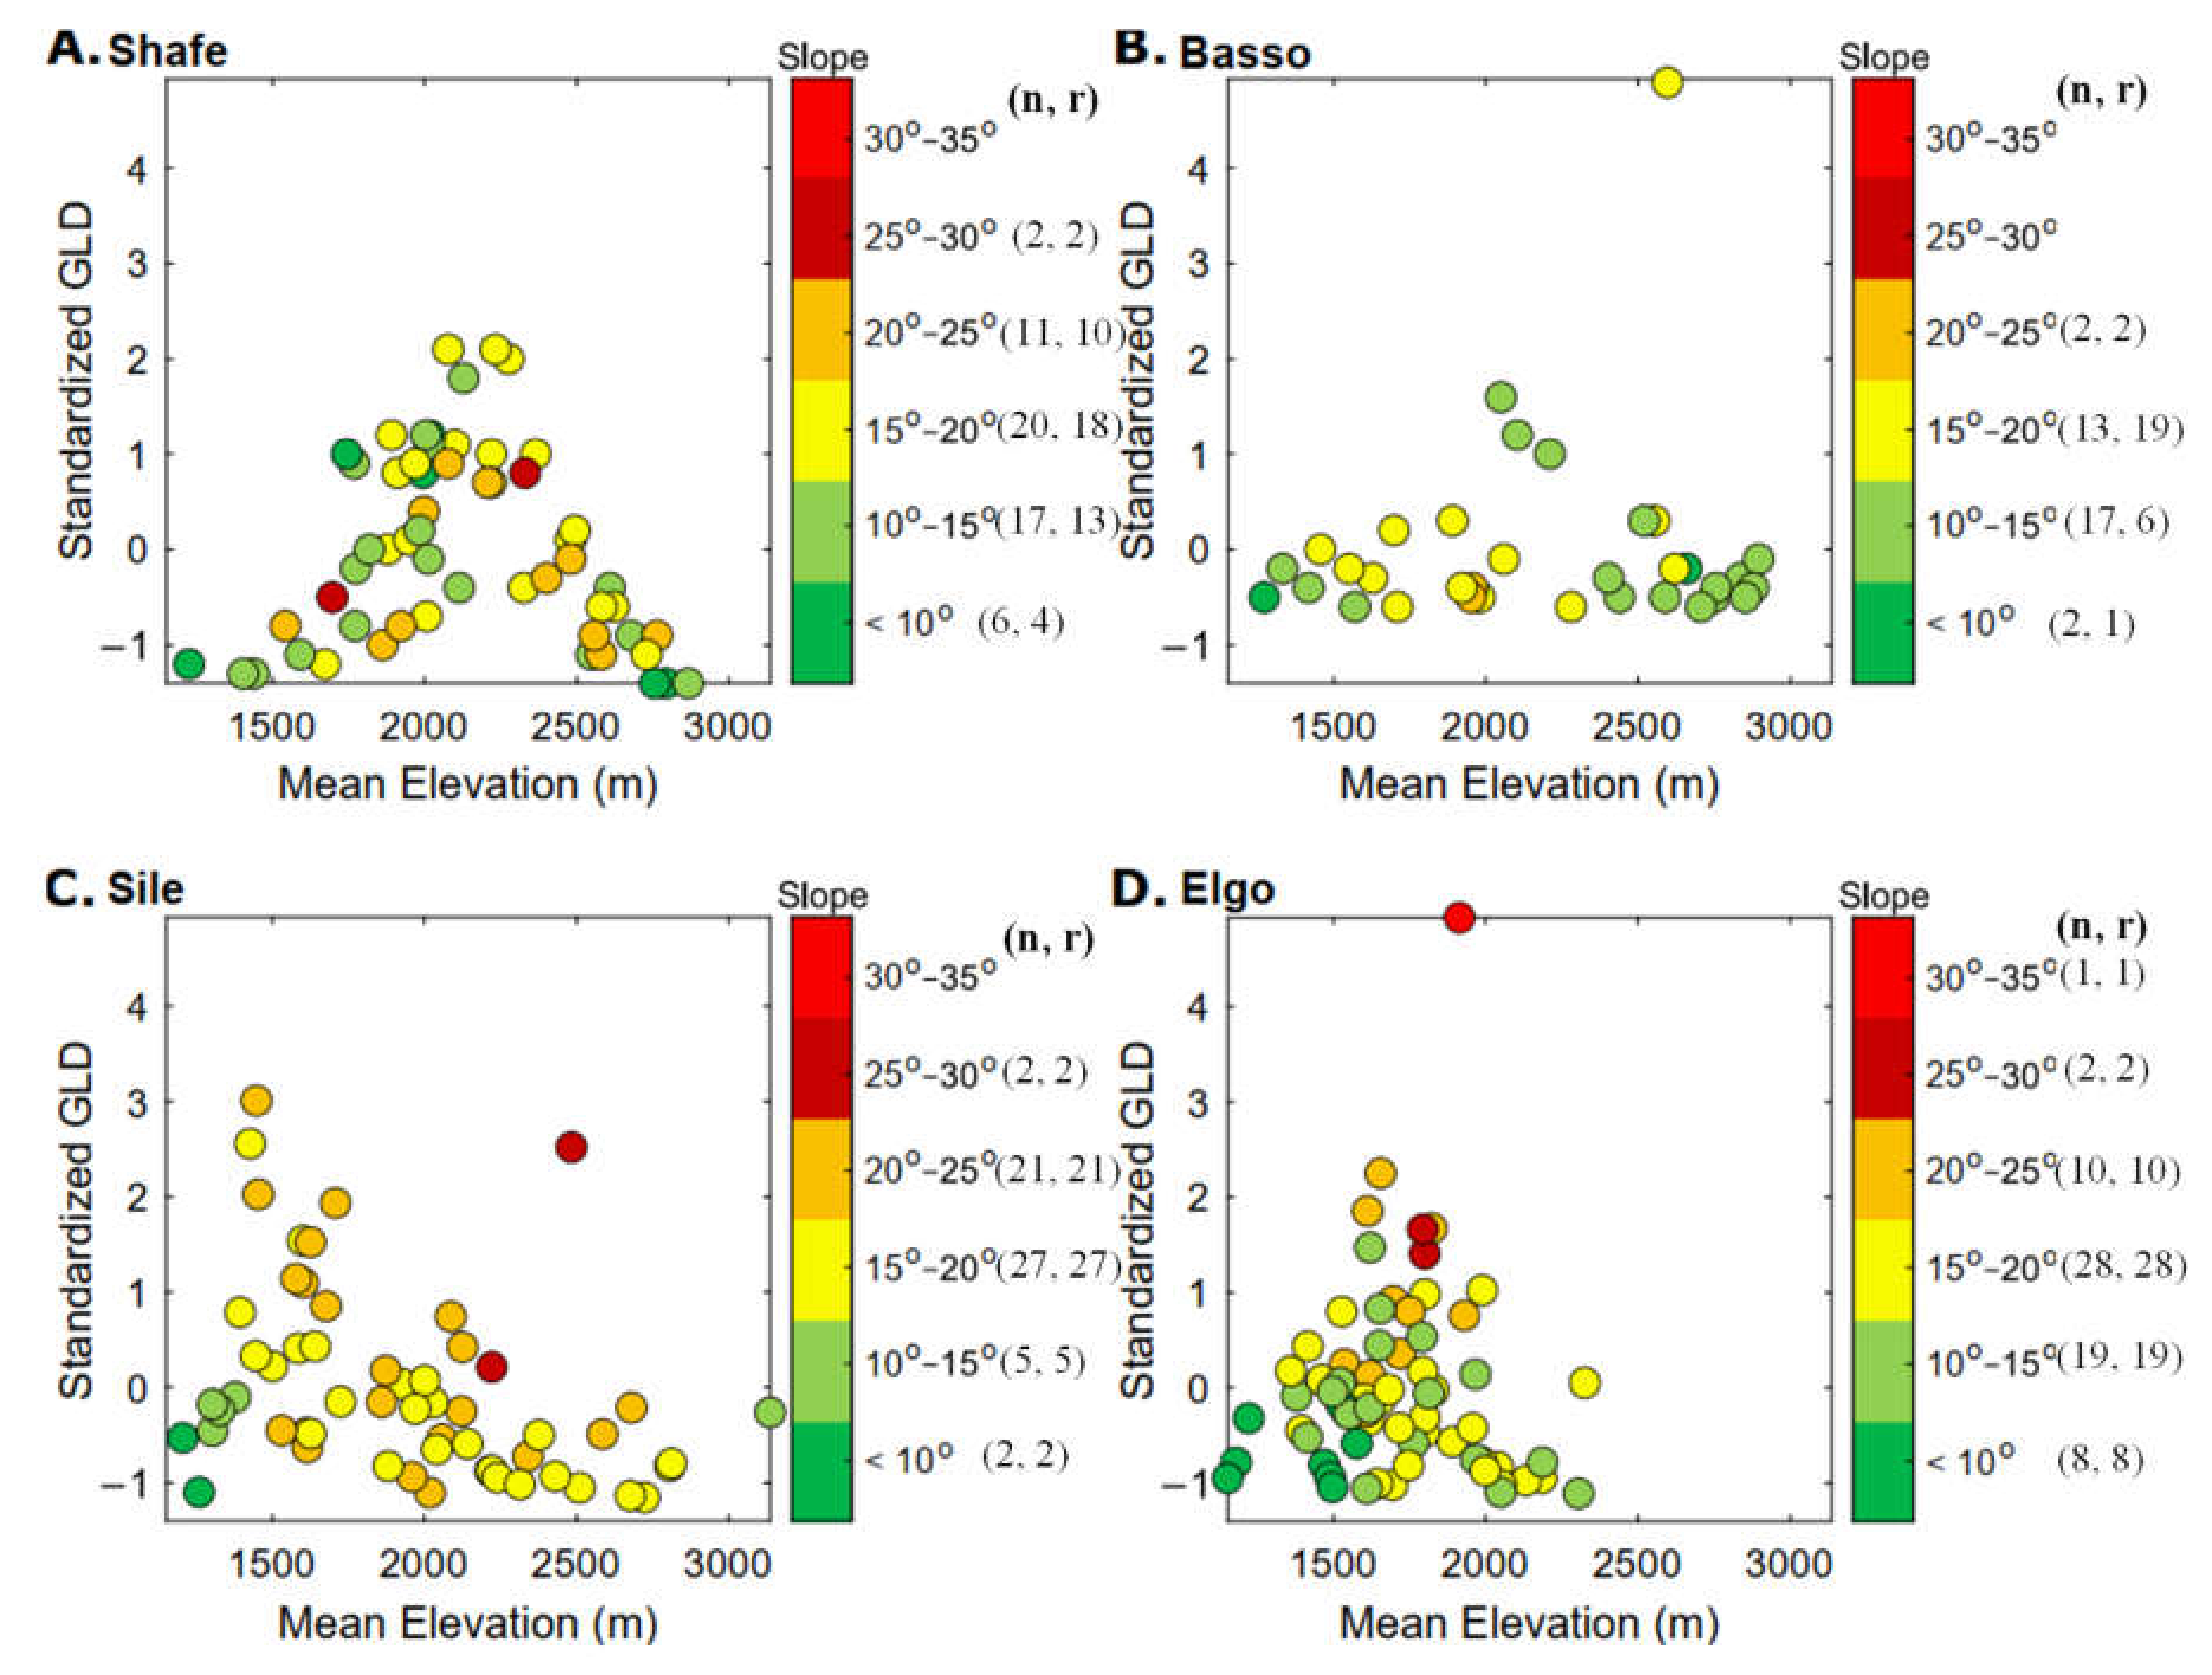
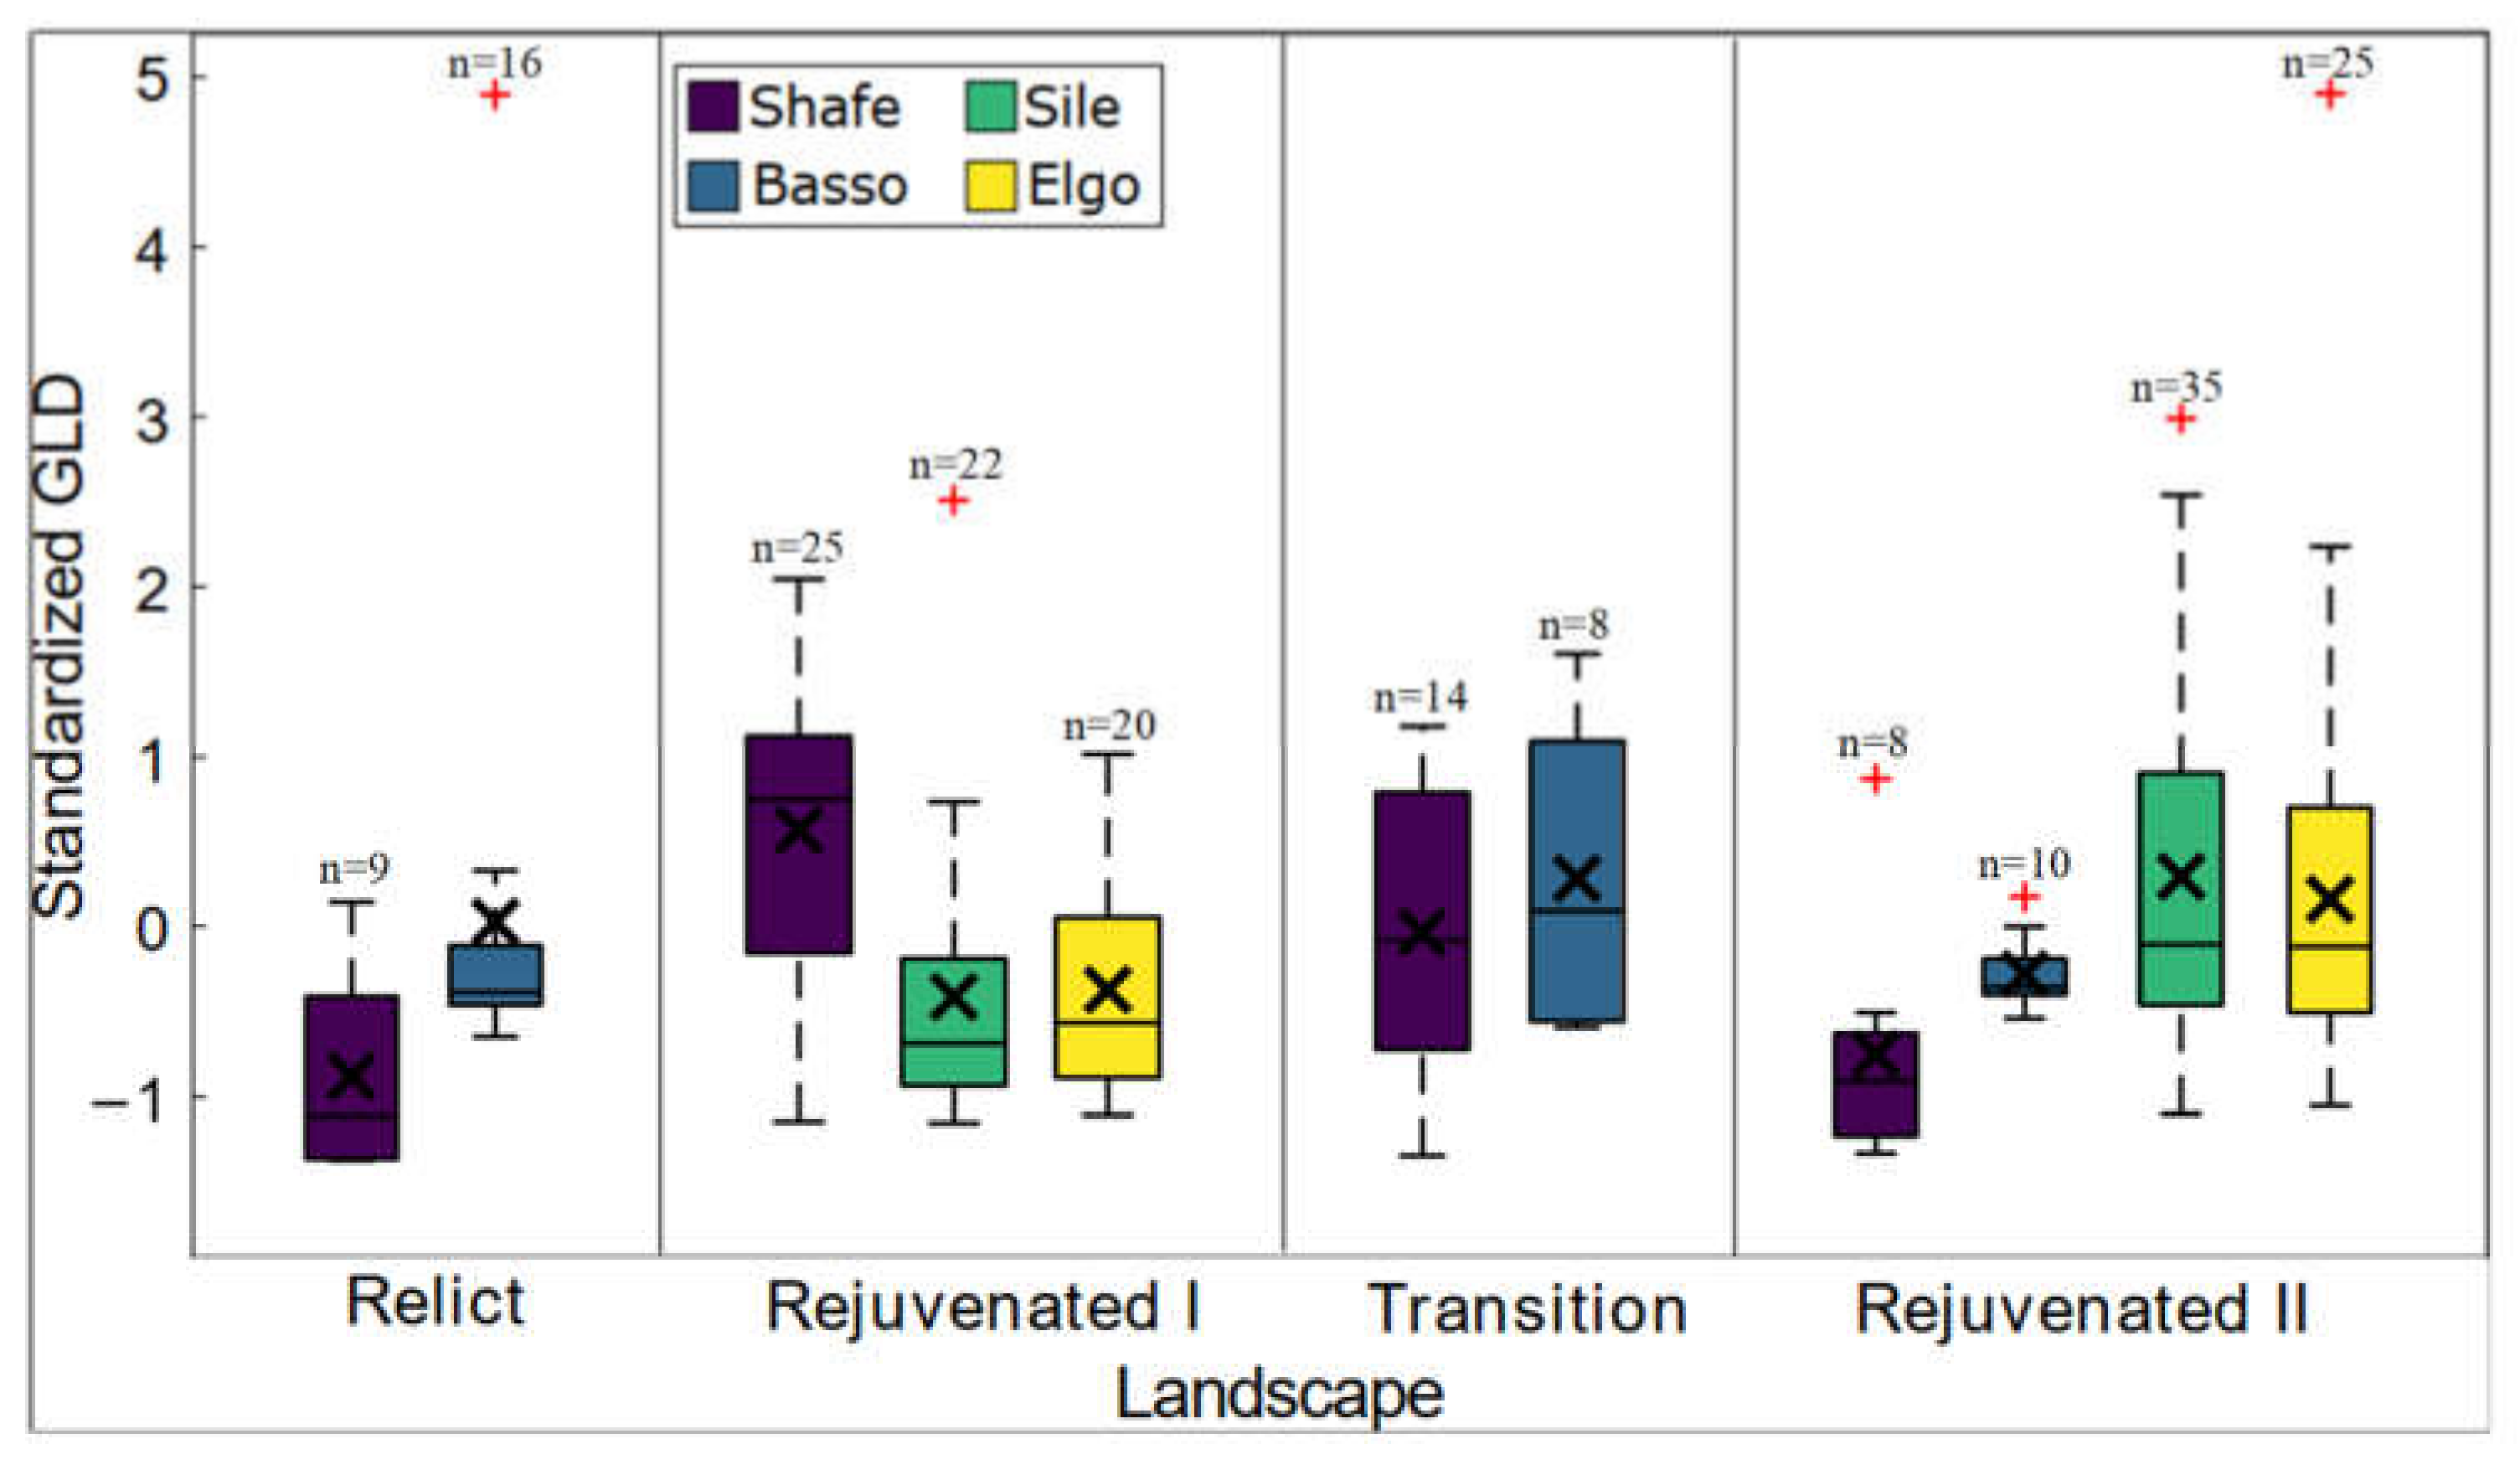
3.3. Controlling Factors of Gully Erosion
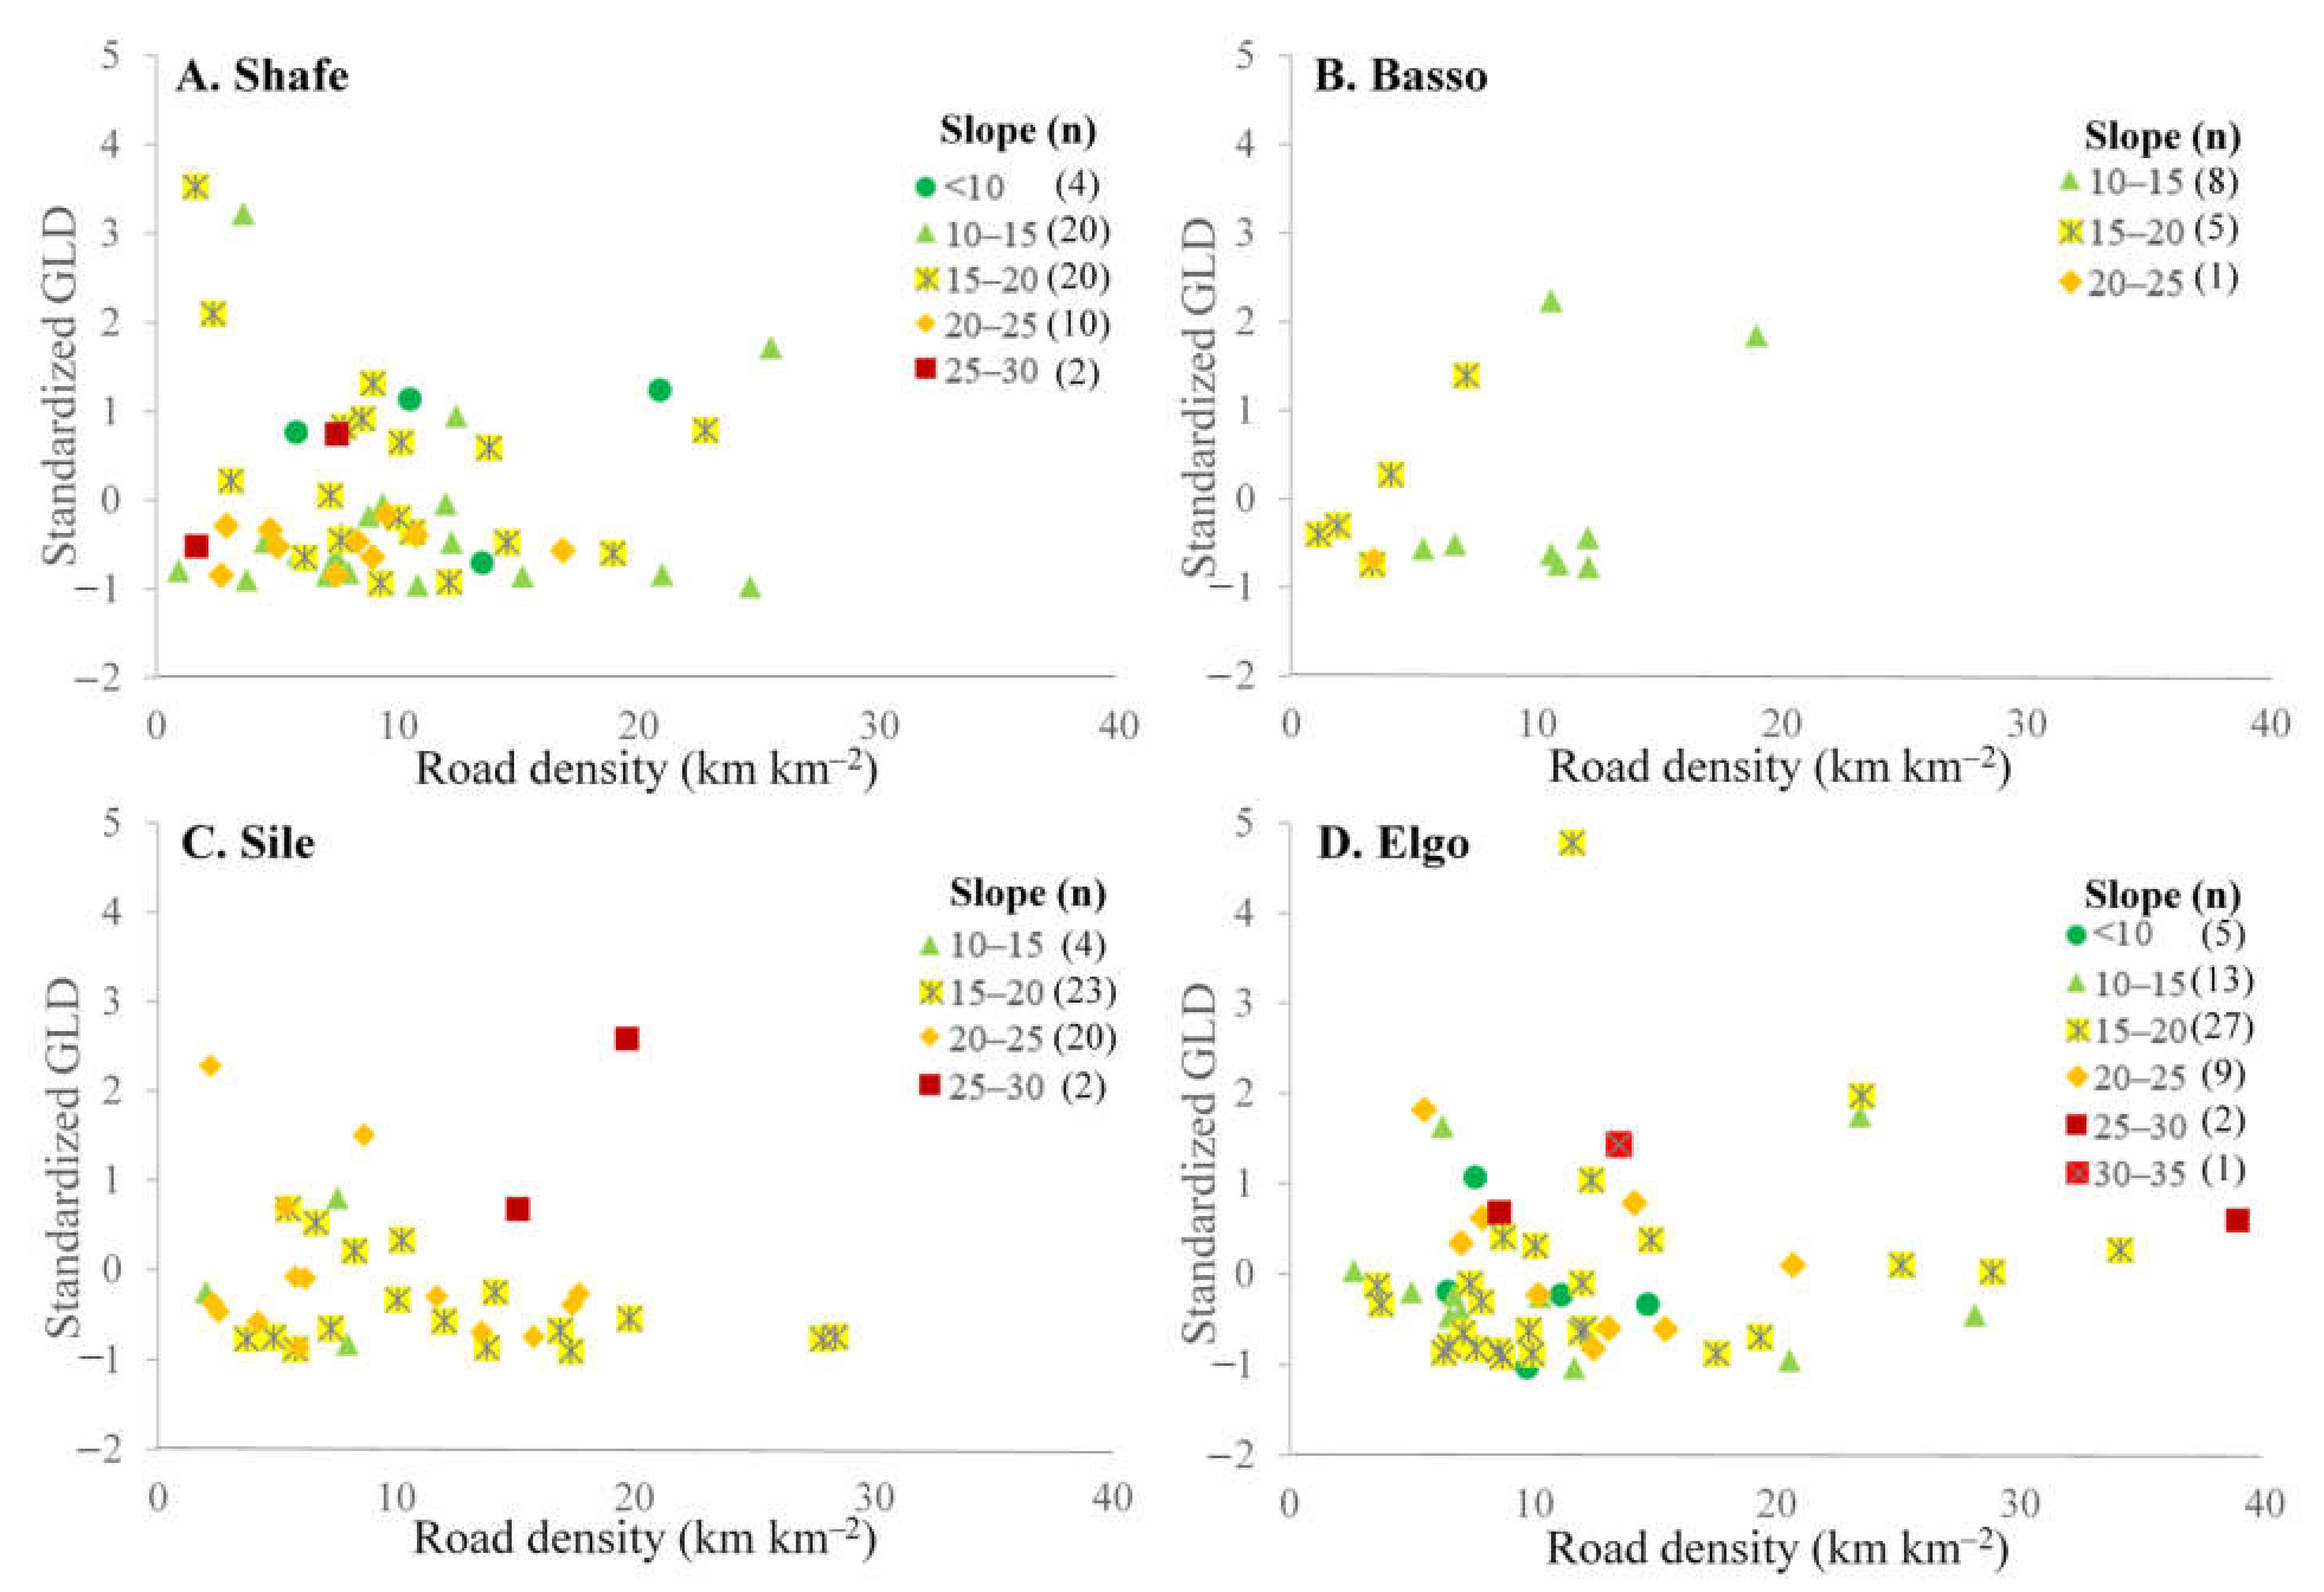
3.3.1. Topographic Controls
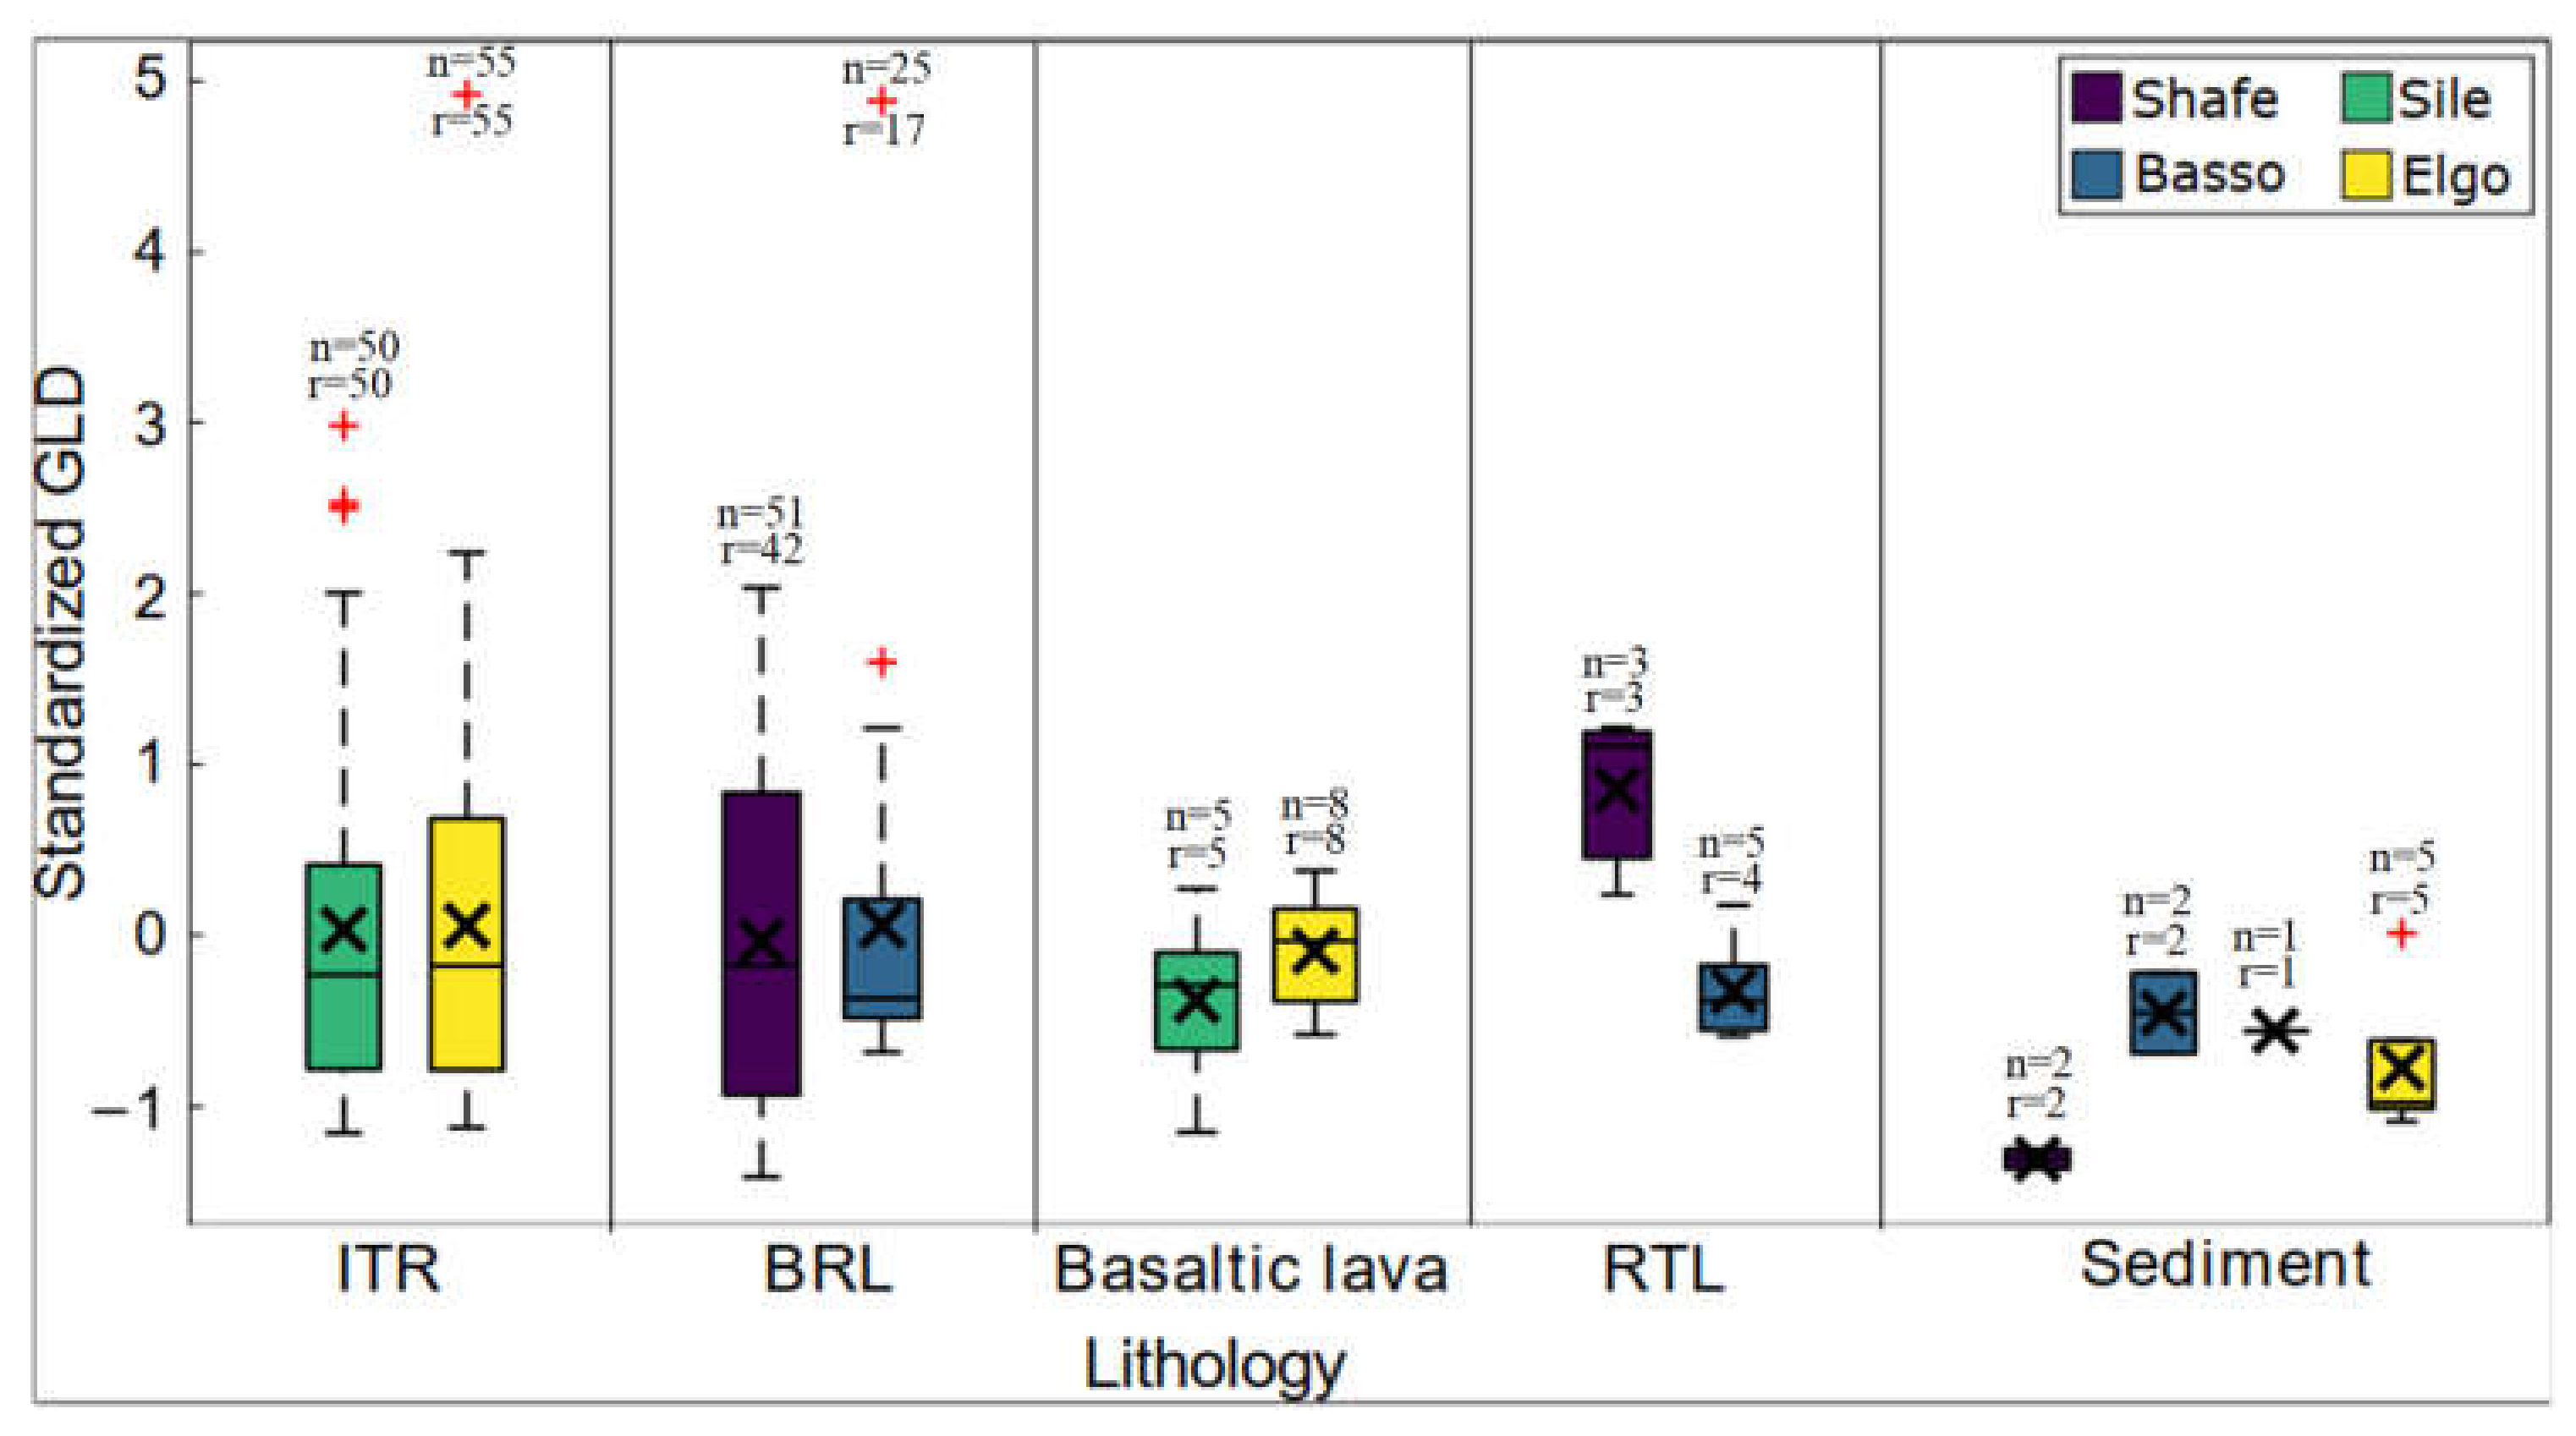
3.3.2. Lithologic and Soil Controls
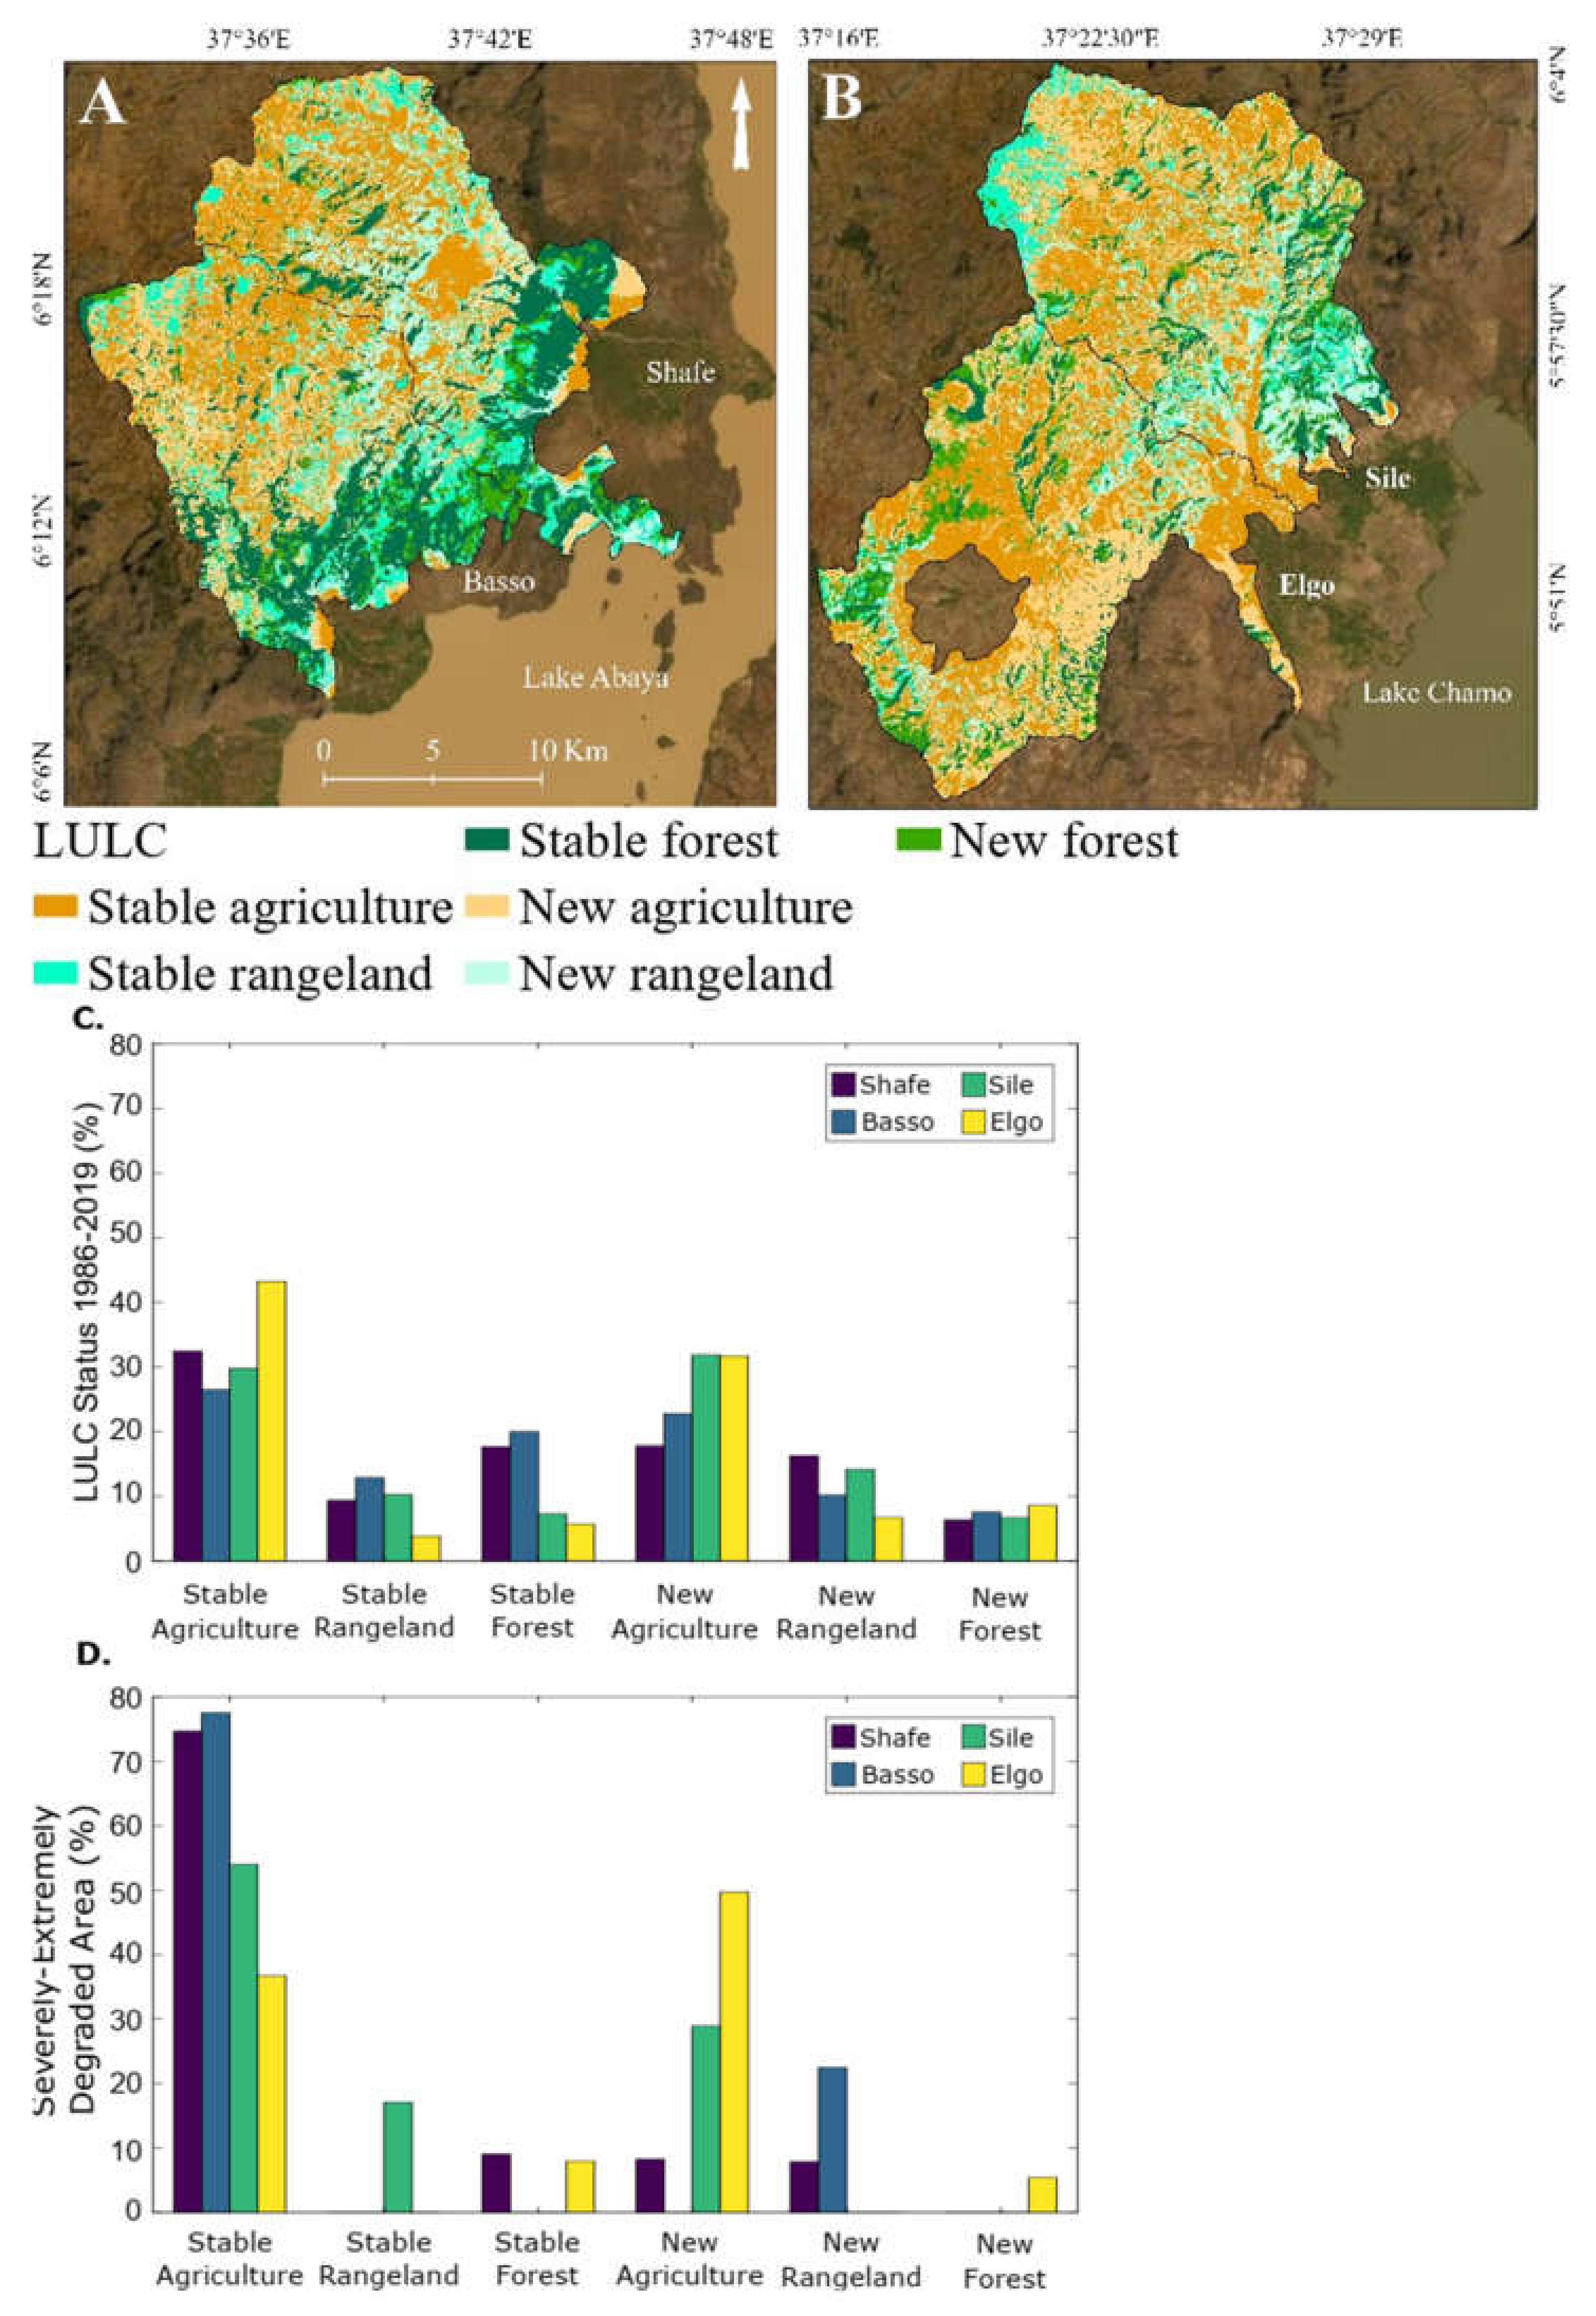
3.3.3. Anthropogenic Controls
3.3.4. Landslides
4. Discussion
4.1. Gully and Landslide Inventories, Data Reliability and Age of the Processes
4.2. Interactions between River Incision, Landslides and Gullies
4.3. The Role of Humans in the Occurrence of Gullies and Landslides
4.4. Gullies and Landslides as Sediment Source
5. Conclusions
Author Contributions
Funding
Institutional Review Board Statement
Informed Consent Statement
Data Availability Statement
Acknowledgments
Conflicts of Interest
Appendix A

| No. | Location | GLD (km km−2) | Climate | Dominant LULC | Dominant Soil/Parent Material | Area (km2) | Source |
|---|---|---|---|---|---|---|---|
| 1 | China, northeast | 0.3–1.2 | Dwb | Cropland | Luvic Phaeozem | 28 | [85] |
| 2 | China, northeast | 0–72.0 | Dwb | Cropland | Black, meadow, albic and dark brown soil | 164 | [94] |
| 3 | Latvia, south-east | 0–4.5 | Dfb | NA | Glacial, glacifluvial and alluvial deposits | 8423 | [95] |
| 4 | Australia, north-central Victoria | <5.2 | Cfb | Cropland and grazing land | Red/grey Vertisols, red Sodosols | 3300 | [52] |
| 5 | Australia, southeast | 0.6–0.9 | Cfb | Forest | NA | 192 | [72] |
| 6 | China, northeast | 1.9–2.4 | Dwb | Farmland | Mollisols with silty clay loam, high clay content and high SOM | 24 | [96] |
| 7 | DR Congo | 0.4–2 | Aw | Forest, few grasses | Sandy soils | 443 | [80] |
| 8 | Ethiopia, central | 0.6–1.2 | Aw | Cropland | Mollic Andosols | 24 | [87] |
| 9 | Ethiopia, central | 0.7–1.1 | Aw | Agriculture | Nitosols | 5.4 | [61] |
| 10 * | Ethiopia, north | 0.3–1 | Csb | Cultivated land | Acrisols, Leptosols, Regosols, Luvisols, and Vertisols | 21.5 | [97] |
| 11 | Ethiopia, north | 0.6–1.4 | Cwb | Agriculture | Leptosols | 12.6 | [59] |
| 12 | Ethiopia, north | 0–2.8 | BSh | Cropland | Cambisols, Leptosols and Regosols | 5142 | [50] |
| 13 | Ethiopia, central | 0.6–1.8 | Cwb | Arable land | Leptosols | 49.3 | [98] |
| 14 | Ethiopia, south | 0–10.6 | Aw | Agriculture | Cambisols and Nitosols | 756 | This study |
| 15 | Ethiopia, south | 0.5–1.7 | Aw | Cropland | Regosols | 5.7 | [60] |
| 16 * | Australia, north | 0–8.3 | BSh, Cfa, Cwa | NA | Luvisols, Regosols and Vertisols | 85,000 | [88] |
| 17 | Romania, Moldavia | 0.1–3 | Dfb | Agriculture | NA | 25,000 | [99] |
| 18 * | Russia, East | 0–4.2 | Dfb | Croplan, mixed forest | Gray forest soils and medium leached chernozem | 188,000 | [100] |
| 19 * | Russia, European territory | 0–0.5 | Dfb, Dfa | Arableland | Chalk, marls and sands | 15 | [101] |
References
- Donohue, I.; Garcia Molinos, J. Impacts of Increased Sediment Loads on the Ecology of Lakes. Biol. Rev. 2009, 84, 517–531. [Google Scholar] [CrossRef] [PubMed]
- Downing, J.A. Emerging Global Role of Small Lakes and Ponds: Little Things Mean a Lot. Limnetica 2010, 29, 9–24. [Google Scholar] [CrossRef]
- Verpoorter, C.; Kutser, T.; Seekell, D.A.; Tranvik, L.J. A Global Inventory of Lakes Based on High-Resolution Satellite Imagery. Geophys. Res. Lett. 2014, 41, 6396–6402. [Google Scholar] [CrossRef]
- Yang, X. Manual on Sediment Management and Measurement; World Meteorological Organization Operational Hydrology Report No. 47; Secretariat of the World Meteorological Organization: Geneva, Switzerland, 2003; ISBN 9263109486. [Google Scholar]
- Syvitski, J.P.M.; Vörösmarty, C.J.; Kettner, A.J.; Green, P. Impact of Humans on the Flux of Terrestrial Sediment to the Global Coastal Ocean. Science 2005, 308, 376–380. [Google Scholar] [CrossRef]
- Olago, D.O.; Odada, E.O. Sediment Impacts in Africa’s Transboundary Lake/River Basins: Case Study of the East African Great Lakes. Aquat. Ecosyst. Health Manag. 2007, 10, 23–32. [Google Scholar] [CrossRef]
- Ayenew, T.; Legesse, D. The Changing Face of the Ethiopian Rift Lakes and Their Environs: Call of the Time. Lakes Reserv. Res. Manag. 2007, 12, 149–165. [Google Scholar] [CrossRef]
- Belete, M.D.; Hebart-Coleman, D.; Mathews, R.E.; Zazu, C. Building Foundations for Source-to-Sea Management: The Case of Sediment Management in the Lake Hawassa Sub-Basin of the Ethiopian Rift Valley. Water Int. 2021, 46, 138–156. [Google Scholar] [CrossRef]
- Schϋtt, B.; Thiemann, S. Kulfo River, South Ethiopia as a Regulator of Lake Level Changes in the Lake Abaya-Lake Chamo System. Zbl. Geol. Paläont. 2006, 1, 129–143. [Google Scholar]
- Teffera, F.E. The Ecology of the Major Ethiopian Rift Valley Lakes Abaya and Chamo, with Special Reference to Water Quality and Food Web Structure. Ph.D. Thesis, KU Leuven, Leuven, Belgium, 2016. [Google Scholar]
- Schütt, B.; Förch, G.; Bekele, S.; Thiemann, S. Modern Water Level and Sediment Accumulation Changes of Lake Abaya, Southern Ethiopia—A Case Study from the Northern Lake Area. Water Res. Environ. 2002, 2, 418–422. [Google Scholar]
- Assefa, E. Landscape Dynamics and Sustainable Land Management in Southern Ethiopia. Ph.D. Thesis, Christian-Albrechts-Universität Zu Kiel, Kiel, Germany, 2012. [Google Scholar]
- Martínek, K.; Verner, K.; Hroch, T.; Megerssa, L.; Kopačková, V.; Buriánek, D.; Muluneh, A.; Kalinová, R.; Yakob, M.; Kassa, M. Main Ethiopian Rift Landslides Formed in Contrasting Geological Settings and Climatic Conditions. Nat. Hazards Earth Syst. Sci. 2021, 21, 3465–3487. [Google Scholar] [CrossRef]
- Shi-Biao, B.; Wang, J.; Lü, G.; Zhou, P.; Hou, S.; Xu, S.-N. GIS-Based Logistic Regression for Landslide Susceptibility Mapping of the Zhongxian Segment in the Three Gorges Area, China. Geomorphology 2010, 115, 23–31. [Google Scholar] [CrossRef]
- Ost, L.; van den Eeckhaut, M.; Poesen, J.; Vanmaercke-Gottigny, M.C. Characteristics and Spatial Distribution of Large Landslides in the Flemish Ardennes (Belgium). Z. Geomorphol. 2003, 47, 329–350. [Google Scholar] [CrossRef]
- Valentin, C.; Poesen, J.; Li, Y. Gully Erosion: Impacts, Factors and Control. Catena 2005, 63, 132–153. [Google Scholar] [CrossRef]
- Vanmaercke, M.; Poesen, J.; Van Mele, B.; Demuzere, M.; Bruynseels, A.; Golosov, V.; Rodrigues Bezerra, J.; Bolysov, S.; Dvinskih, A.; Frankl, A.; et al. How Fast Do Gully Headcuts Retreat? Earth-Sci. Rev. 2016, 154, 336–355. [Google Scholar] [CrossRef]
- Poesen, J.; Nachtergaele, J.; Verstraeten, G.; Valentin, C. Gully Erosion and Environmental Change: Importance and Research Needs. Catena 2003, 50, 91–133. [Google Scholar] [CrossRef]
- Chesworth, W. Slope Classes. Encyclopedia of Soil Science; Encyclopedia of Earth Sciences Series; Springer: Dordrecht, The Natherlands, 2008. [Google Scholar] [CrossRef]
- Mackey, B.H.; Roering, J.J. Sediment Yield, Spatial Characteristics, and the Long-Term Evolution of Active Earthflows Determined from Airborne LiDAR and Historical Aerial Photographs, Eel River, California. Bull. Geol. Soc. Am. 2011, 123, 1560–1576. [Google Scholar] [CrossRef]
- Whipp, D.M.; Ehlers, T.A. Quantifying Landslide Frequency and Sediment Residence Time in the Nepal Himalaya. Sci. Adv. 2019, 5, eaav348. [Google Scholar] [CrossRef] [Green Version]
- Sidle, R.C.; Bogaard, T.A. Dynamic Earth System and Ecological Controls of Rainfall-Initiated Landslides. Earth-Sci. Rev. 2016, 159, 275–291. [Google Scholar] [CrossRef]
- Marc, O.; Behling, R.; Andermann, C.; Turowski, J.M.; Illien, L.; Roessner, S.; Hovius, N. Long-Term Erosion of the Nepal Himalayas by Bedrock Landsliding: The Role of Monsoons, Earthquakes and Giant Landslides. Earth Surf. Dyn. 2019, 7, 107–128. [Google Scholar] [CrossRef] [Green Version]
- Depicker, A.; Govers, G.; Jacobs, L.; Campforts, B.; Uwihirwe, J.; Dewitte, O. Interactions between Deforestation, Landscape Rejuvenation, and Shallow Landslides in the North Tanganyika-Kivu Rift Region, Africa. Earth Surf. Dyn. 2021, 9, 445–462. [Google Scholar] [CrossRef]
- Dewitte, O.; Dille, A.; Depicker, A.; Kubwimana, D.; Maki Mateso, J.C.; Mugaruka Bibentyo, T.; Uwihirwe, J.; Monsieurs, E. Constraining Landslide Timing in a Data-Scarce Context: From Recent to Very Old Processes in the Tropical Environment of the North Tanganyika-Kivu Rift Region. Landslides 2021, 18, 161–177. [Google Scholar] [CrossRef]
- Nyssen, J.; Moeyersons, J.; Poesen, J.; Deckers, J.; Haile, M. The Environmental Significance of the Remobilisation of Ancient Mass Movements in the Atbara—Tekeze Headwaters, Northern Ethiopia. Geomorphology 2002, 49, 303–322. [Google Scholar] [CrossRef]
- Poesen, J. Soil Erosion in the Anthropocene: Research Needs. Earth Surf. Processes Landf. 2018, 43, 64–84. [Google Scholar] [CrossRef]
- Corti, G. Continental Rift Evolution: From Rift Initiation to Incipient Break-up in the Main Ethiopian Rift, East Africa. Earth-Sci. Rev. 2009, 96, 1–53. [Google Scholar] [CrossRef]
- Saria, E.; Calais, E.; Stamps, D.S.; Delvaux, D.; Hartnady, C.J.H. Present-Day Kinematics of the East African Rift. J. Geophys. Res. Solid Earth 2014, 119, 3584–3600. [Google Scholar] [CrossRef]
- Larsen, M.C. Landslides and Sediment Budgets in Four Watersheds in Eastern Puerto Rico. In Water Quality and Landscape Processes of Four Watersheds in Eastern Puerto Rico; USGS: Reston, VA, USA, 2012; pp. 153–178. [Google Scholar]
- Bennett, G.L.; Miller, S.R.; Roering, J.J.; Schmidt, D.A. Landslides, Threshold Slopes, and the Survival of Relict Terrain in the Wake of the Mendocino Triple Junction. Geology 2016, 44, 363–366. [Google Scholar] [CrossRef] [Green Version]
- Schoenbohm, L.M.; Whipple, K.X.; Burchfiel, B.C.; Chen, L. Geomorphic Constraints on Surface Uplift, Exhumation, and Plateau Growth in the Red River Region, Yunnan Province, China. Bull. Geol. Soc. Am. 2004, 116, 895–909. [Google Scholar] [CrossRef]
- Menéndez-Duarte, R.; Marquínez, J.; Fernández-Menéndez, S.; Santos, R. Incised Channels and Gully Erosion in Northern Iberian Peninsula: Controls and Geomorphic Setting. Catena 2007, 71, 267–278. [Google Scholar] [CrossRef]
- Clarke, B.A.; Burbank, D.W. Quantifying Bedrock—Fracture Patterns within the Shallow Subsurface: Implications for Rock Mass Strength, Bedrock Landslides, and Erodibility. J. Geophys. Res. Earth Surf. 2011, 116, F04009. [Google Scholar] [CrossRef] [Green Version]
- Braun, J.; Mercier, J.; Guillocheau, F.; Robin, C. A Simple Model for Regolith Formation by Chemical Weathering. J. Geophys. Res. Earth Surf. 2016, 121, 2140–2171. [Google Scholar] [CrossRef] [Green Version]
- Brosens, L.; Broothaerts, N.; Campforts, B.; Jacobs, L.; Razanamahandry, V.F.; Van Moerbeke, Q.; Bouillon, S.; Razafimbelo, T.; Rafolisy, T.; Govers, G. Under Pressure: Rapid Lavaka Erosion and Floodplain Sedimentation in Central Madagascar. Sci. Total Environ. 2022, 806, 150483. [Google Scholar] [CrossRef] [PubMed]
- Brosens, L.; Campforts, B.; Robinet, J.; Vanacker, V.; Opfergelt, S.; Ameijeiras-Mariño, Y.; Minella, J.P.G.; Govers, G. Slope Gradient Controls Soil Thickness and Chemical Weathering in Subtropical Brazil: Understanding Rates and Timescales of Regional Soilscape Evolution Through a Combination of Field Data and Modeling. J. Geophys. Res. Earth Surf. 2020, 125, e2019JF005321. [Google Scholar] [CrossRef]
- Bonini, M.; Corti, G.; Innocenti, F.; Manetti, P.; Mazzarini, F.; Abebe, T.; Pecskay, Z. Evolution of the Main Ethiopian Rift in the Frame of Afar and Kenya Rifts Propagation. Tectonics 2005, 24, TC1007. [Google Scholar] [CrossRef]
- Molin, P.; Corti, G. Topography, River Network and Recent Fault Activity at the Margins of the Central Main Ethiopian Rift (East Africa). Tectonophysics 2015, 664, 67–82. [Google Scholar] [CrossRef]
- Minda, T.T.; van der Molen, M.K.; Struik, P.C.; Combe, M.; Jiménez, P.A.; Khan, M.S.; de Arellano, J.V.G. The Combined Effect of Elevation and Meteorology on Potato Crop Dynamics: A 10-Year Study in the Gamo Highlands, Ethiopia. Agric. For. Meteorol. 2018, 262, 166–177. [Google Scholar] [CrossRef]
- MOWR. Rift Valley Lakes Basin Integrated Resources Development Master Plan Study Project. Part II Prefeasibility Studies; Federal Democratic Republic of Ethiopia, Ministry of Water Resources: Addis Ababa, Ethiopia, 2010; (unpublished).
- Teffera, F.; Lemmens, P.; Deriemaecker, A.; Brendonck, L.; Dondeyne, S.; Deckers, J.; Bauer, H.; Gamo, F.W.; Meester, L.D. A Call to Action: Strong Long-Term Limnological Changes in the Two Largest Ethiopian Rift Valley Lakes, Abaya and Chamo. Inland Waters 2017, 2041, 129–137. [Google Scholar] [CrossRef] [Green Version]
- Beck, H.E.; Zimmermann, N.E.; McVicar, T.R.; Vergopolan, N.; Berg, A.; Wood, E.F. Present and Future Köppen-Geiger Climate Classification Maps at 1-Km Resolution. Sci. Data 2018, 5, 180214. [Google Scholar] [CrossRef] [Green Version]
- Assefa, E.; Bork, H. Dynamics and Driving Forces of Agricultural Landscapes in Southern Ethiopia—A Case Study of the Chencha and Arbaminch Areas. J. Land Use Sci. 2017, 11, 278–293. [Google Scholar] [CrossRef]
- Wagesho, N. Catchment Dynamics and Its Impact on Runoff Generation: Coupling Watershed Modelling and Statistical Analysis to Detect Catchment Responses. Int. J. Water Resour. Environ. Eng. 2015, 6, 73–87. [Google Scholar] [CrossRef] [Green Version]
- NMA. Dekadal Rainfall. Adjusted Rainfall Reconstruction Data. Ethiopian National Meteorological Agency. 2020. Available online: https://iridl.ldeo.columbia.edu/SOURCES/.Ethiopia/ (accessed on 14 May 2020).
- Dewitte, O.; Jones, A.; Elbelrhiti, H.; Horion, S.; Montanarella, L. Satellite Remote Sensing for Soil Mapping in Africa: An Overview. Prog. Phys. Geogr. 2012, 36, 514–538. [Google Scholar] [CrossRef]
- Guzzetti, F.; Mondini, A.C.; Cardinali, M.; Fiorucci, F.; Santangelo, M.; Chang, K.T. Landslide Inventory Maps: New Tools for an Old Problem. Earth-Sci. Rev. 2012, 112, 42–66. [Google Scholar] [CrossRef] [Green Version]
- Desprats, J.F.; Raclot, D.; Rousseau, M.; Cerdan, O.; Garcin, M.; Bissonnais, Y.L.E.; Slimane, A.B.E.N.; Fouche, J. Mapping Linear Erosion Features Using High and Very High Resolution Satellite Imagery. Land Degrad. Dev. 2013, 32, 22–32. [Google Scholar] [CrossRef]
- Guyassa, E.; Frankl, A.; Zenebe, A.; Poesen, J.; Nyssen, J. Gully and Soil and Water Conservation Structure Densities in Semi-Arid Northern Ethiopia over the Last 80 Years. Earth Surf. Processes Landf. 2018, 43, 1848–1859. [Google Scholar] [CrossRef]
- Vanmaercke, M.; Chen, Y.; Haregeweyn, N.; De Geeter, S.; Campforts, B.; Heyndrickx, W.; Tsunekawa, A.; Poesen, J. Predicting Gully Densities at Sub-Continental Scales: A Case Study for the Horn of Africa. Earth Surf. Processes Landf. 2020, 45, 3763–3779. [Google Scholar] [CrossRef]
- Whitford, J.A.; Newham, L.T.H.; Vigiak, O.; Melland, A.R.; Roberts, A.M. Geomorphology Rapid Assessment of Gully Sidewall Erosion Rates in Data-Poor Catchments: A Case Study in Australia. Geomorphology 2010, 118, 330–338. [Google Scholar] [CrossRef]
- Zhang, W.; Liu, Y. Research on Visual Interpretation and Spatial Distribution Pattern of the Erosion Gully in Luoyugou Watershed of China. Environ. Nat. Resour. Res. 2019, 9, 23–31. [Google Scholar] [CrossRef]
- WP/WLI International Geotechnical Societies’ UNESCO Working Party on World Landslide. A Suggested Method for Describing the Activity of a Landslide. Int. Assoc. Eng. Geol. Bull. 1993, 47, 53–57. [Google Scholar] [CrossRef]
- Keaton, J.R.; Degraff, J.V. Surface Observation and Geologic Mapping. Spec. Rep.-Natl. Res. Counc. Transp. Res. Board 1996, 247, 178–230. [Google Scholar]
- Marden, M.; Betts, H.; Arnold, G.; Hambling, R. Gully Erosion and Sediment Load: Waipaoa, Waiapu and Uawa Rivers, Eastern North Island, New Zealand. In Proceedings of the 2008 Symposium of the International Commission on Continental Erosion, Christchurch, New Zealand, 1–5 December 2008; pp. 339–350. [Google Scholar]
- Conoscenti, C.; Angileri, S.; Cappadonia, C.; Rotigliano, E.; Agnesi, V.; Märker, M. Gully Erosion Susceptibility Assessment by Means of GIS-Based Logistic Regression: A Case of Sicily (Italy). Geomorphology 2014, 204, 399–411. [Google Scholar] [CrossRef] [Green Version]
- Jacobs, L.; Kervyn, M.; Reichenbach, P.; Rossi, M.; Marchesini, I.; Alvioli, M.; Dewitte, O. Regional Susceptibility Assessments with Heterogeneous Landslide Information: Slope Unit- vs. Pixel-Based Approach. Geomorphology 2020, 356, 107084. [Google Scholar] [CrossRef]
- Addisu, S. Assessment of the Impact of Road Construction on Physical Land Degradation in Central Highlands of Ethiopia. Master’s Thesis, Addis Ababa University, Addis Ababa, Ethiopia, 2009. [Google Scholar]
- Belayneh, L.; Bantider, A.; Moges, A. Road Construction and Gully Development in Hadero Tunto-Durgi Road Project, Southern Ethiopia. Ethiop. J. Environ. Stud. Manag. 2014, 7, 720. [Google Scholar] [CrossRef] [Green Version]
- Osore, A.; Moges, A. Extent of Gully Erosion and Farmer’s Perception of Soil Erosion in Alalicha Watershed, Southern Ethiopia. J. Environ. Earth Sci. 2014, 4, 74–82. [Google Scholar]
- Hopp, L.; McDonnell, J.J. Connectivity at the Hillslope Scale: Identifying Interactions between Storm Size, Bedrock Permeability, Slope Angle and Soil Depth. J. Hydrol. 2009, 376, 378–391. [Google Scholar] [CrossRef]
- Prancevic, J.P.; Lamb, M.P.; McArdell, B.W.; Rickli, C.; Kirchner, J.W. Decreasing Landslide Erosion on Steeper Slopes in Soil-Mantled Landscapes. Geophys. Res. Lett. 2020, 47, e2020GL087505. [Google Scholar] [CrossRef]
- Schwanghart, W.; Scherler, D. Bumps in River Profiles: Uncertainty Assessment and Smoothing Using Quantile Regression Techniques. Earth Surf. Dyn. 2017, 5, 821–839. [Google Scholar] [CrossRef] [Green Version]
- Yismaw, A.; Mitiku, B.; Beyene, B.; Gtsadik, T.; Dure, T.; Zewde, T.; Theshome, Y.; Tesfaye, W.; Abrham, R. Geological Map of Dila Map Sheet (NB37-6); Federal Democratic Republic of Ethiopia Ministry of Mine, Geological Survey of Ethiopia: Addis Ababa, Ethiopia, 2012.
- Hengl, T.; De Jesus, J.M.; Heuvelink, G.B.M.; Gonzalez, M.R. SoilGrids250m: Global Gridded Soil Information Based on Machine Learning. PLoS ONE 2017, 12, e0169748. [Google Scholar] [CrossRef] [Green Version]
- Hua, A.K.; Ping, O.W. The Influence of Land-Use/Land-Cover Changes on Land Surface Temperature: A Case Study of Kuala Lumpur Metropolitan City. Eur. J. Remote Sens. 2018, 51, 1049–1069. [Google Scholar] [CrossRef] [Green Version]
- USA National Geospatial-Intelligence Agency (NGA). USGS Shuttle Radar Topography Mission, Digital Elevation Model 1 Arc-Second; USA National Geospatial-Intelligence Agency (NGA): Springfield, VA, USA, 2000.
- Bhandari, A. Feature Scaling for Machine Learning: Understanding the Difference between Normalization vs. Standardization. 2020. Available online: https://www.analyticsvidhya.com/blog/2020/04/feature-scaling-machine-learning-normalization-standardization/ (accessed on 6 January 2022).
- Olaniya, M.; Bora, P.K.; Das, S.; Chanu, P.H. Soil Erodibility Indices under Different Land Uses in Ri-Bhoi District of Meghalaya (India). Sci. Rep. 2020, 10, 114986. [Google Scholar] [CrossRef]
- GZAD: Gamo Zone Agricultural Department. Population Data of All Woredas and Kebeles of Gamo Zone; GZAD: Arba Minch, Ethiopia, 2020; (Unpublished work). [Google Scholar]
- Mcinnes, J.; Vigiak, O.; Roberts, A.M. Using Google Earth to Map Gully Extent in the West Gippsland Region (Victoria, Australia). In Proceedings of the MODSIM2011, The 19th International Congress on Modelling and Simulation, Perth, WA, Australia, 12–16 December 2011; pp. 3370–3376. [Google Scholar]
- Frankl, A.; Poesen, J.; Haile, M.; Deckers, J.; Nyssen, J. Quantifying Long-Term Changes in Gully Networks and Volumes in Dryland Environments: The Case of Northern Ethiopia. Geomorphology 2013, 201, 254–263. [Google Scholar] [CrossRef] [Green Version]
- Farooq, S.; Khan, M. Preparing Landslide Inventory Maps Using Virtual Globes Introduction: Mohd; Department of Geology, AMU: Uttar Pradesh, India, 2016; pp. 1–6. [Google Scholar]
- Dewitte, O.; Depicker, A.; Moeyersons, J.; Dille, A. Mass Movements in Tropical Climates; Treatise on Geomorphology; Shroder, J.J.F., Ed.; Elsevier: Amsterdam, The Netherlands, 2022; Volume 5, pp. 338–349. ISBN 9780128182345. [Google Scholar]
- Kubwimana, D.; Ait Brahim, L.; Nkurunziza, P.; Dille, A.; Depicker, A.; Nahimana, L.; Abdelouafi, A.; Dewitte, O. Characteristics and Distribution of Landslides in the Populated Hillslopes of Bujumbura, Burundi. Geosciences 2021, 11, 259. [Google Scholar] [CrossRef]
- Depicker, A.; Jacobs, L.; Delvaux, D.; Havenith, H.-B.; Maki Mateso, J.-C.; Govers, G.; Dewitte, O. The Added Value of a Regional Landslide Susceptibility Assessment: The Western Branch of the East African Rift. Geomorphology 2020, 353, 106886. [Google Scholar] [CrossRef]
- Maki Mateso, J.-C.; Bielders, C.; Monsieurs, E.; Depicker, A.; Smets, B.; Tambala, T.; Bagalwa Mateso, L.; Dewitte, O. Natural and Human-Induced Landslides in a Tropical Mountainous Region: The Rift Flank West of Lake Kivu (DR Congo). Nat. Hazards Earth Syst. Sci. Discuss. 2021, 2021, 1–35. [Google Scholar] [CrossRef]
- Shano, L.; Raghuvanshi, T.K.R.; Meten, M. Landslide Hazard Zonation Using Logistic Regression Model: The Case of Shafe and Baso Catchments, Gamo Highland, Southern Ethiopia. Geotech. Geol. Eng. 2021, 40, 83–101. [Google Scholar] [CrossRef]
- Makanzu Imwangana, F.; Dewitte, O.; Ntombi, M.; Moeyersons, J. Topographic and Road Control of Mega-Gullies in Kinshasa (DR Congo). Geomorphology 2014, 217, 131–139. [Google Scholar] [CrossRef]
- Frankl, A.; Nyssen, J.; De Dapper, M.; Haile, M.; Billi, P.; Munro, R.N.; Deckers, J.; Poesen, J. Linking Long-Term Gully and River Channel Dynamics to Environmental Change Using Repeat Photography (Northern Ethiopia). Geomorphology 2011, 129, 238–251. [Google Scholar] [CrossRef]
- Schmidtchen, G.; Bork, H.R. Changing Human Impact during the Period of Agriculture in Central Europe. The Case Study Biesdorfer Kehlen, Brandenburg, Germany. In Long Term Hillslope and Fluvial System Modelling/Concepts and Case Studie; Lang, A., Hennrich, K., Dikau, R., Eds.; Springer: Berlin/Heidelberg, Germany, 2003. [Google Scholar] [CrossRef]
- Larsen, I.J.; Montgomery, D.R. Landslide Erosion Coupled to Tectonics and River Incision. Nat. Geosci. 2012, 5, 468–473. [Google Scholar] [CrossRef]
- Campforts, B.; Vanacker, V.; Herman, F.; Vanmaercke, M.; Schwanghart, W.; Tenorio, G.E.; Willems, P.; Govers, G. Parameterization of River Incision Models Requires Accounting for Environmental Heterogeneity: Insights from the Tropical Andes. Earth Surf. Dyn. 2020, 8, 447–470. [Google Scholar] [CrossRef]
- Zhang, T.; Liu, G.; Duan, X.; Wilson, G. V Spatial Distribution and Morphologic Characteristics of Gullies in the Black Soil Region of Northeast China: Hebei Watershed. Phys. Geogr. 2016, 37, 228–250. [Google Scholar] [CrossRef]
- Nyssen, J.; Poesen, J.; Moeyersons Layeten, E.; Veyret-Picot, M.; Deckers, J.; Haile, M.; Govers, G. Impact of Road Building on Gully Erosion Risk: A Case Study from the Northern Ethiopian Highlands. Earth Surf. Processes Landf. 2002, 1283, 1267–1283. [Google Scholar] [CrossRef]
- Moges, A.; Holden, N.M. Land Cover Change and Gully Development Between 1965 and 2000 in Umbulo Catchment, Ethiopia. Mt. Res. Dev. 2009, 29, 265–276. [Google Scholar] [CrossRef]
- Darr, S.D.; Pringle, M.J. Improving Gully Density Maps for Modelling Water Quality within Great Barrier Reef Catchments. In Proceedings of the 22nd International Congress on Modelling and Simulation, Hobart, TAS, Australia, 3–8 December 2017; pp. 1920–1926. [Google Scholar]
- Zachar, D. Classification of Soil Erosion. Soil Erosion; Elsevier Scientific Publishing Company: Amsterdam, The Netherlands, 1982. [Google Scholar]
- Na, J.; Yang, X.; Tang, G.; Dang, W.; Strobl, J. Population Characteristics of Loess Gully System in the Loess Plateau of China. Remote Sens. 2020, 12, 2639. [Google Scholar] [CrossRef]
- Korup, O.; Densmore, A.L.; Schlunegger, F. The Role of Landslides in Mountain Range Evolution. Geomorphology 2010, 120, 77–90. [Google Scholar] [CrossRef]
- Dille, A.; Kervyn, F.; Mugaruka Bibentyo, T.; Delvaux, D.; Bamulezi Ganza, G.; Ilombe Mawe, G.; Kalikone Buzera, C.; Safari Nakito, E.; Moeyersons, J.; Monsieurs, E.; et al. Causes and Triggers of Deep-Seated Hillslope Instability in the Tropics—Insights from a 60-Year Record of Ikoma Landslide (DR Congo). Geomorphology 2019, 345, 106835. [Google Scholar] [CrossRef]
- Francis, O.; Fan, X.; Hales, T.; Hobley, D.; Xu, Q.; Huang, R. The Fate of Sediment After a Large Earthquake. J. Geophys. Res. Earth Surf. 2022, 127, e2021JF006352. [Google Scholar] [CrossRef]
- Wang, R.; Zhang, S.; Pu, L.; Yang, J.; Yang, C.; Chen, J. Gully Erosion Mapping and Monitoring at Multiple Scales Based on Multi-Source Remote Sensing Data of the Sancha River Catchment, Northeast China. ISPRS Int. J. Geo-Inf. 2016, 5, 200. [Google Scholar] [CrossRef] [Green Version]
- Soms, J. Regularities of Gully Erosion Network Development and Spatial Distribution in South-Eastern Lativa. Baltica 2006, 19, 72–79. [Google Scholar]
- Li, H.; Cruse, R.M.; Liu, X.; Zhang, X. Effects of Topography and Land Use Change on Gully Development in Typical Mollisol Region of Northeast China. Chin. Geogr. Sci. 2016, 26, 779–788. [Google Scholar] [CrossRef] [Green Version]
- Yibeltala, M.; Tsunekawac, A.; Haregeweynd, N.; Adgoe, E.; Mesheshae, D.T.; Aklogf, D. Analysis of Long-Term Gully Dynamics in Different Agro-Ecology Settings. Catena 2020, 179, 160–174. [Google Scholar] [CrossRef]
- Kropáče, K.J.; Schillaci, C.; Salvini, R.; Marker, M. Assessment of Gully Erosion in the Upper Awash, Central Ethiopian Highlands Based on a Comparison of Archived Aerial Photographs and Very High Resolution Satellite Images. Geogr. Fis. Dinam. Quat. 2016, 39, 161–170. [Google Scholar] [CrossRef]
- Radoane, M.; Ichim, I.; Radoane, N. Gully Distribution and Development in Moldavia, Romania. Catena 1995, 24, 127–146. [Google Scholar] [CrossRef]
- Golosov, V.; Yermolaev, O.; Rysin, I.; Vanmaercke, M.; Medvedeva, R.; Zaytseva, M. Mapping and Spatial-Temporal Assessment of Gully Density in the Middle Volga Region, Russia. Earth Surf. Process. Landf. 2018, 43, 2818–2834. [Google Scholar] [CrossRef]
- Medvedeva, R.A.; Golosov, V.N.; Ermolaev, O.P. Spatio-Temporal Assessment of Gully Erosion in the Zone of Intensive Agriculture in the European Part of Russia. Geogr. Nat. Resour. 2018, 39, 204–211. [Google Scholar] [CrossRef]
| Gully Characteristics | Shafe | Basso | Sile | Elgo | |
|---|---|---|---|---|---|
| Total area of the catchment (km2) | 205 | 209 | 231 | 226 | |
| Total number of gullies (#) | 3640 | 823 | 1748 | 1125 | |
| Total gully length (km) | 716 | 121 | 366 | 228 | |
| Maximum gully length (km) | 2.4 | 2.1 | 2.1 | 2.0 | |
| Mean gully length (km) | 0.2 | 0.1 | 0.2 | 0.2 | |
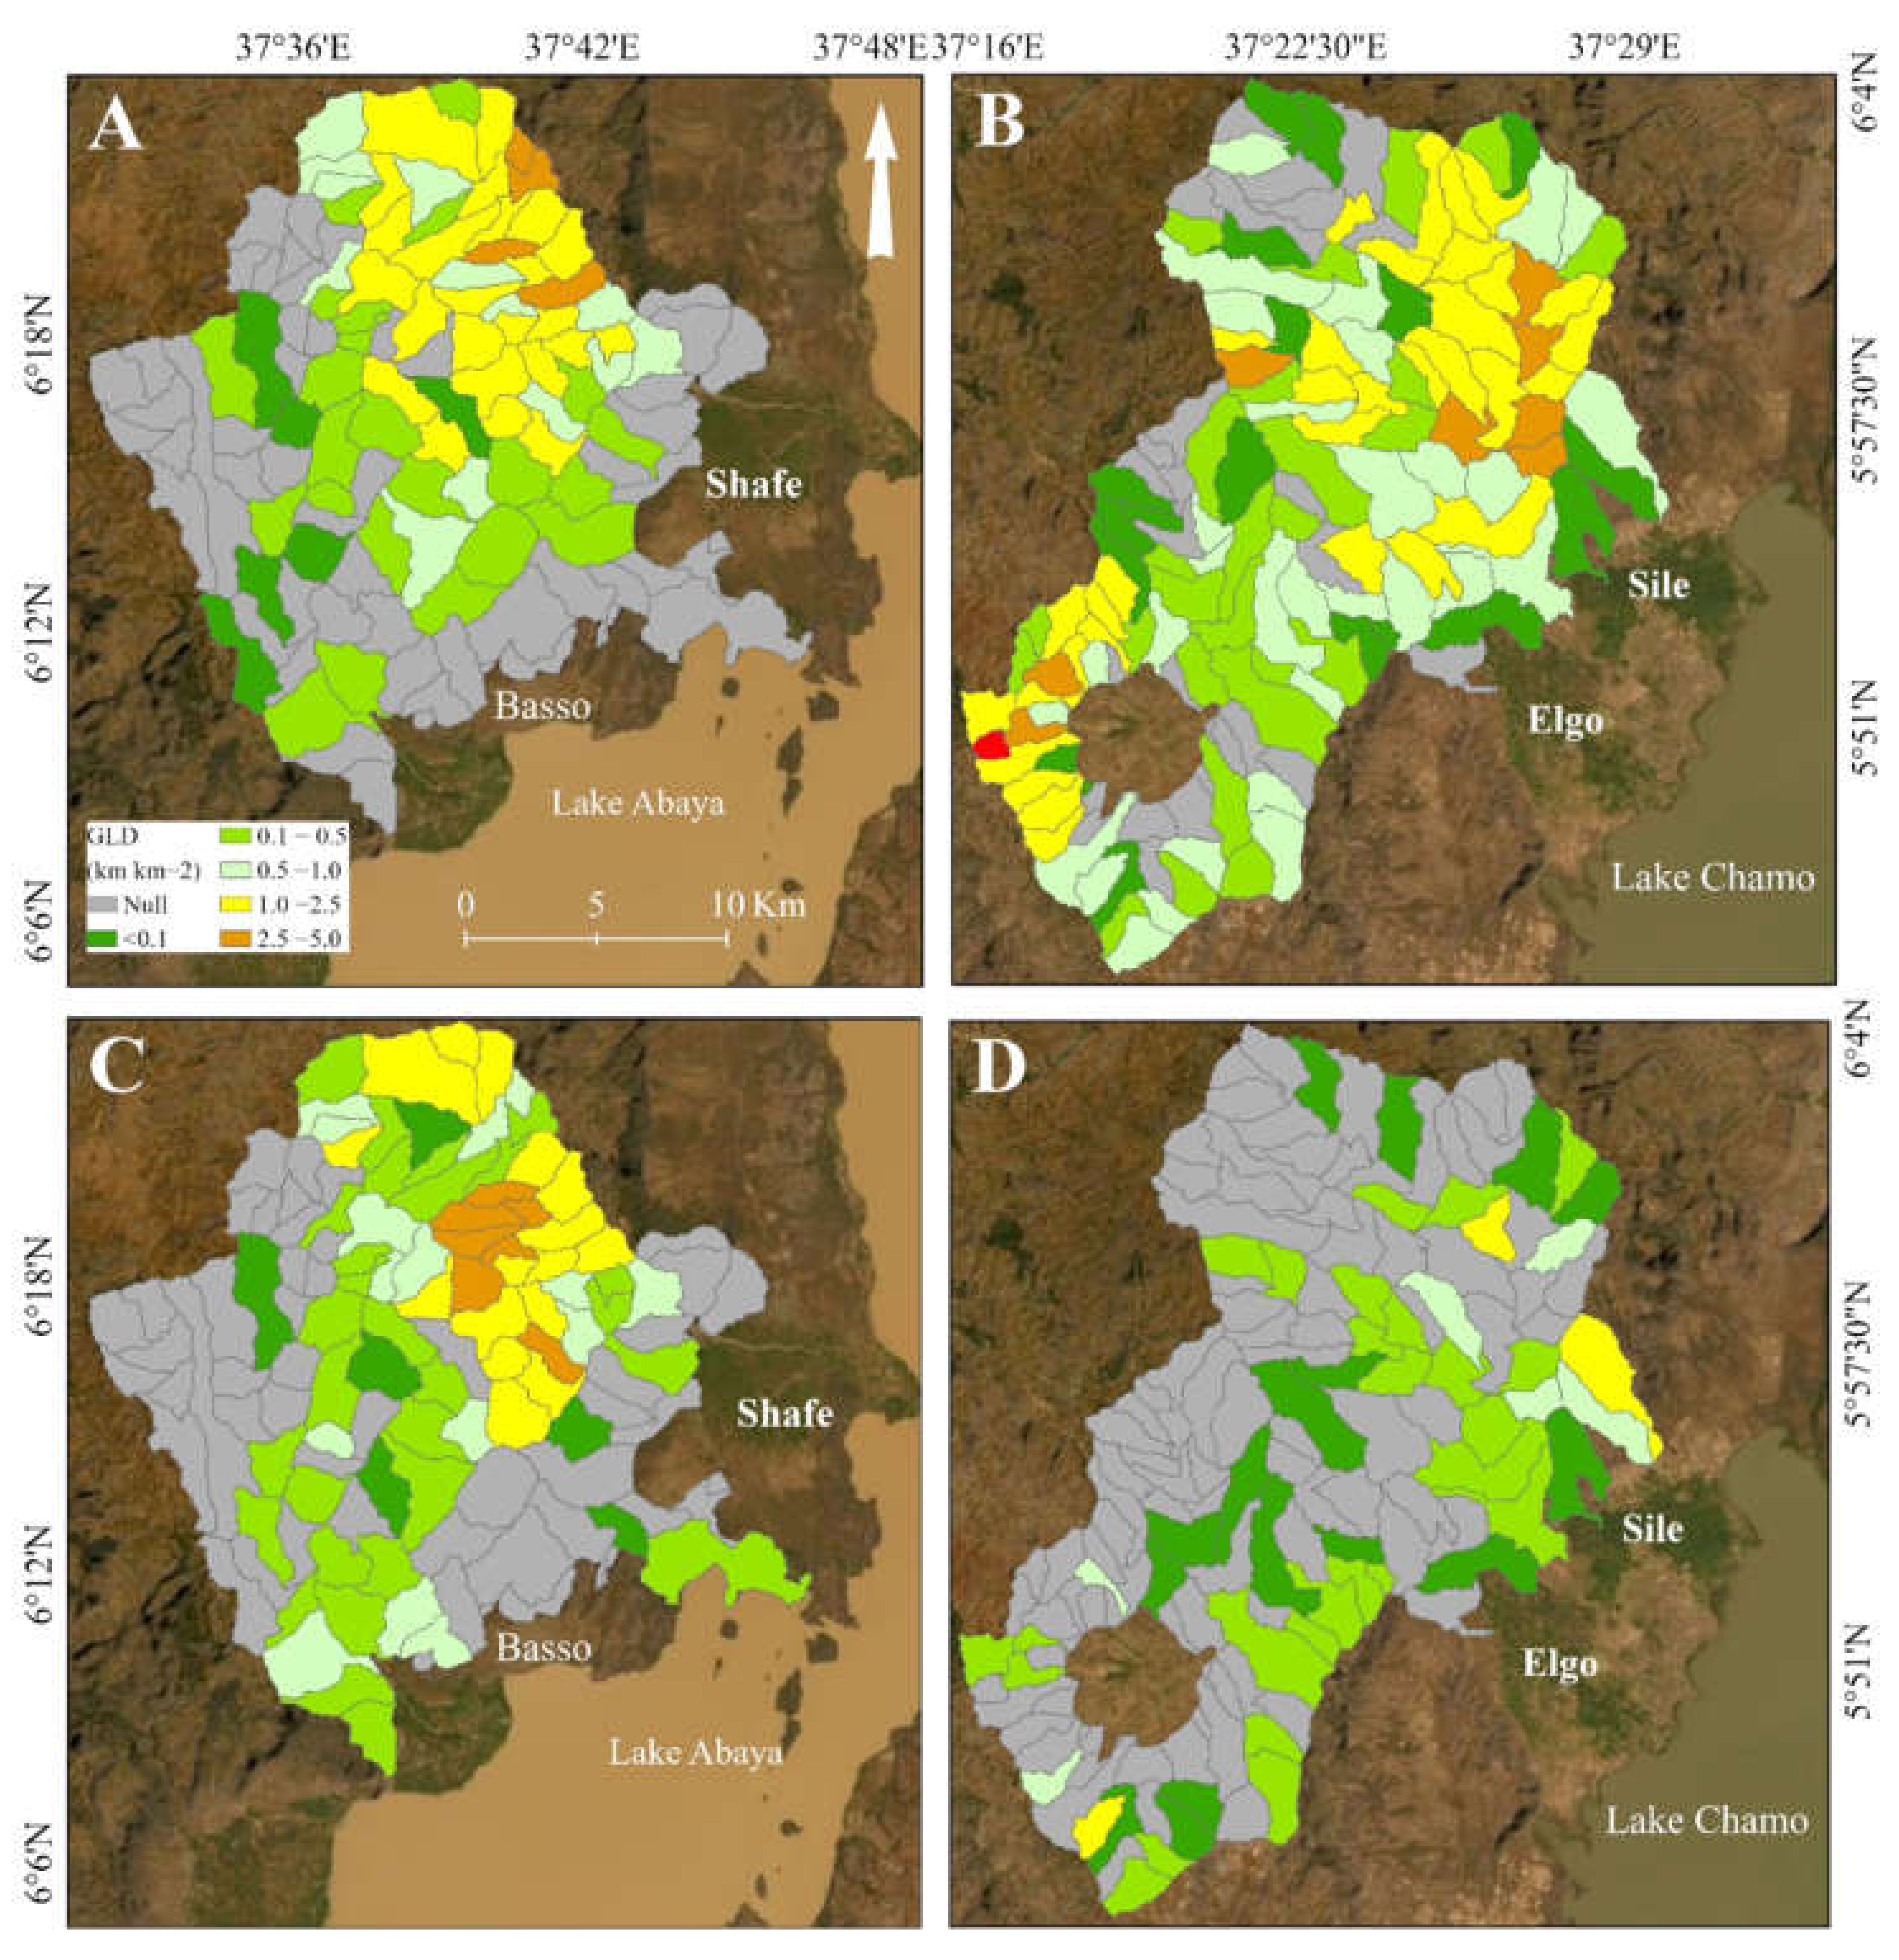
| GLD for all gullies (km km−2) | 3.5 | 0.6 | 1.6 | 1.0 | |
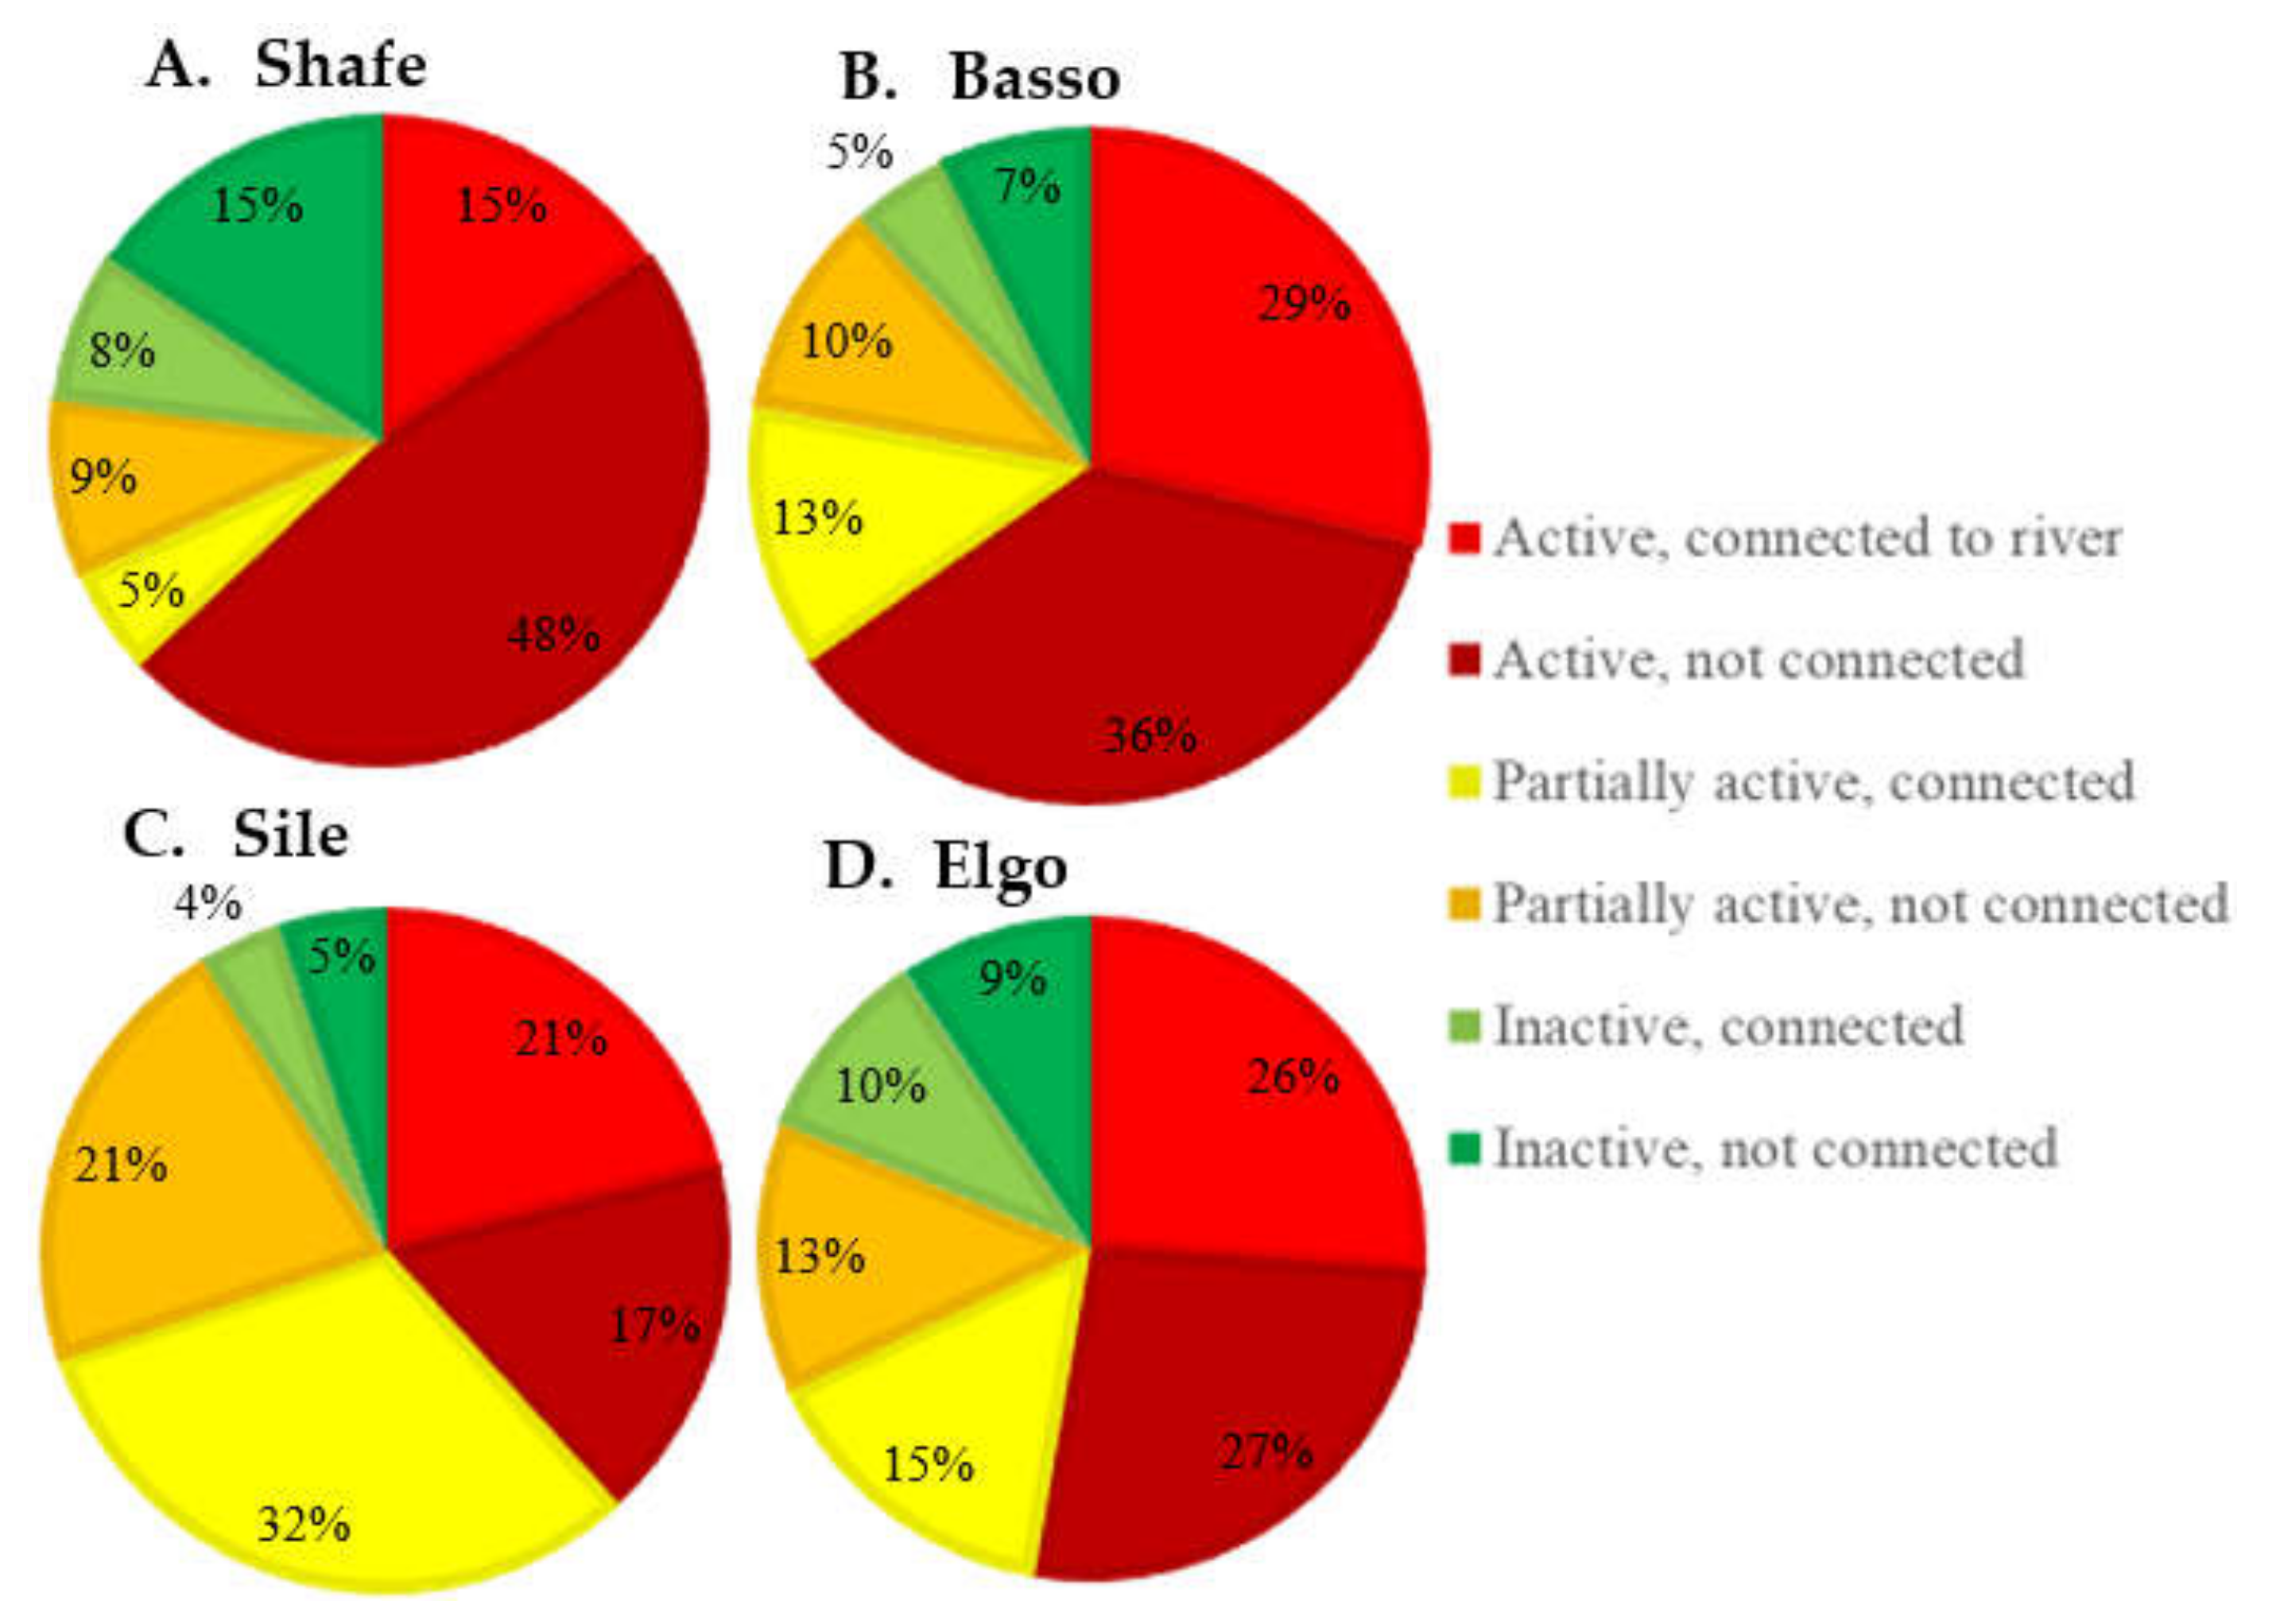
| Gully status (%) | Active | 63 | 65 | 38 | 53 |
| Partially active | 14 | 23 | 53 | 28 | |
| Inactive | 23 | 12 | 9 | 19 | |
| Gullies connected to a road (%) | 9 | 6 | 18 | 25 | |
| Gullies active and connected to road (%) | 4.4 | 3.3 | 7.9 | 13.2 | |
| Gullies active and connected to river (%) | 15 | 29 | 21 | 26 | |
| Landslide Characteristics | Shafe | Basso | Sile | Elgo | |
|---|---|---|---|---|---|
| Total number of landslides (#) | 104 | 107 | 148 | 71 | |
| Total area covered by landslides (km2) | 29 | 38 | 56 | 8 | |
| Total area covered by the active landslides (km²) | 0.4 | 0.6 | 0.5 | 0.2 | |
| Area of the largest landslide (km2) | 12.2 | 5.2 | 15.5 | 1.2 | |
| Mean area of the landslides (km2) | 0.3 | 0.4 | 0.4 | 0.1 | |
| The ratio of shallow/deep-seated landslides | 36/68 | 35/72 | 54/94 | 29/42 | |
| Landslide (all)-point density in rejuvenated and relict landscapes, respectively (# km2) | 0.7, N | 1.1, 0.2 | 0.7, N | 0.4, N | |
| Active landslide-point density in rejuvenated and relict landscapes, respectively (# km2) | 0.2, N | 0.6, 0.1 | 0.3, N | 0.2, N | |
| Landslide-area density (km2 km−2) | 0.2 | 0.3 | 0.3 | 0.0 | |
| Activity of landslides (%) | Active | 32 | 53 | 45 | 46 |
| Inactive | 68 | 47 | 55 | 54 | |
| Landslides connected to the river (%) | 90 | 94 | 93 | 70 | |
| Landslides active and connected to the river (%) | 32 | 52 | 50 | 32 |
| Shafe | Basso | Sile | Elgo | |||||||
|---|---|---|---|---|---|---|---|---|---|---|
| Total # of Gullies (All) within Landslides | 501 | 205 | 499 | 56 | ||||||
| Total # of Active Gullies within Landslides | 367 | 137 | 256 | 32 | ||||||
| GDin: GDout and GLDin: GLDout landslide | Landscape | Gully activity | GD | GLD | GD | GLD | GD | GLD | GD | GLD |
| Rejuvenated I | All | 33:46 | 5:8 | 6:25 | 1:3 | 3:6 | <1:1 | 3:4 | <1:1 | |
| Rejuvenated II | All | 2:7 | <1:1 | 2:3 | <1:1 | 21:9 | 3:2 | 8:7 | 1:1 | |
| Transition | All | 26:13 | 3:3 | 14:6 | 1:1 | N | N | N | N | |
| Relict | All | N | N | 6:4 | 1:<1 | 17:3 | 2:1 | N | N | |
| Rejuvenated I | Active | 28:28 | 3:4 | 97:13 | 8:1 | 2:2 | <1:<1 | 3:1 | <1:<1 | |
| Inactive | 6:9 | 1:2 | N:1 | N:<1 | 2:<1 | <1:<1 | N:<1 | N:<1 | ||
| Rejuvenated II | Active | 34:3 | 3:<1 | 6:<1 | <1:<1 | 13:3 | 1:<1 | 11:3 | 1:<1 | |
| Inactive | 1:2 | <1:1 | 2:1 | 1:<10 | 3:1 | <1:<1 | 5:<1 | 1:<1 | ||
| Rejuvenated I and II | Active | 29:16 | 3:2 | 7:2 | 1:<1 | 5:3 | 1:<1 | 9:2 | 1:<1 | |
| Inactive | 3:6 | <1:1 | 2:1 | 1:<1 | 2:1 | <1:<1 | 5:<1 | 1:<1 | ||
Publisher’s Note: MDPI stays neutral with regard to jurisdictional claims in published maps and institutional affiliations. |
© 2022 by the authors. Licensee MDPI, Basel, Switzerland. This article is an open access article distributed under the terms and conditions of the Creative Commons Attribution (CC BY) license (https://creativecommons.org/licenses/by/4.0/).
Share and Cite
Belayneh, L.; Dewitte, O.; Gulie, G.; Poesen, J.; O’Hara, D.; Kassaye, A.; Endale, T.; Kervyn, M. Landslides and Gullies Interact as Sources of Lake Sediments in a Rifting Context: Insights from a Highly Degraded Mountain Environment. Geosciences 2022, 12, 274. https://doi.org/10.3390/geosciences12070274
Belayneh L, Dewitte O, Gulie G, Poesen J, O’Hara D, Kassaye A, Endale T, Kervyn M. Landslides and Gullies Interact as Sources of Lake Sediments in a Rifting Context: Insights from a Highly Degraded Mountain Environment. Geosciences. 2022; 12(7):274. https://doi.org/10.3390/geosciences12070274
Chicago/Turabian StyleBelayneh, Liuelsegad, Olivier Dewitte, Guchie Gulie, Jean Poesen, Daniel O’Hara, Alemayehu Kassaye, Tizita Endale, and Matthieu Kervyn. 2022. "Landslides and Gullies Interact as Sources of Lake Sediments in a Rifting Context: Insights from a Highly Degraded Mountain Environment" Geosciences 12, no. 7: 274. https://doi.org/10.3390/geosciences12070274