Article

Migration of Salt Ions in Frozen Hydrate-Saturated Sediments: Temperature and Chemistry Constraints

Center for Petroleum Science and Engineering, Skolkovo Institute of Science and Technology, Bolshoy Boulevard 30, Bld. 1, 121205 Moscow, Russia
*
Author to whom correspondence should be addressed.
Geosciences 2022, 12(7), 276; https://doi.org/10.3390/geosciences12070276
Submission received: 30 May 2022 / Revised: 1 July 2022 / Accepted: 7 July 2022 / Published: 9 July 2022
(This article belongs to the Special Issue Permafrost and Gas Hydrate Response to Ground Temperature Rising)

Abstract

:
Migration of dissolved salts from natural (cryopeg brines, seawater, etc.), or artificial sources can destabilize intrapermafrost gas hydrates. Salt transport patterns vary as a function of gas pressure, temperature, salinity, etc. The sensitivity of the salt migration and hydrate dissociation processes to ambient temperature and to the concentration and chemistry of saline solutions is investigated experimentally on frozen sand samples at a constant negative temperature (−6 °C). The experiments show that the ambient temperature and the solution chemistry control the critical salt concentration required for complete gas hydrate dissociation. Salt ions migrate faster from more saline solutions at higher temperatures, and the pore moisture can reach the critical salinity in a shorter time. The flux density and contents of different salt ions transported to the samples increase in the series Na2SO4–KCl–CaCl2–NaCl–MgCl2. A model is suggested to account for phase transitions of pore moisture in frozen hydrate-saturated sediments exposed to contact with concentrated saline solutions at pressures above and below the thermodynamic equilibrium, in stable and metastable conditions of gas hydrates, respectively.

1. Introduction

Gas (especially, methane) in permafrost can exist in the clathrate (hydrate) form [1,2,3,4,5,6]. Gas hydrates are crystalline clathrate compounds which are formed out of water molecules and low-molecular gas under certain pressures and temperatures [4,7]. Gas hydrates are remarkable by sequestering large amounts of natural gas: each volume unit of gas hydrate can store about 160 units of methane. In this respect, gas hydrates constitute rich unconventional resources of natural gas but, at the same time, pose serious threats to petroleum production from conventional reservoirs [3,4,8,9].
Laboratory modeling confirms the possibility of active hydrate formation in freezing and frozen sediments [10,11,12]. However, gas hydrates can lose stability and dissociate into water and large volumes of gas due to pressure and temperature changes [13]. The dissociation reactions decay and even stop under negative temperatures, which are typical for permafrost, as the released interstitial water quite rapidly freezes to ice which coats gas hydrate particles and impedes further dissociation [14,15,16,17,18,19,20].
In addition to the temperature and pressure changes, destabilization of gas hydrates can result from reactions with various organic or inorganic chemical agents that inhibit hydrate formation: salts, acids, and other compounds [21,22,23,24,25,26,27,28]. The effect of dissolved salts on the pressure and temperature limits of hydrate stability has received much attention [21,23,29,30,31,32,33]. The results show that hydrate dissociation in a free volume accelerates at higher temperatures and higher salt concentrations. Furthermore, the rate of dissociation depends on the chemistry of the solution and increases in the series KCl–CaCl2–NaCl–MgCl2.
Although the interaction of saline solutions with frozen hydrate-bearing sediments and related salt transport has been rather poorly studied, some inferences can be made from the respective studies of pore ice which is similar to gas hydrate in many aspects [34,35,36,37,38,39]. Salt transport into permafrost body is known to be controlled by temperature, salt concentration, and chemistry. It is faster from more saline solutions at higher temperatures, and differs for different salt ions [37,40]: the mobility decreases in the series Ca2+ > Na+ > Hg2+ > Cu2+ > Pb2+ > K+ > Fe2+ > Co3+.
Thus, laboratory modeling of salt transport in frozen hydrate-saturated soils and its sensitivity to temperature and solution parameters (concentration and chemical composition) can provide insights into thermodynamic processes associated with the interaction of ice- and gas hydrate-bearing permafrost with saline solutions at negative temperatures.

2. Materials and Methods

Migration of dissolved salts in frozen hydrate-saturated sediments interacting with different saline solutions was investigated in experiments at user-specified negative temperatures that were maintained constant during all runs. The experimental procedure included several steps.
1.
Sand samples were saturated with water to the desired moisture content and placed in a pressure cell for saturation with methane hydrate under vacuum.
2.
The hydrate-saturated samples in the pressure cell were frozen and brought to a metastable state by reducing the pressure to 0.1 MPa.
3.
The frozen hydrate-saturated samples were taken out of the pressure cell and measured for water contents, density, and fraction of water converted to hydrate (hydrate coefficient K h i n , u.f.).
4.
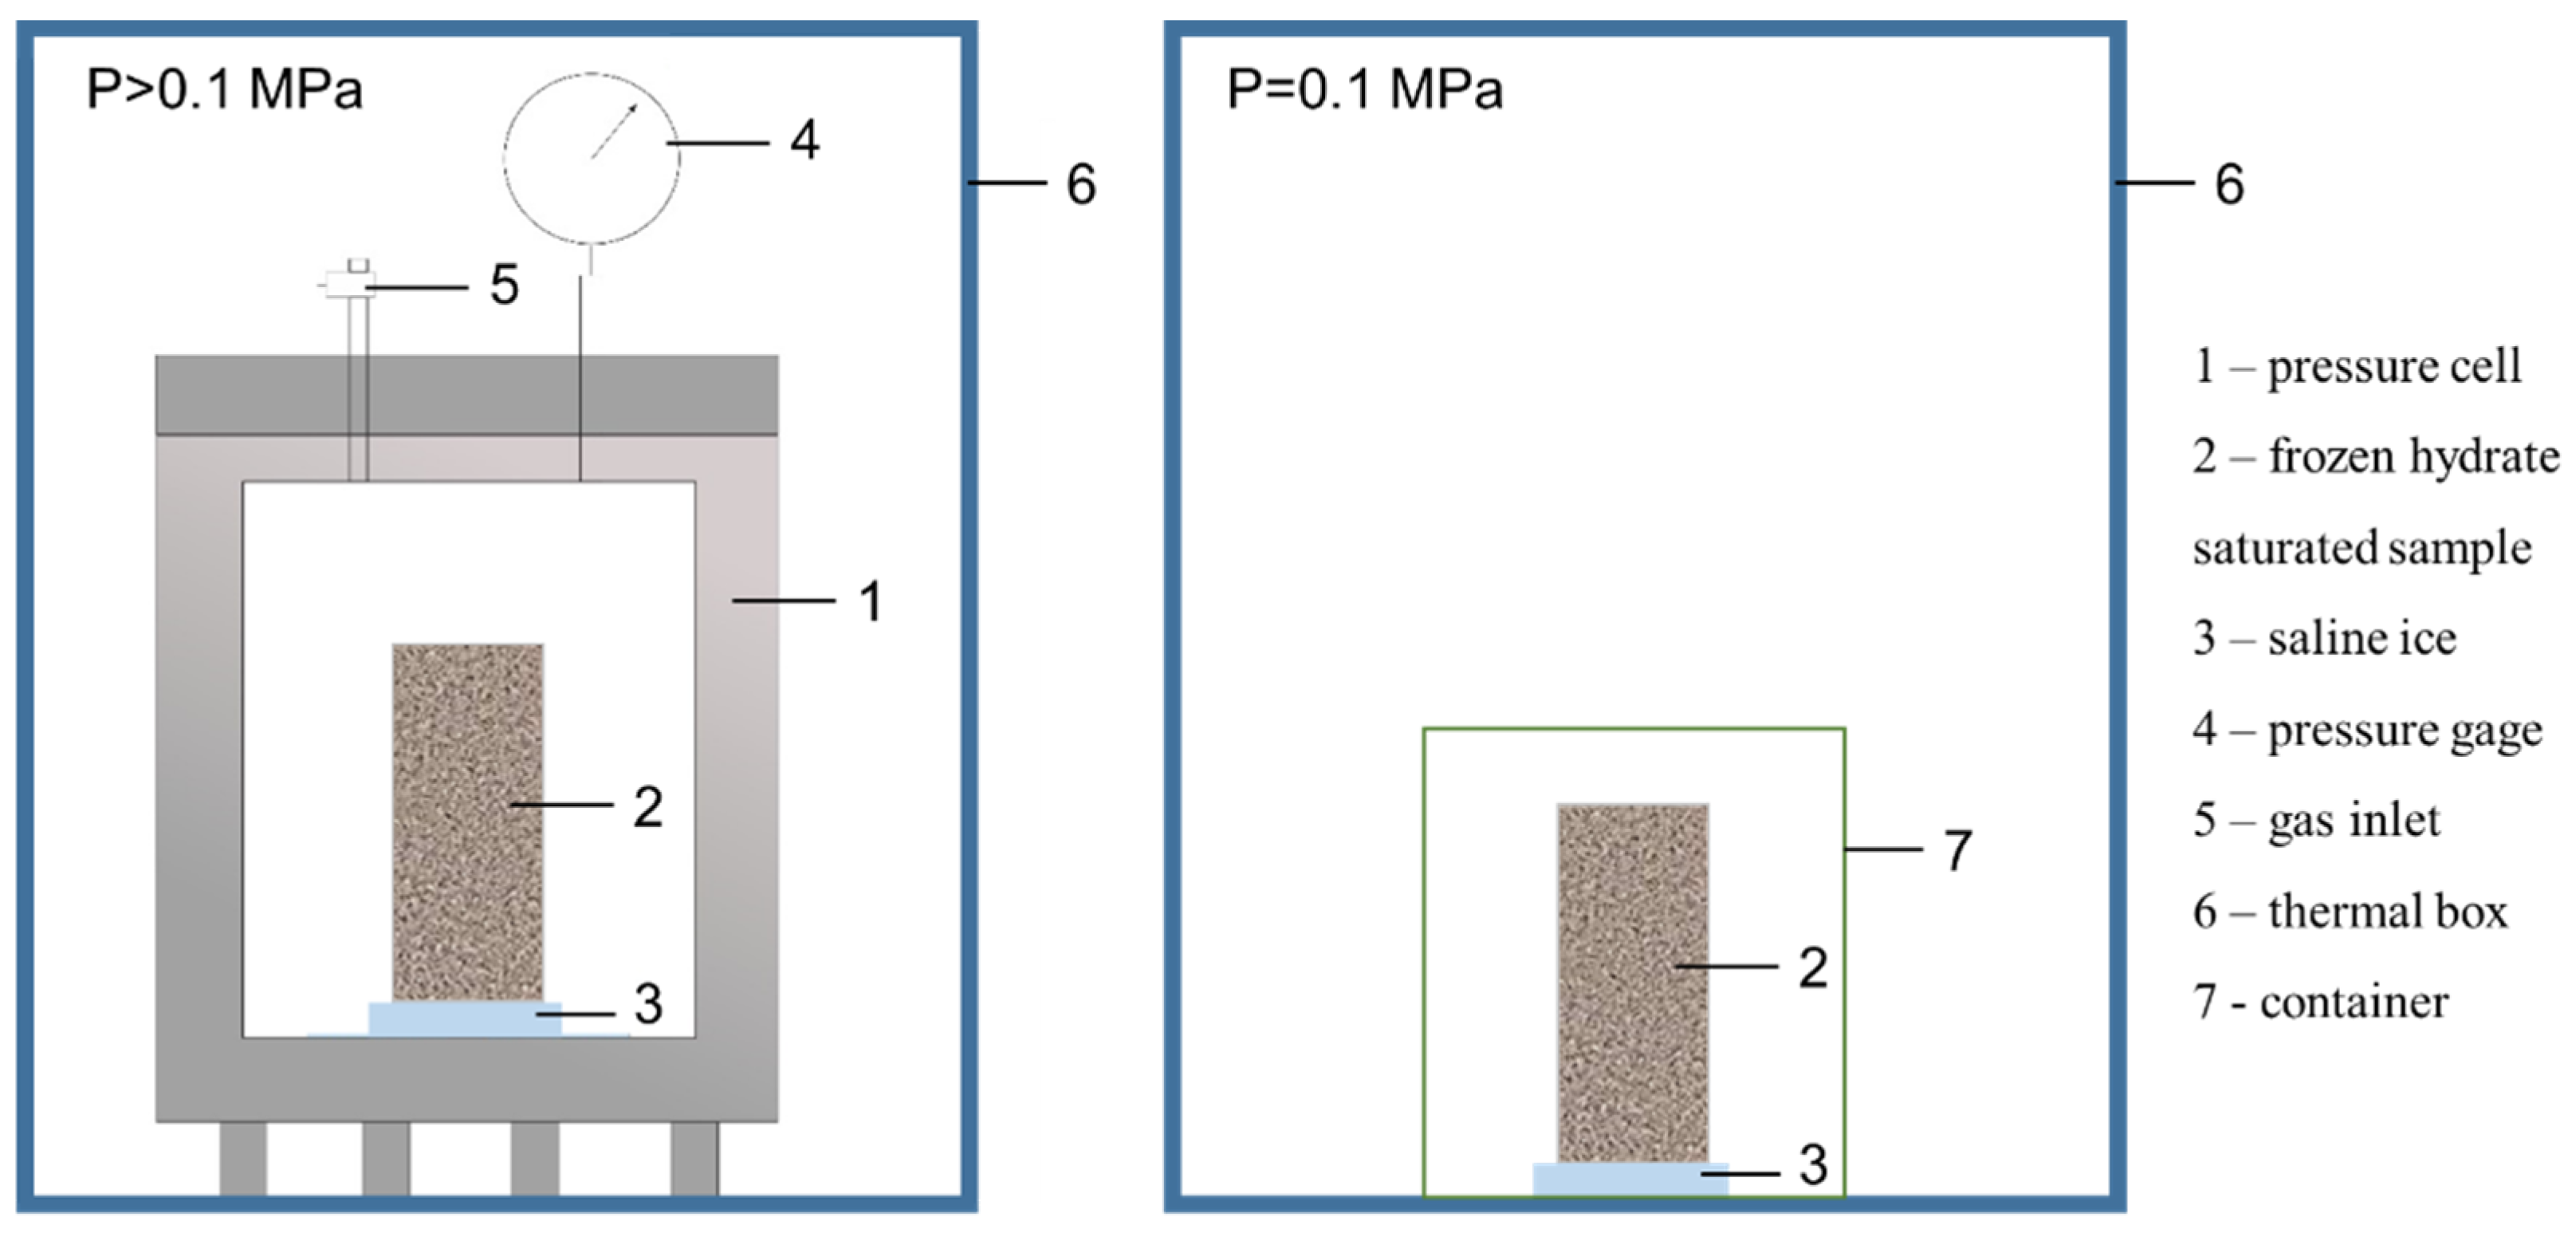
The samples were juxtaposed against a frozen salt solution (saline ice) at a constant negative temperature and under pressures of 0.1 and 4 MPa, in a tight thermally insulated box. The interaction process was monitored continuously.
5.
The samples were placed back into the pressure cell where the methane pressure increased to 4 MPa for the given temperature conditions; then, the system was placed into a thermal box (Figure 1).
The sandy samples were ~80% composed of 0.10–0.25 mm quartz particles (Table 1) and had natural salinity of ~0.01% (Table 2); the active surface area was ~0.6 g/m2.
The frozen cylindrical twin samples (~5 cm in diameter and 6–9 cm high) initially containing 11–12% of water were saturated in the vacuumed tight pressure cell by filling it with cold hydrate-forming gas (99.98% CH4) up to the hydrate formation pressure > 3 MPa, under specially created conditions providing uniform saturation of the pore space [41]. Additionally, five or six samples with similar moisture contents, density and hydrate saturation were prepared in the same way and were used for comparison. Saturation of the samples in the pressure cell began at temperatures of −5 to −6 °C; gas hydrates formed immediately on the surface of porous ice, impeded migration of pore moisture, and became distributed uniformly over the samples. The saturation process was enhanced using cyclic temperature fluctuations from −5 or −6 °C to +3 °C. It lasted at least two weeks, and then the samples were frozen to −6 ± 1 °C. The residual liquid pore moisture that had not converted to hydrate froze up. Thus, obtained samples had hydrate saturation of at least 60% [41].
Then, the pressure in the cell was reduced to 0.1 MPa, at the same temperature, and the frozen hydrate-saturated samples became metastable. They underwent partial dissociation and kept residual hydrate saturation of 30% for quite a long time, due to the self-preservation effect. The initial parameters measured in the samples (in probes of frozen hydrate saturated sand) before they were exposed to interaction with saline solutions were within 11–12% weight water content; 35 to 40% porosity; 1.80 g/cm3 density, and hydrate coefficient 0.4–0.6 K h i n . The frozen hydrate-bearing sand had a massive ice–hydrate texture, with its all properties, including pore hydrate contents, distributed uniformly along the samples [41].
The experiments were performed at different pressures and temperatures, with solutions of different concentrations and chemistry, in order to check the sensitivity of salt transport in frozen sediments to (i) temperature that varied from −3 to −20 °C; (ii) salt concentration (0.1 to 0.4 N); and (iii) salt type (NaCl, MgCl2, CaCl2, Na2SO4 and KCl, at 0.1 N). In some experiments, the applied pressures were below and above the equilibrium (0.1 MPa and 4.0 MPa, respectively).
The effect of above-equilibrium pressure (4.0 MPa) on dissociation of pore methane hydrate in frozen sediments interacting with saline solutions was tested in a pressure cell filled with methane up to the 4.0 MPa gas pressure. The experimental runs lasted from several hours to several days, depending on run conditions. The temperature was maintained constant to an accuracy of ±0.5 °C.
The pressure was released, and the pressure cell was opened to interrupt the sample-solution contact at certain time intervals. During the breaks, the samples were measured for water contents, salinity, and hydrate coefficient, separately in 5–8-mm thick layers. For comparison, hydrate-free samples were likewise exposed to interaction with saline solutions under the same experimental conditions. This approach allowed tracing accumulation of salt ions and dissociation of pore gas hydrates in the samples as a function of temperature, salt concentration, and chemistry at different gas pressures.
Gas contents were estimated by measuring (with 2–3 times repeatability) the volume of gas released as the samples were thawing under the effect of a saturated solution in the special gas collector tube. The obtained values of the level of liquid in the tube change were used to estimate hydrate contents and hydrate coefficients, assuming a hydrate number of 5.9 for methane hydrate [42].
Specific gas content (G, cm3/g) is the volume of gas in hydrate-containing frozen probe and it was found as:
G = ( V 2 V 1 ) · T m s
where ( V 2 V 1 )—change in the volume of liquid in the gas collector tube (cm3); T—temperature correction; m s —the mass of the soil sample (g).
The weight gas hydrate content (H, wt.% of sample weight) was determinate for each interval as:
H = m g · M C H 4 · 5.9 · H 2 O M C H 4 · 100 %
where m g is a specific gravity of methane in gas hydrate form (g/g, i.e., grams of gas in per gram of sediment) calculated from the specific gas content (G) for pure methane.
The fraction of water converted to hydrate or the hydrate coefficient ( K h , u.f.) is given by
K h = W h W
where W h   is the percentage of water in a hydrate form (wt.% of sample weight) and W is the total amount of water (wt.%).
The samples with measured water contents were used to estimate the number of salt ions that migrated across the sample–solution interface. The contents of salt ions were measured in water extracted from water-soluble salts, on a “MARK 603” conductivity meter, to an accuracy of ±0.002% (±0.1 mg-EQ/100 g).
Variations in the flux of salt ions through the section of a frozen hydrate-saturated sample (J, mol/m2·s) were estimated as:
J = υ S · t ,
where S is the surface area of the sample section, m2; t is the time of salt migration, s; v is the molar content of ions, mole.

3. Results

Previous experiments [42] confirmed active Na+ diffusion into frozen hydrate-saturated samples interacting with a frozen NaCl solution, whereby pore moisture in the samples became saline and gas hydrates dissociated into gas and water.
Salt transport across the sediment–solution interface is controlled by the properties of the sediments and the solutions (concentration and chemistry of salts), as well as by external factors, such as pressure and temperature. The sensitivity of salt transport patterns to these factors was studied in laboratory experiments on sand samples interacting with solutions of different compositions and concentrations at negative temperatures and pressures of 0.1 and 4.0 MPa.

3.1. Effect of Temperature

The effect of temperature on salt transport patterns in frozen hydrate-bearing samples was tested in the range from −3 °C to −20 °C. Salt ions accumulated faster at higher temperatures, which accelerated the dissociation of pore methane hydrates. At the warmest negative temperature of −3 °C, Na+ penetrated the farthest from the contact for two hours of interaction with a 0.2 N NaCl solution, while the respective distances at lower temperatures were 6 cm at −6 °C and 2.2 cm at −20 °C (Figure 2).
Migration of salt ions into the pore space of frozen hydrate-saturated sand samples after two hours of interaction with a 0.2 N NaCl solution at −3 °C led to complete dissociation of methane hydrates within 7 cm from the contact, and residual hydrates ( K h = 0.22 against the initial value of K h = 0.4) remained restricted to the last 1 cm of the sample. At colder temperatures of −6 °C and −20 °C, hydrate dissociation was complete within 3.5 cm and 1.0 cm from the contact, respectively; in the latter case, the hydrate coefficient reduced from 0.37 to 0.10 (Figure 3).
The calculated average Na+ flux density for the applied experimental conditions showed a decreasing trend at lower temperatures (Figure 4): it was 58.10−10 mol/cm2 at −3 °C, 20.10−10 mol/cm2 at −6 °C, and only 5.10−10 mol/cm2 at −20 °C (Figure 4).
The critical salt concentration C c r required for complete dissociation of metastable pore gas hydrates in a sample interacting with a 0.1 N NaCl solution at 0.1 MPa showed linear temperature dependence (Figure 5). C c r was higher at lower ambient temperatures (Figure 5): 0.6% relative to pore moisture at −2.5 °C; 2.5% at −10 °C, and 3.4% at −16 °C and 0.1 MPa.
Thus, we obtained an empirical dependence that can be used to calculate the critical salt concentrations required for the complete dissociation of metastable gas hydrates through temperature value.
At stable conditions (above-equilibrium gas pressure) and the same temperature of −6.5 °C, the critical concentration was higher: e.g., 2% at 4.0 MPa against 1.3% at 0.1 MPa.
Thus, the experiments confirmed the effect of temperature on salt transport and hydrate dissociation in frozen hydrate-bearing sediments interacting with saline solutions.

3.2. Effect of Salt Concentration

The laboratory modeling of the salt concentration effect on the interaction between frozen hydrate-bearing sediments and saline solutions was preceded by HydraFlash thermodynamic calculations of methane hydrate stability in a free volume for different salt concentrations (Figure 6).
The presence of salts was shown to shift the hydrate stability zone toward higher pressures and lower temperatures, with the shift magnitude depending on salt concentration. Namely, the equilibrium temperature decreased from −5 to −10 °C as the NaCl concentration increased from 1% to 5%, at a constant pressure of 2.5 MPa. Salt concentration can be expected to influence the preservation of metastable pore gas hydrates at a constant negative temperature as well.
Laboratory modeling of the NaCl concentration effect on the dissociation of pore methane hydrate in frozen sediments included two series of experiments. The runs were in metastable (0.1 MPa) and stable (4.0 MPa) conditions, when hydrate dissociation was controlled, respectively, by salt transport kinetics and by both thermodynamic and kinetic factors.
At the below-equilibrium pressure (0.1 MPa) and a constant temperature of −6.5 °C, Na+ penetrated farther into the samples as the source solutions became more saline: 4.5 cm, 5.2 cm, and 7 cm from the contact at NaCl concentrations of 0.1N (Figure 7A), 0.2 N (Figure 7B), and 0.4N (Figure 7C), respectively, after 4 h of interaction.
The contents of Na+ that migrated to the samples affect the distribution of gas hydrates (hydrate coefficient patterns). Hydrate constituted about 40% of pore moisture in the samples before the interaction with the NaCl solution and decreased progressively away from the contact after the interaction. After four hours of interaction at a constant temperature of −6.5 °C, the zone of decreasing hydrate coefficient expanded from 2.5 cm at 0.1 N to 5.6 cm at 0.4 N NaCl concentration (Figure 8) and covered the sample part where residual hydrate was present.
Thus, it is possible to trace the propagation of the hydrate dissociation front in frozen samples as a function of salt concentration.
The sensitivity of Na+ contents and hydrate coefficient to salt concentration was also observed in the experiments at the above-equilibrium pressure (4.0 MPa). After 4 h of interaction with 0.1 N and 0.2 N NaCl solutions, Na+ penetrated 3.4 cm and 6 cm along the samples, respectively (Figure 9).
Interaction with solutions of higher concentrations at 4 MPa and −6.5 °C led to more active salt migration and more rapid dissociation of pore methane hydrates: all hydrate dissociated to distances of 1.6 cm and 4.4 cm from the contact after 4 h of interaction with 0.1 N and 0.2 N NaCl solutions, respectively (Figure 10).
The NaCl concentration affected the average density of the Na+ flux to the frozen hydrate-bearing samples. It increased from 0.96·10−10 mol/cm2·s in the case of a 0.1 N solution to 8.2·10−10 mol/cm2·s upon interaction with a 0.4 N solution, at 0.1 MPa. A Na+ flux increase, though less prominent, was also observed in the 4.0 MPa runs: from 0.4 mol/cm2·s at 0.1 N to 4.62·10−10 mol/cm2·s at 0.4 N (Figure 11).
Thus, greater concentrations of the source solutions provide faster accumulation of Na+ and hydrate dissociation in frozen hydrate-bearing sand, at pressures below and above the equilibrium, i.e., in both metastable and stable conditions. The changes are stronger at atmospheric pressure.

3.3. Effect of Solution Chemistry

The laboratory testing of salt transport sensitivity to the salt type was likewise preceded by thermodynamic calculations in HydraFlash. The methane hydrate stability in a free volume was estimated as to the effect of different salts that typically occur in permafrost (NaCl, CaCl2, MgCl2, KCl and Na2SO4), for a temperature range of 0 to −20 °C.
The stability conditions showed to be highly sensitive to the salt composition. The equilibrium shifted to lower temperatures and pressures in the series Na2SO4–KCl–CaCl2–NaCl–MgCl2, for 5% solutions. The pressure shift relative to a non-saline gas–water system was 2.8 MPa for Na2SO4 and 3.8 MPa for MgCl2, at −5 °C (Figure 12). The modeling results are consistent with the available published data [25,43,44].
Then, 0.1 N solutions of the respective salts (NaCl, CaCl2, MgCl2, KCl, and Na2SO4) were used in experiments with frozen hydrate-bearing sand, at a constant temperature of −6 °C and atmospheric pressure (Figure 13). The contents of salt ions after 4 h of interaction increased in the series Na2SO4–KCl–CaCl2–NaCl–MgCl2 (Figure 13).
Salt ions penetrated the farthest (5 cm from the contact) into the sample that interacted with the MgCl2 solution. The respective values for other salts were 4.6 cm for NaCl, 2.8 cm for CaCl2, 2 cm for KCl, and only ~0.6 cm for Na2SO4.
The salts arrange in the same series Na2SO4–KCl–CaCl2–NaCl–MgCl2 according to the distribution of salt contents and hydrate coefficients along the samples. The hydrate coefficient shows the amount of pore gas hydrates remaining after 4 h of interaction with the respective saline solutions. All pore hydrates, which initially constituted around 40–50% of pore moisture, dissociated over 4.5 cm from the contact with the MgCl2 solution. For other salts, the distances were 3.4 cm for NaCl, 2 cm for CaCl2, and 1 cm for KCl. Unlike these, the interaction with the Na2SO4 solution led to only partial hydrate dissociation: the hydrate coefficient decreased from 0.50 to 0.25 within 0.5 cm from the contact, with minor decrease within 3 cm (Figure 14).
Average flux density of salt ions to the pores of frozen hydrate-bearing samples (Figure 15) was the greatest in the case of interaction with the MgCl2 solution (5.4·10−6 (mg-EQ/100 g)/cm2·s) and the lowest in the case of Na2SO4 (0.3·10−6 mg-EQ/100 g)/cm2·s).
Complete dissociation of pore gas hydrates required different critical concentrations for different salts. They increase in the MgCl2–NaCl–CaCl2–KCl–Na2SO4 series from 3.23 mg-EQ/100 g (0.08%) for MaCl2 to 3.5 mg-EQ/100 g (0.16%) for Na2SO4 at a constant negative temperature of −6 °C and a pressure of 0.1 MPa (Table 3).
Thus, salt migration and the ensuing dissociation of pore gas hydrates in frozen sand interacting with saline solutions of different compositions become progressively more active in the series Na2SO4–KCl–CaCl2–NaCl–MgCl2, which shows up in increasing contents of salt ions and decreasing hydrate coefficients in the samples.

4. Discussion

Thus, the patterns of salt migration from saline solutions to the pore space of frozen hydrate-saturated sediments are largely controlled by ambient temperature, as well as by the concentration and chemistry of solutions. Pore moisture in frozen hydrate-bearing sediments interacting with saline solutions at negative temperatures and at pressures above or below equilibrium undergoes several stages of phase transition (Table 4).
Initially, before the experiments, the salt concentration in the pore moisture is close to zero and the pore methane hydrate is stable at 4 MPa and −6 °C (Table 4a-1).
At the gas pressure above then equilibrium (P ≥ Peq) salt migration from a saline solution to the pore space of frozen hydrate-bearing sediments during the interaction at −6 °C mainly occurs along films of unfrozen water on the surface of sediment particles and along the boundaries of ice crystals. As the process progresses, the water films become thicker as gas hydrates dissociate into gas and water and the ice melts in the pore space (Table 4b-1). Unlike the destabilization of the pore hydrate with a decrease in pressure, where the decomposition of the gas hydrate starts at the gas–gas hydrate interface [45,46], the process of hydrate decomposition begins from the side of unfrozen water films on the surface of particles, since it is unfrozen water films that are the main transport route for the migration of salt ions in frozen rocks [35].
As the migrated salt reaches some critical concentration CCcr(hyd), hydrate dissociation accelerates abruptly until all hydrates dissociate, while the released water freezes up, because the ambient temperature is negative, and the reaction is heat-consuming (Table 4c-1). At a concentration higher than the critical concentration of hydrate dissociation, but less than the critical concentration of ice thawing (Ccr(ice)) there is a gradual increase in the content of the liquid phase due to the smooth melting of pore ice. In this case, the boundary of ice melting can be uneven due to the penetration of the salt solution through the defective zones of ice crystals.
A further increase in the salt concentration above the critical value CCcr(hyd) corresponding to dramatic pore ice melting (if the negative temperature is above the freezing point of the solution) leads to complete thawing of the sample (Table 4d-1).
At gas pressures below the equilibrium value (P < Peq), pore hydrate in frozen sediments is metastable due to the self-preservation effect (Table 4a-2). In these conditions, residual gas hydrate inclusions in permafrost are coated in ice (frozen water that was released by partial hydrate dissociation at a negative temperature). The interaction of saline solutions with frozen sediments containing metastable pore gas hydrate is likewise accompanied by salt migration, but the process is more active, while the critical concentration sufficient to cause complete hydrate dissociation is lower than that in stable conditions, at pressures above the equilibrium, P ≥ Peq (Table 4b-2).
The equilibrium content of unfrozen liquid pore water in hydrate-bearing sediments is known [47] to be lower at above-equilibrium gas pressures (P ≥ Peq) than in the P < Peq case. As salt ions migrate mainly along the films of unfrozen water, salt transport is expected to be more active in sediments with metastable pore gas hydrates.
There is published evidence [37] that permeability along ice crystal boundaries plays an important role in salt transport through frozen rocks. Correspondingly, salt migration to frozen hydrate-bearing sediments must depend on the intergranular permeability of pore hydrate and ice. In this respect, the metastable system, with higher ice contents, can faster attain critical salt concentrations required for hydrate dissociation (Table 4c-2).
Gas released by the dissociation reaction in the conditions of incomplete saturation migrates from the pore space into the free volume outside the sample, at a rate depending on permeability (which is to be studied separately). Some gas can dissolve in liquid pore water, but its solubility is limited by salt concentration in the liquid phase.
Salt migration from the solution to the sediments accelerates at higher temperatures and leads to faster hydrate dissociation due to higher contents of salt ions and lower critical salt concentrations required for complete dissociation of both stable and metastable (self-preserved) pore hydrates, at P ≥ Peq and P < Peq, respectively.
The effect of solution chemistry, the salt concentration being constant, is associated with the mobility of salt ions: e.g., chloride salts are more mobile in frozen rocks than sulfate compounds [48]. Our experimental results confirm that chloride salts can penetrate farther into frozen hydrate-bearing samples and induce more active hydrate dissociation than sulfates. The mobility of cations also depends on their radius [40,49], which increases in the series Mg2+ < Na+ < Ca2+ < K+. The experiments show that the migration of salt ions into the frozen hydrate-bearing rocks becomes less active and the related hydrate dissociation is slower in the same series of salts.
The reported experimental results demonstrate that the processes of salt transport and pore hydrate dissociation in frozen sediments interacting with saline solutions are controlled by gas pressure, as well as by ambient temperature and properties (concentration and chemistry) of the solutions.

5. Conclusions

The reported experiments show that salt transport patterns in frozen hydrate-bearing sediments interacting with saline solutions largely depend on ambient temperature and on the properties (concentration and chemistry) of solutions. The soil temperature and the solution chemistry control the critical salt concentration required to provide complete dissociation of pore gas hydrates.
Lower temperatures decelerate the migration of salt ions from the solution to the sediments and the ensuing dissociation of pore methane hydrate. As the temperature falls from −3 to −16 °C, the critical salt concentration becomes eight times higher, while cooling from −3.0 to −20 °C decreases exponentially the average salt flux density (to almost ten times lower values).
Salt migration from more saline solutions is more active: the average flux density is eight times higher in the case of a 0.4 N NaCl solution than for a 0.1 N solution, at a constant negative temperature of −6 °C and both below- and above-equilibrium pressure. Thus, attaining the salt concentration critical for hydrate dissociation takes less time.
The salt flux density and the contents of salt ions in the frozen hydrate-bearing sediments decrease in the series MgCl2–NaCl–CaCl2–KCl–Na2SO4, while the critical salt concentration increases correspondingly, from 8% for MgCl2 to 16% in Na2SO4.
The experimental data make a basis for modeling phase transitions in the pore moisture of frozen hydrate-saturated sediments interacting with ever more saline solutions in stable (P ≥ Peq) and metastable (P < Peq) conditions.
The experiments confirm that pore gas hydrates in permafrost can lose stability under the impact of saline solutions of natural (seawater in the Arctic shelf or brines from cryopegs) or production-related (disposed of technical waters or drilling fluids) origin. The results can be used to estimate the effect of temperature and solution parameters on salt migration patterns in specific cases.

Author Contributions

Conceptualization, experimental methodology, supervision, E.C.; experimental work, V.E., E.K. and V.S.; processing and analysis, E.C., V.E. and D.D.; writing—original draft preparation, E.C. and V.E.; writing—review and editing, E.C., V.E., D.D. and B.B. All authors have read and agreed to the published version of the manuscript.

Funding

The research was supported by the Russian Science Foundation (grants No. 22-17-00112, 21-77-10074).

Data Availability Statement

Not applicable.

Acknowledgments

The authors owe their gratitude to the anonymous reviewers for their time and effort in improving this paper.

Conflicts of Interest

The authors declare no conflict of interest.

References

  1. Cherskiy, N.V.; Groysman, A.G.; Nikitina, L.M.; Tserev, V.P. First Experimental Determination of Heats of Decomposition of Natural-Gas Hydrates. Dokl. Acad. Sci. USSR Earth Sci. Sect. 1984, 265, 163–167. (In Russian) [Google Scholar]
  2. Chuvilin, E.M.; Yakushev, V.S.; Perlova, E.V. Gas and Possible Gas Hydrates in the Permafrost of Bovanenkovo Gas Field, Yamal Peninsula, West Siberia. Polarforschung 2000, 68, 215–219. [Google Scholar]
  3. Yakushev, V.S. Natural Gas and Gas Hydrates in the Permafrost; Gazprom VNIIGAZ: Moscow, Russia, 2009; p. 192. (In Russian) [Google Scholar]
  4. Max, M. (Ed.) Natural Gas Hydrate in Oceanic and Permafrost Environments; Kluwer Academic Publishers: Washington, DC, USA, 2000; p. 419. ISBN 978-1-4020-1362-1. [Google Scholar] [CrossRef]
  5. Delisle, G. Temporal Variability of Subsea Permafrost and Gas Hydrate Occurrences as Function of Climate Change in the Laptev Sea, Siberia. Polarforschung 2000, 68, 221–225. [Google Scholar]
  6. Wang, J.; Lau, H.C. Thickness of Gas Hydrate Stability Zone in Permafrost and Marine Gas Hydrate Deposits: Analysis and Implications. Fuel 2020, 282, 118784. [Google Scholar] [CrossRef]
  7. Sloan, E.D., Jr.; Koh, C.A. Clathrate Hydrates of Natural Gases; CRC Press: Boca Raton, FL, USA, 2007; p. 752. ISBN 9780429129148. [Google Scholar] [CrossRef]
  8. Nimblett, J.N.; Shipp, R.C.; Strijbos, F. Gas Hydrate as a Drilling Hazard: Examples from Global Deepwater Settings. In Proceedings of the Annual Offshore Technology Conference, Houston, TX, USA, 2–5 May 2005; pp. 1429–1435. [Google Scholar] [CrossRef]
  9. Chuvilin, E.; Ekimova, V.; Davletshina, D.; Sokolova, N.; Bukhanov, B. Evidence of Gas Emissions from Permafrost in the Russian Arctic. Geosciences 2020, 10, 383. [Google Scholar] [CrossRef]
  10. Chuvilin, E.; Davletshina, D. Formation and Accumulation of Pore Methane Hydrates in Permafrost: Experimental Modeling. Geosciences 2018, 8, 467. [Google Scholar] [CrossRef] [Green Version]
  11. Chuvilin, E.M.; Ebinuma, T.; Kamata, Y.; Uchida, T.; Takeya, S.; Nagao, J.; Narita, H. Effects of Temperature Cycling on the Phase Transition of Water in Gas-Saturated Sediments. Can. J. Phys. 2003, 81, 343–350. [Google Scholar] [CrossRef] [Green Version]
  12. Chuvilin, E.M.; Yakushev, V.S.; Perlova, E.V. Experimental Study of Gas Hydrate Formation in Porous Media. In Advances in Cold-Region Thermal Engineering and Sciences; Springer: Berlin/Heidelberg, Germany, 1999; pp. 431–440. [Google Scholar] [CrossRef]
  13. Koh, C.A.; Sloan, E.D. Natural Gas Hydrates: Recent Advances and Challenges in Energy and Environmental Applications. AIChE J. 2007, 53, 1636–1643. [Google Scholar] [CrossRef]
  14. Kuhs, W.F.; Genov, G.; Staykova, D.K.; Hansen, T. Ice Perfection and Onset of Anomalous Preservation of Gas Hydrates. Phys. Chem. Chem. Phys. 2004, 6, 4917–4920. [Google Scholar] [CrossRef]
  15. Chuvilin, E.; Bukhanov, B.; Davletshina, D.; Grebenkin, S.; Istomin, V. Dissociation and Self-Preservation of Gas Hydrates in Permafrost. Geosciences 2018, 8, 431. [Google Scholar] [CrossRef] [Green Version]
  16. Takeya, S.; Ebinuma, T.; Uchida, T.; Nagao, J.; Narita, H. Self-Preservation Effect and Dissociation Rates of CH4 Hydrate. J. Cryst. Growth 2002, 237, 379–382. [Google Scholar] [CrossRef]
  17. Chuvilin, E.M.; Guryeva, O.M. Experimental Study of Self-Preservation Effect of Gas Hydrates in Frozen Sediments. In Proceedings of the 9th International Conference on Permafrost, Fairbanks, AK, USA, 29 June–3 July 2008; Volume 28. [Google Scholar]
  18. Buffett, B.A.; Zatsepina, O.Y. Metastability of Gas Hydrate. Geophys. Res. Lett. 1999, 26, 2981–2984. [Google Scholar] [CrossRef]
  19. Istomin, V.A.; Yakushev, V.S.; Makhonina, N.A.; Kwon, V.G.; Chuvilin, E.M. Self-Preservation Phenomenon of Gas Hydrate. Gas Ind. 2006, 36–46. (In Russian) [Google Scholar]
  20. Stern, L.A.; Circone, S.; Kirby, S.H.; Durham, W.B. Temperature, Pressure, and Compositional Effects on Anomalous or “Self” Preservation of Gas Hydrates. Can. J. Phys. 2003, 81, 271–283. [Google Scholar] [CrossRef]
  21. Saw, V.K.; Das, B.B.; Ahmad, I.; Mandal, A.; Laik, S. Influence of Electrolytes on Methane Hydrate Formation and Dissociation. Energy Sources Part A Recovery Util. Environ. Eff. 2014, 36, 1659–1669. [Google Scholar] [CrossRef]
  22. Najibi, H.; Mohammadi, A.H.; Tohidi, B. Estimating the Hydrate Safety Margin in the Presence of Salt and/or Organic Inhibitor Using Freezing Point Depression Data of Aqueous Solutions. Ind. Eng. Chem. Res. 2006, 45, 4441–4446. [Google Scholar] [CrossRef]
  23. Qi, Y.; Wu, W.; Liu, Y.; Xie, Y.; Chen, X. The Influence of NaCl Ions on Hydrate Structure and Thermodynamic Equilibrium Conditions of Gas Hydrates. Fluid Phase Equilibria 2012, 325, 6–10. [Google Scholar] [CrossRef]
  24. Kamath, V.A.; Mutalik, P.N.; Sira, J.H.; Patil, S.L. Experimental Study of Brine Injection Depressurization of Gas Hydrates Dissociation of Gas Hydrates. SPE Form. Eval. 1991, 6, 477–484. [Google Scholar] [CrossRef]
  25. Masoudi, R.; Tohidi, B. On Modelling Gas Hydrate Inhibition by Salts and Organic Inhibitors. J. Pet. Sci. Eng. 2010, 74, 132–137. [Google Scholar] [CrossRef]
  26. Wu, G.; Ji, H.; Tian, L.; Chen, D. Effects of Salt Ions on the Methane Hydrate Formation and Dissociation in the Clay Pore Water and Bulk Water. Energy Fuels 2018, 32, 12486–12494. [Google Scholar] [CrossRef]
  27. Zhang, L.; Sun, L.; Lu, Y.; Kuang, Y.; Ling, Z.; Yang, L.; Dong, H.; Yang, S.; Zhao, J.; Song, Y. Molecular Dynamics Simulation and In-Situ MRI Observation of Organic Exclusion during CO2 Hydrate Growth. Chem. Phys. Lett. 2021, 764, 138287. [Google Scholar] [CrossRef]
  28. Chuvilin, E.; Ekimova, V.; Davletshina, D.; Bukhanov, B.; Krivokhat, E.; Shilenkov, V. Temperature Variation during Salt Migration in Frozen Hydrate-Bearing Sediments: Experimental Modeling. Geosciences 2022, 12, 261. [Google Scholar] [CrossRef]
  29. Li, S.; Wang, J.; Lv, X.; Ge, K.; Jiang, Z.; Li, Y. Experimental Measurement and Thermodynamic Modeling of Methane Hydrate Phase Equilibria in the Presence of Chloride Salts. Chem. Eng. J. 2020, 395, 125126. [Google Scholar] [CrossRef]
  30. Zatsepina, O.Y.; Buffett, B.A. Thermodynamic Conditions for the Stability of Gas Hydrate in the Seafloor. J. Geophys. Res. Solid Earth 1998, 103, 24127–24139. [Google Scholar] [CrossRef]
  31. Dholabhai, P.D.; Englezos, P.; Kalogerakis, N.; Bishnoi, P.R. Equilibrium Conditions for Methane Hydrate Formation in Aqueous Mixed Electrolyte Solutions. Can. J. Chem. Eng. 1991, 69, 800–805. [Google Scholar] [CrossRef]
  32. Dickens, G.R.; Quinby-Hunt, M.S. Methane Hydrate Stability in Seawater. Geophys. Res. Lett. 1994, 21, 2115–2118. [Google Scholar] [CrossRef]
  33. Cha, M.; Hu, Y.; Sum, A.K. Methane Hydrate Phase Equilibria for Systems Containing NaCl, KCl, and NH4Cl. Fluid Phase Equilibria 2016, 413, 2–9. [Google Scholar] [CrossRef]
  34. Alekseev, S. Cryogenesis of Groundwater and Rocks (on the Example of the Daldino-Alakitsky Region of Western Yakutia); SRC OIGGM SO: Novosibirsk, Russia, 2000; p. 119. (In Russian) [Google Scholar]
  35. Chuvilin, E.M.; Ershov, E.D.; Smirnova, O.G. Ionic Migration in Frozen Soils and Ice. In Proceedings of the 7th International Permafrost Conference, Yellowknife, NT, Canada, 23–27 June 1998; pp. 167–171. [Google Scholar]
  36. Ershov, E.D.; She, Z.S.; Lebedenko, Y.; Chuvilin, E.M.; Kryuchkov, K.Y. Mass Transfer and Deformation Processes in Frozen Rocks Interacting with Aqueous Salt Solutions. In Engineering-Geological Study and Evaluation of Frozen, Freezing and Thawing Soils (IGK-92). Materials of the III Scientific and Technical Workshop; Vedeneev VNIIG: St Petersburg, Russia, 1993; pp. 67–77. (In Russian) [Google Scholar]
  37. Ershov, E.D.; Chuvilin, E.N.; Smirnova, O.G. Mobility of Ions of Chemical Elements in Ice and Frozen Rocks. Dokl. Akad. Nauk 1999, 367, 796–798. (In Russian) [Google Scholar]
  38. Borisov, V.; Alekseev, S. Factors of Interaction of Brines with Ice (Frozen Rock) at a Negative Temperature. In Fundamental Problems of Water and Water Resources at the Turn of the III Millennium; NTL: Tomsk, Russia, 2000; pp. 584–589. (In Russian) [Google Scholar]
  39. Gaidaenko, E.P. Solubility of Ice in Frozen Soils under the Influence of Saline Solutions. In Problems of Engineering Glaciology; Nauka: Novosibirsk, Russia, 1986; pp. 32–36. (In Russian) [Google Scholar]
  40. Ershov, E.D. (Ed.) Fundamentals of Geocryology. Part 1. Physical and Chemical Foundations of Geocryology; MSU: Moscow, Russia, 1995; p. 368. ISBN 5-211-02464-8. (In Russian) [Google Scholar]
  41. Chuvilin, E.M.; Davletshina, D.A.; Lupachik, M.V. Hydrate Formation in Frozen and Thawing Methane-Saturated Sediments. Earth’s Cryosphere 2019, 23, 44–52. [Google Scholar] [CrossRef]
  42. Chuvilin, E.; Ekimova, V.; Bukhanov, B.; Grebenkin, S.; Shakhova, N.; Semiletov, I. Role of Salt Migration in Destabilization of Intra Permafrost Hydrates in the Arctic Shelf: Experimental Modeling. Geosciences 2019, 9, 188. [Google Scholar] [CrossRef] [Green Version]
  43. Xu, J.; Chen, Z.; Liu, J.; Sun, Z.; Wang, X.; Zhang, J. A Molecular Dynamic Study on the Dissociation Mechanism of SI Methane Hydrate in Inorganic Salt Aqueous Solutions. J. Mol. Graph. Model. 2017, 75, 403–412. [Google Scholar] [CrossRef] [PubMed]
  44. Zheng, R.; Li, X.; Negahban, S. Phase Boundary of Gas Hydrates in Single and Mixed Electrolyte Solutions: Using a Novel Unified Equation of State. J. Mol. Liq. 2022, 345, 117825. [Google Scholar] [CrossRef]
  45. Chuvilin, E.M.; Kozlova, E.V.; Skolotneva, T.S. Experimental Simulation of Frozen Hydrate-Containing Sediments Formation. In Proceedings of the Fifth International Conference on Gas Hydrates, Trondheim, Norway, 13–16 June 2005; pp. 1561–1567. [Google Scholar]
  46. Yang, L.; Falenty, A.; Chaouachi, M.; Haberthür, D.; Kuhs, W.F. Synchrotron X-ray Computed Microtomography Study on Gas Hydrate Decomposition in a Sedimentary Matrix. Geochem. Geophys. Geosyst. 2016, 17, 3717–3732. [Google Scholar] [CrossRef] [Green Version]
  47. Sergeeva, D.; Istomin, V.; Chuvilin, E.; Bukhanov, B.; Sokolova, N. Influence of Hydrate-Forming Gas Pressure on Equilibrium Pore Water Content in Soils. Energies 2021, 14, 1841. [Google Scholar] [CrossRef]
  48. Lebedenko, Y.P. Cryogenic Migration of Ions and Bound Moisture in Ice-Saturated Frozen Rocks. Eng. Geol. 1989, 4, 21–30. (In Russian) [Google Scholar]
  49. Benediktova, N.A. Physical and Chemical Processes in Frozen Rocks during Their Interaction with Saline Solutions; Moscow State University: Moscow, Russia, 1992. (In Russian) [Google Scholar]
Figure 1. System for modeling the interaction between frozen hydrate-saturated and hydrate-free rocks with saline solutions under atmospheric and higher pressures.
Geosciences 12 00276 g001
Figure 2. Variations of Na+ contents along frozen hydrate-bearing sand samples for 2 h of interaction with a 0.2 N NaCl solution under different temperature: (a) −3 °C; (b) −6 °C; (c) −20 °C.
Geosciences 12 00276 g002
Figure 3. Variations of hydrate coefficient ( K h ) along frozen hydrate-bearing sand samples ( K h i n ~0.4, W = 12%) for 2 h of interaction with a 0.2 N NaCl solution at −3 (a), −6 (b), and −20 °C (c).
Geosciences 12 00276 g003
Figure 4. Average Na+ flux to a frozen hydrate-bearing sample for 4 h of interaction with a 0.1 N NaCl solution, at 0.1 MPa.
Geosciences 12 00276 g004
Figure 5. Temperature dependence of critical salt concentration ( C c r ) required for complete dissociation of pore gas hydrate in frozen sand at 0.1 MPa (Csol = 0.1N).
Geosciences 12 00276 g005
Figure 6. Pressure and temperature conditions of hydrate stability in a free volume at different NaCl concentrations (HydraFlash modeling).
Geosciences 12 00276 g006
Figure 7. Variations of Na+ contents along frozen hydrate-bearing sand samples after four hours of interaction with 0.1 N (A), 0.2 N (B), and 0.4 N (C) NaCl solutions, at −6.5 °C and 0.1 MPa.
Geosciences 12 00276 g007aGeosciences 12 00276 g007b
Figure 8. Variations of hydrate coefficient ( K h ) along frozen hydrate-bearing sand samples ( K h i n ~0.4, W = 12%) after four hours of interaction with 0.1 N (A), 0.2 N (B), and 0.4 N (C) NaCl solutions, at −6.5 °C and 0.1 MPa.
Geosciences 12 00276 g008aGeosciences 12 00276 g008b
Figure 9. Variations of Na+ contents along frozen hydrate-bearing sand samples after four hours of interaction with 0.1 N (A) and 0.2 N (B) NaCl solutions, at −6.5 °C and 4.0 MPa.
Geosciences 12 00276 g009aGeosciences 12 00276 g009b
Figure 10. Variations of hydrate coefficient ( K h ) along frozen hydrate-bearing sand samples ( K h i n ~0.4, W = 12%) after four hours of interaction with 0.1 N (A) and 0.2 N (B) NaCl solutions, at −6.5 °C and 4.0 MPa.
Geosciences 12 00276 g010
Figure 11. Variations of Na+ contents in frozen hydrate-bearing sand after four hours of interaction with a NaCl solution of different concentrations, at −6.5 °C and p = 0.1 and 4.0 MPa.
Geosciences 12 00276 g011
Figure 12. Pressure and temperature conditions of pore hydrate stability in frozen sand interacting with 5% Na2SO4, KCl, CaCl2, NaCl, and MgCl2 solutions, at temperatures from 0 °C to −20 °C (HydraFlash modeling).
Geosciences 12 00276 g012
Figure 13. Contents of salt ions along frozen hydrate-bearing sand samples after 4 h of interaction with 0.1 N CaCl2, KCl and NaCl solutions at −6.5 °C and 0.1 MPa.
Geosciences 12 00276 g013
Figure 14. Variations of hydrate coefficient ( K h ) along frozen hydrate-bearing sand samples ( K h i n ~0.5, W = 12%) after 4 h of interaction with 0.1 N CaCl2, KCl and NaCl solutions at −6.5 °C and 0.1 MPa.
Geosciences 12 00276 g014
Figure 15. Average density of the flux of salt ions to a frozen hydrate-bearing sample for 4 h of interaction with 0.1 N MgCl2, NaCl, CaCl2, KCl, and NaSO4 solutions, at −6.5 °C and 0.1 MPa.
Geosciences 12 00276 g015
Table 1. Grain sizes and mineralogy of sandy samples.
SampleParticle Size Distribution, %Mineralogy *
1–0.50.5–0.250.25–0.10.1–0.050.05–0.001<0.001
Fine Sand>0.11.580.417.30.8>0.1>98% quartz
* Element contents > 1%.
Table 2. Salinity and major-ion chemistry of solutions used in experiments.
Soil TypeAnions, mg-EQ/100 gCations, mg-EQ/100 gTDS, %
pHHCO3ClSO42−Ca2+Mg2+Na+ + K+
Sand7.10.0750.0250.060.025-0.1350.01
Table 3. Critical salt concentration ( C c r ) required for dissociation of pore gas hydrates in frozen sand interacting with MgCl2, NaCl, CaCl2, KCl, and NaSO4 solutions at −6.5 °C and 0.1 MPa.
Salt C c r mg-EQ/100 g C c r ,   %
MgCl23.230.08
NaCl4.890.11
CaCl23.290.13
KCl3.900.15
Na2SO43.500.16
Table 4. Phase transitions of pore moisture of frozen hydrate-saturated sediments interacting with saline solutions depending on the accumulation of salts and the conditions for existence of pore methane hydrates (at stable (P ≥ Peq) and metastable (P < Peq) conditions). P is experimental pressure and Peq is equilibrium pressure. Detailed explanation in the text.
StagesGas pressure
P ≥ PeqP < Peq
Initial state (Cin = 0%) Geosciences 12 00276 i001 Geosciences 12 00276 i002 Geosciences 12 00276 i003
CcrhydC > Cin Geosciences 12 00276 i004 Geosciences 12 00276 i005
Ccrhyd < CCcr ice Geosciences 12 00276 i006 Geosciences 12 00276 i007
Ccrhyd < C > Ccr ice Geosciences 12 00276 i008 Geosciences 12 00276 i009
Publisher’s Note: MDPI stays neutral with regard to jurisdictional claims in published maps and institutional affiliations.

