Abstract
Karst springs are an essential source of private water supply for about 10% of households in Tennessee. However, the water quality of these springs is unmonitored and unregulated even though many springs are highly productive yet vulnerable to contamination. This study assesses spatial patterns in the water quality of roadside springs in northeast Tennessee. Karst spring water samples collected from 50 springs were assessed using EPA Standard methods for pathogens, nutrients, radon, and physicochemical parameters. From statistical and spatial analyses, all but five samples contained E. coli, while all samples contained fecal coliform. High E. coli was spatially clustered (Local Moran’s I = 0.177, pseudo p-value = 0.012) in regions of high agricultural land use, resulting in a fecal contamination hot spot on the border of Washington and Sullivan Counties, Tennessee. Radon concentrations exceeded the 300 pCi/L proposed MCL in 29 (58%) of springs, with one spring in Unicoi County exceeding 1000 pCi/L. A radon hot spot was identified in northern Washington County (Local Moran’s I = 0.160, pseudo p-value = 0.014). Cokriging of E. coli with land use and radon with distance to mapped fault did not improve interpolation models for either parameter. Other parameters, including nitrate, pH, and total dissolved solids, were within recommended ranges for drinking water. This snapshot of spring water quality status identifies areas of poor spring water quality of which spring water users in the region should be aware, and establishes the need for longitudinal sampling of spring water quality in contamination hot spots.
1. Introduction
Safe drinking water is a strategic priority for humanity [1]. As a natural drainage of groundwater aquifers, springs are a source of fresh water at household, city/county, and even regional scales, depending on the quality and quantity of discharge [2,3,4]. An estimated 15 million (13%) American households rely on private drinking-water systems [5,6]. Springs are an essential source of water supply in Tennessee for rural and municipal drinking water [7,8]. In Tennessee, 10% of households [9], including 95% of rural residents [10], rely on private water supplies (defined as springs, wells, lakes, and rainwater [9]).
Some of the largest springs and most prolific groundwater supplies around the world are karstic [11], formed primarily by the dissolution and surface drainage of carbonate terranes [12]. Karst makes up about 50,000,000 km2 (20–25%) of the earth’s land surface [13,14,15], and approximately 20% of land surface in the United States [12,16]. In East Tennessee, karst springs are formed due to fractured and faulted zones and solution openings in the carbonate rocks of the Chickamauga, Knox, and Conasauga Groups [3].
While springs are often regarded as high-quality water sources [17], they are also highly susceptible to pathogenic bacteria and contamination from inorganic compounds [8,18,19,20,21] due to the absence of a natural filtration system and rapidly flowing water in karst systems [22]. Pathways into the subsurface exist through karst bedrock features such as sinkholes, conduits, sinking streams, and caves [23,24] which may rapidly focus both point and non-point-source pollution with little physical and biogeochemical attenuation (through degradation, sorption, or ion exchange). Furthermore, radiogenic contamination may also be associated with springs in karst landscapes [25], and when subsurface streams reemerge as springs, they carry these pollutants, creating high potential for adverse public and environmental health effects when the springs are used for water supply [12,23,24,26].
Increased bacterial loads (i.e., E. coli) have been attributed to the flushing of (allochthonous) bacteria into groundwater by stormwater runoff [27,28]. Bacterial contamination is of concern in karst regions where sewers, septic tanks, and livestock farms may be sited up-gradient of a spring [8,29,30,31,32]. Widespread enteric viruses and fecal contamination have been reported in many springs of Appalachia [26] and East Tennessee [28,33].
Inorganic compounds commonly found in spring water include nitrates, phosphates, and chloride [34]. Nitrate, with generally low background concentration in groundwater [35], can become elevated through anthropogenic enrichment related to agricultural activities or domestic effluent discharge [36,37,38].
Elevated radon concentration in groundwater has been associated with karst landscapes [39], faults [25,40,41], and well depth [40]. This is not unique to karst landscapes alone, as elevated radon has been reported in groundwater wells of the Piedmont region of North Carolina (USA), which is underlain by fractured crystalline rocks [42], and in East Tennessee, with terrigenous clastic aquifers of the Ocoee Supergroup (pCo), Snowbird (pCs), and Great Smoky Groups (pCg), as well as the argillaceous and conglomerate aquifers of the Walden Creek Group (pCw) [25,29,43]. Geogenic radioactive substances such as radon from the radioactive decay of radium (Ra-226) present in rock and soils [44] or uranium-238, thorium-232, and uranium-235 contained in rocks [45] may be present in groundwater [34,46] and be transferred to indoor air through domestic water use, posing a public health threat. This threat can be magnified in Tennessee where 1 in 5 homes experiences elevated radon in indoor air with a higher prevalence in East Tennessee [47]. Radon is considered to be the second leading cause of lung cancer in the USA [47]; the exposure risk through ingestion and transfer from water to indoor air is increased due to degasification of elevated waterborne radon concentration [48]. Radon concentration in indoor air is increased by 1-2 pCi/L for every 10,000 pCi/L of radon in household water supplies. Even such a small increase is important as the action level for indoor air is 4 pCi/L of radon [49] and elevated household radon in indoor air occurs in East Tennessee [47]. A map of average household radon concentration in air (https://arcg.is/1STe9L1, accessed on 18 August 2021) shows average concentration in excess of the 4 pCi/L action level in all study counties except Greene County (average concentration 2-4 pCi/L). The nexus between indoor air radon and radon in spring water becomes important when springs are developed and piped for indoor use.
Groundwater and surface water interactions in karst landscapes of East Tennessee have been assessed primarily to evaluate groundwater flow paths and velocities via dye tracing [50,51,52], or to measure spring water discharge [3,7,53]. Limited water quality parameters have been assessed [3,25,26,33,54] and two regional studies on surface and cave/spring water quality found conflicting results; cave/spring water had significantly lower bacteria concentrations than surface water in one study [50], but similar concentrations in the other [28]. Thus, little is known about karst spring water impact on surface water quality in East Tennessee. This is of high importance because statewide, 13,485 km (50%) of assessed recreational waters and 26 km (1%) of domestic-water-supply streams are reported as impaired for bacteria [55]. Because karst springs may be a source of bacteriological impairment for these streams, a first step is to complete a regional assessment of spring water quality.
The aims of this study are, therefore, to (1) assess water quality constituents of karst spring water to acquire a baseline dataset and provide a snapshot of water quality in springs that can serve as a drinking water source; and (2) assess spatial patterns in water quality parameters to identify contamination hot spots. Because private-water-supply sampling is not mandated in Tennessee, the results of this research may help to identify impaired springs, providing baseline data for a more focused follow-up study to include intensive sampling in problem areas.
2. Materials and Methods
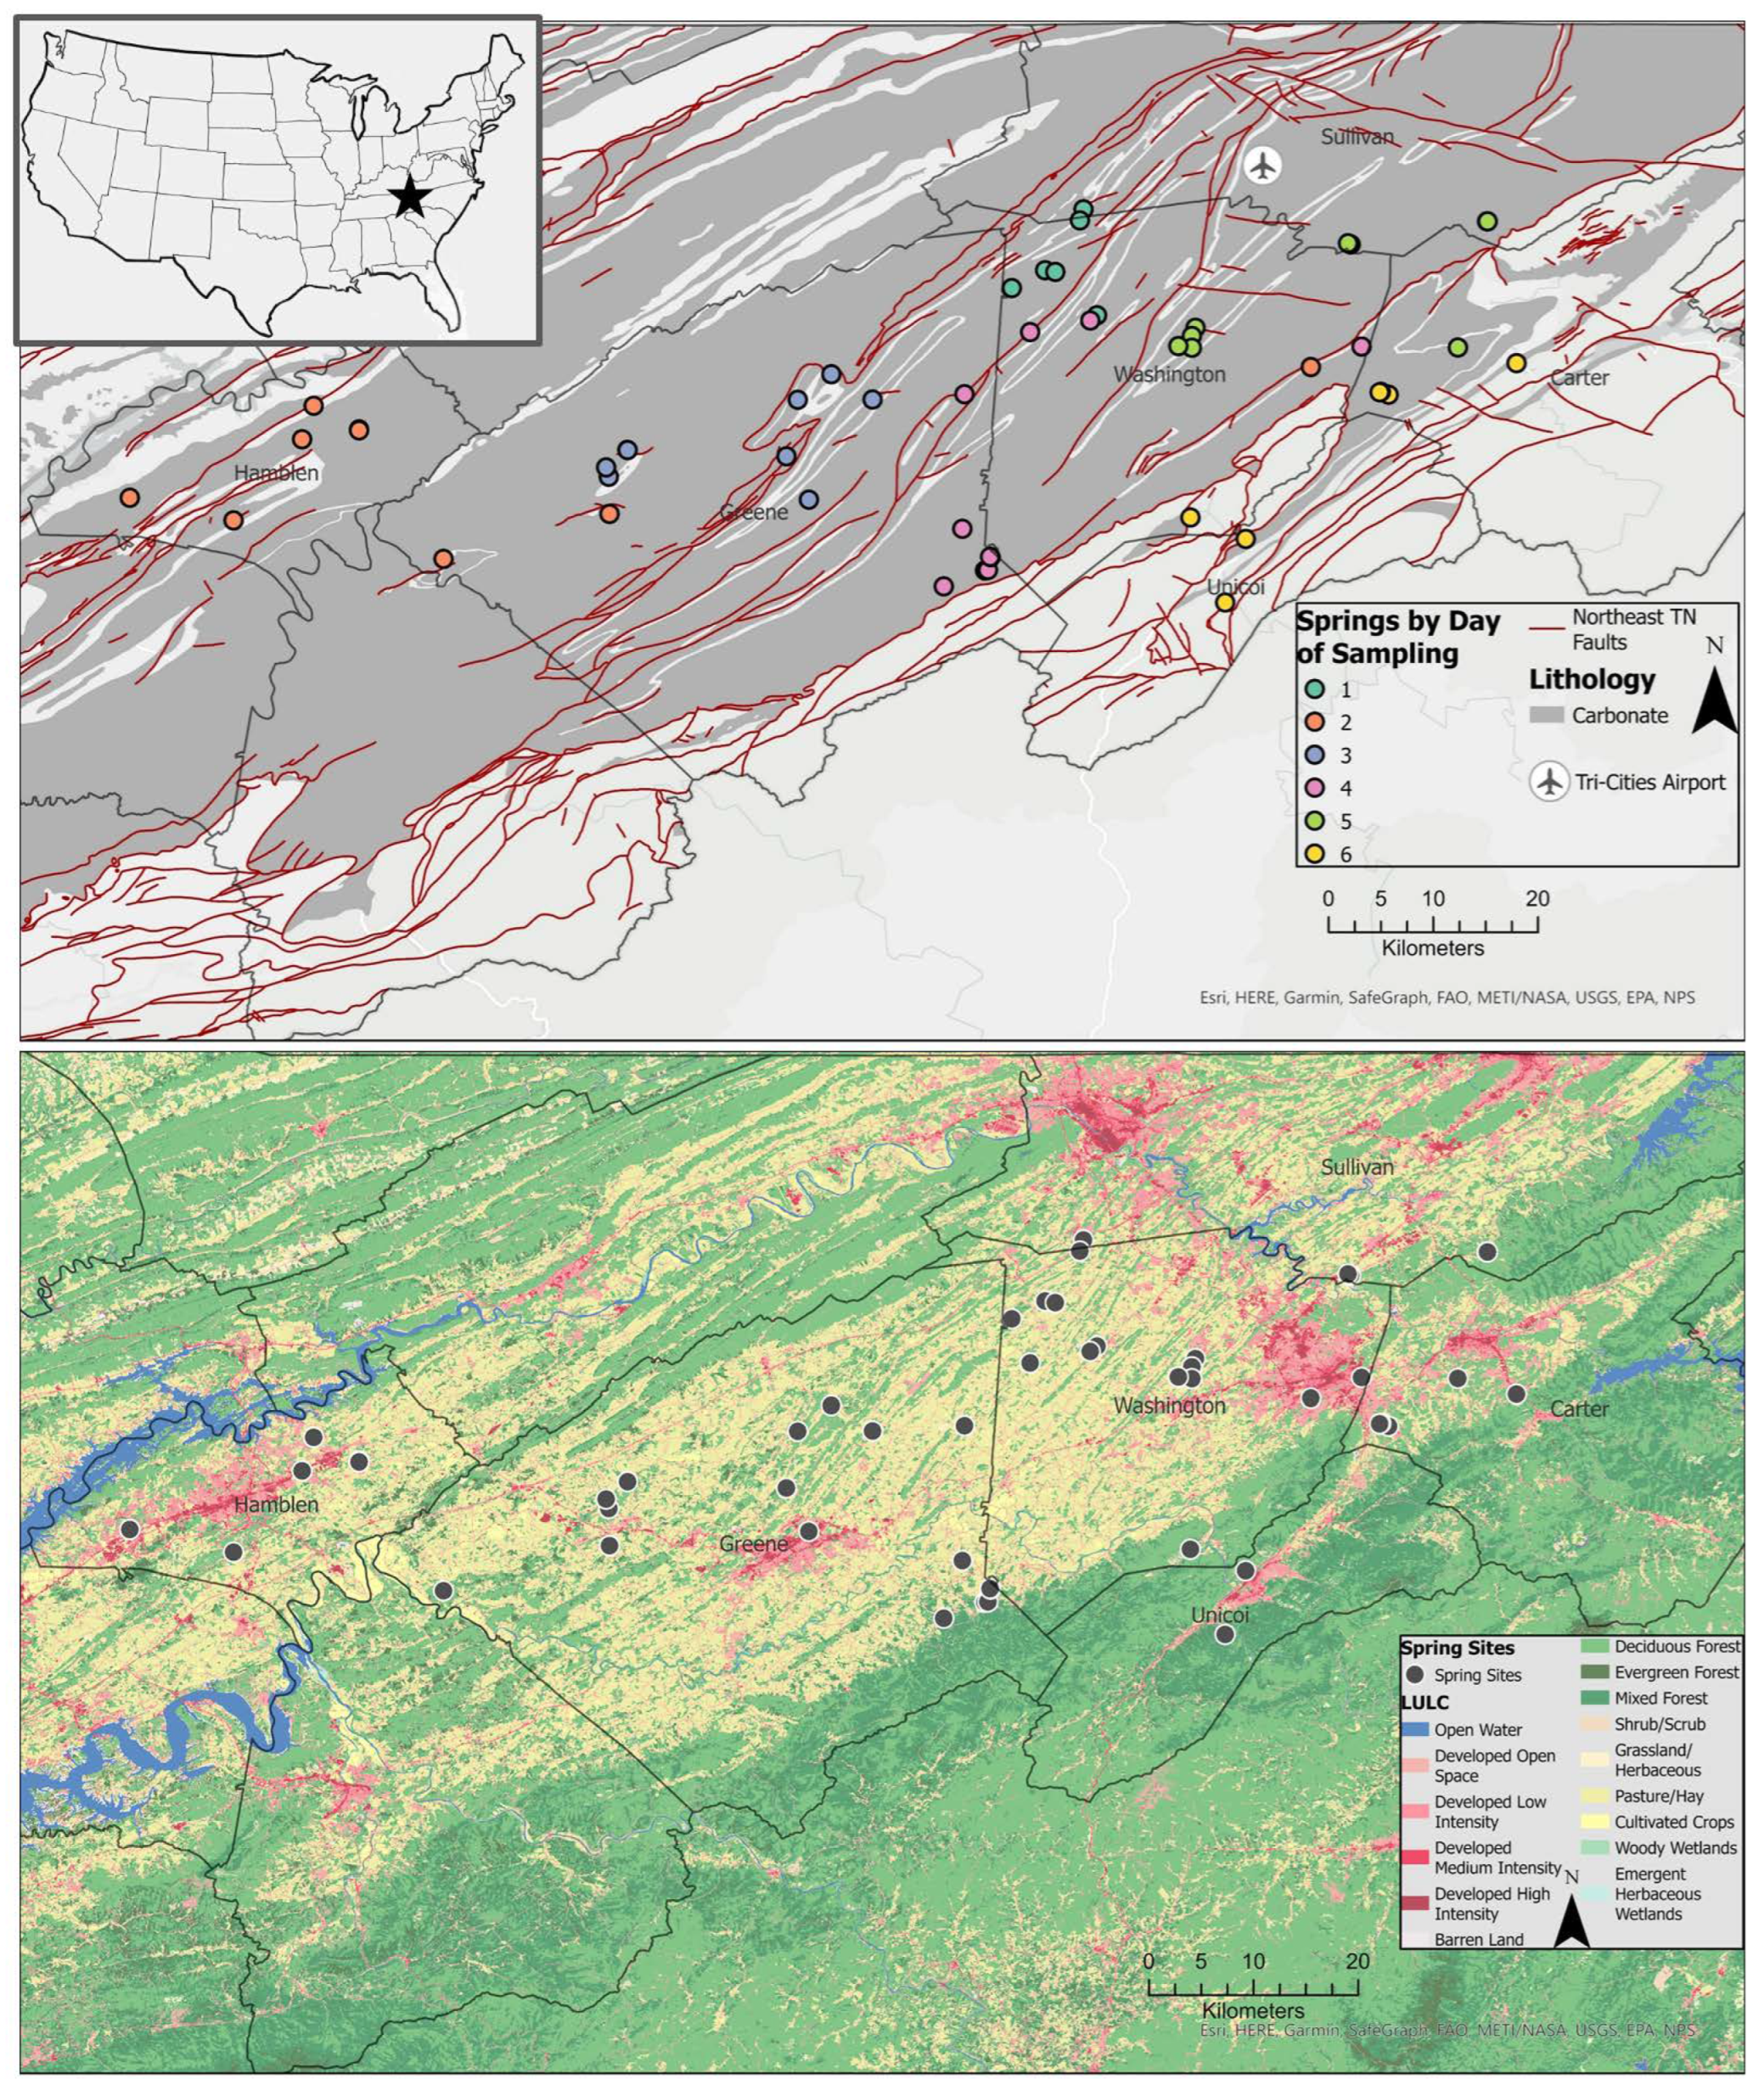
The study area consists of a six-county region in northeast Tennessee, USA (Figure 1) which experiences a humid subtropical (Cfa) climate with mean winter low temperatures of 1.7 °C (35 °F) and summer high temperatures of 29.4 °C (85 °F) [56]. Precipitation occurs year round, with higher accumulation in the summer months and an annual accumulation between 1016 and 1270 mm [56,57]. The study area lies within the Valley and Ridge physiographic province which is characterized by parallel northeast–southwest-oriented ridges and valleys underlain by folded and faulted sedimentary strata. The ridges are cherty limestone and dolomite of the Knox Group, and valleys are underlain by soluble limestone of the Ordovician-aged Chickamauga limestone and calcareous shale of the Cambrian-aged Conasauga Group [7,58].
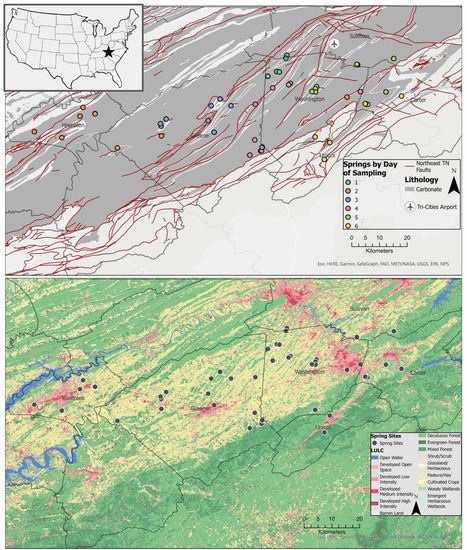
Figure 1.
Simplified geologic map of East Tennessee displays carbonate zones, faults and sampling points (upper), and land use (2019 National Land Cover Dataset) (lower).
Sampling locations were predominantly underlain by carbonate rocks in areas of agricultural land use (Figure 1). They were identified through databases of known springs from Tennessee Hometown Locator (https://tennessee.hometownlocator.com/ accessed on 24 March 2021) using data from the Geographic Names Information System maintained by the US Geological Survey and a private database provided by the Tennessee Department of Environment and Conservation. Springs’ GPS coordinates were mapped and assessed in Google Earth and Google Street View for evidence of spring and potential of free access for sampling. Local knowledge of spring location was also utilized for access to private springs with landowner permission.
2.1. Field Data Collection
Field sampling of fifty springs took place during six sampling days between 10 May and 15 June 2021, coinciding with some precipitation events in the region prior to sampling days 1 and 5 (3 mm and 5.1 mm of precipitation, respectively). Overall, during the study period, the region received normal monthly precipitation, with some parts accumulating less than 75% of the normal total monthly precipitation, and others receiving in excess of 125% [59,60]. We identified five USGS stream gauges in the study area and noted that discharge patterns were similar for all five, with peak flows, associated with rainfall around sampling day 5, occurring between sampling days 5 and 6. Stream discharge was increasing at sampling day 5 and in recession at sampling day 6. Discharge was not measured at the individual springs due to the extremely low flow of some springs and lack of accessibility at others.
All spring water samples were collected for analysis following the USEPA single sample method (USEPA, 2010). We elected to collect a single sample at each site due to the regional scale of the study area and the lack of water quality data available for all but one sampled spring (the public water supply spring for the city of Elizabethton, TN). Discrete sampling is recommended for large study areas where a regional assessment of water quality is required [26,61]. Therefore, this methodology was selected to provide background data on spring water quality in the study area.
Physicochemical properties of water were measured in situ during sample collection using a YSI ProDSS-2 626870-2 multiparameter water quality meter (with GPS) calibrated for each of the parameters (Table 1). Water samples for fecal coliform and E. coli were collected in 125 mL single-use sterile plastic bottles. Samples for nitrate/nitrite and radon analyses were collected in 200 mL plastic bottles and 40 mL amber glass radon vials, respectively. All samples were stored in a cooler with ice until analyzed. At all sites, samples were collected where water emerged from the ground. For some sites, water was collected using a plastic dipper and transferred to sample bottles. The dipper and all equipment were sanitized with a 1% solution of Liquinox prior to sampling.

Table 1.
Water quality parameters and methods of measurement.
2.2. Laboratory Analysis
Water samples were subjected to chemical (nitrate and nitrite), microbial (fecal coliform and E. coli), and radon constituents’ analyses. Water samples for chemical and radioactive constituents were transported overnight on ice to an external lab for processing. Samples were processed for radon (Rn-222) using Method 7500-RN(B) [62], and for nitrate/nitrite using Method 300_M [63]. Microbial constituents were analyzed with EPA Standard Methods 9223 B (Enzyme Substrate) using the Colilert Quanti-Tray 2000 method in the East Tennessee State University Department of Geosciences Hydrology Laboratory.
2.3. Statistical and Geostatistical Analysis
Descriptive statistics were calculated in SPSS 25.0 [64]. Antecedent precipitation (24-h total) for each sampling day were downloaded from the National Climatic Data Center for Tri-Cities Airport, TN. Correlation analysis was conducted in SPSS 25.0 to assess the relationship between antecedent precipitation and water quality parameters. Next, using K-means clustering, we grouped the sample sites into six clusters based on similarity of water quality parameters and compared cluster membership with sampling day, reasoning that if antecedent precipitation impacted water quality, then sampling sites in the same water quality cluster would have been collected on the same sampling day.
To identify the most important parameters in distinguishing springs from each other based on water quality, a principal components analysis was completed. We repeated the K-means clustering exercise using the four components to further compare this grouping with sampling day.
Spatial autocorrelation of all parameters was assessed using the Local Moran’s I in GeoDa [65]. Distance from each sampling site to the nearest fault was measured in ArcGIS Pro using the near tool, and Spearman correlation was calculated to determine the strength and nature of the relationship between fault proximity and radon concentration. Kriging and cokriging interpolation were completed in ArcGIS Pro 2.8.3 [66] for E. coli and radon, the only parameters with statistically significant spatial autocorrelation and health-based regulatory criteria violation. Ordinary kriging interpolation analysis was performed on log-transformed E. coli and square root-transformed radon. Cokriging interpolation of E. coli with agricultural land use and radon with distance to fault, as inferred from previous research [25,67,68], was conducted to improve the precision of the interpolation of these parameters and reduce the uncertainty in the predicted error surfaces. Prediction error statistics and cross-validation plots (distribution and scatter plots of predicted and measured data) from both models were compared to identify the best model. For an unbiased prediction, mean prediction error and mean standardized should be near zero. For valid predicted standard errors, root mean square standardized errors should be close to 1 [69].
To prepare the agricultural land use dataset for cokriging with E. coli, we identified “pasture/hay” and “cultivated crops” land uses in the 2019 National Land Cover Dataset (Figure 1) [70]. Based on the 30 m resolution of the land cover data, a square tessellation (area = 0.23 km2) of the study area was generated, and zonal statistics were used to calculate the area measurement of each land use. Percent agricultural land (pasture/hay and cultivated crop land uses) was calculated from the zonal statistics table output and joined to the tessellation layer. This layer of percent agricultural land use was used as the second variable in the optimized cokriging interpolation of E. coli.
The distance to fault layer was generated for a similar tessellation using the near tool to calculate distance from each cell to the nearest fault. This fault proximity layer was used as a covariate in the radon cokriging interpolation.
3. Results
3.1. Descriptive Statistics
Descriptive statistics for all physicochemical parameters, nitrate and nitrite, fecal coliform, E. coli, and radon are displayed in Table 2 with water quality standards for each parameter.

Table 2.
Descriptive Statistics of Water Quality Constituents Standards (Environmental Protection Agency (EPA); Tennessee Department of Environment and Conservation [TDEC]).
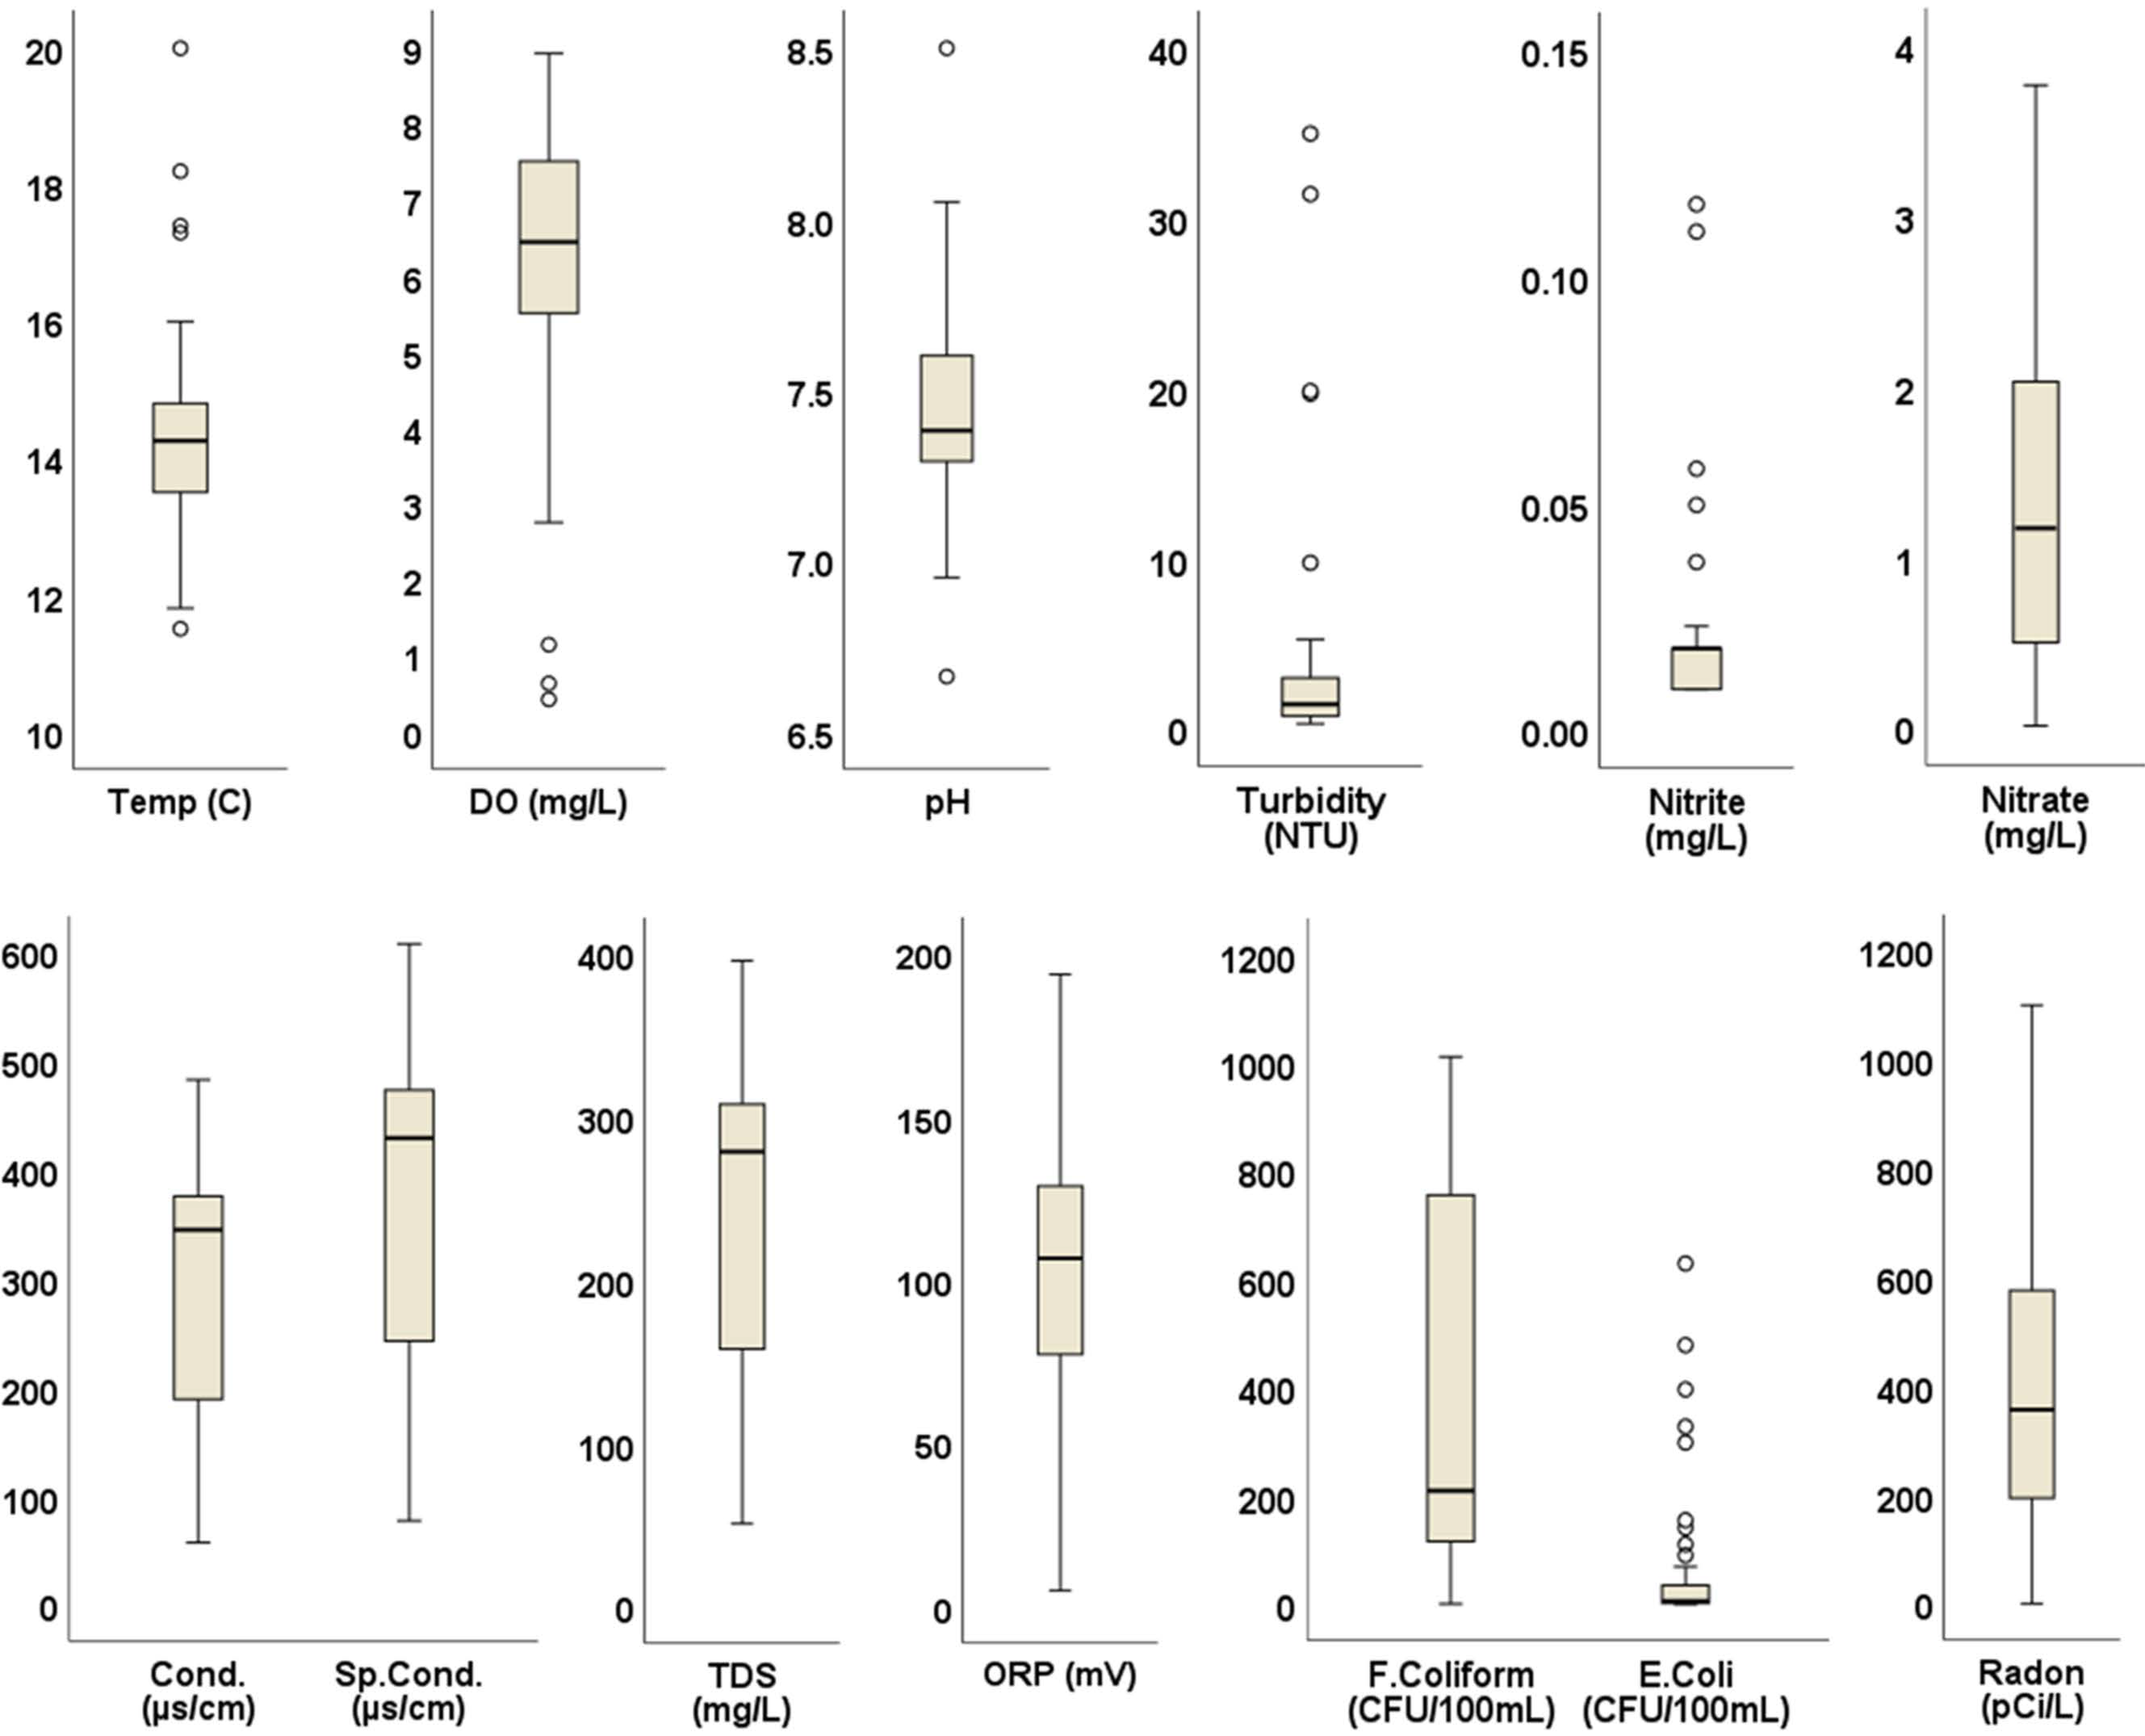
Water samples generally met water quality criteria for physicochemical parameters when the univariate statistics shown in Figure 2 were compared with regulatory criteria in Table 2. DO ranged from 0.42 to 8.93 mg/L, with a median of 6.44 mg/L; 84% of sampled springs met DO standards of >5 mg/L. Turbidity ranged from 0.30 to 35 NTU; an outlier of 787 NTU resulted from disturbance during sampling related to exceptionally low flows and was discarded. Aside from this, turbidity in 86% of samples met the standard of 5 NTU. ORP ranged from −50.80 mV to 652.70 mV, with a median of 106.65 mV. All but one of the springs had an ORP below 250 mV, the minimum to meet drinking-water standards (Lin et al., 2017). All other physicochemical parameters met the standards. Similarly, nitrate and nitrite concentrations for all samples were within the recommended USEPA limits of 10 mg/L and 1 mg/L, respectively.
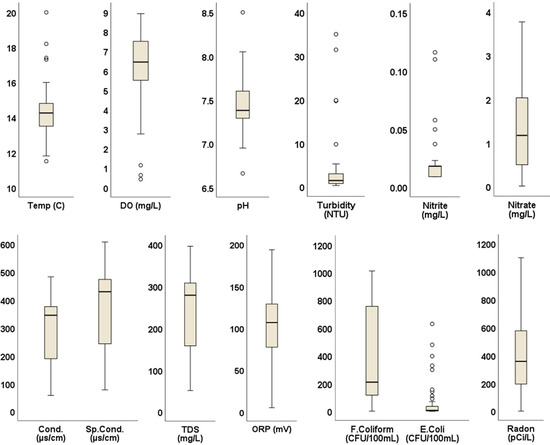
Figure 2.
Box plots of water quality parameter measurements. Circles indicate outliers falling outside the second and third quartiles.
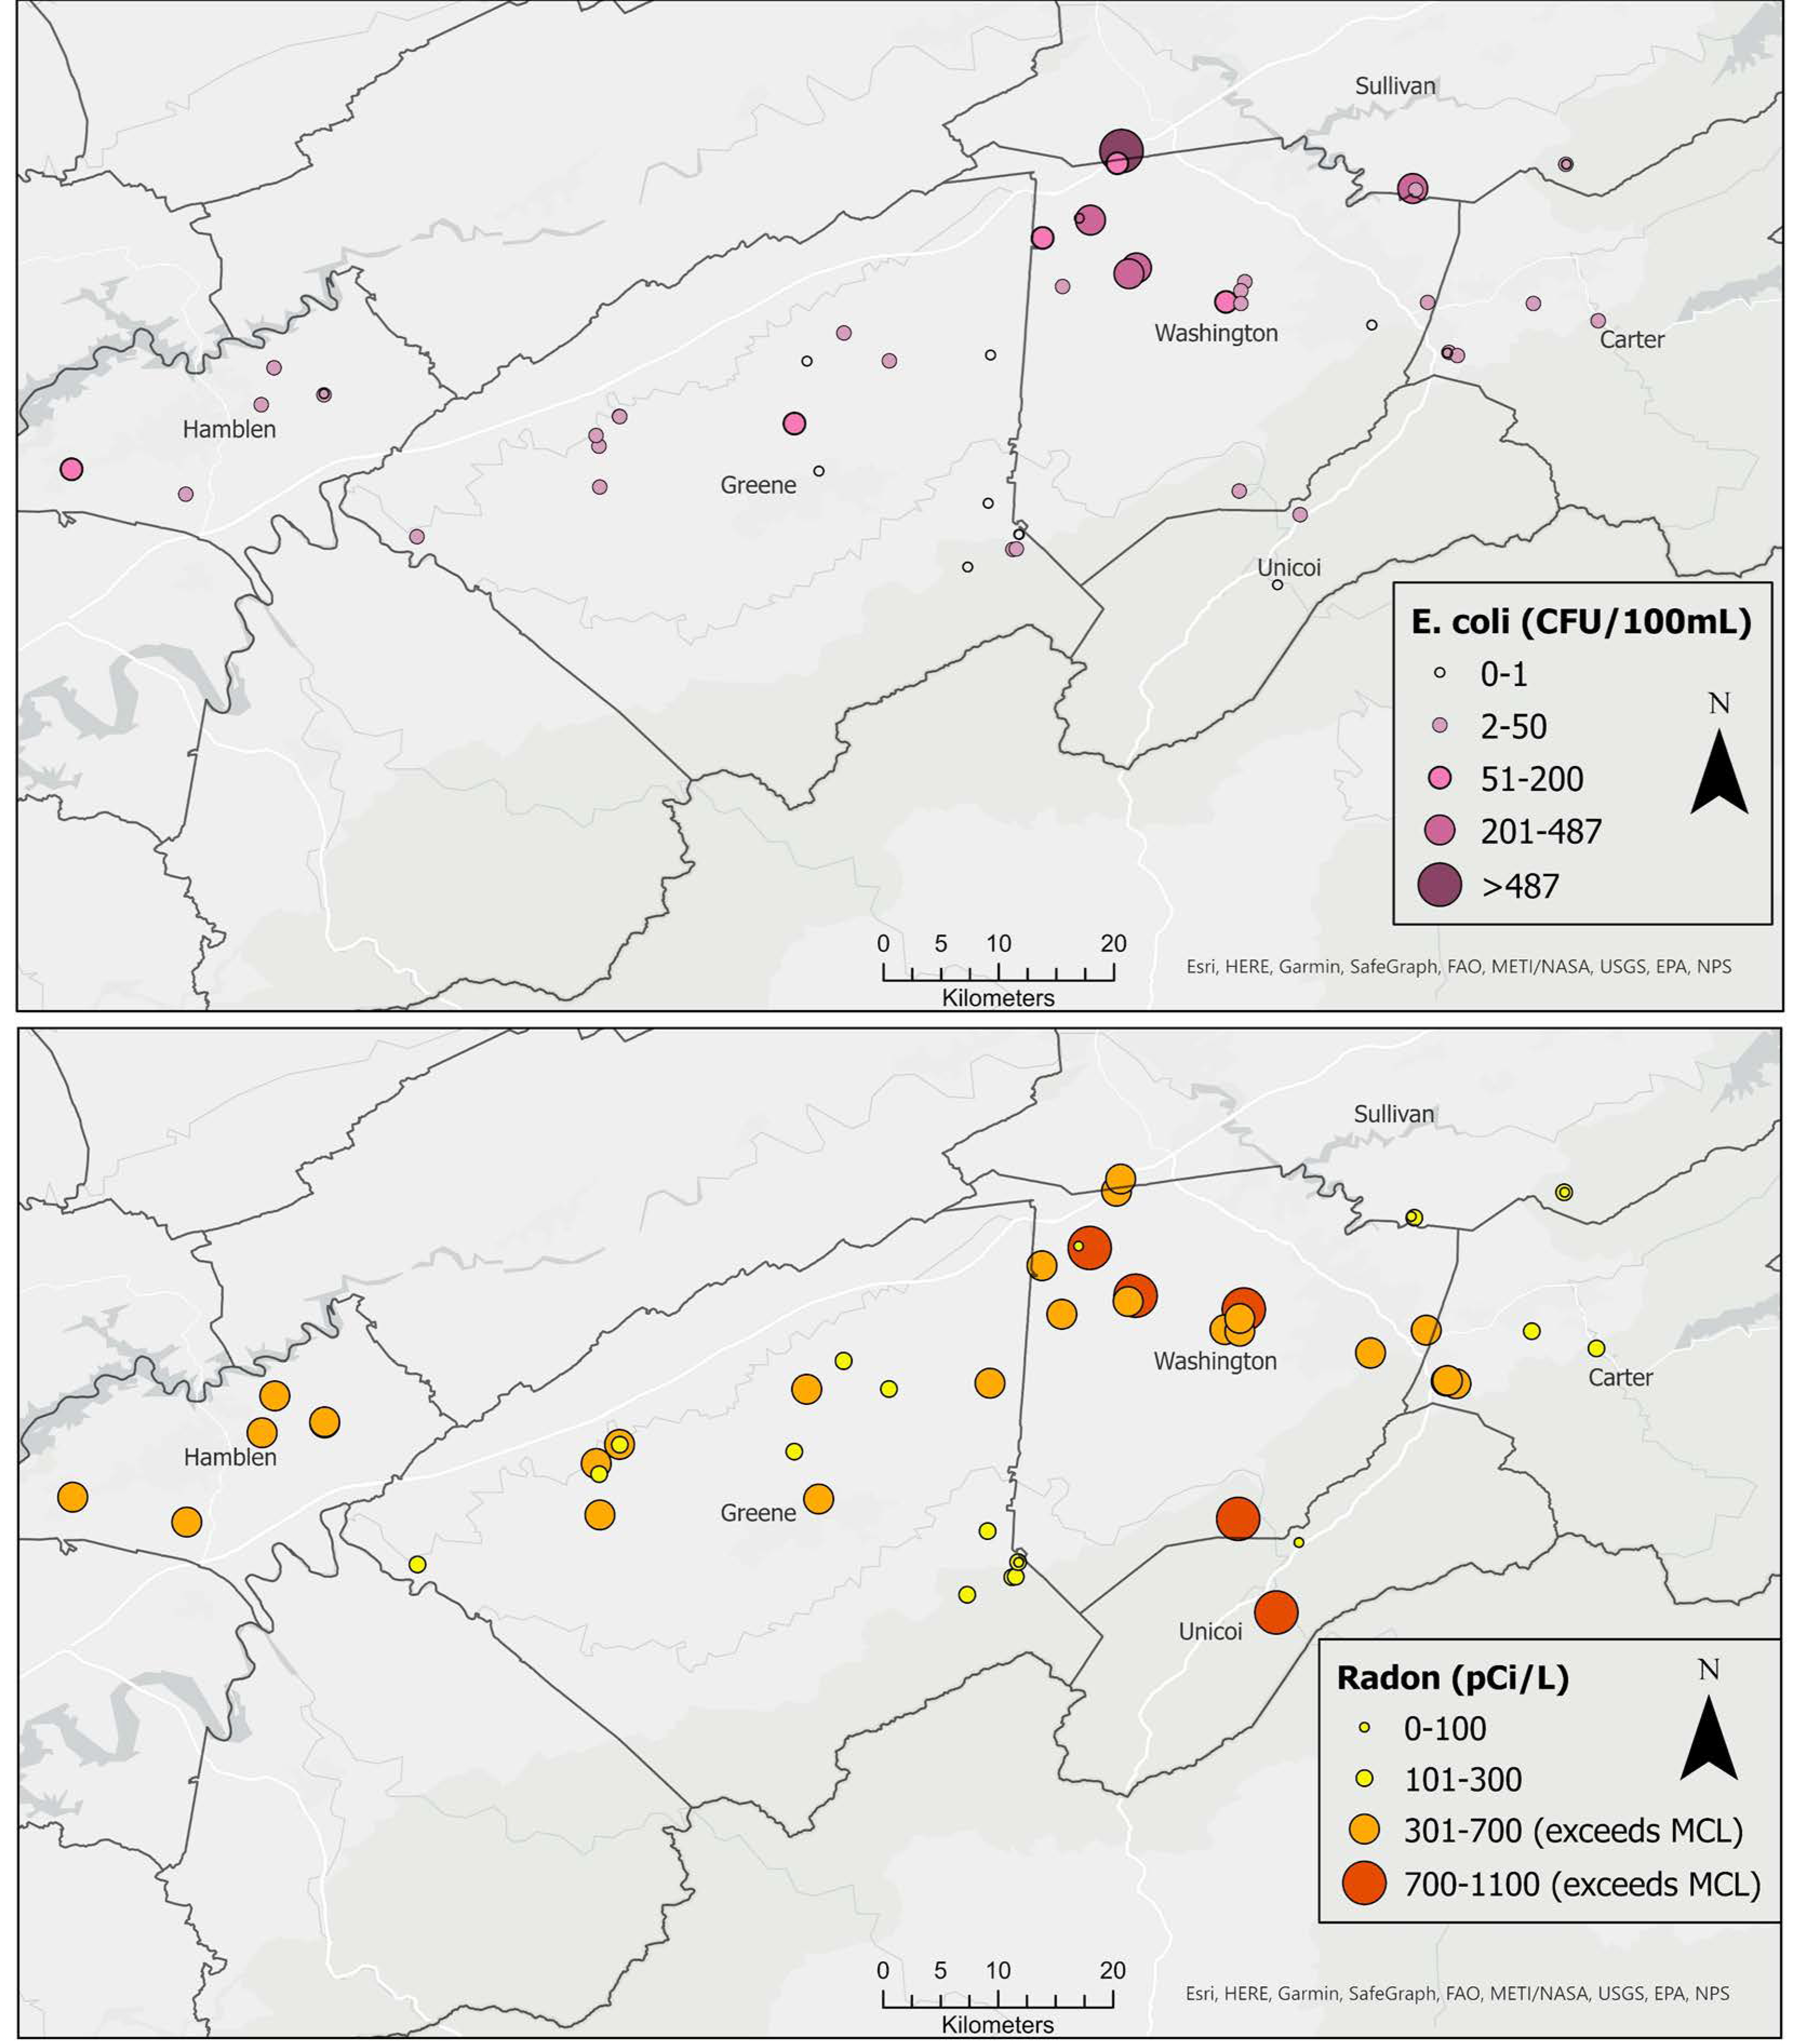
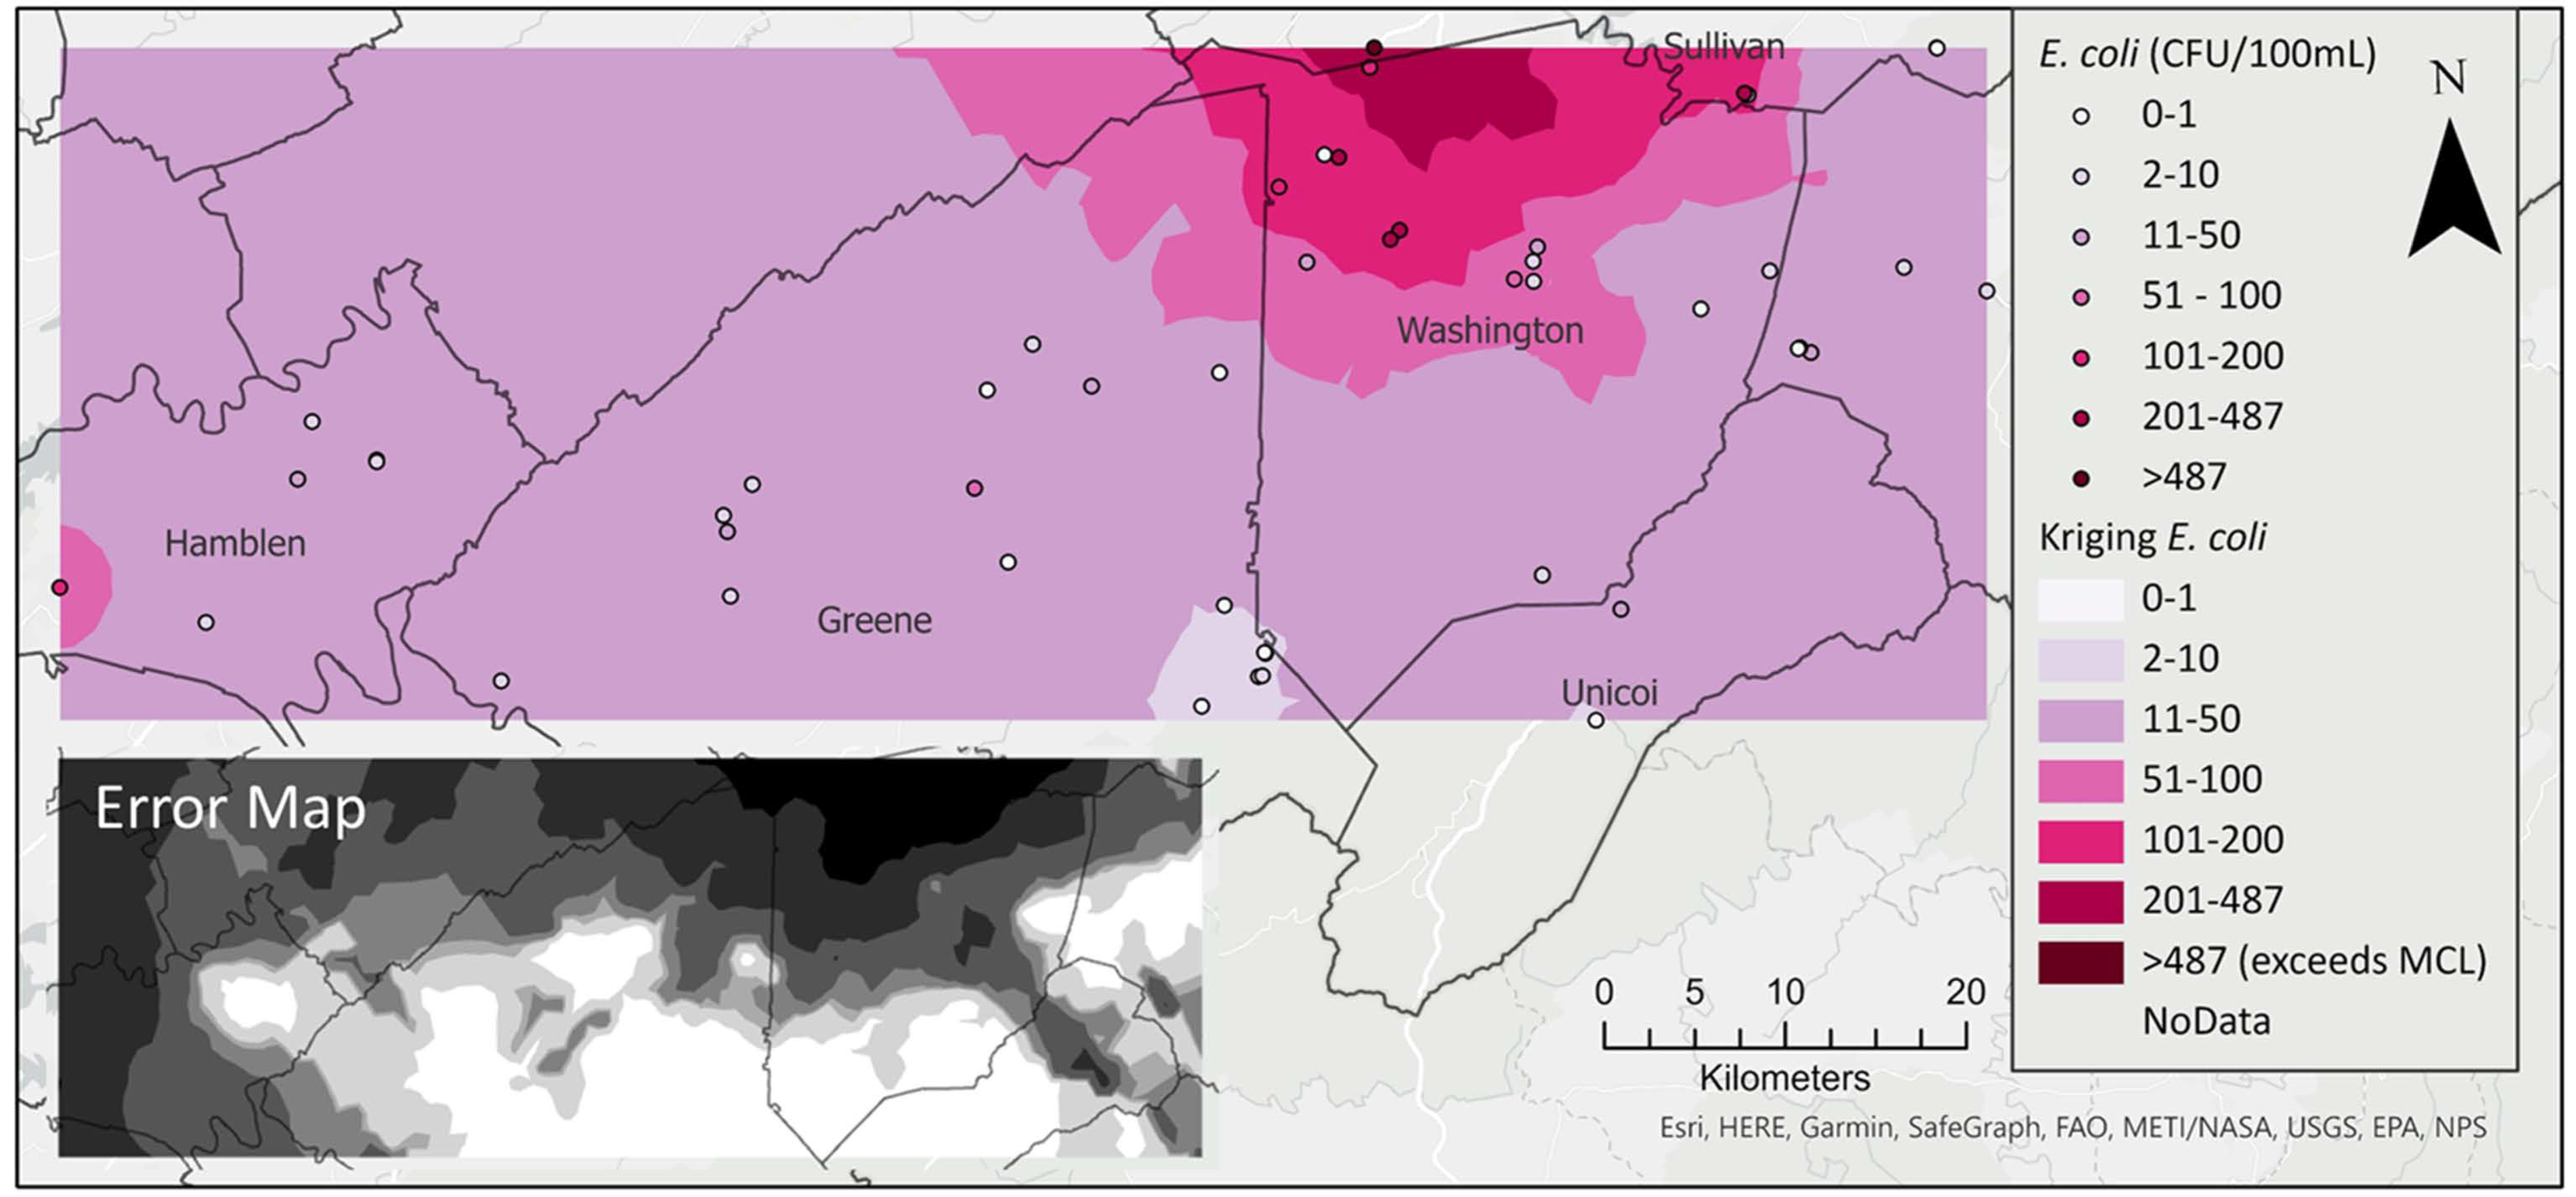
All water samples contained fecal coliform bacteria with a median value of 209.8 CFU/100 mL. Similarly, all but five samples (90%) of spring water contained E. coli, with maximum concentration of 629 CFU/100 mL and a median of 5.75 CFU/100 mL. High concentrations of E. coli exceeding the 487 CFU/100 mL single sample limit for recreational water [71] were detected in springs on the border between Washington and Sullivan counties (Figure 3). Radon concentrations ranged from 0 pCi/L to 1100 pCi/L, with a median value of 356.5 pCi/L. Concentrations exceeded the USEPA’s proposed maximum contaminant level (MCL) of 300 pCi/L (for states without enhanced indoor air programs) in 60% of the springs. The bulk of these high radon values occurred in northern Washington County, with a few others in Hamblen, Greene, and Unicoi counties (Figure 3). Maps showing the spatial distribution of other water quality parameters are included as (supplementary figures Figures S1–S11).
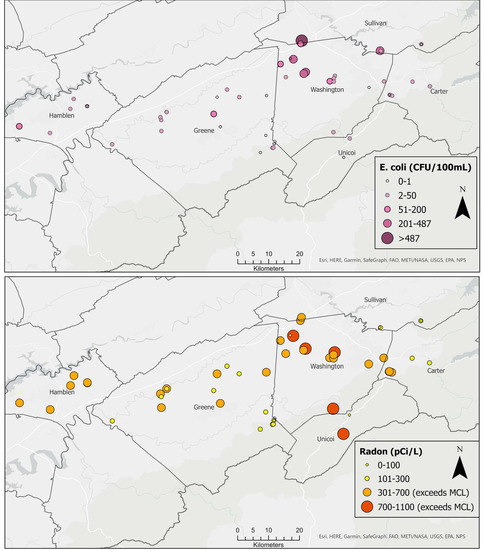
Figure 3.
Spatial distribution of E. coli (upper) and radon (lower).
We found a significant but weak correlation between antecedent precipitation (1-day, 2-day, and 3-day antecedent precipitation) and two water quality parameters: E. coli (r = 0.323, p = 0.015) and pH (r = −0.364, p = 0.005). This was assessed to evaluate potential bias associated with distributing the sampling over 6 days in a 6-week period, recognizing the potential influence of antecedent precipitation, which occurred prior to some sampling days. USGS stream discharge at five nearby stream gauges showed a common pattern of increased discharge beginning around sampling day 5, suggesting that the precipitation recorded at the Tri-Cities airport was not a localized event, but rather regional in nature. Peak discharge occurred between sampling days 5 and 6, and no sampling was completed at peak discharge.
K-means clustering of sampling sites using all water quality results did not produce an observable spatial pattern, and cluster membership did not align with sampling day. Sites sampled on Day 1 (preceded by 3.0 mm of precipitation) were associated with K-means clusters 1 and 3 and sites sampled on Day 5 (preceded by 5.1 mm of precipitation) were associated with K-means clusters 1, 3, 4, and 6. All other sampling days did not experience more than a trace of antecedent precipitation, and these were also distributed among different clusters.
Principal components analysis identified four components that loaded high on the following parameters after Varimax rotation: (1) conductivity/TDS (30.8 % of variance); (2) DO, pH, and ORP (15.6 % of variance); (3) fecal bacteria (14.3% of variance); and (4) nitrates/nitrites, radon, and turbidity (12.2% of variance) (supplementary files Figure S12). In total, these four components had a cumulative variance explained of 73%. Therefore, the most important variables in distinguishing springs from one another are the family of parameters associated with dissolved solids (conductivity, specific conductance, and TDS) followed by physicochemical parameters (DO, pH, and ORP). The first component may reflect the residence time of the spring water (short residence time associated with low dissolved solids, and older groundwater with longer residence times associated with higher dissolved solids).
K-means clustering of sampling sites using the four components found that these clusters also did not align with sampling day. In fact, locations sampled during Days 5 and 6 (associated with increasing and decreasing regional stream flow and potentially influenced by rainfall) were assigned to five and three different clusters, respectively. Therefore, because of the lack of association between sampling day (representing antecedent precipitation) and cluster membership, we conclude that spatial patterns in water quality are not explained solely by antecedent precipitation.
3.2. Spatial Autocorrelation
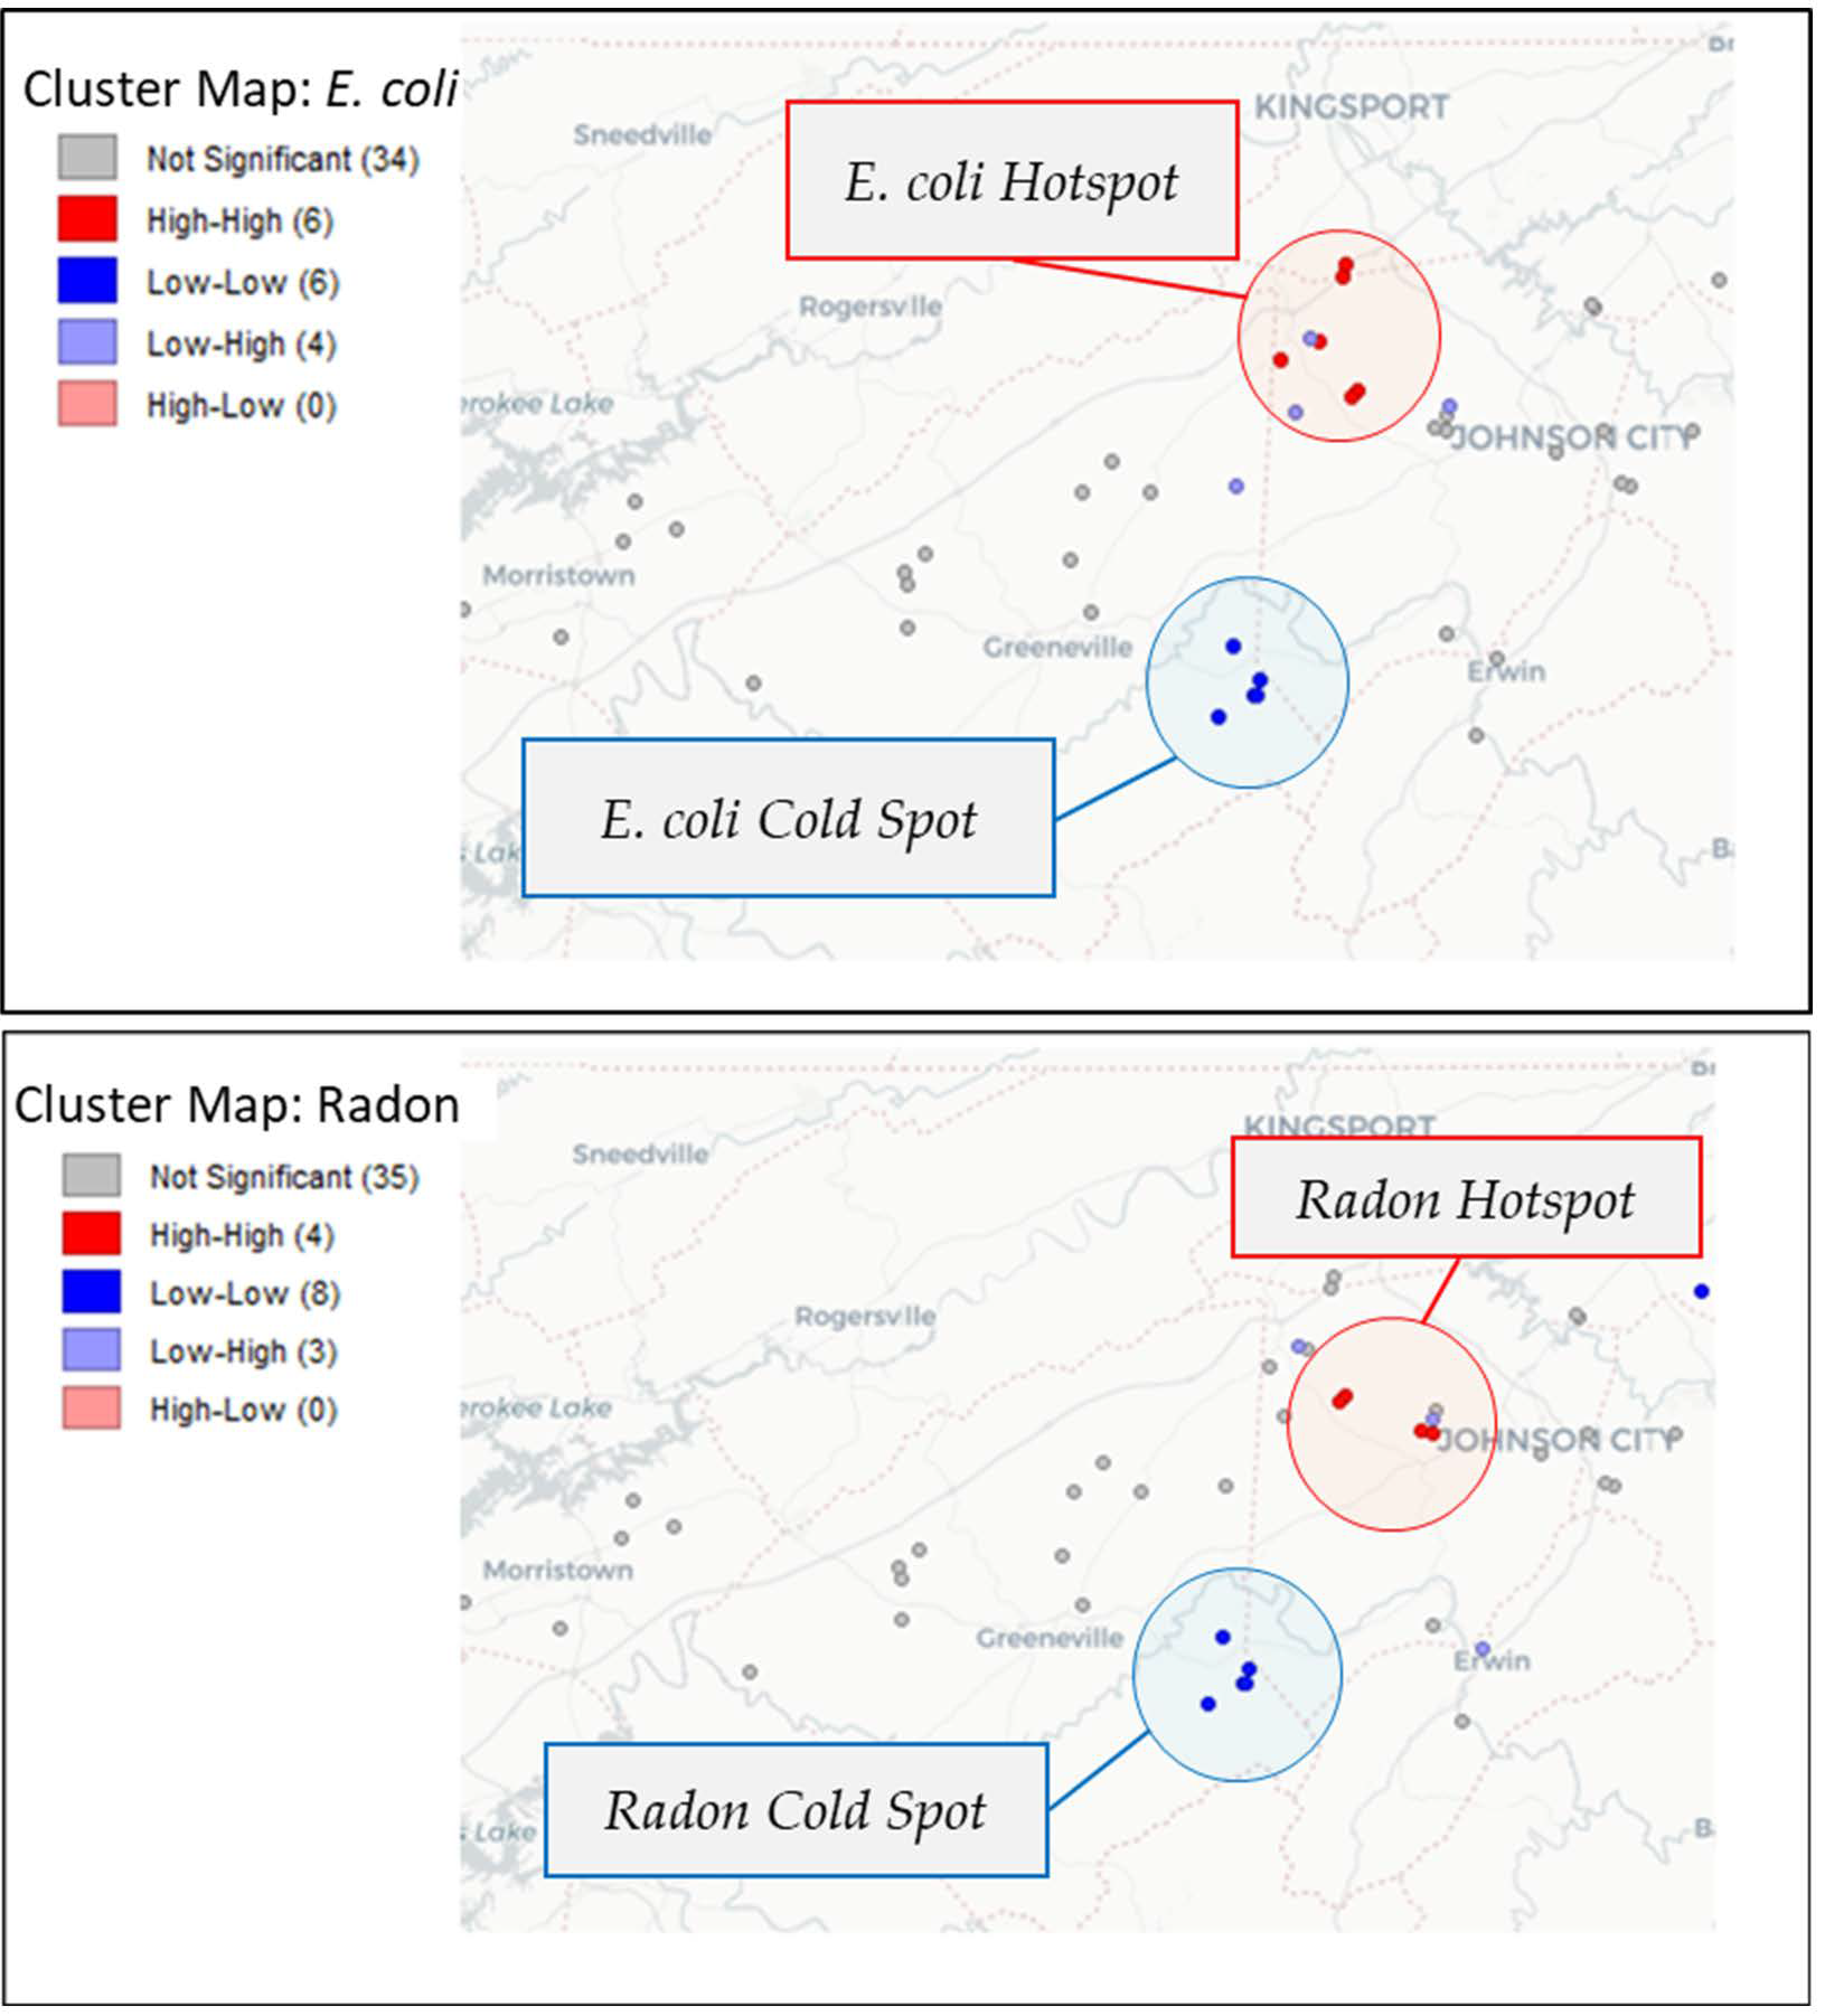
Spatial autocorrelation analysis of E. coli and radon (Figure 4) revealed that both parameters exhibited spatial clustering. A hotspot for E. coli was confirmed on the border of Washington and Sullivan counties (Local Moran’s I = 0.177, pseudo p-value = 0.012). A smaller hotspot for radon was confirmed in northern Washington County near the border with Sullivan County (Local Moran’s I = 0.160, pseudo p-value = 0.014).
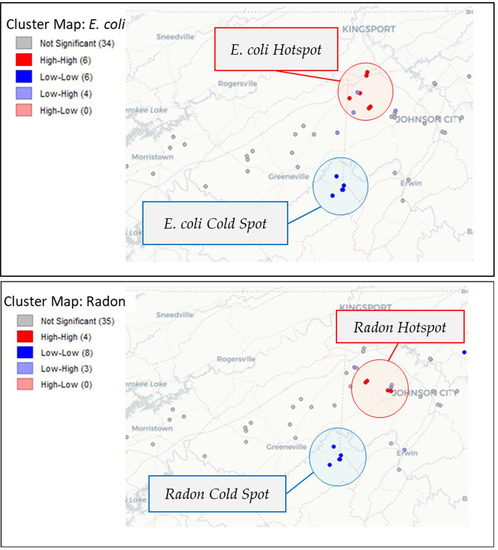
Figure 4.
Local indicators of spatial autocorrelation (LISA) map of E. coli and radon show hot spots around northern Washington County and cold spots to the south.
3.3. Kriging and Cokriging of E. coli
Confirming local spatial autocorrelation findings, an optimized kriging model of log-transformed E. coli data shows a region of higher concentration near the Washington–Sullivan County border (Figure 4). This region also shows high uncertainty in E. coli prediction likely due to large scale variability in E. coli concentrations (Figure 5, inset map)
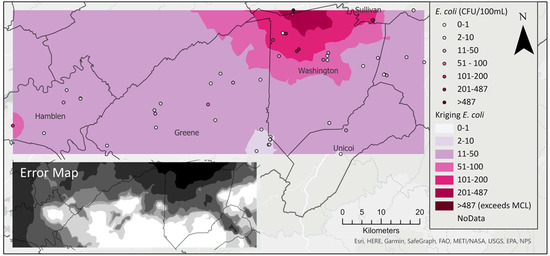
Figure 5.
Kriging interpolation of E. coli shows a hot spot in northern Washington County. Inset map shows standard error.
As established in previous research [67,72], exploratory spatial mapping and field observation suggested a potential relationship between E. coli concentration and agricultural land use. The comparison of kriging and cokriging diagnostics (Table 3 and [supplementary files Figure S13]) shows that the kriging model was superior as indicated by the higher root-mean-square-standardized error (RMSSE closer to 1). Root-mean-square-standardized errors were less than 1 in both models, indicating an overestimation in the variability of the predictions. However, an assessment of the distribution graphs indicated that the peaks of the measured and predicted values aligned best in the E. coli kriging model. Although the scatter plot of predicted graphs revealed that high E. coli values were underestimated and low values were overestimated in both models, the kriging model produced better estimation at low values. In all, the kriging model better captured the distribution of E. coli than the cokriging model.

Table 3.
Cross-validation comparison for E. coli kriging and cokriging interpolations.
3.4. Kriging and Cokriging of Radon
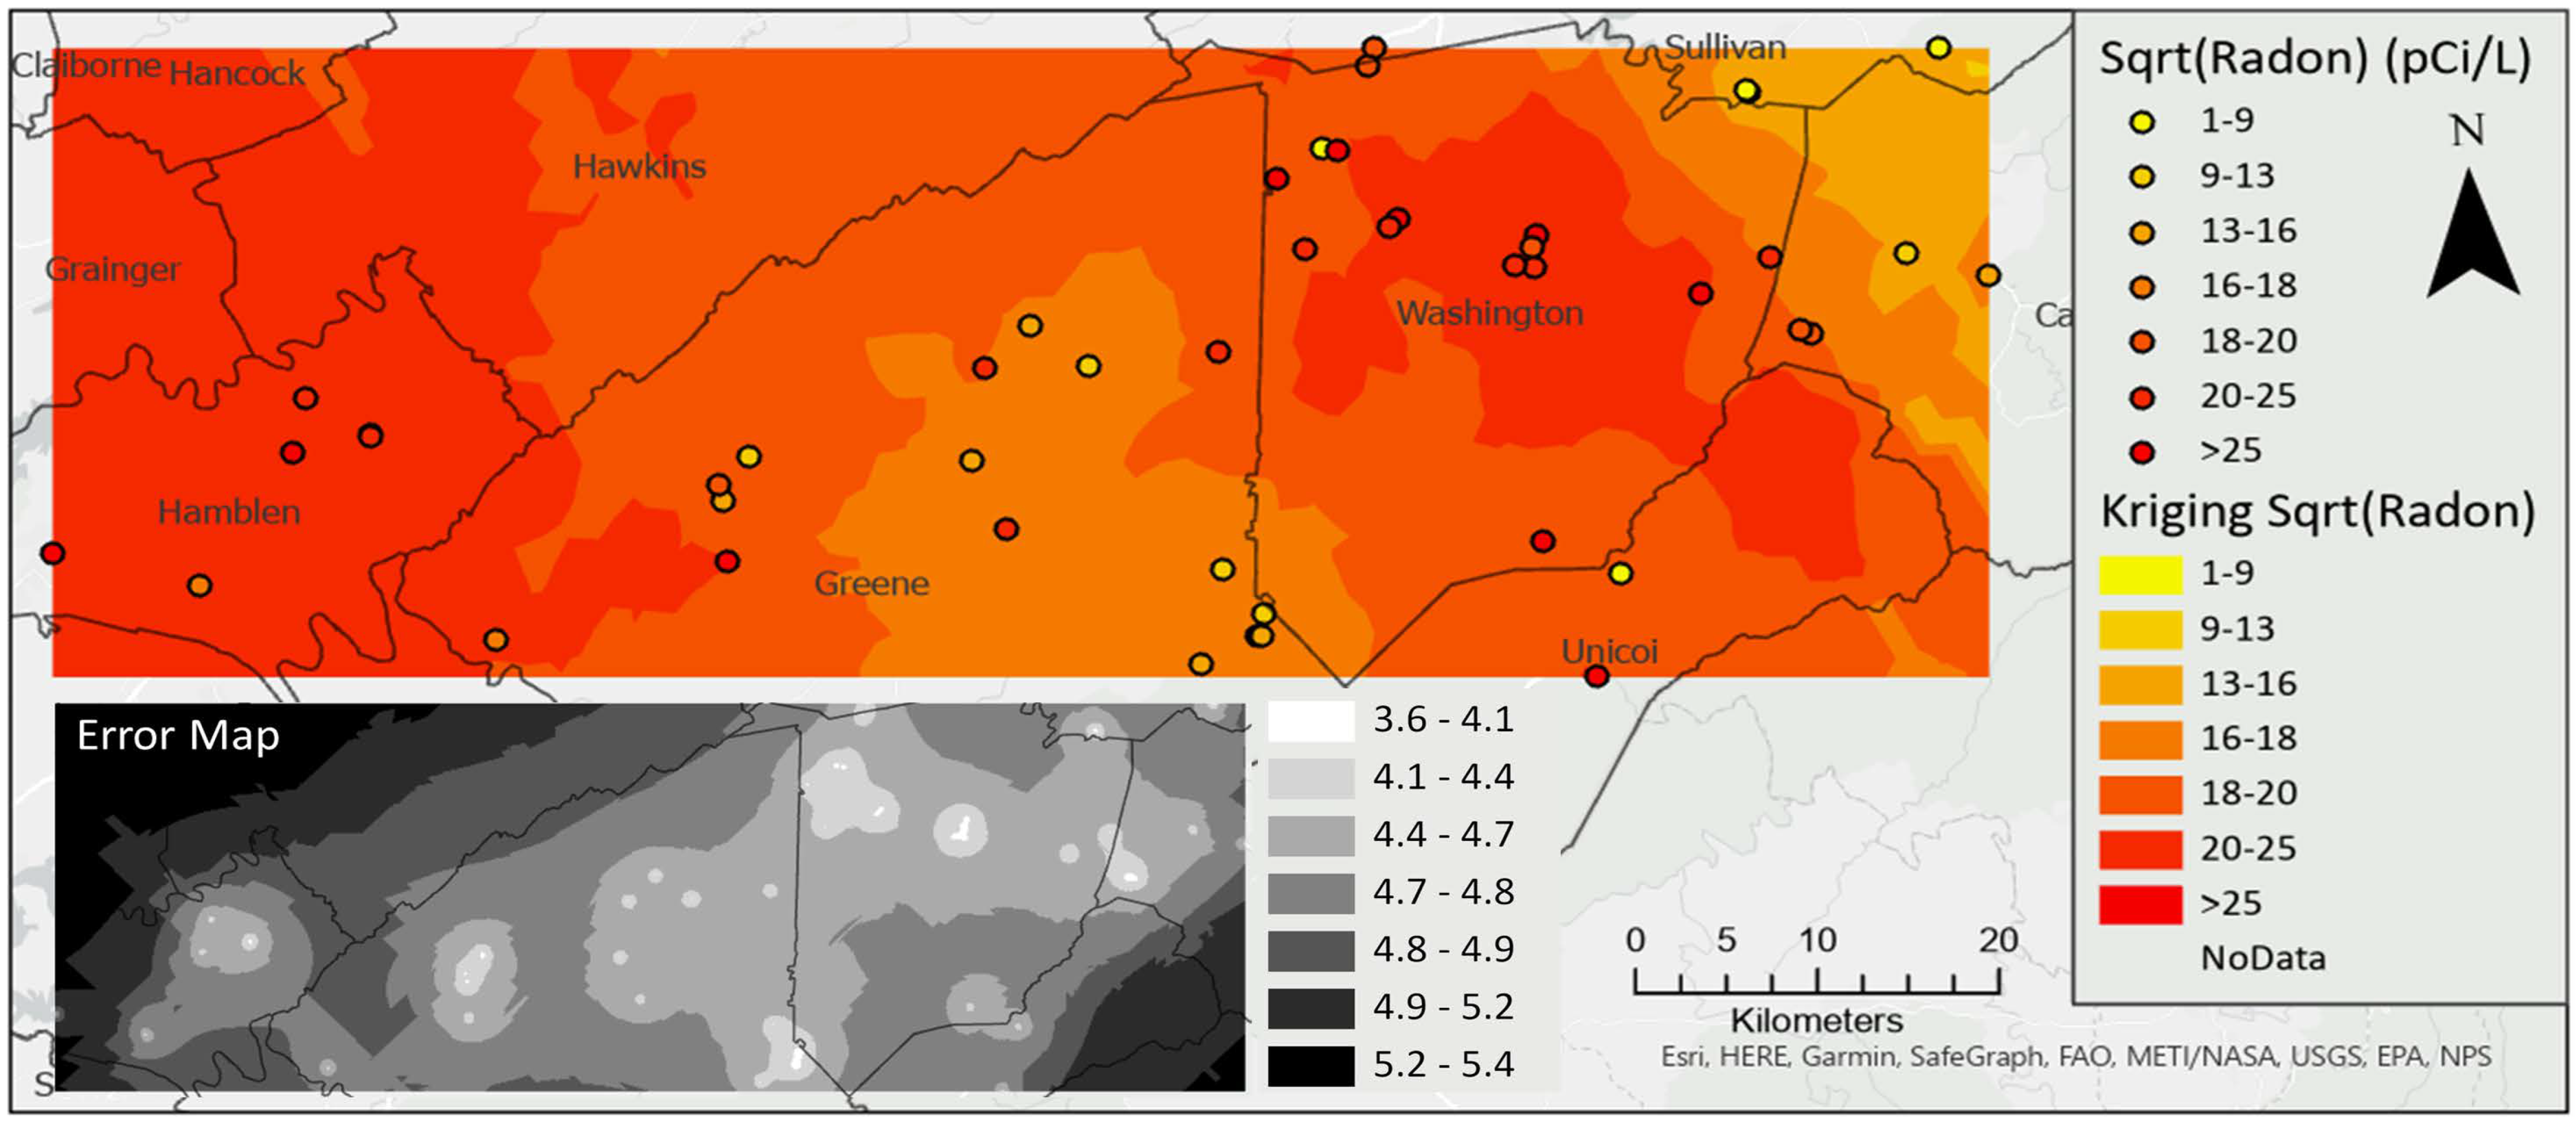
Radon concentrations were not normally distributed, and, therefore, kriging interpolation was completed on the square root of radon concentration. The interpolation for radon identified the hot spot in northern Washington County, with low uncertainty throughout the study area except near boundaries, especially in the northwestern corner where no samples were collected (Figure 6).
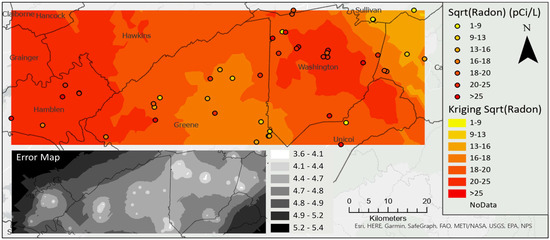
Figure 6.
Kriging interpolation of the square root of radon concentration, inset map shows standard error.
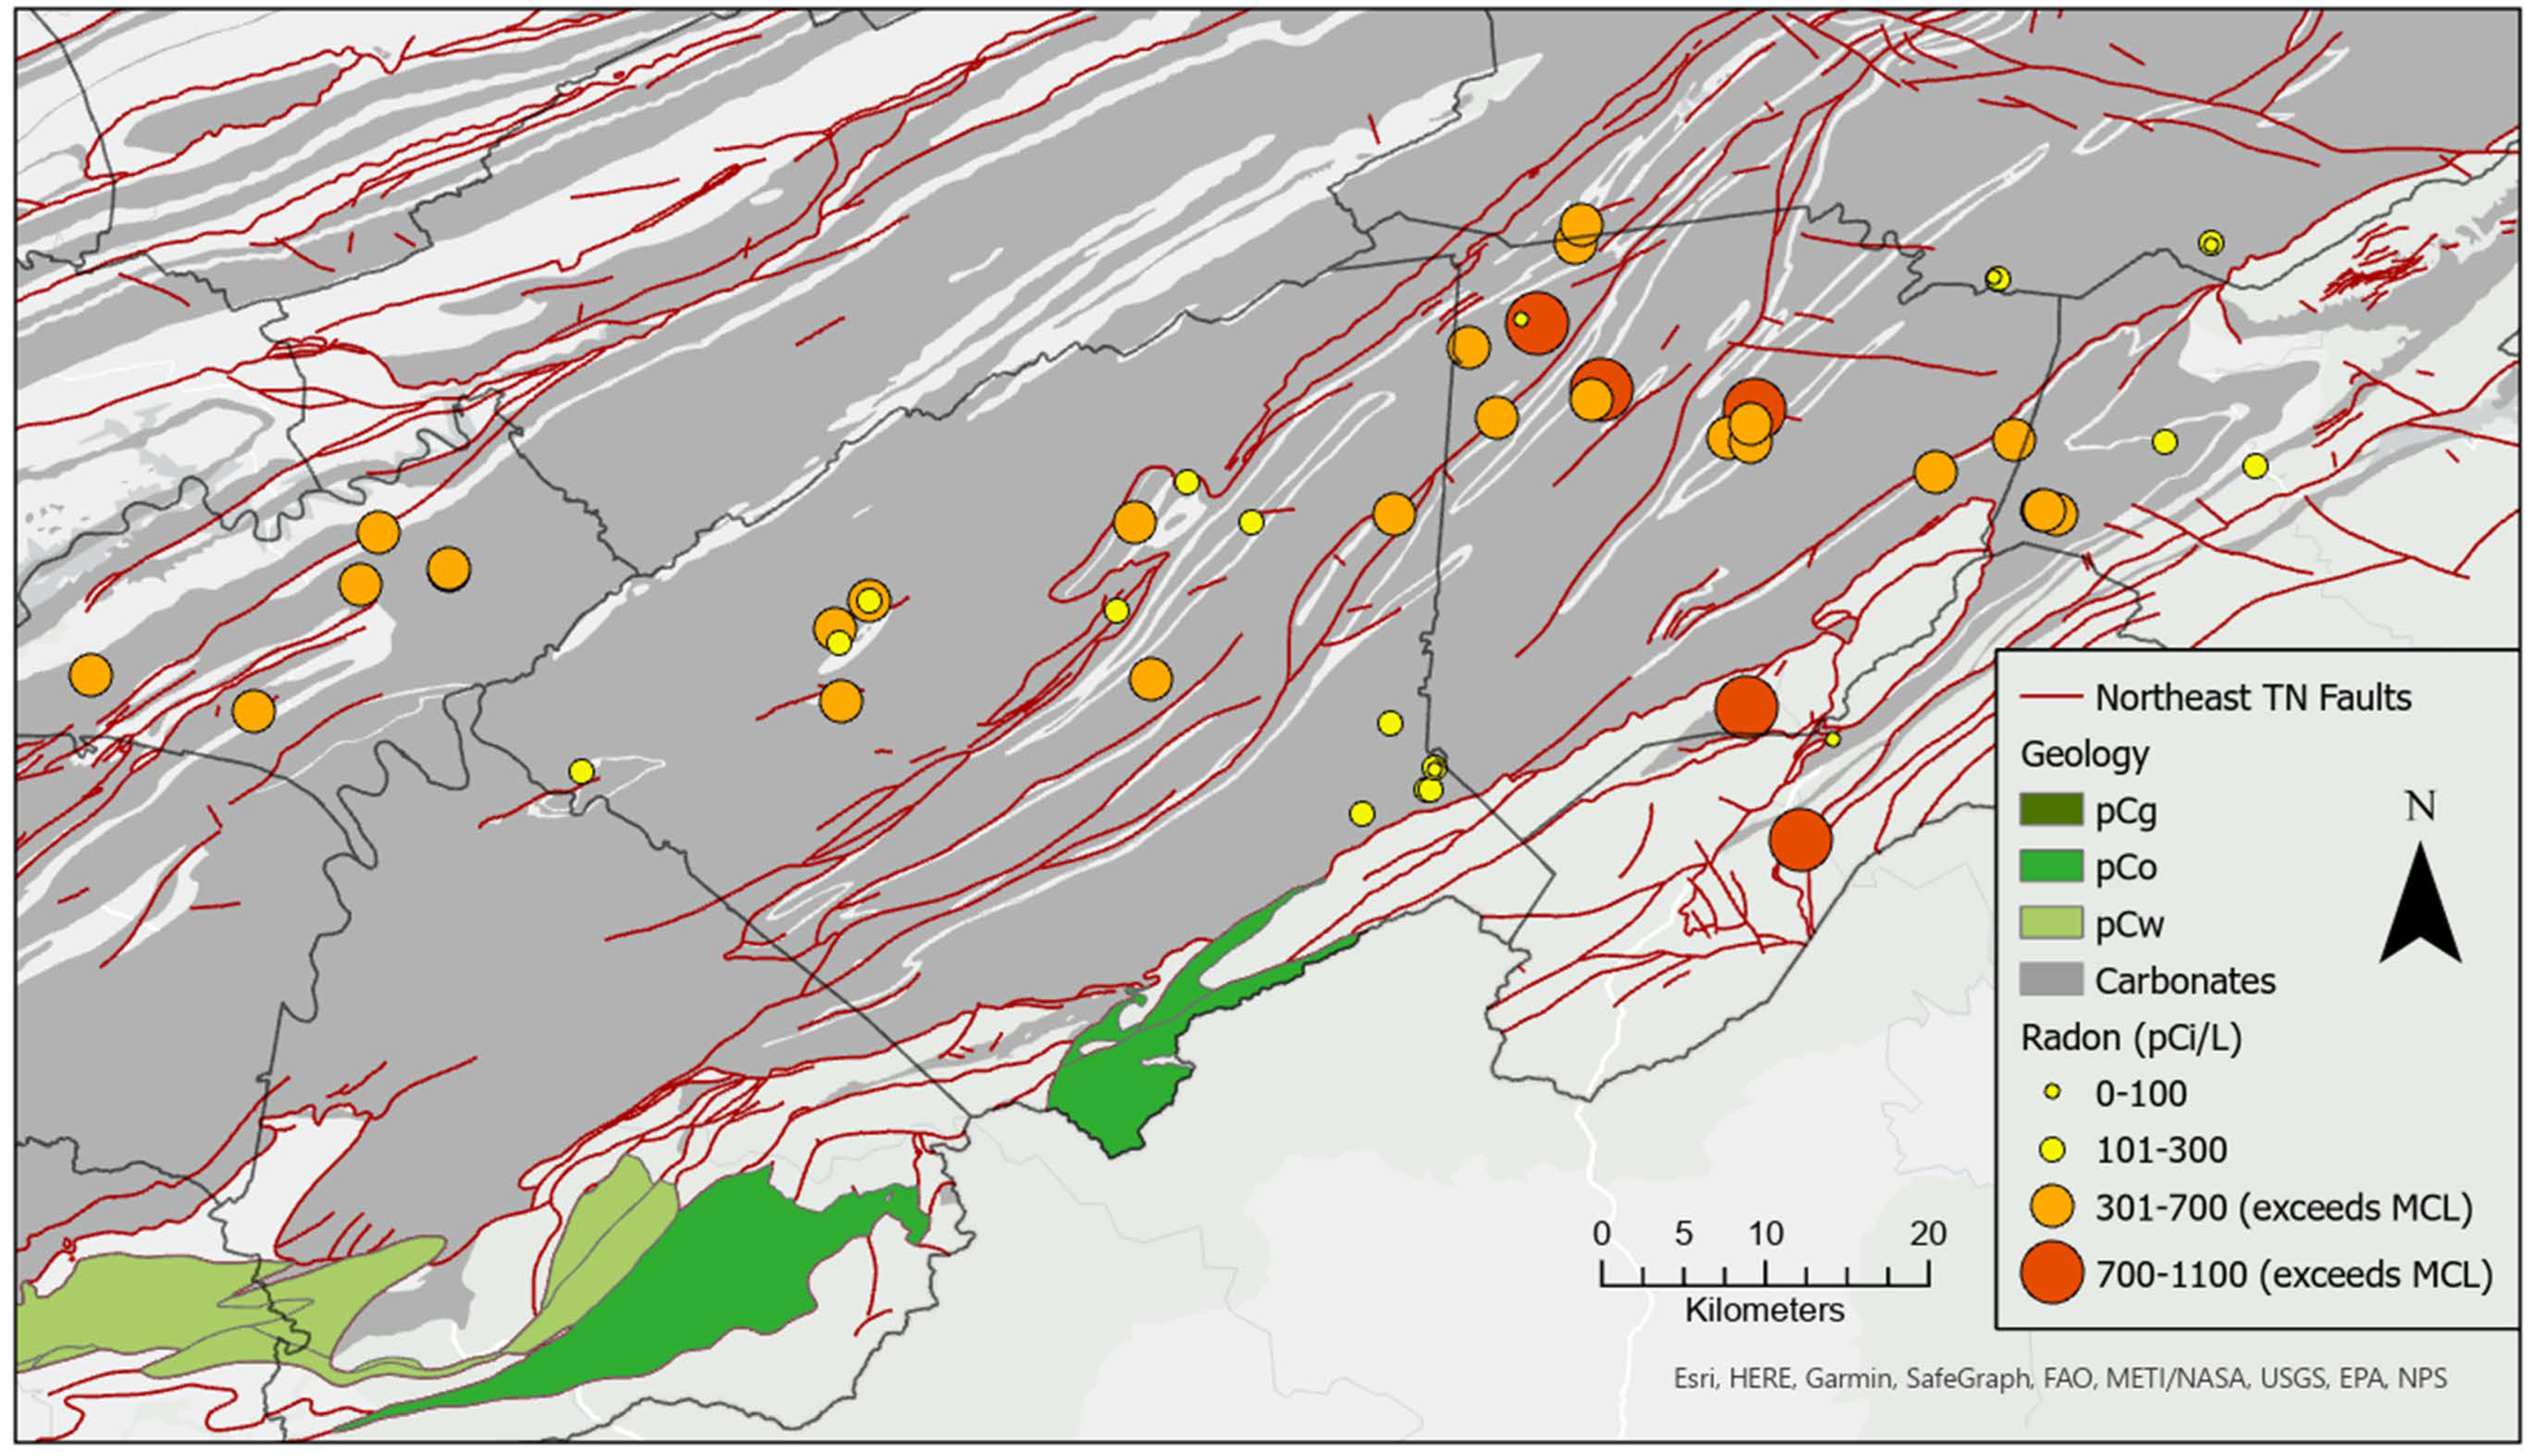
The Spearman correlation of radon concentration with distance to faults was significant at r = −0.253 (p = 0.076), using α = 0.1. Although weak, this negative correlation indicates that radon concentration tends to increase with proximity (shorter distance) to faults (Figure 7). An ordinary least squares regression model of radon using distance to faults was significant, but explained only 7% of the variability in the radon data and further, a one-kilometer increase in distance from a fault resulted in a mere 17 piC/L reduction in radon concentration, with an intercept of 471 pCi/L. Last, cokriging of radon with distance to faults produced no improvement in the kriging surface, based on comparison of diagnostic metrics (mean error standardized, root mean squared error standardized) and was discarded in favor of the kriging interpolation model shown in Figure 6. Examination of known radon-bearing units of the Ocoee Supergroup (pCo), including the Walden Creek Group (pCw) and Great Smoky Group (pCg) (Figure 7), revealed that none were colocated with the study area and further assessment of these geologic units was discontinued.
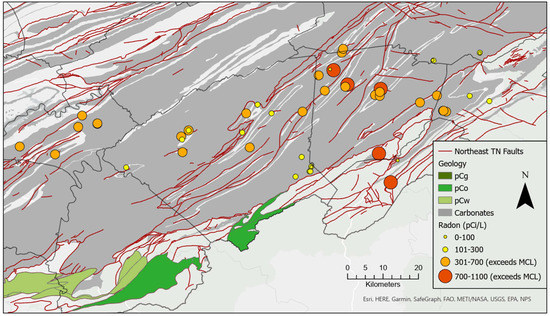
Figure 7.
Radon concentration and relevant geology.
4. Discussion
We elected to use a discrete sampling approach with a single sample at each site. This approach has the benefit of permitting a more regional assessment of water quality, yet has limitations because water quality parameters represent only a single point in time and it is unknown whether conditions are representative of the normal water quality of a given spring. Furthermore, spring discharge could not be measured during sampling and there was no baseline discharge information. As a result, it was impossible to determine the hydrologic condition at the spring site in terms of “baseflow without recharge”, “baseflow with recharge” or “storm flow”. These conditions reflect different water quality regimes: “baseflow without recharge” may be reflective of long-term changes in water quality of an aquifer while “baseflow with recharge” and “storm flow” conditions are indicative of current water quality under the influence of a source of recharge [72]. The significant relationship between precipitation and E. coli shows that E. coli concentration tends to correlate with precipitation depth on sampling days when there is precipitation. This is consistent with previous research which established a positive correlation between E. coli and 1-day and 3-day antecedent precipitation [73], and E. coli concentration and peak precipitation [28]. Even though K-means clustering showed that sampling day and overall water quality were not related, the E. coli–precipitation correlation suggests that the observed E. coli hotspot may be a spatiotemporal hotspot event. We, therefore, recommend additional sampling across different times and seasons to confidently ascertain the extent of fecal contamination occurrence in the hotspot region.
4.1. Physicochemical Parameters
All spring water samples met water quality standards for all the physicochemical parameters except turbidity, DO, and ORP. Turbidity is a measure of the relative clarity or optical property of water influenced by the presence of color-producing substances, suspended minerals, and organic particles [74,75,76]. Excessive turbidity in spring water could result from urban runoff, livestock, agricultural runoff, septic systems, and other sources of leaks or spills [18,77,78,79]. Beyond suspended sediment impacts on water clarity, the particles may also aid microbial growth by sheltering pathogens from disinfection, thereby causing a health risk [80,81].
DO is influenced by temperature, salinity, and elevation [74,82,83,84]. Low DO may suggest contaminated water supply [74,75] and indicates chemically reducing conditions or oxygen-depleting chemical/biochemical reactions. These conditions may result from naturally occurring organic carbon in aquifer materials or from agricultural, industrial, or domestic wastes [85]. Furthermore, ORP is a measure of the activity of an aqueous system allowing the exchange of ions/electrons of certain elements in biological systems [86]. Low ORP, due to low DO and other oxidants, may be associated with increasing concentration of contaminants and metals in water [87] but, conversely, high ORP may also increase dissolution of some toxic substances in water, e.g., uranium, selenium, and nitrate [85,88]. Positive ORP values indicate oxidizing conditions, and negative ORP values reflect reducing and anaerobic conditions [89].
4.2. Microbial Constituents
The existence of pathogenic microbes including enterotoxin-producing bacteria in the subsurface aquatic environment is a public health concern for the safe use of drinking water [33]. This risk can be identified by the presence of fecal coliform and E. coli which are common indicators of fecal pollution in freshwater [23,90]. E. coli, commonly found in the feces of warm-blooded animals and humans, is a more effective indicator of fecal contamination [91]. Even though contaminated drinking water sourced from karst systems has long been associated with disease outbreaks [92,93,94], other studies [95,96,97], however, suggest that the correlation between fecal-contamination indicators and health risks to humans is weak. This is probably because most strains of E. coli are harmless except E. coli 0157:H7, which is pathogenic [98].
The detection of fecal coliform and E. coli in 100% and 90% of the samples, respectively, suggests fecal contamination and the likely presence of disease-causing microorganisms. High E. coli and fecal-coliform levels were observed in regions of agricultural land use. This is consistent with prior research in the region where 89% of samples showed the presence of indicator bacteria [33] and an earlier study where 100% of springs sampled in the upper Tennessee River watershed were positive for these indicator bacteria [99]. Nearly 14,000 km (49%) of surface water streams in Tennessee [55] are impaired for E. coli, and watershed restoration efforts must consider both surface and subsurface (i.e., karst springs) sources of impairment. This research may be used to provide the necessary baseline data to identify springs as potential contributors to surface water E. coli impairment.
The spatial autocorrelation analysis (Figure 4) identified a fecal-contamination hot spot on the border of Washington and Sullivan Counties, Tennessee, corresponding to areas dominated by livestock farming. However, kriging interpolation prediction and error surfaces (Figure 5) revealed the highest uncertainty in areas of highest predicted concentration. This was likely due to the significant difference between E. coli concentrations within the hotspot region and adjoining location outside of the hotspot region representing a significant variability at short distances. The comparison of cross-validation diagnostics provides no conclusive evidence on which model gives a more reliable prediction. Similarities in the prediction and measured distributions suggests that the ordinary kriging model fits the E. coli data distribution well, but the RMS-standardized errors’ values for the E. coli kriging model (0.1935) and cokriging model (E. coli and percent agricultural land use) (0.1609) were both below 1. The lack of improvement with the addition of land use land cover data as a covariate might be due to the complex nature of the karst subsurface. Therefore, further sampling of additional springs in areas of concern is recommended in addition to inclusion of other related covariates including distance from septic tank systems [100,101], and beef cow population density [102].
4.3. Radioactive Constituent
Radon concentration exceeded 300 pCi/L (maximum contaminant level (MCL) proposed by the USEPA for states without an enhanced indoor air program) in 60% of the springs. A recent study of radon in Tennessee well water [25] reported high radon concentrations in wells underlain by older Precambrian rocks on the Tennessee–North Carolina border. Aside from the effect of bedrock geology, karst, well depth, and faulting also influence the concentration of radon in groundwater [25,34,39,40,41]. Moreover, radon concentration in springs may be influenced by the flow rate, such that low discharge volume springs (with less flushing potential) tend to have elevated levels of radon [47].
A radon hot spot identified in northern Washington County (Figure 6) may be due to the lithological contributions (carbonate units of the Knox Group, Maynardville limestone and the Chickamauga limestone), from spring water–rock interaction, and fault density as revealed in Figure 7. Radon concentration in spring water due to interaction with carbonate aquifer materials can be amplified by temperature/pressure-driven movement of radon-rich air from carbonate rock solution cavities [103]. In addition, soil-gas radon concentration diffusion into spring water can also be influenced by enhanced soil permeability occurring at depth caused by fissure- and solution-cavity-induced pathways in karst landscapes [103]. Further research to measure spring discharge and how this may influence radon concentration is recommended. Similarly, soil data may also be used as a covariable with radon concentration for cokriging interpolation since soils derived from carbonate rocks are known to contain elevated uranium and radium contents which are precursor elements of radon gas [103]. To build on this research, we recommend sampling of private water supply wells in areas where springs exhibit high radon concentration.
The co-occurrence of radon and E. coli spatial clusters (hot spots and cold spots) in the study area was also noted in other research of E. coli occurrence and transport by radon-222 in Tolo Harbor, Hong Kong [104], and was explained as likely due to the similarity between radon half-life and E.coli decay rate.
5. Conclusions
This study evaluated the status of karst spring water quality to develop a baseline dataset of spring water quality in northeast Tennessee and to identify areas of concern (hot spots). This research, relative to previous studies, provides a more holistic water quality (physicochemical, microbial, nutrient, and radiological) assessment of karst springs in northeast Tennessee, evaluating field and laboratory analytical results of water quality parameters based on USEPA primary and secondary water quality standards. This formed the basis of further geospatial analysis to identify localities where spring water use as a potential source of drinking water may predispose population or individuals to health hazards.
Results from this study showed that karst aquifers in northeast Tennessee were vulnerable to both fecal and (geogenic) radon contamination. All 50 sampled springs in the study area contained fecal coliform and 90% contained E. coli. This is more prominent along the border of Washington and Sullivan Counties, Tennessee, representing the zone of poorest water quality in terms of microbial constituents. Therefore, when and/or where spring water is used for domestic and drinking purposes, water must be properly treated for microbial purification before consumption.
Similarly, 60% of sampled springs contained radon-222 gas at concentrations above the maximum contamination levels (for states not having enhanced indoor air programs). In Tennessee, one in five homes tests high for elevated radon in indoor air which is exacerbated by high radon in water supplies. Elevated levels of radon have been detected in all 95 counties, and more concentrated levels occur in East Tennessee [45]. Therefore, users in areas of higher radon concentration in both water and air, such as in East Tennessee, should conduct regular monitoring of radon in their water to ensure that the concentration is below that which contributes to elevated indoor air radon. A reduction in indoor air radon will likely reduce lung cancer risk exposure.
As the majority of sampled springs were private springs, these findings may be used to inform landowners using or considering spring water as a domestic water supply source. Where potential risks to public health exist, necessary aquifer protection or water treatment advisory measures can be issued by the authorities to potential (private) water users. Furthermore, these results may be useful in identifying fecal contamination sources in spring-fed surface water bodies impaired for E. coli.
Supplementary Materials
The following supporting information can be downloaded at: https://www.mdpi.com/article/10.3390/geosciences12080303/s1. Figure S1: Spatial Distribution of Temperature; Figure S2: Spatial Distribution of Dissolved Oxygen; Figure S3: Spatial Distribution of pH; Figure S4: Spatial Distribution of Turbidity; Figure S5: Spatial Distribution of Electrical Conductivity; Figure S6: Spatial Distribution of Specific Conductance; Figure S7: Spatial Distribution of Total Dissolved Solids; Figure S8: Spatial Distribution of Oxidation Reduction Potential; Figure S9: Spatial Distribution of Nitrate; Figure S10: Spatial Distribution of Nitrite; Figure S11: Spatial Distribution of Fecal Coliform; Figure S12: PCA Analysis Rotated Component Matrix; Figure S13: Spatial Interpolation Diagnostics.
Author Contributions
Conceptualization, L.F., I.L., T.A.J. and A.N.; Data curation, L.F.; Formal analysis, L.F. and I.L.; Funding acquisition, L.F. and I.L.; Investigation, L.F. and I.L.; Methodology, L.F., I.L., T.A.J. and A.N.; Project administration, L.F.; Supervision, I.L.; Visualization, L.F., I.L., T.A.J.; Writing—original draft, L.F.; Writing—review and editing, I.L., T.A.J. and A.N. All authors have read and agreed to the published version of the manuscript.
Funding
The authors gratefully acknowledge the Tennessee Department of Health and US Centers for Disease Control and Prevention under the SafeWatch portion of the Strengthening Environmental Health Capacity (EHC) initiative; federal award number 6 NUE1EH001436-01-01 for funding the laboratory supplies and analyses. Similarly, special thanks to East Tennessee State University College of Graduate Studies for the 2021 Graduate Research Grant and the East Tennessee State University Department of Geosciences Hydrology Laboratory. The research could not have been completed without this support.
Data Availability Statement
Not Applicable.
Acknowledgments
Profound appreciation goes to Judy Manners, Susan Burchfield of the Tennessee Department of Health (TDH), and Amanda Evans of TDH Division of Laboratory Services—Nashville Central Laboratory for their logistics support all through the field work and technical support during the laboratory analyses for this research.
Conflicts of Interest
The authors declare no conflict of interest.
References
- United States Agency for International Development (USAID). U.S. Global Water Strategy. Available online: https://www.usaid.gov/what-we-do/water-and-sanitation/us-global-water-strategy (accessed on 10 January 2022).
- Plan, L.; Kuschnig, G.; Stadler, H. Case Study: Klaffer Spring—The major spring of the Vienna water supply (Austria). In Groundwater Hydrology of Springs, Engineering, Theory, Management, and Sustainability; Elsevier: Oxford, UK, 2010; p. 567. ISBN 978-1-85617-502-9. [Google Scholar]
- Sun, P.-C.P.; Criner, J.H.; Poole, J.L. Large Springs of East Tennessee; U.S. Government Printing Office: Washington, DC, USA, 1963.
- Stevanovic, Z. Utilization and regulation of springs. In Groundwater Hydrology of Springs. Engineering, Theory, Management, and Sustainability; Elsevier: Amsterdam, The Netherlands, 2010; p. 567. ISBN 978-1-85617-502-9. [Google Scholar]
- Dieter, C.; Maupin, M.; Caldwell, R.; Harris, M.; Ivahnenko, T.; Lovelace, J.K. Estimated Use of Water in the United States in 2015; U.S. Geological Survey: Reston, VA, USA, 2018; p. 23.
- Centers for Disease Control and Prevention Private Ground Water Wells. Available online: https://www.cdc.gov/healthywater/drinking/private/wells/index.html#one (accessed on 23 September 2021).
- Brahana, J.V.; Bradley, W. Preliminary Delineation and Description of the Regional Aquifers of Tennessee—The Central Basin Aquifer System; U.S. Geological Survey: Nashville, TN, USA, 1986.
- Tennessee Department of Environment and Conservation. Protection of Potable Water Supplies in Tennessee Watersheds; Tennessee Department of Environment and Conservation: Nashville, TN, USA, 2021.
- CDC-SafeWatch Safe Water for Community Health. Available online: https://www.cdc.gov/nceh/ehs/safe-watch/index.html (accessed on 14 March 2021).
- Beni, R.; Guha, S.; Hawrami, S. Drinking Water Disparities in Tennessee: The Origins and Effects of Toxic Heavy Metals. J. Geosci. Environ. Prot. 2019, 7, 135–146. [Google Scholar] [CrossRef]
- Kresic, N.; Stevanovic, Z. Groundwater Hydrology of Springs: Engineering, Theory, Management, and Sustainability; Kresic, N., Stevanovic, Z., Eds.; Elsevier: Burlington, MA, USA, 2010; ISBN 9781856175029. [Google Scholar]
- Williams, M.A.; Vondracek, B. Spring distributions and relationships with land cover and hydrogeologic strata in a karst landscape in Winona County, Minnesota, USA. Carbonates Evaporites 2010, 25, 333–347. [Google Scholar] [CrossRef]
- Gvozdetskii, N. Occurrence of karst phenomena on the globe and problems of their typology. Earth Res. 1967, 7, 98–127. [Google Scholar]
- White, W.B. Geomorphology and Hydrology of Karst Terrains; Oxford University Press: Oxford, UK, 1988; ISBN 9780195044447. [Google Scholar]
- Wu, Q.; Xing, L.; Zhou, W. Utilization and protection of large karst springs in China. In Groundwater Hydrology of Springs Engineering, Theory, Management, and Sustainability; Elsevier: Amsterdam, The Netherlands, 2010; p. 567. ISBN 978-1-85617-502-9. [Google Scholar]
- USGS Karst Aquifers. Available online: https://www.usgs.gov/mission-areas/water-resources/science/karst-aquifers?qt-science_center_objects=0#qt-science_center_objects (accessed on 1 November 2021).
- Ameen, H.A. Spring water quality assessment using water quality index in villages of Barwari Bala, Duhok, Kurdistan Region, Iraq. Appl. Water Sci. 2019, 9, 1–12. [Google Scholar] [CrossRef]
- Vesper, D.J.; White, W.B. Metal transport to karst springs during storm flow: An example from Fort Campbell, Kentucky/Tennessee, USA. J. Hydrol. 2003, 276, 20–36. [Google Scholar] [CrossRef]
- Heinz, B.; Birk, S.; Liedl, R.; Geyer, T.; Straub, K.; Andesen, J.; Bester, K.; Kappler, A. Water Quality Deterioration at a Karst Spring (Gallusquelle, Germany) due to combined sewer overflow: Evidence of Bacterial and Micro-pollutant Contamination. Env. Geol. 2009, 57, 797–808. [Google Scholar] [CrossRef]
- Sinreich, M.; Pronk, M.; Kozel, R. Microbiological monitoring and classification of karst springs. Environ. Earth Sci. 2014, 71, 563–572. [Google Scholar] [CrossRef]
- BlackEagle, C.W. Karst science and the geological society of America. GSA Today 2015, 25, 38–41. [Google Scholar]
- Alpha, T.; Galloway, J.P.; Tinsley, J., III. Karst Topography Computer Animations and Paper Model; U.S. Geological Survey: Reston, VA, USA, 1997.
- Zheng, Y.; Kelly, W.R.; Panno, S.V.; Liu, W. Identification of Sources of Fecal Pollution of Karst Waters; Illinois State Water Survey: Champaign, IL, USA, 2013; p. 81. [Google Scholar]
- Moore, H.; Drumm, E. Karst Geology in Tennessee; University of Tennessee: Knoxville, TN, USA, 2018. [Google Scholar]
- Luffman, I.; Manners, J.; Bailey, C.N. Radon in Tennessee residential well water. In Proceedings of the Virtual 2021 Tennessee Water Resources Symposium; Tennessee Section of the American Water Resources Association: Burns, TN, USA, 2021. [Google Scholar]
- Krometis, L.; Patton, H.; Wozniak, A.; Sarver, E. Water scavenging from roadside springs in Appalachia. J. Contemp. Water Res. Educ. 2019, 166, 46–56. [Google Scholar] [CrossRef]
- Knierim, K.J.; Hays, P.D.; Bowman, D. Quantifying the variability in Escherichia coli (E. coli) throughout storm events at a karst spring in northwestern Arkansas, United States. Env. Earth Sci. 2014, 74, 4607–4623. [Google Scholar] [CrossRef]
- McCurdy, P.; Luffman, I.; Joyner, T.A.; Maier, K. Storm sampling to assess inclement weather impacts on water quality in a karst watershed: Sinking Creek, Watauga watershed, East Tennessee. J. Environ. Qual. 2020, 50, 429–440. [Google Scholar] [CrossRef] [PubMed]
- Hardeman, W.D.; Miller, R.A.; Swingle, G.D. Geologic Map of Tennessee; Tennessee Division of Geology: Nashville, TN, USA, 1966.
- Cressler, C.W. Geology and Ground-Water Resources of Gordon, Whitfield, and Murray Counties, Georgia; U.S. Geological Survey: Reston, VA, USA, 1974.
- Sheahan, N.T.; Zukin, J.G. Developing spring water under the proposed FDA rules. Prof. Geol. 1993, 30, 9–11. [Google Scholar]
- Kelly, W.R.; Panno, S.V.; Hackley, K.C.; Martinsek, A.T.; Krapac, I.G.; Weibel, C.P.; Storment, E.C. Bacteria Contamination of Groundwater in a Mixed Land-Use Karst Region. Water Qual. Expo. Health 2009, 1, 69–78. [Google Scholar] [CrossRef]
- Johnson, T.B.; McKay, L.D.; Layton, A.C.; Jones, S.W.; Johnson, G.C.; Cashdollar, J.L.; Dahling, D.R.; Villegas, L.F.; Fout, G.S.; Williams, D.E.; et al. Viruses and Bacteria in Karst and Fractured Rock Aquifers in East Tennessee, USA. Ground Water 2011, 49, 98–110. [Google Scholar] [CrossRef]
- Bunnell, J.E.; Finkelman, R.B.; Centeno, J.A.; Selinus, O. Medical Geology: A globally emerging discipline. Geol. Acta 2007, 5, 273–281. [Google Scholar] [CrossRef]
- Da Silva Rangel Neto, R.; Luz, L.D.; Aguiar Junior, T.R. Springs’ Water Quality Assessment in Areas with Different Degrees of Forest Conservation: A Study in Tropical Climate Basins. Water Air Soil Pollut. 2020, 231, 227. [Google Scholar] [CrossRef]
- Barakat, A.; Meddah, R.; Afdali, M.; Touhami, F. Physicochemical and microbial assessment of spring water quality for drinking supply in Piedmont of Béni-Mellal Atlas (Morocco). Phys. Chem. Earth 2018, 104, 39–46. [Google Scholar] [CrossRef]
- Panno, S.V.; Hackley, K.C.; Hwang, H.H.; Kelly, W.R. Determination of the sources of nitrate contamination in karst springs using isotopic and chemical indicators. Chem. Geol. 2001, 179, 113–128. [Google Scholar] [CrossRef]
- Panno, S.V.; Kelly, W.R. Nitrate and herbicide loading in two groundwater basins of Illinois’ sinkhole plain. J. Hydrol. 2004, 290, 229–242. [Google Scholar] [CrossRef]
- All, J.; Wulff, A.; Iovanna, A. Using geoinformatics to examine residential radon vulnerability. Southeast. Geogr. 2008, 48, 97–109. [Google Scholar]
- Cho, S.Y.; Koo, M.H.; Cho, B.W.; Jung, Y.Y.; Oh, Y.H. Factors controlling the spatial and temporal variability in groundwater 222Rn and U levels. Water 2019, 11, 1796. [Google Scholar] [CrossRef]
- Seminsky, K.Z.; Seminsky, K.K. Radon concentration in groundwater sources of the Baikal region (East Siberia, Russia). Appl. Geochem. 2019, 111, 104446. [Google Scholar] [CrossRef]
- Vinson, D.S.; Vengosh, A.; Hirschfeld, D.; Dwyer, G.S. Relationships between radium and radon occurrence and hydrochemistry in fresh groundwater from fractured crystalline rocks, North Carolina (USA). Chem. Geol. 2009, 260, 159–171. [Google Scholar] [CrossRef]
- King, P.B.; Neuman, R.B.; Hadley, J.B. Geology of the Great Smoky Mountains National Park, Tennessee and North Carolina; U.S. Geological Survey: Reston, VA, USA, 1968.
- World Health Organization. WHO Handbook on Indoor Radon. A public Health Perspective; WHO: Geneva, Switzerland, 2009. [Google Scholar]
- Hem, J.D. Study and Interpretation of the Chemical Characteristics of Natural Water; U.S. Geological Survey: Reston, VA, USA, 1985.
- Hwang, J.; Kim, T.; Kim, H.; Cho, B.; Lee, S. Predictive radon potential mapping in groundwater: A case study in Yongin, Korea. Environ. Earth Sci. 2017, 76, 515. [Google Scholar] [CrossRef]
- TDEC Tennessee Radon Program. Available online: https://www.tn.gov/environment/program-areas/opsp-policy-and-sustainable-practices/community-programs-and-services/radon.html (accessed on 7 November 2021).
- National Academy of Science. Risk Assessment of Radon in Drinking Water; National Academy of Science: Washington, DC, USA, 1999. [Google Scholar]
- USEPA. Report to Congress: Radon in Drinking Water Regulations; USEPA: Washington, DC, USA, 2012.
- Gao, Y.; Gibson, N.; Burnham, T.; Evanshen, B. Water chemistry and quality changes in the Rockhouse Cave system, Carter County, Tennessee. In Proceedings of the Sixteenth Tennessee Water Resources Symposium, Burns, TN, USA, 19 April 2006. [Google Scholar]
- Fridell, Z.T.; Luffman, I.E.; Whitelaw, M. Groundwater Source Assessment of The Rock House Springshed, Carter County, TN. In Proceedings of the 2015 Tennessee Water Resources Symposium, Burns, TN, USA, 1–3 April 2015. [Google Scholar]
- Burnham, T.; Luffman, I.; Whitelaw, M.; Gao, Y. Assessing structural control on groundwater flow in the Morrell Cave springshed, Sullivan County, Tennessee. Spec. Pap. Geol. Soc. Am. 2016, 516, 151–164. [Google Scholar]
- Hollyday, E.F.; Smith, M.A. Large Springs in the Valley and Ridge Province in Tennessee; U.S. Geological Survey: Nashville, TN, USA, 1990.
- Ogden, A.E.; Brown, T.L.; Hamilton, K.G. Delineation of wellhead protection areas for municipal used springs of Eastern Tennessee 1990; Research Project Technical Completion Report #124; Tennessee Water Resources Research Center, The University of Tennessee: Knoxville, TN, USA, 1990. [Google Scholar]
- USEPA. How’s my Waterway. Available online: mywaterway.epa.gov (accessed on 17 November 2021).
- US Federal Government. US Climate Resilience Toolkit Climate Explorer. Available online: https://crt-climate-explorer.nemac.org (accessed on 22 March 2022).
- Tennessee Climate Office Tennessee Climatology. Available online: https://www.etsu.edu/cas/geosciences/tn-climate/tn-climatology.php (accessed on 1 March 2022).
- Lloyd, O.B., Jr.; Lyke, W.I. Hydrologic Atlas 730-K; U.S. Geological Survey: Reston, VA, USA, 1995.
- Tollefson, W.; Joyner, T.A. May 2021 Tennessee State Climate Summary; Tennessee Climate Office, East Tennessee State University: Johnson City, TN, USA, 2021. [Google Scholar]
- Tollefson, W.; Joyner, T.A. June 2021 Tennessee State Climate Summary; Tennessee Climate Office, East Tennessee State University: Johnson City, TN, USA, 2021. [Google Scholar]
- National Research Council. Review of the EPA’s Economic Analysis of Final Water Quality Standards for Nutrients for Lakes and Flowing Waters in Florida; National Academies Press: Washington, DC, USA, 2012; ISBN 0309254930. [Google Scholar]
- Eaton, A.D.; Clesceri, L.S.; Rice, E.W.; Greenberg, A.E.; Franson, M.A.H. Standard Method 7500-Rn, Standard Methods for the Examination of Water and Wastewater; American Public Health Association: Washington, DC, USA, 1996. [Google Scholar]
- Pfaff, J.D. Determination of Inorganic Anions by Ion Chromatography. In Methods for the Determination of Metals in Environmental Samples; Elsevier: Amsterdam, The Netherlands, 1996; pp. 388–417. [Google Scholar] [CrossRef]
- IBM Corp. IBM SPSS Statistics for Windows, Version 25.0; IBM Corp: Armonk, NY, USA, 2017. [Google Scholar]
- Anselin, L.; Syabri, I.; Kho, Y. GeoDa: An Introduction to Spatial Data Analysis. Geogr. Anal. 2006, 38, 5–22. [Google Scholar] [CrossRef]
- Environmental Systems Research Institute (ESRI). ArcGIS Pro: Release 2.8.3; ESRI: Redlands, CA, USA, 2021. [Google Scholar]
- St Laurent, J.; Mazumder, A. The influence of land-use composition on fecal contamination of riverine source water in southern British Columbia. Water Resour. Res. 2012, 48, W00M03. [Google Scholar] [CrossRef]
- Petersen, F.; Hubbart, J.A. Spatial and temporal characterization of Escherichia coli, suspended particulate matter and land use practice relationships in a mixed-land use contemporary watershed. Water 2020, 12, 1228. [Google Scholar] [CrossRef]
- ESRI Performing Cross-Validation and Validation. Available online: https://desktop.arcgis.com/en/arcmap/latest/extensions/geostatistical-analyst/performing-cross-validation-and-validation.htm (accessed on 9 February 2022).
- MRLC Data. Available online: https://www.mrlc.gov/data?f%5B0%5D=category%3Alandcover&f%5B1%5D=region%3Aconus (accessed on 15 February 2022).
- USEPA Rules of the Tennessee Department of Environment and Conservation Chapter 0400-40-03 General Water Quality Criteria. Available online: https://www.epa.gov/sites/default/files/2014-12/documents/tn-chapter1200-4-3.pdf (accessed on 20 September 2021).
- Turner, M. Update of Barton Springs Water Quality Data Analysis—Austin, Texas; University of South Florida: Tampa, FL, USA, 2005. [Google Scholar]
- Chen, H.J.; Chang, H. Response of discharge, TSS, and E. coli to rainfall events in urban, suburban, and rural watersheds. Environ. Sci. Processes Impacts 2014, 2014, 16. [Google Scholar] [CrossRef]
- Swenson, H.A.; Baldwin, H.L. A Primer on Water Quality; U.S. Geological Survey: Washington, DC, USA, 1965.
- Minnesota Pollution Control Agency. Turbidity: Description, Impact on Water Quality, Sources, Measures; Minnesota Pollution Control Agency: Saint Paul, MN, USA, 2008; Volume 3.
- Shigut, D.A.; Liknew, G.; Irge, D.D.; Ahmad, T. Assessment of physico-chemical quality of borehole and spring water sources supplied to Robe Town, Oromia region, Ethiopia. Appl. Water Sci. 2017, 7, 155–164. [Google Scholar] [CrossRef]
- Boyer, D.G.; Pasquarell, G.C. Agricultural land use impacts on bacterial water quality in a karst groundwater aquifer. Am. Water Resour. Assoc. 1999, 35, 291–300. [Google Scholar] [CrossRef]
- Mahler, B.J.; Personné, J.C.; Lods, G.F.; Drogue, C. Transport of free and particulate-associated bacteria in karst. J. Hydrol. 2000, 238, 179–193. [Google Scholar] [CrossRef]
- Pronk, M.; Goldscheider, N.; Zopfi, J. Particle-size distribution as indicator for fecal bacteria contamination of drinking water from karst springs. Environ. Sci. Technol. 2007, 41, 8400–8405. [Google Scholar] [CrossRef] [PubMed]
- USGS. Turbidity and Water. Available online: https://www.usgs.gov/special-topics/water-science-school/science/turbidity-and-water?qt-science_center_objects=0#qt-science_center_objects (accessed on 1 November 2021).
- Singh, P.K.; Tiwari, A.K.; Panigary, B.P.; Mahato, M.K. Water quality indices used for water resources vulnerability assessment using GIS technique: A review. Int. J. Earth Sci. Eng. 2013, 6, 1594–1600. [Google Scholar]
- Guenther, P.M.; Hubert, W.A. Factors influencing dissolved oxygen concentrations during winter in small Wyoming reservoirs. Great Basin Nat. 1991, 51, 282–285. [Google Scholar]
- Yellow Springs Instruments. YSI Model 55 Handheld Dissolved Oxygen and Temperature System Operations Manual; Yellow Springs Instruments: Yellow Springs, OH, USA, 1997. [Google Scholar]
- USGS. Dissolved Oxygen V2.1. In National Field Manual for the Collection of Water-Quality Data; U.S. Geological Survey: Washington, DC, USA, 2006. [Google Scholar]
- Clune, J.W.; Cravotta, C.A., III. Drinking Water Health Standards Comparison and Chemical Analysis of Groundwater for 72 Domestic Wells in Bradford County, Pennsylvania, 2016; U.S. Geological Survey: Reston, VA, USA, 2019.
- USEPA. Field Measurement of Oxidation-Reduction Potential. Available online: https://www.epa.gov/sites/default/files/2017-07/documents/field_measurement_of_orp113_af.r2.pdf (accessed on 22 May 2021).
- Ministry of Environment and Natural Resources Oxidation-Reduction Potential (ORP). Available online: https://www.enr.gov.nt.ca/sites/enr/files/oxidation-reduction_potential.pdf (accessed on 12 February 2021).
- Karthikeyan, B.; Lakshmanan, E.; Nair, N.R. Spatial and temporal variation of uranium in a shallow weathered rock aquifer in southern India. J. Earth Syst. Sci. 2011, 120, 911–920. [Google Scholar] [CrossRef]
- Myers, D. Innovations in Monitoring with Water-Quality Sensors with Case Studies on Floods, Hurricanes, and Harmful Algal Blooms. In Separation Science and Technology; Ahuja, S., Ed.; Elsevier: Amsterdam, The Netherlands, 2019; p. 442. ISBN 978-0-12-815730-5. [Google Scholar]
- DeSimone, L.A.; McMahon, P.B.; Rosen, M.R. The Quality of Our Nation’s Waters—Water Quality in Principal Aquifers of the United States, 1991–2010; U.S. Geological Survey: Reston, VA, USA, 2014.
- Edberg, S.C.; Rice, E.W.; Karlin, R.J.; Allen, M.J. Escherichia coli: The best biological drinking water indicator for public health protection. J. Appl. Microbiol. Symp. Suppl. 2000, 88, 106S–116S. [Google Scholar] [CrossRef]
- Pharris, C.; Kittrell, F.W.; Williams, W.C. A Water-Borne Outbreak of Gastroenteritis in a Tennessee Town. Am. J. Public Health Nations Health 1938, 28, 736–740. [Google Scholar] [CrossRef][Green Version]
- D’Antonio, R.G.; Winn, R.E.; Taylor, J.P.; Gustafson, T.L.; Current, W.L.; Rhodes, M.M.; Gary, G.W., Jr.; Zajac, R. A waterborne outbreak of cryptosporidiosis in normal hosts. Ann. Intern. Med. 1985, 103, 886–888. [Google Scholar] [CrossRef] [PubMed]
- Beaudeau, P.; de Valk, H.; Vaillant, V.; Mannschott, C.; Tillier, C.; Mouly, D.; Ledrans, M. Lessons learned from ten investigations of waterborne gastroenteritis outbreaks, France, 1998–2006. J. Water Health 2008, 6, 491–503. [Google Scholar] [CrossRef] [PubMed]
- Weiskel, P.K.; Howes, B.L.; Heufelder, G.R. Coliform contamination of a coastal embayment: Sources and transport pathways. Environ. Sci. Technol. 1996, 30, 1872–1881. [Google Scholar] [CrossRef]
- Scott, T.M.; Rose, J.B.; Jenkins, T.M.; Farrah, S.R.; Lukasik, J. Microbial source tracking: Current methodology and future directions. Appl. Environ. Microbiol. 2002, 68, 5796–5803. [Google Scholar] [CrossRef]
- Shanks, O.C.; Atikovic, E.; Blackwood, A.D.; Lu, J.; Noble, R.T.; Domingo, J.S.; Seifring, S.; Sivaganesan, M.; Haugland, R. Quantitative PCR for detection and enumeration of genetic markers of bovine fecal pollution. Appl. Environ. Microbiol. 2008, 74, 745–752. [Google Scholar] [CrossRef]
- Centers for Disease Control and Prevention E. coli 0157:H7 and Drinking Water from Private Wells. Available online: https://www.cdc.gov/healthywater/drinking/private/wells/disease/e_coli.html (accessed on 14 September 2021).
- Johnson, G.C. Water Quality of Springs in the Valley and Ridge Physiographic Province in the Upper Tennessee River Basin; U.S. Geological Survey: Reston, VA, USA, 2002.
- Arwenyo, B.; Wasswa, J.; Nyeko, M.; Kasozi, G.N. The impact of septic systems density and nearness to spring water points, on water quality. Afr. J. Environ. Sci. Technol. 2017, 11, 11–18. [Google Scholar] [CrossRef]
- USEPA. How Your Septic System Can Impact Nearby Water Sources. Available online: https://www.epa.gov/septic/how-your-septic-system-can-impact-nearby-water-sources (accessed on 6 October 2021).
- Luffman, I.; Tran, L. Risk Factors for E. coli O157 and Cryptosporidiosis Infection in Individuals in the Karst Valleys of East Tennessee, USA. Geosciences 2014, 4, 202–218. [Google Scholar] [CrossRef]
- USEPA. EPA’s Map of Radon Zones Tennessee; USEPA: Washington, DC, USA, 1993.
- Cheng, K.H.; Luo, X.; Jiao, J.J.; Yu, S. Delineating E. coli occurrence and transport in the sandy beach groundwater system by radon-222. J. Hazard. Mater. 2022, 431, 128618. [Google Scholar] [CrossRef] [PubMed]
Publisher’s Note: MDPI stays neutral with regard to jurisdictional claims in published maps and institutional affiliations. |
© 2022 by the authors. Licensee MDPI, Basel, Switzerland. This article is an open access article distributed under the terms and conditions of the Creative Commons Attribution (CC BY) license (https://creativecommons.org/licenses/by/4.0/).

