Article

Parametric Study of Lateral Loaded Blade Pile in Clay

1
School of Engineering and Built Environment, Griffith University, 58 Parklands Dr, Southport, QLD 4215, Australia
2
Blade Pile Group Pty. Ltd., 12 Junction Road, Burleigh Heads, QLD 4220, Australia
*
Author to whom correspondence should be addressed.
Geosciences 2022, 12(9), 329; https://doi.org/10.3390/geosciences12090329
Submission received: 16 August 2022 / Revised: 28 August 2022 / Accepted: 29 August 2022 / Published: 30 August 2022
(This article belongs to the Collection New Advances in Geotechnical Engineering)

Abstract

:
The study of the mechanical properties between the pile and soil is limited when an enlarged head is added at the bottom of the pile foundation, which acts as anchor stabilization. This study investigates the blade pile foundation used in a solar panel project, which is subjected to lateral wind load action. The parametrical study is performed through the numerical simulation of the blade pile that is embedded in clay soil. The study considers both the soil modulus and the strength parameter of cohesion and concludes that the blade pile foundation capacity has a positive correlation with both. Moreover, when adding blades to a normal circular hollow section (CHS) pile, if the clay cohesion is less than 35 MPa, the capacity improvement rate will be greater. It analyzes the simulated load versus the soil displacement by considering clay in the soil states of very soft, soft, firm, stiff, very stiff and hard. This study finds that the blade application increases the lateral capacity of the pile foundation. In addition, when the soil is very soft to firm, adding blades results in a higher percentage of capacity improvement, which is up to 14.8% for the standard 1.5-m CHS pile with an outside diameter of 76.1 mm.

1. Introduction

The pile foundation, a slender structure often used for transferring the load from the upper structure to the soil [1], can generally be categorized as a precast pile or a cast in situ pile according to the piling construction method used. Onsite piling is more suitable for high-rise buildings because it is easy to drill a deep hole for the cast. As for projects that do not need substantial compression capacity, a precast pile foundation is the optimum option. Further, prefabricated piles are more cost effective than bored piles [2].
When a pile is cast in soil, the shaft and end resistance contribute to the pile capacity, and therefore, studies have designed numerous methods, such as grouting technology, to increase the shaft and the base area [3,4]. As for the precast pile, and, in particular, the steel precast pile, the effects of adding helixes up to the tip have been examined. One study demonstrated that the pile’s bearing capacity can be improved by adding the helix [5]. Further studies have focused on determining the number of helixes to be used as well as the design with the optimum distance between helixes [6,7,8,9].
The helix pile can also be used as an uplift resisting structure, and its capacity can be determined through two methods: the individual and the cylindrical methods. In the individual method, it is assumed that each blade that contacts the soil will contribute to the ultimate uplift bearing capacity, whereas in the cylindrical method, it is assumed that the shaft resistance created by the soil from the extreme top and bottom blades (the cylinder volume) will contribute to this capacity [10]. The authors of [11,12] investigated the use of the screw pile in sand, silt and clay. Recently, [13] updated the cylindrical shear method equations. Further, [14] focused on the proposed factor values, such as the bearing capacity factor Nc, in calculating the uplift capacity.
In addition to the helix pile showing better load capacity, these blade piles are easy to install because of the presence of the helix. Traditional solid precast piles have often been criticized because driving these into hard soil is difficult, and the process, which requires the use of a hammer drive, results in significant noise; however, this issue has been solved because small size precast piles are being used these days, for these are easy to install and the process is less noisy [15].
Many researchers have also investigated the correlation between the installation torque and its designed capacity. An empirical study showed that there is a direct correlation between the axial ultimate load capacity and the installation torque [16]. Furthermore, a later study investigated the relationship between the uplift bearing capacity and the installation torque and proposed an empirical torque factor, which is related to the diameter of the spiral and the friction angle of the sand [17].
Resistance to lateral loads is also an important function of pile foundations in practical applications. According to [18], pile foundations for structures often involve crane towers or offshore platforms, and these structures are used for resisting the lateral movement caused by the external environment. However, limited research has focused on the helix pile when using blades to resist the lateral load caused by wind action. Moreover, a suitable method is yet to be proposed to estimate the lateral bearing capacity when using screw piles. Further, onsite testing showed that the lateral bearing capacity of piles varies over a small range [19]. In this context, this study considers the wind lateral load in examining the blade pile foundation embedded in clay soil.

2. FEM Simulation of Pile Foundation

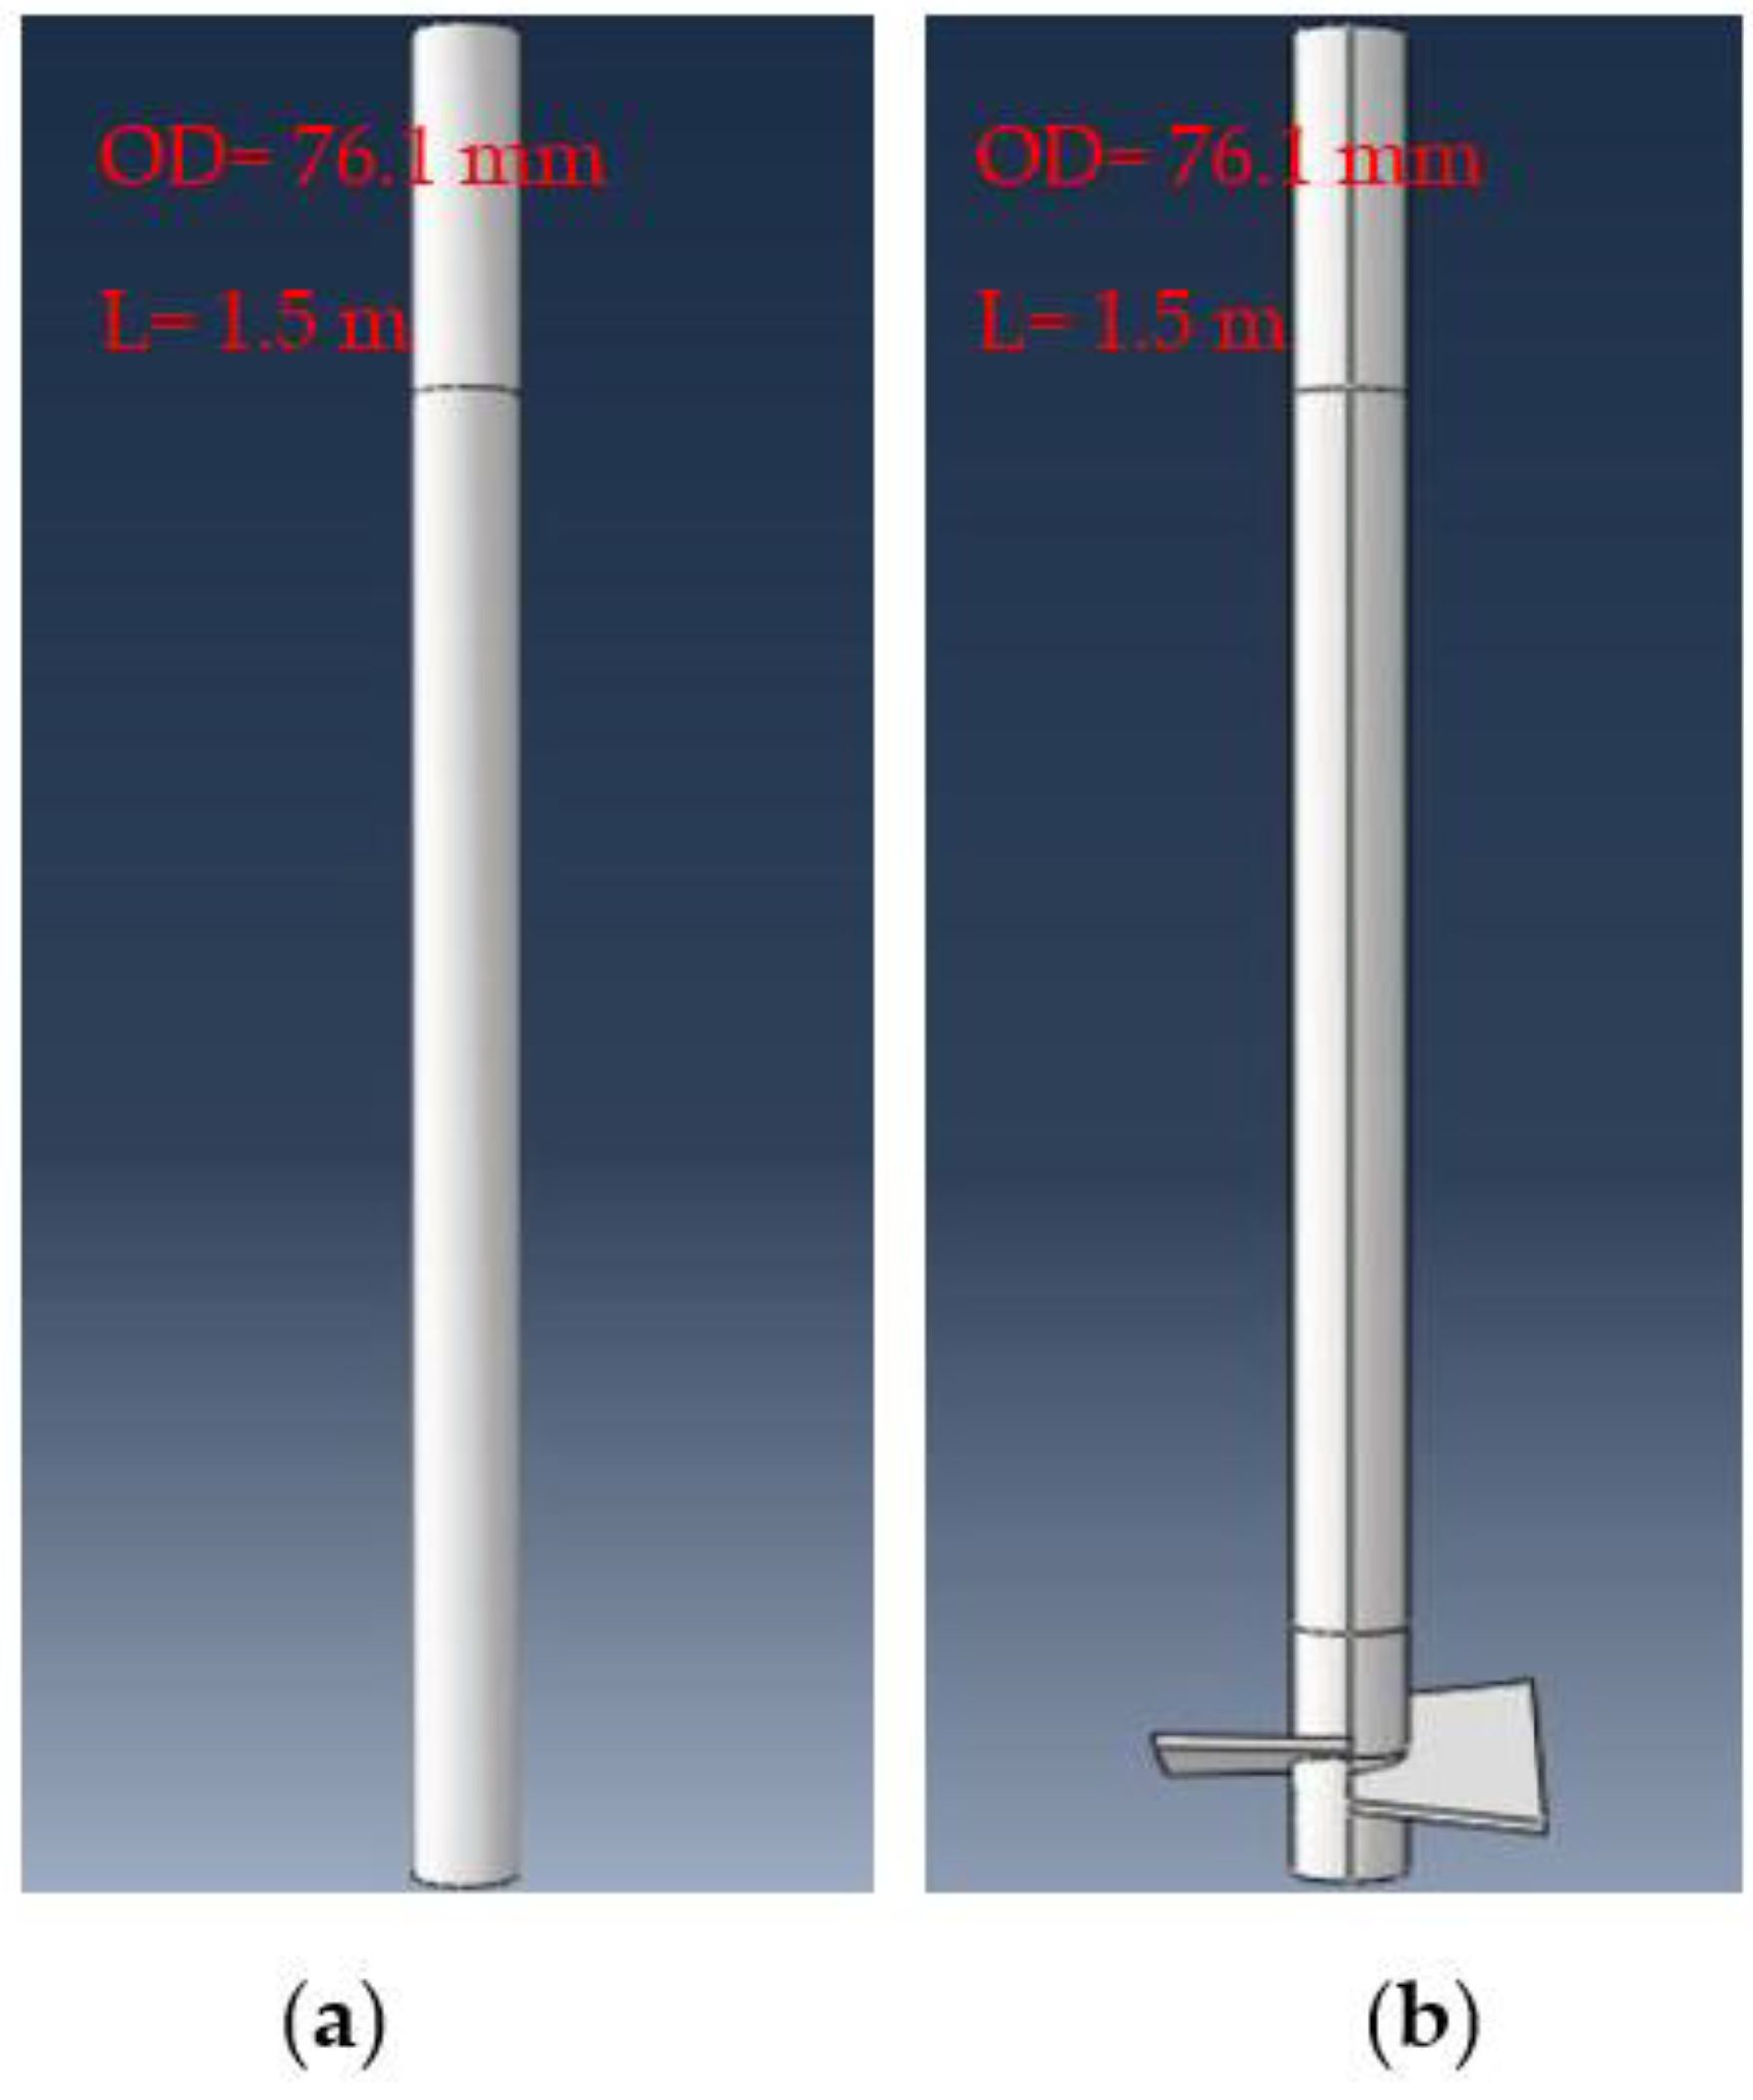
2.1. Pile Geometry and Material Parameter

In civil engineering, the interaction between pile and soil is a complex process. They suggested that, due to the more complex nature of soil, it is not isotropic [20]. Therefore, the interaction between the structure and the soil affects the expression of the structure. The finite element method (FEM) allows the analysis and processing of complex behaviors. Moreover, it is worth mentioning that numerical simulation methods have gained much popularity in recent years. Many researchers use finite element analysis in the study of pile–soil interactions [21,22,23,24,25].
This study used Abaqus, a very popular finite element software, which allows researchers to simulate structure–soil interactions for examining the nonlinear behavior of soils. The finite element method (FEM) is commonly used to solve engineering problems by decomposing complex structures into multiple simple individual parts and then mathematically calculating different individual parts to obtain the desired values. The construction is meshed by the discretization of the spatial dimension. In detail, FEM is constructed by discretizing the spatial dimension for meshing, then using a system of algebraic equations for simulation and, last, minimizing the error by using the variational method.
In this research, the problem is solved statically. Based on piles set in the middle of the soil, the equilibrium of the ground stress is considered in the numerical simulation process, displacement constraints must be applied to the lateral sides of the soil in the calculation domain, and the specific constraints are that the two lateral sides in the X direction constrain their displacements in the X direction, and the two lateral sides in the Y direction constrain their displacements in the Y direction.
To examine the blade’s effect on traditional shaft piles, two models are considered, as shown in Figure 1. The standard circular hollow section (CHS) tube available in the market is used for this investigation, which has an outside diameter (OD) of 76.1 mm and a wall thickness of 4 mm. As shown in Figure 1, the only difference between these two models is that one of the CHS tubes does not have blades welded on it. In this study, the standard CHS pile and the CHS blade pile are labeled as CHSB0P and CHSB1P, respectively. Note that 0 represents that there are no blades, and 1 represents that there is one layer of it (i.e., two blades).
The pile geometry and the material parameter of these FEM models are summarized in Table 1, Table 2 and Table 3. As shown in Table 2, the blades of CHSB1P have an area of 0.05375 m2 (250 mm in length and 10 mm in thickness), which come into contact with soil from the pile end.
Based on previous numerical simulation studies, the material parameters of helical piles were referenced and set [26,27]. These two models do not vary in terms of material strength; that is, the modulus, Poisson’s ratio, density, yield and ultimate strength are identical, as depicted in Table 3.

2.2. Soil Material Parameter and Model Geometry

For the FEM simulation, the Mohr–Coulomb constitutive relationship is selected, and the penalty formula is used for simulating the surface contact between the soil and the pile shaft. This study integrates and adjusts the soil parameters used in past studies on the soil [28]. Table 4 provides the soil parameters of clay used in the FEM modeling.
To perform the parametrical study of these two models in various soil states, the cohesion used in the FEM simulation ranges from 10 to 80 kPa, representing the soil state being soft to hard. In this context, the modulus is assumed to be a constant. Furthermore, the Young’s modulus of the clay used varies from 10 to 120 MPa, which represents the soil state being in a very soft state to a stiff state. Note that cohesion is assumed to be a constant. To be more realistic, FEM models with two variables (different cohesion and modulus) are also simulated; the soil parameters are summarized in Table 4.
In addition, based on previous studies, in the numerical simulation of helical piles, in order to reduce the influence of soil boundary conditions on the model, the soil size is chosen to be at least 20 times the pile diameter, and the soil depth in the lower part of the helical pile is at least 10 times the pile diameter [29].
In this research, the model will take too much time or provide inaccurate results when the soil dimension is too big or too small, respectively. In this context, the soil width and the depth in all models are determined as 3 m and 3 m, respectively.

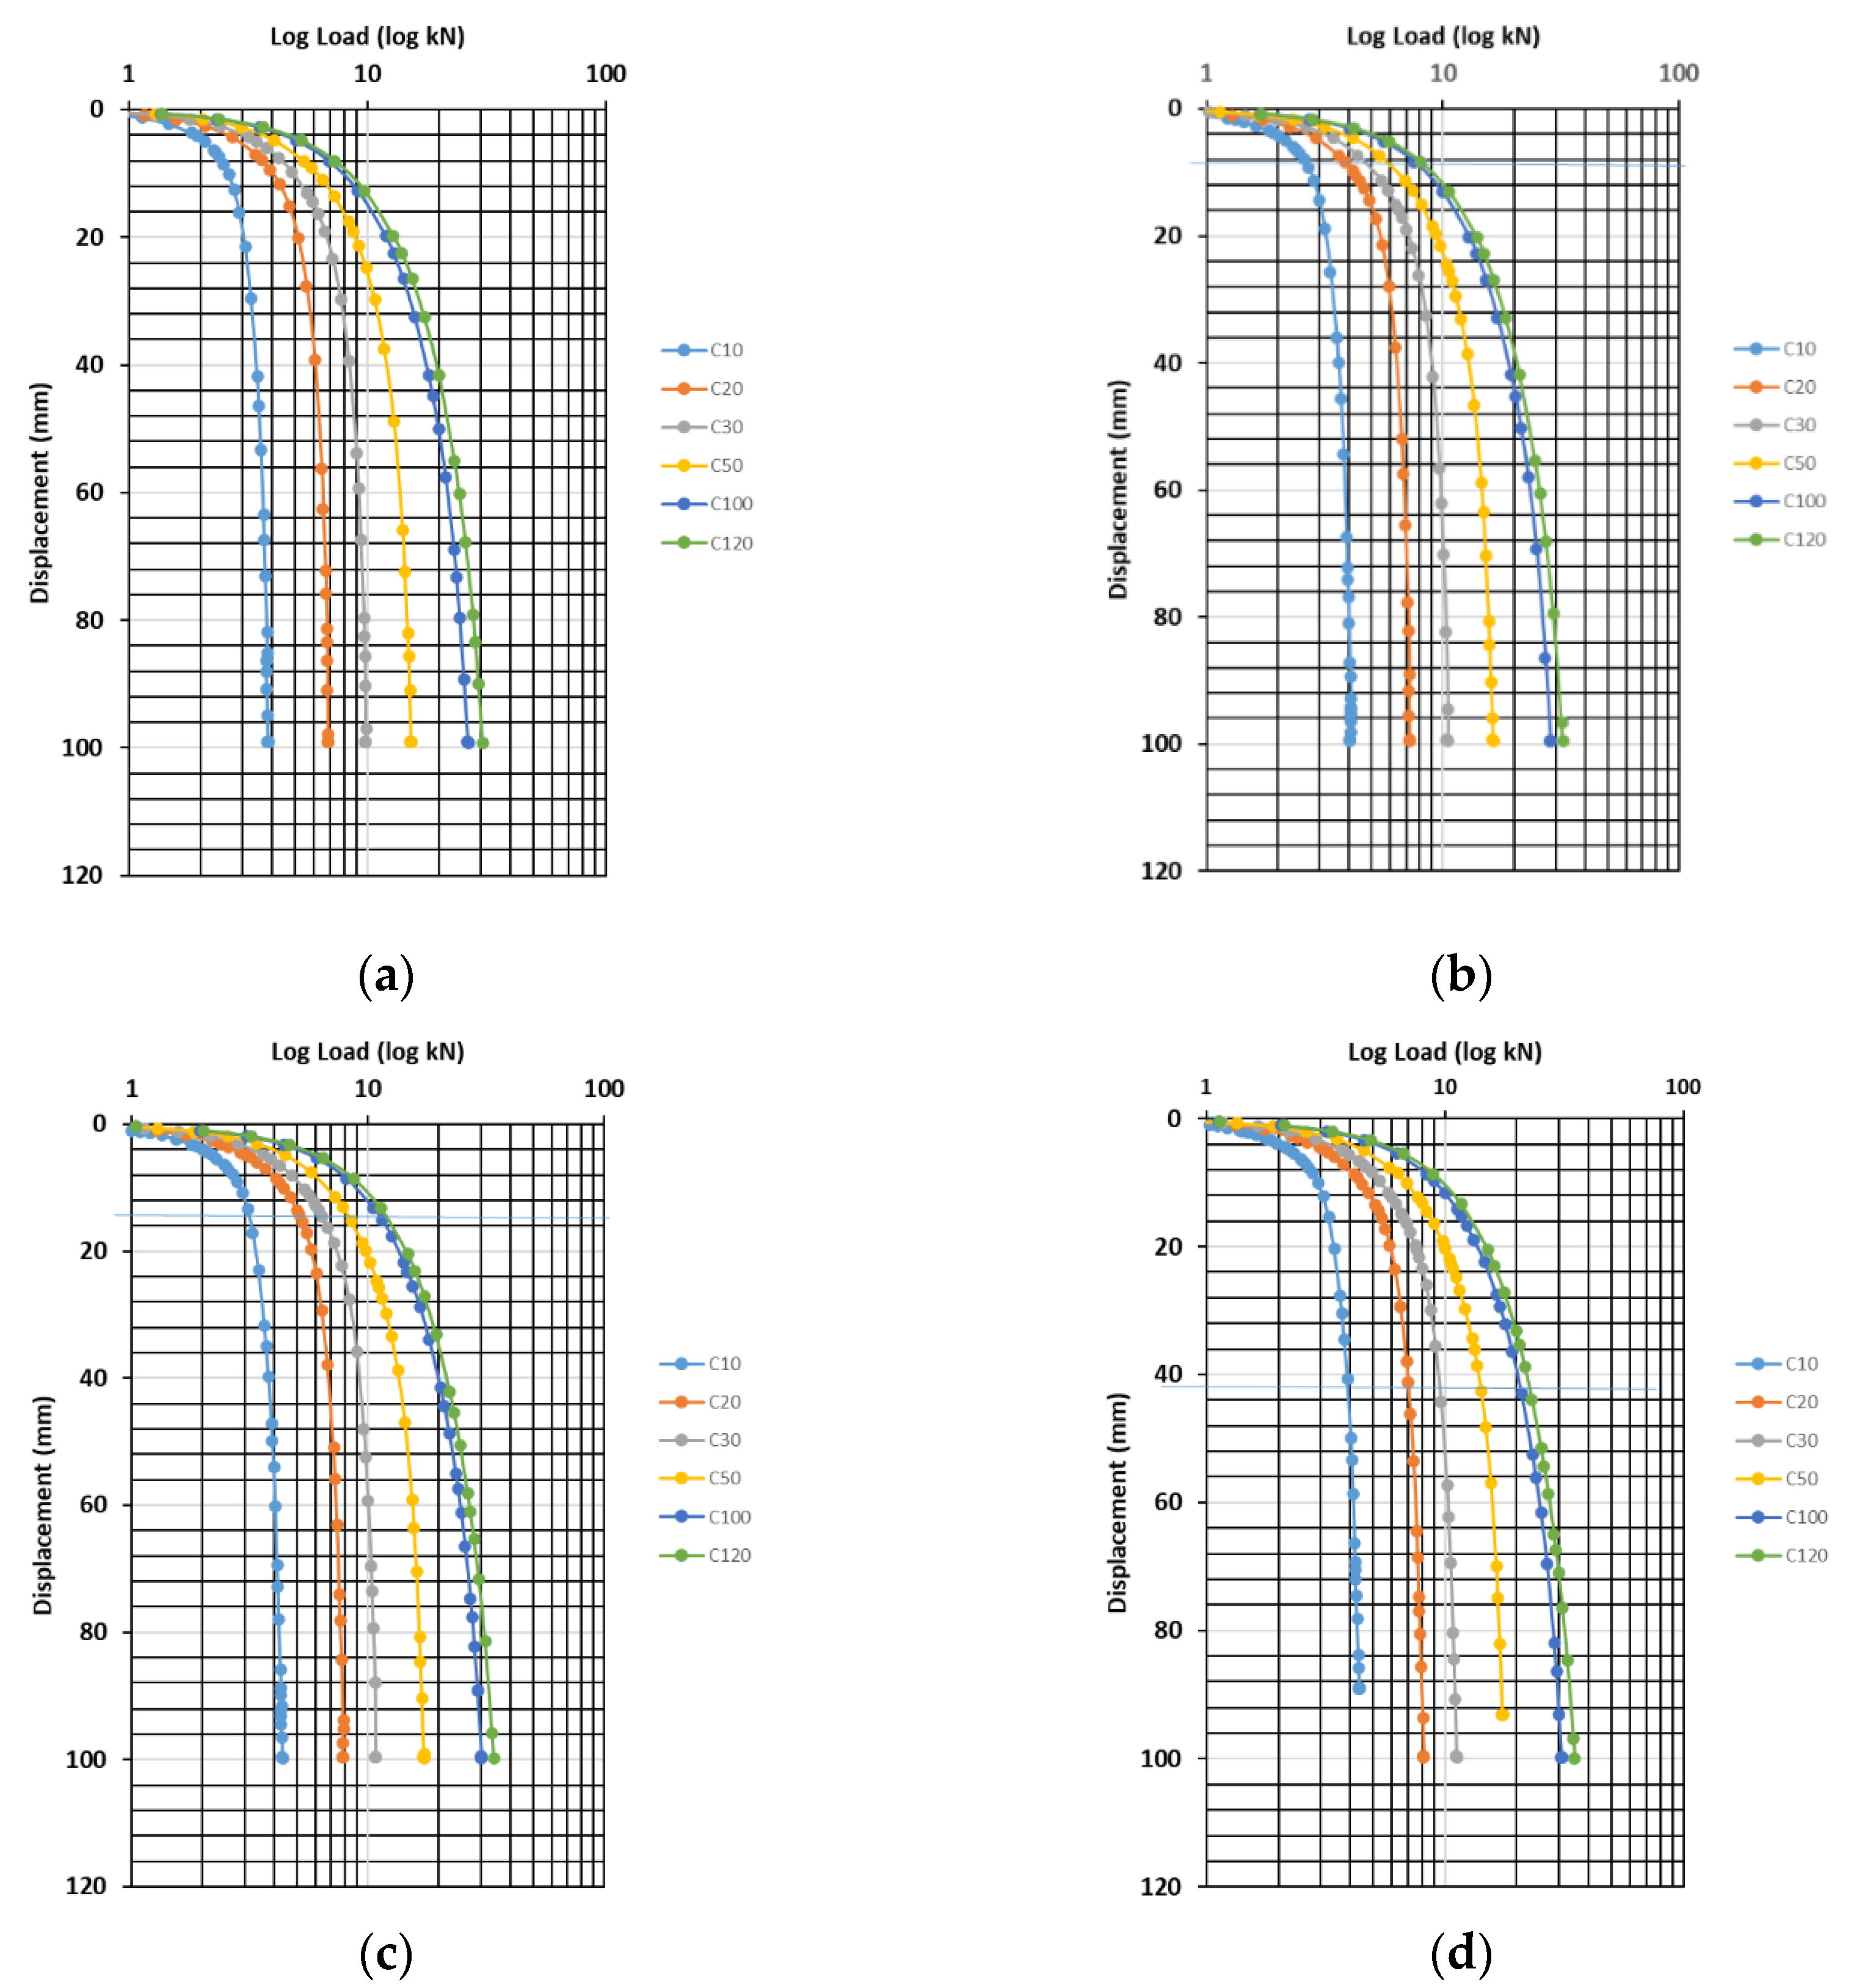
3. Parametrical Study of CHS Pile

3.1. Study of CHSB0 Pile

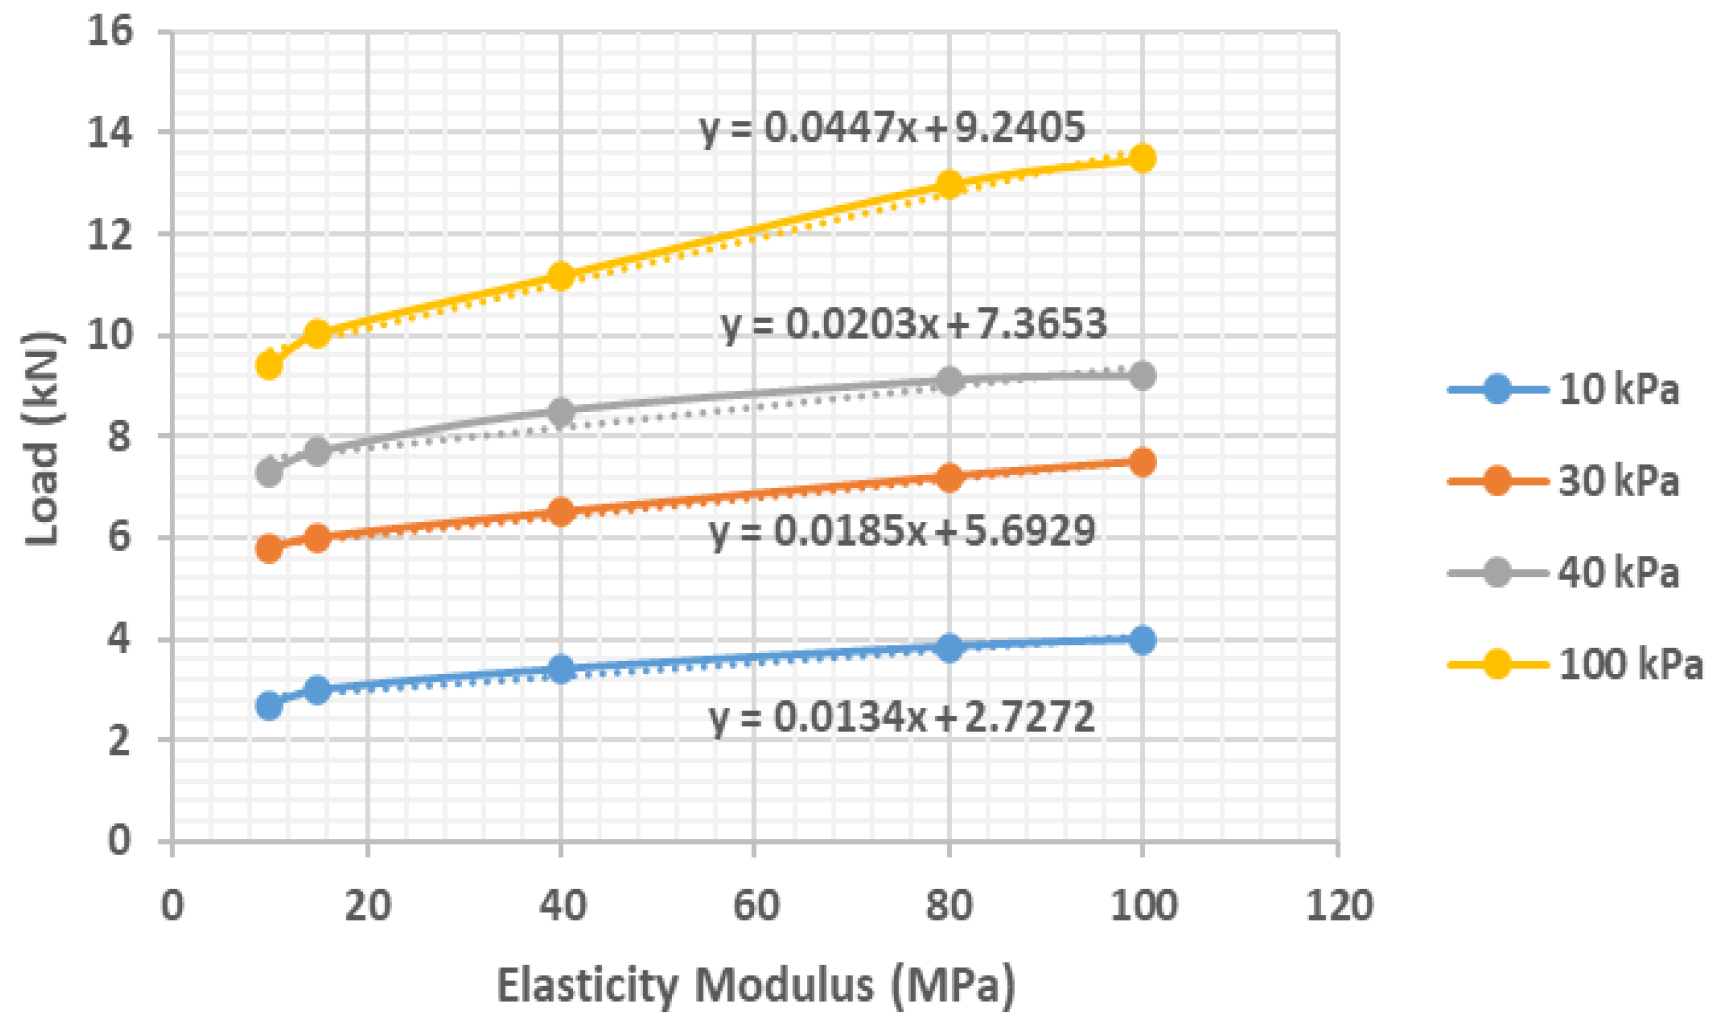
3.1.1. Effect of Modulus of Elasticity

To study the effect of the modulus of soil on the capacity of the pile foundation, the modulus values of elasticity of 10, 15, 40, 80 and 100 MPa are considered by assuming that the value for clay cohesion is a constant. In this study, four constant cohesion values are considered, as shown in Table 5. The log load versus the soil top displacement correlations are plotted in Figure 2a–d.
As shown in Figure 2, in general, the soil lateral displacement increases as the applied loads increase. The soil displacement appears linear from the first part of the curve, and then, the plasticity of the soil develops. By using the log method and finding the point that shows a dramatic increase in the displacement, the ultimate bearing capacity of the pile foundation, and the corresponding allowable displacement, can be found. As shown in Figure 2a,b, the ultimate soil displacement is about 10 mm, and when the cohesion increases, as shown in Figure 2c,d, the ultimate soil displacement is approximately 18 mm. The ultimate bearing capacity in relation to the soil modulus is summarized in Table 6, and the plotted diagram showing the correlation between the modulus and the load capacity is provided in Figure 3.
As shown in Table 6, the smallest pile foundation capacity is 2.3 kN when the 1.5 m pile is embedded in soft clay with an elastic modulus of 10 MPa and the maximum pile foundation capacity is obtained as 12.3 kN with a clay modulus of 100 MPa. Moreover, when the cohesion value is constant, the pile capacity increases as the plasticity modulus increases.
Figure 3 depicts the increment trend or the rate of increase in terms of the ultimate pile–soil capacity. Clearly, the pile foundation capacity increases as the modulus increases, but the gradient differs. The slope of each trend line corresponds to the growth rate of the bearing capacity. In detail, the capacity increment rate is related to the cohesion of clay. Thus, the hard soil that has a cohesion of 100 kPa will show a greater capacity increase rate of 0.0379, whereas the smallest gradient is determined as 0.0065 when the soil cohesion is small (10 kPa).

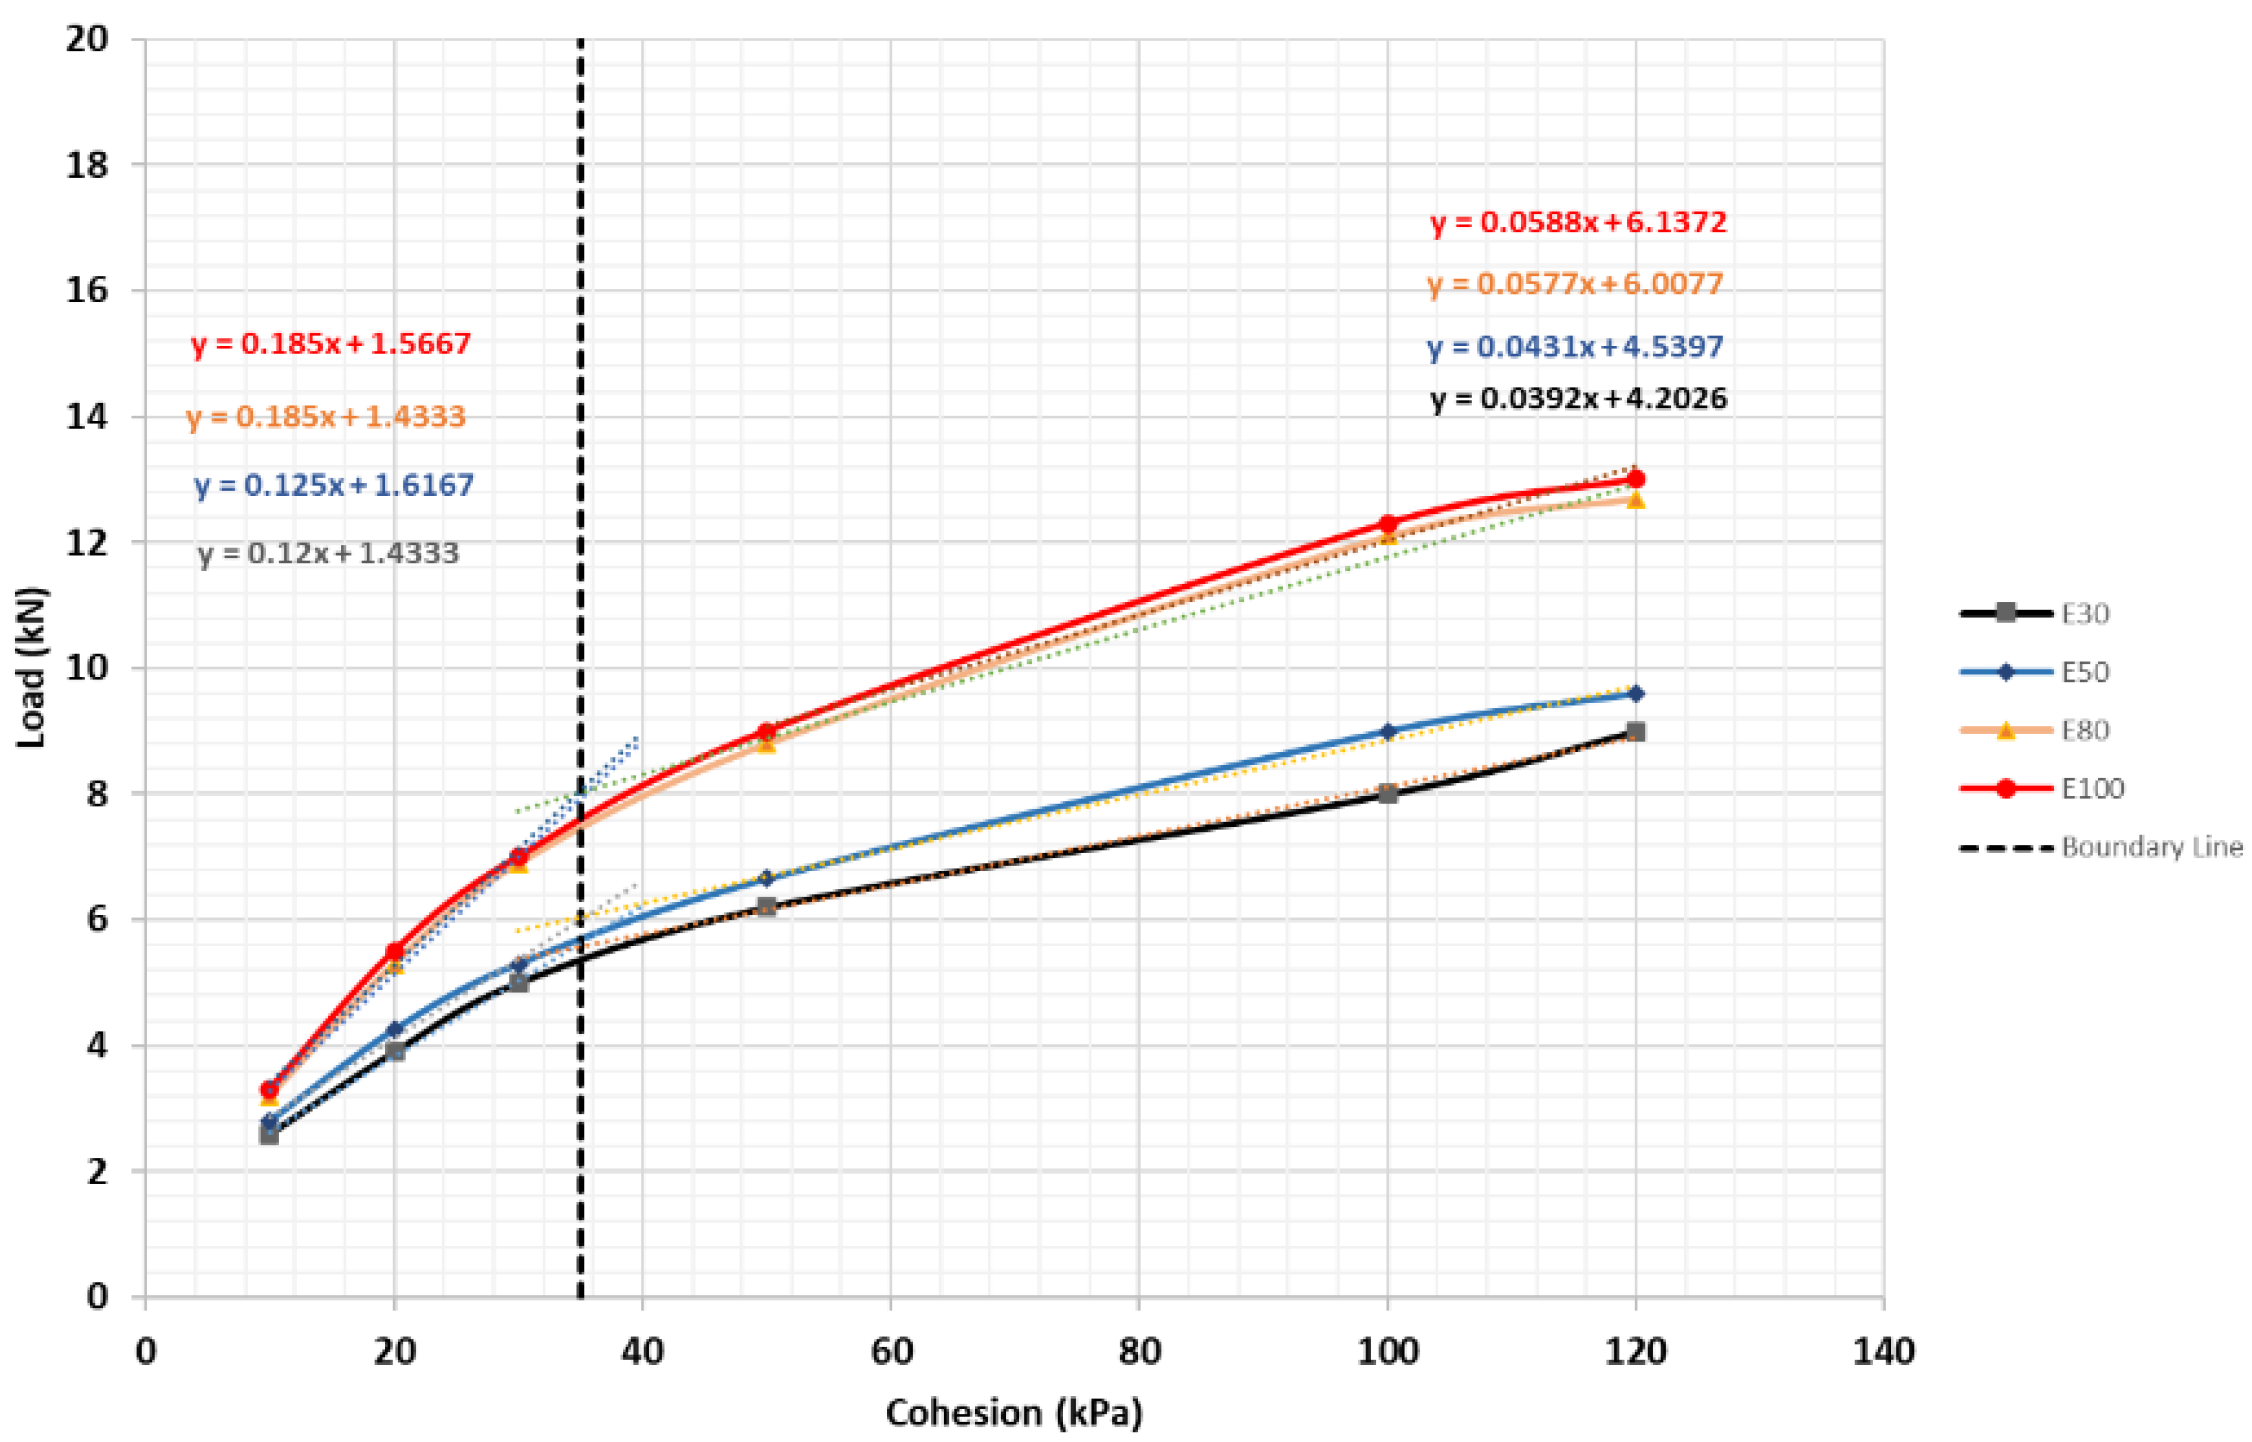
3.1.2. Effect of Cohesion

To study the effect of the soil cohesion on the capacity of the pile foundation, the clay cohesion values of 10, 20, 30, 50, 100 and 120 MPa are considered, and it is assumed that the clay modulus is a constant value. In this study, four constant modulus values are considered, as shown in Table 7, and the log load versus the soil top displacement correlations are plotted in Figure 4a–d.
As shown in Figure 4, in general, the soil lateral displacement increases as the applied loads increase. The soil displacement appears linear from the first part of the curve, and then, the plasticity of the soil develops. Similarly, the ultimate bearing capacity can be found by plotting the intersections of two tangents for each curve. The ultimate bearing capacity of the modeled pile in relation to the soil strength parameter of cohesion is summarized in Table 8.
Table 8 provides a summary of the ultimate bearing capacity of the CHSB0 pile embedded in soil with cohesion ranging from 10 to 120 MPa. The table clearly reveals that there is a positive correlation between the ultimate bearing capacity and cohesion, with the minimum and the maximum capacities being 2.6 and 13 kN. However, it is difficult to observe its increase rate.
Furthermore, the figure shows that the capacity increment rate will be close despite Young’s modulus. Moreover, the equations of the eight regression lines describe the trend that the ultimate bearing capacity (Qult) shows a positive correlation with the cohesion.
Q u l t   y x C
where
  • Q u l t = Ultimate bearing capacity of pile foundation in clay.
  • C = Cohesion of clay.
  • y x = Increment gradient = 0.15 for 10 < C 35; = 0.0497 for 35 < C 120.
As shown in Figure 5, six points were taken for each group to plot the curve. Then, tangents were taken from the first three points and were made to intersect with the tangents from the last three points; this showed that 35 MPa cohesion provides a boundary, which shows an increment rate of 0.153 when the cohesion is less than 35 MPa, and of 0.0497 when the cohesion of clay is more than 35 MPa.

3.2. Parametrical Study of CHSB1 Pile

3.2.1. Effect of Modulus of Elasticity

To investigate the blade pile foundation, a number of models were created by adding a layer of blades (2 blades). The material used as well as the soil parameters were the same as for the normal CHS piles (without blades). The load versus the soil top displacement curves in terms of Young’s modulus are provided in Figure 6, with consideration of a constant cohesion of 10 (Figure 2a), 30 (Figure 2b), 50 (Figure 2c) and 100 kPa (Figure 2d). The correlation between the ultimate bearing capacity of the pile foundation of each model in relation to Young’s modulus is summarized in Table 9, and Figure 7, which illustrates the modulus versus capacity, is provided for convenient analysis of the modulus slope gradient.
Based on the research on the modulus of elasticity and load bearing capacity of helical piles in the past, the load bearing capacity of helical piles is improved with the increase in the modulus of elasticity. When the modulus of elasticity increases from 15 MPa to 75 MPa, the load capacity also increases from 540 kN to about 800 kN [27].
As depicted in Table 9, the pile foundation capacity increases as the modulus increases, with the minimum and maximum capacities of 2.7 and 13.5 kN, respectively. Similar to the finding for the pile without blade application, these capacity increment rates are related to the cohesion values of clay.
As shown in Figure 7, the slope gradients or the capacity improvement rates are determined as 0.013, 0.019, 0.020 and 0.045 when the modulus values are 10, 30, 50 and 100 MPa, respectively, and, in addition, no point divides the curve into two different slope lines. In this figure, it can be seen that the slope increases as the cohesion increases, which is roughly the same trend as in Figure 3. Further, when the cohesive force 100 kPa elastic modulus is 100 MPa, the slope of CHSB1P is large with CHSB0P, which indicates that the pile foundation with added blades has higher ultimate bearing capacity. Based on the comparison with Figure 3, the slope of CHSB0P is 0.0065, and the slope of CHSB1P is 0.0134 when the cohesive force is 10 kPa and the modulus of elasticity is 100 MPa. It can be seen that the added blades can improve the bearing capacity of the CHS pile.

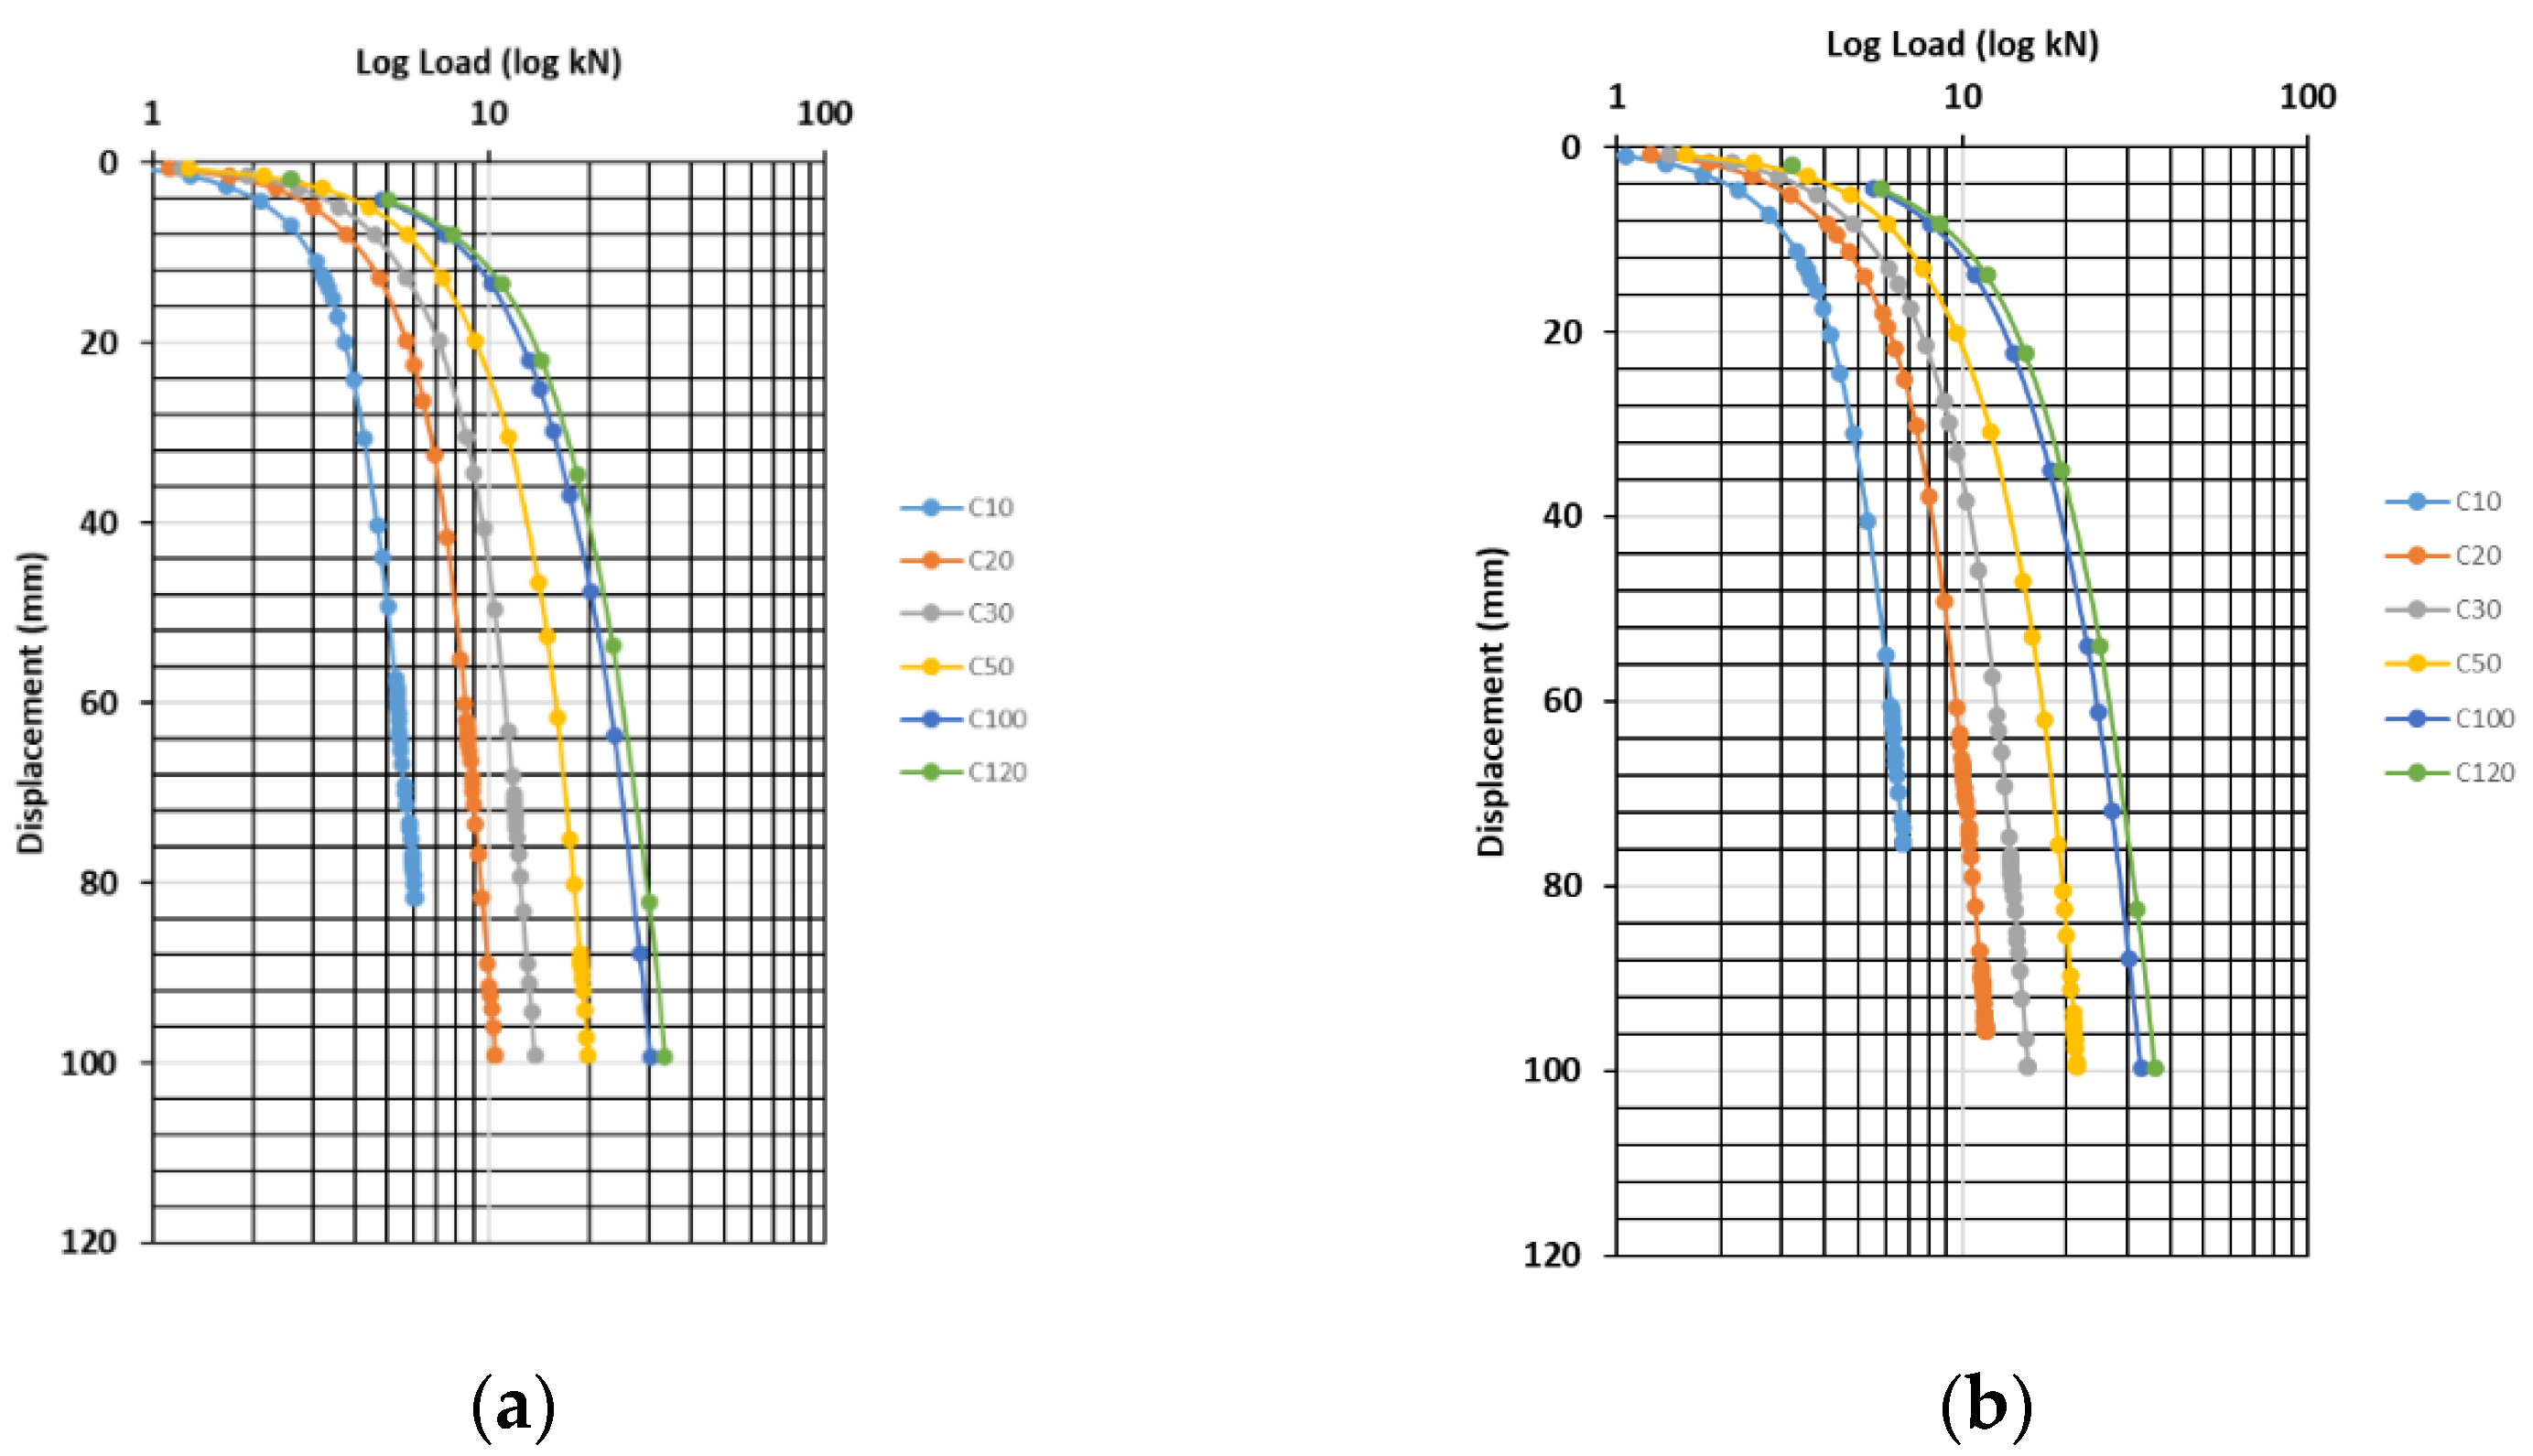
3.2.2. Effect of Cohesion

To examine the correlation of the blade pile capacity and cohesion, the log load versus displacement curves when the soil modulus is a constant are provided in Figure 8a–d (for the CHSB1 pile). The same trends are found by comparing these with the curves for the CHSB0 pile: the initial part of the curves appear linear, and then, elastic deformation occurs. By interpreting the load versus displacement data, the ultimate bearing capacity values of each model corresponding to the soil parameters are summarized in Table 10. Furthermore, for convenient analysis of the capacity improvement rate, the cohesion versus capacity blade pile foundation is provided in Figure 9.
As shown in Figure 9, when the cohesion increases, the pile capacity increases, but the increment rates are different. When the cohesion is less than 35 MPa, the slope gradient is approximately determined as 0.13 despite the modulus value, and when the cohesion is greater than 35 MPa, the slope gradient is about 0.06. For mathematical representation of the ultimate capacity, refer to Equation (1).
For this section, the parameters of the common pile foundation and CHSB1 pile are studied to analyze their effects on the bearing capacity under different elastic modulus and cohesion conditions. In Section 4 of this research, CHSB0P and CHSB1P are re-simulated, which are analyzed for classified clay soils to confirm the relationship between bearing capacity and displacement under realistic clay parameters.

4. Comparison between CHSB0 and CHSB1 Piles

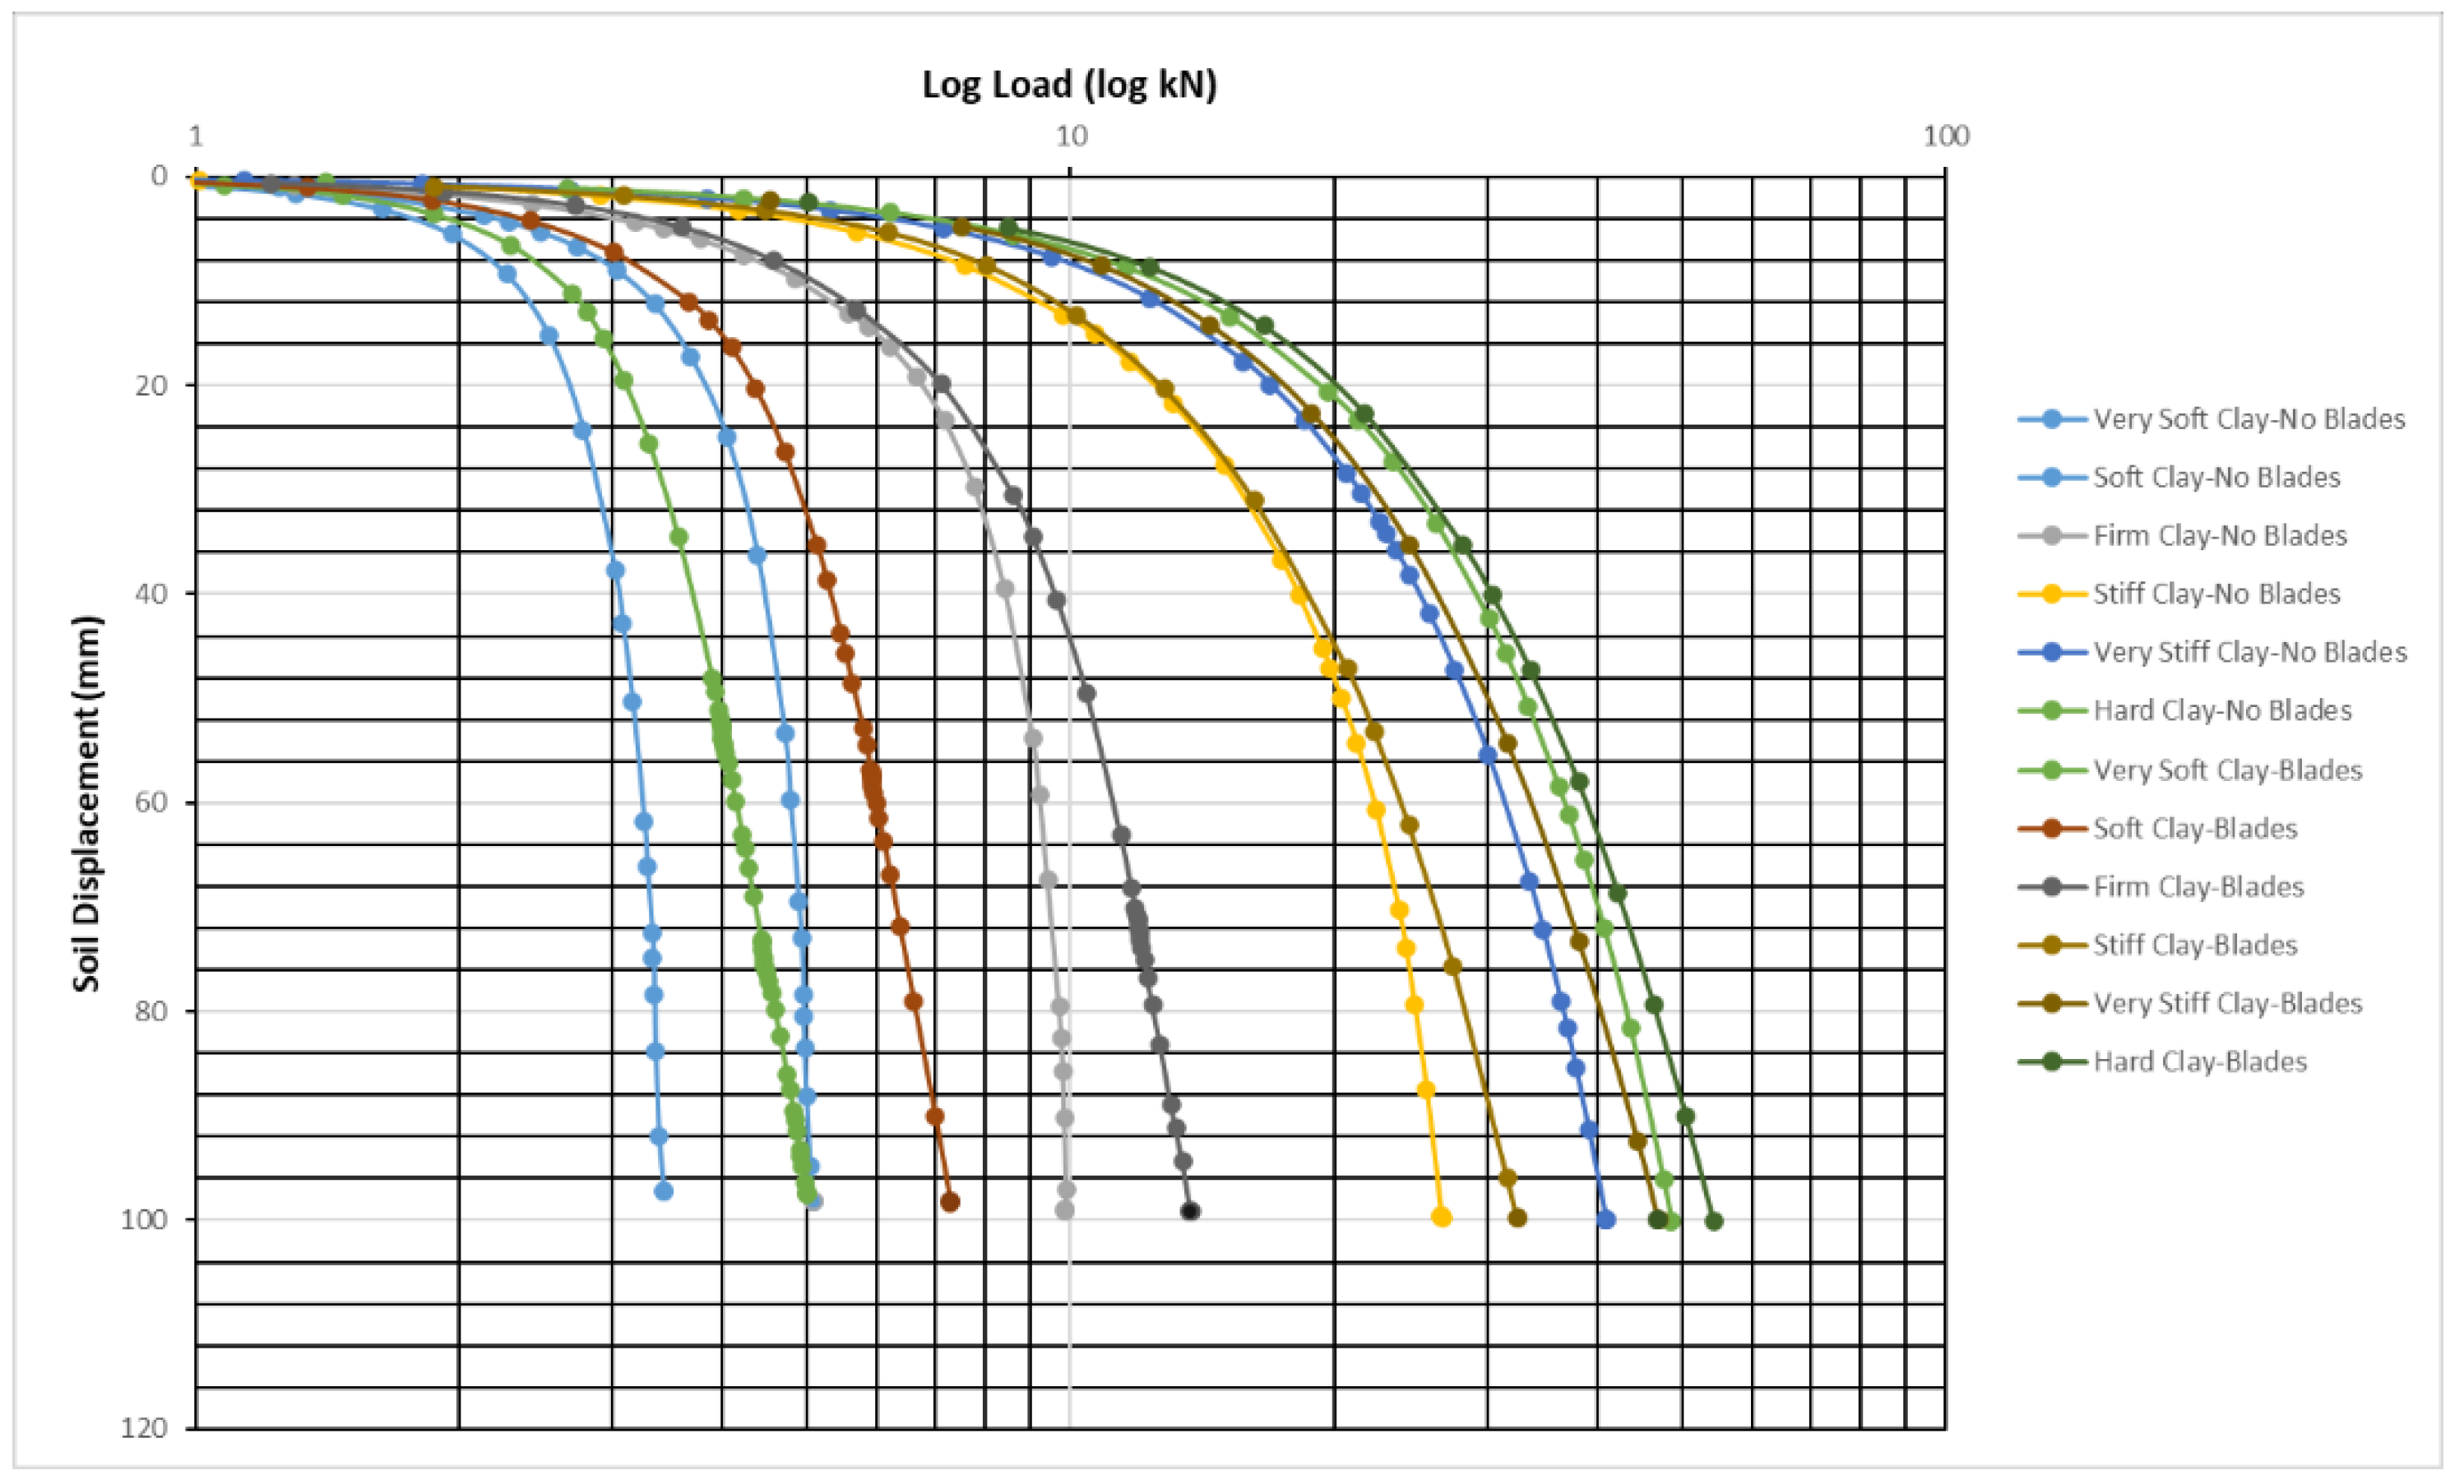
4.1. CHSB0 and CHSB1 Piles in Clay

On the basis of the soil conditions provided in Table 4, the log load versus the soil lateral displacement of all FEM models, by considering different types of soil states, is provided in Figure 10. The figure shows that when the soil condition is ascertained, the capacity of the blade pile foundation is greater than that of the normal pile foundation. Moreover, the loads that lead to 100 mm soil displacement from the blade pile model are greater than the corresponding loads from the normal pile model. For example, when the soil is in the very soft state, for a 100 mm lateral soil displacement to occur, a load of 3.4 and 5 kN must be applied to the CHSB0 pile and the CHSB1 pile, respectively. Taking another example, when the soil is hard, the load required to cause 100 mm soil displacement for the normal pile and the blade pile are 48.6 and 54.3 kN, respectively.
Moreover, as shown in Figure 10, the capacity increment between the blade pile and the normal pile is related to the soil state because the lateral distance in the figure between the two curves (normal pile and blade pile) differs. Further, the maximum distances occur when the soil is very soft to firm, that is, the harder the soil, the less the horizontal distance between two curves.

4.2. Ultimate Bearing Capacity Improvement

According to the data obtained from Figure 10, the point that shows a dramatic soil movement increase provides the ultimate bearing capacity of the pile foundation. These points are around 20 to 40 mm soil displacement. Normally, for the solar panel pier, the failure criterion is the load that causes a 25 mm soil surface displacement. In this context, the pile capacity of the pile foundations in different soil environments is summarized in Table 11.
As shown in Table 11, CHSB0 shows the minimum capacity of 2.7 kN and the maximum of 19.6 kN when the soil is soft; in comparison, the CHSB1 pile shows the minimum capacity of 3.1 kN with 14.8% improvement and the maximum capacity of 20.1 kN with 2.5% improvement. This result indicates that when the clay material is very soft to firm, the blade pile can be used as a replacement for the traditional piles.

5. Conclusions and Recommendation

The study in relation to the mechanical behavior of the soil and tube/cylinder shaft pile under lateral load action has been investigated for a long time. However, when an enlarged head is added at the bottom of the pile foundation, which acts as anchor stabilization, the study of the mechanical properties between its pile and soil is very limited. In this study, a parametrical investigation was performed, and the ultimate bearing capacity of the normal CHSB pile and the blade pile in different types of soil was calculated and compared. Two soil parameters were considered, namely, Young’s modulus and the soil strength parameter of cohesion. The conclusions of this study are as follows:
The ultimate bearing capacity of the CHSB0 pile foundation as well as of the CHSB1 pile foundation will increase as the Young’s modulus increases.
The ultimate capacity improvement rate is related to cohesion: the greater the cohesion, the greater the capacity; however, the improvement rate will be changed.
The ultimate bearing capacity of the CHSB0 pile foundation as well as of the CHSB1 pile foundation will increase as the soil cohesion increases.
The ultimate capacity improvement rate is related to Young’s modulus: the greater the Young’s modulus, the greater the capacity improvement. Furthermore, the cohesion of 35 MPa is found to be a boundary. When the cohesion is less than 35 MPa, the capacity improvement rate is greater.
Numerical simulations of the CHSB0 pile and of the CHSB1 pile were also conducted for six states of soil: very soft, soft, firm, stiff, very stiff and hard. The ultimate bearing capacity of each pile was determined and compared. The conclusions are as follows.
When the soil state is ascertained, the ultimate bearing capacity of the blade pile foundation is greater than that of the CHSB0 pile.
When the soil state changes from very soft to hard, the lateral bearing capacity of both the CHSB0 pile and the CHSB1 pile will increase.
When the soil is very soft to firm, the CHSB1 pile has much greater capacity than the CHSB0 pile, but when the soil is stiff to hard, the blade pile capacity is just slightly greater than that of the CHSB0 pile. The reason is that when the soil is stiff to hard, the load-displacement curve shows no ‘drop’ point, which means the pile–soil system does not show the failure condition.
On replacing the CHSB0 pile by the CHSB1 pile, the maximum lateral capacity improvement can be 14.8% when the soil is very soft and 2.5% when the soil is hard.

Author Contributions

The concept of using the blade pile group connected by a frame under lateral wind loads was proposed by J.Z., who has a patent from Blade Pile Group Pty Ltd. In this research, only the single blade pile was investigated for the purposes of future investigation and comparison. The FEM modeling was developed by L.L., under the supervision of E.O. This paper was written and edited by L.L. and J.Z. Data analysis was conducted by a team comprising all the authors listed in this paper. In addition, the chart review is completed by L.L. and G.S. All authors have read and agreed to the published version of the manuscript.

Funding

This research received no external funding.

Data Availability Statement

The excel data of field tests used to support the findings of this study are available from the first author or the corresponding author upon request.

Acknowledgments

Thanks are due to the solar panel design project team of Blade Pile Group Co., Ltd. for their support.

Conflicts of Interest

The authors declare that there are no conflict of interest regarding the publication of this paper.

References

  1. Zhou, J.; Oh, E. Full-Scale Field Tests of Different Types of Piles; Springer: Singapore, 2021. [Google Scholar] [CrossRef]
  2. Abdel-Rahman, A.H.; Rabie, M.; Awad-Allah, M.F. Comparison between Egyptian code, DIN 4014, and AASHTO methods of predicting ultimate bearing capacity of large diameter bored piles. El-Azher Univ. Eng. J. 2006, 8, 15–26. [Google Scholar]
  3. Hussein, H.H. Behavior of grouting pile in sandy soil. IOP Conf. Ser. Mater. Sci. Eng. 2020, 737, 12109. [Google Scholar] [CrossRef]
  4. He, B.; Wang, L.; Hong, Y. Capacity and failure mechanism of laterally loaded jet-grouting reinforced piles: Field and numerical investigation. Sci. China Technol. Sci. 2016, 59, 763–776. [Google Scholar] [CrossRef]
  5. Al-Baghdadi, T.A.; Brown, M.J.; Knappett, J.A.; Al-Defae, A.H. Effects of vertical loading on lateral screw pile performance. Proc. Inst. Civ. Eng.-Geotech. Eng. 2017, 170, 259–272. [Google Scholar] [CrossRef]
  6. Soltani-Jigheh, H.; Zahedi, P. Load transfer mechanism of screw piles in sandy soils. Indian Geotech. J. 2020, 50, 871–879. [Google Scholar] [CrossRef]
  7. Ghaly, A.; Hanna, A.; Hanna, M. Installation torque of screw anchors in dry sand. Soils Found. 1991, 31, 77–92. [Google Scholar] [CrossRef]
  8. Salhi, L.; Nait-Rabah, O.; Deyrat, C.; Roos, C. Numerical modeling of single helical pile behavior under compressive loading in sand. Electron. J. Geotech. Eng. 2013, 18, 4319–4338. [Google Scholar]
  9. Rao, S.N.; Prasad, Y.V.S.N.; Shetty, M.D. The behaviour of model screw piles in cohesive soils. Soils Found. 1991, 31, 35–50. [Google Scholar] [CrossRef]
  10. Perko, H.A. Helical Piles: A Practical Guide to Design and Installation; Wiley: Hoboken, NJ, USA, 2009; pp. 104–118. [Google Scholar] [CrossRef]
  11. Mitsch, M.P.; Clemence, S.P. Uplift capacity of helix anchors in sand. In Unknown Host Publication Title; Clemence, S.P., Ed.; American Society of Civil Engineers (ASCE): Reston, VA, USA, 1985; pp. 26–47. [Google Scholar]
  12. Mooney, J.S.; Adamczak, S.; Clemence, S.P. Uplift Capacity of Helical Anchors in Clay and Silt; Clemence, S.P., Ed.; American Society of Civil Engineers: Reston, VA, USA, 1985; pp. 48–72. [Google Scholar]
  13. Nasr, M.H. Large capacity screw piles. In Proceedings of the International Conference: Future Vision and Challenges for Urban Development, Cairo, Egypt, 20–22 December 2004; pp. 1–15. [Google Scholar]
  14. Budhu, M. Soil Mechanics and Foundations; Wiley: New York, NY, USA, 2020; No. 1; pp. 1–xvi. [Google Scholar]
  15. Elkasabgy, M.; Naggar, M.H.E. Dynamic response of vertically loaded helical and driven steel piles. Can. Geotech. J. 2013, 50, 521–535. [Google Scholar] [CrossRef]
  16. Hoyt, R.M.; Chance, A.; Clemence, S.P. Uplift capacity of helical anchors in soil. In Congrès International de Mécanique des Sols et des Travaux de Fondations; Taylor & Francis: Rio de Janeiro, Brazil, 1989; Volume 12, pp. 1019–1022. [Google Scholar]
  17. Tsuha, C.D.H.C.; Aoki, N. Relationship between installation torque and uplift capacity of deep helical piles in sand. Can. Geotech. J. 2010, 47, 635–647. [Google Scholar] [CrossRef]
  18. Das, B.M.; Rozendal, D.B. Ultimate uplift capacity of piles in sand. Transp. Res. Rec. 1983, 945, 40–44. [Google Scholar]
  19. Feng, S.; Fu, W.; Chen, H.; Li, H.; Xie, Y.; Lv, S.; Li, J. Field tests of micro screw anchor piles under different loading conditions at three soil sites. Bull. Eng. Geol. Environ. 2020, 80, 127–144. [Google Scholar] [CrossRef]
  20. Dutta, S.C.; Roy, R. A critical review on idealization and modeling for interaction among soil–foundation–structure system. Comput. Struct. 2002, 80, 1579–1594. [Google Scholar]
  21. Trochanis, A.M.; Bielak, J.; Christiano, P. Three-dimensional nonlinear study of piles. J. Geotech. Eng. 1991, 117, 429–447. [Google Scholar] [CrossRef]
  22. Zaman, M.M.; Najjar, Y.M.; Muqtadir, A. Effects of cap thickness and pile inclination on the response of a pile group foundation by a three-dimensional nonlinear finite element analysis. Comput. Geotech. 1993, 15, 65–86. [Google Scholar] [CrossRef]
  23. Ng, C.W.W.; Zhang, L.M. Three-dimensional analysis of performance of laterally loaded sleeved piles in sloping ground. J. Geotech. Geoenvironmental Eng. 2001, 127, 499–509. [Google Scholar] [CrossRef]
  24. Pan, J.L.; Goh, A.T.C.; Wong, K.S.; Selby, A.R. Three-dimensional analysis of single pile response to lateral soil movements. Int. J. Numer. Anal. Methods Geomech. 2002, 26, 747–758. [Google Scholar]
  25. Chore, H.S.; Ingle, R.K.; Sawant, V.A. Parametric study of pile groups subjected to lateral load. Struct. Eng. Mech. Int. J. 2010, 36, 243–246. [Google Scholar] [CrossRef]
  26. Nematzadeh, M.; Fazli, S.; Naghipour, M.; Jalali, J. Experimental study on modulus of elasticity of steel tube-confined concrete stub columns with active and passive confinement. Eng. Struct. 2017, 130, 142–153. [Google Scholar] [CrossRef]
  27. Zhou, W.; Gao, R.; Zhu, H.; Wei, X.; Cao, Q.; Gao, Z. Behavior of steel casing composite piles under lateral loading and parameter optimization. Eng. Struct. 2020, 220, 110991. [Google Scholar] [CrossRef]
  28. Look, B.G. Handbook of Geotechnical Investigation and Design Tables; Taylor & Francis: London, UK, 2007; p. 346. [Google Scholar] [CrossRef]
  29. Nowkandeh, M.J.; Choobbasti, A.J. Numerical study of single helical piles and helical pile groups under compressive loading in cohesive and cohesionless soils. Bull. Eng. Geol. Environ. 2021, 80, 4001–4023. [Google Scholar] [CrossRef]
Figure 1. (a) Abaqus for CHSB0P; (b) Abaqus for CHSB1P.
Geosciences 12 00329 g001
Figure 2. Load versus horizontal displacement for CHSB0 pile: (a) cohesion of 10 kPa; (b) cohesion of 30 kPa; (c) cohesion of 50 kPa; (d) cohesion of 100 kPa.
Geosciences 12 00329 g002
Figure 3. Elasticity modulus versus ultimate load for CHSB0 pile.
Geosciences 12 00329 g003
Figure 4. Load versus horizontal displacement for CHSB0 pile. (a) Elasticity modulus of 30 MPa; (b) elasticity modulus of 50MPa; (c) elasticity modulus of 80MPa; (d) elasticity modulus of 100MPa.
Geosciences 12 00329 g004
Figure 5. Relationship between cohesive force and ultimate bearing capacity for CHSB0 pile.
Geosciences 12 00329 g005
Figure 6. Load versus horizontal displacement for CHSB1 pile. (a) Cohesion of 10 kPa; (b) cohesion of 30 kPa; (c) cohesion of 50 kPa; (d) cohesion of 100 kPa.
Geosciences 12 00329 g006
Figure 7. Elasticity modulus versus ultimate load for CHSB1 pile.
Geosciences 12 00329 g007
Figure 8. Load versus horizontal displacement for CHSB1 pile. (a) Elasticity modulus of 30 MPa; (b) elasticity modulus of 50 MPa; (c) elasticity modulus of 80 MPa; (d) elasticity modulus of 100 MPa.
Geosciences 12 00329 g008aGeosciences 12 00329 g008b
Figure 9. Relationship between cohesive force and ultimate bearing capacity for CHSB1 pile.
Geosciences 12 00329 g009
Figure 10. Log load versus soil displacement of CHSB0 and CHSB1 piles in clay.
Geosciences 12 00329 g010
Table 1. Pile geometry parameter.
TypeODWall ThicknessLengthEmbedmentBlade No
mmmmmmNo.
CHSB0P76.141.51.20
CHSB1P76.141.51.22
OD = outside diameter.
Table 2. Blade geometry parameter.
TypeWall ThicknessLengthBlade Area
mmmmm2
CHSB0P000
CHSB1P102500.05375
Table 3. Pile material parameter.
TypeModulusPoisson’s RatioDensityCHS GradeBlade Grade
MPaN/At/mm3MPaMPa
CHSB0P210,0000.37.8 × 10−9450N/A
CHSB1P210,0000.37.8 × 10−9450350
Table 4. Clay parameters used in FEM model.
Soil IndexUnit Weight, γSoil Cohesion, cModulus of Elasticity E
kN/m3kPaMPa
Very soft161010
Soft171515
Firm18.53030
Stiff208575
Very stiff21150150
Hard22.5200180
Table 5. Controlled parameters and varying parameters.
ControlledElastic Modulus (MPa)
c = 10 kPa10, 15, 40, 80 and 100
c = 30 kPa10, 15, 40, 80 and 100
c = 50 kPa10, 15, 40, 80 and 100
c = 100 kPa10, 15, 40, 80 and 100
Table 6. Pile foundation capacity in relation to Young’s modulus of soil for CHSB0 pile.
Elastic Modulus
(MPa)
Pile Foundation Capacity (kN)
c = 10 kPac = 30 kPac = 50 kPac = 100 kPa
102.34.535.59.0
152.444.876.19.2
402.735.46.711.0
802.895.87.312.1
1002.926.07.812.3
Table 7. Controlled parameters and varying parameters.
ControlledCohesion (kPa)
E = 30 MPa10, 20, 30, 50, 100 and 120
E = 50 MPa10, 20, 30, 50, 100 and 120
E = 80 MPa10, 20, 30, 50, 100 and 120
E = 100 MPa10, 20, 30, 50, 100 and 120
Table 8. Pile foundation capacity in relation to cohesion of soil for CHSB0 pile.
Cohesion
(kPa)
Pile Foundation Capacity (kN)
E = 30 MPaE = 50 MPaE = 80 MPaE = 100 MPa
102.62.83.23.3
203.94.255.35.5
305.05.36.97.0
506.26.658.89.0
1008.09.012.112.3
1209.09.612.713.0
Table 9. Pile foundation capacity in relation to Young’s modulus of soil for CHSB1 pile.
Elastic Modulus
(MPa)
Pile Foundation Capacity (kN)
c = 10 kPac = 30 kPac = 50 kPac = 100 kPa
102.75.87.39.4
152.996.07.710.05
403.46.58.511.2
803.847.29.113.0
1003.987.59.213.5
Table 10. Pile foundation capacity in relation to cohesion of soil for CHSB1 pile.
Cohesion
(kPa)
Pile Foundation Capacity (kN)
E = 30 MPaE = 50 MPaE = 80 MPaE = 100 MPa
102.93.24.14.35
204.24.655.96.0
305.055.47.27.35
506.46.959.09.15
1008.99.313.013.5
1209.210.014.014.8
Table 11. Ultimate bearing capacity of normal and blade pile foundations in different types of clay.
Pile LabelUltimate Bearing Capacity (kN)
Very SoftSoft ClayFirm ClayStiff ClayVery Stiff ClayHard Clay
CHSB02.73.86.712.816.919.6
CHSB13.14.37.112.8317.420.1
Capacity
Improvement (%)
14.813.15.90.232.952.5
Publisher’s Note: MDPI stays neutral with regard to jurisdictional claims in published maps and institutional affiliations.

