Abstract
In this paper, the 1978–2022 series of northern (NHSI) and southern (SHSI) hemisphere sea ice extent are submitted to singular spectral analysis (SSA). The trends are quasi-linear, decreasing for NHSI (by 58,300 km/yr) and increasing for SHSI (by 15,400 km/yr). The amplitude of annual variation in the Antarctic is double that in the Arctic. The semi-annual components are in quadrature. The first three oscillatory components of both NHSI and SHSI, at 1, 1/2, and 1/3 yr, account for more than 95% of the signal variance. The trends are respectively 21 (Antarctic) and 4 times (Arctic) less than the amplitudes of the annual components. We next analyze variations in pole position (PM for polar motion, coordinates , ) and length of day (lod). Whereas the SSA of the lod is dominated by the same first three components as sea ice, the SSA of the PM contains only the 1-yr forced annual oscillation and the Chandler 1.2-yr component. The 1-yr component of NHSI is in phase with that of the lod and in phase opposition with m1, while the reverse holds for the 1-yr component of SHSI. The semi-annual component appears in the lod and not in . The annual and semi-annual components of NHSI and SHSI are much larger than the trends, leading us to hypothesize that a geophysical or astronomical forcing might be preferable to the generally accepted forcing factors. The lack of modulation of the largest (SHSI) forced component does suggest an alternate mechanism. In Laplace’s theory of gravitation, the torques exerted by the Moon, Sun, and planets play the leading role as the source of forcing (modulation), leading to changes in the inclination of the Earth’s rotation axis and transferring stresses to the Earth’s envelopes. Laplace assumes that all masses on and in the Earth are set in motion by astronomical forces; more than variations in eccentricity, it is variations in the inclination of the rotation axis that lead to the large annual components of melting and re-freezing of sea-ice.
1. Introduction
In a series of previous papers, we have applied singular spectrum analysis (SSA) to long time series of geophysical observables. We have analyzed series for which several decades to centuries of data were available, allowing for exploration of their periodic or quasi-periodic components on time scales from days to a full century. We have successively analyzed polar motion and length of day [1,2,3], the oceanic climate indices MJO, PDO, ENSO, etc. [4,5,6], and global surface temperatures [7,8], and contributed to the understanding of the solar–terrestrial relationship of sunspot numbers via ISSN [9,10]. The determination of a comprehensive range of pseudo-periodic components of ISSN has even allowed us to propose a prediction of the ongoing solar cycle, Cycle 25. In the present paper, we extend the same analysis to an important component of the climate system, namely, variations in the surface extent of sea ice in the Arctic and Antarctic.
In previous papers, on which the present study is partly based [2,3], we recalled the importance of Laplace’s treatise on celestial mechanics [11], in particular the system of equations, later named after Euler and Liouville, that express the conservation of kinetic momentum [12] and govern the declination and inclination of the rotation axis of any planet in revolution about the Sun (see Appendix A and Appendix B). Laplace’s paradigm can be summarized in two statements: (1) all masses on the surface or internal to a planet are set in motion by astronomical forces (particularly from the Sun, Moon, and Jovian planets) and (2) it is sufficient to know the polar motion or its time derivative (the lod) in order to have access to the periods of all moving masses on the Earth’s surface or inside of it. This is why the revolution periods of planets (or their commensurate combinations) and luni-solar tides have been found in many observed time series of geophysical phenomena, ranging from hours to millions of years [1,2,5,7,13,14,15,16,17,18,19,20,21,22,23,24,25,26,27,28,29,30].
Most recently, Courtillot et al. [10] have shown that the sunspot number ISSN, which is a proxy for solar activity, can be decomposed as a series of oscillations with periods similar to or commensurate with those of the Jovian planets [14]. They were able to reconstruct more than 90% of the variance of the original time series [10]. Similar results have been obtained for polar motion, with 90% of the variance being carried by the ephemerids of the Jovian planets [2]. Pioneering work by Milankovic [13] and more recently by Laskar et al. [17] explains how, over very long time scales, these planets influence the obliquity, precession, and eccentricity of our planet’s orbit and rotation axis, and therefore, among other consequences, its climate.
Planets exert gravitational forces (attraction) on all celestial bodies; because of its mass, the Sun is the leading attractor, exerting a force F of 3.57 × 10 kg.m.s on the Earth. However, because it is close to the solar system’s center of gravity, its contribution to the budget of angular momenta (F*Sun–Earth distance*Earth’s revolution period = 1.68 × 10 kg.m.s) is one to two orders of magnitude smaller than that of the Jovian planets. In a heliocentric reference frame, Jupiter’s angular momentum is 1.93 × 10 kg.m.s, Saturn’s is 7.82 × 10 kg.m.s, Neptune’s is 2.50 × 10 kg.m.s, and that of Uranus is 1.69 × 10 kg.m.s.
We present the data for the extent of sea ice in the Northern and Southern hemispheres (NHSI and SHSI, respectively) in Section 2, then their spectral components, using both Fourier analysis and SSA, in Section 3. We provide complementary results on polar motion and lod in Section 4, then compare the annual components of polar motion and lod with those of the sea ice extent in Section 5. Finally, we discuss a hypothesis based on these results and close with a conclusion in Section 6.
2. Available Data on the Extent of Sea Ice in Both Hemispheres
Very precise daily series of sea ice extent in the Arctic (NHSI) and Antarctic (SHSI) are available starting in 1978 ([31,32], https://nsidc.org/data/seaice_index/data-and-image-archive, accessed on 2 April 2022). The dataset from which the NHSI and SHSI sea ice areas are calculated consists of sea ice concentration maps derived from the radiance obtained from microwave radiometers on a suite of satellites. These observations began with the Nimbus 7 Scanning Multichannel Microwave Radiometer (SMMR), which operated from 1978 through 1987, followed by the Defense Meteorological Satellite Program (DMSP) series of F8, F11, F13, and F15 Special Sensor Microwave Imagers (SSMIS) and the F17 Special Sensor Microwave Imager Sounder (SSMIS). The F8 satellite operated from 1987 through 1991, the F11 from 1991 through 1995, the F13 from 1995 through 2007, and the F17 from 2008 through 2010 [31,33,34,35]. After 2010 and up to 2018, we refer to [36], quoting [34,35].
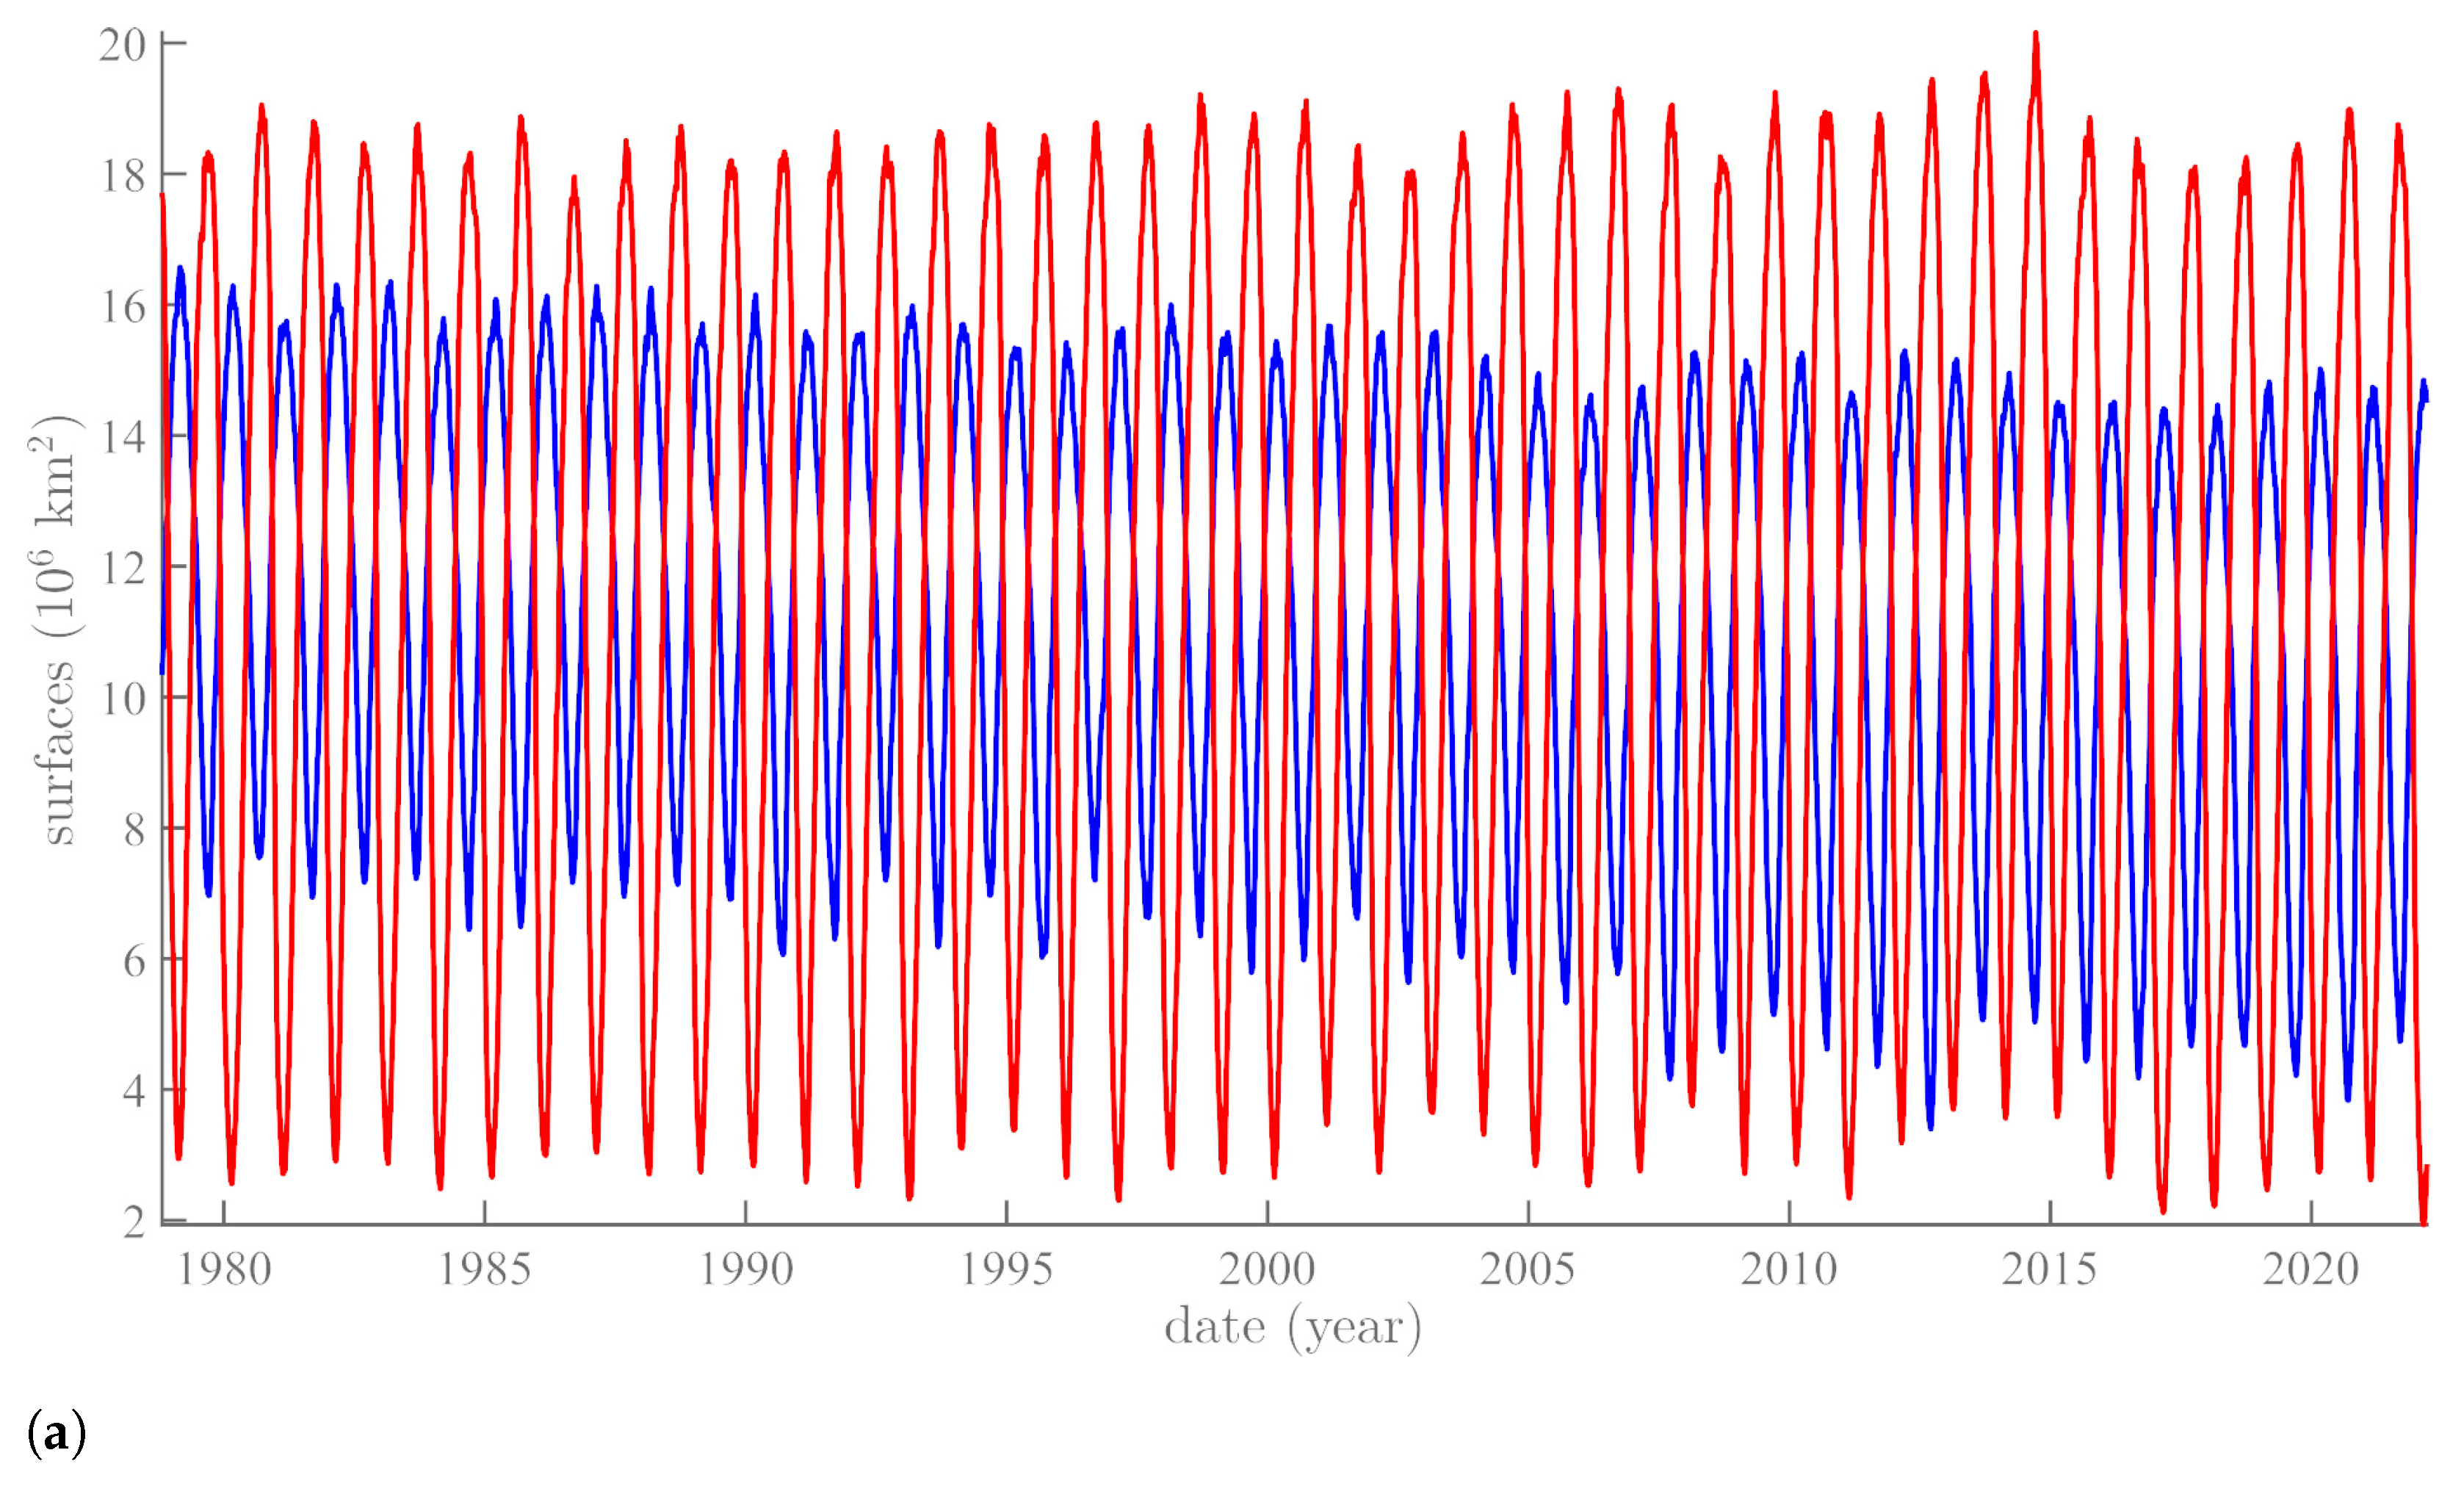
The dataset is generated using the Advanced Microwave Scanning Radiometer—Earth Observing System (AMSR-E) Bootstrap Algorithm with tie-points varying daily. Daily (every other day prior to July 1987) and monthly data are available for both the north and south polar regions. Data are gridded on the SSM/I polar stereographic grid (25 × 25 km) and provided in two-byte integer format. The sampling from 26 October 1978 to 2 December 1987 is not as continuous as afterwards; there is only one datum every other day from 26 October 1978 to 20 August1987, one per day from 20 August 1987 to 2 December 1987, then a gap from 2 December 1987 and 13 January 1988, back to one point per day from 13 January 1988 to 19 February 2022, a two day gap from 19 February 2022 to 22 February 2022, and finally full sampling (one per day) until 21 March 2022. We worked with the dataset as described above, starting in 26 October 1978 and ending in 21 March 2022 (see https://nsidc.org/data/G02135/versions/3 for more details, accessed on 2 April 2022). The data are shown in Figure 1a, with NHSI in blue and SHSI in red.


Figure 1.
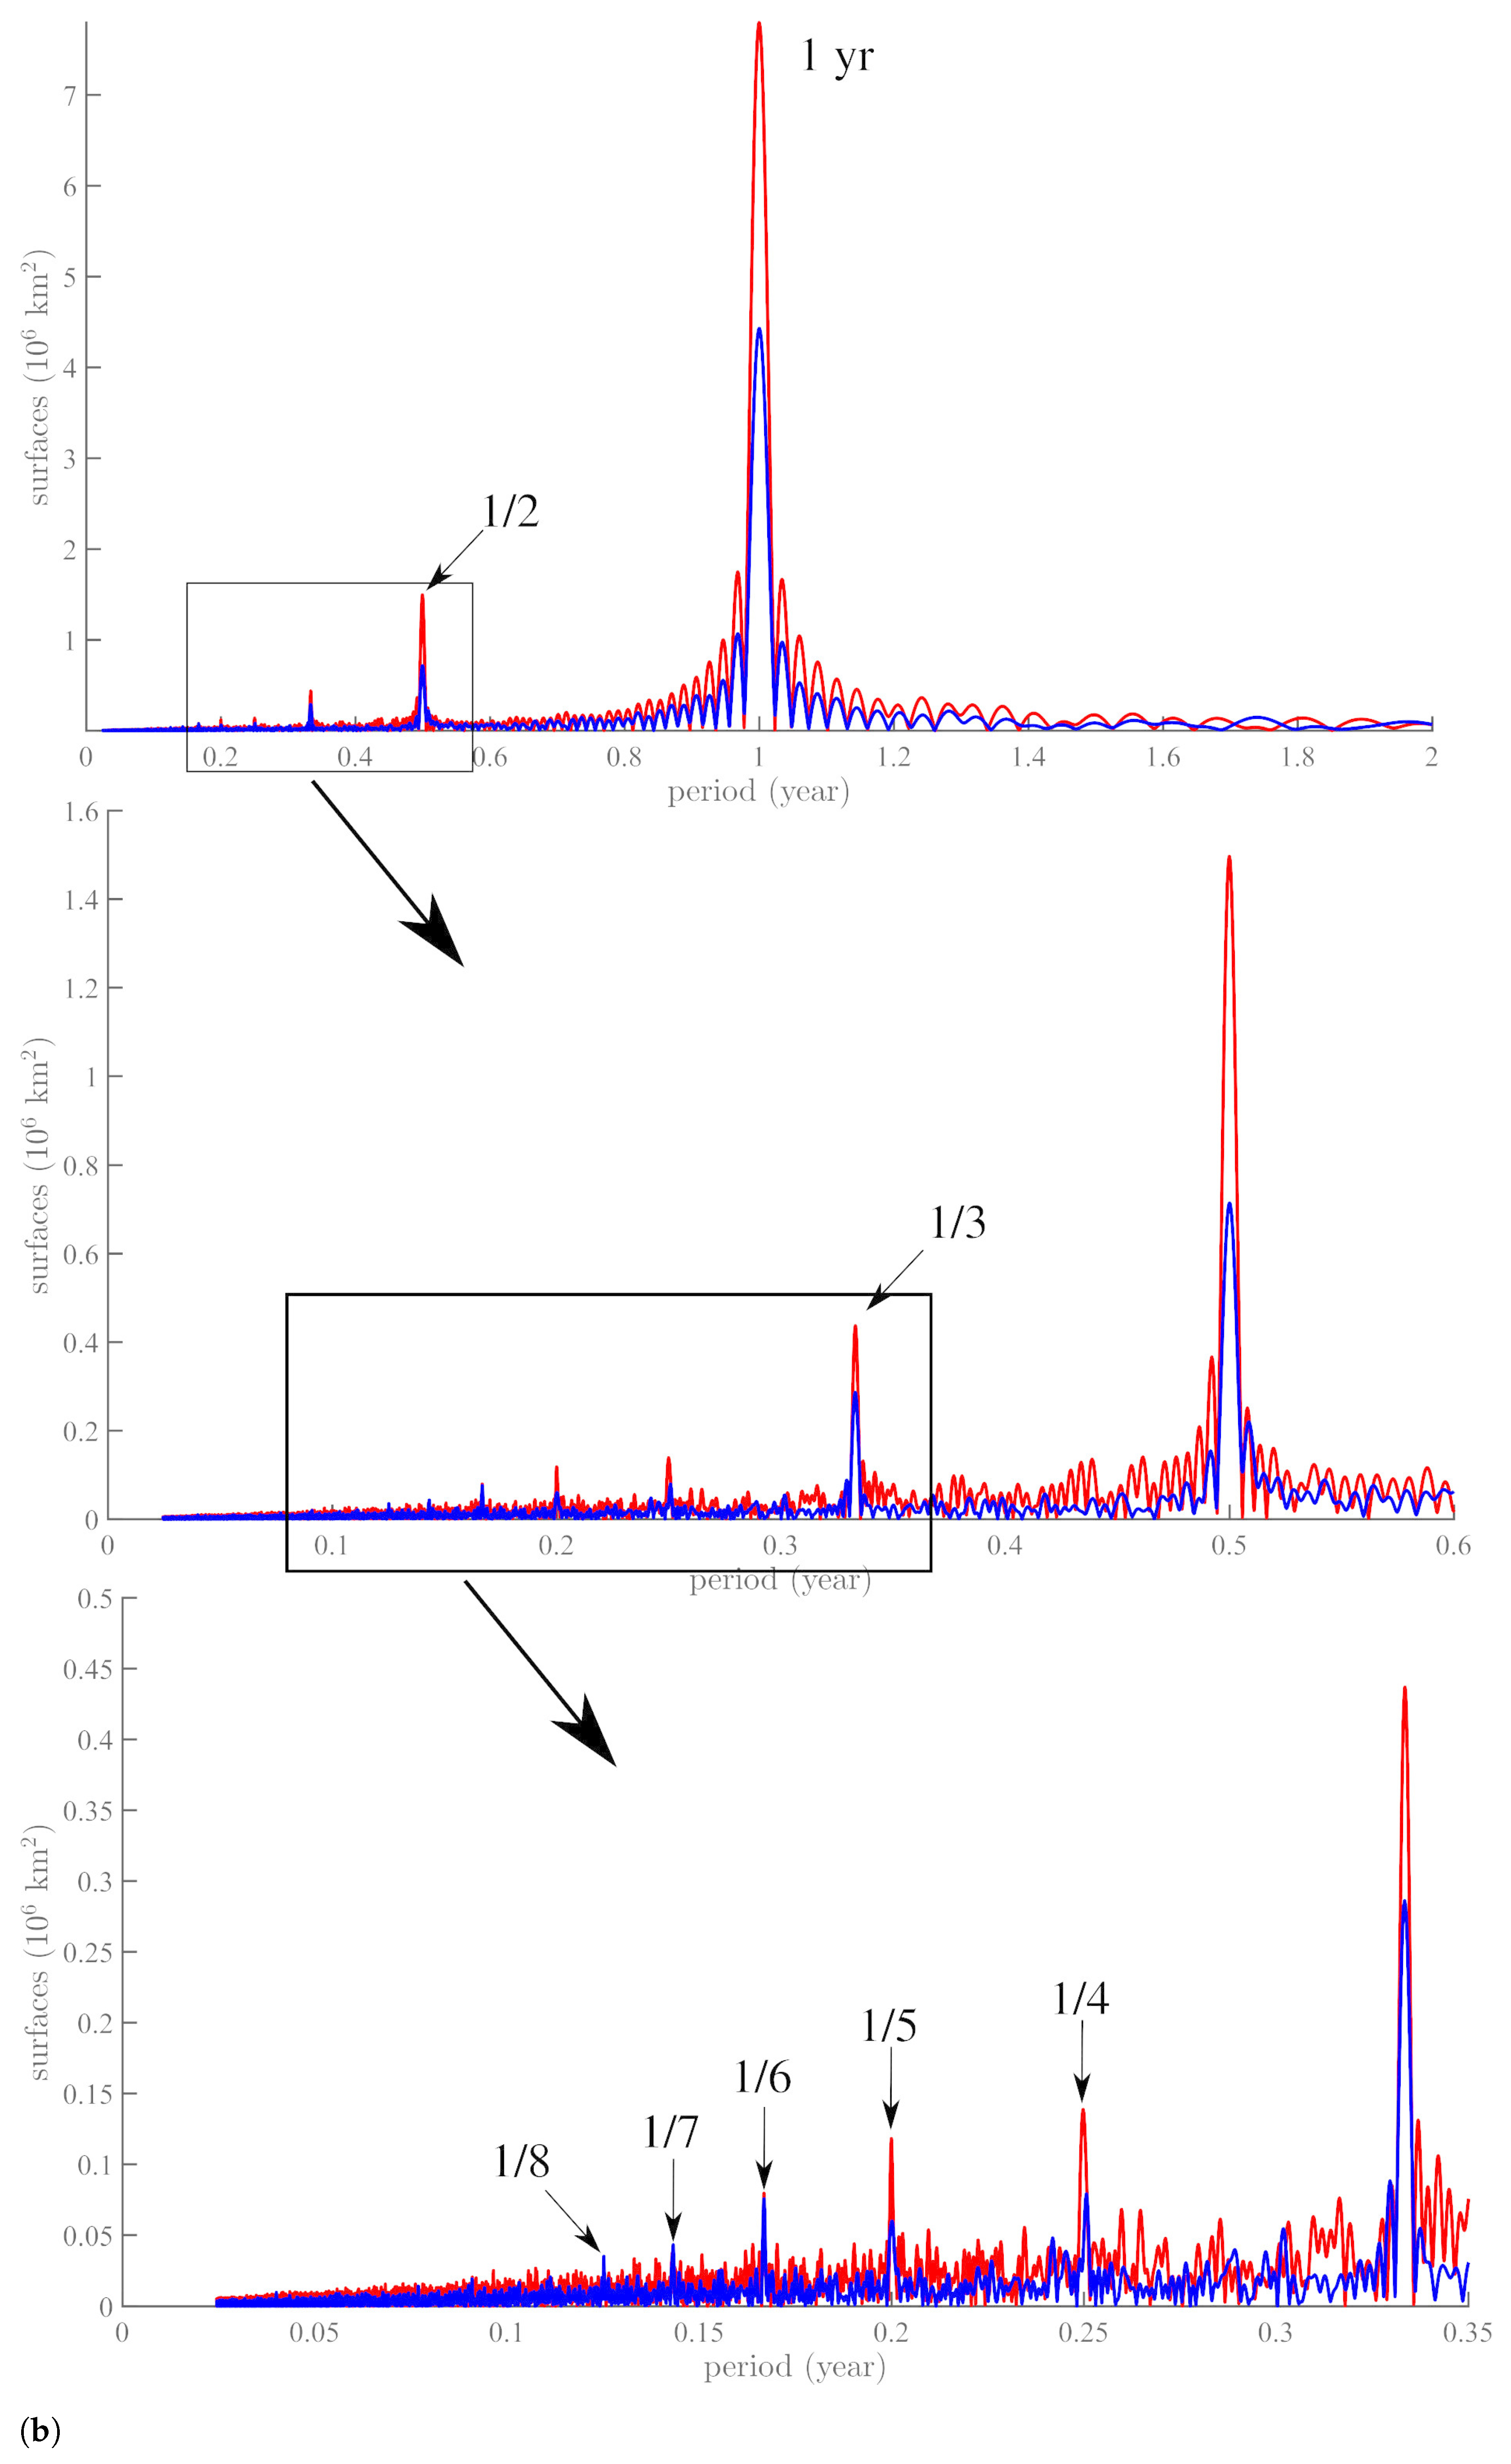
Temporal evolution of SHSI (red) and NHSI (blue): (a) raw southern hemisphere (SHSI, red) and northern hemisphere (NHSI, blue) sea-ice data and (b) Fourier spectra of the SHSI (red) and NHSI (blue) series in Figure 1a.
A number of features are immediately apparent from this figure: annual variations are dominant, their amplitude in the Antarctic is double that in the Arctic, and they are in phase opposition and modulated, with a flat trend for SHSI, a decreasing trend for NHSI, and a sub-decadal modulation of the envelopes of both. Figure 1b shows the Fourier spectra of the two series with successive enlargements; it can be seen that a fundamental annual period is accompanied by seven harmonics ranging from 1/2 to 1/8 of a year.
3. SSA Analysis of NHSI and SHSI Data on Sea Ice Extent
As in a number of previous papers (e.g., [2,5,10]), we have submitted time series to iterative Singular Spectrum Analysis (iSSA), and now do the same for the sea ice extent. We refer the reader to these papers and to the Golyandina and Zhigljavsky’s book [37] for the SSA method, to [38] for the properties of the Hankel and Toeplitz matrices that it uses, and to [39] for the singular value decomposition algorithm SVD).
Let us begin by considering a discrete (non-zero) time series () of length N (N > 2):
Step 1: Embedding Step
is divided into K segments of length segments of length L in order to build a matrix with dimensions , where conditions our decomposition. This is the first “tuning knob”. Integrating yields a Hankel matrix
Embedding, which is the first step in an SSA, consists of projecting a one-dimensional time series in a multidimensional space of series such that vectors belong to , where . The parameter that controls the embedding is L, the size of the window used for analysis, which is an integer between 2 and . The Hankel matrix has a number of properties with regard to symmetry; the dimension of its transpose , called the trajectory matrix, is K. Embedding is a compulsory step in the analysis of nonlinear series. Formally, it consists of the empirical evaluation of all pairs of distances between two offset vectors, which are delayed (lagged) in order to calculate the correlation dimension of the series.
Step 2: Decomposition in Singular Values (SVD)
SVD of a non-zero trajectory matrix X with dimensions takes the shape
where the eigenvalues () of matrix are arranged in order of decreasing amplitude. Eigenvectors and are provided by
Here, the form an orthonormal basis and are arranged in the same order as the . Let be a part of matrix such that
Embedding matrix X can then be represented as a simple linear sum of elementary matrices X. If all eigenvalues are equal to 1, then decomposition of X into a sum of unitary matrices is as follows:
As d is the rank of X (), SVD allows us to write X as a sum of d unitary matrices defined in a univocal way.
We now discuss the nature and characteristics of the embedding matrix. Its rows and columns are subseries of the original time series (or signal). The eigenvectors and have a time structure, and can be considered as a representation of temporal data. Let X be a suite of L lagged parts (X and ,…, ) of the linear basis of its eigenvectors. If we let
with , then relation (4) can be written as
that is, for the jth elementary matrix,
where is a component of vector Z. This means that vector Z is composed of the ith components of vector X. In the same way, if we let
then for the transposed trajectory matrix we obtain
which corresponds to a representation of the lagged vectors in the orthogonal basis (,…,). It is apparent why SVD is a very good choice for the analysis of the embedding matrix, because it provides two different geometrical descriptions.
Step 3: Reconstruction
As we have seen, matrices are unit matrices, and we can “re-group” these matrices into a physically homogeneous quantity. This is the second “tuning knob” of SSA. In order to regroup the unit matrices, we first divide the set of indices {i,…,i} into m disjoint subsets of indices .
Let I be the grouping of p indices of ; because (5) is linear, the resulting matrix X that regroups indices I can then be written as
This step is called regrouping the eigentriplets (, U and V). In the limit case , (11) becomes exactly (5), and we again find the unit matrices.
Next, we need to associate pairs of eigentriplets. This means separating the additive components of a time series. First, we must consider the concept of separability.
Let be the sum of two time series and such that for any . Let L be the analyzing window (with fixed length), and let X, X, and X be the respective embedding matrices of series , , and . These two subseries are separable (even weakly) in Equation (5) if there is a collection of indices such that , respectively, if there is a collection of indices such that .
In a case in which separability exists, the contribution of (for instance) corresponds to the ratio of the associated eigenvalues () to the total eigenvalues ().
Thus, regrouping SVD components can be summarized by their decomposition into several elementary matrices, the structure of which must be as close as possible to a Hankel matrix of the initial trajectory matrix (this is true on paper; however, in reality things are much more difficult).
Step 4: The Diagonal Mean (or Hankelization) Step
The final step involved returning to the data space in order to calculate time series with length N associated with submatrices . Let Y be a matrix with dimension ; then, for each element we have and . Let be the minimum and be the maximum; in addition, one always has . Finally, let . The diagonal average applied to the kth index of time series y associated with matrix Y provides us with
Relation (12) corresponds to the mean of the element on the anti-diagonal of the matrix, while for , , for ,, etc.
As mentioned above, Step 3 is the most difficult part. Here, we have chosen the iterative SSA (iSSA) approach from among many others. Because relation (5) is linear, we can iterate the decomposition. We start with a small value of L (looking for the longest period), which we then increase until we obtain a quasi-Hankel matrix (Steps 1 and 2). We then extract the corresponding lowest-frequency component that was subtracted from the original signal. We again increase the value of L to find the next component (shortest period). The algorithm stops when no pseudo-cycle can be detected or extracted. In this way, we scan the series from low frequencies to high.
We next apply SSA in order to determine the waveforms (amplitude and phase) of the periodic or quasi-periodic components of the sea ice extent series. As seen in Figure 1, the series are dominated by the modulation of a quasi-monochromatic cycle.
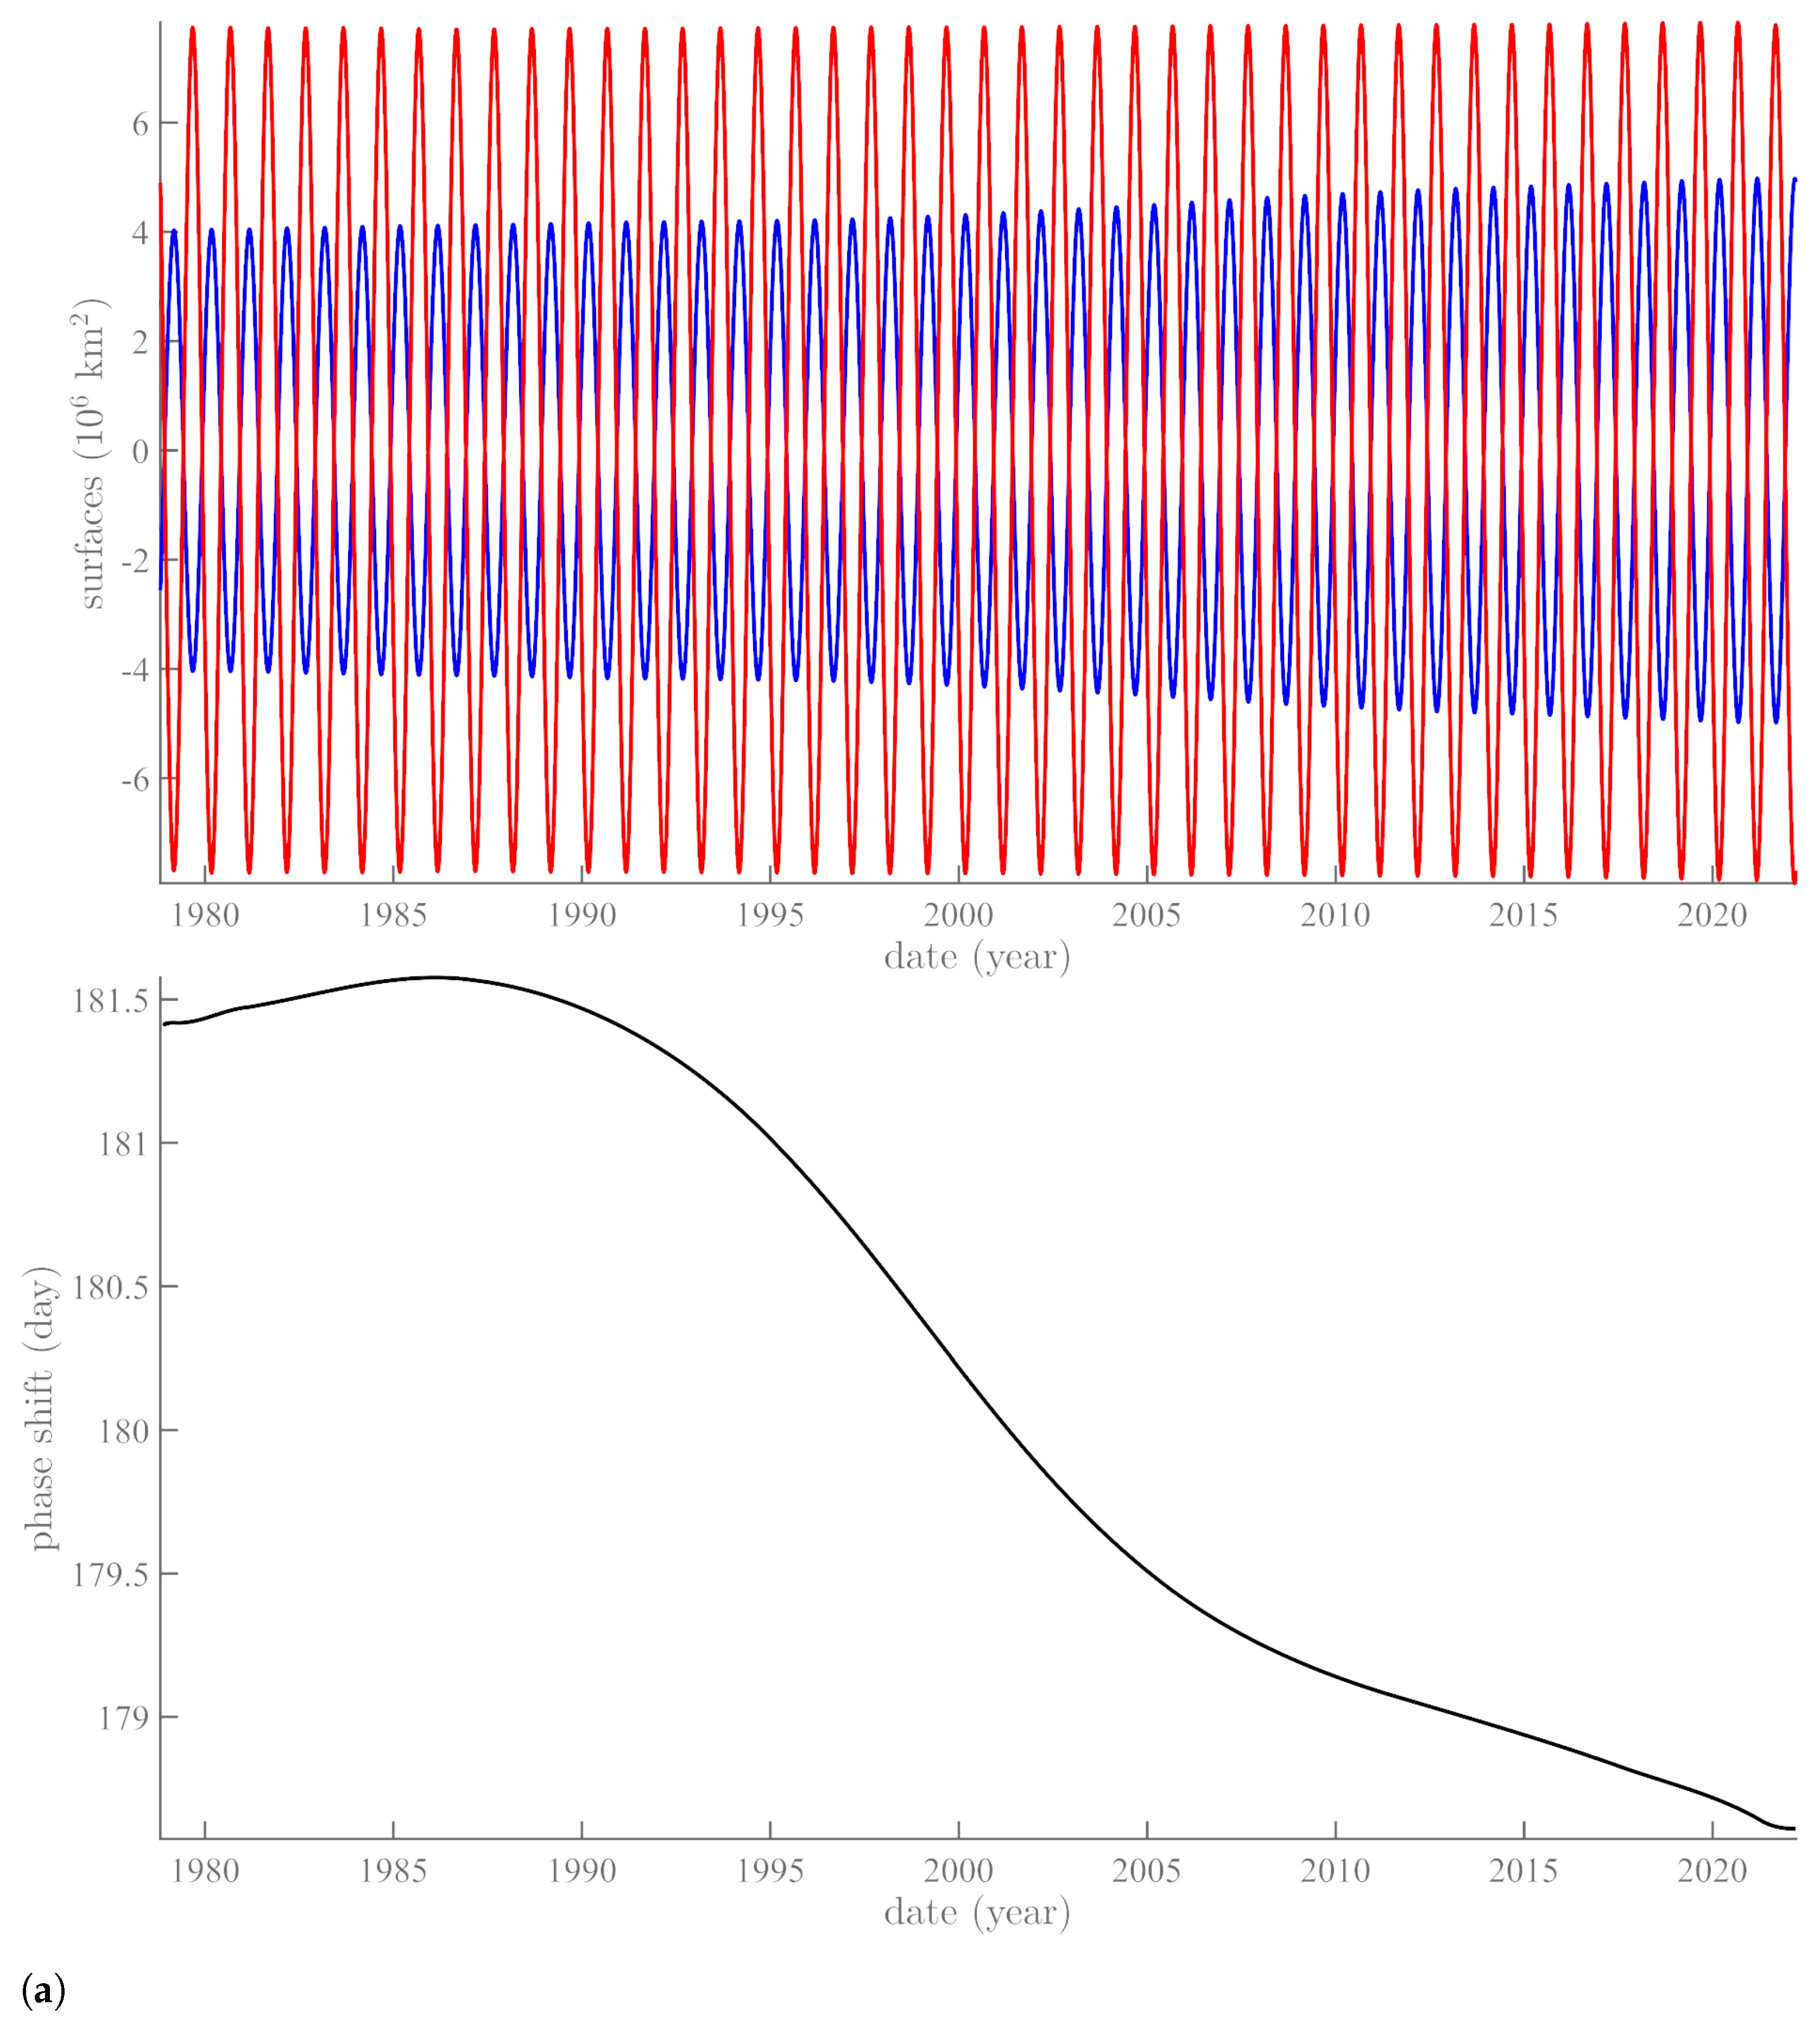
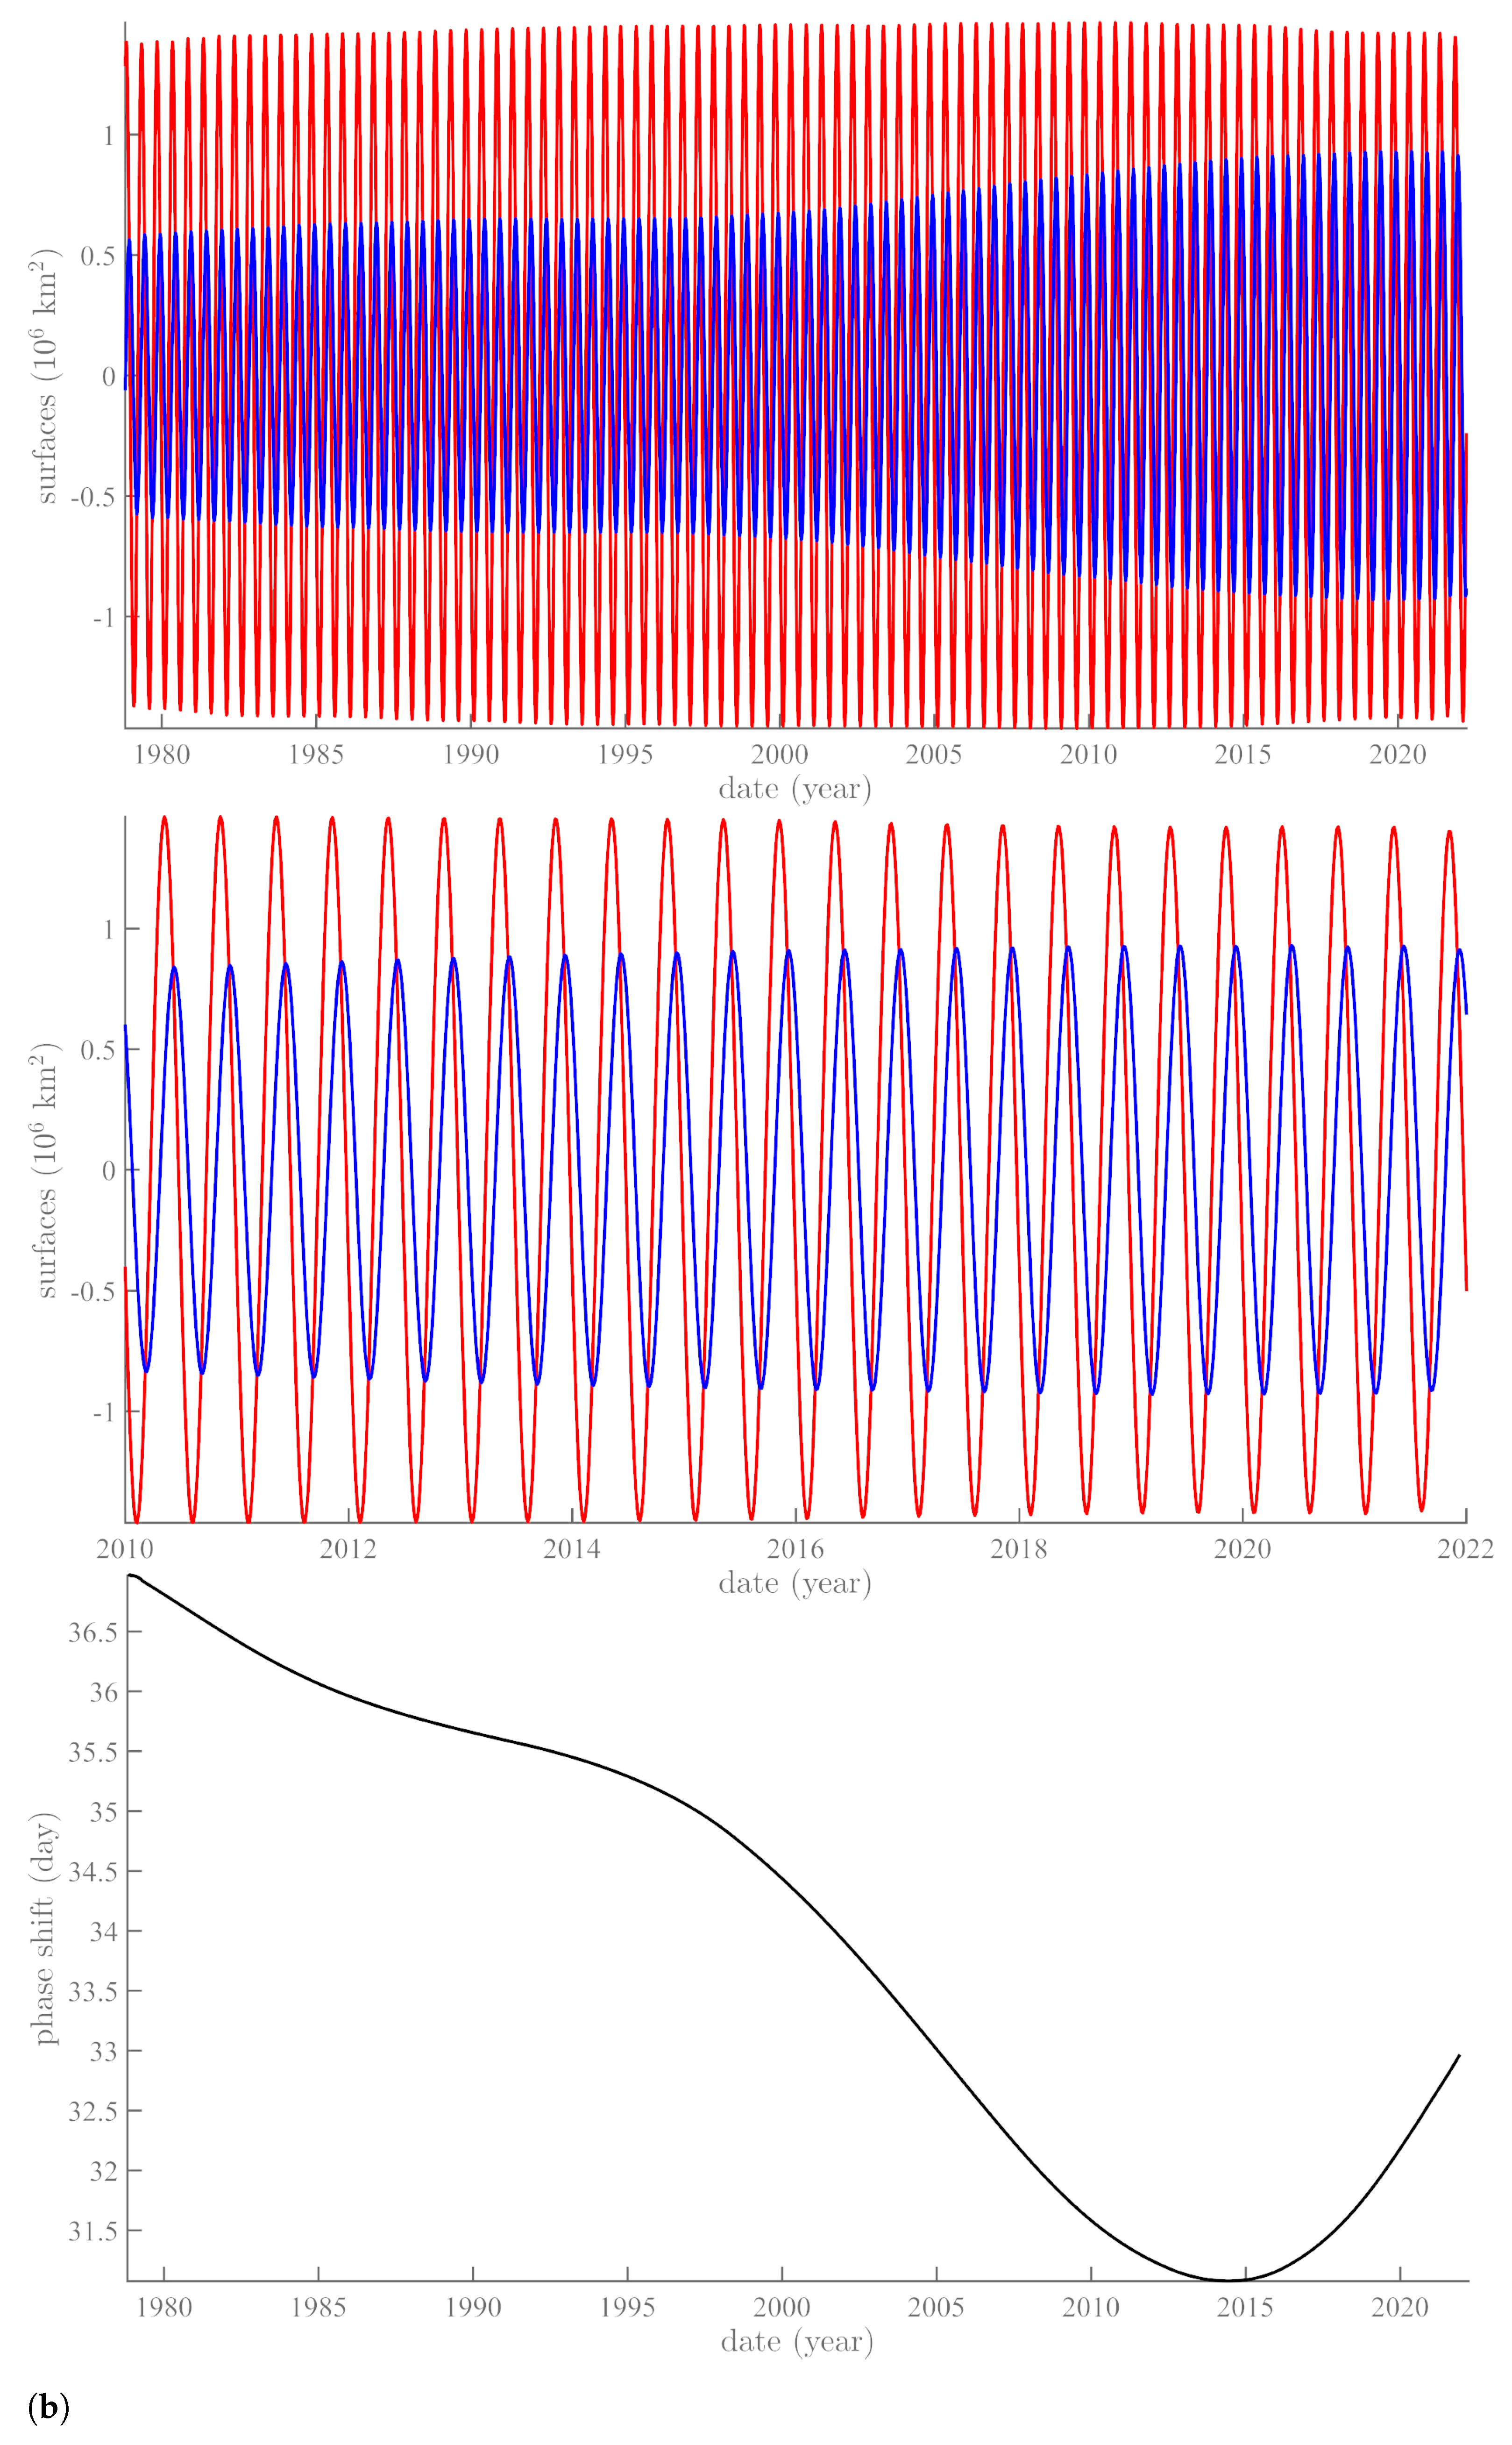
For NHSI, the first three components allow for recovery of 98.7% of the total signal variance. They occur at periods of 1.000 ± 0.014 yr (95.6% of the variance), 0.499 ± 0.003 yr (2.69%), and 0.333 ± 0.001 yr (0.43%). For SHSI, the first three components permit recovery of 97.9% of the total signal variance, occurring at periods of 0.999 ± 0.014 yr (94.4%), 0.500 ± 0.004 yr (3.25%), and 0.333 ± 0.001 yr (0.25%). The remaining components have negligible contributions. In the following, we focus on the annual and semi-annual components, which are respectively displayed in Figure 2a,b.

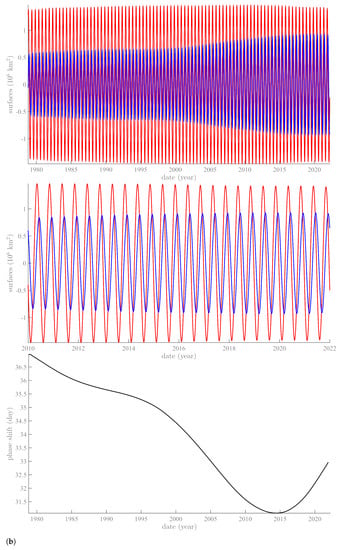
Figure 2.
Annual and semi-annual components extracted from SHSI (red) and NHSI (blue): (a) SSA annual component of SHSI (red) and NHSI (blue) from 1978 to 2022 (top) and their phase difference (bottom, in days); (b) SSA semi-annual component of SHSI (red) and NHSI (blue) from 1978 to 2022 (top), an enlargement of the period from 2010 to 2022 (middle), and their phase difference (bottom, in days).
The annual Antarctic sea ice component is only slightly modulated on a multi-decadal time scale, whereas the annual Arctic component is modulated, with significant growth. The two are in phase opposition (180 ± 1 day), as expected. For the semi-annual components, the phase difference is 34 ± 2 days, which is close to quadrature (90/2 days).
The trends are quasi-linear (not shown in the figures), decreasing for NHSI (by 58.300 km/yr) and increasing for SHSI (by 15.400 km/yr). The total surface change since 1978 is a gain of 0.57 × 10 km for the Antarctic and a loss of 2.15 × 10 km for the Arctic. These values are in good agreement with [36]; note that they are respectively 21 (Antarctic) and 4 (Arctic) times less than the amplitudes of the annual SSA components.
4. Complementary Results for Polar Motion and Length of Day
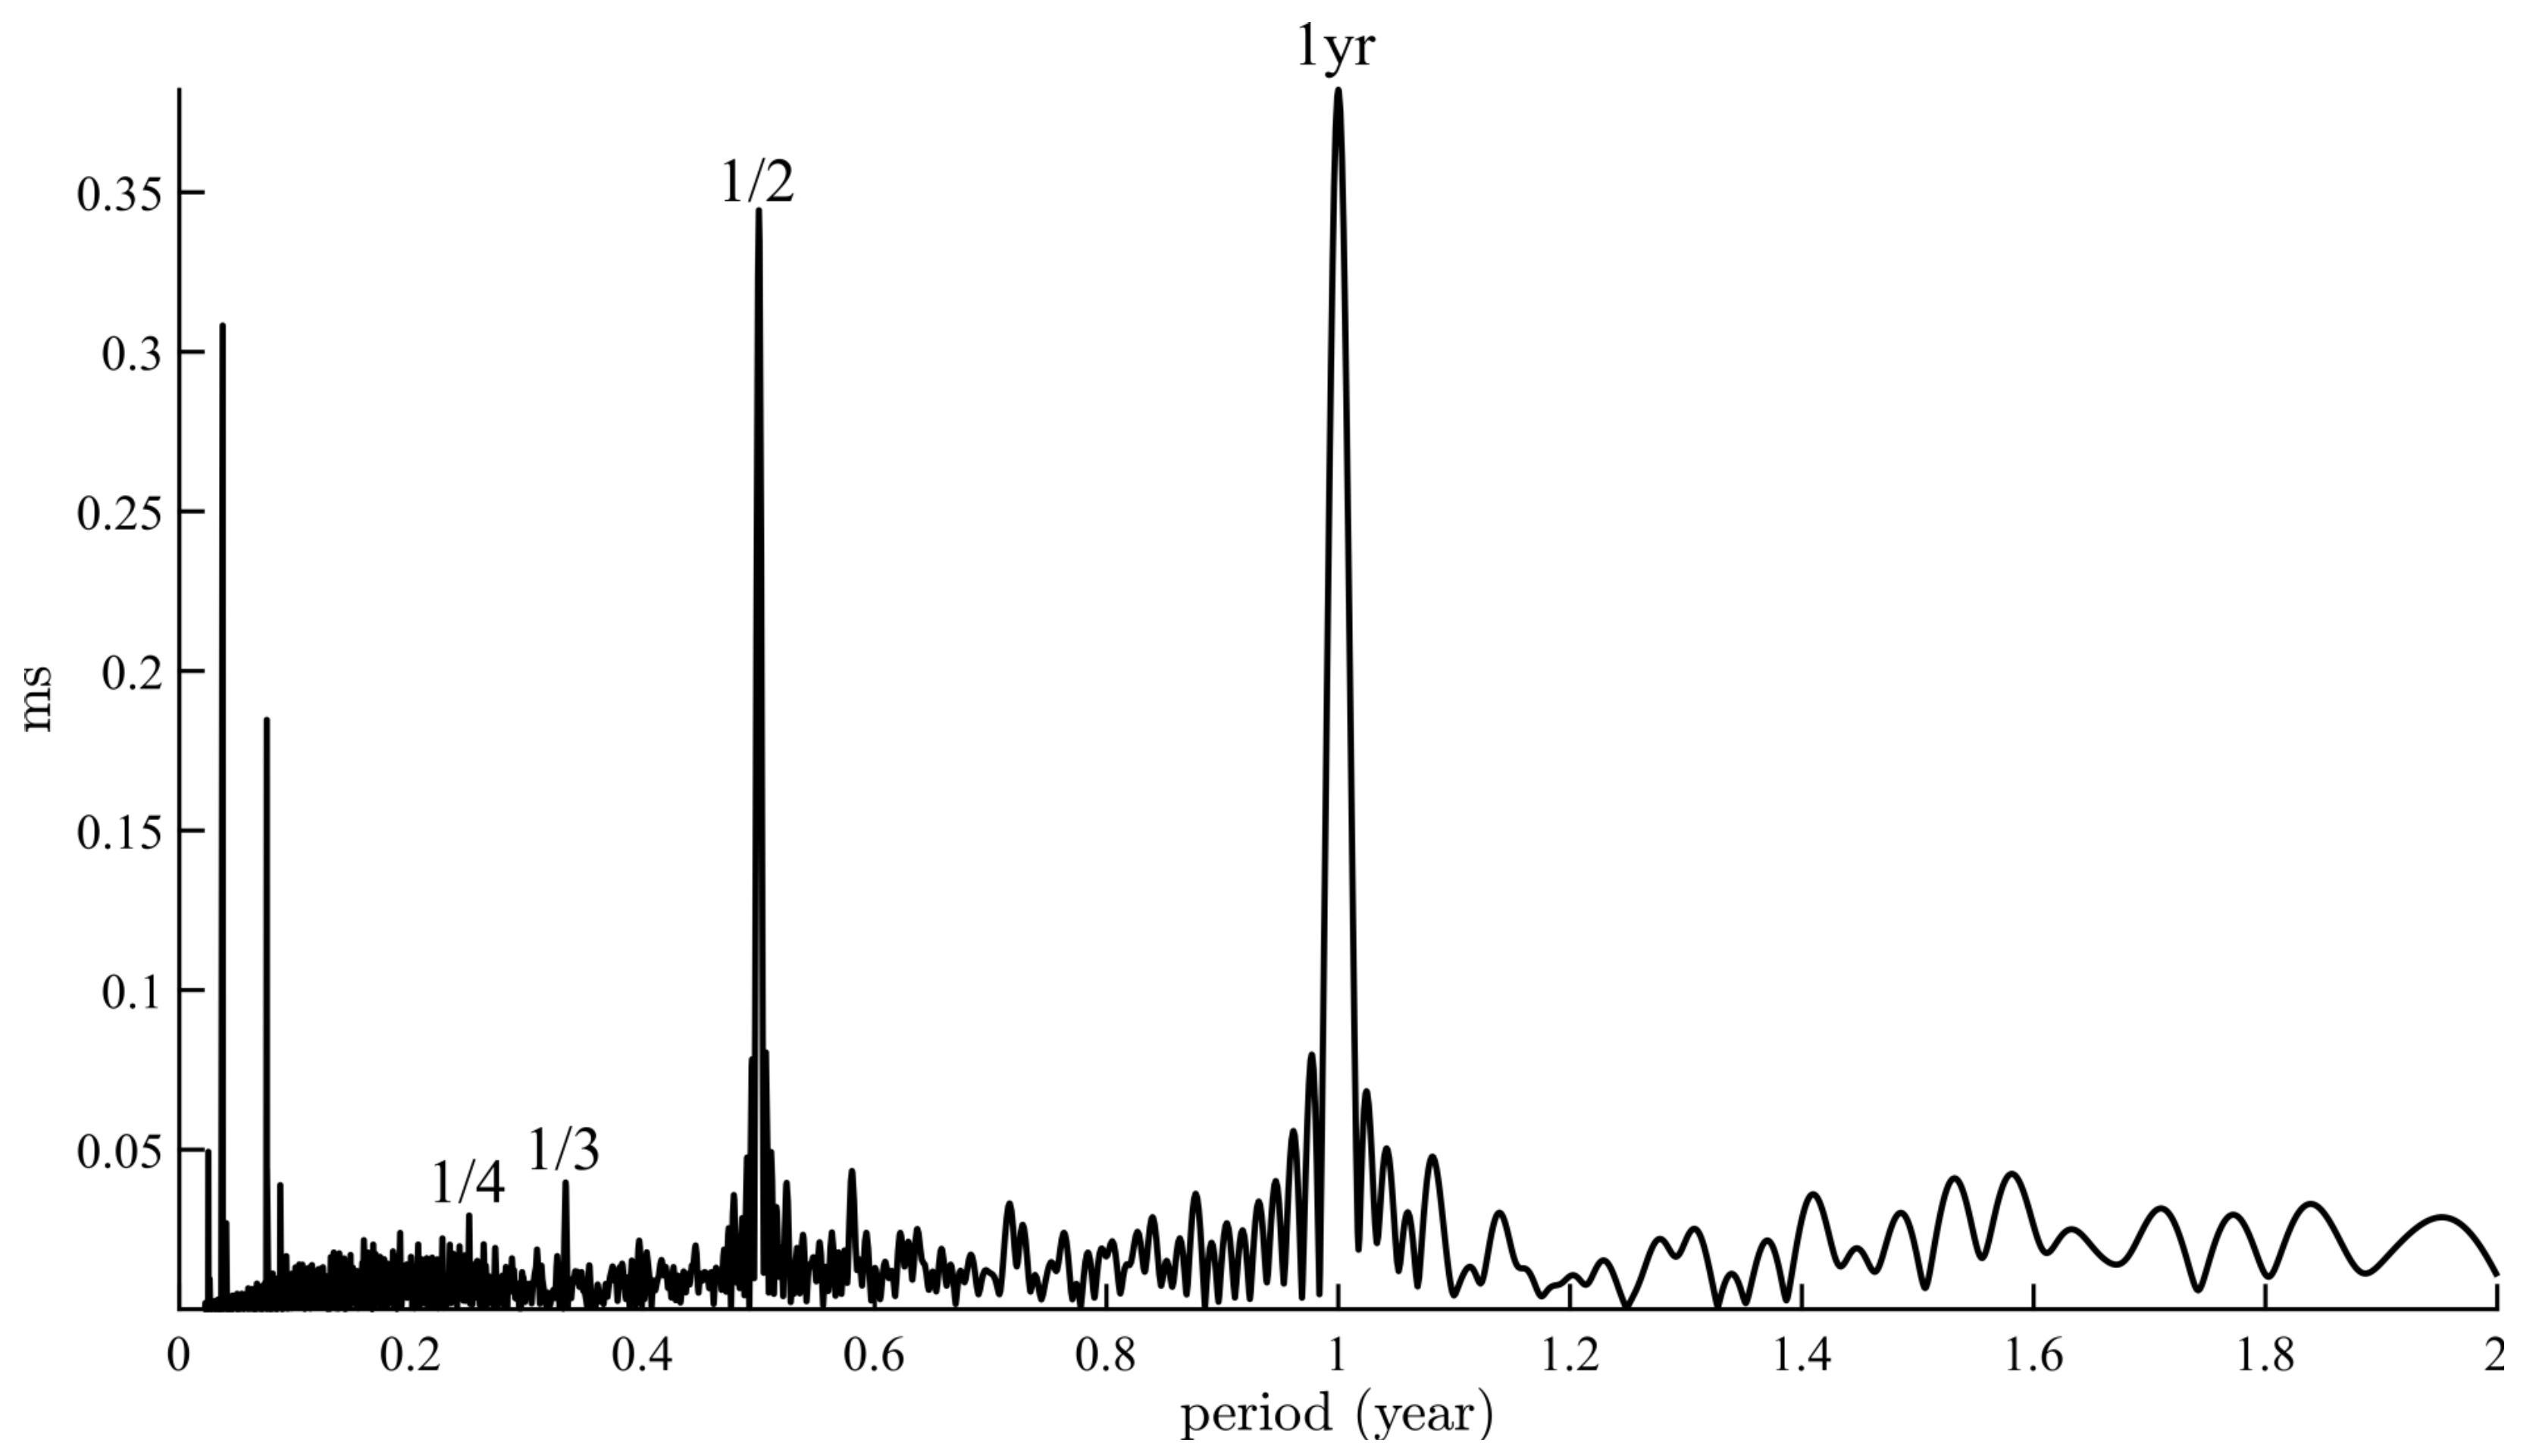
The orientation of the Earth’s rotation axis is a key variable on many time scales that modulates the insolation of any location on the Earth’s surface. It is therefore interesting to compare the spectral components of sea ice extent with the variations in polar motion (PM) and length of day (lod). These data are available from the website of the International Celestial Reference System (IERS, https://www.iers.org/IERS/EN/DataProducts/EarthOrientationData/eop.html, accessed on 2 April 2022), from which we have selected File EOP14C04. Several authors have studied the spectral content of the lod. In Le Mouël et al. [1], we used SSA to explore the range from 9.13 days to 18.6 years. Longer periods (at 18.6 yrs and 11 yrs) as well as certain harmonics, along with shorter periods at 27 days and associated harmonics, are linked to the Sun and Moon, and are discussed elsewhere [1]. In this paper, we focus on the range below 2 years (Figure 3, Fourier spectrum). Distinct peaks can be seen at 1 and 1/2 yr, as well as at 1/3 and 1/4 yr. The leading two terms amount to 13.25% and 11.06% of the total lod variance, respectively, for a total of 24.3%.
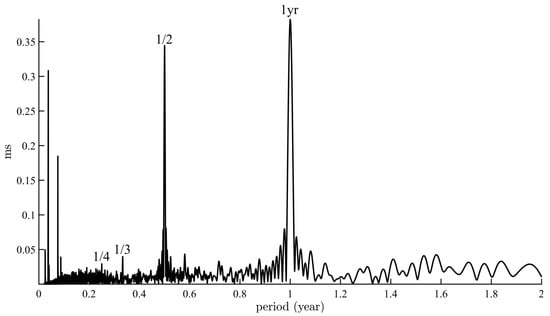
Figure 3.
Fourier spectrum of the lod time series (1962–2021).
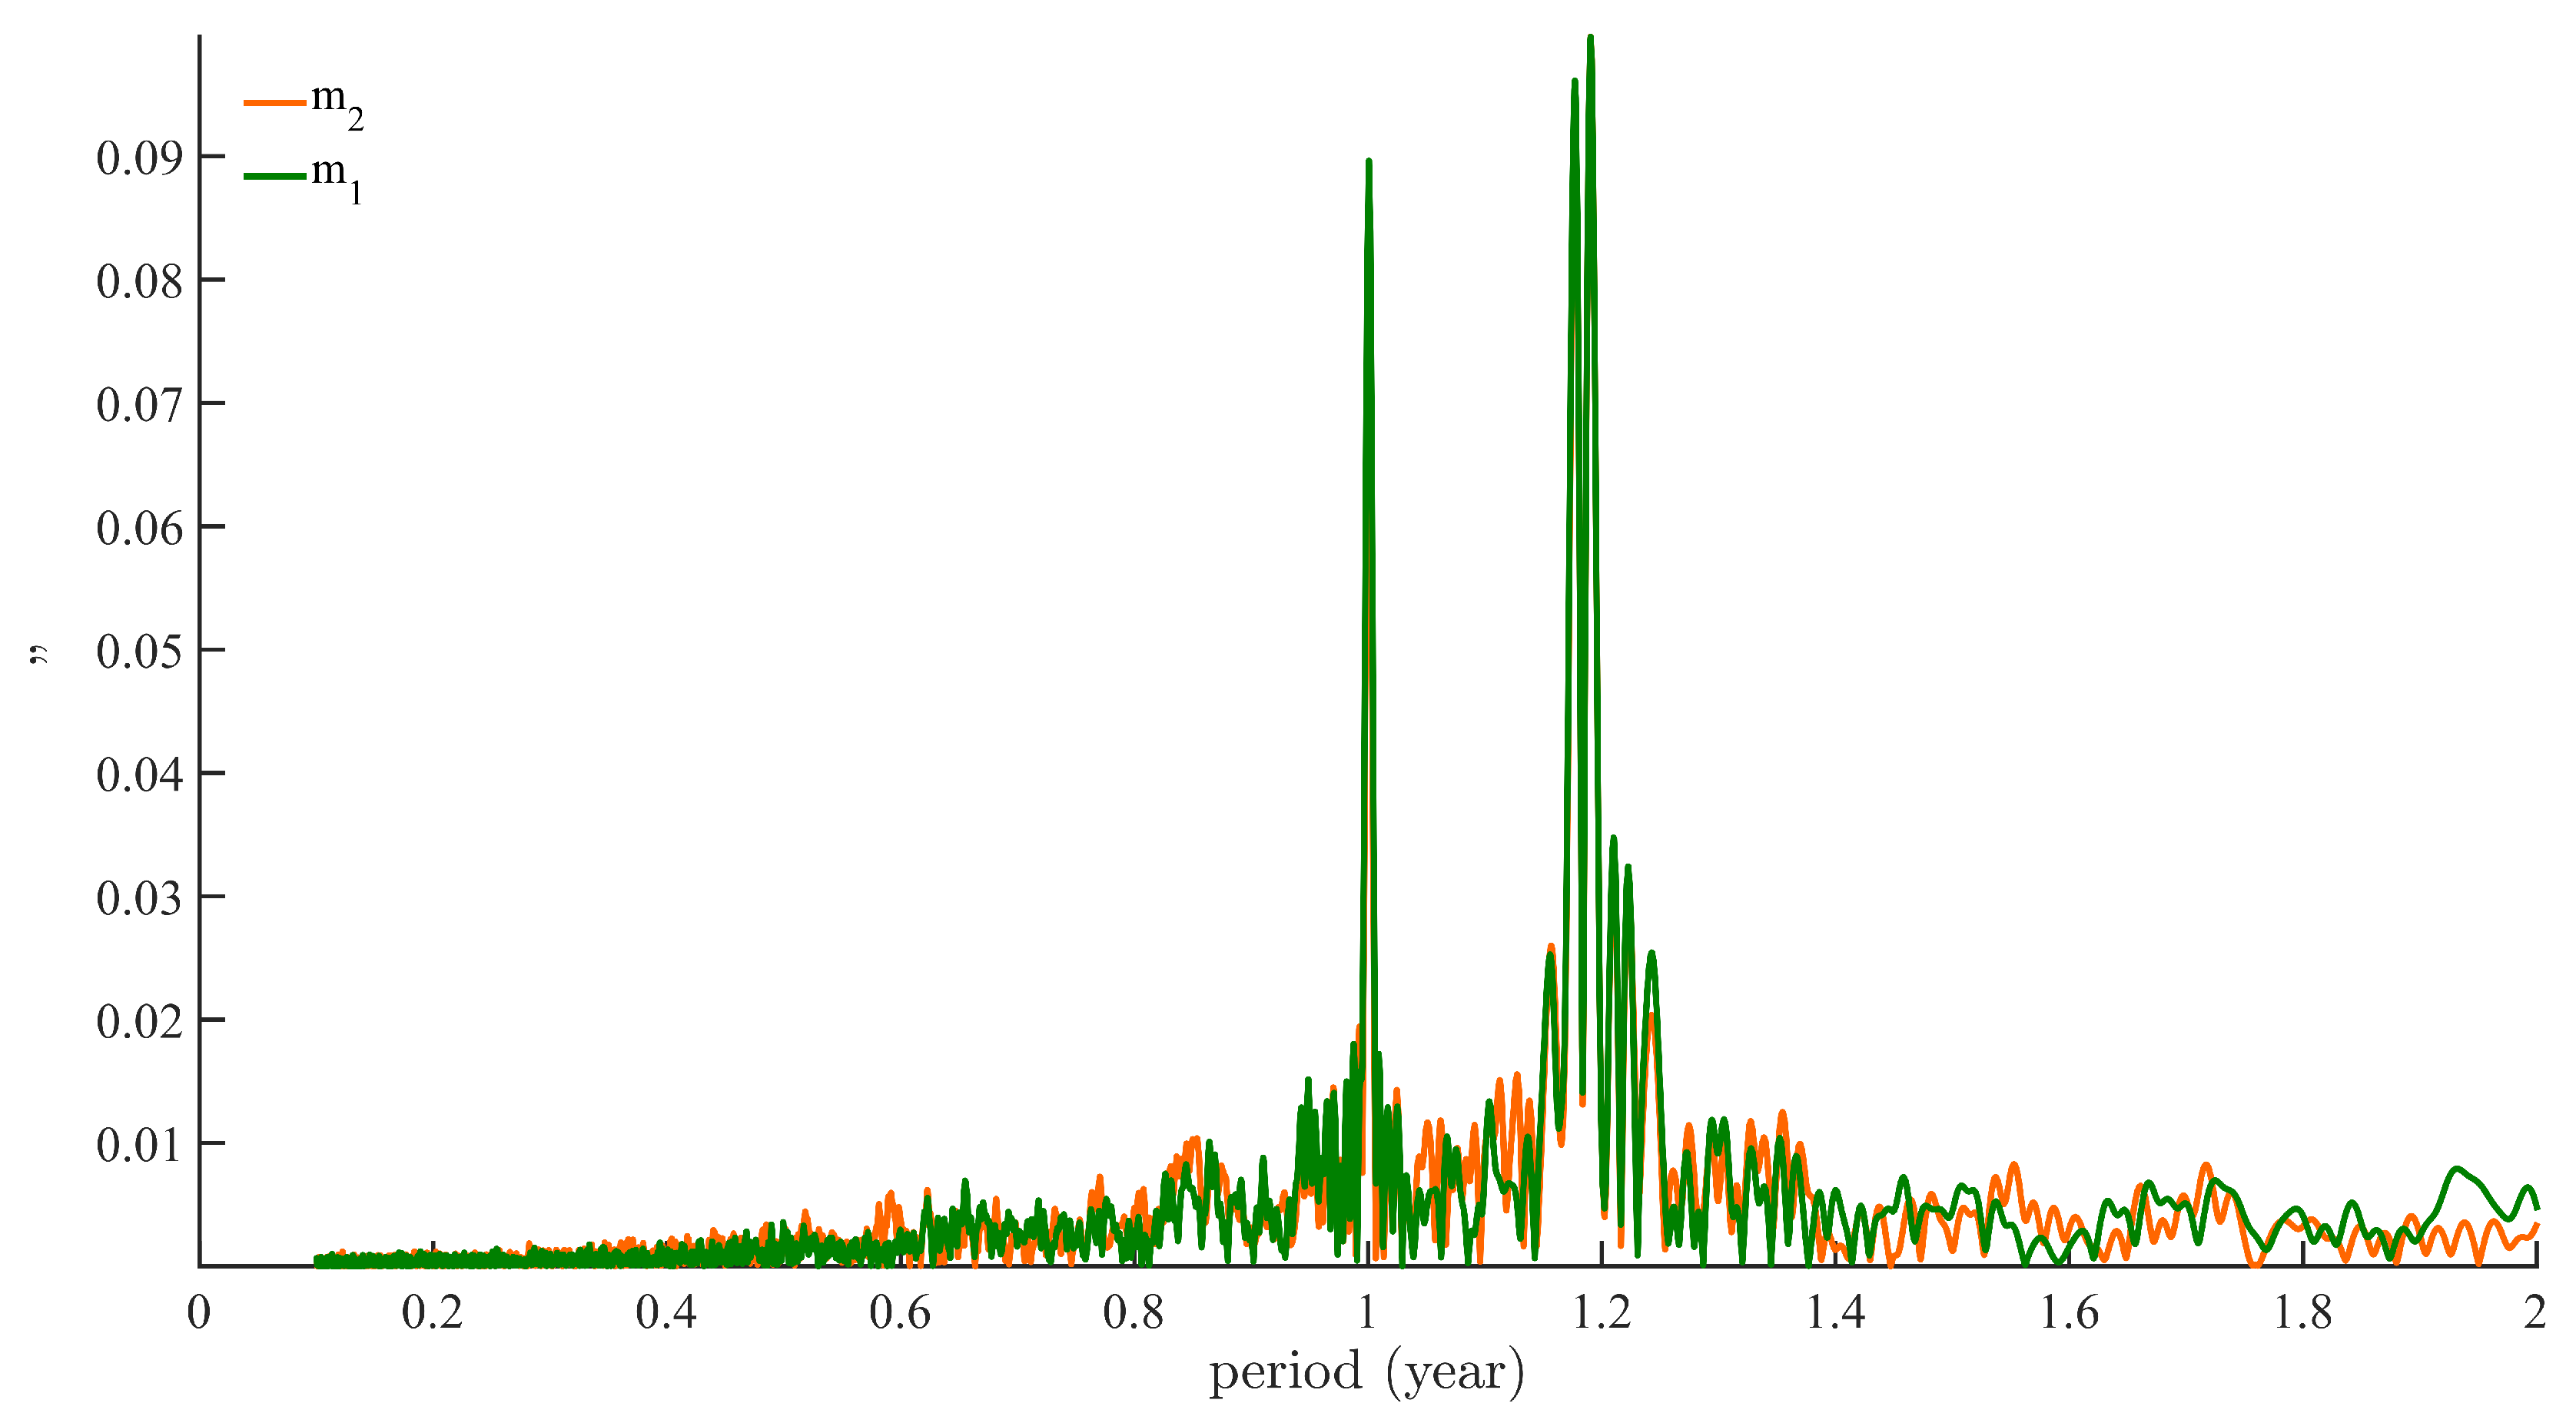
We now turn to the time series (1978–2022) of coordinates of the pole of rotation (, ; see [2]). The Fourier analysis of the modulus m (hereafter PM, for polar motion) is shown in Figure 4. The spectrum features only two sharp peaks at 1 yr and 1.2 yr. Components with decadal to ∼80 yr (Gleissberg cycle) periods are present, though out of the picture, as is the trend known as the Markowitz drift [40,41,42]. The 1/3 yr and higher harmonics seen in NHSI, SHSI, and lod are not found in PM The ∼1.2 yr component is actually a doublet at 1.19 ± 0.00(4) and 1.20 ± 0.00(4) yr, known as the Chandler wobble [43,44]. These three components, Markowitz, Chandler and annual, respectively amount to 7.5, 40.4, and 19.8% of the signal variance, for a total of 67.7% [2].

Figure 4.
Fourier spectrum of the coordinates of the rotation pole (, ) time series (1978–2022).
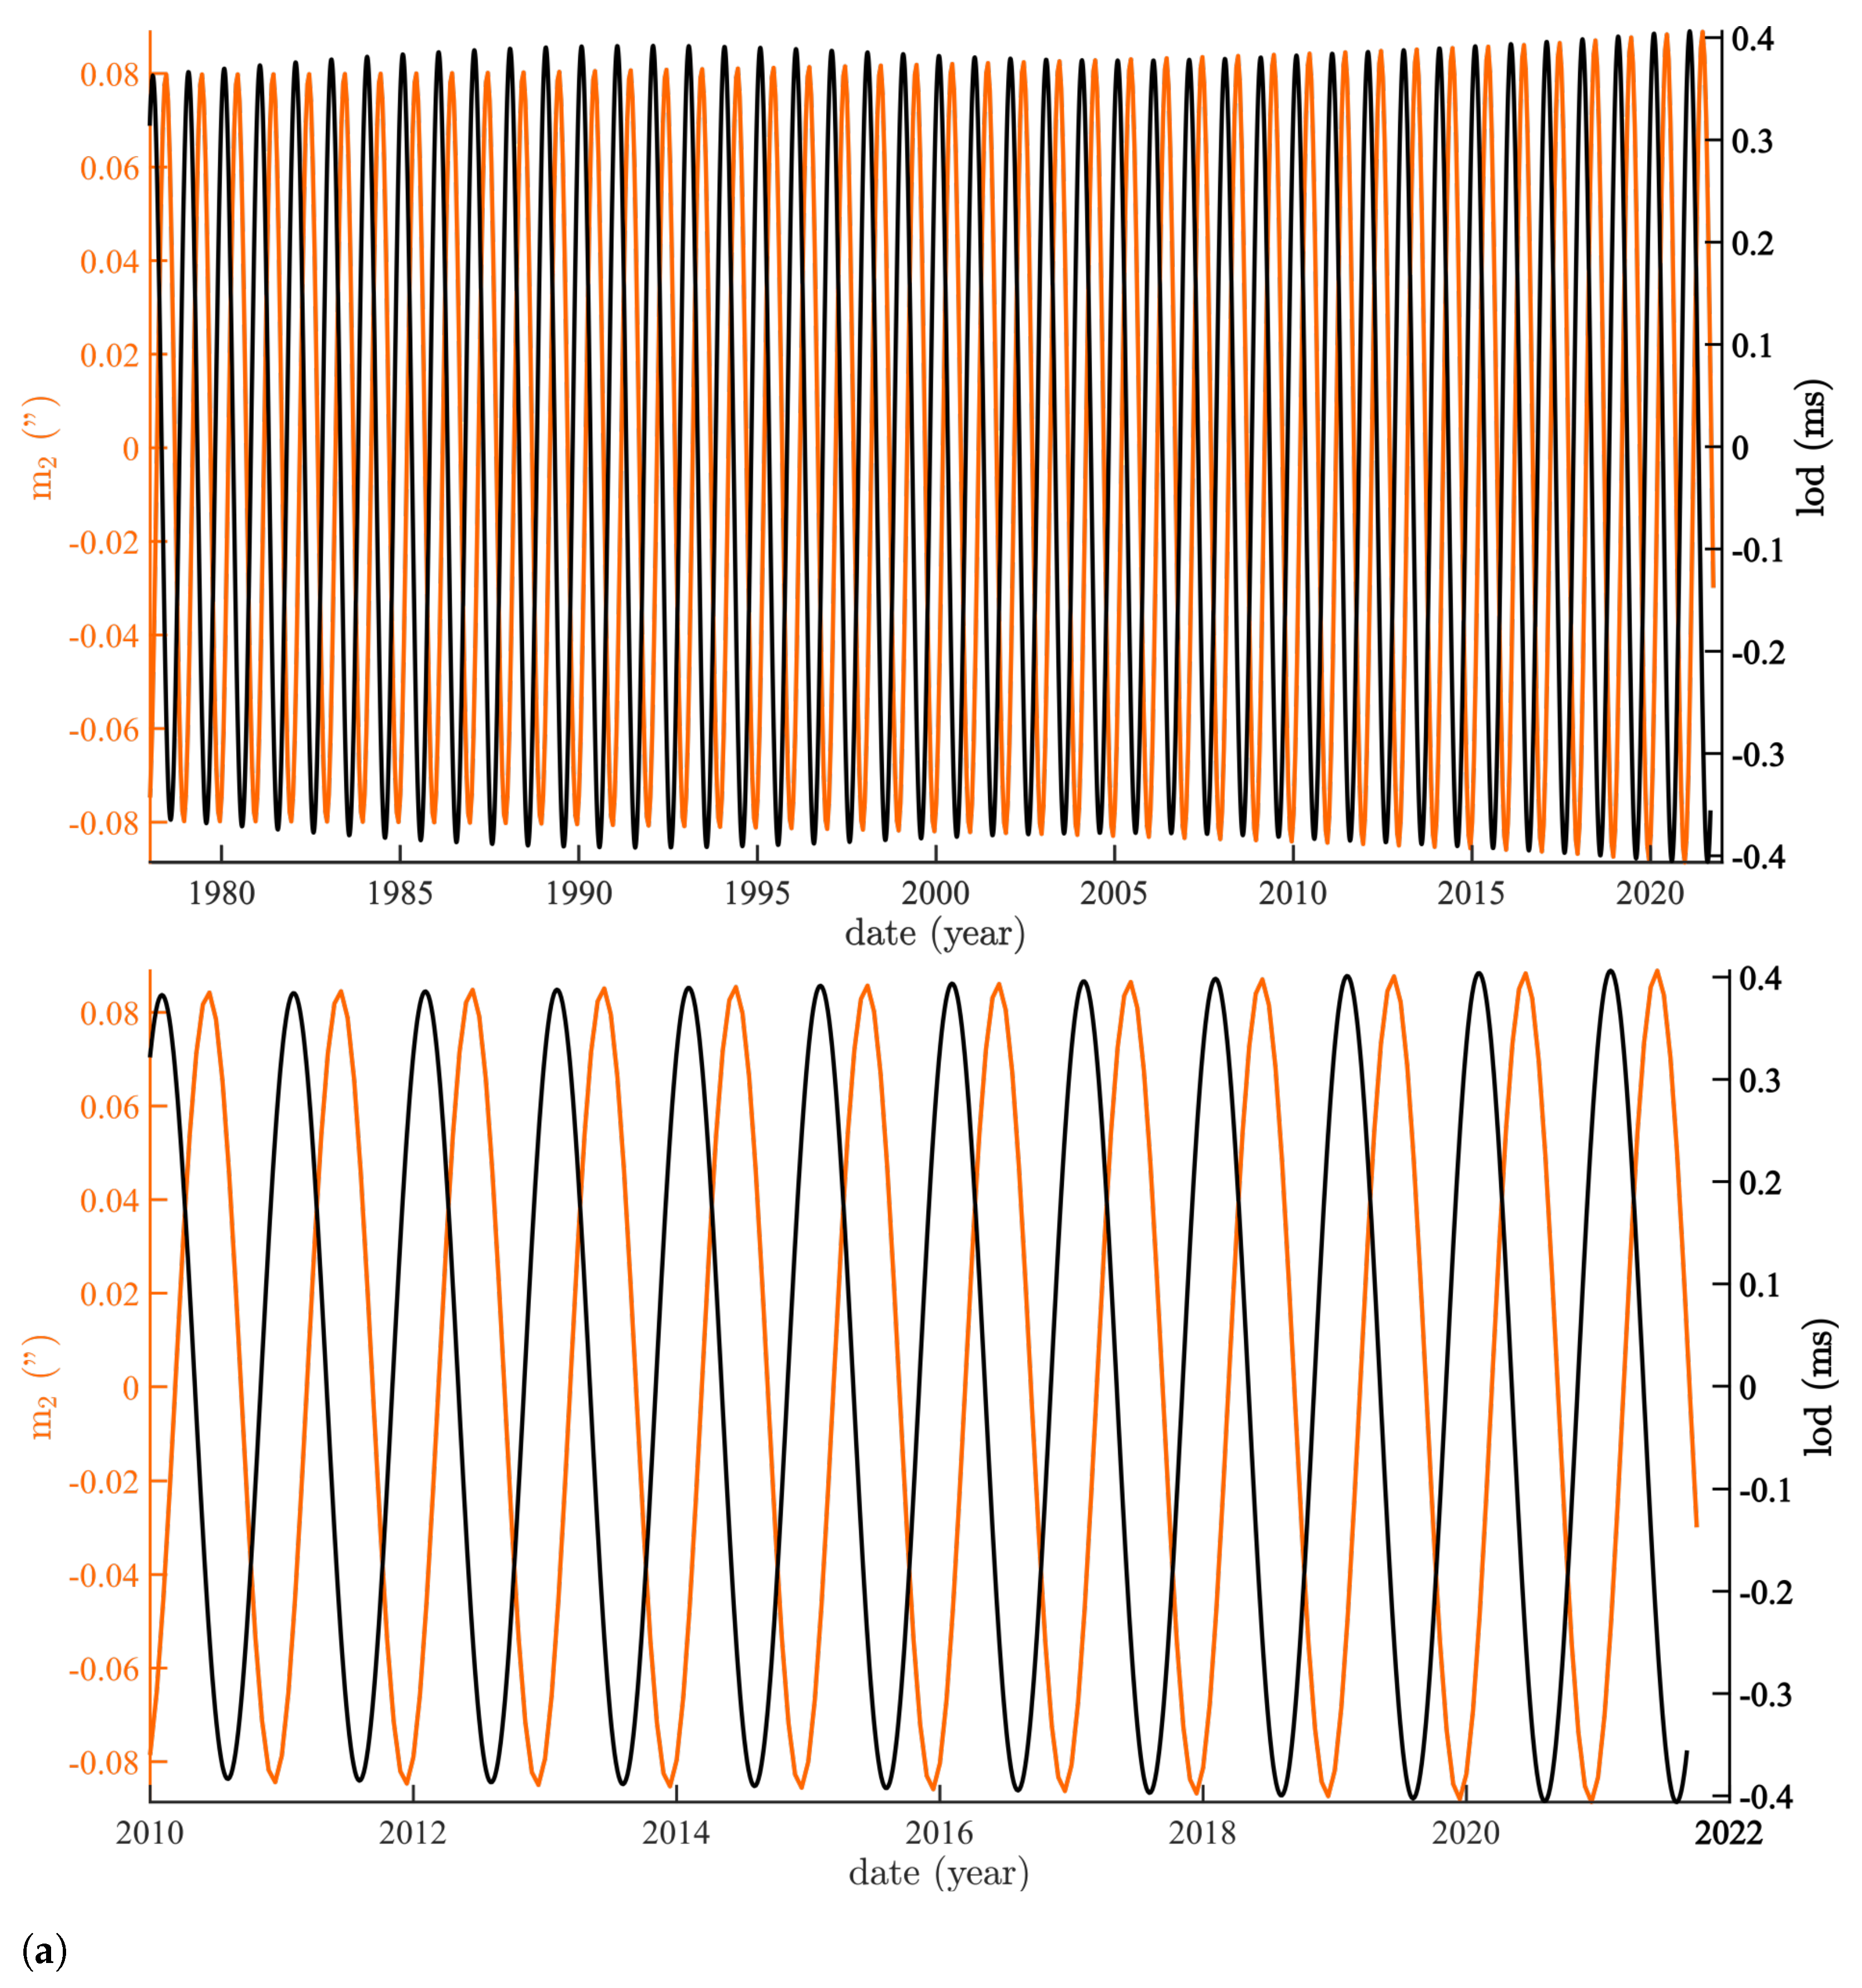
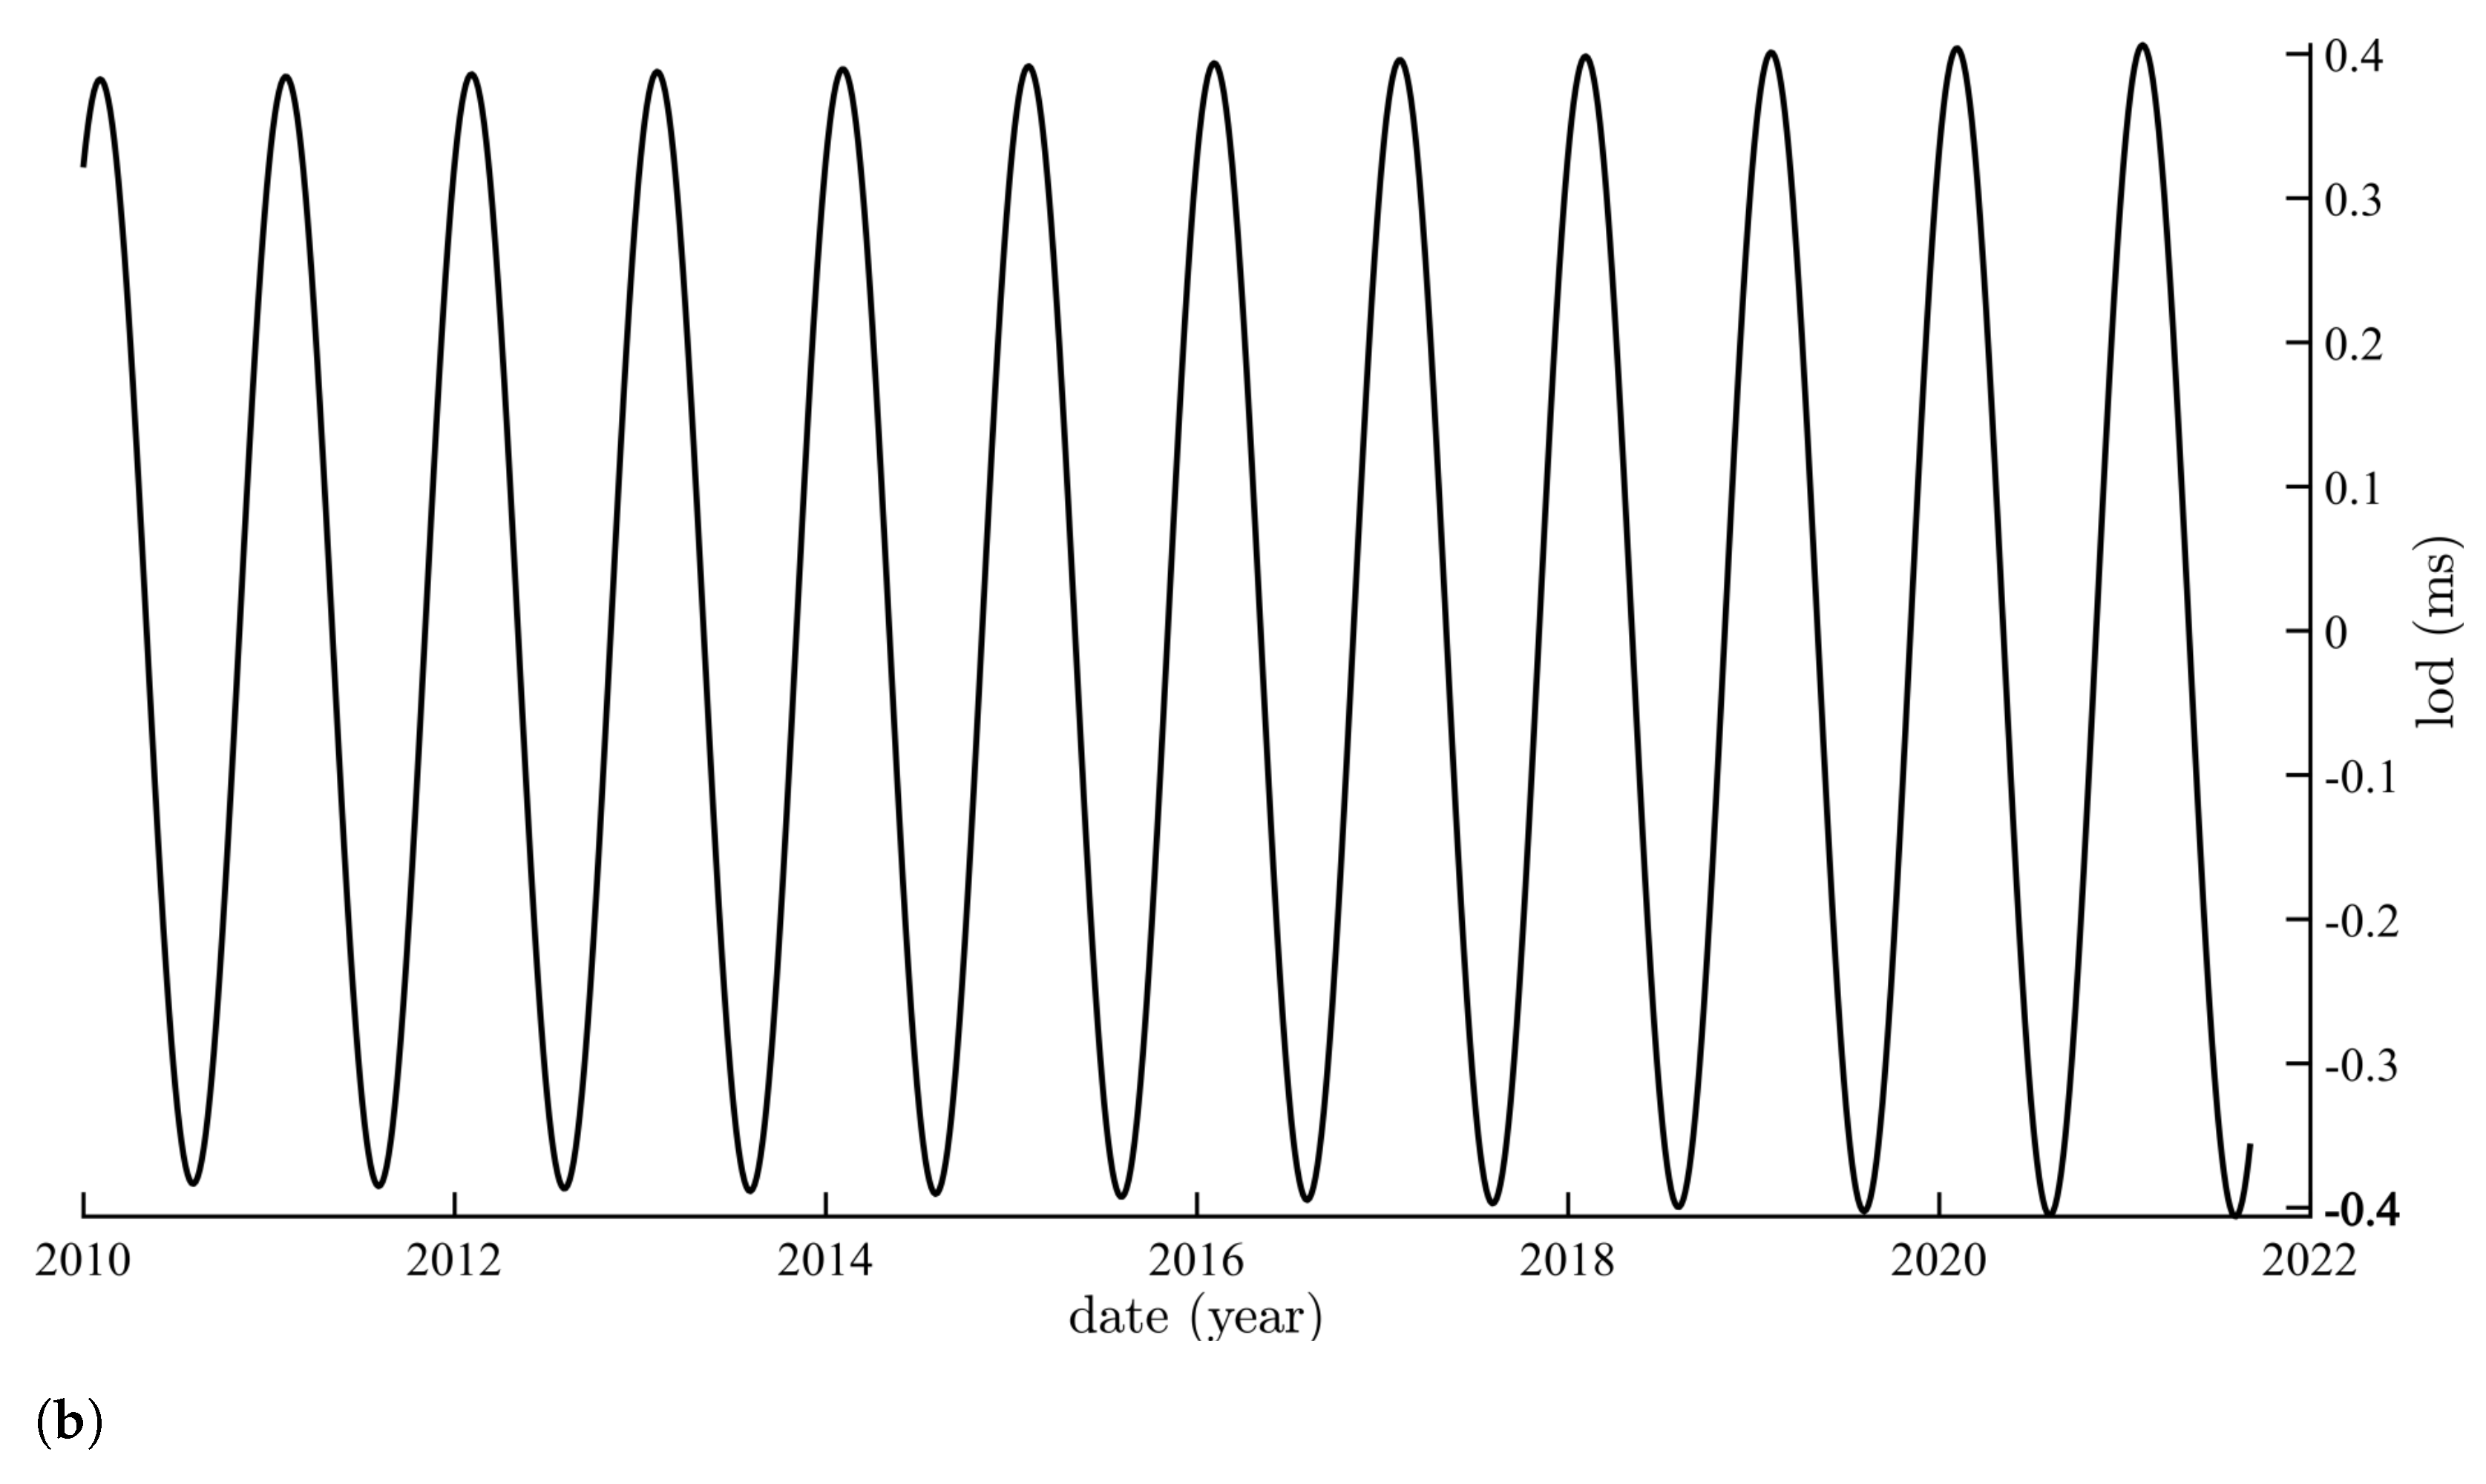
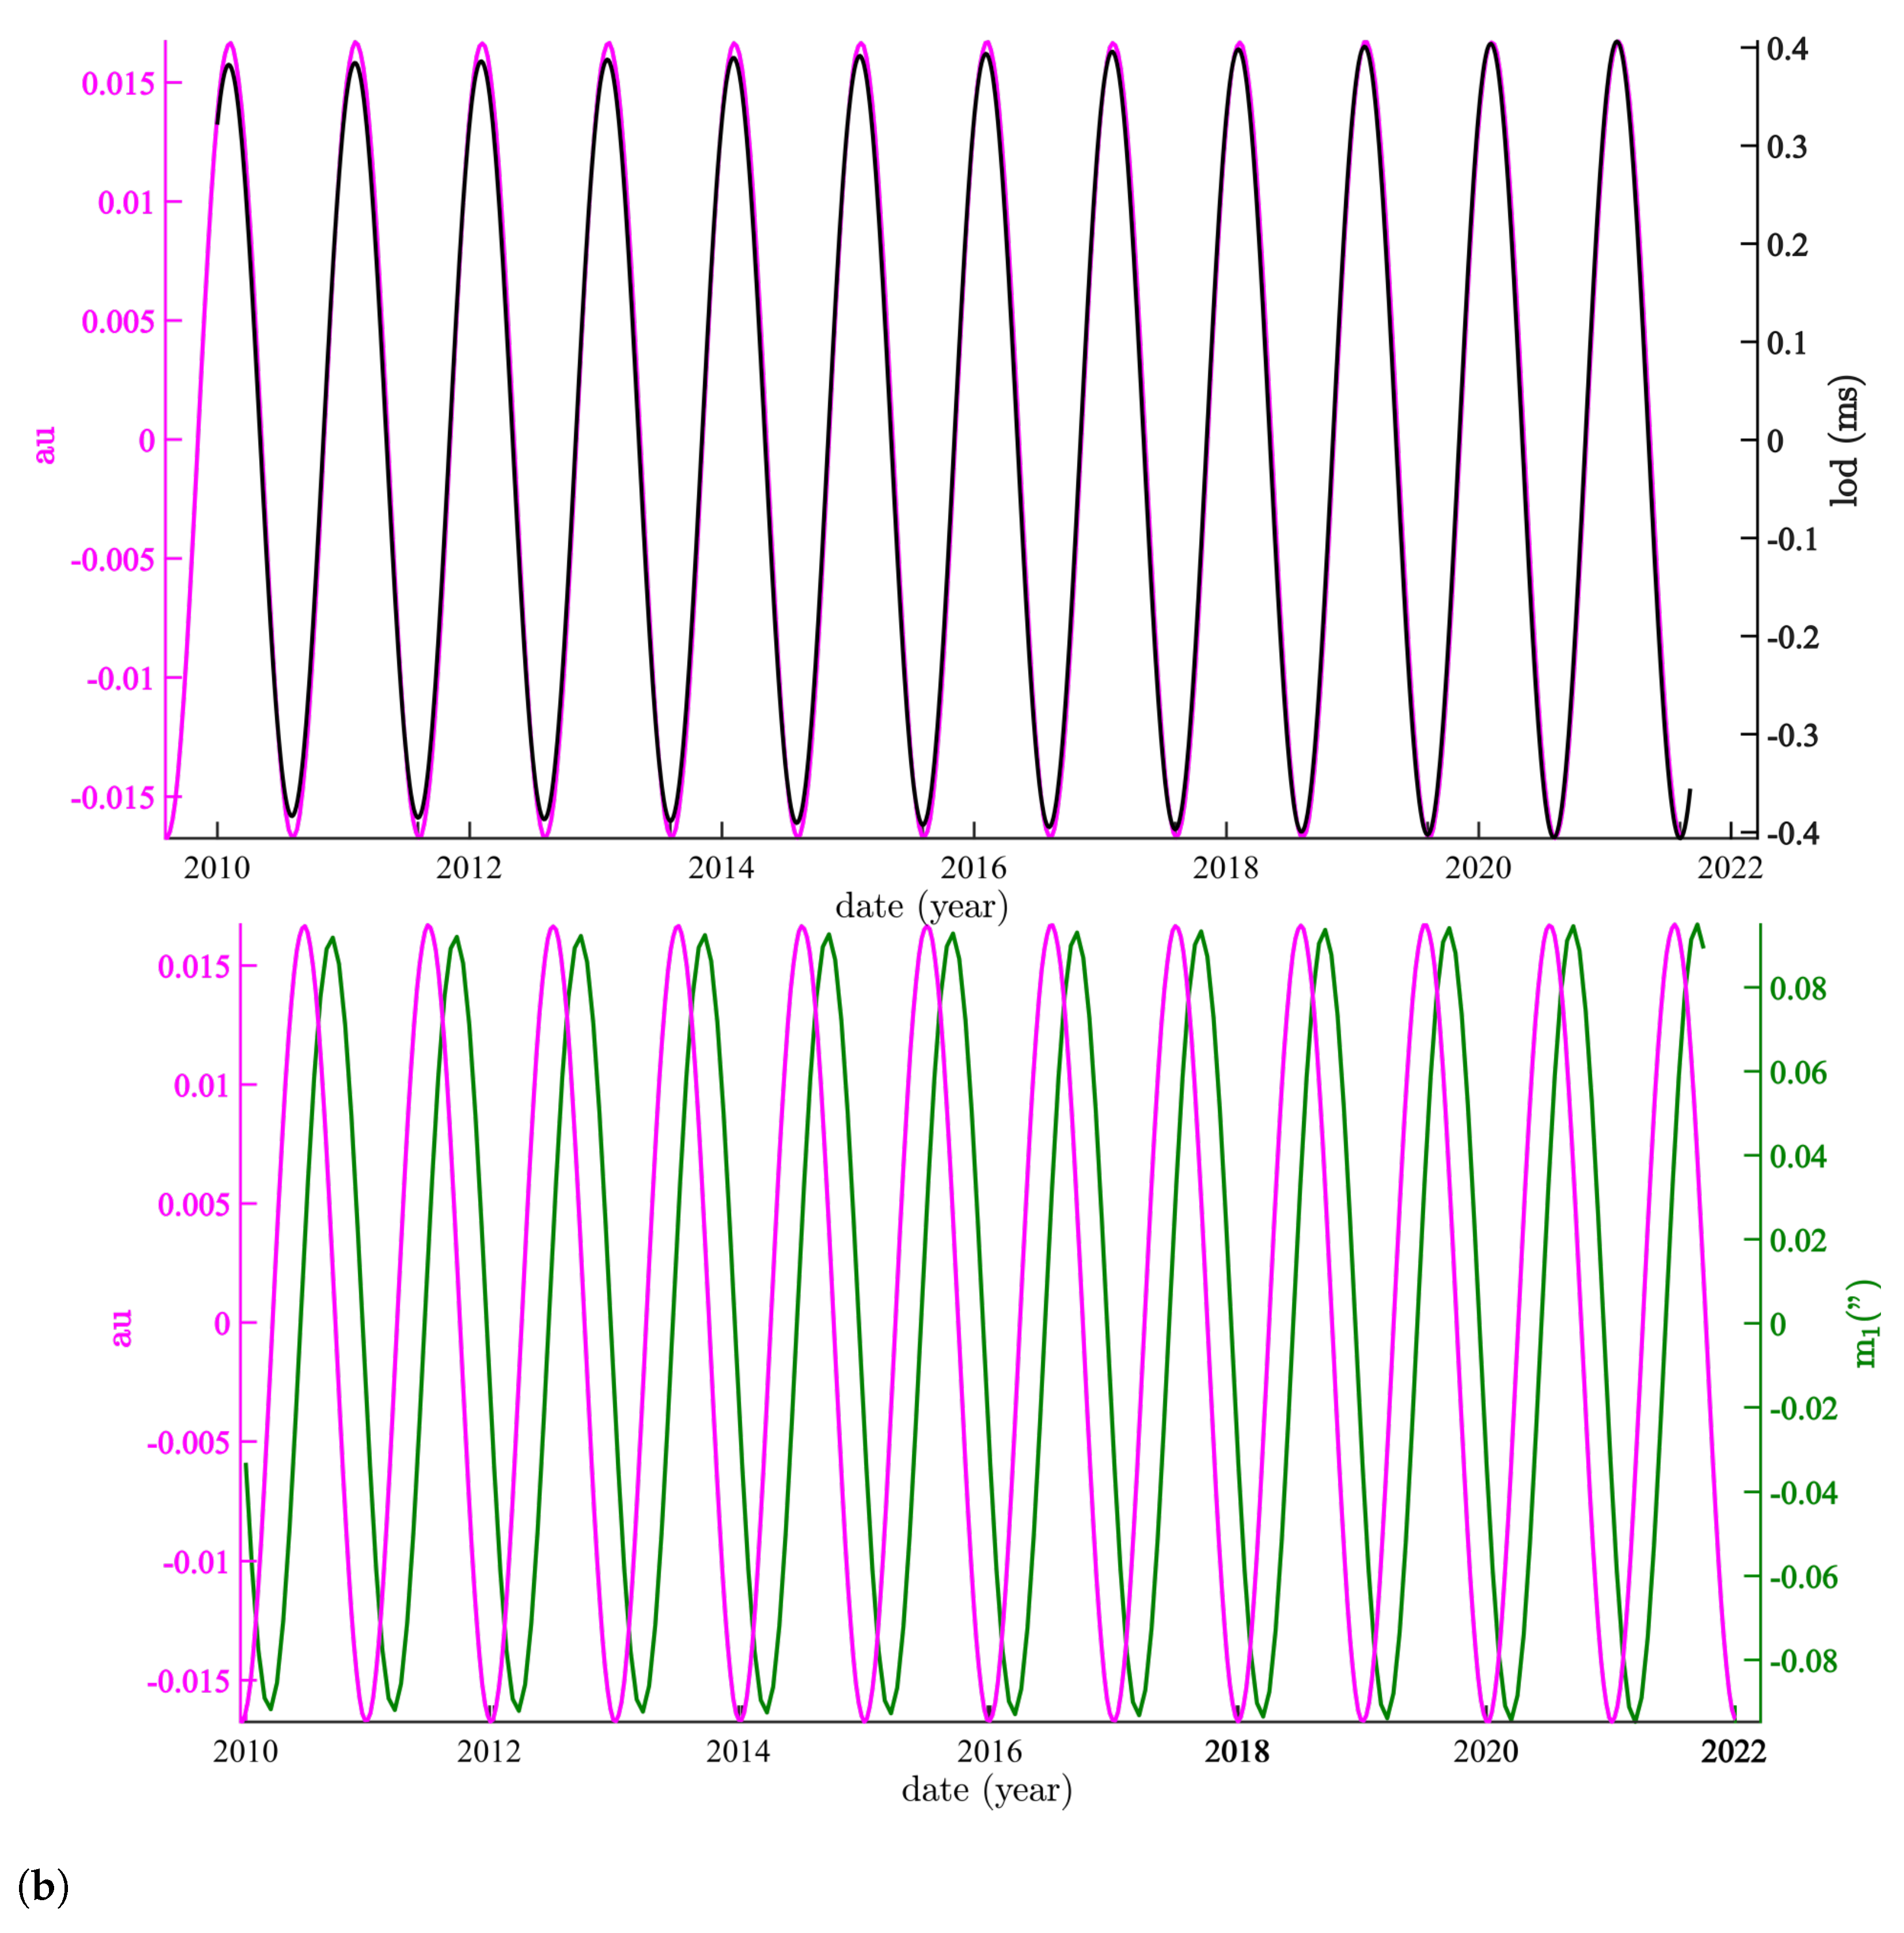
Figure 5a,b compares the annual and semi-annual SSA components of PM and lod. The annual components are slightly modulated (<10%) and are close to pure sinusoids. As a result, they are almost perfectly correlated, with a phase difference of 41 ± 3 days between and lod (i.e., quadrature; Figure 5).
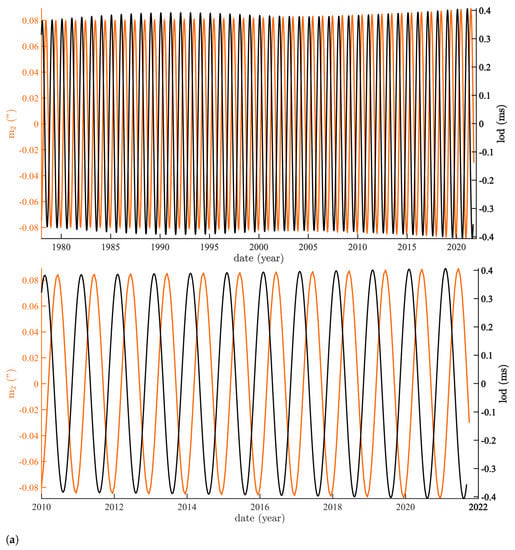

Figure 5.
Annual and semi-annual components extracted from lod and PM: (a) superimposition of the SSA annual components of the and lod time series (top: 1978–2022; bottom: enlargement of 2010–2022); (b) SSA semi-annual component of the lod time series (2010–2022).
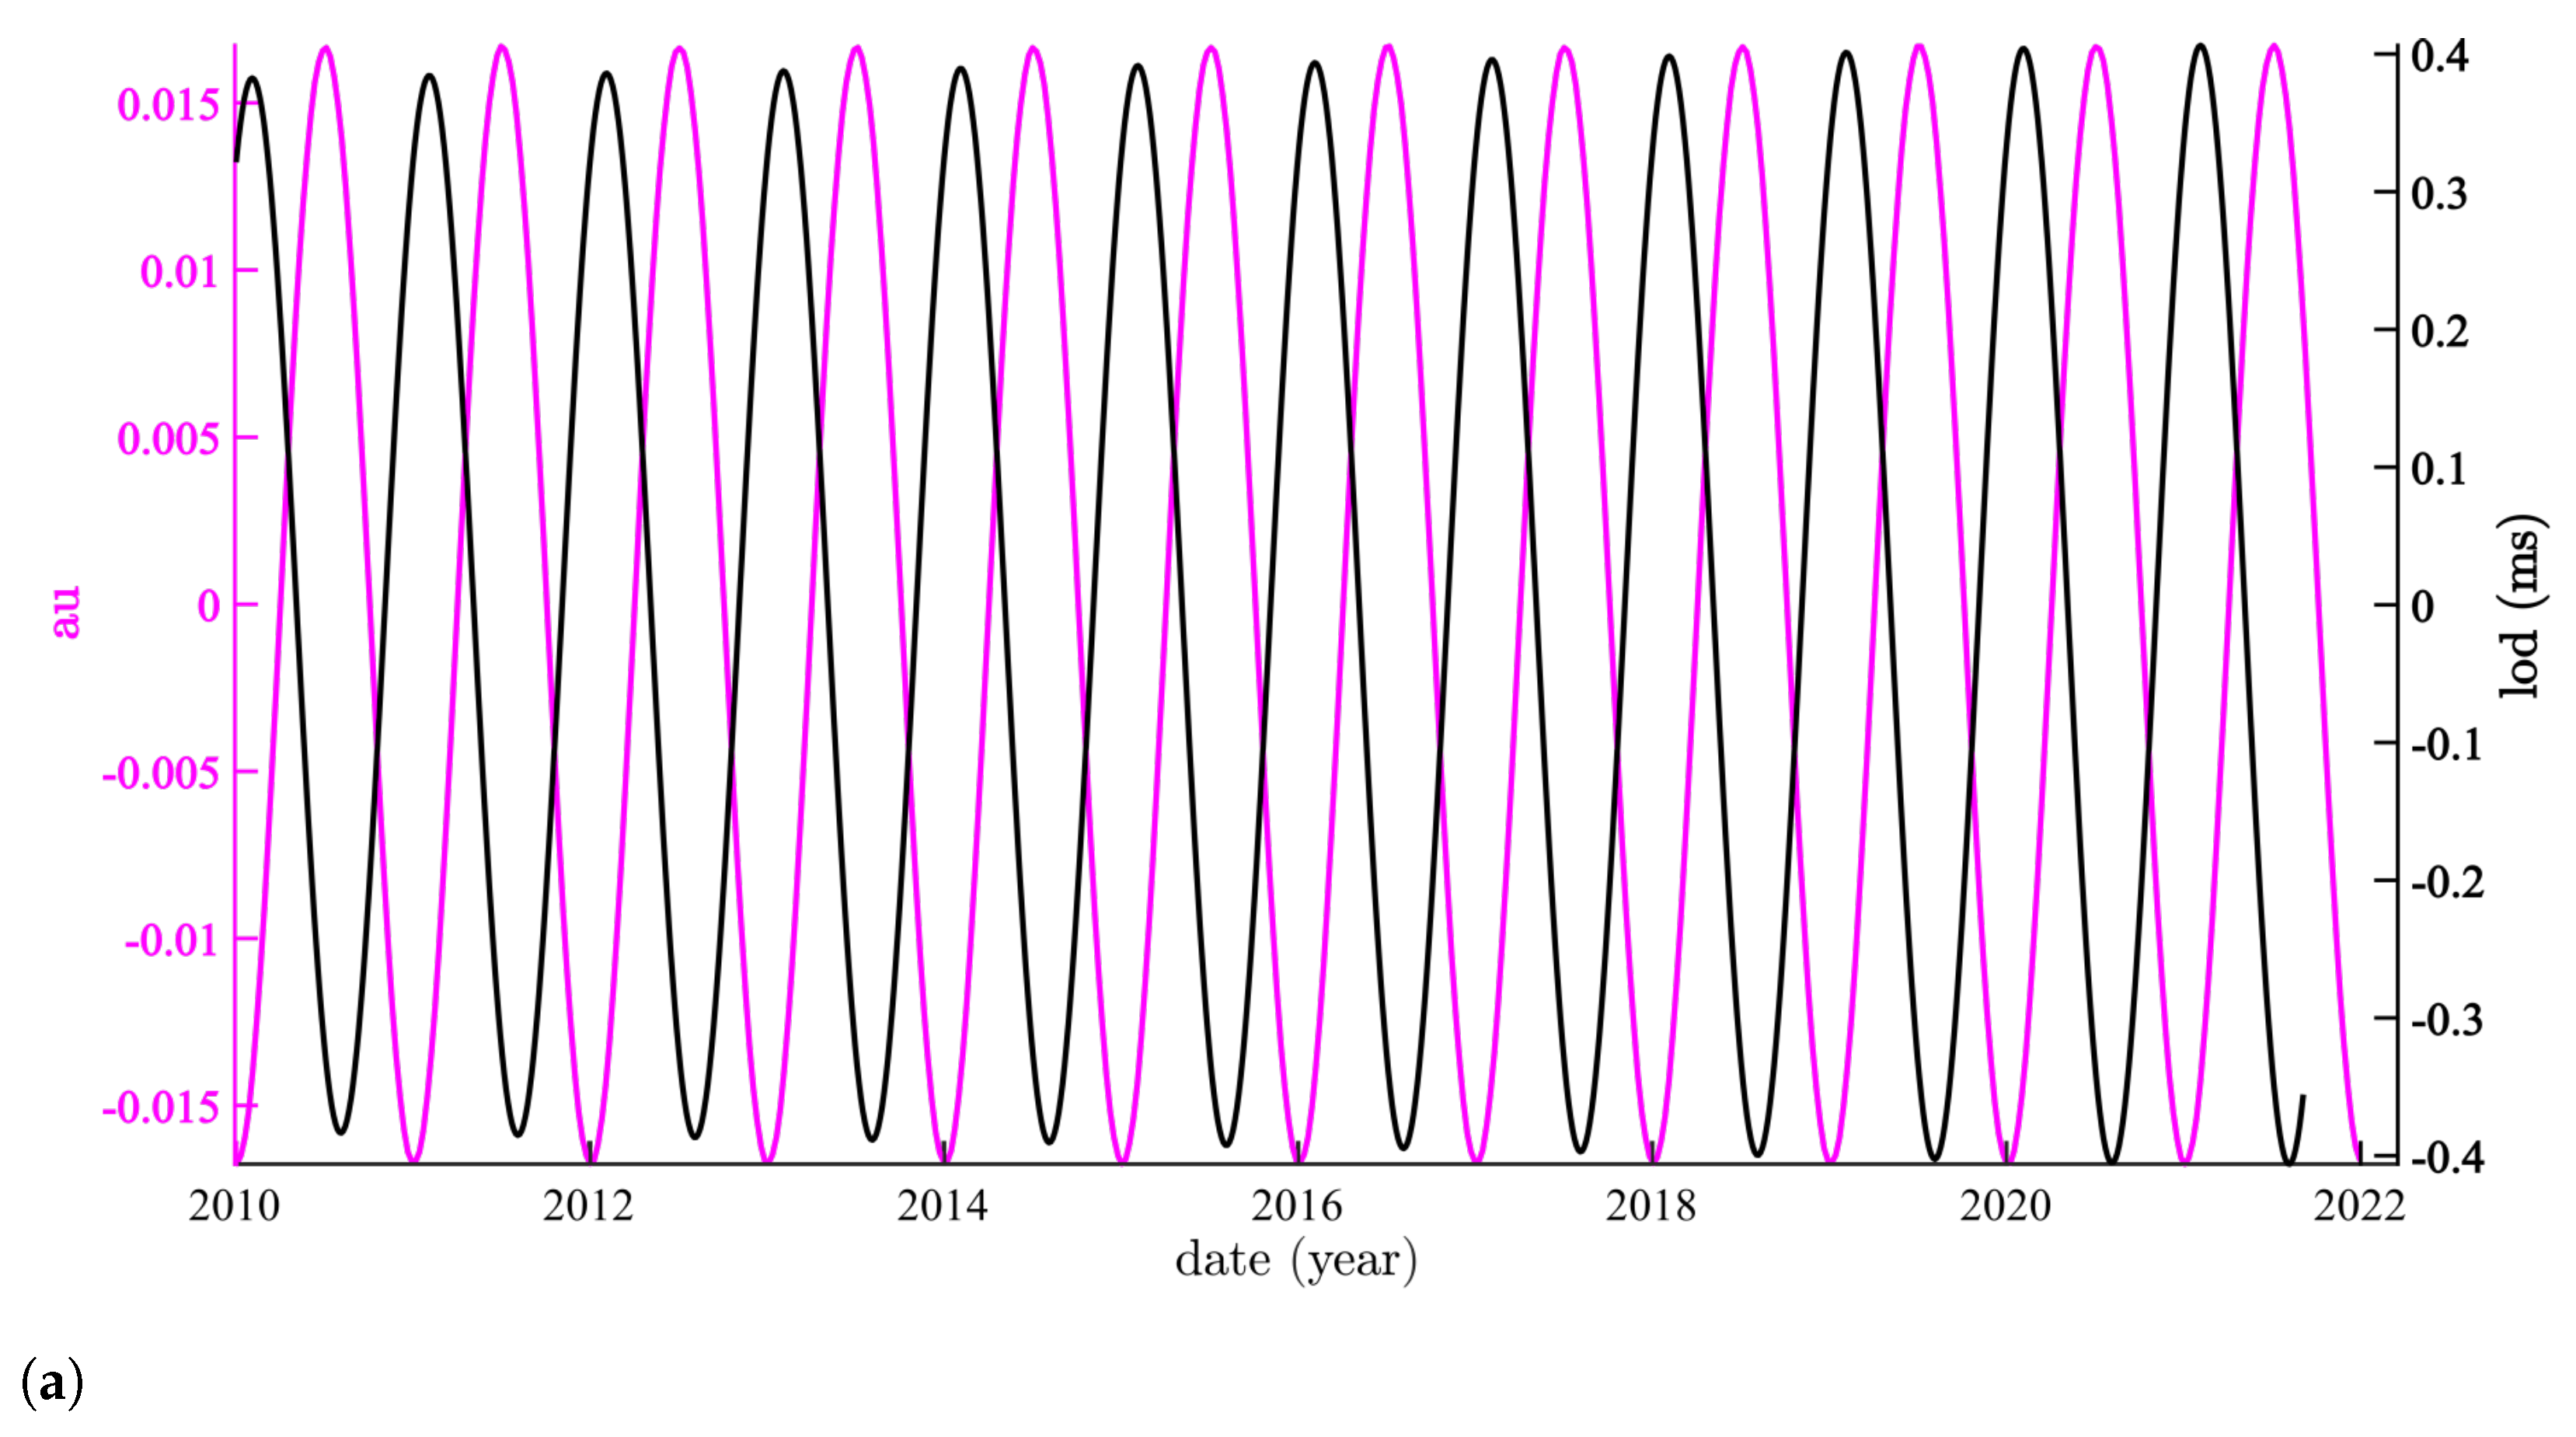
The prominence of an “astronomical” annual component in these time series, of course, leads one to relate it to the revolution period of the Earth around the Sun. Here, we compare the annual variations of the Sun–Earth distance D (in au) with m1 (Figure 6, bottom) and lod (Figure 6, top). The phase lags are respectively 65.6 ± 2.1 days for D and and 152.5 ± 4.1 days for D and lod.

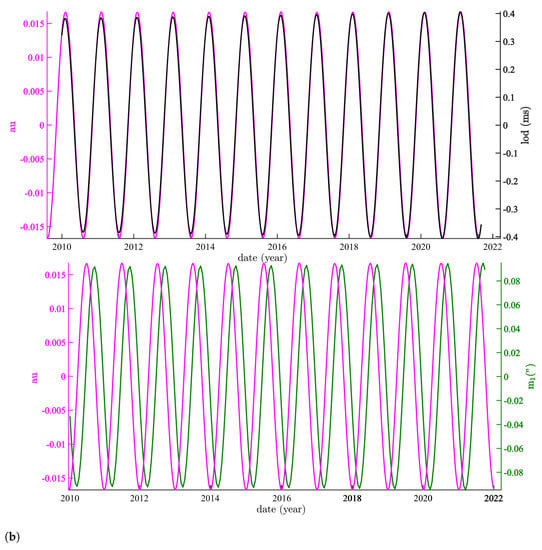
Figure 6.
Variations in the Earth-to-Sun distance D (in au; purple) compared to the first (annual) SSA component of (bottom) and the lod (top). In the middle curve, lod is offset by 152.5 days.
5. Comparison of Annual and Semi-Annual SSA Components of Polar Motion and Length of Day vs. Variations in Sea Ice Extent
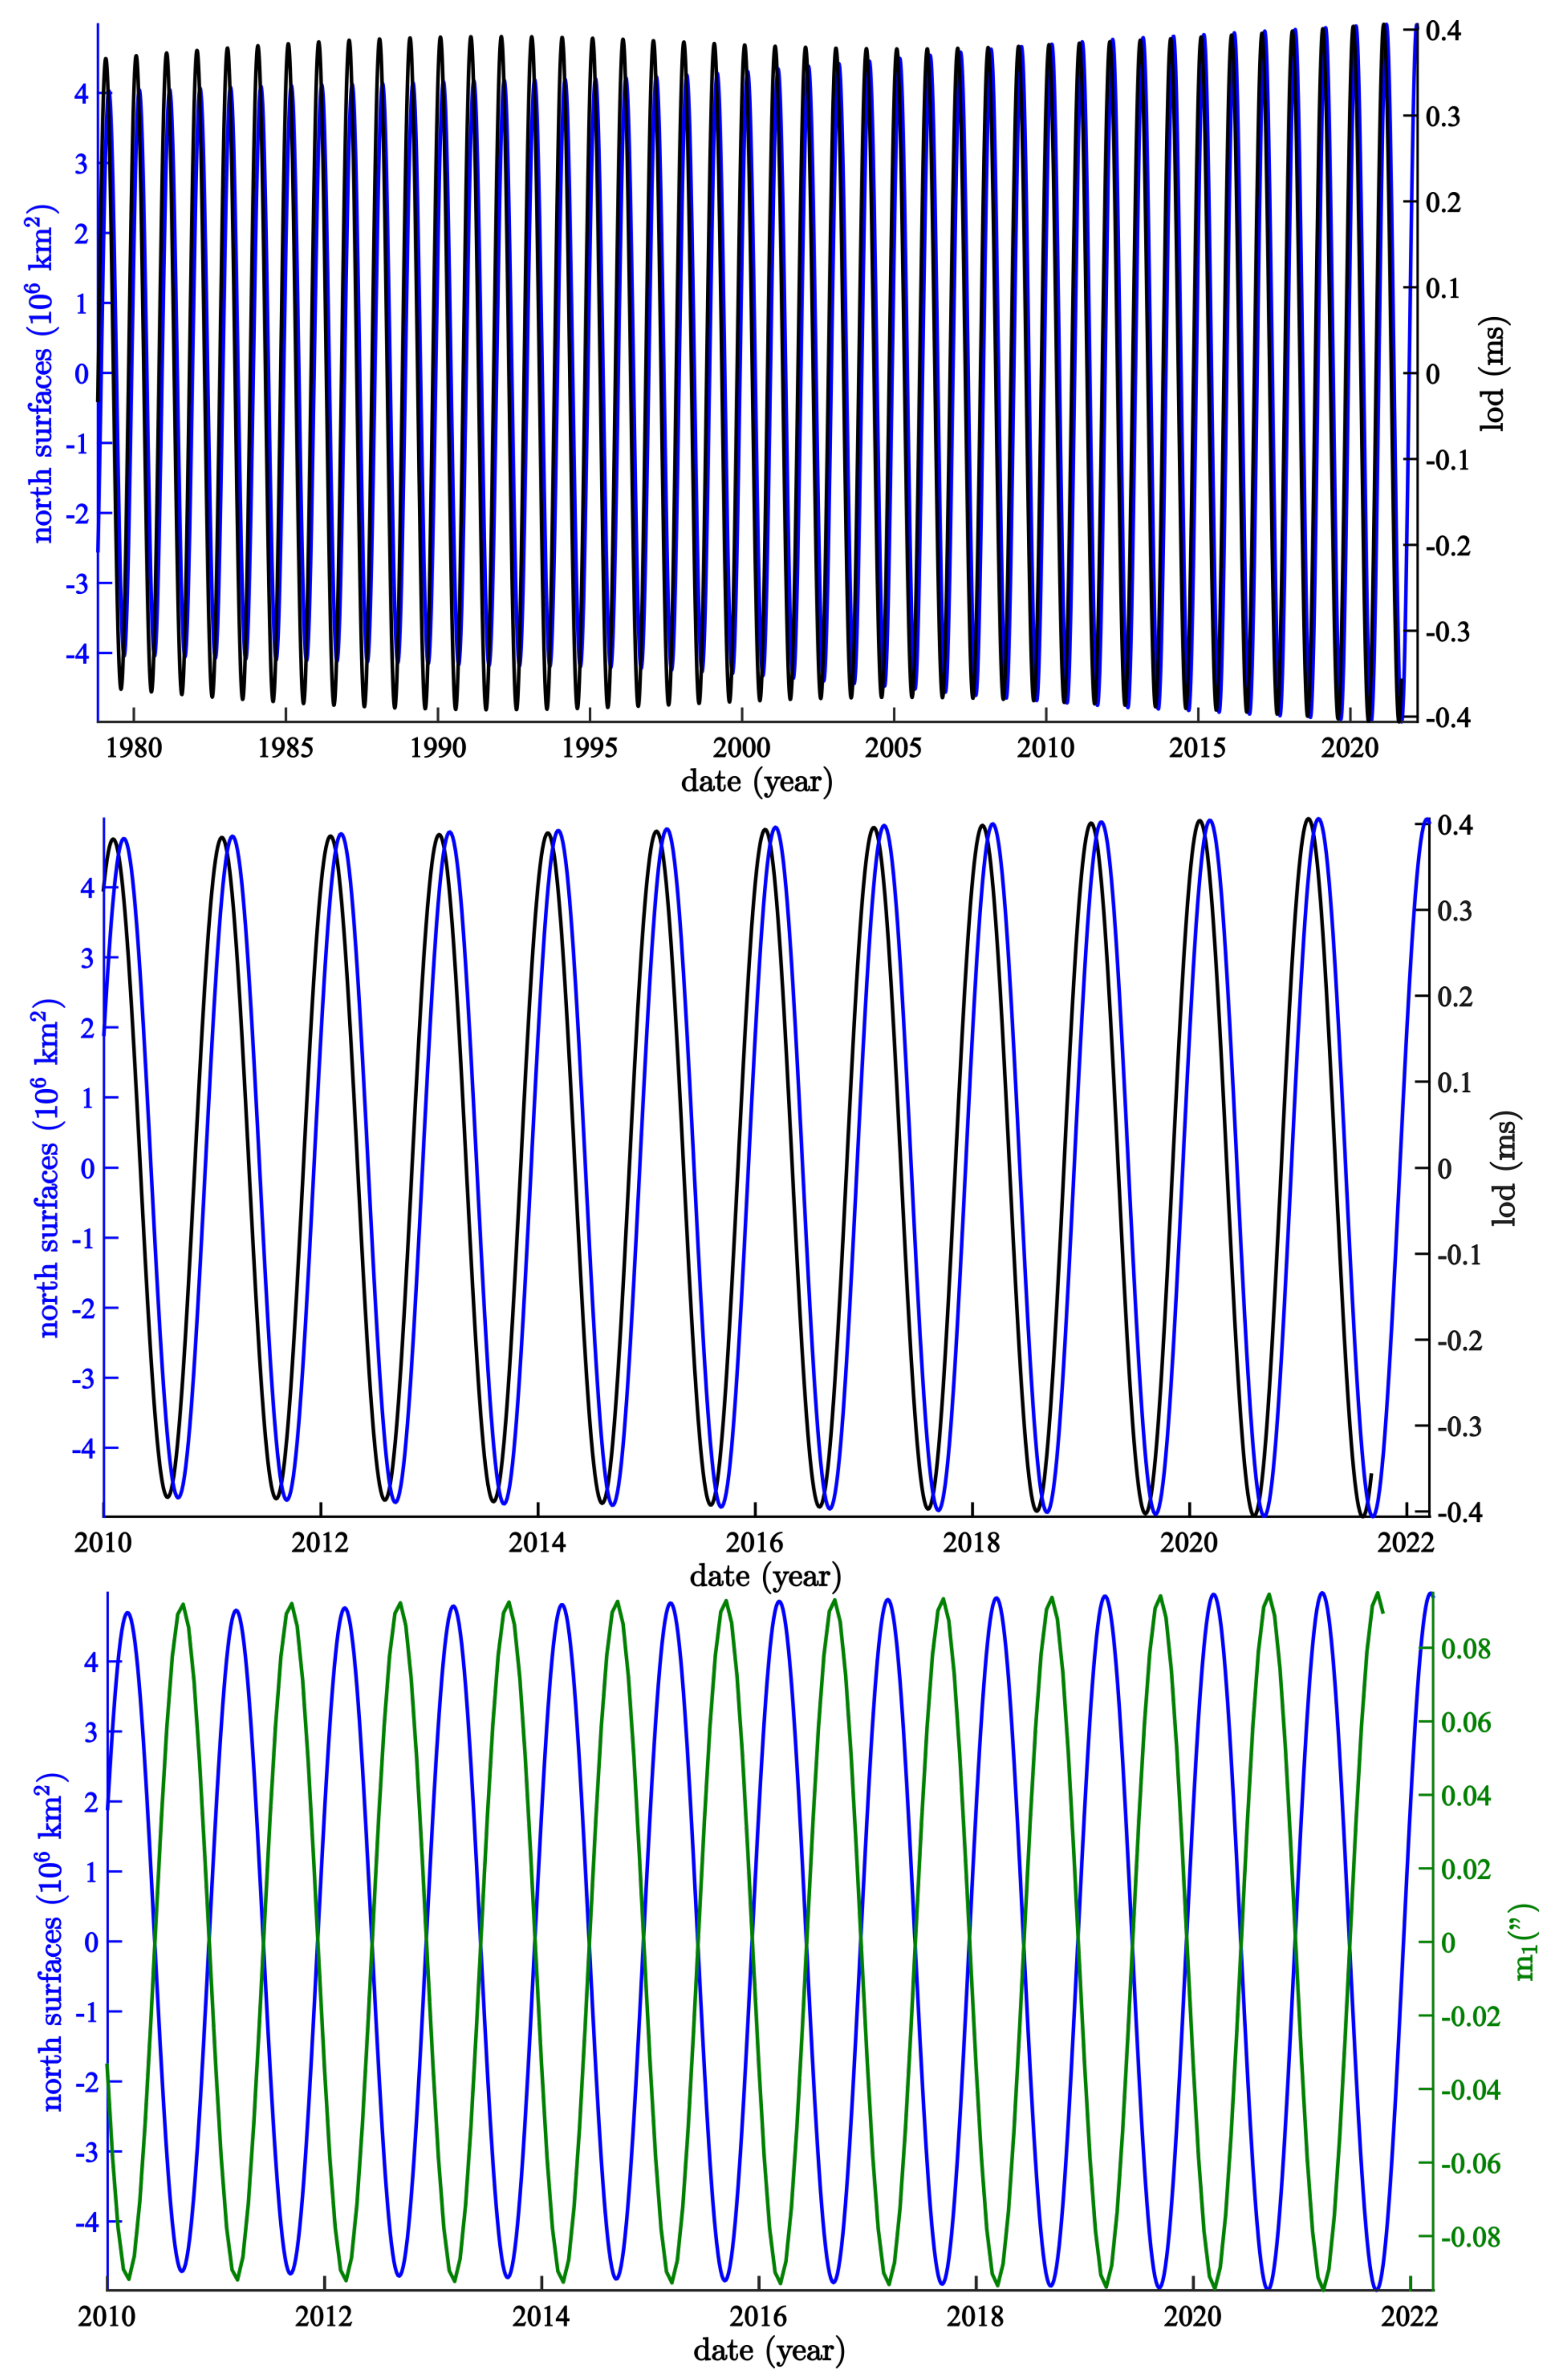
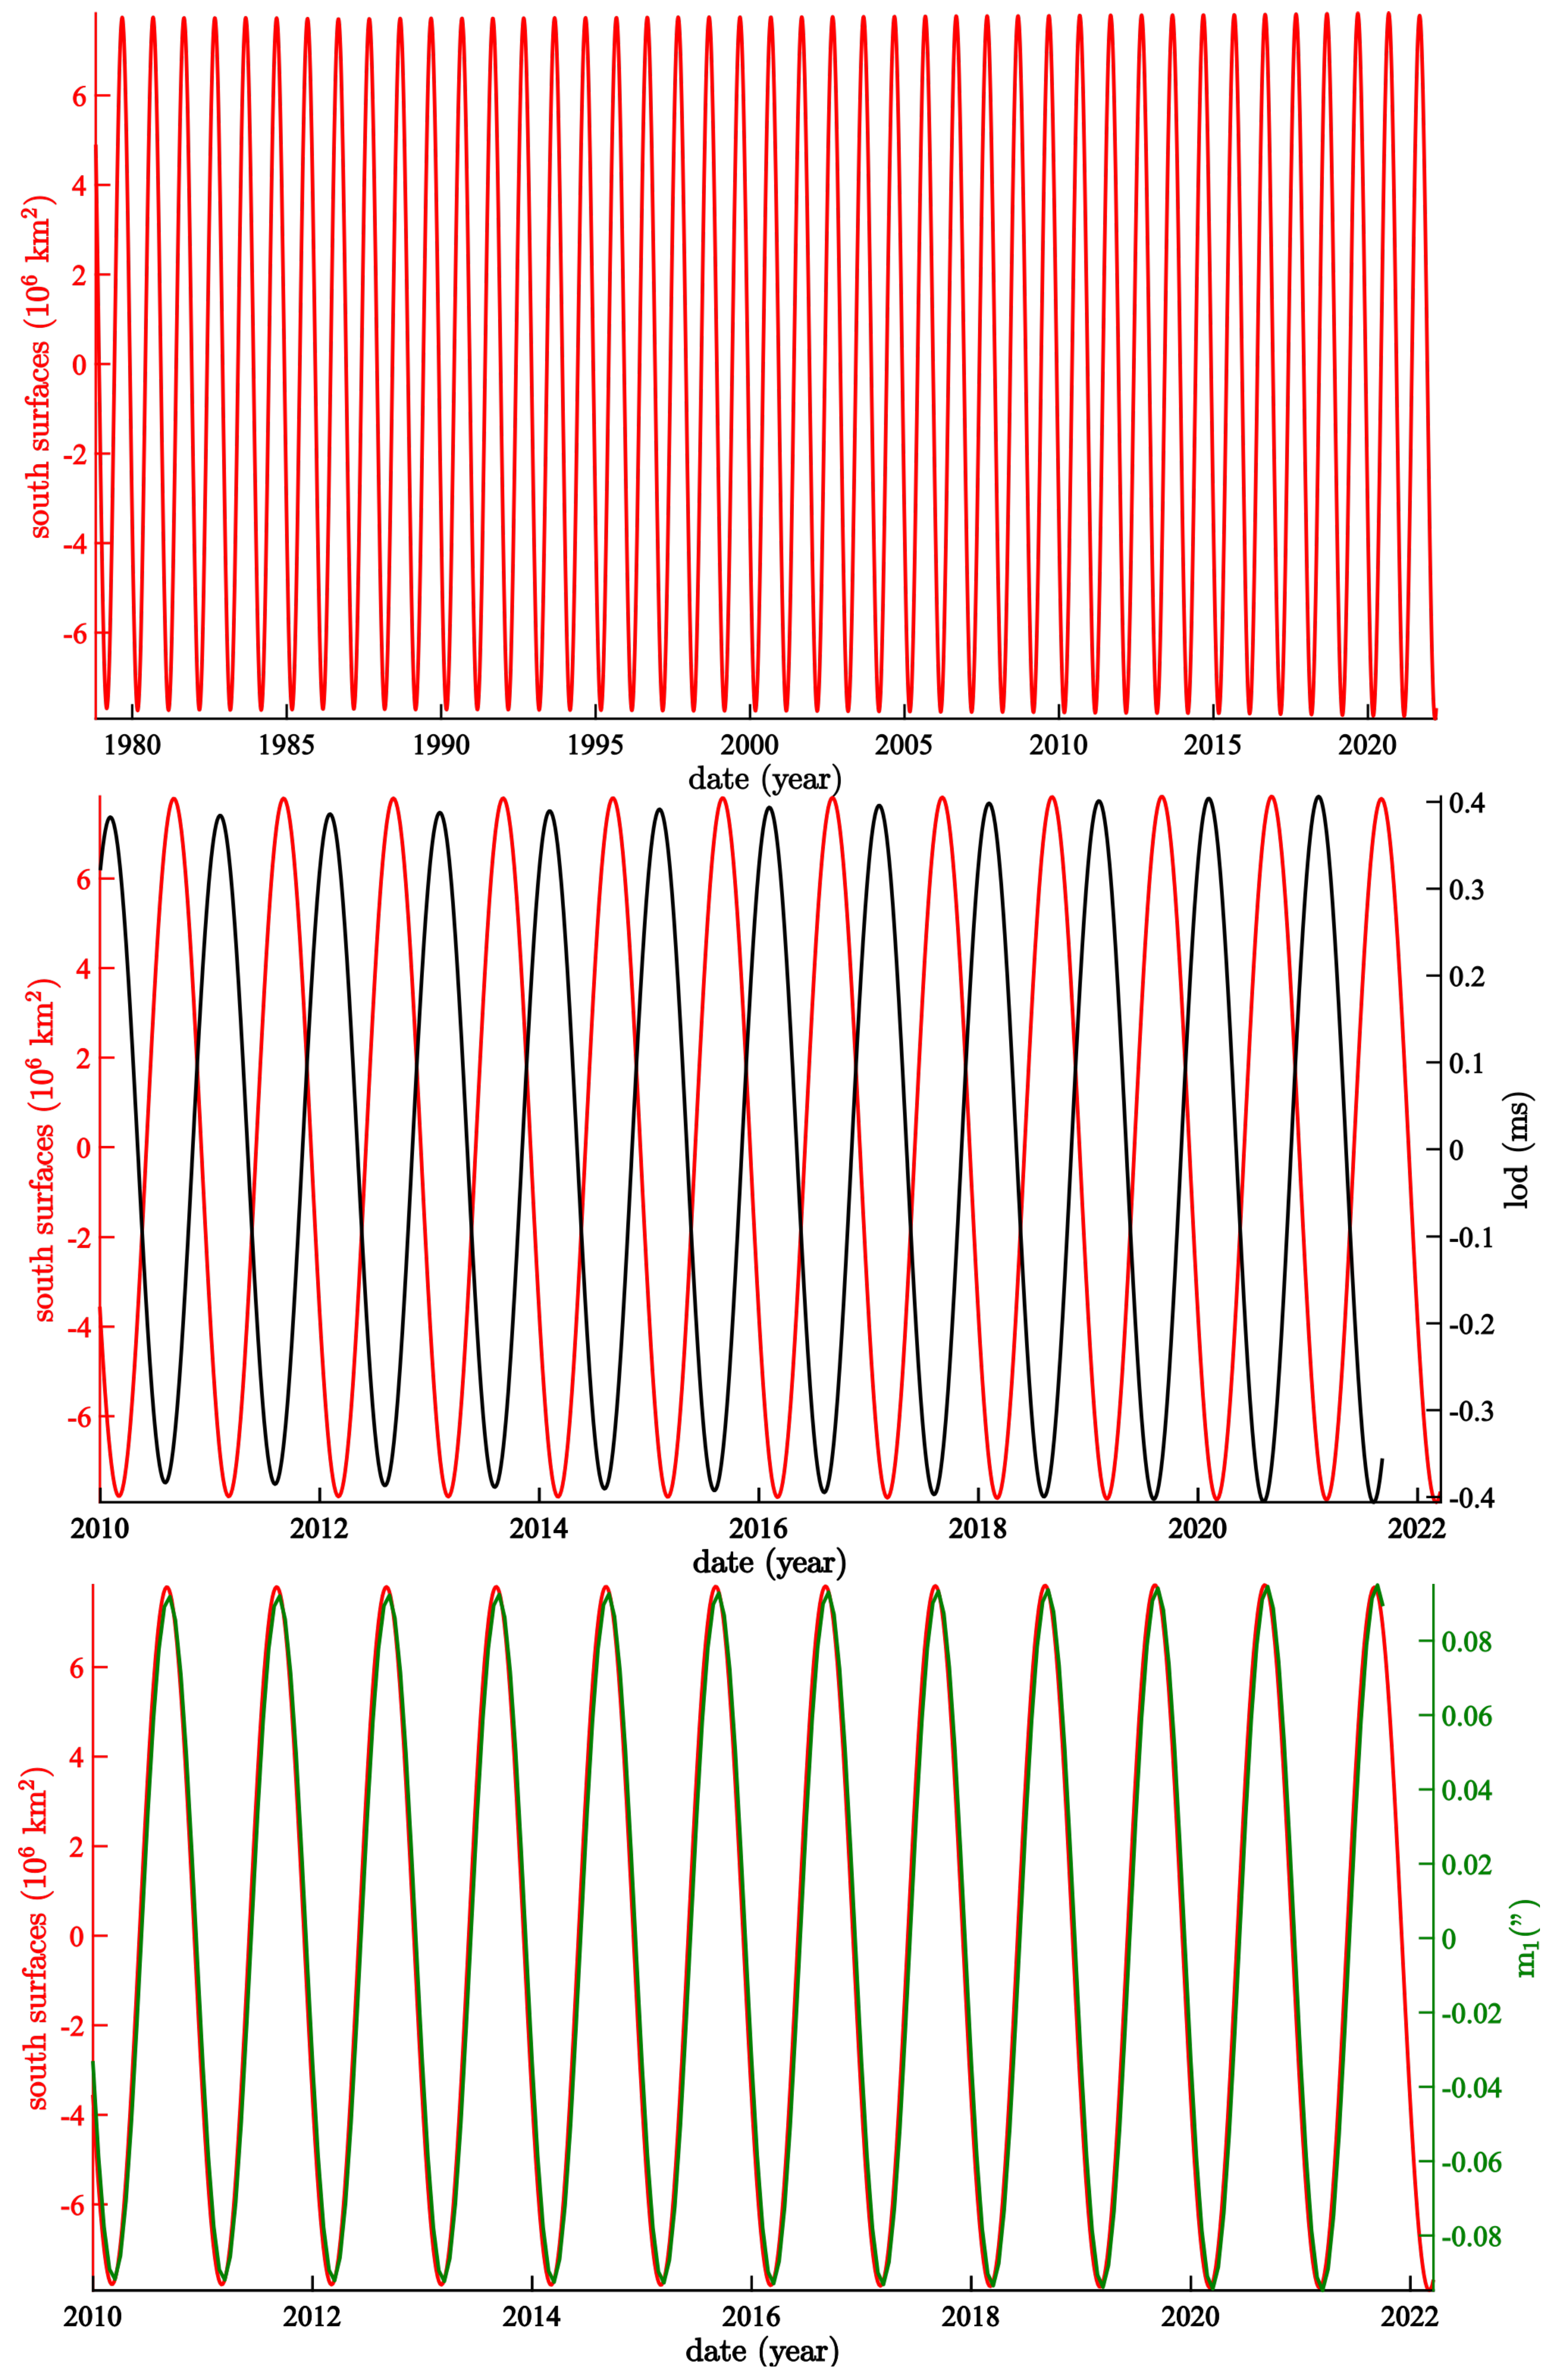
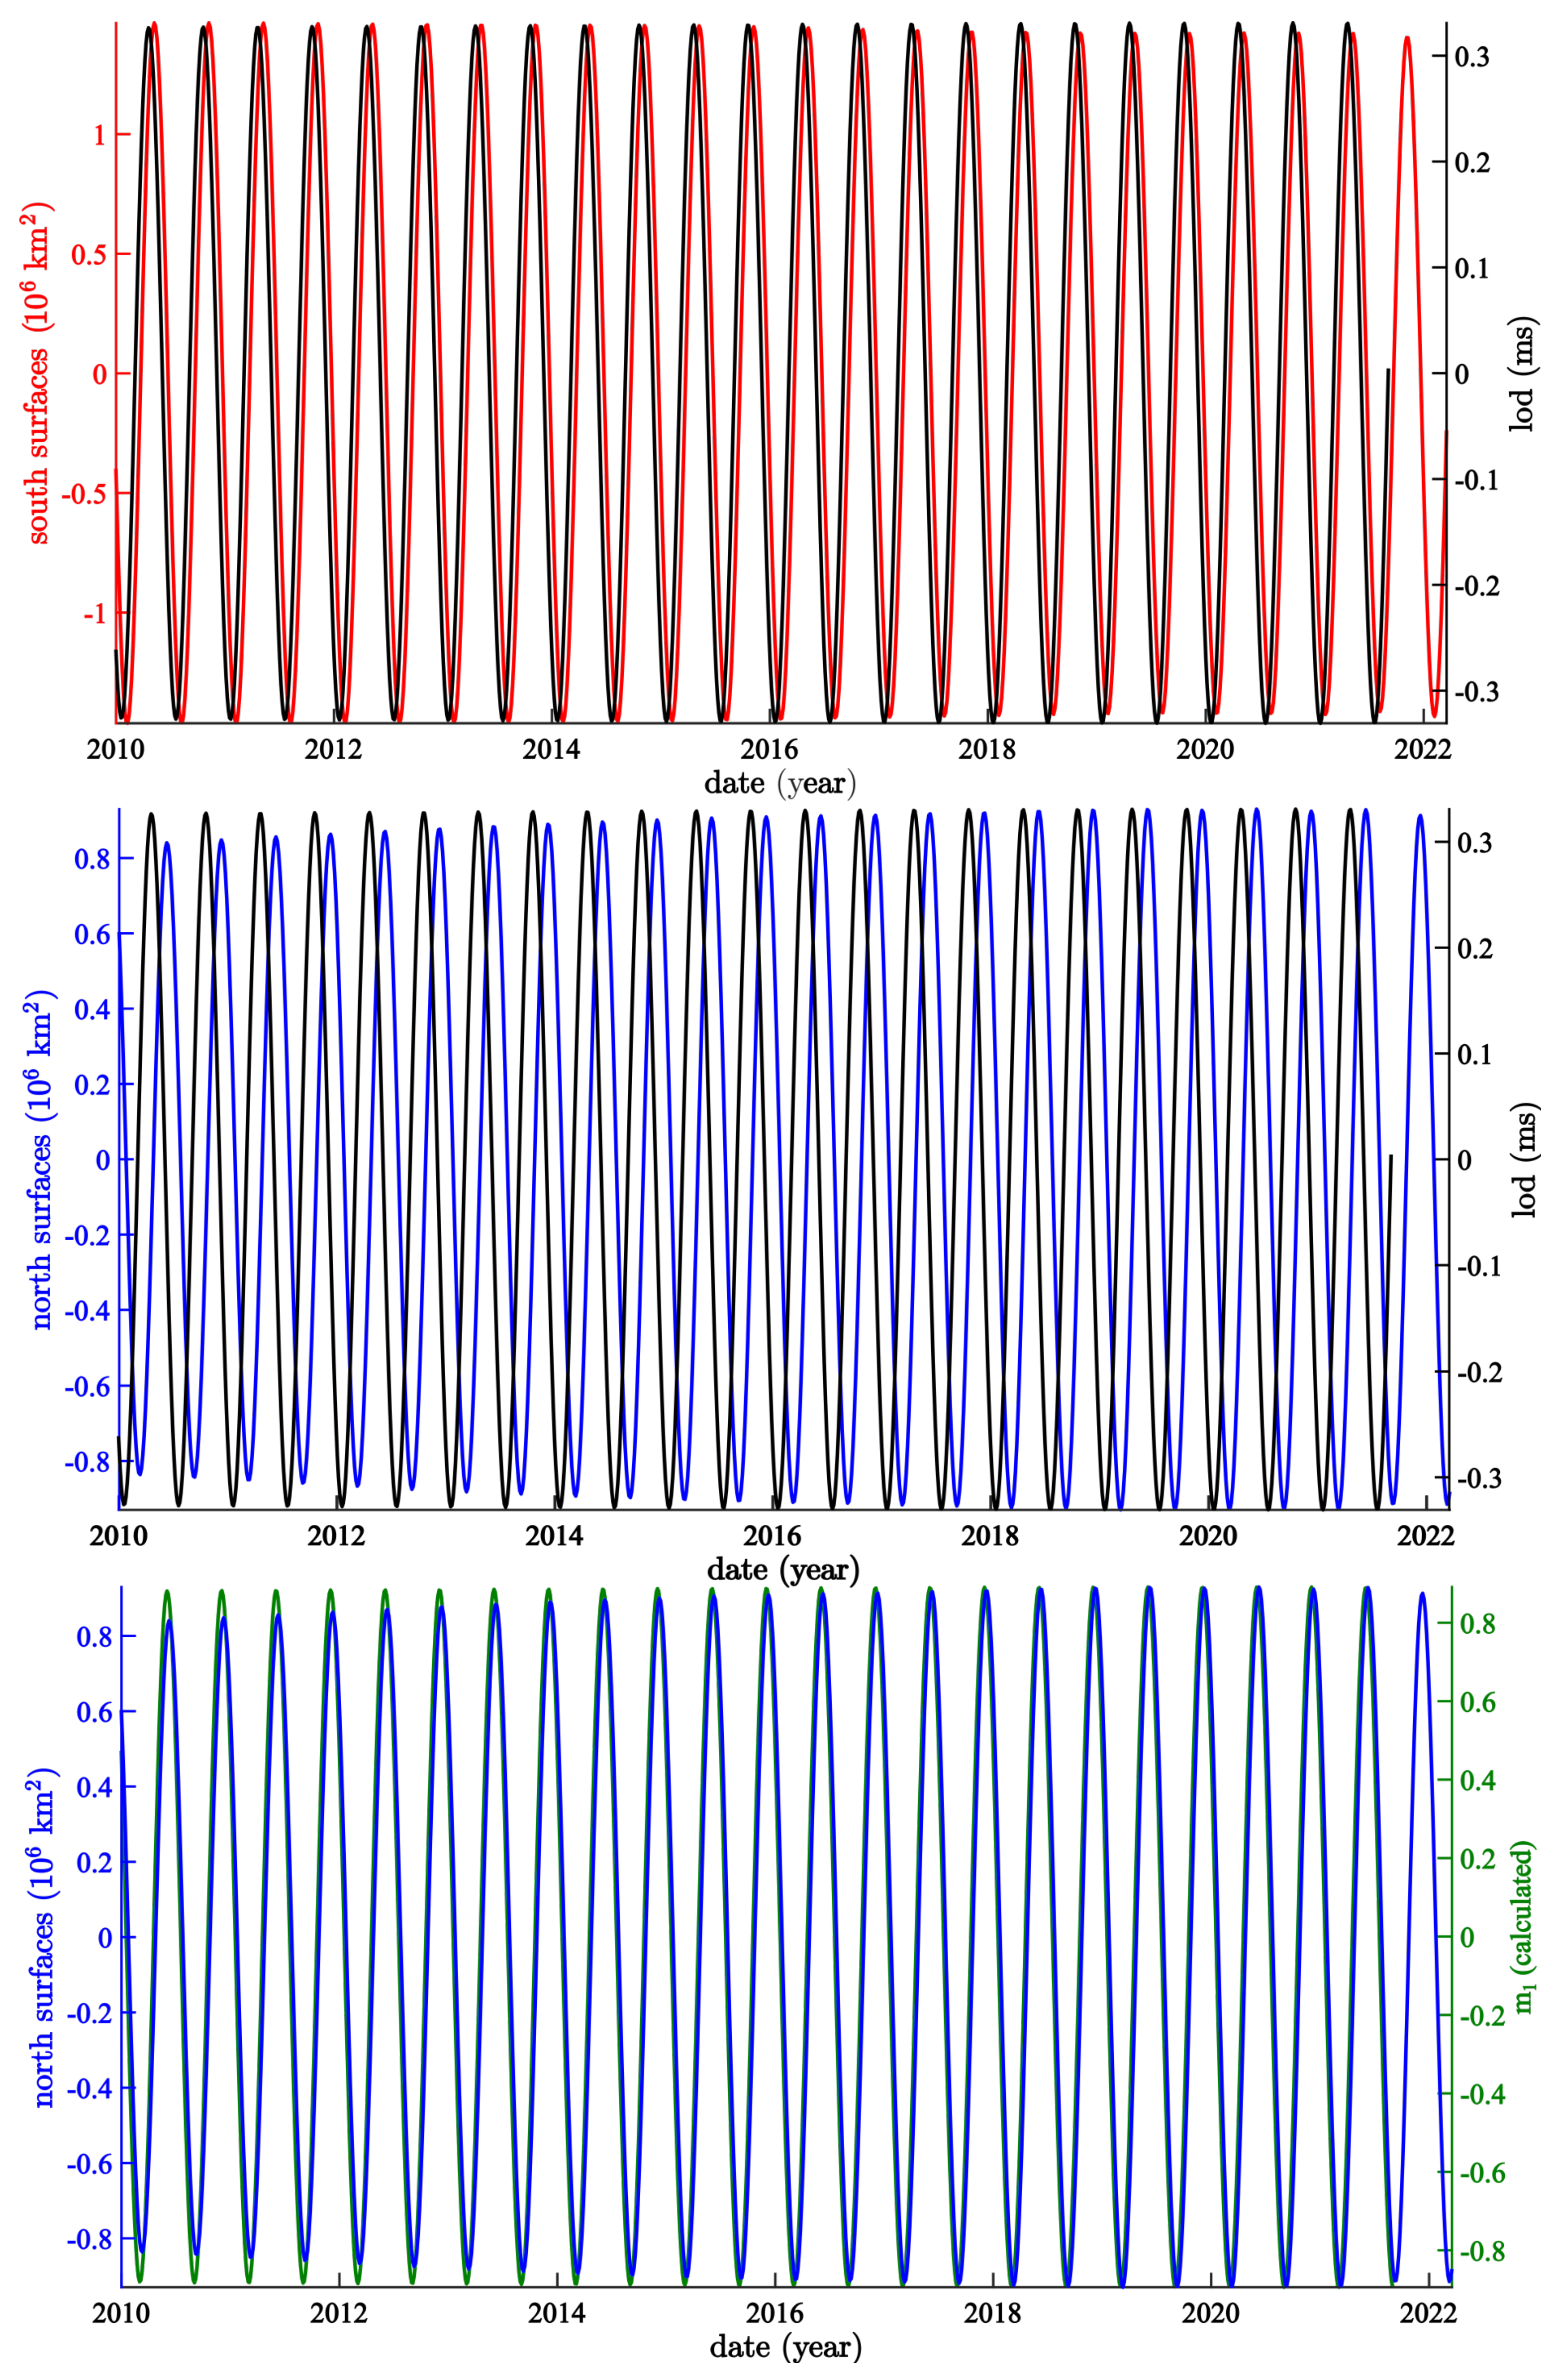
We now compare the annual components of sea ice extent NHSI (Figure 7) and SHSI (Figure 8) with those of and lod, in particular, their phases (Table 1). In the case of the northern hemisphere (Arctic), variations in sea ice extent are almost in phase with the lod and in phase opposition with . The phase difference is 153.8 ± 4.2 days for m and 33.0 ± 1.1 days for lod (see Figure 7, middle enlargement). NHSI is more strongly modulated (by 20% over 40 years, corresponding mainly to the trend) than lod. In the case of the southern hemisphere (Antarctic), variations in sea ice extent are almost in phase with m1, and are in phase opposition with lod.

Figure 7.
Comparison of SSA annual components of pole motion (bottom, in arc seconds) and lod (top and middle enlargement, in ms) with that of NHSI (Arctic sea ic; in 10 km): top = 1978–2022; middle and bottom = 2010–2022.

Figure 8.
Comparison of SSA annual components of pole motion (bottom, in arc seconds) and lod (top and middle enlargement, in ms) with that of SHSI (Antarctic sea-ice, in 10 km): top = 1978–2022; middle and bottom = 2010–2022.

Table 1.
Phase differences of the annual lines of the pairs, shown as column and line headings (in days, which in this case is very close to 1 day = 1 degree).
The semi-annual component of lod is compared with that of NHSI in Figure 7 (middle) and with that of SHSI in Figure 9 (top). The respective phase differences are 51.8 ± 1.9 days (N) and 19.2 ± 1.5 days (S). Recall that the semi-annual component is present in lod and is not present in . Thanks to the Euler–Liouville system ([11]), we can integrate the lod to obtain the theoretical polar motion that should accompany it, which is shown in Figure 9 (bottom). The agreement in terms of the phase is excellent.

Figure 9.
Comparison of SSA semi-annual components of pole motion (bottom, in arc seconds) and lod (top and middle in ms) with those of NHSI (middle and bottom, Arctic sea-ice in 10 km) and SHSI (top, Antarctic sea-ice in 10 km) for 2010–2022; in the lower frame is not observed, but is computed by integrating lod (see text).
As shown in the previous section, these annual and semi-annual components of NHSI and SHSI are much larger (up to 20 times) than the trends observed since 1978. The mechanisms generally suggested as a forcing factor of the trends (global warming, winds; see [36,45,46,47]) must be dwarfed by a first order geophysical or astronomical forcing. Of course, the annual oscillating components of NHSI and SHSI are in opposite phases in both hemispheres (Figure 2a,b). SHSI is not significantly modulated, whereas NHSI is, which is reminiscent of the classical behavior of a forced oscillator. Polar motion indeed possesses a forced annual component, generally attributed to climate and oceanic/atmospheric sources (see, e.g., [48] or [49] chapter 7).
The lack of modulation of the largest forced component (SHSI) suggests an alternate mechanism. If we follow Laplace’s paradigm, the torques exerted by the Moon, Sun, and planets play the leading role (if not the whole) as the source of forcing (modulation) of many (if not most) geophysical phenomena (generalized Earth tides). These forces (and torques) lead to changes in the inclination of the Earth’s rotation axis, transferring stresses to the Earth’s solid and fluid envelopes, setting Earth masses, and resulting in thermal dissipation. This description is essentially that of [13] with respect to paleo-climates and ice ages; more than variations in eccentricity, it is variations in inclination of the rotation axis that lead to the large annual component of the melting and re-freezing of sea ice.
We have seen in Figure 6 the excellent correlations of lod and with the Sun–Earth distance D in phase opposition and phase, respectively. It is noteworthy that the phase differences of the annual components of NHSI with , SHSI with lod, and D with lod are all equal to 153 days, which happens to be half of the Euler period of 306 days (Table 1).
Let us follow Lambeck’s formulation ([49], chapter 3, system 3.2.9) of the Liouville–Euler equations (see [2]):
where ; (polar coordinate). This is a linear first-order differential system. The annual oscillation of the forcing function that follows sea ice extent variations should behave as or , without phase changes. This is indeed what is seen in Figure 7, Figure 8 and Figure 9, where the phases remain constant. The fact that the phase differences of the polar motion and lod can be recovered from the leading annual components of sea ice strengthens previous findings (e.g., [2,3,10]), with lod and , being strongly linked.
6. Discussion and Conclusions
The differences between the frequency ranges of the length of day (lod) and polar motion (PM) can be understood in the frame of Laplace’s ([11]) formulation of the Liouville–Euler system, which consists of an equation for polar axis inclination and another for the derivative of declination , both depending only on . The second equation, which involves a derivative operator, amounts to a high-pass filter (the derivative operator is the reason that lod contains richer higher frequency components than ), whereas the first behaves as an integrator, i.e., passes lower frequencies.
We now explore further consequences of Laplace’s formulation. We have seen that there is no semi-annual component in the polar motion (e.g., [2,3]). According to the theory of forced oscillators (e.g., [50]), the forcing frequency, (here the annual oscillation) is at the boundary between the two frequency domains. Figure 7 (center) shows that the semi-annual components of NHSI and lod are almost in quadrature (51.8 ± 1.9 days, close to 90/2 = 45 days for quadrature). Because there is a derivative operator between lod and PM, and because from Figure 5, Figure 6 and Figure 7 the forced annual oscillations may be assumed to follow variations in the Earth–Sun distance D in lod, in PM, and finally in NHSI and SHSI with remarkably constant phase differences, any semi-annual oscillation of the lod should theoretically be present in the PM as well. As this would perturb polar motion, it must be eliminated (dissipated), which is why we find it in NHSI and SHSI and in quadrature with lod (Figure 7, bottom).
Integrating the semi-annual component of lod should provide access to the same semi-annual component of that does not exist, but which should be in phase with the semi-annual component of NHSI considering the behavior of the annual component of the sea ice series. The result is shown in Figure 7 (bottom) under the label “calculated ”. The phases and modulations of the two curves are the same (additionally yielding a prediction of the semi-annual component of NHSI). This is why all forced oscillations and their harmonics are found in the variations in sea ice, with very small amplitude modulations and remarkably stable phase differences between both hemispheres and with lod and PM.
The generally accepted origin of the annual oscillation in PM is the reorganization of fluid masses at the Earth surface. We may quote somewhat extensively Lambeck’s introduction ([49], chapter 7):
“The principal seasonal oscillation in the wobble is the annual term which has generally been attributed to a geographical redistribution of mass associated with meteorological causes. Jeffreys, in 1916, first attempted a detailed quantitative evaluation of this excitation function by considering the contributions from atmospheric and oceanic motion, of precipitation, of vegetation and of polar ice. Jeffreys concluded that these factors explain the observed annual polar motion, a conclusion still valid today, although the quantitative comparisons between the observed and computed annual components of the pole path are still not satisfactory. These discrepancies may be a consequence of (i) inadequate data for evaluating the known excitations functions, (ii) the neglect of additional excitation functions, (iii) systematic errors in the astronomical data, or (iv) year-to-year variability in the annual excitation functions”.
In other words, [49] explains that the annual oscillation of PM is in part caused by variations in sea ice and in part by variations in the atmospheric circulation. Regardless of whether one follows [11] or [48], the observations show remarkably constant phase differences; yet, there is no reason for the periodic components of all climate indices to have the same relative or absolute phases (e.g., [5], Figure 10a,b).

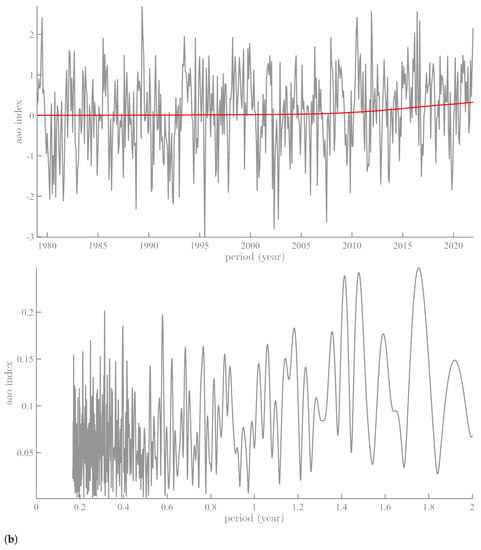
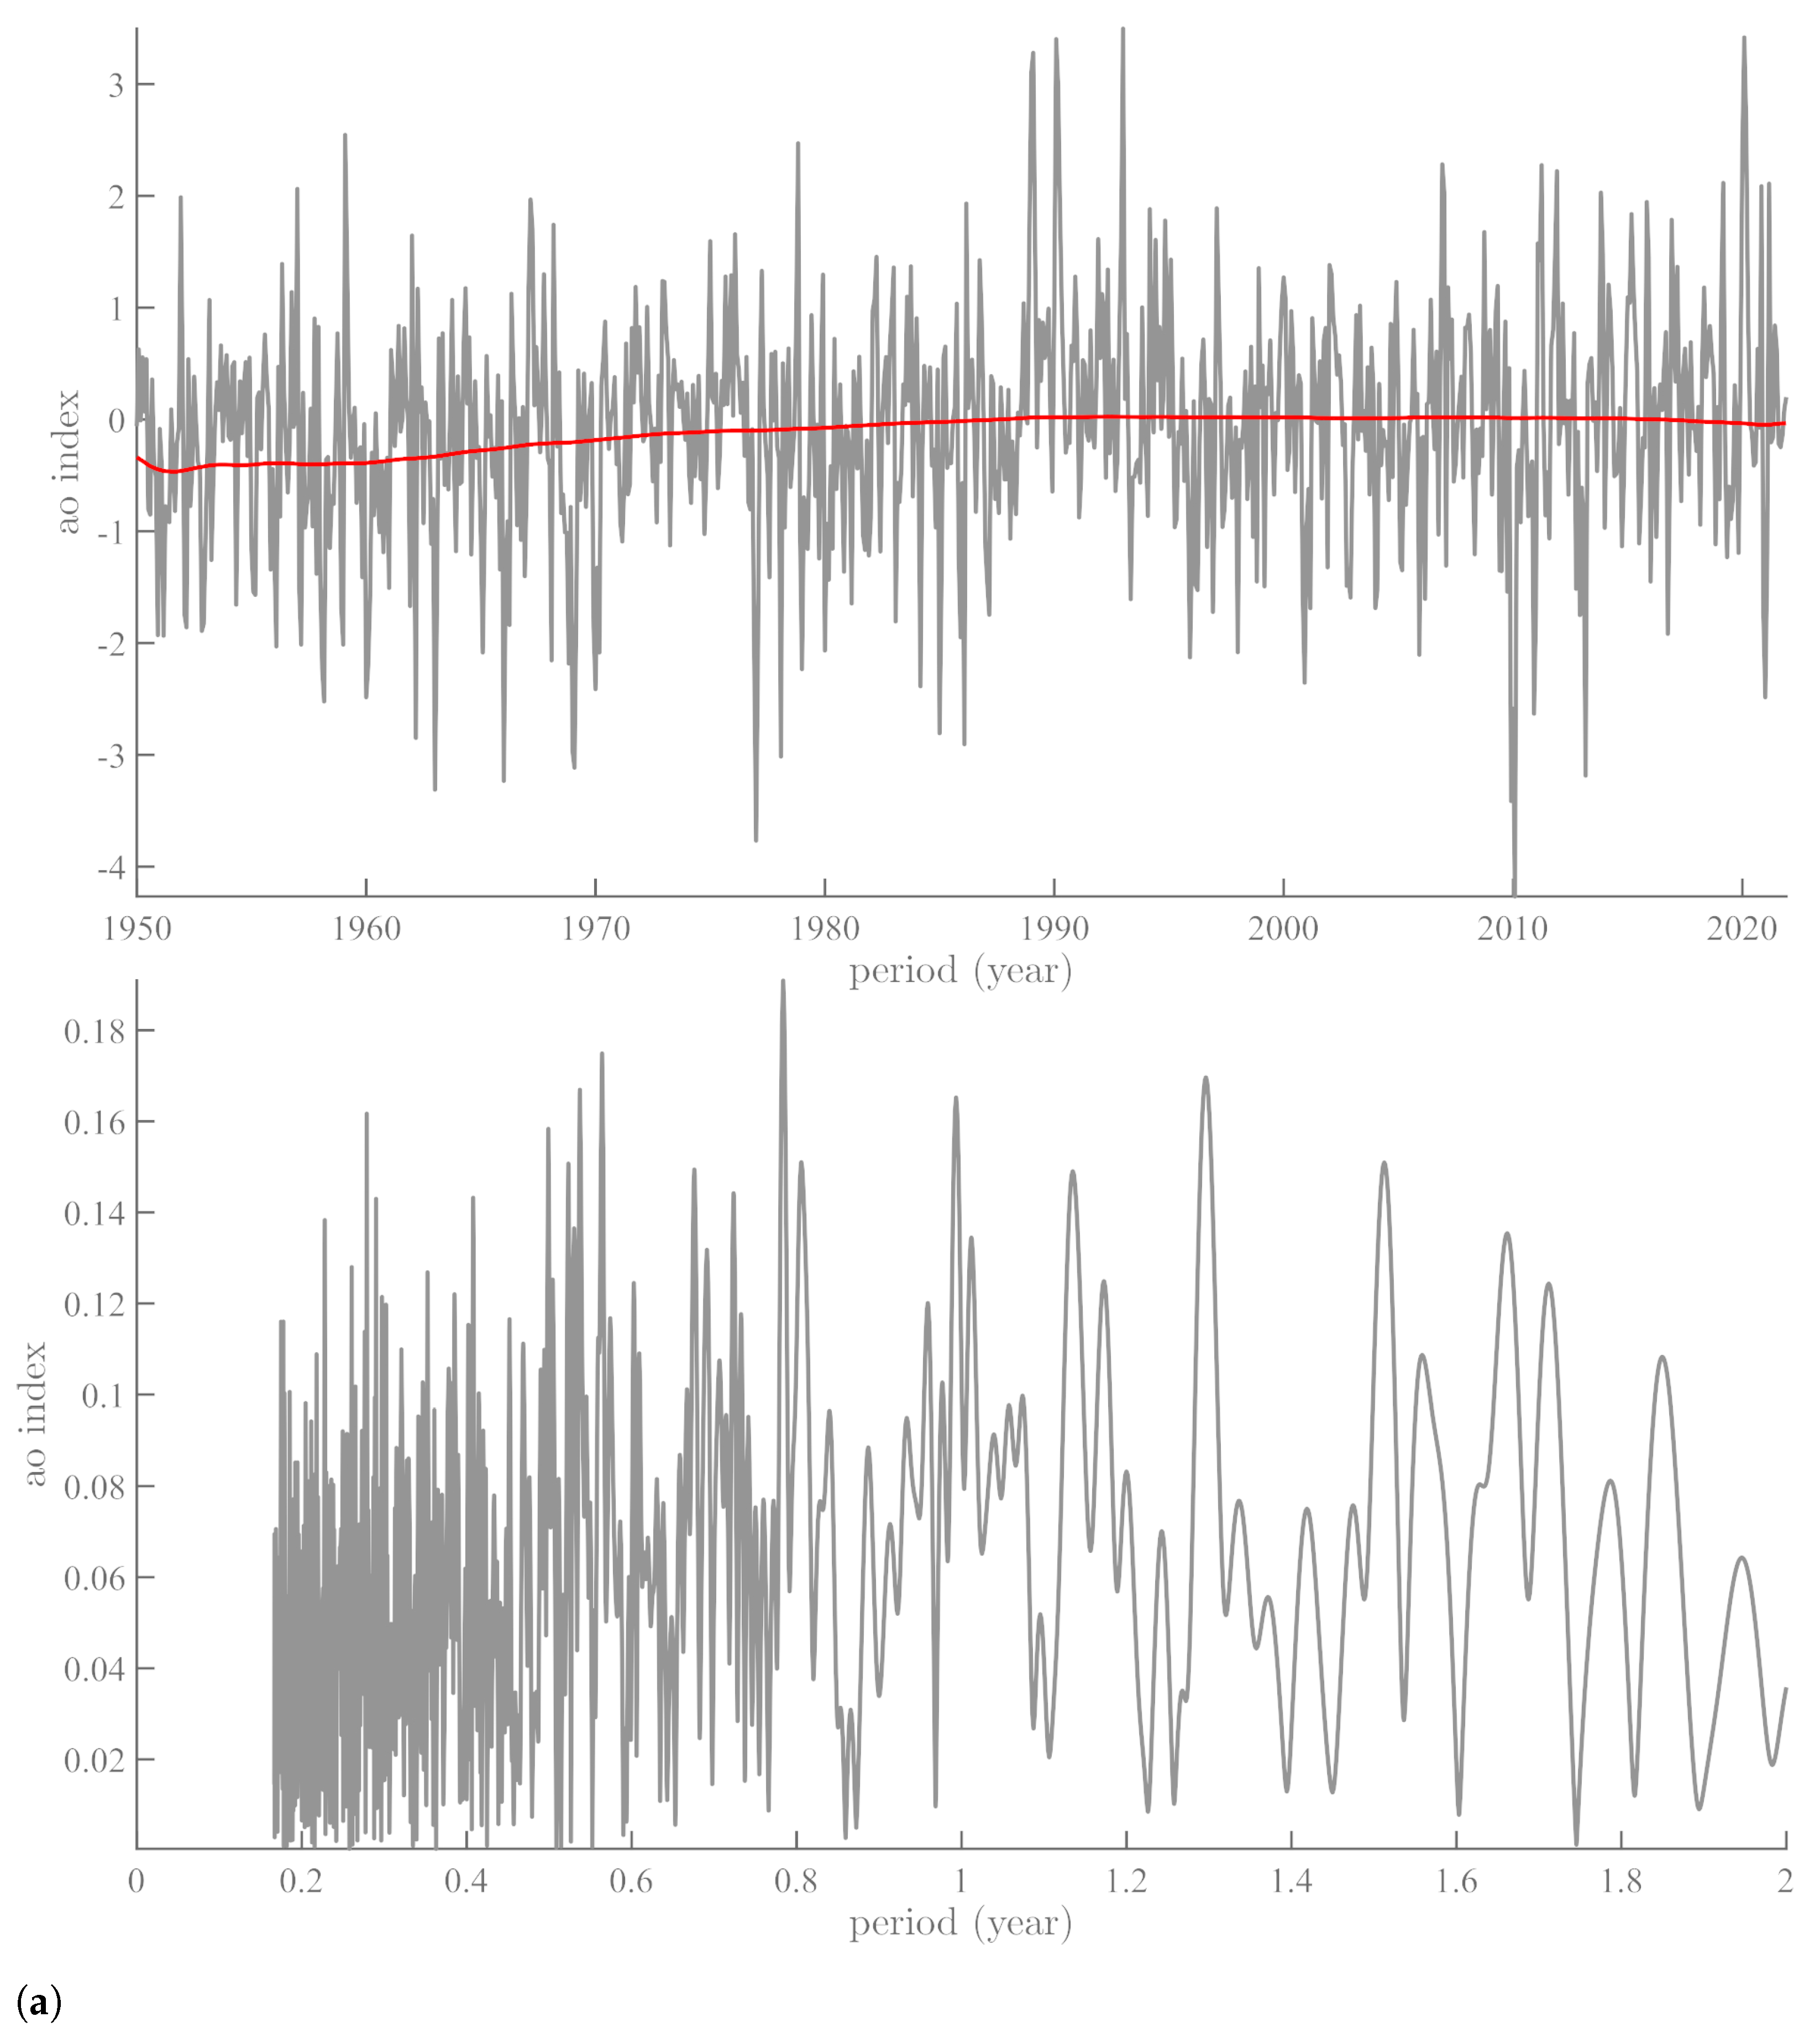
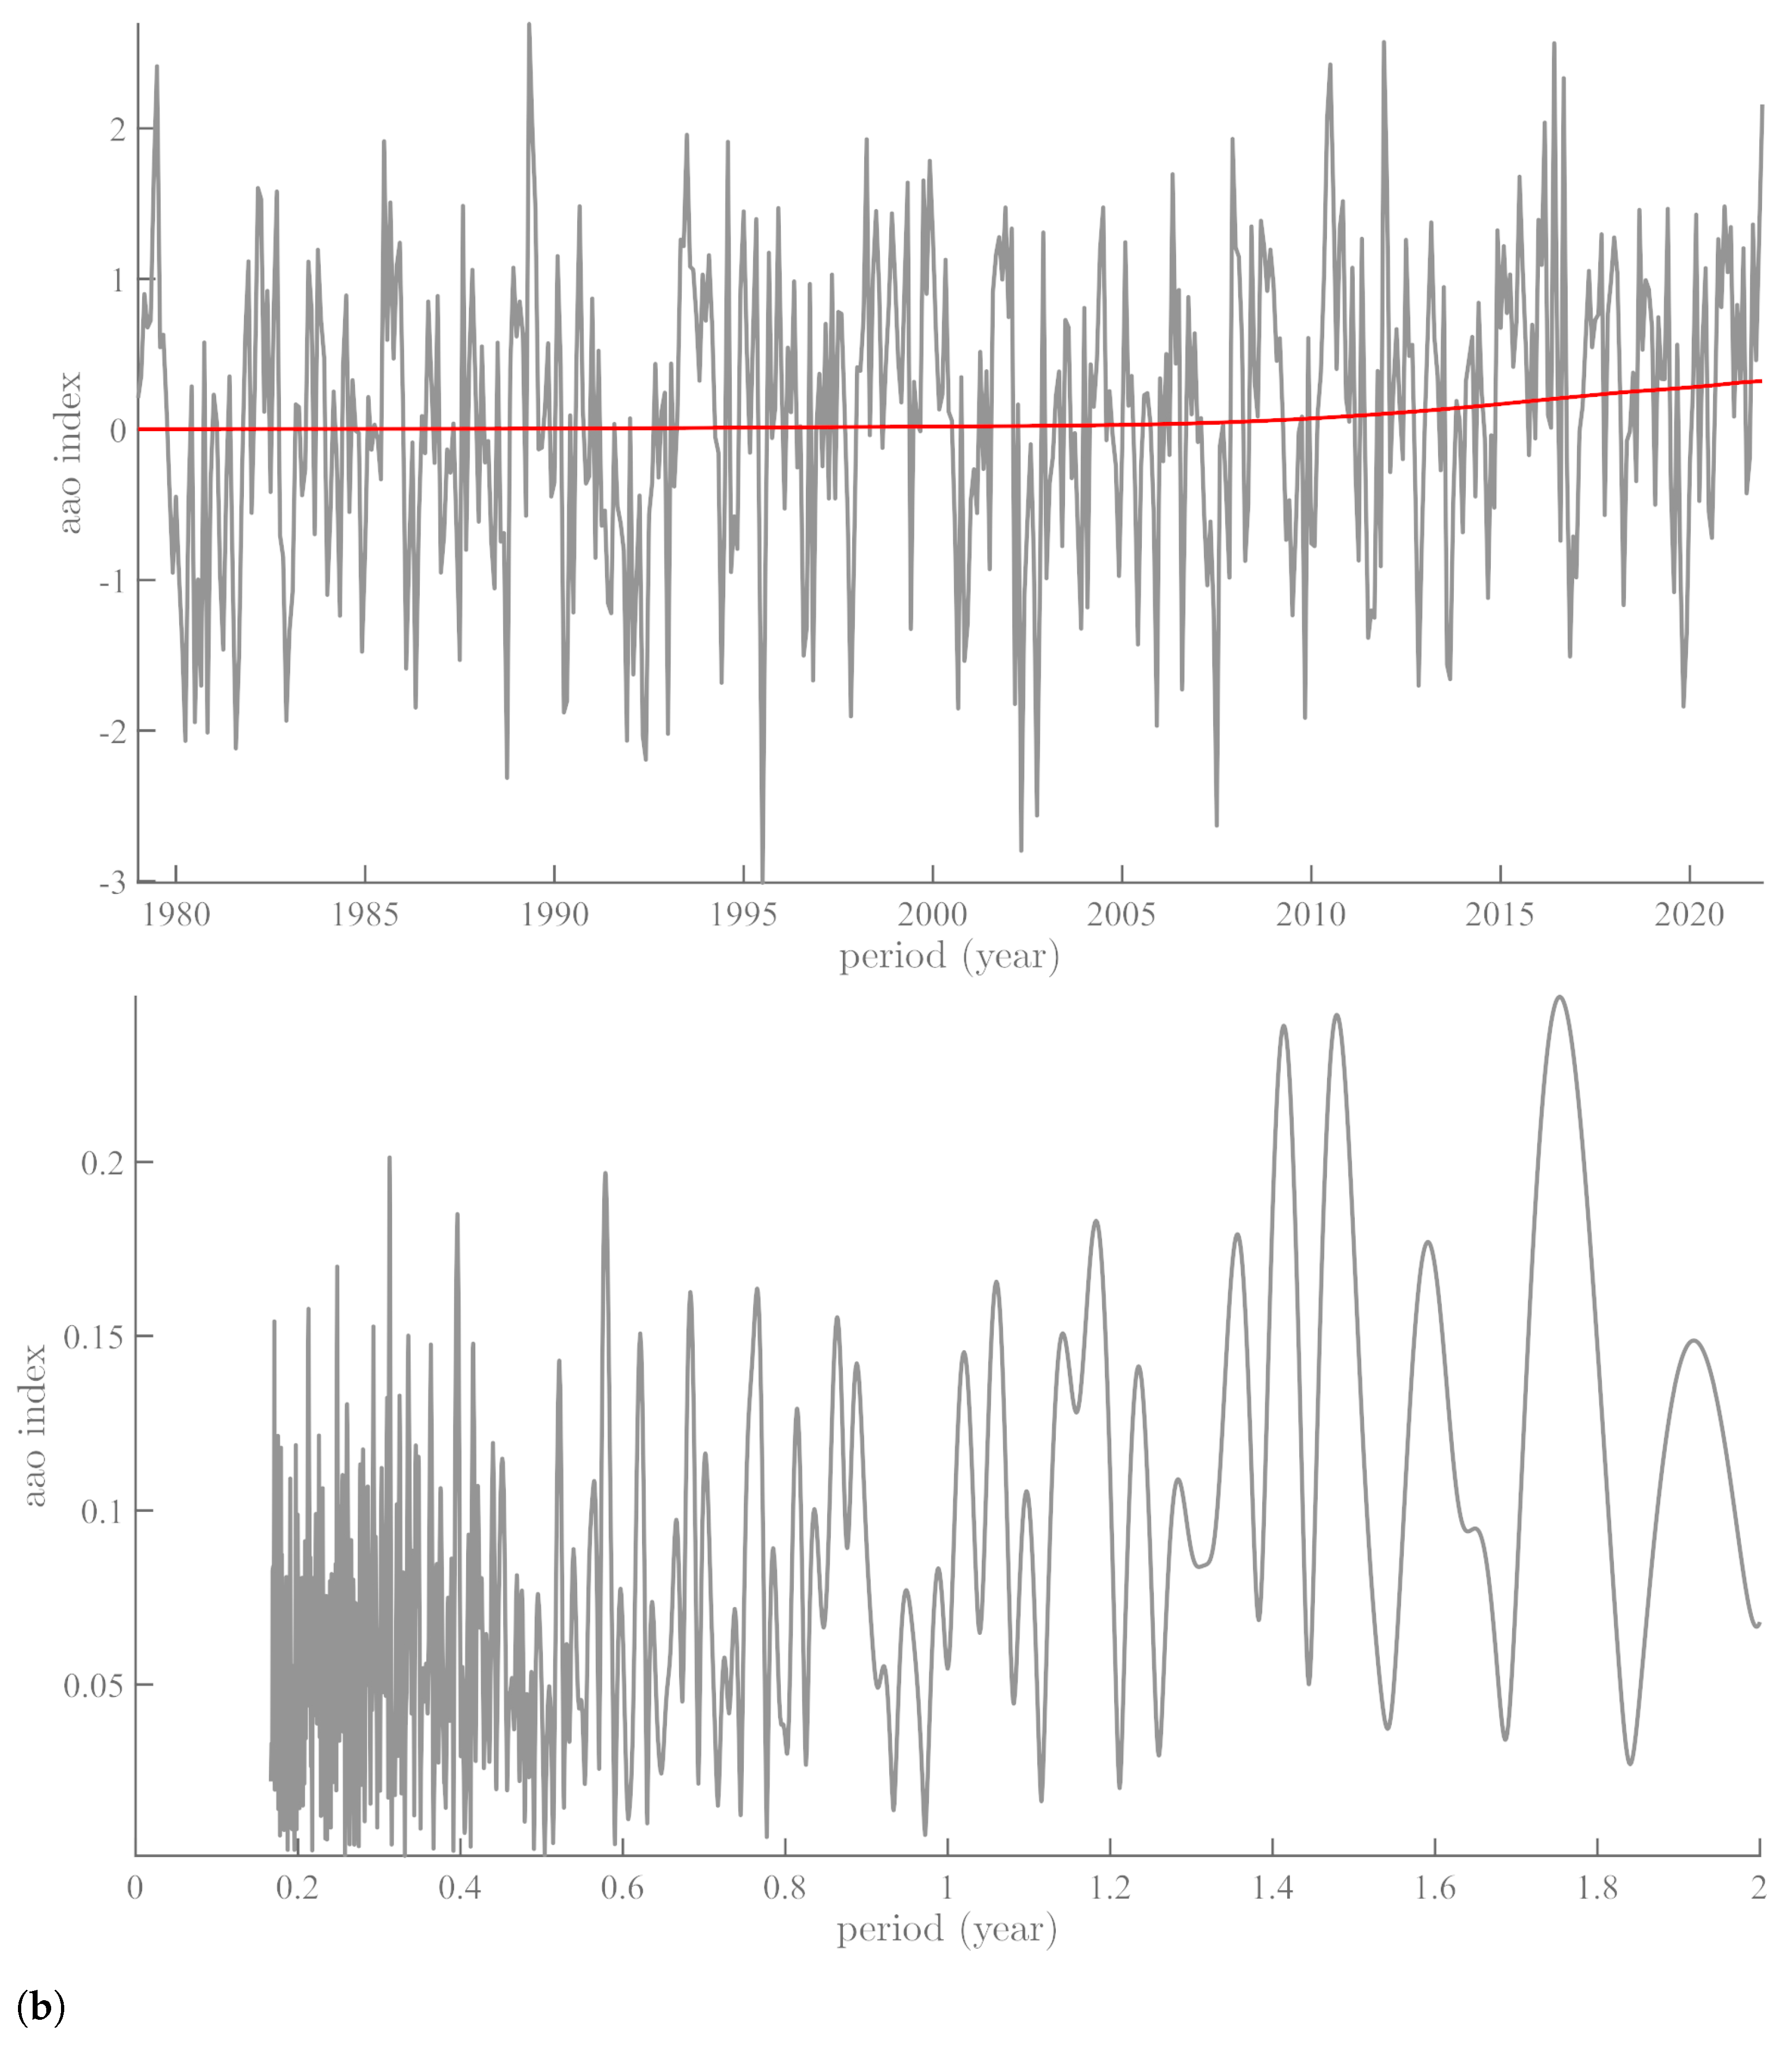
Figure 10.
AO and AAO Indices: (a) AO Index with its mean (red) and spectrum (lower curve); (b) AAO Index with its mean (red) and spectrum (lower curve).
Figure 10a,b shows the Fourier spectrum of the climatic indices associated with the Arctic (AO, [51]) and Antarctic (AAO, [51]) sea ice thickness. It is common to find suggestions in the literature that the evolution of sea ice extent should be captured by its climate indices.
The AO is characteristic of exchanges in atmospheric mass between the Arctic Ocean and the zonal ring centered on 45° N. For instance, [52] have shown how changes in surface winds associated with the trends and fluctuations of AO influence sea ice motion in the center of the Arctic, and how these changes in ice motion in turn influence the thickness and concentration of sea ice and the distribution of surface temperature above the Arctic ([53,54,55]). The AAO monitors the periodic reinforcement and weakening of the circumpolar vortex, and is sometimes called the austral annular mode AAM. It is a stationary mode, unlike the Antarctic circumpolar waves ([56]) that explains a large part of Antarctic climate variability on pluri-annual scales. These two indices, AO and AAO, are widely used to explain the evolution of sea ice since 1978; yet, their spectra (Figure 10a,b) are devoid of any significant annual and semi-annual periodicities, while the NHSI and SHSI series display annual and semi-annual periodicities that amount to more than 98% of the total signal variance. Nor are annual and semi-annual periodicities found in either AO or AAO. Overall, neither annual nor semi-annual periodicities are found in either ten MJO indices or several other index series, such as PDO and ENSO ([5]). On the other hand, polar motion and length of day are global phenomena that could explain the regularity of the phase and amplitude modulations of oscillating sea ice components at 1 and 0.5 year.
Thus, Laplace’s formulation by and modern analysis of the periodic and semi-periodic components of sea ice variations are not that far from one another, although the direction of causality may have to be changed. If we follow Laplace’s view, variations in sea ice extent are a consequence of polar motion, as can be read from the Liouville–Euler equations. On the other hand, in the modern interpretation, they are consequences of wind speed variations that should be reflected by indices such as AAO and AO. We have already discussed the impact of the AAO index on the spatial variations of the annual and semi-annual components of the SLP ([57]).
The results obtained in this paper on the phases and amplitudes of the SSA components of NHSI and SHSI lead us to prefer Laplace’s formulation. This formulation allows us to understand the presence of the harmonic series (1, 1/2, 1/3, 1/4, 1/5, 1/6, 1/7, and 1/8 yr) in Figure 1b. In a schematic way, variations in sea ice extent are the infinitesimal (incremental) expression of oceanic motion, a topic that requires use of the theory of fluid mechanics of turbulent flow. There is no solution of this problem in the spherical case [58,59,60,61,62,63,64], although there is one in the case of flow between two coaxial cylinders [65,66,67,68]. The perturbation in flow velocity can be written as
where integer n is the order of symmetry (n=0 for axial symmetry) and k is the wavelength of the instability. Acceptable values of the annual oscillation are obtained by solving Equation (14) under the appropriate boundary conditions ( = 0 for r = and r = ). The Reynolds number can be taken as (or , as and are given. For fixed n and k, the values of form a discrete suite . By analogy with Earth, the solid surface and free surface of the atmosphere are such that , and the only solutions for abs() are 1 day and 1 year. Therefore, we should try to find harmonics of these two values. A detailed study of the solution of Equation (2) in the case of co-axial cylinders is provided by [67]. The flows are stationary toric vortices, known as Taylor vortices, regularly placed along the cylinder generatrices. In the case of two cylinders rotating in the same sense, we find two vortices rotating in opposite directions, , being the critical wavelength above which is not 0. Thus, we know how to describe the figure of the turbulent flow between two co-axial cylinders.
In light of the above, it is no surprise to find the series of harmonics of the annual forcing. Furthermore, the term in Equation (14) forces the spatial symmetries of the flow. This is already known regarding the variations of the sea ice dipole in Antarctica (cf. [69,70,71]) and variations in the trends of global atmospheric pressure (cf. [6]). These spatial and temporal variations seem to be better explained by Taylor–Couette type flow forced by variations in polar motion (rotation), in essentially the same way as envisioned by Laplace [11].
Author Contributions
F.L., V.C., D.G. and J.-L.L.M. contributed to conceptualization, formal analysis, interpretation, and writing. All authors have read and agreed to the published version of the manuscript.
Funding
This research was supported by the Université de Paris, IPGP, and the LGL-TPE de Lyon.
Data Availability Statement
The used data are freely available at the following addresses: Sea Ice extent, NOAA: https://nsidc.org/data/seaice_index/data-and-image-archive, accessed on 2 April 2022; IERS, https://www.iers.org/IERS/EN/DataProducts/EarthOrientationData/eop.html, accessed on 2 April 2022.
Conflicts of Interest
The authors declare that they have no known competing financial interest or personal relationships that could have influenced or appeared to influence the work reported in this paper.
Appendix A
Laplace ([11], vol. 5, cap. 1, page 347), in French:
“Nous avons fait voir (n°8), que le moyen mouvement de rotation de la Terre est uniforme, dans la supposition que cette planète est entièrement solide, et l’on vient de voir que la fluidité de la mer et de l’atmosphère ne doit point altérer ce résultat. Les mouvements que la chaleur du Soleil excite dans l’atmosphère, et d’où naissent les vents alizés semblent devoir diminuer la rotation de la Terre: ces vents soufflent entre les tropiques, d’occident en orient, et leur action continuelle sur la mer, sur les continents et les montagnes qu’ils rencontrent, paraît devoir affaiblir insensiblement ce mouvement de rotation. Mais le principe de conservation des aires, nous montre que l’effet total de l’atmosphère sur ce mouvement doit être insensible; car la chaleur solaire dilatant également l’air dans tous les sens, elle ne doit point altérer la somme des aires décrites par les rayons vecteurs de chaque molécule de la Terre et de l’atmosphère, et multipliées respectivement par leur molécules correspondantes; ce qui exige que le mouvement de rotation ne soit point diminué. Nous sommes donc assurés qu’en même temps que les vents analysés diminuent ce mouvement, les autres mouvements de l’atmosphère qui ont lieu au-delà des tropiques, l’accélèrent de la même quantité. On peut appliquer le même raisonnement aux tremblements de Terre, et en général, à tous ce qui peut agiter la Terre dans son intérieur et à sa surface. Le déplacement de ces parties peut seul altérer ce mouvement; si, par exemple un corps placé au pole, était transporté à l’équateur; la somme des aires devant toujours rester la même, le mouvement de la Terre en serait un peu diminué; mais pour que cela fut sensible, il faudrait supposer de grands changement dans la constitution de la Terre”.
Appendix B

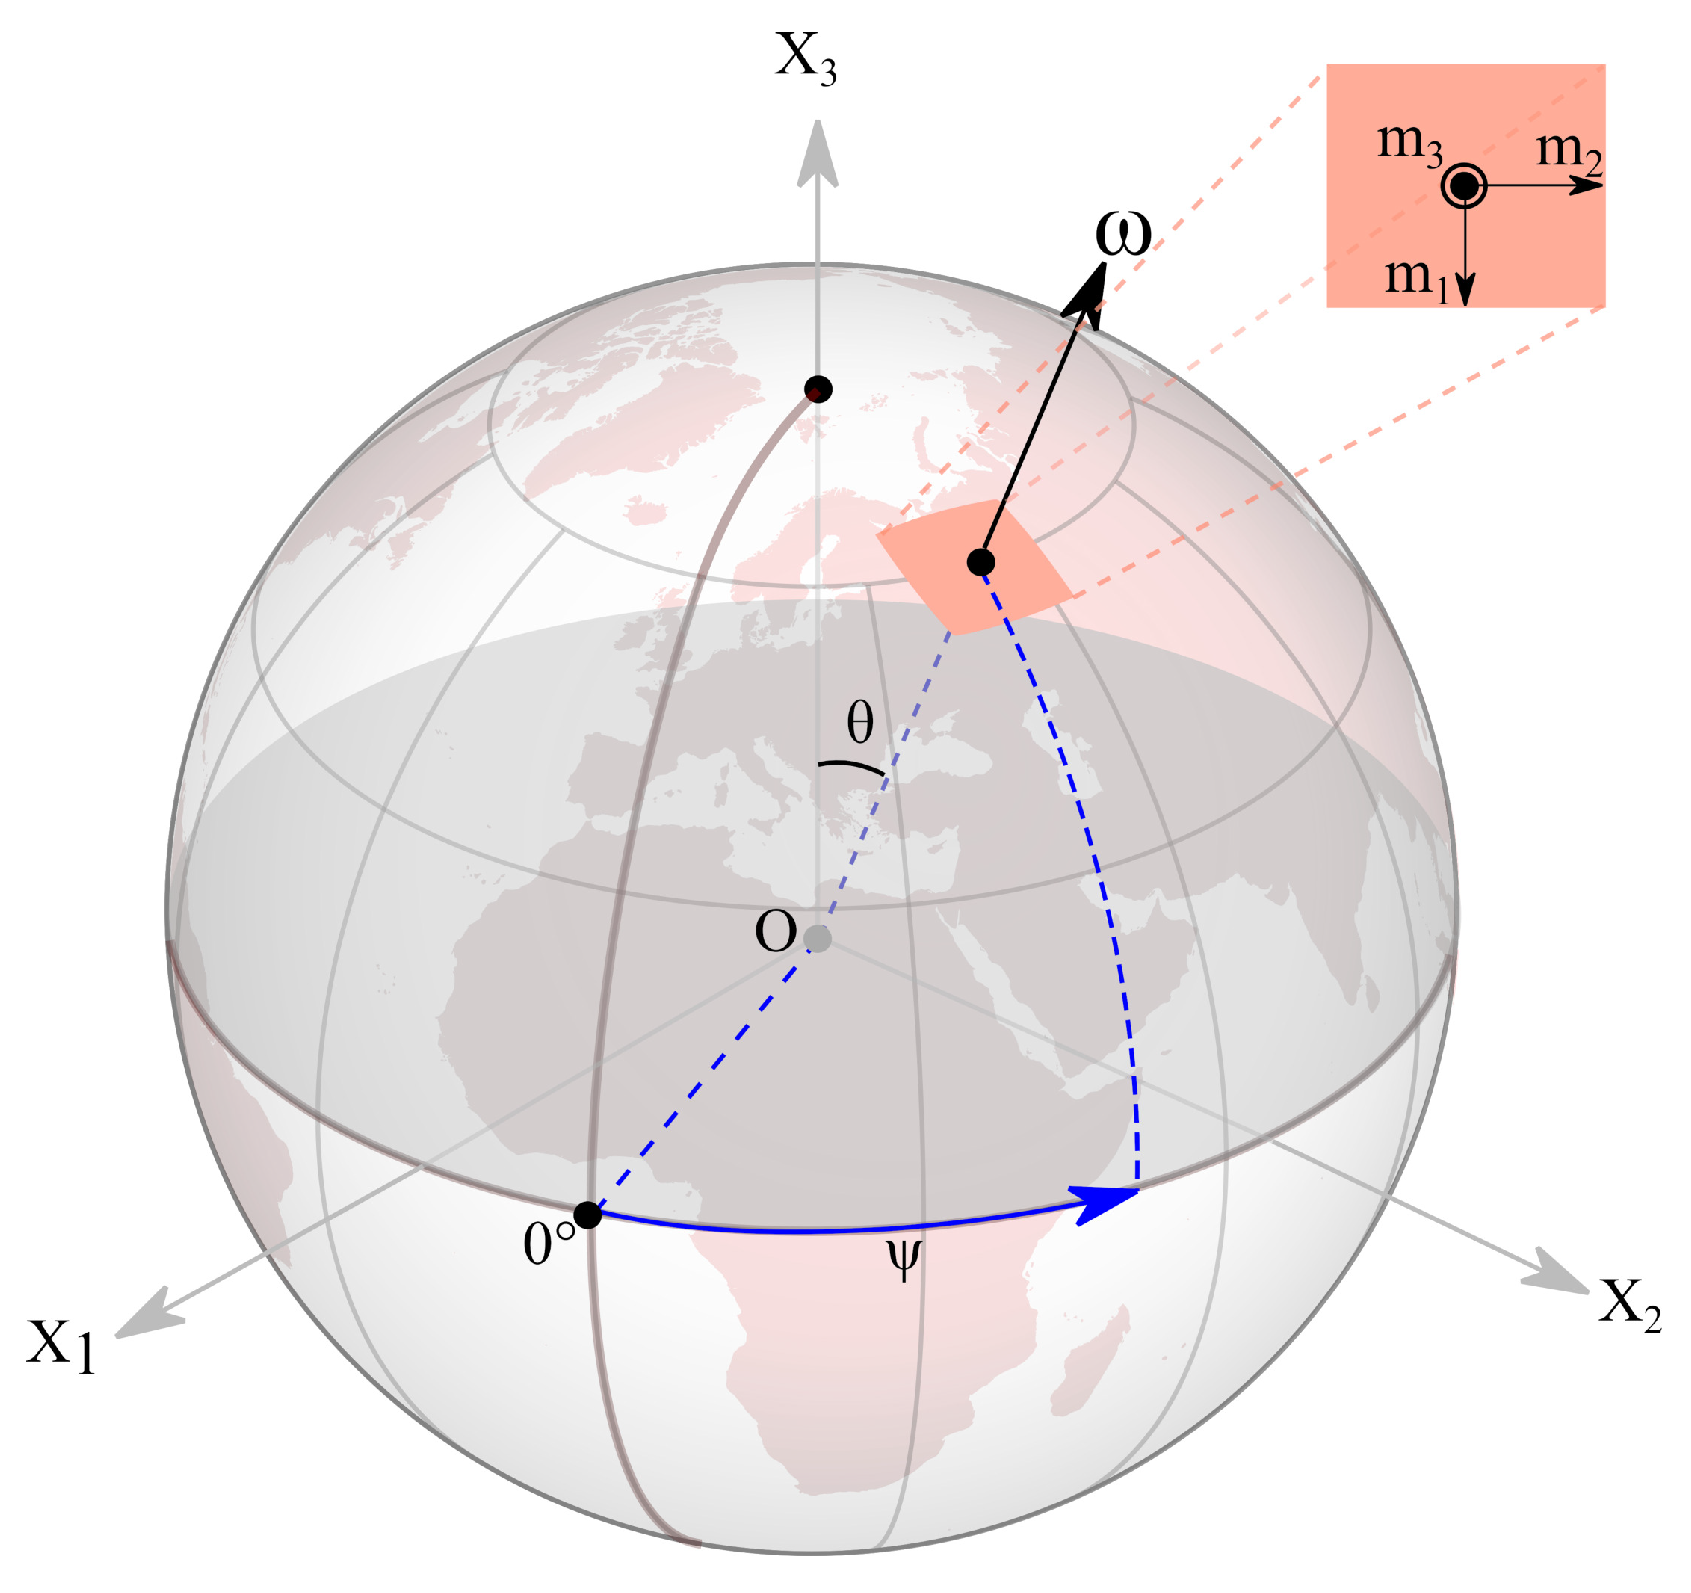
Figure A1.
Terrestrial reference frame; and are the coordinates of the rotation pole, while and are the declination and inclination, respectively, introduced by Laplace [11].
Figure A1.
Terrestrial reference frame; and are the coordinates of the rotation pole, while and are the declination and inclination, respectively, introduced by Laplace [11].
Laplace provides the full equations with the Sun and Moon included:
Note that and depend on and not on .
The inclination of the rotation axis has the current value h in the first equation; is linked to the Earth’s rotation, and thus to the lod. On the right side of the two equations are the ephemerids and masses of the Moon and Sun that enter the classical theory of gravitation (see Appendix in [2] for more details). The length of day and polar inclination are clearly connected by the first relationship. Thus, Laplace reduces the problem to a system of two equations for the inclination and time derivative of the declination of the Earth’s rotation axis; and (and the norm that can be considered as a known constant) provide the direction of the polar rotation axis and its variations, while the time difference (in ms) between the theoretical and measured rotation of the Earth is proportional as , with v being the rotation velocity and the Earth’s radius a constant. Here, either alone, v alone, or both together can vary. We assume the former, as the mean rotation rate apparently remains constant, as already noted above; furthermore, the two equations imply the need to study the time derivative of declination of the rotation axis, which is a quantity that is linearly related to the derivative of lod.
References
- Le Mouël, J.L.; Lopes, F.; Courtillot, V.; Gibert, D. On forcings of length of day changes: From 9-day to 18.6-year oscillations. Phys. Earth Planet. Inter. 2019, 292, 1–11. [Google Scholar] [CrossRef]
- Lopes, F.; Le Mouël, J.L.; Courtillot, V.; Gibert, D. On the shoulders of Laplace. Phys. Earth Planet. Inter. 2021, 316, 106693. [Google Scholar] [CrossRef]
- Lopes, F.; Courtillot, V.; Gibert, D.; Mouël, J.-L.L. On Two Formulations of Polar Motion and Identification of Its Sources. Geosciences 2022, 12, 398. [Google Scholar] [CrossRef]
- Courtillot, V.; Le Mouël, J.L.; Kossobokov, V.; Gibert, D.; Lopes, F. Multi-Decadal Trends of Global Surface Temperature: A Broken Line with Alternating ∼30 yr Linear Segments ? NPJ Clim. Atmos. Sci. 2013, 3. Available online: http://www.scirp.org/journal/PaperInformation.aspx?PaperID=34080 (accessed on 12 January 2023). [CrossRef]
- Le Mouël, J.L.; Lopes, F.; Courtillot, V. A solar signature in many climate indices. J. Geophys. Res. Atmos. 2019, 124, 2600–2619. [Google Scholar] [CrossRef]
- Lopes, F.; Courtillot, V.; Le Mouël, J.-L. Triskeles and Symmetries of Mean Global Sea-Level Pressure. Atmosphere 2022, 13, 1354. [Google Scholar] [CrossRef]
- Le Mouël, J.L.; Lopes, F.; Courtillot, V. Characteristic time scales of decadal to centennial changes in global surface temperatures over the past 150 years. Earth Planets Space 2020, 7, e2019EA000671. [Google Scholar] [CrossRef]
- Lopes, F.; Courtillot, V.; Gibert, D.; Le Mouël, J.-L. Extending the Range of Milankovic Cycles and Resulting Global Temperature Variations to Shorter Periods (1–100 Year Range). Geosciences 2022, 12, 448. [Google Scholar] [CrossRef]
- Le Mouël, J.L.; Lopes, F.; Courtillot, V. Solar turbulence from sunspot records. Mon. Notices Royal Astron. Soc. 2021, 492, 1416–1420. [Google Scholar] [CrossRef]
- Courtillot, V.; Lopes, F.; Le Mouël, J.L. On the prediction of solar cycles. Sol. Phys. 2021, 296, 1–23. [Google Scholar] [CrossRef]
- Laplace, P.S. Traité de Mécanique Céleste; l’Imprimerie de Crapelet: Paris, France, 1799. [Google Scholar]
- Lopes, F.; Courtillot, C.; Gibert, D.; Le Mouël, J.L. On pseudo-periodic perturbations of planetary orbits, and oscillations of Earth’s rotation and revolution: Lagrange’s formulation. arXiv 2022, arXiv:2209.07213. [Google Scholar] [CrossRef]
- Milanković, M. Théorie Mathématique des phéNomènes Thermiques Produits par la Radiation Solaire; Faculté des Sciences de l’Université de Belgrade, Gauthier-Villard Edition: Paris, France, 1920. [Google Scholar]
- Mörth, H.T.; Schlamminger, L. Planetary Motion, Sunspots and Climate, Solar-Terrestrial Influences on Weather and Climate; Springer: Dordrecht, The Netherlands, 1979; Volume 193. [Google Scholar]
- Fairbridge, R.W. Planetary periodicities and terrestrial climate stress. In Climatic Changes on a Yearly to Millennial Basis; Springer: Dordrecht, The Netherlands, 1984; pp. 509–520. [Google Scholar]
- Mörner, N.A. Planetary, solar, atmospheric, hydrospheric and endogene processes as origin of climatic changes on the Earth. In Climatic Changes on a Yearly to Millennial Basis; Springer: Dordrecht, The Netherlands, 1984; pp. 483–507. [Google Scholar]
- Laskar, J.; Robutel, P.; Joutel, F.; Gastineau, M.; Correia, A.C.M.; Levrard, B. A long-term numerical solution for the insolation quantities of the Earth. Astron. Astrophys. 2004, 428, 261–285. [Google Scholar] [CrossRef]
- Scafetta, N. Empirical evidence for a celestial origin of the climate oscillations and its implications. J. Atmos. Sol. Terr. Phys. 2010, 72, 951–970. [Google Scholar] [CrossRef]
- Barnhart, B.L.; Eichinger, W.E. Empirical mode decomposition applied to solar irradiance, global temperature, sunspot number, and CO2 concentration data. J. Atmos. Sol. Terr. Phys. 2011, 73, 1771–1779. [Google Scholar] [CrossRef]
- Manzi, V.; Gennari, R.; Lugli, S.; Roveri, M.; Scafetta, N.; Schreiber, B.C. High-frequency cyclicity in the Mediterranean Messinian evaporites: Evidence for solar–lunar climate forcing. J. Sediment. Res. 2012, 82, 991–1005. [Google Scholar] [CrossRef]
- Scafetta, N. Multi-scale harmonic model for solar and climate cyclical variation throughout the Holocene based on Jupiter–Saturn tidal frequencies plus the 11-year solar dynamo cycle. J. Atmos. Sol. Terr. Phys. 2012, 80, 296–311. [Google Scholar] [CrossRef]
- Mörner, N.A. Planetary beat and solar–terrestrial responses. Pattern. Recognit. Phys. 2013, 1, 107–116. [Google Scholar] [CrossRef]
- Scafetta, N. Discussion on climate oscillations: CMIP5 general circulation models versus a semi-empirical harmonic model based on astronomical cycles. Earth-Sci. Rev. 2013, 126, 321–357. [Google Scholar] [CrossRef]
- Lopes, F.; Le Mouël, J.L.; Gibert, D. The mantle rotation pole position. A solar component. CR Geosci. 2017, 349, 159–164. [Google Scholar] [CrossRef]
- Boulila, S.; Laskar, J.; Haq, B.U.; Galbrun, B.; Hara, N. Long-term cyclicities in Phanerozoic sea-level sedimentary record and their potential drivers. Glob. Planet Chang. 2018, 165, 128–136. [Google Scholar] [CrossRef]
- Dumont, S.; Le Mouël, J.L.; Courtillot, V.; Lopes, F.; Sigmundsson, F.; Coppola, D.; Eibl, E.P.S.; Bean, C.J. The dynamics of a long-lasting effusive eruption modulated by Earth tides. Earth Planet. Sci. Lett. 2020, 536, 116145. [Google Scholar] [CrossRef]
- Dumont, S.; Silveira, G.; Custódio, S.; Lopes, F.; Le Mouël, J.L.; Courtillot, V.; Gouhier, M.; Guéhenneux, Y. Response of Fogo volcano (Cape Verde) to lunisolar gravitational forces during the 2014–2015 eruption. Phys. Earth Planet. Inter. 2021, 312, 106659. [Google Scholar] [CrossRef]
- Petrosino, S.; Dumont, S. Tidal modulation of hydrothermal tremor: Examples from Ischia and Campi Flegrei volcanoes, Italy. Front. Earth Sci. 2022, 9, 775269. [Google Scholar] [CrossRef]
- Bank, M.J.; Scafetta, N. Scaling, mirror symmetries and musical consonances among the distances of the planets of the solar system. Front. Astron. Space Sci. 2022, 8, 758184. [Google Scholar] [CrossRef]
- Dumont, S.; Custódio, S.; Petrosino, S.; Thomas, A.M.; Sottili, G. Tides, earthquakes, and volcanic eruptions. In A Journey through Tides; Elsevier: Amsterdam, The Netherlands, 2023; pp. 333–364. [Google Scholar] [CrossRef]
- Cavalieri, D.J.; Parkinson, C.L. Arctic sea ice variability and trends, 1979–2010. Cryosphere 2012, 6, 881. [Google Scholar] [CrossRef]
- Fetterer, F.; Knowles, K.; Meier, W.N.; Savoie, M.; Windnagel, A.K. Sea Ice Index; National Snow and Ice Data Center: Boulder, CO, USA, 2017. [Google Scholar]
- Cavalieri, D.J.; Parkinson, C.L.; Gloersen, P.; Zwally, H.J. Arctic and Antarctic Sea Ice Concentrations from Multichannel Passive-Microwave Satellite Data Sets: October 1978–September 1995 User’s Guide NASA Tech. Mem. 104647; Goddard Space Flight Center: Greenbelt, MD, USA, 1997; p. 21. [Google Scholar]
- Cavalieri, D.J.; Parkinson, C.L.; Gloersen, P.; Comiso, J.C.; Zwally, H.J. Deriving long-term time series of sea ice cover from satellite passive microwave multisensor data sets. J. Geophys. Res. Oceans 1999, 104, 15803–15814. [Google Scholar] [CrossRef]
- Cavalieri, D.J.; Parkinson, C.L.; Di Girolamo, N.; Ivanoff, A. Intersensor calibration between F13 SSMI and F17 SSMIS for global sea ice data records. IEEE Geosci. Remote. Sens. Lett. 2011, 9, 233–236. [Google Scholar] [CrossRef]
- Parkinson, C.L. A 40-y record reveals gradual Antarctic sea ice increases followed by decreases at rates far exceeding the rates seen in the Arctic. Proc. Natl. Acad. Sci. USA 2019, 116, 14414–14423. [Google Scholar] [CrossRef]
- Golyandina, N.; Zhigljavsky, A. Singular Spectrum Analysis; Springer: Berlin/Heidelberg, Germany, 2013. [Google Scholar]
- Lemmerling, P.; Van Huffel, S. Analysis of the structured total least squares problem for Hankel/Toeplitz matrices. Numer. Algorithms 2001, 27, 89–114. [Google Scholar] [CrossRef]
- Golub, G.H.; Reinsch, C. Singular Value Decomposition and Least Squares Solutions; Linear Algebra; Springer: Berlin/Heidelberg, Germany, 1971; pp. 134–151. [Google Scholar]
- Markowitz, W. Concurrent astronomical observations for studying continental drift, polar motion, and the rotation of the Earth. In Symposium-International Astronomical Union; Cambridge University Press: Cambridge, UK, 1968; Volume 32, pp. 25–32. [Google Scholar]
- Le Mouël, J.L.; Lopes, F.; Courtillot, V. Identification of Gleissberg cycles and a rising trend in a 315-year-long series of sunspot numbers. Sol. Phys. 2017, 292, 1–9. [Google Scholar] [CrossRef]
- Le Mouël, J.L.; Lopes, F.; Courtillot, V. Sea-Level Change at the Brest (France) Tide Gauge and the Markowitz Component of Earth’s Rotation. J. Coast. Res. 2021, 37, 683–690. [Google Scholar] [CrossRef]
- Chandler, S.C. On the variation of latitude, I. Astron. J. 1891, 11, 59–61. [Google Scholar] [CrossRef]
- Chandler, S.C. On the variation of latitude, II. Astron. J. 1891, 11, 65–70. [Google Scholar] [CrossRef]
- Zwally, H.J.; Comiso, J.C.; Parkinson, C.L.; Cavalieri, D.J.; Gloersen, P. Variability of Antarctic sea ice 1979–1998. J. Geophys. Res. 2002, 107, 1–9. [Google Scholar] [CrossRef]
- Zhang, J. Increasing Antarctic sea ice under warming atmospheric and oceanic conditions. J. Clim. 2007, 20, 2515–2529. [Google Scholar] [CrossRef]
- Turner, J.; Hosking, J.S.; Bracegirdle, T.J.; Marshall, G.J.; Phillips, T. Recent changes in Antarctic sea ice. Philos. Trans. Royal Soc. A 2015, 373, 20140163. [Google Scholar] [CrossRef]
- Jeffreys, H. Causes contributory to the Annual Variation of Latitude. Mon. Notices Royal Astron. Soc. 1916, 76, 499–525. [Google Scholar] [CrossRef]
- Lambeck, K. The Earth’s Variable Rotation: Geophysical Causes and Consequences; Cambridge University Press: Cambridge, UK, 2005. [Google Scholar]
- Landau, L.D.; Lifshitz, E.M. Mechanics; Mir: Moscow, Russia, 1989. [Google Scholar]
- Thompson, D.W.; Wallace, J.M. The Arctic Oscillation signature in the wintertime geopotential height and temperature fields. Geophys. Res. Lett. 1998, 25, 1297–1300. [Google Scholar] [CrossRef]
- Rigor, I.G.; Wallace, J.M.; Colony, R.L. Response of sea ice to the Arctic Oscillation. J. Clim. 2002, 15, 2648–2663. [Google Scholar] [CrossRef]
- Stroeve, J.; Holland, M.M.; Meier, W.; Scambos, T.; Serreze, M. Arctic sea ice decline: Faster than forecast. Geophys. Res. Lett. 2007, 34. [Google Scholar] [CrossRef]
- Serreze, M.C.; Meier, W.N. The Arctic’s sea ice cover: Trends, variability, predictability, and comparisons to the Antarctic. Ann. N. Y. Acad. Sci. 2019, 1436, 36–53. [Google Scholar] [CrossRef] [PubMed]
- Cohen, J.; Zhang, X.; Francis, J.; Jung, T.; Kwok, R.; Overland, J.; Yoon, J. Divergent consensuses on Arctic amplification influence on midlatitude severe winter weather. Nat. Clim. Chang. 2020, 10, 20–29. [Google Scholar] [CrossRef]
- White, W.B.; Peterson, R.G. An Antarctic circumpolar wave in surface pressure, wind, temperature and sea-ice extent. Nature 1996, 380, 699–702. [Google Scholar] [CrossRef]
- Courtillot, V.; Le Mouël, J.-L.; Lopes, F.; Gibert, D. On the Nature and Origin of Atmospheric Annual and Semi-Annual Oscillations. Atmosphere 2022, 13, 1907. [Google Scholar] [CrossRef]
- Schrauf, G. The first instability in spherical Taylor-Couette flow. J. Fluid Mech. 1986, 166, 287–303. [Google Scholar] [CrossRef]
- Mamun, C.K.; Tuckerman, L.S. Asymmetry and Hopf bifurcation in spherical Couette flow. Phys. Fluids 1995, 7, 80–91. [Google Scholar] [CrossRef]
- Nakabayashi, K.; Tsuchida, Y. Flow-history effect on higher modes in the spherical Couette system. J. Fluid Mech. 1995, 295, 43–60. [Google Scholar] [CrossRef]
- Hollerbach, R.; Junk, M.; Egbers, C. Non-axisymmetric instabilities in basic state spherical Couette flow. Fluid. Dyn. Res. 2006, 38, 257. [Google Scholar] [CrossRef]
- Mahloul, M.; Mahamdia, A.; Kristiawan, M. The spherical Taylor–Couette flow. Eur. J. Mech. B Fluids 2016, 59, 1–6. [Google Scholar] [CrossRef]
- Garcia, F.; Seilmayer, M.; Giesecke, A.; Stefani, F. Modulated rotating waves in the magnetised spherical Couette system. J. Nonlinear Sci. 2019, 29, 2735–2759. [Google Scholar] [CrossRef]
- Mannix, P.M.; Mestel, A.J. Bistability and hysteresis of axisymmetric thermal convection between differentially rotating spheres. J. Fluid Mech. 2021, 911. [Google Scholar] [CrossRef]
- Taylor, G.I. VIII. Stability of a viscous liquid contained between two rotating cylinders. Philos. Trans. R. Soc. Ser. A Contain. Pap. Math. Phys. Character 1923, 223, 289–343. [Google Scholar]
- Landau, L.D.; Lifshitz, E.M. Fluid Mechanics; Pergamonl: New York, NY, USA, 1959; Volume 61. [Google Scholar]
- Chandrasekhar, S. Hydrodynamic and Hydromagnetic Stability; Oxford University Press: Oxford, UK, 1961. [Google Scholar]
- Frisch, U. Turbulence: The Legacy of AN Kolmogorov; Cambridge University Press: Cambridge, UK, 1995. [Google Scholar]
- Holland, M.M.; Landrum, L.; Raphael, M.; Stammerjohn, S. Springtime winds drive Ross Sea ice variability and change in the following autumn. Nature Comm. 2017, 8, 1–8. [Google Scholar] [CrossRef] [PubMed]
- Bertler, N.A.; Conway, H.; Dahl-Jensen, D.; Emanuelsson, D.B.; Winstrup, M.; Vallelonga, P.T.; Zhang, X. The Ross Sea Dipole–temperature, snow accumulation and sea ice variability in the Ross Sea region, Antarctica, over the past 2700 years. Clim. Past 2018, 14, 193–214. [Google Scholar] [CrossRef]
- Le Mouël, J.L.; Lopes, F.; Courtillot, V. A strong link between variations in sea-ice extent and global atmospheric pressure? Cryosphere Dis. 2021, 1–28. [Google Scholar] [CrossRef]
Disclaimer/Publisher’s Note: The statements, opinions and data contained in all publications are solely those of the individual author(s) and contributor(s) and not of MDPI and/or the editor(s). MDPI and/or the editor(s) disclaim responsibility for any injury to people or property resulting from any ideas, methods, instructions or products referred to in the content. |
© 2023 by the authors. Licensee MDPI, Basel, Switzerland. This article is an open access article distributed under the terms and conditions of the Creative Commons Attribution (CC BY) license (https://creativecommons.org/licenses/by/4.0/).

