Article

Understanding the Deep Structure of the Essaouira Basin Using Gravity Data: Hydrogeological Inferences for a Semiarid Region in Central-Western Morocco

1
Laboratory of Applied Sciences for the Environment and Sustainable Development (SAEDD), Higher School of Technology Essaouira, Cadi Ayyad University, Marrakech 40000, Morocco
2
Department of Sciences and Technology, Universidade Aberta, 1600-214 Lisbon, Portugal
3
Centre for Geographical Studies, Institute of Geography and Spatial Planning, University of Lisbon, 1600-276 Lisbon, Portugal
4
Associated Laboratory Terra, University of Lisbon, 1600-276 Lisbon, Portugal
5
Georessources, Geoenvironment and Civil Engineering Laboratory, Faculty of Sciences and Techniques, Cadi Ayyad University, Marrakech 40000, Morocco
6
Geology and Sustainable Mining Institute (GSMI), Mohammed VI Polytechnic University, Benguerir 43150, Morocco
7
Department of Earth Sciences, Polydisciplinary Faculty of Safi, Safi, Morocco, Cadi Ayyad University, Marrakech 40000, Morocco
8
Geosciences and Environmental Techniques Laboratory, Department of Earth Sciences, Faculty of Sciences El Jadida, Chouaïb Doukkali University, El Jadida 24000, Morocco
9
Department of Geology, Ministry of Energy Transition and Sustainable Development, Agdal, Rabat 10090, Morocco
*
Author to whom correspondence should be addressed.
Geosciences 2023, 13(11), 345; https://doi.org/10.3390/geosciences13110345
Submission received: 9 September 2023 / Revised: 3 November 2023 / Accepted: 6 November 2023 / Published: 10 November 2023
(This article belongs to the Section Hydrogeology)

Abstract

:
The Essaouira Basin, located in central western Morocco, faces a significant threat of water shortage due to both the substantially reduced rainfall caused by climate change and the continuously increasing demand for this essential resource. Groundwater resources are being increasingly exploited to meet the needs of the population, whether for agricultural or domestic purposes. Therefore, it has become necessary to intensify investigations across the entire basin, particularly through indirect methods such as geophysical techniques, to accurately delineate the productive zones. In this context, the present study was undertaken to investigate the deep structure of this basin with the aim of comprehending the functioning of its aquifer system. This study is based on the interpretation of gravity data covering the Essaouira Basin. In addition to their qualitative analysis, these data underwent a methodological approach involving transformations to extract meaningful insights. The observed anomalies were interpreted in terms of (i) thickness variations within the slightly folded sedimentary series of the basin; (ii) Paleozoic basement topography; and (iii) the presence of salt deposits. In fact, among the negative anomalies, some coincide with evaporitic deposits that are known either from the geological outcrops or the seismic surveys carried out in the Essaouira Basin within the framework of petroleum exploration programs, while others coincide with areas of increased thickness of sedimentary sequences. The latter include synclines and basement depressions, where the accumulation of groundwater tends to occur; as a result, they constitute suitable zones for the drilling of water extraction wells. Groundwater flows observed in some existing wells are consistent with this hypothesis. The results of the contact analysis approach implemented within the framework of the study reveals the Essaouira Basin is affected by a fault network whose main direction is parallel to the Atlantic margin (i.e., NNE–SSW). This implies that the extensional tectonic phase responsible for initiating the rifting of the Central Atlantic in the Triassic era has primarily impacted the structural configuration of this basin. This study demonstrates the strong potential of the gravity method as a tool to delineate the deep structure of sedimentary basins and to identify potentially productive groundwater zones. The final results will provide important support to decision makers in sustainable groundwater management, especially in vulnerable areas.

1. Introduction

Over the past few decades, Morocco has become increasingly affected by the changing climate. This has led to the irregular occurrence of multiple droughts, especially in arid and semi-arid areas. The Essaouira Basin is strongly affected by these climatic hazards. It belongs to a region of central-western Morocco (Figure 1) where a semi-arid climate characterized by irregular precipitation prevails, with an average value of 300 mm/year, a significant temperature variation according to an annual average value of 20 °C, and evaporation loss estimated at around 910 mm/year. The Essaouira Basin has two different seasons: dry from April to September, and humid from October to March [1]. Annual water deficits exceed 650 mm due to low precipitation and its variability, as well as significant evaporation caused by high temperatures [2]. Consequently, the Essaouira Basin is an area at high risk of water scarcity due to a decrease in rainfall during the past decades, and an increase in need for this essential resource. This situation is the result of high demand for water supplies that exceeds the capacity of the basin. This demand is driven by population growth and associated urban, industrial, and agricultural development. The water resources needed for all of these activities are drawn predominantly from underground aquifers. The intensification of pumping activities throughout the Essaouira Basin has led to the overexploitation of shallow groundwater, which is particularly vulnerable to pollution and drought, and in some places affected by salinity. This situation has caused piezometric level to drop substantially, while rainfall deficiencies have not provided sufficient recharge. As a result, hydrogeologic exploration today is increasingly focused on the investigation of deeper water resources. However, the mobilization of these resources requires a good understanding of the hydrogeology of the Essaouira Basin, particularly the deep structure of its aquifer system. This cannot be achieved solely from the observation of the surface geology but requires the use of an indirect method such as geophysical prospecting.
In this context, we conducted the present study, based on the processing and interpretation of available gravimetric data. These data were acquired by the Moroccan Ministry for Energy Transition and Sustainable Development (MMETSD) within the framework of setting up a geoscience data infrastructure of this basin, in relation to its petroleum and mining potential. The investigated area is a part of the central Moroccan Atlantic plains. It extends between longitudes 9.77° to 9.1° W E and latitudes 9.77° to 9.1° N.
The main purpose of this study is to characterize the deep geological structure of the Essaouira Basin through a detailed mapping of the network of faults that affect the region, especially those concealed by recent deposits. These tectonic structures play an important role in controlling groundwater hydrodynamics by facilitating infiltration and drainage of surface water. The study also aims to identify sub-basins, troughs, and depressions of thick sedimentary series that generally form reservoirs for water storage.
The methodological approach we adopted is the first to be applied in the study area. It involves, in addition to the qualitative analysis of the gravity data, the application of filtering and interpreting methods, such as tilt derivative (TDR), improved logistic filter (ILF), and Euler deconvolution (ED), which help to enhance and analyze the anomalies corresponding to gravity gradient areas and to characterize their sources in terms of location and rooting depth [3,4,5,6,7,8,9,10]. The obtained results are analyzed and discussed in the light of the current geological knowledge of the Essaouira Basin.
Figure 1. Geological map of the study area (based on the 1:1,000,000 scale geological map of Morocco [11]).
Geosciences 13 00345 g001

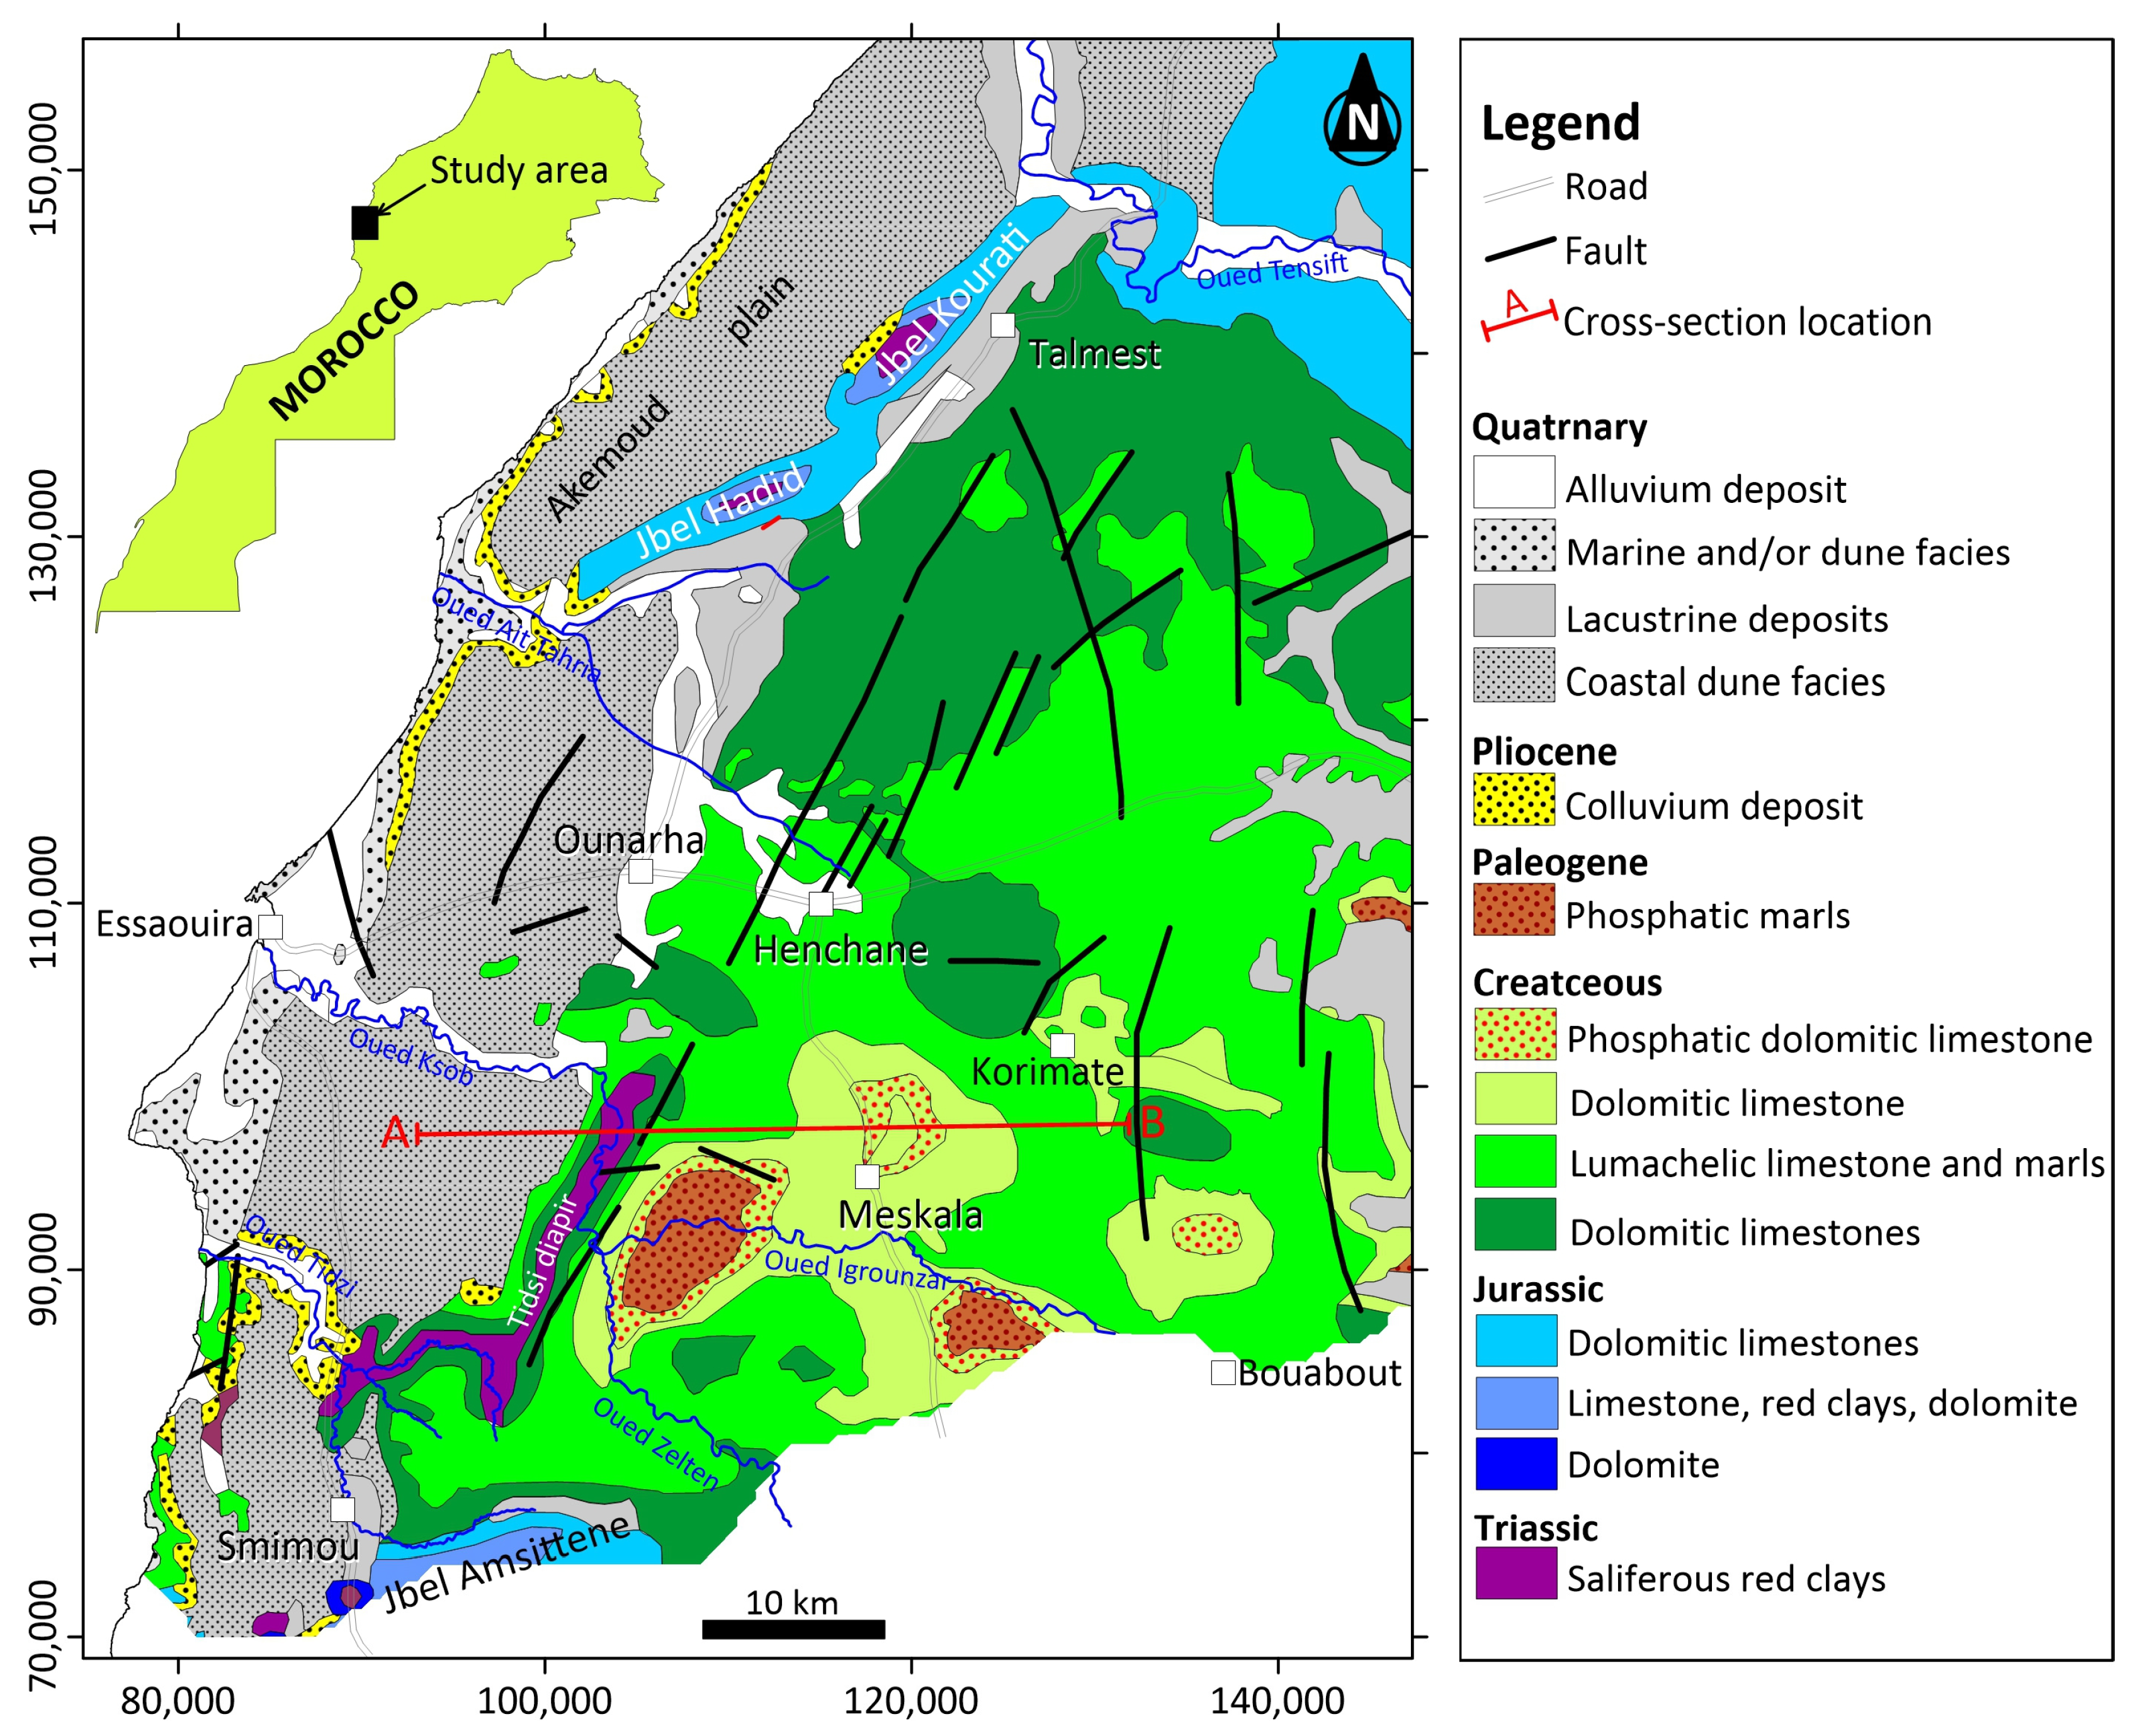
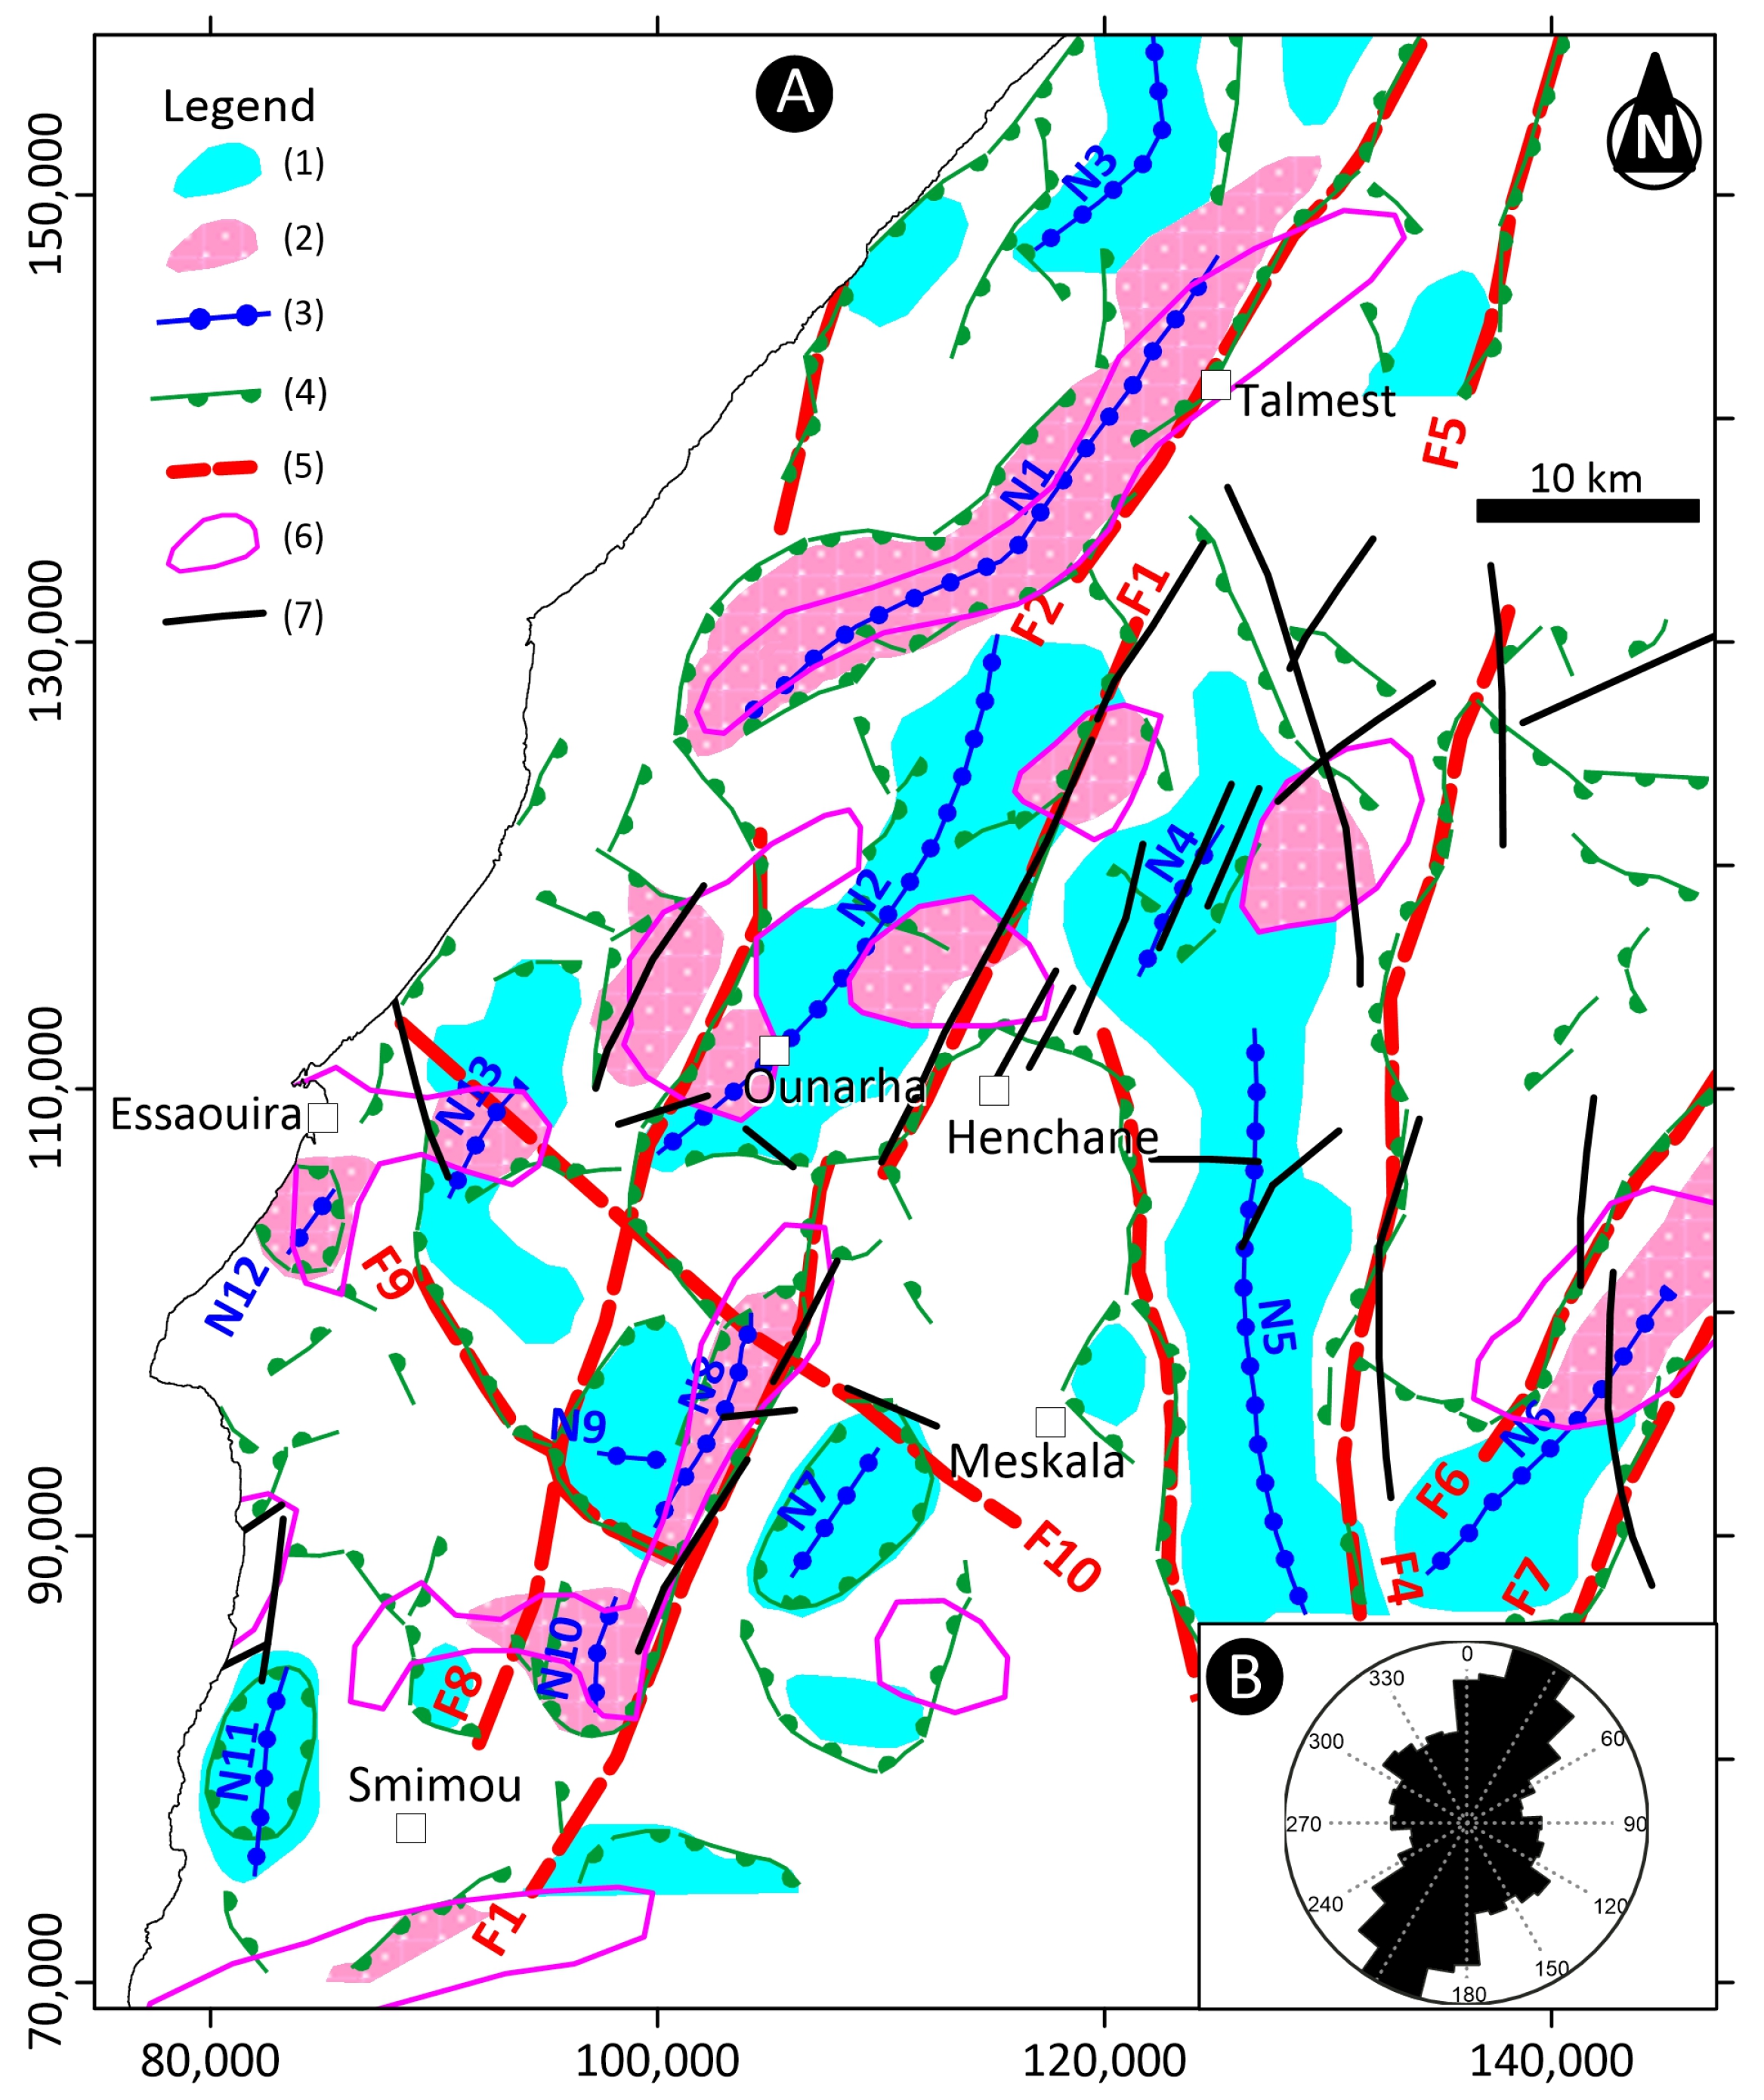
2. Geological and Structural Framework

The Essaouira Basin is the central element of the large Mesozoic coastal basin of El Jadida and Agadir [12]. It extends between the two anticlines of the Jbel Amsittene to the south and the Jbel Hadid to the north (Figure 1). This area marks the transition from the Atlasic basins mainly infilled by silico-clastic deposits, to the evaporitic basins of the Meseta [13]. The Essaouira Basin is a large synclinorium wherein Mesozoic and Cenozoic formations are moderately deformed by Tertiary compressive tectonics and Meso-Cenozoic halokinesis (Figure 2) [14,15,16].
Two major tectonic periods and their associated cycles of sedimentation are primarily responsible for the stratigraphy and structure of this basin. The first was the Triassic to Lower Cretaceous extension of the central Atlantic Ocean, which was responsible for the formation of the sedimentary basin, and the second corresponds to the syn to post-Cretaceous compression that gave rise to the Atlas Mountains [12,14,17,18,19,20,21,22,23,24,25].
From a lithostratigraphic point of view, although the geological outcrops of the Essaouira basin are dominated by Cretaceous and Tertiary formations, its sedimentary infill includes Permo-Triassic to Quaternary deposits, unconformably overlying a Paleozoic basement metamorphosed during the Hercynian orogeny (Figure 2) [26]. The Permo-Triassic series is characterized by deposits of conglomerates, sandstones, red siltstones, evaporites, and basalts that mark the initiation of the Atlantic rifting. It is surmounted by Jurassic limestone–dolomitic series that include intercalations of evaporitic and terrigenous levels. This series has a thickness of about 1000 m. The Cretaceous series is formed of an 800 m thick sequence of more marine environments, consisting of limestone deposits with lateral facies changing into marine shales alternating with terrigenous sediments. Phosphatic sandstones and shaly limestones of the Eocene age with a thickness of approximately 120 m represent the Tertiary sequence [27]. The Quaternary deposits consist of alluvial sands, silts, and clays that are approximately 10 m thick [28].
Concerning tectonics, the Essaouira Basin’s structure features slight folding and brittle deformation, which has resulted in the development of a network of faults with different orientations. The major NW–SE early Triassic extension resulted in a series of grabens via the reactivation of inherited Hercynian faults striking NNE–SSW, NE–SW and E–W. The history of the Essaouira Basin has also been highly affected by salt tectonics, as evidenced by the presence of halokinetic structures that have played an important role in the basin’s evolution. In fact, under the control of the Atlantic rifting and the Atlasic orogen, the salt deposits evolved into diapirs [14,27,29,30,31].
During the alpine compression that began in the Upper Cretaceous, the Essaouira Basin experienced two major episodes of folding [18]. The first one, oriented N20, was responsible for folds and faults structures as well as sinistral strike–slip faults trending NNE–SSW, NE–SW and NNW–SSE. The second compressive episode occurred in the Tertiary and was trending N110. It was less intense and resulted in N30 and N160 reverse faults [18].
The tectonic setting of the Essaouira Basin corresponds to a succession of structural highs and lows wherein the following major features are recognized [15,16,18,32]:
The combined effect of these two types of deformation has led to the individualization of the following major structural features:
  • The Bouabout synclinal depression, crossed by the Oued Igrounzar
  • The Ouled Bou Sbaa anticlinal ridge, which separates the Bouabout trough to the south from the Korimate syncline to the north.
  • The Kourimate synclinal basin, where the sedimentary layers remain subhorizontal and are barely affected by a slight southward dip.
  • The Essaouira synclinal basin, drained by the Oued Ksob.
  • The Tidsi Permo-Triassic diapiric fault separating the Bouabout and Essaouira depressions. This fault is oriented E–W over a distance of 8 to 9 km along the Oued Tidsi, then NE–SW for 20 km until the north of the Oued Ksob.
  • The saliferous anticlines of Jbel Hadid and Jbel Kourati
  • The Akermoud coastal syncline, which extends to the ocean northwest of Jbel Hadid and Jbel Kourati.
Figure 2. Geological cross-section AB of the Essaouira Basin (Compiled from [29,33]), correlated with its tilt derivative and residual anomaly.
Geosciences 13 00345 g002

3. Hydrogeological Framework

The Essaouira Basin is a vast synclinal area, open to the ocean and affected by tectonic deformations (folds and faults) that allow the individualization of many synclinal basins. The combined effect of these deformations and diapirism has led to the compartmentalization of the basin into several independent aquifer systems that contain groundwater in very localized areas. The water generally circulates in depth, in the various limestone or sandstone levels of the Secondary or Tertiary, through karstic pathways, and then emerges as springs at low points in contact with impermeable clay or marl horizons.
The Cenomano-Turonian aquifer remains the most important due to its lithology (limestone and dolomite alternating with marl) and structural features (significant fractures). This aquifer includes Senonian dolomitic limestones and yellow dolomites, whose thickness can reach 100 m; Turonian fractured and karst limestones, with a thickness of about 40 to 80 m; and Cenomanian lumachellic limestones. Given the absence of impermeable formations of significant thickness between the various strata, this aquifer can be considered a multilayered system, in which the Turonian is the main reservoir [26].
These formations are exposed in the hinterland of Essaouira, in the Meskala and Korimate area (Figure 1). They deepen under the Quaternary formations downstream of the Ksob river [2]. They are organized into a series of synclinal basins with a general east–west orientation. The characteristics of the Cretaceous aquifers are related to the presence of discontinuities within these formations. Such discontinuities are represented by stratification planes, which sometimes give rise to springs, the network of tectonic faults and fractures, and karstification phenomena [26]. The transmissivities of the Cenomano-Turonian aquifer generally vary from 2 × 10⁻⁴ to 9 × 10⁻³ m2/s, with local values from 1 × 10⁻¹ to 4 × 10⁻¹ m2/s [26]. These large variations are most likely related to the degree of fracturing and dissolution of the aquifer. The storage coefficient derived from test pumping varies from 1 × 10⁻¹ to 4.5 × 10⁻¹ [34]. The recharge of the aquifer is mainly ensured by rainwater, but also by Igrounzar River for a distance of 1300 m south of Meskala [34].
The drainage of the aquifer is ensured by several springs, which appear in the topographically low points in contact with marl or clay layers. The most important springs are located along the Igrounzar and Ksob rivers. The general flow of the water table is towards the ocean; this is favored by a westward dip of the Cretaceous series.
The Plio-Quaternary aquifer predominates in the coastal zone of the Essaouira Basin. This region corresponds to a plateau with a barely marked hydrographic network, except for the valleys of the Tidsi and Ksob rivers. It includes many basins made of shell limestone and dune sandstone. When the Plio-Quaternary lays on permeable Jurassic or Cretaceous formations, the water is drained vertically at depth. This aquifer is only productive when it is in a perched position resting on impermeable Jurassic or Cretaceous marls. The water table is recharged via water infiltration from rainfall and along the rivers. South of Essaouira, the plio-quaternary aquifer is located in a synclinal zone that extends in a submeridian direction between the Atlantic Ocean and the Tidsi diapir. It is mainly composed of marine or dune sandstones, with a thickness that varies from 10 to 60 m. The most productive points of the aquifer are located along the Ksob River.
North of Essaouira at the level of the Akermoud coastal plateau, which extends between the sea and the Jbels Hadid and Kourati, a multilayer aquifer system is individualized in three reservoirs of different importance and extent [1,35]:
  • The plio-quaternary reservoir, which is mainly composed of conglomerates with sandstone–limestone cement and sandy clay and silty deposits, ancient dunes, and sharp dunes. This ensemble lies on Cretaceous formations in the south and on Jurassic dolomites in the north. This aquifer contains perched aquifers.
  • The Barremian reservoir, consisting of fractured sandstone and sandstone limestone, about 20 m thick.
  • The Huterevian reservoir that is composed of sandstone and marl limestone and highly fractured sandstone, with an average thickness of 25 m.
This system is mainly recharged by rainfall. The general flow of the water table contained in this multilayer aquifer is from east to west and is manifested on the coast by the emergence of springs.
The piezometric data collected in the study area during the high-water period (January to February 2020) allowed us to characterize the flow directions and magnitudes of the subsurface waters in the two nappes that make up our study area, as well as the drainage zones and changes in the hydraulic gradient and the hydrogeochemical characteristics of the samples.

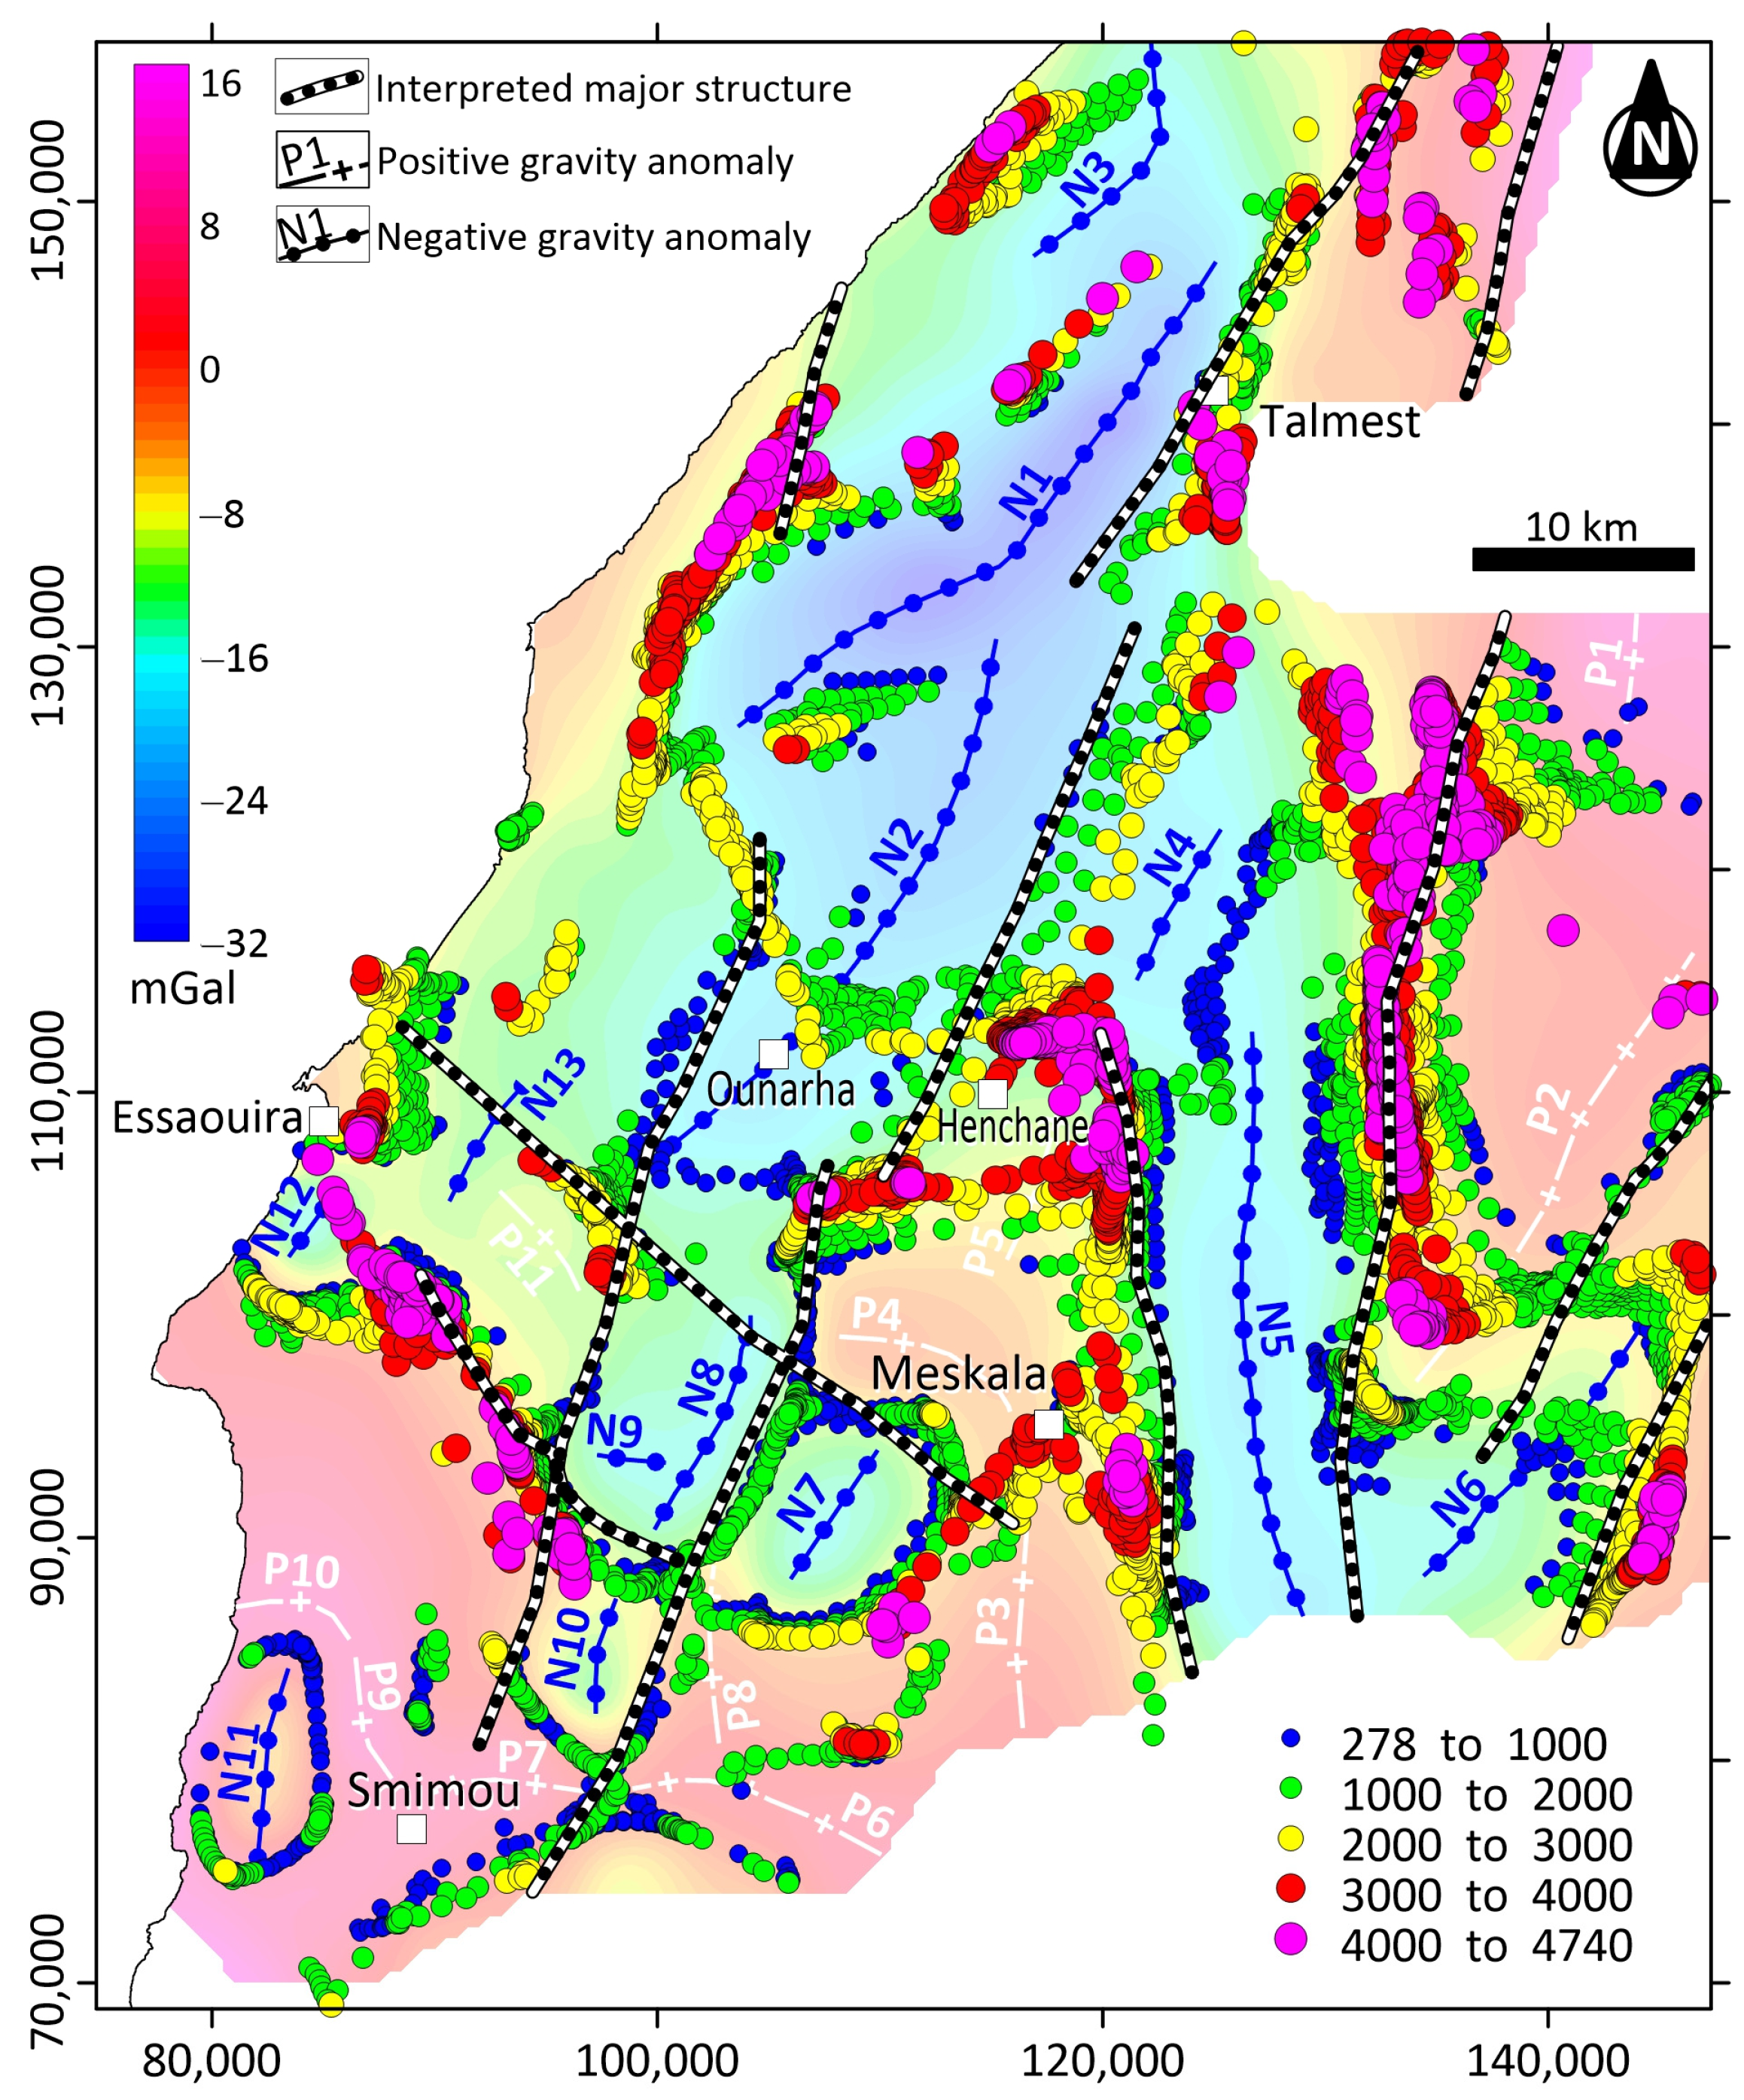
4. Materials and Methods

Gravity data are courtesy of the Geophysical Service of the Moroccan Ministry of Energy Transition and Sustainable Development (MMETSD). They were provided as a Bouguer anomaly map, which was generated using a reduction density of 2.3 g/cc. The data were collected during an earlier regional gravity survey performed by General Geophysical Company in 1975 on behalf of MMETSD. At that time, these data were acquired in order to establish a geoscientific infrastructure required for any exploration program that might be conducted in the Essaouira Basin. The gravity data provide good coverage of the basin, averaging one measurement point per square kilometer. These consist of 3940 gravity readings recorded at 500 m station intervals along roads and trails throughout the study area. The corrections of the gravity data that aim to eliminate the non-geological causes of gravity field were applied using the Bouguer anomaly formula. The first step in this study was to digitize the paper Bouguer anomaly map. The gravity data were then interpolated on a regular grid with a cell size of 500 m using the minimum curvature algorithm [36]. The subsequent analysis, which includes calculating the residual anomaly and applying various filters, was based on this data set.
Gravity data provide valuable information regarding the spatial arrangement of tectonic structures of interest from a hydrogeological perspective. For instance, on a Bouguer anomaly map, faults generally coincide with areas of gravity gradients that define the transition from low values over less dense blocks to higher values over denser blocks. Consequently, gravity data can be exploited to detect faults and determine their extent, especially when they separate blocks with significant density contrasts [37]. Mapping and characterizing such faults constitute the main objective of the present study. For this purpose, we have used a methodological approach which, in addition to qualitative analysis of gravity data from the Essaouira Basin, involves applying several processing techniques. Indeed, after removing the regional anomaly, the gravity data underwent a series of processing techniques such as tilt derivative (TDR), improved logistic filter (ILF), and Euler deconvolution (ED). These powerful methods were employed to accurately map subsurface geological structures and characterize them in terms of depth rooting and connection with basement structures [5,7,8,9,37,38,39,40].

4.1. Tilt Derivative or Tilt Angle

The tilt angle operator is defined as the arctangent of the ratio of the vertical derivative of the potential field with the modulus of its horizontal partial derivatives. Applied to the gravity field anomaly (G), this operator can be written as follows:
H θ G = t a n 1 G Z G x 2 + G y 2
This transformation has the advantage of giving equal importance to anomalies, regardless of their amplitude. Indeed, the arc tangent function has the effect of distributing the calculated signal between −90° and +90°. The tilt angle has the property of being positive over a source and negative elsewhere. The tilt angle filter is commonly used to identify and delineate the edges of potential field anomalies sources. In fact, the zero value of this filter coincides with the source’s edges [41,42,43,44].

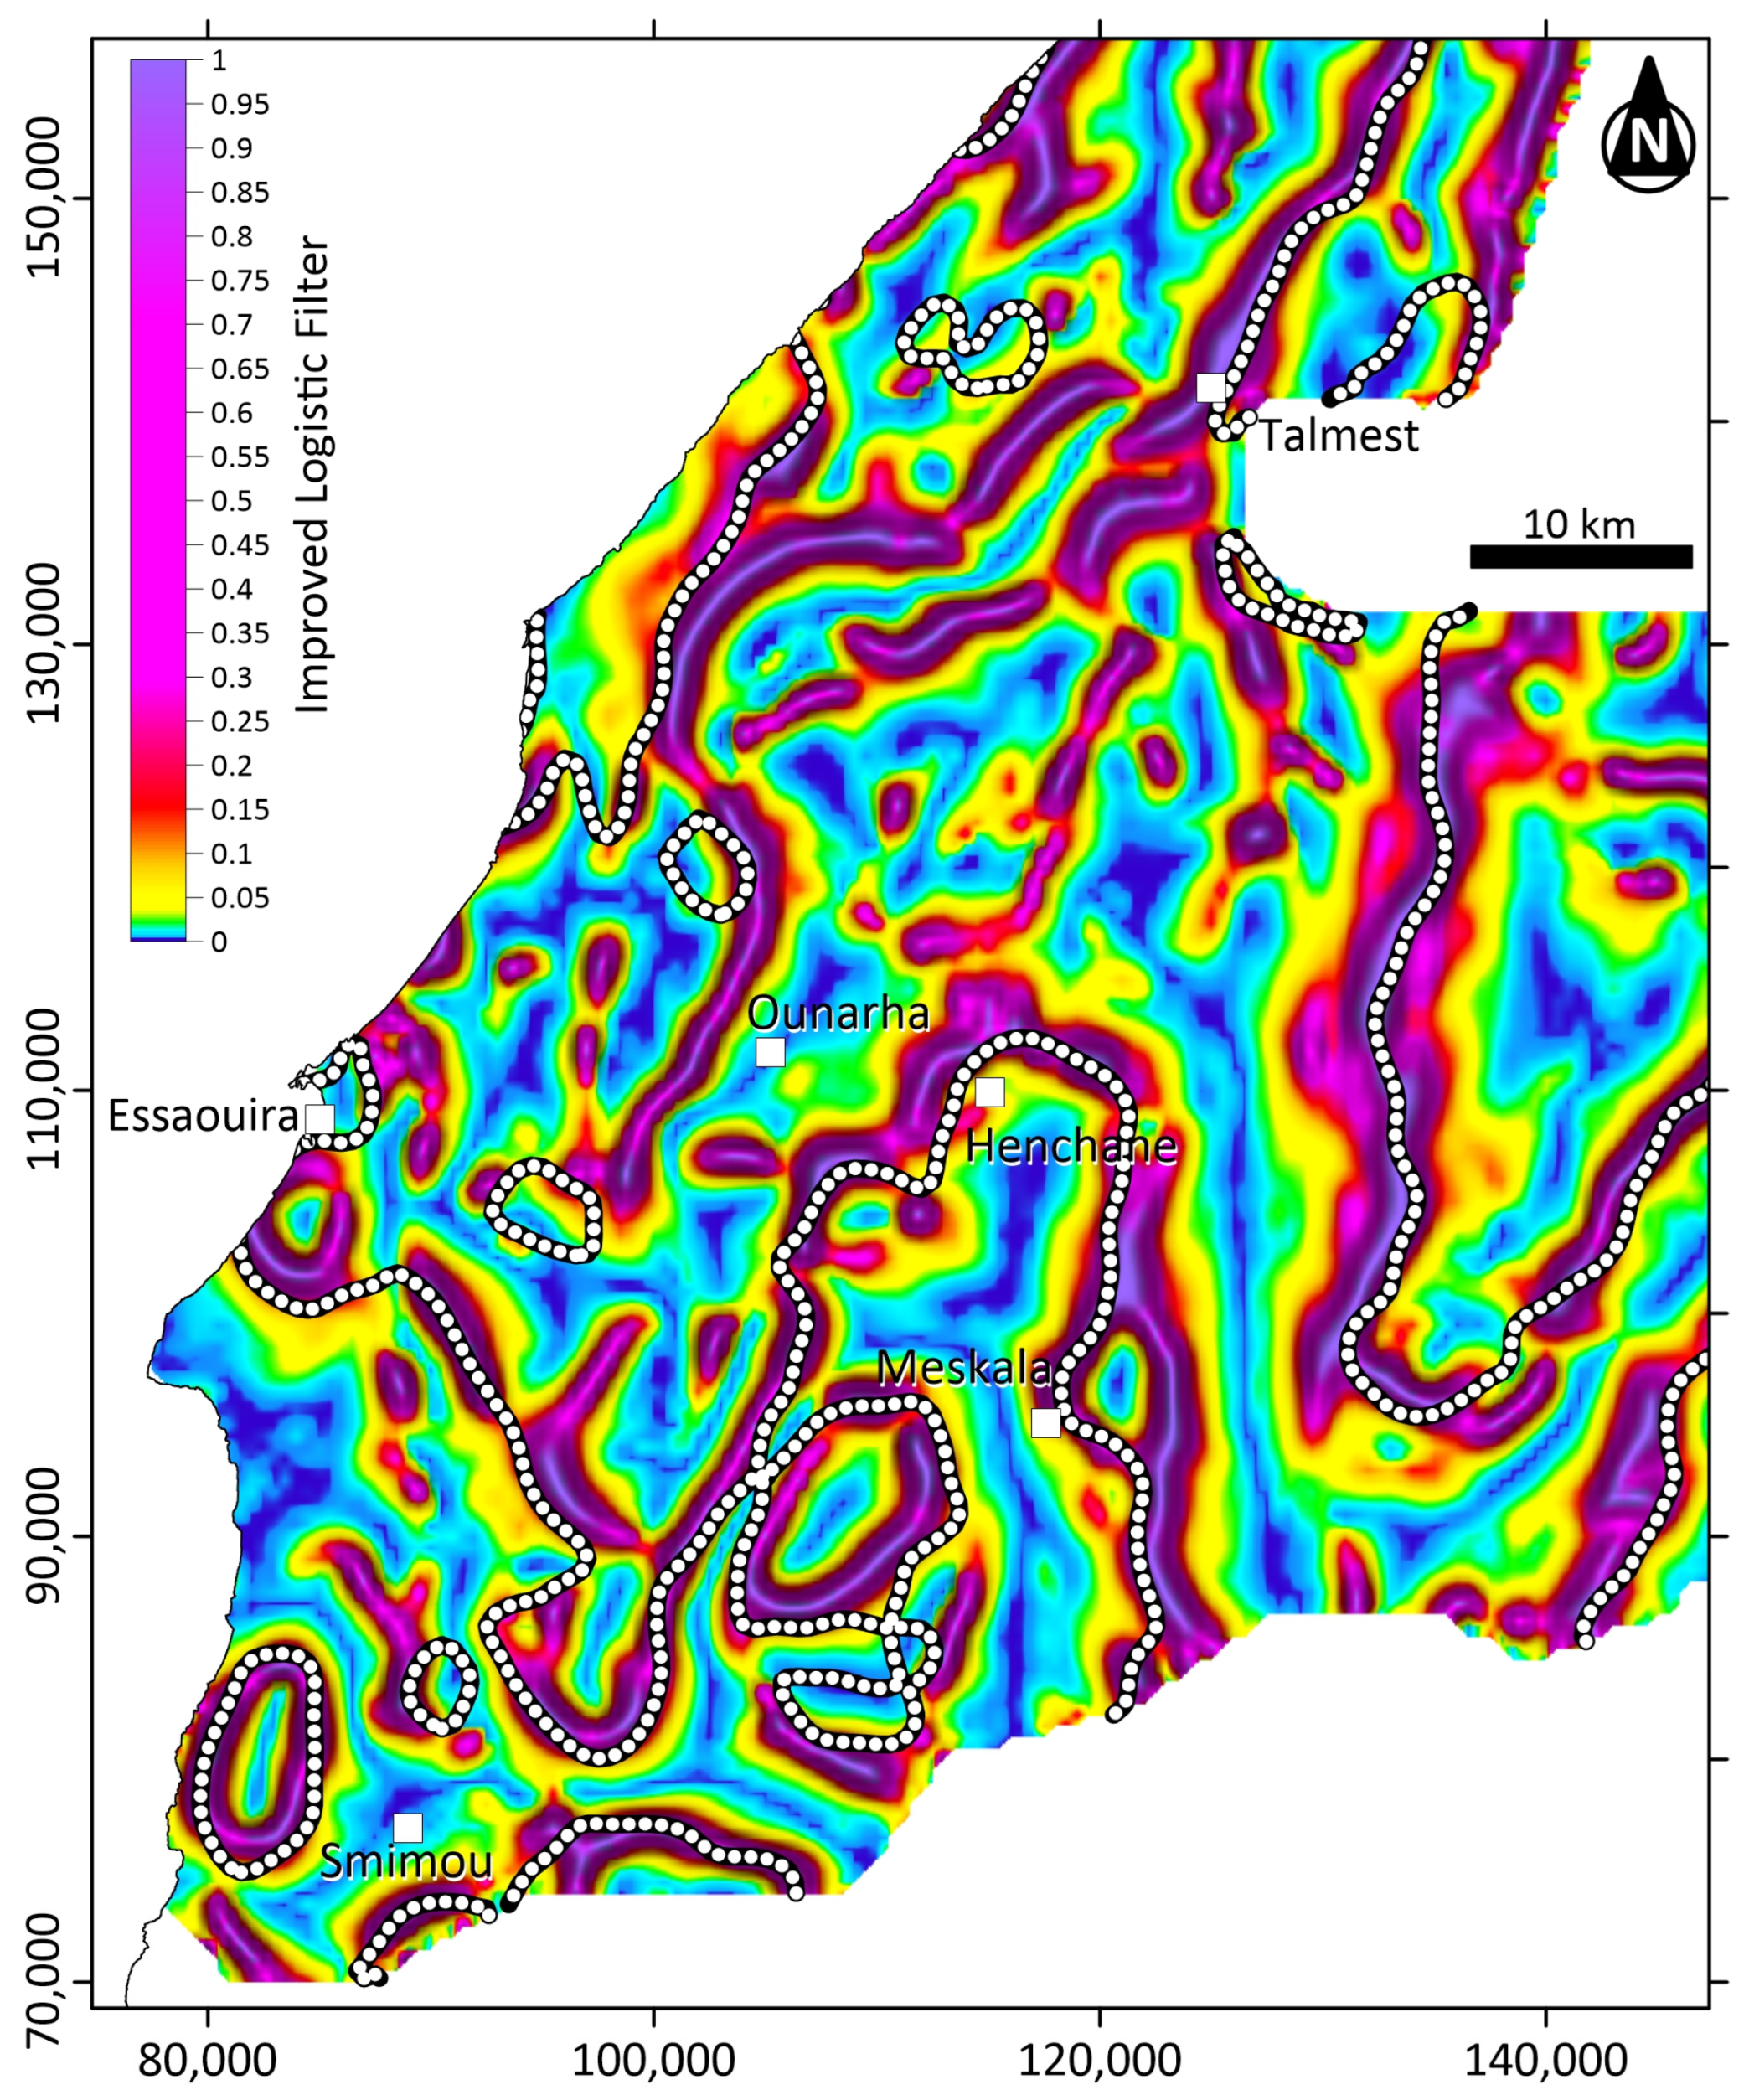
4.2. Improved Logistic Filter

The improved logistic filter represents an edge detection technique that relies on both the logistic function and the horizontal gradient amplitude. Its definition is as follows [9]:
I L = 1 1 + exp p ( R T H G 1 ) + 1 )
RTHG stands for the ratio of the vertical derivative to the horizontal derivative modulus of the total horizontal gradient (THG); it is calculated using the following expression:
R THG = 𝛛 T H G 𝛛 z 𝛛 T H G 𝛛 x 2 + 𝛛 T H G 𝛛 y 2
with
T H G = 𝛛 G 𝛛 x 2 + 𝛛 G 𝛛 y 2
G represents the gravity field, and p is a constant set by the user. In this study, this constant was set to 2, knowing that p values between 2 and 5 provide the best results [9].
The ILF stands as a potent approach for extracting the lateral boundaries of gravity anomalies’ sources. In contrast to some popular methods commonly employed to pursue the same goal, the primary strengths of this method are its low-sensitivity noisy signals and its capability to yield high-resolution outcomes while preventing the generation of erroneous edges [9]. Multiple studies conducted on synthetic models and real data have demonstrated its effectiveness in detecting and delineating geological structures associated with lateral change in the rocks’ density [7,8,9].

4.3. Euler Deconvolution

The origins of the Euler deconvolution method can be attributed to Hood (1965) [45], who was the first to formulate Euler’s homogeneity equation and deduce the structural index which quantifies the rate of change of the field according to distance. Thompson (1982) [46] conducted additional research investigations of this method, implementing it with both synthetic and real data sets. The technique underwent subsequent development, with Reid et al. (1990) [47] expanding its scope; later, Keating (1998) [48] and Mushayandebvu et al. (2004) [49] introduced improvements to enhance its effectiveness. Nowadays, ED is extensively employed as a powerful method for automatically interpreting potential field data, owing to its notable simplicity in usage and implementation [4,50]. This method helps to delineate geological structures by determining their positions and depths, as well as the extent of their roots [51,52,53]. The positive outcomes of its utilization for the interpretation of potential field data have been thoroughly documented across multiple research studies [40,54,55,56,57].
To characterize anomalous geological structures, ED utilizes the gravity field and its derivatives in the X, Y, and Z directions [46]. As stated by Reid et al. (1990) [47], the three-dimensional formulation of Euler’s equation can be expressed as follows:
x x 0 𝛛 G 𝛛 x + y y 0 𝛛 G 𝛛 y + z z 0 𝛛 G 𝛛 z = N B G  
where ( x 0 , y 0 , z 0 ) represent the source’s coordinates of a gravity anomaly observed at the location ( x , y , z ); B denotes the regional gravity value; and N signifies the degree of homogeneity or the structural index (SI), which is related to the attenuation of the anomaly with distance. Determining the appropriate structural index (SI) requires prior knowledge of the source’s geometric characteristics. For instance, for gravity data, an SI value of 2 corresponds to a sphere, an SI of 1 indicates a horizontal cylinder, and an SI of 0 represents a fault [47,58,59].
The principle of Euler deconvolution is based on solving Equation (5), which encompasses four variables ( x 0 , y 0 , z 0 , and B). To solve a system of equations with four unknowns, at least four measurement points are required. The used approach consists of considering an operating square window of four or more adjacent observations at a time. The approach utilized involves considering a square window containing four or more adjacent observations simultaneously. Subsequently, by shifting the operating window from one position to another across the anomaly, numerous solutions for the same source are obtained [46,60,61,62,63,64].

5. Results and Discussion

Gravity surveys are a valuable geophysical tool for exploring subsurface geology, and sedimentary basins are prime targets for such surveys at various scales, from small local basins to large regional ones. Indeed, gravity measurements provide precious insight into the subsurface characteristics of sedimentary basins, allowing researchers to study the geological history, structural features, and potential resources within these geologic environments. The significant density contrast between the material filling the basin and the underlying bedrock makes gravity measurements very sensitive to lateral changes in the thickness of sedimentary rocks related either to tectonic deformation, including folding and faulting or undulations in the bedrock topography [37]. This generally results in negative anomalies, which are the gravity signature of sedimentary basins. The methodologies used to analyze gravity field data are constantly advancing to enhance the deciphering of gravity anomalies, particularly as new geological insights are gained from new drill holes to provide additional depth constraints. Gravity data from the Essaouira Basin will be examined in the light of all these considerations. In the approach employed, special attention will be given to interpreting the negative anomalies associated with the thickening of sedimentary layers and the presence of structural lineaments.
A first examination of the bouguer anomaly map of the study area shows that the observed values vary from a minimum of −10 mGal to a maximum of 59 mGal (Figure 3). These variations define negative anomalies that dominate the central and eastern parts of the Essaouira Basin, and positive anomalies mainly located along the littoral zone. This coastal positive zone is certainly due to the thinning of the continental crust towards the ocean. This results in a regional gravity gradient that we determined using the method of interpolation via linear regression [65]. This gradient was then removed from the Bouguer anomaly dataset, enabling the calculation of the residual gravity map shown in Figure 4. This map shows several positive and negative anomalies, labeled P1 to P11 and N1 to N13, respectively. The study area is predominantly covered by negative anomalies, which are typically surrounded by positive anomalies (Figure 4A). Overlaying the residual anomaly contours on the geological map of the study area provides insight into the origin of the observed anomalies. Certainly, some negative anomalies are obviously related to the presence of salt deposits delineated by Tari et al., 2017. This is the case for anomalies coinciding with the Triassic saliferous core anticline of Jbel Hadid (N1) and Tidzi (N8 and N10). Anomalies N12 and N13 are also related to Triassic evaporites recognized in the Essaouira area. Moreover, anomalies N2 and N6 are partially due to salt diapirs.
Moreover, owing to its particular shape, anomaly N12 could potentially indicate the presence of a salt dome to the south of Essaouira. The other negative and positive anomalies would indicate respective structural lows and highs related to the synclinorium structure of the basin. This is evidenced by the N5 anomalies, which coincide with synclinal troughs whose cores are occupied by Eocene formations. Consequently, the entire region roughly outlined by the transition from green to yellow shades on the residual map corresponds to a depressed region wherein the convergence and accumulation of groundwater are expected. Naturally, this area must not encompass the N1 anomalies that correspond to the salt core anticline of Jbel Hadid.
Furthermore, Figure 2 shows that the bedrock topography also contributes significantly to the observed variations in the gravity field values. In fact, it can be clearly seen that the profile of the residual anomaly reflects the morphology of the Paleozoic basement. The raised basement block beneath the Meskala area is associated with the positive P4 anomaly. The subsided basement zone to the west of this block is related to the N8 anomaly, which clearly shows the effect of the Tidsi salt diapir. Negative anomaly N5, located east of P4, coincides with a significant thickening of the sedimentary cover corresponding to a basement trough. However, the depocenter of this sedimentary depression is shifted southward with regard to the axis of the N5 anomaly (Figure 2). This could be explained by the presence of a quantity of salt beneath the axis of this anomaly, which may not have been imaged by the seismic data. This could be explained by the presence of an amount of salt beneath the axis of this anomaly, which might not have been identified by seismic data. Moreover, the tilt derivative profile shows shorter wavelength variations that are mainly due to shallower lateral changes in the thickness of the sedimentary cover associated with the slight folding of the Meso-Cenozoic series of the Essaouira Basin.
Additionally, the residual anomaly map exhibits several regions of gravimetric gradient that define the transition from positive to negative anomalies. These zones delineate the boundaries between blocks or domains of different densities that correspond to faults or geological contacts. Special attention is often given to the analysis of these gradient zones for the purpose of mapping geological structures. A such analysis can be conducted using different methods of edge detection, among which the Tilt derivative, the Improved Logistic Filter and the Euler deconvolution techniques were implemented within the framework of this study.
The TDR transformation of the residual map results in the enhancement of the high frequency content of the gravity data. This filter is actually based on calculating partial derivatives of the gravity field. It attenuates long-wavelength anomalies while accentuating the those with short wavelengths and low amplitudes. This is made evident through a straightforward comparison between the resulting map and the original residual gravity data. The TDR serves as a high-frequency filter, enhancing data resolution and thereby aiding in the delineation of gravity axes and linear features (Figure 5). In addition, according to Salem et al., 2007, the zero contours of the TDR map delineate an approximate spatial location of the source edges. Therefore, the white dotted lines stand as contacts or faults that separate low-density areas in light blue and green and denser zones in red and pink (Figure 5).
Furthermore, an improved logistic filter (ILF) was applied to the gravimetric data of the Essaouira Basin, as a second method of mapping contacts. The obtained results clearly show that this process transforms the inflection line of a gravity gradient anomaly into a narrow positive anomaly whose maximum coincides with the fault location, allowing its mapping (Figure 6). The ILF has the advantage of enabling accurate mapping of geological structures in comparison to similar methods of edge detection such as the total horizontal gradient. The superposition of the TDR zero contour (white dotted lines) on the ILF map clearly shows that the two methods used for fault mapping provide significantly similar results (Figure 7). The significant agreement observed in the outputs of both methods supports their effectiveness as edge detection techniques for gravimetric sources.
A detailed analysis of Figure 7 shows that the used contact analysis approach allows the mapping of a large number of lineaments of different shapes, lengths, orientations. Most of them appear as linear features, while others have circular shapes that may correspond to the boundaries of evaporite diapirs or relatively closed synclinal sub-basins. Some lineaments extend over tens of kilometers, and might correspond to major geological structures. The latter delimit different areas of high and low density that reflect the folded structure of the Essaouia basin, recognized as a succession of synclines and anticlines. From a hydrogeological point of view, in addition to their interest as preferential pathways for groundwater flow and drainage, these major structures form the boundaries of depressions that are potentially productive in terms of water resources.
Figure 3 shows that variations in the thickness of sedimentary infill in the Essaouira Basin (and consequently changes in gravity field values) are also related to the undulations of the Hercynian basement. The latter is, in fact, shaped by a system of normal faults that result in horsts associated with positive anomalies, as is the case in the Meskala area, and grabens that coincide with negative anomalies.
These variations in the basement surface topography result in significant hydrogeological implications. Indeed, because of its metamorphic nature resulting in very low permeability, the Paleozoic bedrock would influence the dynamics of groundwater by directing its flow towards depressed regions that represent potential areas for drilling to access groundwater resources.
In order to better characterize the geological structures of the study area and gain insight into their depth, extent, and connection to basement structures, the Euler deconvolution (ED) technique has also been applied to the gravity data. The positions and depths of Euler’s solutions have been calculated considering fault-type sources defined by a structural index SI = 0 [47,58,59], a moving window of 10 × 10 times the grid cell size, and a maximum relative error of 15%. These solutions are represented by the colored dots, which correspond to different ranges of depth. They are superimposed to the residual gravity map with the major geologic structures evidenced by this study (Figure 7). These results show that Euler’s solutions clearly cluster along the lineaments inferred from the gravity data analysis, thereby confirming their existence as real geological structures. Furthermore, the clustering of the solutions along the detected faults confirms that the value of the SI parameter has been correctly chosen as a requirement for implementing of the ED method.
As stated earlier, Euler deconvolution is a technique for mapping geological structures and estimating their depth. Its application to the Essaouira Basin therefore confirmed the existence of the faults identified via the two edge-detecting methods used in this study. The ED results show that some of the faults that are responsible for the structuring of the Essaouira Basin are rooted at depths of 3000 m, while others are over 7500 m deep.
Finally, a synthesis map summarizing all the results has been created, as shown in Figure 8A. This map suggests that the study area is affected by a network of faults with varying extents. According to the rose diagram, these faults are predominantly oriented in the NNE–SSW direction, parallel to the Atlantic margin (Figure 8B). This indicates that the structure of the Essaouira Basin is mainly influenced by the extensional phase that initiated the rifting of the Central Atlantic during the Triassic period. One of the most striking features of this map is the identification of sedimentary depressions, which are delimited by the evidenced major faults. Such troughs represent areas of groundwater convergence that might be potentially productive in terms of water supplies (Figure 8A). They are separated by structural highs such as horsts, and anticlines like the one at Jbel Hadid, which represents a folded structure whose core is made of salt deposits. The existence of this anticline has major implications for the hydrogeology of the study area. On one hand, it acts as a barrier separating the groundwater flow in the Cenomanian-Turonian aquifer of the Essaouira Basin from the coastal aquifer hosted by the Plio-Quaternary formations. On the other hand, the evaporite material in the core of the anticline can affect the salinity of groundwater in both aquifers, depending on the structural interconnections that these aquifers may have with the anticline’s core.
Furthermore, we have at our disposal hydrogeological data concerning measurements of groundwater flow conducted in wells and boreholes existing throughout the entire Essaouira Basin. These data were kindly provided by the Agency for the Tensift Hydraulic Basin (ABHT). They were collected from generally shallow wells and boreholes drilled either by the ABHT or by individuals for groundwater exploration or exploitation purposes. Superimposing these data on the synthesis map drawn up at the end of this study allows us to make the following observations, which confirm our inferences about the hydrogeology of the study area (Figure 9):
-
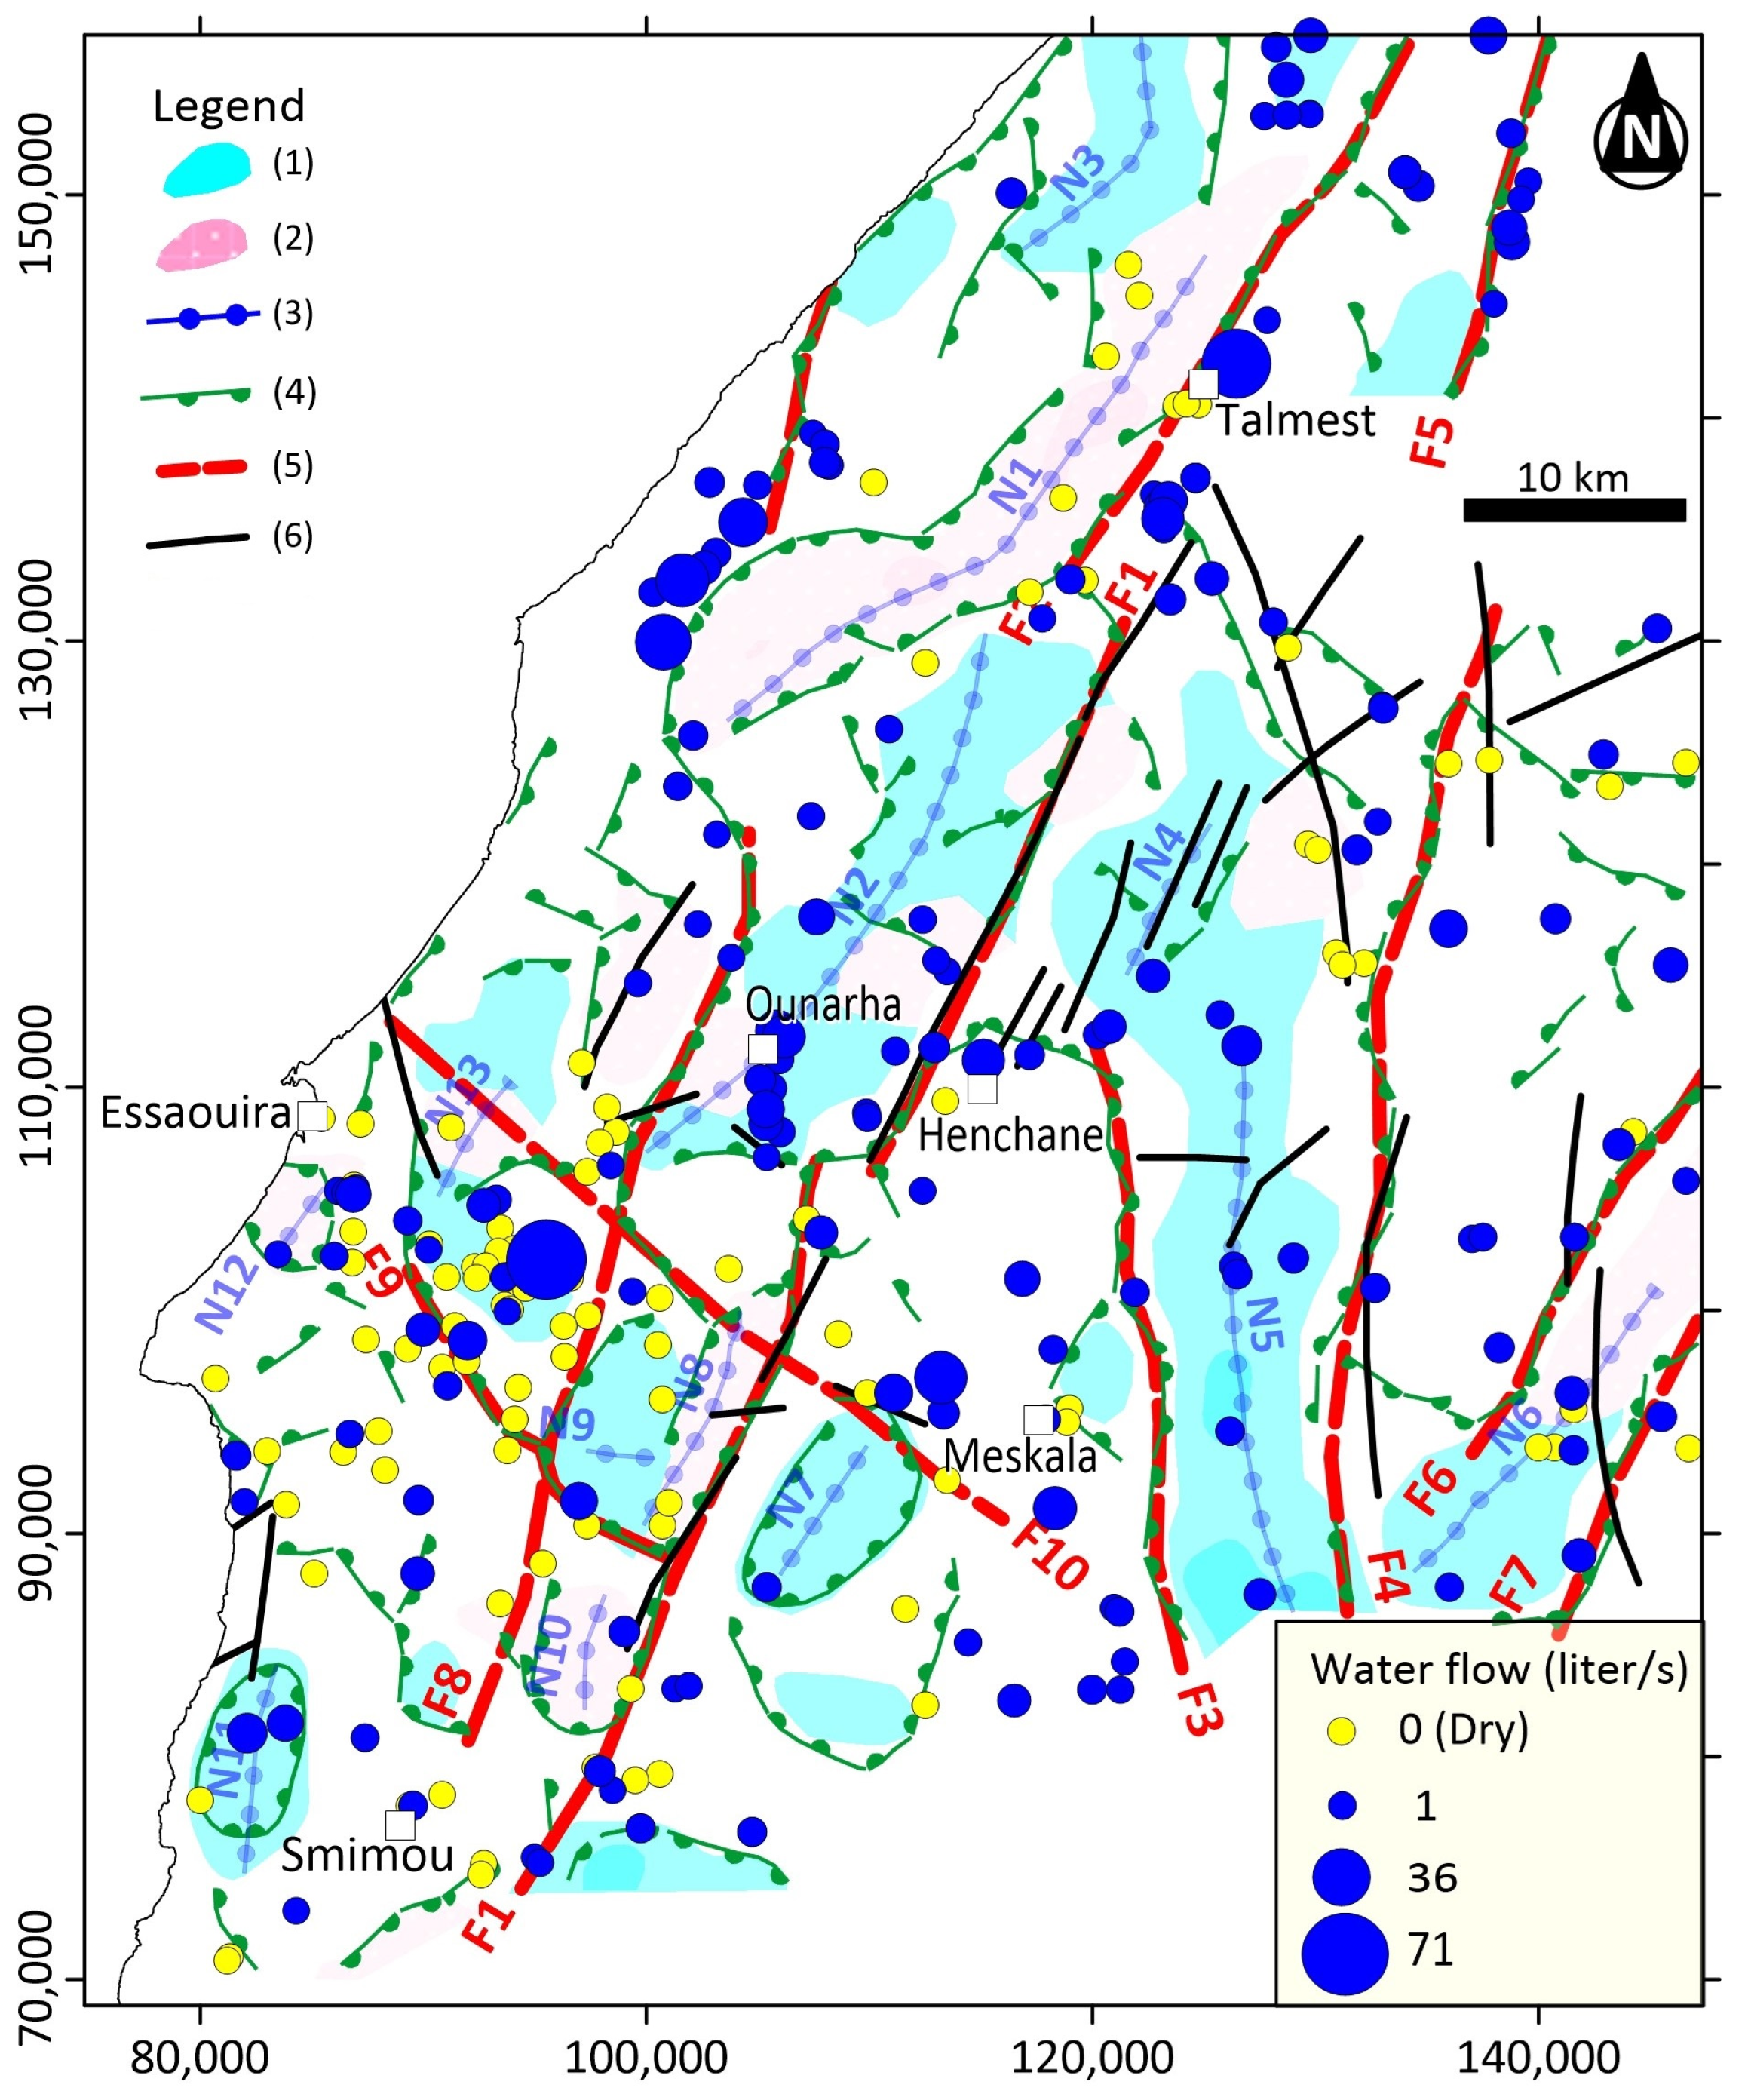
Dry holes are systematically located outside of depressions inferred from the interpretation of the gravity data.
-
Productive holes are observed within these depressions and along or near faults, as structural discontinuities that act as groundwater pathways.
-
Some productive holes are also situated outside of the aforementioned depressions. These could correspond to wells or boreholes positioned in small sub-basins that could not be delineated by the gravity data used in this study due to their regional nature. The characterization of such localized troughs requires detailed investigations that could be carried out using a small-scale geophysical survey.

6. Conclusions

At the end of this gravity study, we have gained a better understanding of the structure of the Essaouira Basin in central western Morocco. The observed gravity anomalies have been explained in terms of structural highs and lows associated with the slight folding of the sedimentary series as well as the topographic undulations of the Paleozoic basement. The various processing techniques applied to the gravity data and the subsequent interpretation show that the salt diapirs recognized throughout the Essaouira Basin explain some negative gravity anomalies. However, the majority of these anomalies are associated with sedimentary depressions, which constitute receptacles for groundwater accumulation and therefore form potentially productive zones for water supply. The resulting structural map shows a compartmentalized aquifer system in which the various sub-basins are clearly identified and delineated.
Furthermore, the faults affecting the Essaouira Basin have also been accurately mapped. Given their NNE–SSW-predominant orientation, these faults appear essentially related to the Triassic rifting of the Atlantic Ocean. From a hydrogeological point of view, these structures play an important role in groundwater drainage, and are also privileged targets for groundwater extraction using wells and boreholes.
The findings of the present study are summarized in the form of a synthesis map, which constitutes a reference document that can serve as a guide for future hydrogeological studies of the Essaouira Basin. The map also provides useful information for hydrogeological decisions like drillhole positioning or action plans for groundwater protection.

Author Contributions

Conceptualization, A.K. (Abdelah Khouz); methodology, A.K. (Abdelah Khouz) and M.J. (Mohammed Jaffal); software, A.K. (Abdelah Khouz) and M.J. (Mohammed Jaffal); validation, M.J. (Mohammed Jaffal) and J.T.; formal analysis, M.J. (Mohammed Jaffal) and J.T.; investigation, A.K. (Abdelah Khouz), M.J. (Mourad Jadoud), O.K. and A.M.; resources, M.J. (Mourad Jadoud), O.K. and A.M.; data curation, A.K. (Abdelah Khouz) and M.J. (Mohammed Jaffal); writing—original draft preparation, A.K. (Abdelah Khouz); writing—review and editing, M.J. (Mohammed Jaffal), J.T., B.B., F.E.B., A.K. (Azzouz Kchikach), M.E.G., H.I., M.J. (Mourad Jadoud), O.K. and A.M.; visualization, A.K. (Abdelah Khouz) and M.J. (Mohammed Jaffal); supervision and project administration, M.J. (Mohammed Jaffal), J.T., B.B. and F.E.B. All authors have read and agreed to the published version of the manuscript.

Funding

The research conducted by Abdellah Khouz and Jorge Trindade was supported by the Geographical Research Centre at the Institute of Geography and Spatial Planning, Lisbon University.

Data Availability Statement

Data are contained within the article.

Acknowledgments

The authors are grateful to the Geophysical Service of the Moroccan Ministry for Energy Transition and Sustainable Development and the Tensift Hydraulic Basin Agency (ABHT) for providing the data used in this work.

Conflicts of Interest

The authors declare no conflict of interest.

References

  1. Bahir, M.; Mennani, A.; Jalal, M.; Youbi, N. Ressources Hydriques Du Bassin Synclinal d’Essaouira (Maroc). Estud. Geol. 2000, 56, 185–195. [Google Scholar] [CrossRef]
  2. Chkir, N.; Trabelsi, R.; Bahir, M.; Hadj Ammar, F.; Zouari, K.; Chamchati, H.; Monteiro, J.P. Vulnérabilité Des Ressources En Eaux Des Aquifères Côtiers En Zones Semi-Arides–Etude Comparative Entre Les Bassins d’Essaouira (Maroc) et de La Jeffara (Tunisie). Comun. Geol. 2008, 95, 107–121. [Google Scholar]
  3. Archibald, N.; Gow, P.; Boschetti, F. Multiscale Edge Analysis of Potential Field Data. Explor. Geophys. 1999, 30, 38–44. [Google Scholar] [CrossRef]
  4. Jaffal, M.; Goumi, N.E.; Kchikach, A.; Aïfa, T.; Khattach, D.; Manar, A. Gravity and Magnetic Investigations in the Haouz Basin, Morocco. Interpretation and Mining Implications. J. Afr. Earth Sci. 2010, 58, 331–340. [Google Scholar] [CrossRef]
  5. Jaffal, M.; Charbaoui, A.; Kchikach, A.; El Ghorfi, M.; Khaldoun, A.; Safhi, A.E.M.; Bodinier, J.-L.; Yazami, O.K.; Jourani, E.-S.; Manar, A. Gravity Study of the Western Bahira Basin and the Gantour Phosphatic Plateau, Central Morocco: Interpretation and Hydrogeological Implications. J. Afr. Earth Sci. 2022, 193, 104581. [Google Scholar] [CrossRef]
  6. Maacha, L.; Jaffal, M.; Jarni, A.; Kchikach, A.; Mouguina, E.M.; Zouhair, M.; Ennaciri, A.; Saddiqi, O. A Contribution of Airborne Magnetic, Gamma Ray Spectrometric Data in Understanding the Structure of the Central Jebilet Hercynian Massif and Implications for Mining. J. Afr. Earth Sci. 2017, 134, 389–403. [Google Scholar] [CrossRef]
  7. Pham, B.T.; Tien Bui, D.; Prakash, I. Bagging Based Support Vector Machines for Spatial Prediction of Landslides. Environ. Earth Sci. 2018, 77, 146. [Google Scholar] [CrossRef]
  8. Pham, L.T.; Oksum, E.; Vu, M.D.; Vo, Q.T.; Du Le-Viet, K.; Eldosouky, A.M. An Improved Approach for Detecting Ridge Locations to Interpret the Potential Field Data for More Accurate Structural Mapping: A Case Study from Vredefort Dome Area (South Africa). J. Afr. Earth Sci. 2021, 175, 104099. [Google Scholar] [CrossRef]
  9. Pham, L.T.; Van Vu, T.; Le Thi, S.; Trinh, P.T. Enhancement of Potential Field Source Boundaries Using an Improved Logistic Filter. Pure Appl. Geophys. 2020, 177, 5237–5249. [Google Scholar] [CrossRef]
  10. Ouchchen, M.; Boutaleb, S.; Abia, E.H.; El Azzab, D.; Abioui, M.; Mickus, K.L.; Miftah, A.; Echogdali, F.Z.; Dadi, B. Airborne Magnetism of the Ighrem Region (Western Anti-Atlas, Morocco): Geological Interpretation and Prospecting of New Copper Zones. J. Afr. Earth Sci. 2021, 176, 104140. [Google Scholar] [CrossRef]
  11. Hollard, H.; Choubert, G.; Bronner, G.; Marchand, J.; Sougy, J. Carte géologique du Maroc à l’échelle 1/1,000,000. Notes et Mém. Serv. Géol. Maroc 1985, 260. [Google Scholar]
  12. Medina, F. Chronologie Des Phases et Style Tectonique Dans Le Haut Atlas Occidental, Maroc. Garcia Orta. Sér. Geol. 1985, 8, 43–54. [Google Scholar]
  13. Salvan, H.M. Les Formations Évaporitiques Du Trias Marocain. Problèmes Stratigraphiques, Paléogéographiques et Paléoclimatologiques. Quelques Réflexions. Rev. Géol. Dyn. Géogr. Phys. 1984, 25, 187–203. [Google Scholar]
  14. Broughton, P.; Trepanier, A. Hydrocarbon Generation in the Essaouira Basin of Western Morocco. AAPG Bull. 1993, 77, 999–1015. [Google Scholar]
  15. Hafid, M. Incidences de l’évolution Du Haut Atlas Occidental et de Son Avant Pays Septentrional Sur La Dynamique Mésocénozoïque de La Marge Atlantique (Entre Safi et Agadir). Apport de La Sismique Réflexion et Des Données de Forages. Ph.D. Thesis, Université Ibn Tofail, Kenitra, Morocco, 1999. Unpublished. [Google Scholar]
  16. Bouatmani, R.; Medina, F.; Salem, A.A.; Hoepffner, C. Thin-Skin Tectonics in the Essaouira Basin (Western High Atlas, Morocco): Evidence from Seismic Interpretation and Modelling. J. Afr. Earth Sci. 2003, 37, 25–34. [Google Scholar] [CrossRef]
  17. Medina, F.; Chorowicz, J. Phénomènes Synsédimentaires et Tectonique Extensive Mésozoïque: L’exemple de l’anticlinal d’Anklout Haut Atlas Occidental. Bull. L’institut Sci. (Rabat) 1983, 7, 23–32. [Google Scholar]
  18. Souid, A.K. Etude Tectonique et Microtectonique Des Injections Du Trias Du Bassin d’Essaouira Pendant Les Compressions Alpines Dans l’avant-Pays Atlantique (Maroc). Ph.D. Thesis, Université de Montpellier, Montpellier, France, 1983. [Google Scholar]
  19. Laville, E.; Petit, J.-P. Role of Synsedimentary Strike-Slip Faults in the Formation of Moroccan Triassic Basins. Geology 1984, 12, 424–427. [Google Scholar] [CrossRef]
  20. Medina, F. La Distension Triasique Contemporaine Du Rifting de l’Atlantique Central Dans Le Couloir d’Argana (Haut Atlas Occidental, Maroc). Bull. L’institut Sci. (Rabat) 1984, 39–46. [Google Scholar]
  21. Medina, F. Landsat Imagery Interpretation of Essaouira Basin (Morocco): Comparison with Geophysical Data, and Structural Implications. J. Afr. Earth Sci. (Middle East) 1989, 9, 69–75. [Google Scholar] [CrossRef]
  22. Piqué, A.; Laville, E. L’ouverture de l’Atlantique Central: Un Rejeu En Extension Des Structures Paléozoïques? In Comptes Rendus de L’Académie des Sciences. Série 2, Mécanique, Physique, Chimie, Sciences de L’univers, Sciences de la Terre; Gauthier-Villars: Paris, France, 1993; Volume 317, pp. 1325–1332. [Google Scholar]
  23. Pique, A.; Laville, E. L’ouverture Initiale de l’Atlantique Central. Bull. Soc. Géol. Fr. 1995, 166, 725–738. [Google Scholar]
  24. Le Roy, P.; Pique, A.; Le Gall, B.; Ait Brahim, L.; Morabet, A.M.; Demnati, A. Les Bassins Cotiers Triasico-Liasiques Du Maroc Occidental et La Diachronie Du Rifting Intra-Continental de l’Atlantique Central. Bull. Soc. Géol. Fr. 1997, 168, 637–648. [Google Scholar]
  25. Pique, A.; Ait Brahim, L.; Ait Ouali, R.; Amrhar, M.; Charroud, M.; Gourmelen, C.; Laville, E.; Rekhiss, F.; Tricart, P. Evolution Structurale Des Domaines Atlasiques Du Maghreb Au Méso-Cénozoïque; Le Rôle Des Structures Héritées Dans La Déformation Du Domaine Atlasique de l’Afrique Du Nord. Bull. Soc. Géol. Fr. 1998, 169, 797–810. [Google Scholar]
  26. Hanich, L. Structure et Fonctionnement d’un Aquifère Multicouche Carbonaté–Exemple Du Bassin d’Essaouira–Guide Méthodologique; Thesis report; Cadi Ayad University: Marrakech, Morocco, 2001. [Google Scholar]
  27. Taj-Eddine, K. Le Jurassique Terminal et Le Crétacé Basal Dans l’Atlas Atlantique (Maroc): Biostratigraphie, Sédimentologie, Stratigraphie Séquentielle et Géodynamique; Laboratoire de Géologie sédimentaire et Paléontologie, Université Paul Sabatier: Toulouse, France, 1992; Volume 16. [Google Scholar]
  28. Hanich, L.; Zouhri, L.; Dinger, J. Characterization of the Cretaceous Aquifer Structure of the Meskala Region of the Essaouira Basin, Morocco. J. Afr. Earth Sci. 2011, 59, 313–322. [Google Scholar] [CrossRef]
  29. Mehdi, K.; Griboulard, R.; Bobier, C. Rôle de l’halocinèse Dans l’évolution Du Bassin d’Essaouira (Sud-Ouest Marocain). C. R. Géosci. 2004, 336, 587–595. [Google Scholar] [CrossRef]
  30. Amrhar, M. Structural Evolution of the Western High Atlas in the Context of the Opening of the Central Atlantic and the Africa-Europe Collision. In Structure, Tectonic Instabilities and Neomagmatism; Cadi Ayad University: Marrakech, Morocco, 1995. [Google Scholar]
  31. Hafid, M. Triassic–Early Liassic Extensional Systems and Their Tertiary Inversion, Essaouira Basin (Morocco). Mar. Pet. Geol. 2000, 17, 409–429. [Google Scholar] [CrossRef]
  32. Bouatmani, R.; Chakor Alami, A.; Medina, F. Subsidence, Évolution Thermique et Maturation Des Hydrocarbures Dans Le Bassin d’Essaouira (Maroc): Apport de La Modélisation. Bull. L’institut Sci. Rabat 2007, 29, 15–36. [Google Scholar]
  33. Tari, G.; Novotny, B.; Jabour, H.; Hafid, M. Salt Tectonics along the Atlantic Margin of NW Africa (Morocco and Mauritania). In Permo-Triassic Salt Provinces of Europe, North Africa and the Atlantic Margins; Elsevier: Amsterdam, The Netherlands, 2017; pp. 331–351. [Google Scholar]
  34. Laftouhi, N.E. Hydrogéologie et Hydrogéochimie de l’aquifère Turonien Du Bassin Synclinal de Meskala-Kourimat-Ida Ou Zemzem (Essaouira, Maroc). Ph.D. Thesis, Cadi Ayad University, Marrakech, Morocco, 1991. [Google Scholar]
  35. Ben Kabbour, B. Contribution à l’identification et La Caractérisation d’un Système Aquifère Multicouche Par Méthodes Géophysiques, Hydrogéologiques et Télédétection. Exemple Appliqué à La Région d’Akermoud—Ain El Hjar (Province d’Essaouira, Maroc); University Cadi Ayyad: Marrakech, Maroc, 1995. [Google Scholar]
  36. Briggs, I.C. Machine Contouring Using Minimum Curvature. Geophysics 1974, 39, 39–48. [Google Scholar] [CrossRef]
  37. Everaerts, M.; Mansy, J.-L. Le Filtrage Des Anomalies Gravimetriques; Une Cle Pour La Comprehension Des Structures Tectoniques Du Boulonnais et de l’Artois (France). Bull. Soc. Géol. Fr. 2001, 172, 267–274. [Google Scholar] [CrossRef]
  38. Ouerghi, S.; Rebai, N.; Gabtni, H.; Farhat, B.; Bouaziz, S. Apport de La Gravimétrie à l’étude Des Structures Effondrées Du Nord-Est de La Tunisie: Implications Hydrogéologiques. Hydrol. Sci. J. 2013, 58, 1361–1373. [Google Scholar] [CrossRef]
  39. Khazri, D.; Gabtni, H. New Structural Model to Understanding the Subsurface Hydrogeology System of the Ouled Asker Groundwater, Central Tunisian Atlassic Foreland, Derived from an Integrated Geophysical Approach. Arab. J. Geosci. 2022, 15, 738. [Google Scholar] [CrossRef]
  40. Ikirri, M.; Jaffal, M.; Rezouki, I.; Echogdali, F.Z.; Boutaleb, S.; Abdelrahman, K.; Abu-Alam, T.; Faik, F.; Kchikach, A.; Abioui, M. Contribution of Gravity Data for Structural Characterization of the Ifni Inlier, Western Anti-Atlas, Morocco: Hydrogeological Implications. Appl. Sci. 2023, 13, 6002. [Google Scholar]
  41. Miller, H.G.; Singh, V. Potential Field Tilt—A New Concept for Location of Potential Field Sources. J. Appl. Geophys. 1994, 32, 213–217. [Google Scholar]
  42. Verduzco, B.; Fairhead, J.D.; Green, C.M.; MacKenzie, C. New Insights into Magnetic Derivatives for Structural Mapping. Lead. Edge 2004, 23, 116–119. [Google Scholar] [CrossRef]
  43. Salem, A.; Williams, S.; Fairhead, J.D.; Ravat, D.; Smith, R. Tilt-Depth Method: A Simple Depth Estimation Method Using First-Order Magnetic Derivatives. Lead. Edge 2007, 26, 1502–1505. [Google Scholar]
  44. Salem, A.; Williams, S.; Fairhead, D.; Smith, R.; Ravat, D. Interpretation of Magnetic Data Using Tilt-Angle Derivatives. Geophysics 2008, 73, L1–L10. [Google Scholar]
  45. Hood, P. Gradient Measurements in Aeromagnetic Surveying. Geophysics 1965, 30, 891–902. [Google Scholar] [CrossRef]
  46. Thompson, D.T. EULDPH: A New Technique for Making Computer-Assisted Depth Estimates from Magnetic Data. Geophysics 1982, 47, 31–37. [Google Scholar]
  47. Reid, A.B.; Allsop, J.M.; Granser, H.; Millett, A.; Somerton, I.W. Magnetic Interpretation in Three Dimensions Using Euler Deconvolution. Geophysics 1990, 55, 80–91. [Google Scholar] [CrossRef]
  48. Keating, P.B. Weighted Euler Deconvolution of Gravity Data. Geophysics 1998, 63, 1595–1603. [Google Scholar] [CrossRef]
  49. Mushayandebvu, M.F.; Lesur, V.; Reid, A.B.; Fairhead, J.D. Grid Euler Deconvolution with Constraints for 2D Structures. Geophysics 2004, 69, 489–496. [Google Scholar] [CrossRef]
  50. Shepherd, T.; Bamber, J.L.; Ferraccioli, F. Subglacial Geology in Coats Land, East Antarctica, Revealed by Airborne Magnetics and Radar Sounding. Earth Planet. Sci. Lett. 2006, 244, 323–335. [Google Scholar] [CrossRef]
  51. Keating, P.; Pilkington, M. Euler Deconvolution of the Analytic Signal and Its Application to Magnetic Interpretation. Geophys. Prospect. 2004, 52, 165–182. [Google Scholar] [CrossRef]
  52. Zakariah, M.N.A.; Roslan, N.; Sulaiman, N.; Lee, S.C.H.; Hamzah, U.; Noh, K.A.M.; Lestari, W. Gravity Analysis for Subsurface Characterization and Depth Estimation of Muda River Basin, Kedah, Peninsular Malaysia. Appl. Sci. 2021, 11, 6363. [Google Scholar] [CrossRef]
  53. Cooper, G.R.J. The Automatic Determination of the Location and Depth of Contacts and Dykes from Aeromagnetic Data. Pure Appl. Geophys. 2014, 171, 2417–2423. [Google Scholar] [CrossRef]
  54. Cordell, L.; Grauch, V.J.S. Mapping Basement Magnetization Zones from Aeromagnetic Data in the San Juan Basin, New Mexico. In The Utility of Regional Gravity and Magnetic Anomaly Maps; Society of Exploration Geophysicists: Houston, TX, USA, 1985; pp. 181–197. [Google Scholar]
  55. Barbosa, V.C.; Silva, J.B.; Medeiros, W.E. Stability Analysis and Improvement of Structural Index Estimation in Euler Deconvolution. Geophysics 1999, 64, 48–60. [Google Scholar] [CrossRef]
  56. Ugalde, H.; Morris, W.A. Cluster Analysis of Euler Deconvolution Solutions: New Filtering Techniques and Geologic Strike Determination. Geophysics 2010, 75, L61–L70. [Google Scholar] [CrossRef]
  57. Barbosa, V.C.; Silva, J.B. Reconstruction of Geologic Bodies in Depth Associated with a Sedimentary Basin Using Gravity and Magnetic Data. Geophys. Prospect. 2011, 59, 1021–1034. [Google Scholar] [CrossRef]
  58. Ravat, D. Analysis of the Euler Method and Its Applicability in Environmental Magnetic Investigations. J. Environ. Eng. Geophys. 1996, 1, 229–238. [Google Scholar] [CrossRef]
  59. FitzGerald, D.; Reid, A.; McInerney, P. New Discrimination Techniques for Euler Deconvolution. In Proceedings of the 8th SAGA Biennial Technical Meeting and Exhibition, Pilanesberg, South Africa, 7–10 October 2003. [Google Scholar]
  60. Reid, A.B. Euler Deconvolution: Past, Present and Future—A Review. In Proceedings of the 65th SEG meeting, Houston, USA, Expanded Abstracts, Houston, TX, USA, 8–13 October 1995; pp. 272–273. [Google Scholar]
  61. Hansen, R.O.; Suciu, L. Multiple-Source Euler Deconvolution. Geophysics 2002, 67, 525–535. [Google Scholar] [CrossRef]
  62. El Dawi, M.G.; Tianyou, L.; Hui, S.; Dapeng, L. Depth Estimation of 2-D Magnetic Anomalous Sources by Using Euler Deconvolution Method. Am. J. Appl. Sci. 2004, 1, 209–214. [Google Scholar] [CrossRef]
  63. Salem, A.; Smith, R. Depth and Structural Index from Normalized Local Wavenumber of 2D Magnetic Anomalies. Geophys. Prospect. 2005, 53, 83–89. [Google Scholar] [CrossRef]
  64. Melo, F.F.; Barbosa, V.C.; Uieda, L.; Oliveira, V.C.; Silva, J.B. Estimating the Nature and the Horizontal and Vertical Positions of 3D Magnetic Sources Using Euler Deconvolution. Geophysics 2013, 78, J87–J98. [Google Scholar] [CrossRef]
  65. Draper, N.R.; Smith, H. Applied Regression Analysis; John Wiley & Sons: Hoboken, NJ, USA, 1998; Volume 326. [Google Scholar]
Figure 3. Bouguer anomaly map of the Essaouira Basin. White dots represent the gravity measurement stations.
Geosciences 13 00345 g003
Figure 4. (A) Superposition of the salt diapirs’ outlines, recognized from seismic data, on the residual gravity anomaly map. (B) Overlay of residual gravity anomaly contours on the geological map of the Essaouira Basin (same legend as Figure 1), salt diapir after Tari et a. 2017 [33].
Geosciences 13 00345 g004
Figure 5. Tilt derivative of the residual gravity map. The dotted lines represent the zero contour, which delineate the boundaries of the causative bodies.
Geosciences 13 00345 g005
Figure 6. Improved logistic filter map (p = 2) of the residual gravity data. The white dotted lines represent the zero contours of the tilt derivative.
Geosciences 13 00345 g006
Figure 7. Euler deconvolution solutions of the study area, calculated for a structural index SI = 0, a moving window of 10 × 10 and maximum relative error of 15%. The background image represents the residual gravity map.
Geosciences 13 00345 g007
Figure 8. (A) Map summarizing the obtained results. 1. Negative gravity anomaly associated with sedimentary sub-basin; 2. Negative gravity anomaly related to salt deposits; 3. Axis of negative gravity anomaly; 4. Interpreted fault; 5. Interpreted major fault; 6. Salt diapir [33]; 7. Observed fault; (B) Rose diagram of corresponding faults’ orientation.
Geosciences 13 00345 g008
Figure 9. Superposition of groundwater flow data on the synthesis map of results. 1. Negative gravity anomaly associated with sedimentary sub-basin; 2. Negative gravity anomaly related to salt deposit; 3. Axis of negative gravity anomaly; 4. Interpreted fault; 5. Interpreted major fault; 6. Observed fault.
Geosciences 13 00345 g009
Disclaimer/Publisher’s Note: The statements, opinions and data contained in all publications are solely those of the individual author(s) and contributor(s) and not of MDPI and/or the editor(s). MDPI and/or the editor(s) disclaim responsibility for any injury to people or property resulting from any ideas, methods, instructions or products referred to in the content.

