Abstract
Arctic permafrost often contains gas-saturated horizons. The gas component in freezing and frozen soils can exist under different pressures, which are expected to affect their properties and behavior. The effect of pore gas pressure on the thermal conductivity of frozen and unfrozen silt loam saturated with methane or carbon dioxide at pressures below the hydrate formation conditions is observed in the current study. The variable gas pressure and temperature conditions are simulated in a specially designed pressure cell, which allows thermal conductivity measuring in pressurized samples at positive and negative temperatures. The experiments using natural samples collected near the gas emission crater (Yamal Peninsula) show that thermal conductivity is sensitive to pore gas pressure even at high moisture contents. The thermal conductivity of methane-saturated soil becomes 4% and 6% higher in frozen and unfrozen samples, respectively, as the gas pressure increases from 0.1 MPa to 2 MPa. In the case of CO2 saturation, the respective thermal conductivity increase in frozen and unfrozen samples reaches 25% and 15% upon pressure change from 0.1 to 0.9 MPa. The results stimulate further special studies of the effects of gas type and pressure on the thermal properties of closed gas-saturated taliks, of which the pore pressure is increasing during freezing up.
1. Introduction
Intensive exploration of the Russian Arctic regions for petroleum production has revealed large amounts of gas, especially methane, stored in permafrost [1,2,3,4,5,6,7,8,9,10,11,12]. Gas accumulations are found at different depths within permafrost but are especially abundant at shallow levels above the Gas Hydrate Stability Zone (GHSZ) [13,14,15,16,17,18,19,20,21]. Intra-permafrost gas is an essential source of methane emissions from evolving permafrost, including the explosive emissions that produced particular craters discovered in northern West Siberia in the past decade [22,23,24,25,26]. Gas accumulation can be associated with various geocryological processes, such as penetration of gas into local reservoirs during the degradation of thermokarst lakes, the perennial freezing of ground, the migration of deep-seated gas through fractured permafrost, or gas release during the dissociation of gas hydrates [2,3]. A local accumulation of gas often occurs as a result of cryogenic concentration during the freezing process of gas-containing sediments, caused by the compression of gas by the freezing front, which leads to the appearance of gas pressure. A typical case of this process is the freezing in closed conditions of gas-saturated deposits of talik zones, for example, sub-lake taliks, which can freeze from all sides during the degradation of thermokarst lakes.
Permafrost gas reservoirs are often pressurized, and drilling can cause explosive gas emissions, with the ejection of rock debris. The development of recommendations for predicting the occurrence and behavior of such “explosive” intra-permafrost structures in areas of economic development of the Arctic is relevant, especially in the context of global climate change [27]. Meanwhile, the gas component of permafrost pore fluids remains poorly investigated, though this knowledge is crucial in many aspects. The properties of frozen, freezing, and thawing rocks, including thermal properties that have implications for the thermal and mechanic responses of gas-saturated permafrost to temperature variations, comprise an especially important issue [28], for example, in assessing the reverse freezing of gas-saturated thawing halos around production wells during an emergency shutdown of the well [29,30]. When water-gas-saturated sediments reverse freeze in a confined space, the significant pressure generated can crush casing and tubing pipes.
Several previous theoretical and experimental studies revealed the influence of gas composition and pressure on the temperature of pore water/pore ice phase transitions in soils [31,32] and their related thermal parameters [32]. It has been shown that the chemical composition of the gas has a noticeable effect on lowering the freezing point of pore water only in the presence of highly soluble gases such as CO2. Thus, for slightly soluble gases (nitrogen and methane), the coefficient of the decrease in freezing temperature for the studied rocks is about 0.1 °C/MPa; with the appearance of carbon dioxide in the system, it increases to 1.36 °C/MPa [31]. However, this influence has not been practically utilized in relation to the assessment of the thermal conductivity of gas-saturated sediments. In this respect, physical modeling is a workable way to estimate the sensitivity of thermal conductivity to the type of pore gas and gas pressure in soils exposed to freezing and thawing.
2. Materials and Methods
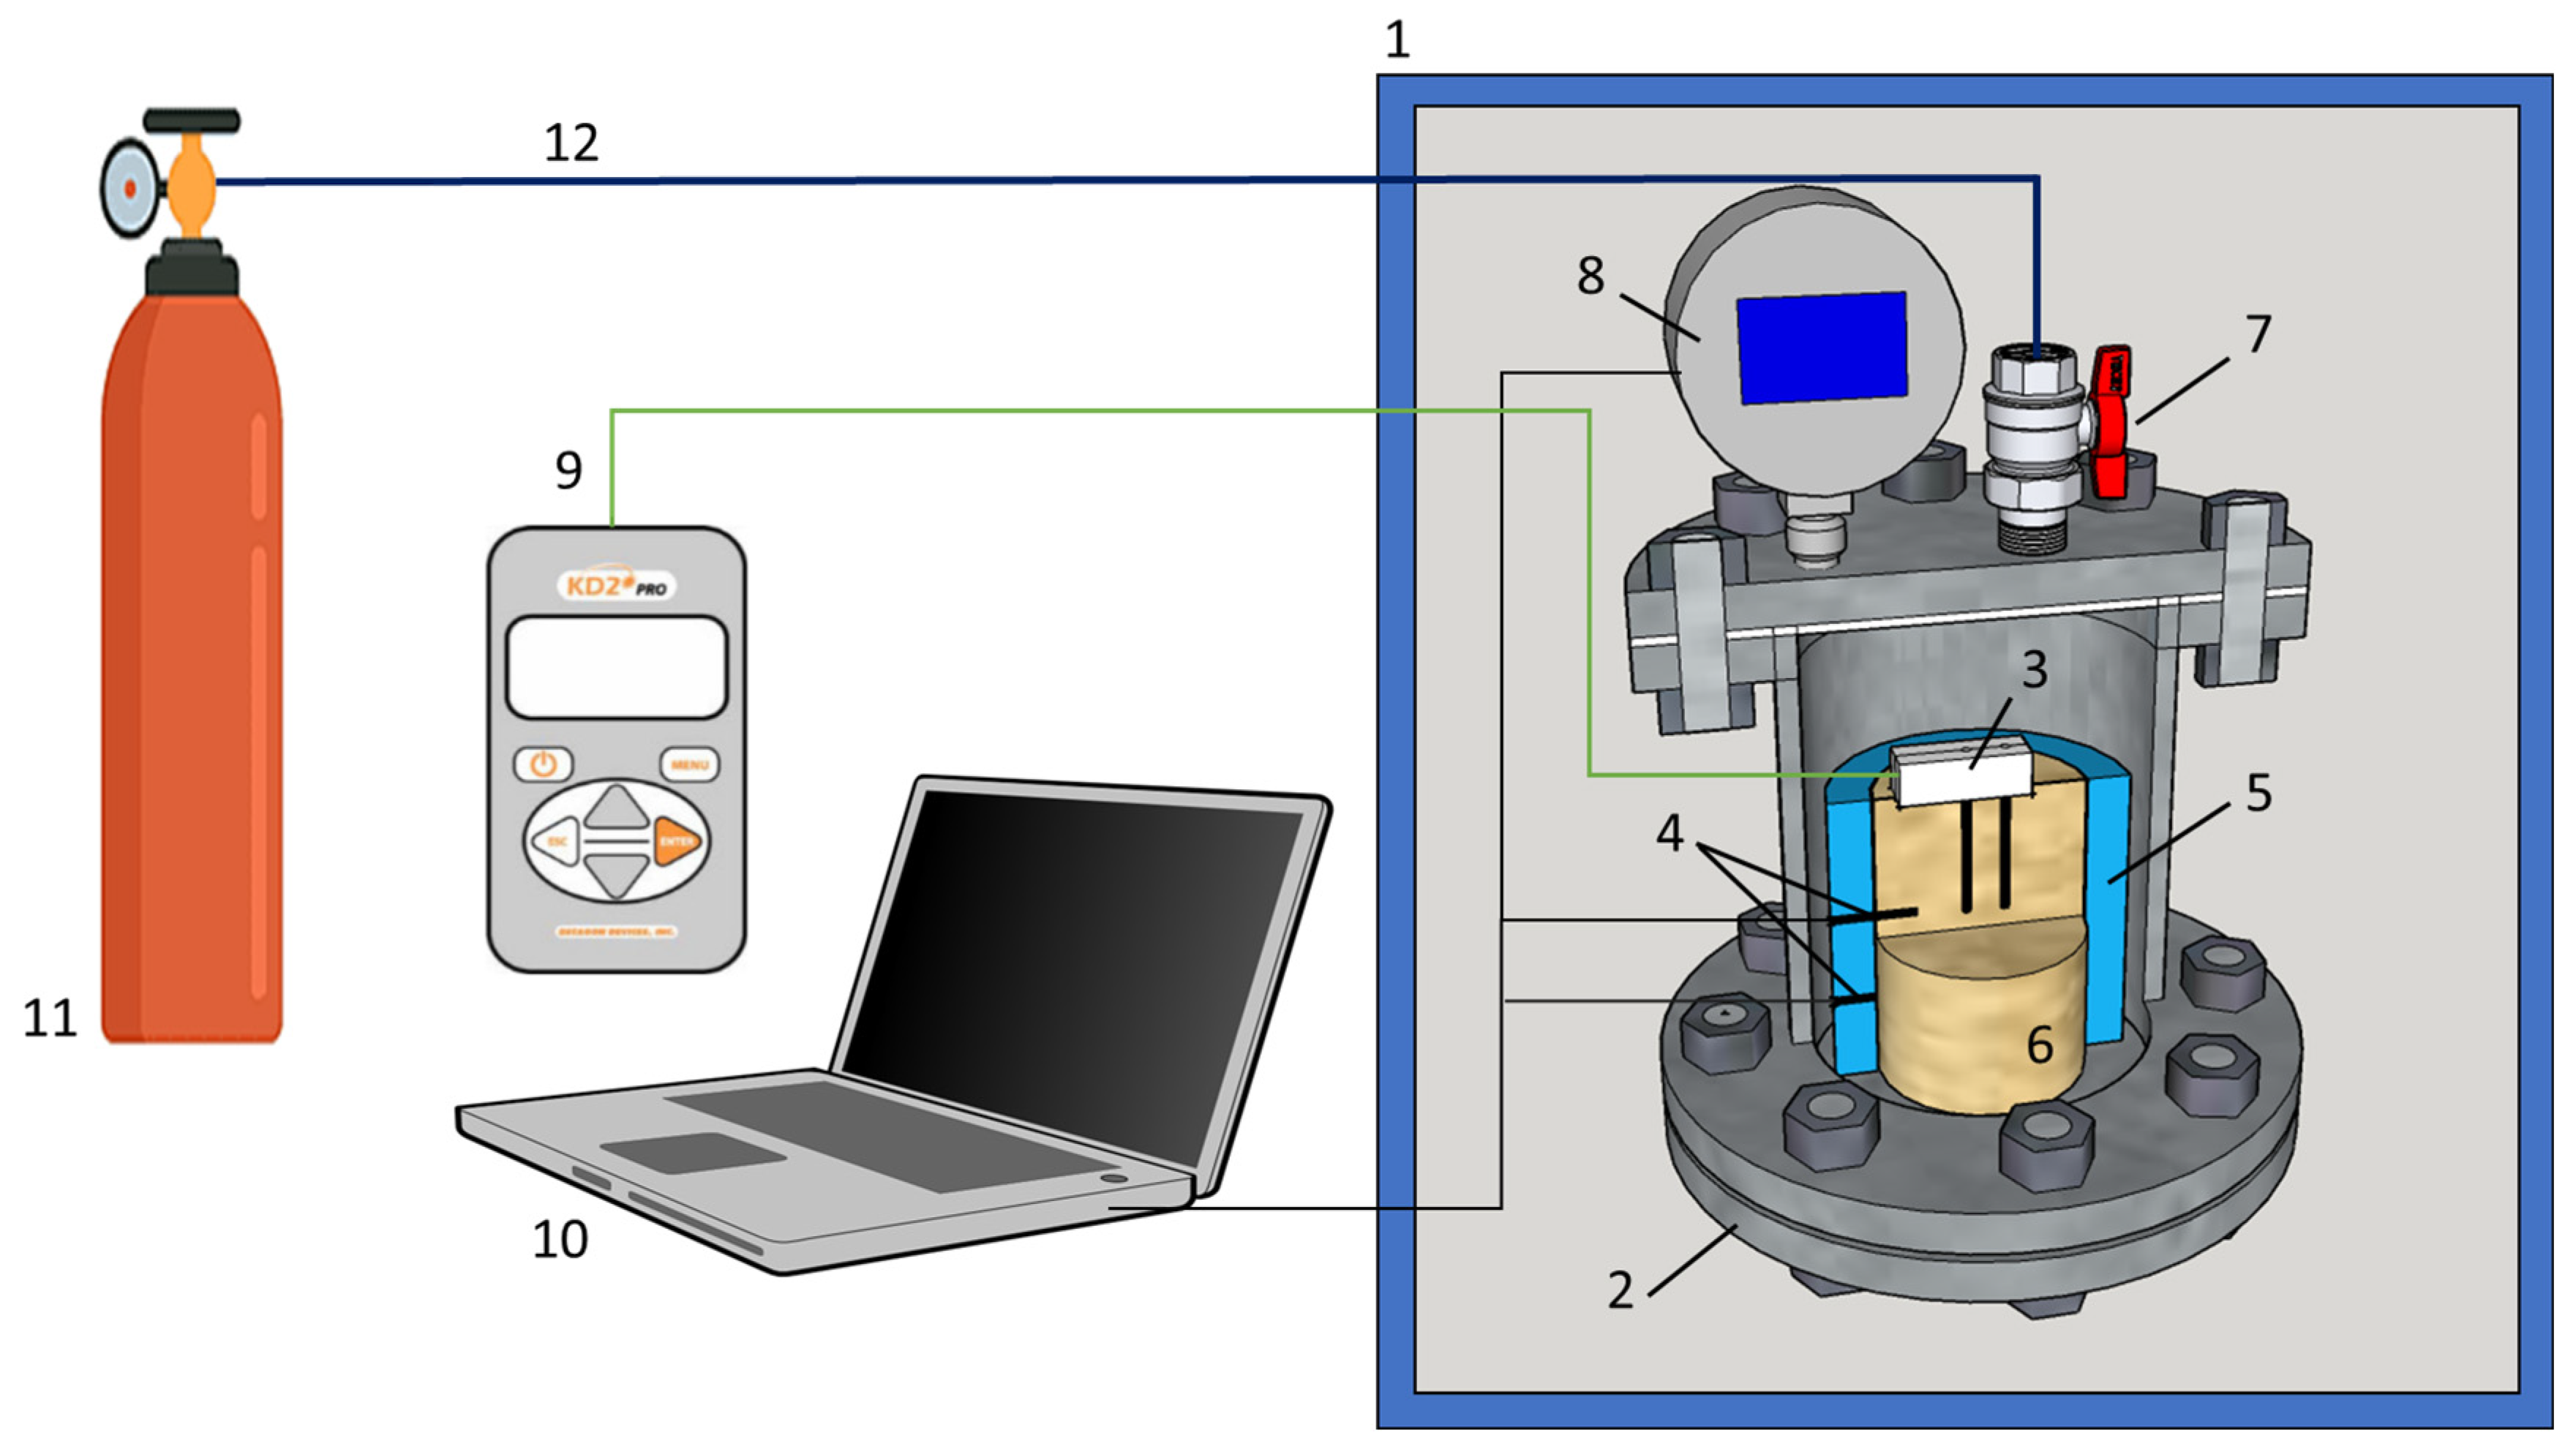
The thermal conductivity of gas-bearing sediment samples at different pressure and temperature conditions was studied in a test pressure cell with a system of gas supply and automatic pressure and temperature recording (Figure 1). The test pressure cell with sediment samples was placed into a climatic cell with set temperature conditions. The temperature and pressure in the pressure cell were monitored via the digital PT sensors connected to a PC.
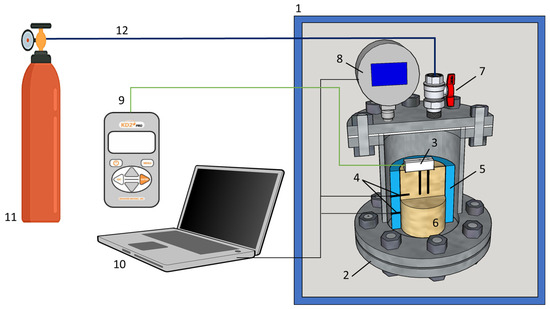
Figure 1.
Schematic of the experimental setup: 1 = temperature chamber, 2 = pressure chamber, 3 = thermal conductivity sensor, 4 = temperature sensors, 5 = plastic container, 6 = sample; 7 = inlet gas port, 8 = digital pressure sensor, 9 = KD-2 Pro device, 10 = PC with logging system, 11 = gas cylinder, 12 = gas line.
The thermal conductivity of gas-bearing sediment samples was measured using a KD-2 Pro dual-needle probe (manufactured by METER Group, Pullman, WA, USA). The dual-needle SH-1 sensor was 30 mm long and 1.3 mm in diameter. The temperature of the samples near the sensor rose no more than 0.5 C during the measurements.
According to the findings from an earlier modification of the KD-2 instrument used in experiments with frozen, unfrozen, and hydrate-bearing samples [33], the absolute accuracy in thermal conductivity measurements of frozen samples is no worse than ±5%. The relative measurement error is within 0.5%, which makes it possible to determine small fluctuations in the thermal conductivity of samples over time, provided that the probe is installed identically and there are no external influences on the experimental setup.
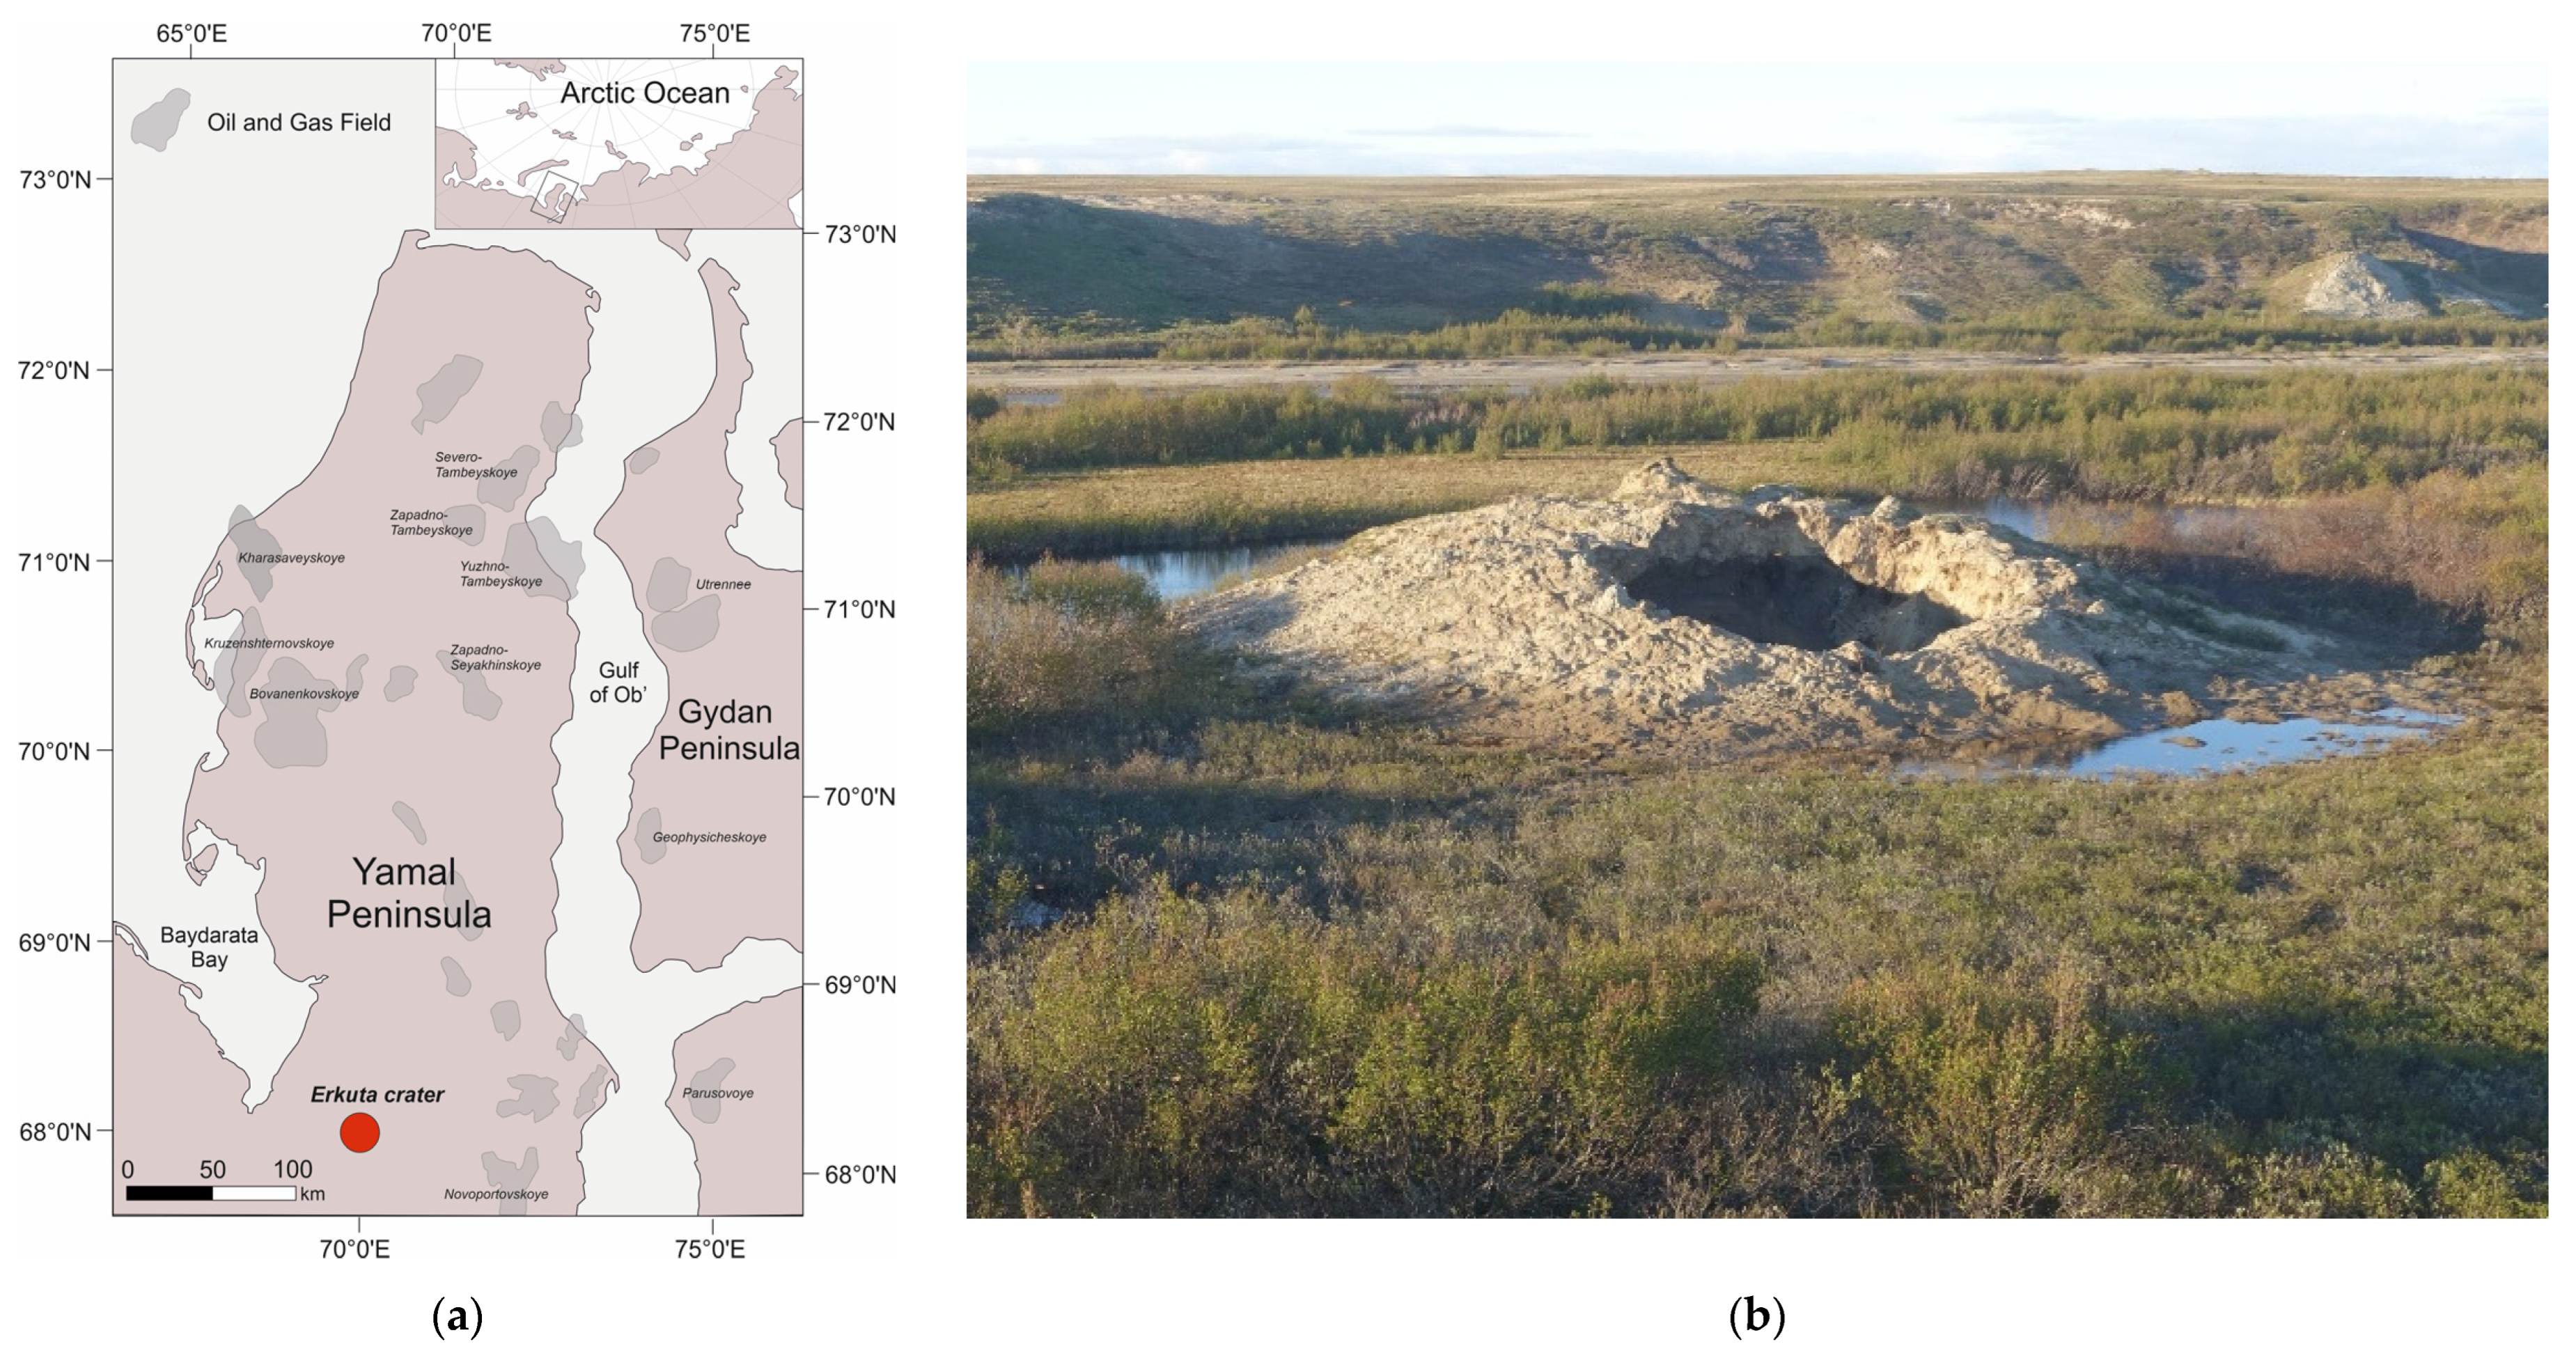
The experiments were applied to clay silt (silt loam) sampled in the vicinity of a crater (Figure 2) produced by explosive gas emissions in the Erkuta River valley in the southern Yamal Peninsula [24].
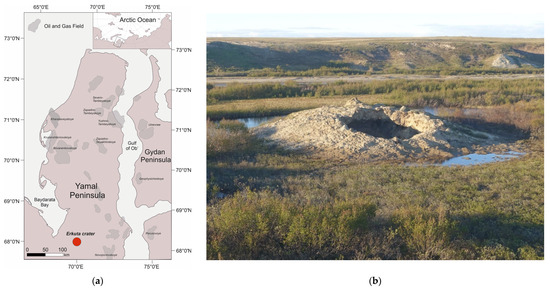
Figure 2.
Erkuta crater location on the Yamal Peninsula (a), and (b) a general view in July 2017 (photo by A. Sinitsky).
The sample represents the soil ejected from shallow permafrost during the explosion (Table 1).

Table 1.
The particle sizes, salinity, and density of sample used in the experiments.
The sample (Table 1) consists mainly (54%) of 0.05–0.01 mm silt particles, has the low salinity of ≤0.05%, and contains only ~0.4% total organic carbon (TOC). The mineralogy (Table 2) includes 45% quartz, 32% feldspars (microcline and albite), and about 18% clay minerals (illite, chlorite, kaolinite, smectide), and a minor percentage is made up of other phases (less than a few percent).

Table 2.
The mineral composition of the studied soils.
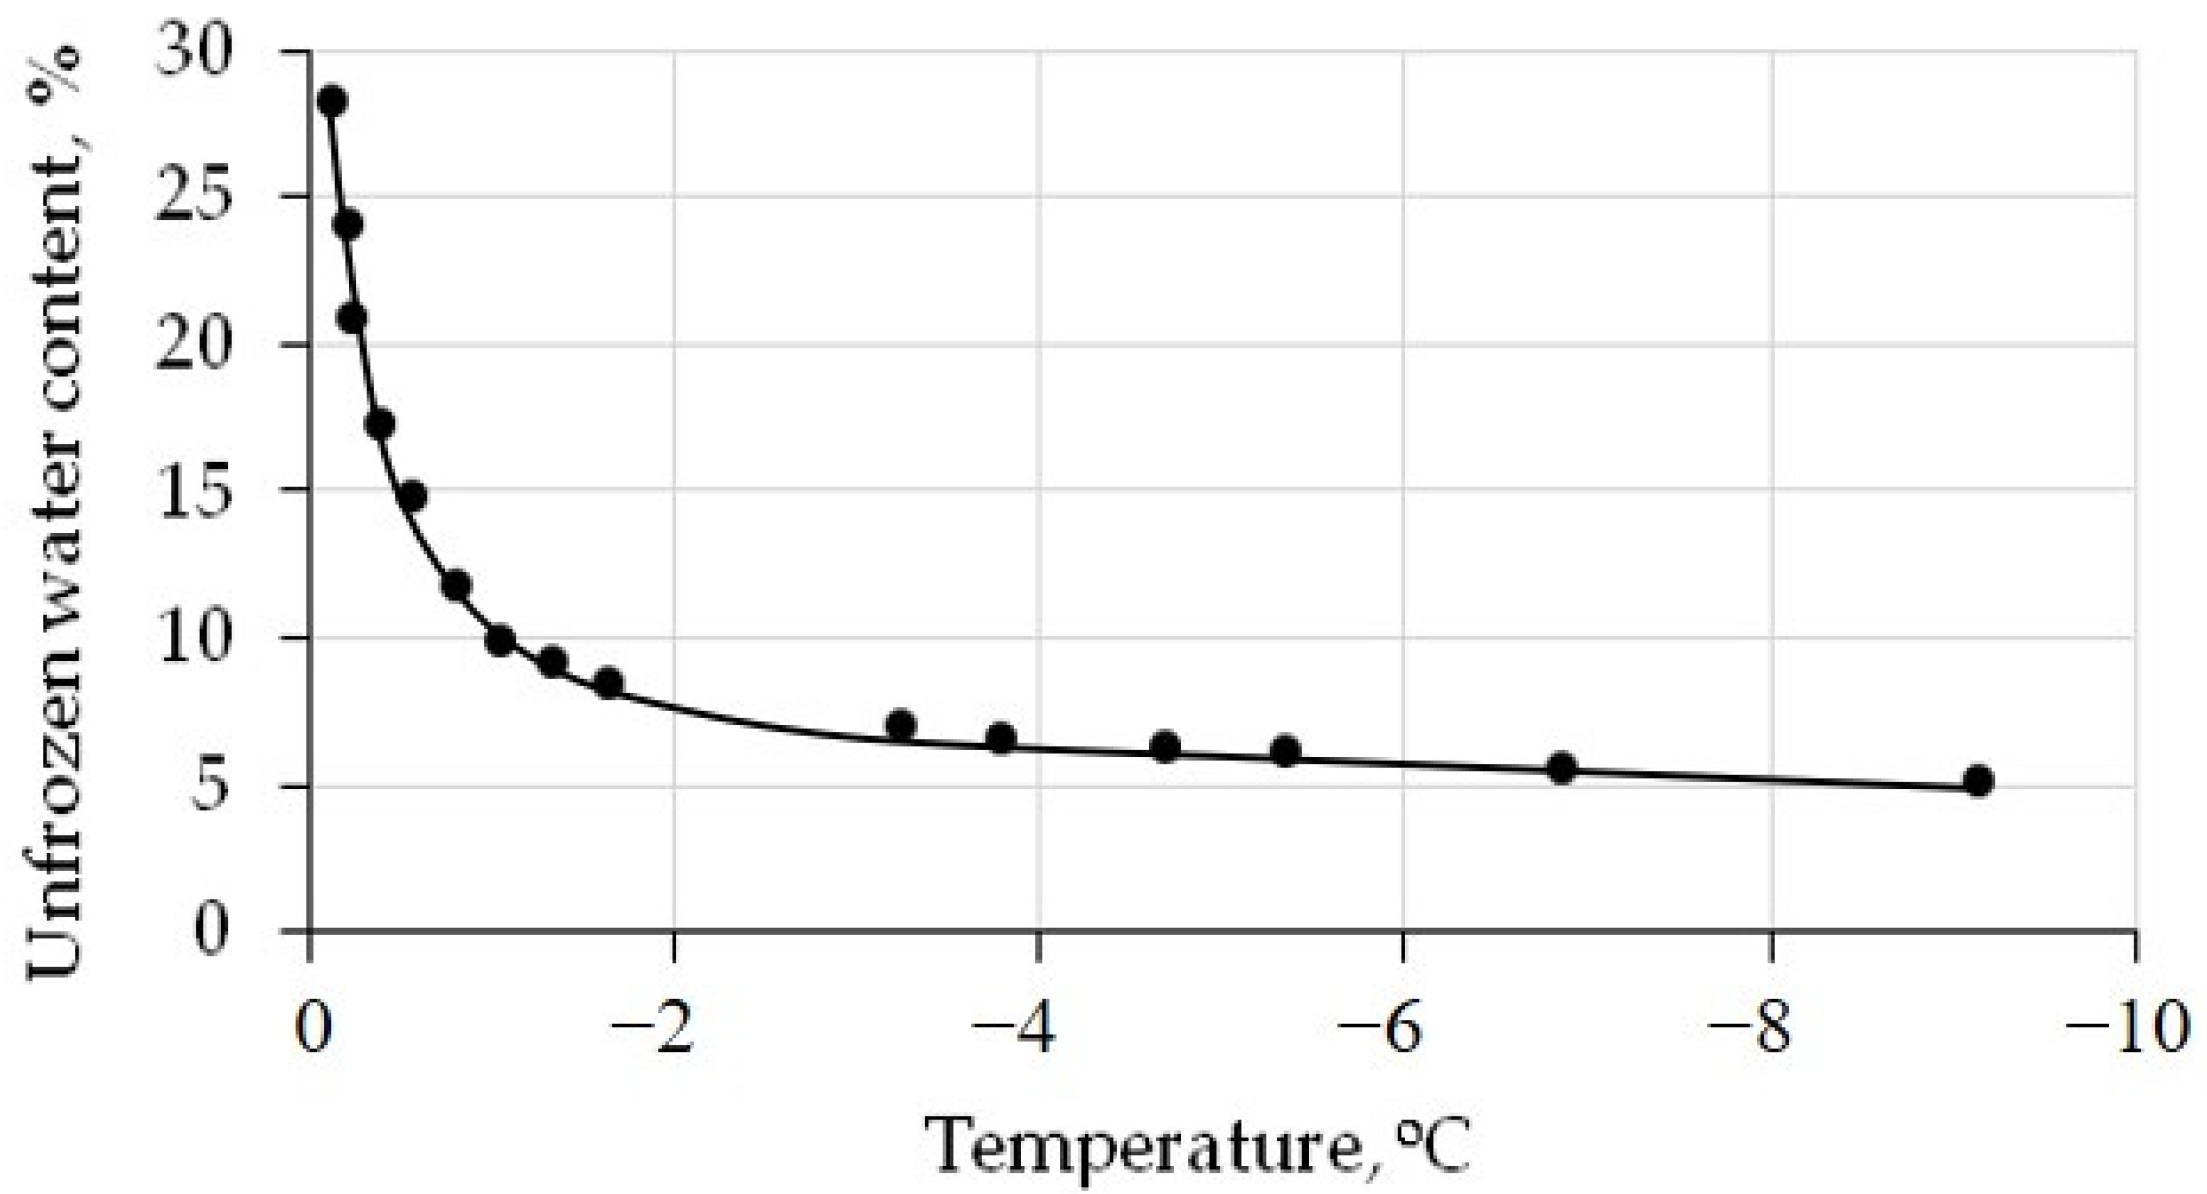
The unfrozen water content, estimated via the water potential method [35], vary as a function of the temperature below 0 °C (Figure 3).
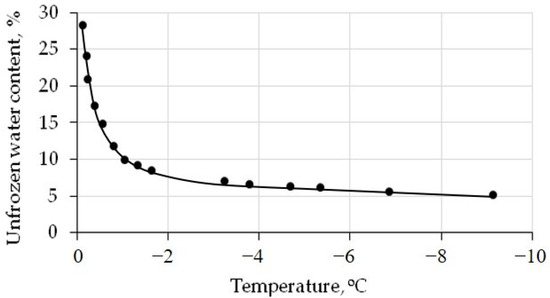
Figure 3.
The unfrozen water content curve for the silt loam. Black dots—calculated data. Solid line—approximation of calculated data.
The air-dry soil sample was prepared with a specified initial moisture content and density, following the method described in [33]. To attain the designed water content, the dry soil samples were mixed with distilled water and then left for 30 min for stabilization. The wet soil was compacted, layer by layer, into perforated cylindrical plastic containers of 80 mm in height and 46 mm in diameter. The sample initially had a moisture content of 21%, a dry density of 1.98 g/cm3, a porosity of ~38%, and a water saturation (Sw) of 88% (Table 3).

Table 3.
The moisture, density, and porosity of the sample used in the experiments.
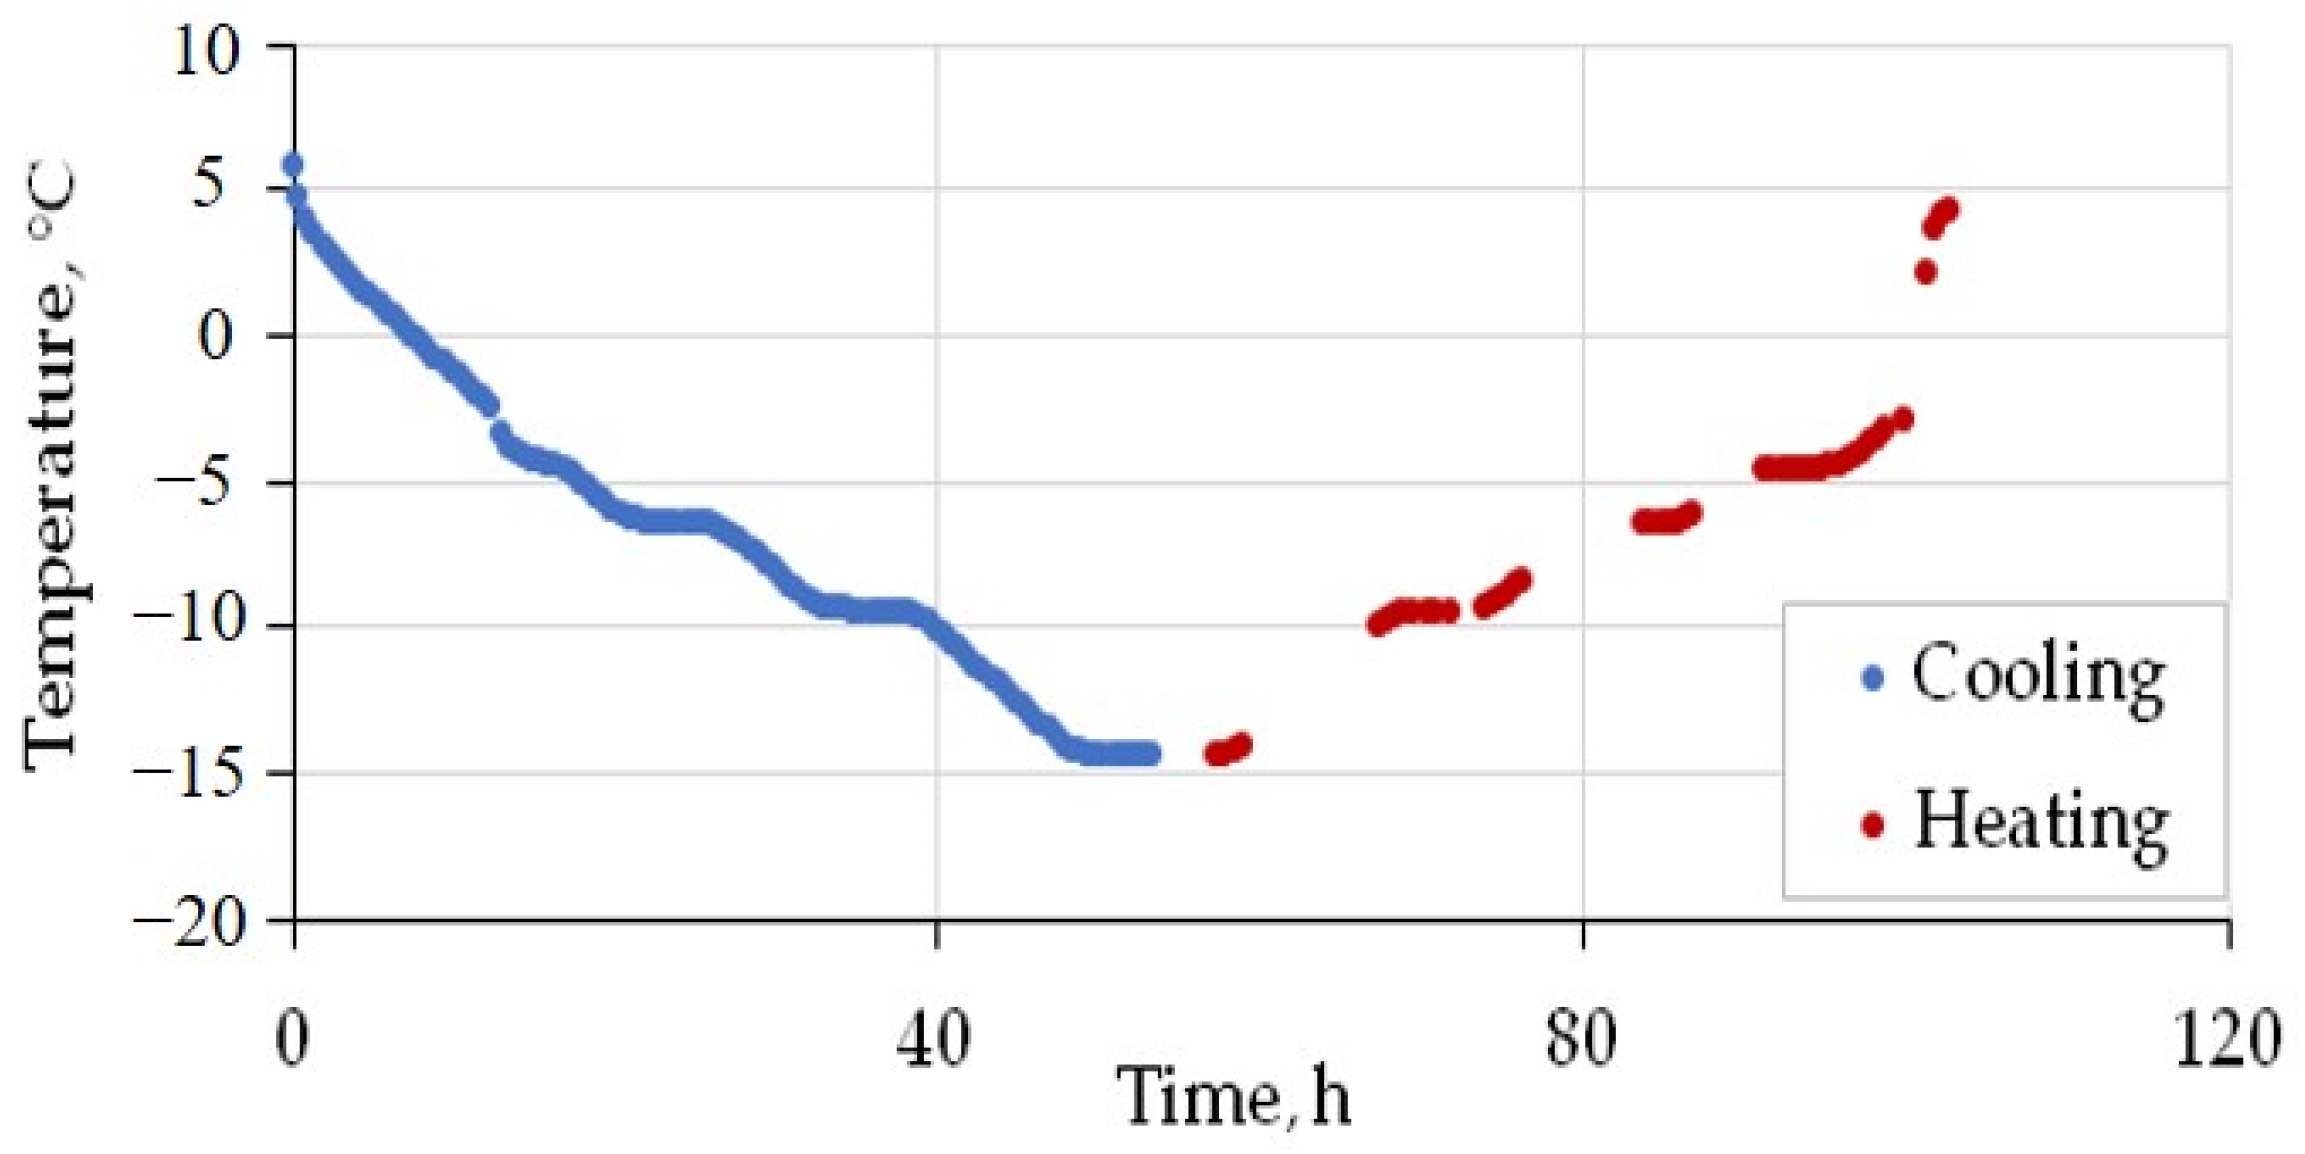
The prepared sample was placed into the pressure cell, which was then sealed, vacuumed, cooled to −6, and filled with CH4 or CO2, until pressures were reached below the limit required for pore hydrate formation: 0.1, 1, and 2 MPa for pore methane (99.99%) and 0.1, 0.5 and 0.9 MPa in the case of 99.95% CO2. The temperature was first increased to positive values (+6 °C) and then reduced to −15 °C after 8 h of stabilization. The heating–cooling cycles last about 4–5 days, while thermal conductivity variations are constantly monitored. The sample was cooled down and warmed up at a rate of ~0.5 °C/h (Figure 4).
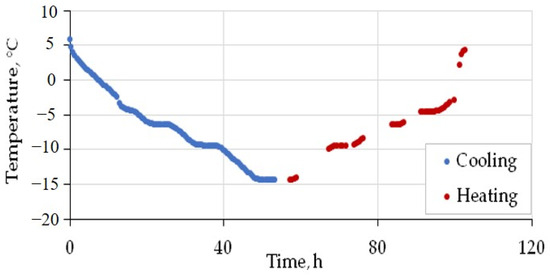
Figure 4.
Time-dependent temperature variations in CH4 in the saturated silt loam sample (W = 21%) in the pressure cell under 1 MPa during cooling and heating between +5 °C and −15 °C.
3. Results
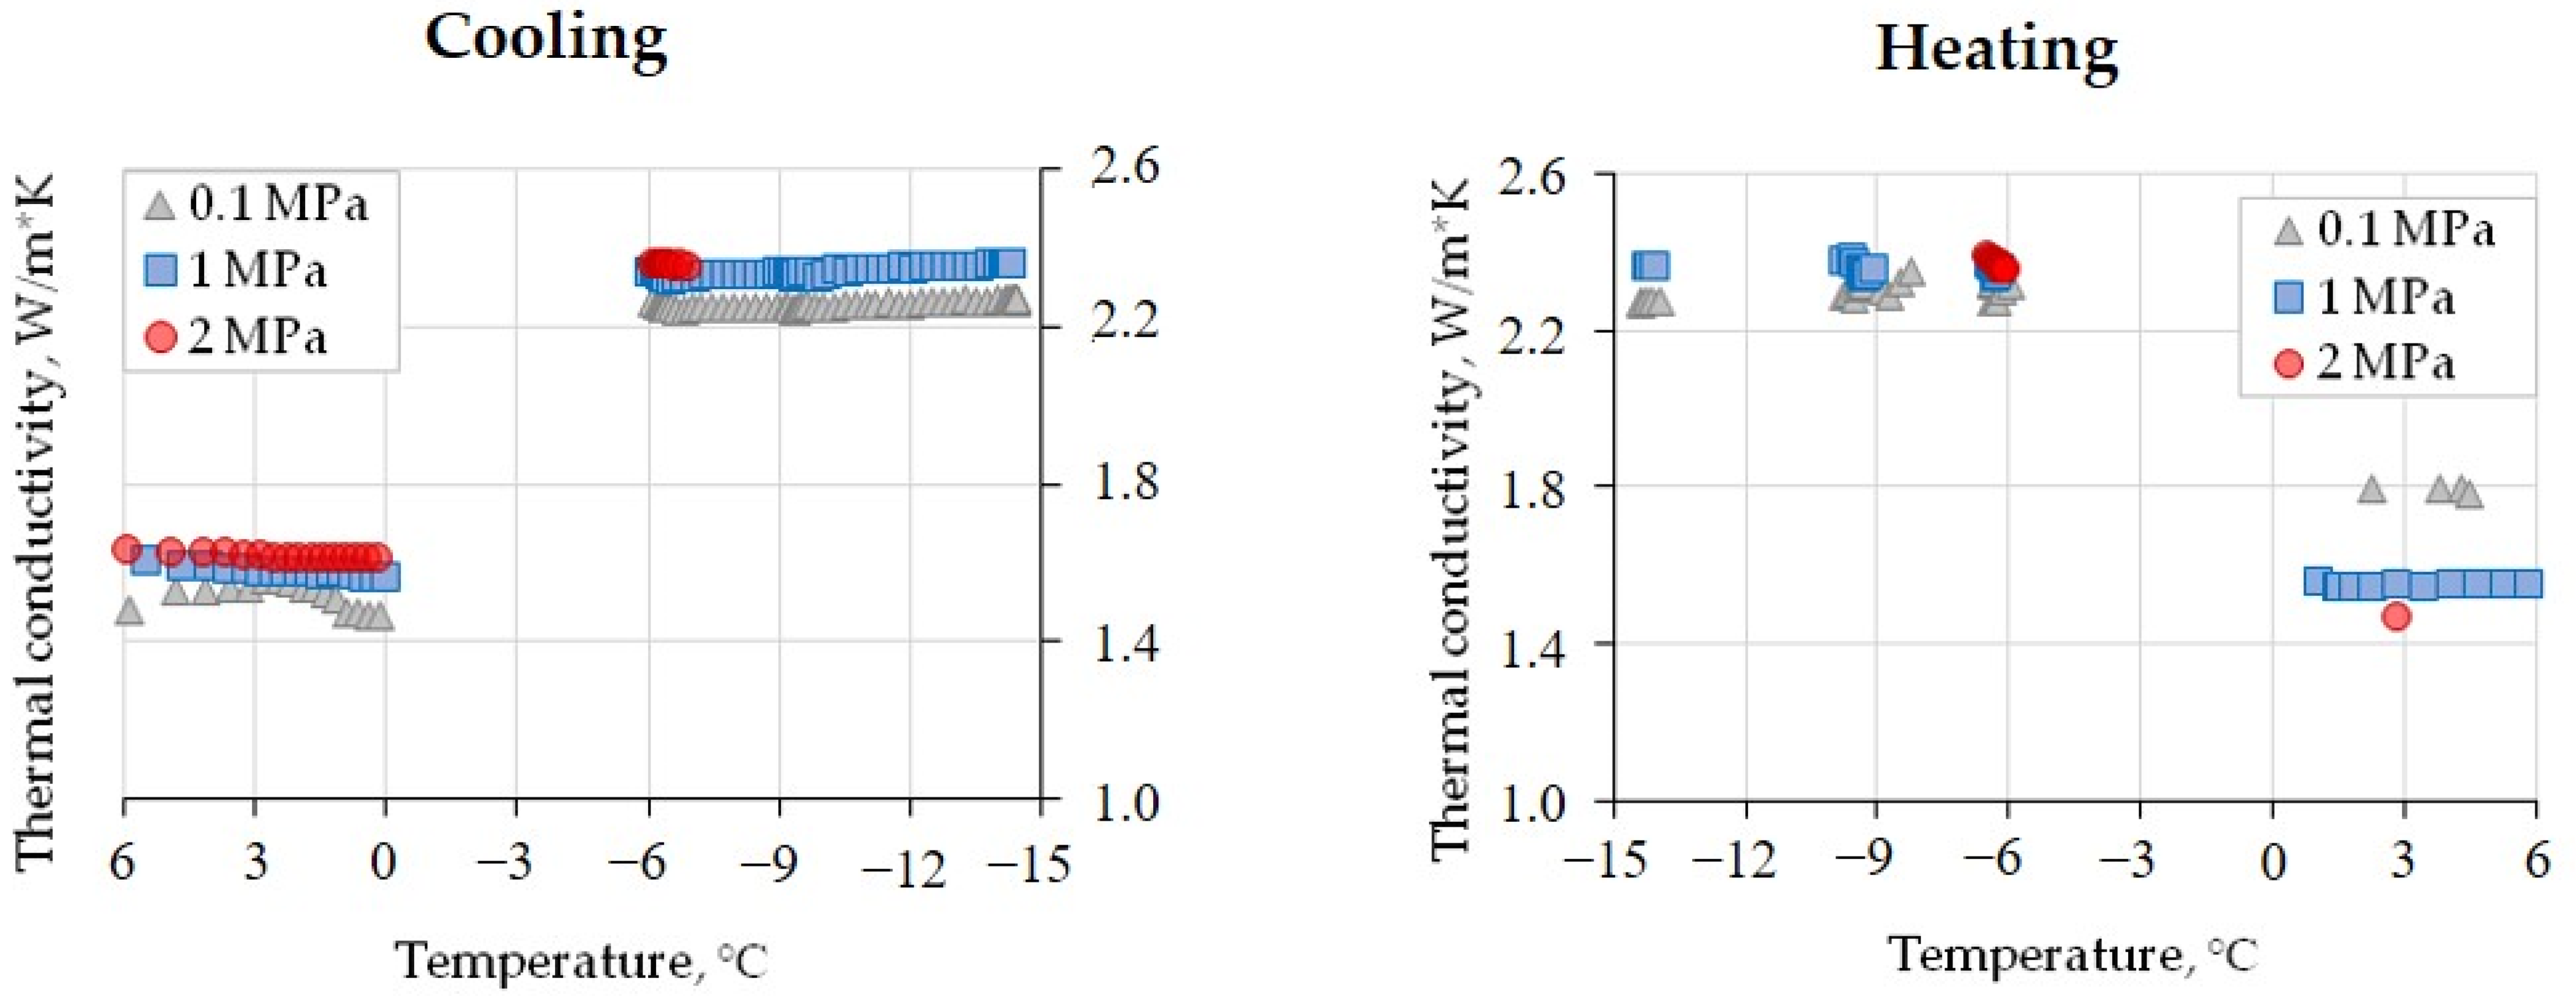
The laboratory experiments have provided evidence for the thermal conductivity behavior in a methane-saturated soil sample exposed to cyclic heating and cooling at different gas pressure values (0.1, 1, and 2 MPa). The results show that in the sample with W = 21% and Sw = 89% (Figure 5), the cooling cycle from +6 °C to 0 °C led to a thermal conductivity decrease of only few percent (from 2 to 4%) at the observed gas pressure interval and comparable to the precision of thermal conductivity measurements.
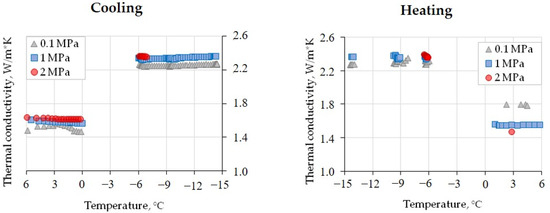
Figure 5.
Thermal conductivity variations in a methane-saturated loam sample (W = 21%, Sw = 89%) as a function of the temperature at various gas pressures.
In the temperature range from 0 °C to −6 °C, it was impossible to reliably record the thermal conductivity of freezing soil because of the effects of the pore moisture transition on the ice upon cooling. Nevertheless, a systematic pressure-dependent 40–45% increase was observed: the thermal conductivity changed from 1.58 to 2.25 W/(m·K) at 0.1 MPa, from 1.61 to 2.31 W/(m·K) at 1 MPa, and from 1.62 to 2.37 W/(m·K) at 2 MPa. The increase was only 0.10–0.12 W/(m·K) when the pressure reached 2 MPa in the frozen sample at −6 °C (Figure 5; Table 4); it was, likewise, minor (within 2%) upon further cooling from −6 °C to −14.5 °C; and it was even zero upon warming from −14.5 to −6 °C and from ~2.3 W/(m·K) at 0.1 MPa to ~2.4 W/(m·K) at 1 and 2 MPa (Figure 5). Further heating to a positive temperature led to a decrease in thermal conductivity as the pore ice transformed into liquid water.

Table 4.
The sensitivity of the thermal conductivity (W/(m·K)) to the pressure of the pore gas (CH4) in frozen silt loam (W = 21%, Sw = 89%) exposed to cyclic heating and cooling between −6 °C and −14.5 °C.
Measurements of the methane-saturated sample at positive temperatures before and after cooling–warming cycles at 0.1 MPa revealed a 0.2–0.3 W/(m·K) increase, possibly due to a slight compaction of the sample. At 1 MPa, the thermal conductivity remained almost invariable within the accuracy of measurements but became 0.1 W/(m·K) lower at 2 MPa after the cooling–warming cycles (Figure 5).
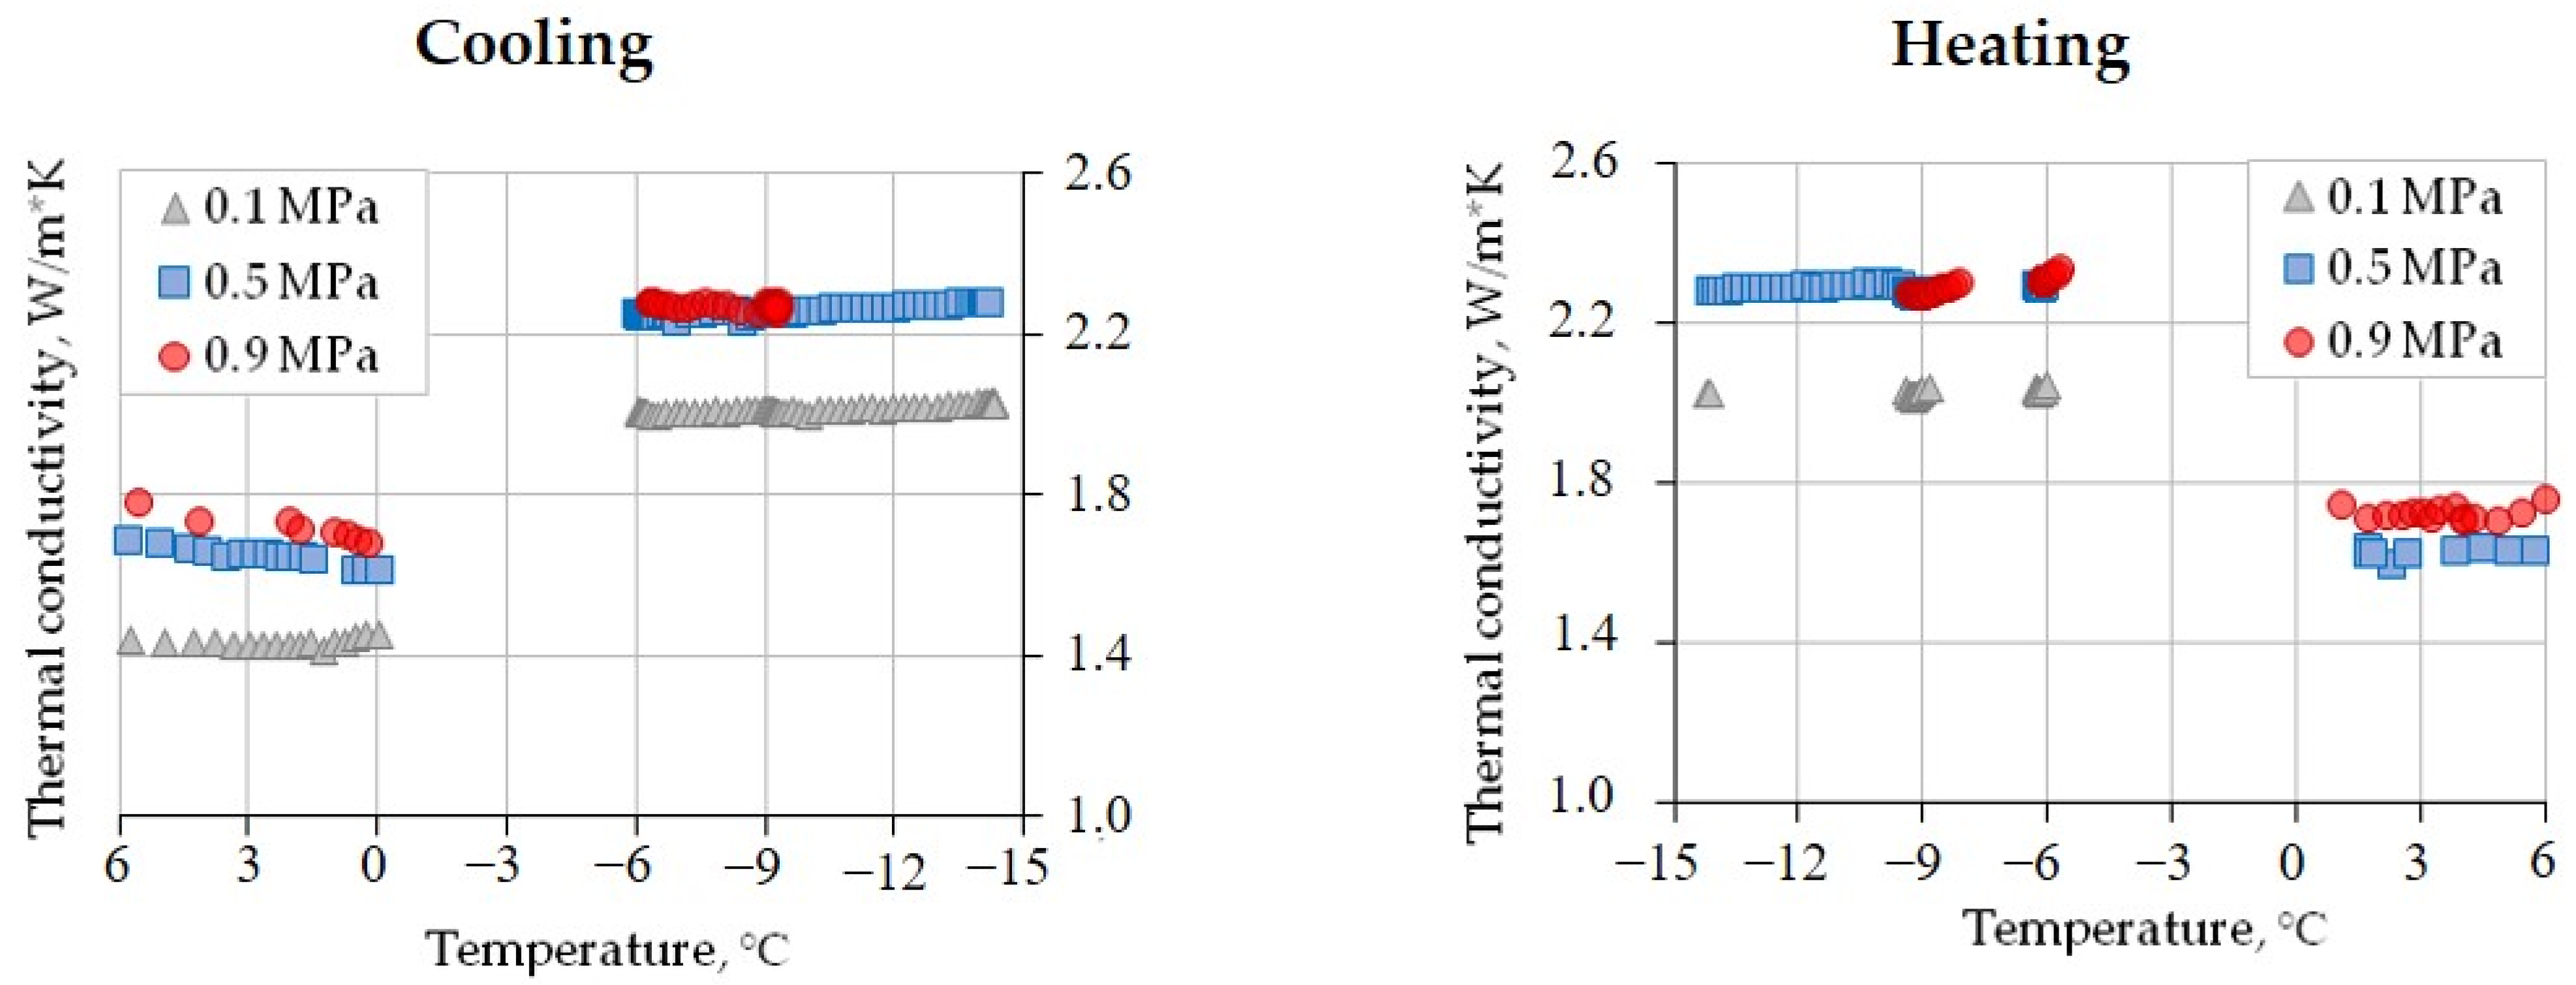
In the case of CO2 saturation, the initial thermal conductivity of the sample before freezing–thawing cycles (at +6 °C) varied with the gas pressure. It changed from 1.44 W/(m·K) at 0.1 MPa to 1.69 W/(m·K) (17% increase) at 0.5 MPa and to 1.80 W/(m·K) (another 7%) at 0.9 MPa. The variations upon cooling from +6 °C to 0 °C ranged from ~1.44 W/(m·K) at 0.1 MPa to only 5% lower on average at 0.5 and 0.9 MPa. Freezing to −6 °C led to an average thermal conductivity increase of 40%, irrespective of the pressure (Figure 6).
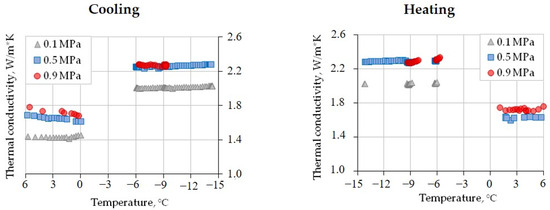
Figure 6.
The temperature-dependent thermal conductivity of gas-saturated silt loam (W = 21%, Sw = 89%) at different CO2 pressures.
Cooling and heating between −6 °C and −14.5 °C had only a minor influence on the thermal conductivity: it changed within 2% (Table 5). Subsequent thawing led to a thermal conductivity decrease (Figure 6) from ≈2.3 W/(m·K) (at 0.5 and 0.9 MPa) to 1.73 W/(m·K) for 0.9 MPa and to 1.63 W/(m·K) (at 0.5 MPa).

Table 5.
The sensitivity of the thermal conductivity (W/(m·K)) to the pressure of pore gas (CO2) in frozen silt loam (W = 21%, Sw = 89%) exposed to heating and cooling between −6 °C and −14.5 °C.
In general, the increase in CO2 pressure from 0.1 to 0.5 MPa led to a ~0.3 W/(m·K) increase in thermal conductivity (Figure 6), but its value did not change at 0.9 MPa. The ~0.3 W/(m·K) difference between the values at 0.1 MPa and at higher pressures (0.5 and 0.9 MPa) persisted after freezing.
4. Discussion
The experiments confirm that gas pressure affects the thermal conductivity of freezing finely dispersed soil even at sufficiently high moisture contents. The effect is markedly stronger in the case of saturation with carbon dioxide, which is more soluble in pore water than methane, and the solubility increases markedly with pressure [31]. The higher water solubility of CO2 due to active interaction with water molecules makes the freezing temperature of pore moisture lower than the values for gas-free water and water saturated with methane. The freezing temperature of CH4-saturated soil changes with the pressure, from ~−0.2 °C at 0.1 MPa to −0.3 °C at 2 MPa, but the respective change in the CO2-saturated sample is greater: to −1.0 °C at 0.5 MPa and to −1.2 °C at 0.9 MPa. It was initially expected that in finely dispersed soil saturated with CO2, the thermal conductivity after freezing would increase less than in methane-saturated soil, as was previously noted by the authors for sandy soil. However, experimental data have shown that the thermal conductivity values of the frozen sample under the gas pressure of CO2 and methane are generally close. A lower value of thermal conductivity in a CO2-saturated frozen sample compared to a methane-saturated sample is observed only at a pressure of 0.1 MPa. It should be noted that in these conditions, a lower value of thermal conductivity in the sample was also observed before freezing.
Generally, the thermal conductivity increase in gas-saturated sediments may be due to the pressure of gas on the soil skeleton, whereby more thermal contacts appear between particles. The type of gas can also have a certain influence; according to A.P. Babichev et al., 1991 [36], the thermal conductivity of CH4 at 0.1 MPa and room temperature is almost twice as high as that of CO2 and is 0.0342 and 0.016 W/(m⋅K), respectively. With an increase in pressure to 4 MPa, the thermal conductivity of gases increases slightly [37]. In addition, freezing and thawing conditions, which largely determine the processes of mass transfer and structure formation in soil environments, can have a significant impact on the change in thermal conductivity of gas-saturated sediments, but this requires special consideration. The interaction among soil components in the presence of CO2 may additionally increase as some crusts on grain surfaces dissolve upon carbonic acid formation or as carbonates precipitate when pore water freezes up at negative temperatures [38,39]. In our case, when carbon dioxide dissolves in pore water, and carbonic acid (H2CO3) forms, the latter actively interacts with calcite. Its content in the soil used in the experiment reaches 1%. As a result, calcium carbonate (calcite) and, possibly, siderite transform into more soluble bicarbonates. With further freezing of such a soil sample saturated with CO2 and containing bicarbonates, carbonate precipitates improve the thermal contacts between soil particles, which, along with the formation of ice, leads to an increase in the thermal conductivity of the soil in the frozen state. An increase in CO2 pressure promotes a more active conversion of calcium particles into a soluble form, bicarbonate, which, in turn, when frozen, falls out of solution and cements soil particles. These factors can account for the greater effect of gas pressure on thermal conductivity in samples with pore CO2 than in those with CH4.
5. Conclusions
The reported experiments simulated the effect of gas pressure on the thermal conductivity of sediments saturated with methane or carbon dioxide at pressures below the hydrate formation limit and at temperatures varying cyclically between positive and negative values. The thermal conductivity increased systematically with the gas pressure due to enhanced thermal interaction between soil particles and a higher density of gas medium.
As the gas pressure in the methane-saturated sample changed from 0.1 MPa to 2 MPa, its thermal conductivity became about 0.1 W/(m·K) higher in the temperature range from −6 °C to −14.5 °C. The increase caused by methane pressure was about 6% for the unfrozen sample and under 4% when it was frozen.
In the case of CO2 saturation, the pressure increase from 0.1 to 0.9 MPa (until the hydrate formation value) led to a greater thermal conductivity change: 0.3 W/(m·K) or 25% and 15% for the unfrozen and frozen samples, respectively.
The experiments have implications for the thermal behavior of gas-saturated taliks at increasing pore pressures within the interval below the formation of gas hydrate. The thermal conductivity of frozen gas-saturated soils of the talik zone can be expected to increase significantly with the appearance of CO2 in the gas component, which can ultimately affect the rate of freezing of the gas-saturated talik under conditions of increasing pressure in a closed system. However, it must be borne in mind that an increase in the CO2 content of gas-saturated sediments significantly reduces the pressure range in which freezing and frozen rocks can exist without a hydrate phase.
Author Contributions
Conceptualization, experimental methodology, supervision, E.C.; experimental work, D.D. and S.G.; processing and analysis, E.C. and D.D.; writing—original draft preparation, E.C., D.D. and B.B.; visualization, D.D.; writing—review and editing, E.C., D.D. and B.B. All authors have read and agreed to the published version of the manuscript.
Funding
The article was prepared within the framework of a research grant funded by the Ministry of Science and Higher Education of the Russian Federation (Grant ID: 075-15-2022-325).
Data Availability Statement
Data are contained within the article.
Conflicts of Interest
The authors declare no conflict of interest.
References
- Chuvilin, E.M.; Yakushev, V.S.; Perlova, E.V.; Kondakov, V.V. Gas component of permafrost rock masses at Bovanenkovo gas condensate field (Yamal Penensula). Dokl. Akad. Nauk 1999, 369, 522–524. [Google Scholar]
- Chuvilin, E.; Ekimova, V.; Davletshina, D.; Sokolova, N.; Bukhanov, B. Evidence of gas emissions from permafrost in the Russian Arctic. Geosciences 2020, 10, 383. [Google Scholar] [CrossRef]
- Yakushev, V.S. Natural Gas and Gas Hydrates in Permafrost; VNIIGAZ: Moscow, Russia, 2009; p. 192. ISBN 978-5-89754-048-8. (In Russian) [Google Scholar]
- Yakushev, V. Environmental and technological problems for natural gas production in permafrost regions. Energies 2023, 16, 4522. [Google Scholar] [CrossRef]
- Bondarev, V.L.; Mirotvorskiy, M.Y.; Zvereva, V.B.; Oblekov, G.I.; Shaydullin, R.M.; Gudzenko, V.T. Above-Cenomanian sediments in the Yamal Peninsula: Gas contents and chemical compositions (a case study of the Bovanenkovo oil-and-gas-condensate field). Geol. Geofiz. Razrab. Neftyanykh Gazov. Mestorozhdenii 2008, 5, 22–34. (In Russian) [Google Scholar]
- Makhonina, N.A.; Perlova, E.V.; Yakushev, V.S.; Akhmedsafin, S.K. Permafrost gas accumulations in the Zapolyarnoye oil-gas-condensate field. Nauka Tekhnika Gazov. Promyshlennosti 2004, 1–2, 43–46. (In Russian) [Google Scholar]
- Shmelev, D.G.; Rogov, V.V.; Gubin, S.V.; Davydov, S.P. Cryolithogenic deposits on the right bank of the lower reaches of the Kolyma River. Vestn. Mosk. Univ. Ser. 5 Geogr. 2013, 3, 66–72. (In Russian) [Google Scholar]
- Streletskaya, I.D.; Vasiliev, A.A.; Oblogov, G.E.; Semenov, P.B.; Vanshtein, B.G.; Rivkina, E.M. Methane in ground ice and frozen sediments in the coastal zone and on the shelf of Kara Sea. J. Ice Snow 2018, 58, 65–77. [Google Scholar] [CrossRef]
- Kraev, G.; Belonosov, A.; Veremeeva, A.; Grabovskii, V.; Sheshukov, S.; Shelokhov, I.; Smirnov, A. Fluid migration through permafrost and the pool of greenhouse gases in frozen soils of an oil and gas field. Remote Sens. 2022, 14, 3662. [Google Scholar] [CrossRef]
- Perlshtein, G.Z.; Sergeev, D.O.; Tipenko, G.S.; Tumskoy, V.E.; Khimenkov, A.N.; Vlasov, A.N.; Merzlakov, V.P.; Stanilovskaya, J.V. Hydrocarbon gases and the cryolithozone of the Arctic Shelf. Arkt. Ekol. I Ekon. 2015, 2, 35–44. (In Russian) [Google Scholar]
- Khimenkov, A.N.; Vlasov, A.N.; Brushkov, A.V.; Koshurnikov, A.V.; Volkov-Bogorodsky, D.B.; Sergeev, D.O.; Gagarin, V.E.; Sobolev, P.A. Geosystems of Gas-Saturated Permafrost; Geoinfo: Moscow, Russia, 2021; p. 288. ISBN 978-5-9908493-3-4. (In Russian) [Google Scholar]
- Shakhova, N.; Semiletov, I.; Salyuk, A.; Yusupov, V.; Kosmach, D.; Gustafsson, Ö. Extensive methane venting to the atmosphere from sediments of the East Siberian Arctic Shelf. Science 2010, 327, 1246–1250. [Google Scholar] [CrossRef]
- Are, F.E. The problem of hypogene gas emission into atmosphere. Kriosf. Zemli 1998, 2, 42–50. (In Russian) [Google Scholar]
- Collet, T.S.; Dallimore, S.R. Permafrost-associated gas hydrate. In Natural Gas Hydrates in Oceanic and Permafrost Environments; Max, M.D., Ed.; Kluwer Academic Publishers: Dordrecht, The Netherlands; London, UK, 2000; p. 414. ISBN 978-94-011-4387-5. [Google Scholar]
- Yakushev, V.S. Natural gas liberations around production wells at Russian Arctic gas fields. Geosciences 2020, 10, 184. [Google Scholar] [CrossRef]
- Kraev, G.; Rivkina, E.; Vishnivetskaya, T.; Belonosov, A.; van Huissteden, J.; Kholodov, A.; Smirnov, A.; Kudryavtsev, A.; Tshebaeva, K.; Zamolodchikov, D. Methane in gas shows from boreholes in epigenetic permafrost of Siberian Arctic. Geosciences 2019, 9, 67. [Google Scholar] [CrossRef]
- Bogoyavlensky, V.; Kishankov, A.; Kazanin, A.; Kazanin, G. Distribution of permafrost and gas hydrates in relation to intensive gas emission in the central part of the Laptev Sea (Russian Arctic). Mar. Pet. Geol. 2022, 138, 105527. [Google Scholar] [CrossRef]
- Rivkina, E.M.; Samarkin, V.A.; Gilichinsky, D.A. Methane in permafrost rocks of the Kolyma-Indigirka lowland. Dokl. RAS 1992, 323, 559–562. (In Russian) [Google Scholar]
- Vasiliev, A.A.; Melnikov, V.P.; Zadorozhnaya, N.A.; Oblogov, G.E.; Streletskaya, I.D.; Savvichev, A.S. Doklady Akademii Nauk. 2022, Volume 505, pp. 113–118. Available online: https://www.mathnet.ru/php/journal.phtml?jrnid=dan&option_lang=eng (accessed on 15 October 2023). (In Russian).
- Cherbunina, M.Y.; Shmelev, D.G.; Krivenok, L.A. The effect of degassing method of frozen soils on the test results of methane concentration. Eng. Geol. 2018, 13, 62–73. (In Russian) [Google Scholar] [CrossRef]
- Zadorozhnaya, N.A.; Oblogov, G.E.; Vasiliev, A.A.; Streletskaya, I.D.; Malkova, G.V.; Semenov, P.B.; Vanshtein, B.G. Methane in frozen and thawing sediments of Western Russian Arctic. Earth’s Cryosphere 2022, 26, 41–55. (In Russian) [Google Scholar] [CrossRef]
- Kizyakov, A.; Khomutov, A.; Zimin, M.; Khairullin, R.; Babkina, E.; Dvornikov, Y.; Leibman, M. Microrelief associated with gas emission craters: Remote-sensing and field-based study. Remote Sens. 2018, 10, 677. [Google Scholar] [CrossRef]
- Dvornikov, Y.A.; Leibman, M.O.; Khomutov, A.V.; Kizyakov, A.I.; Semenov, P.; Bussmann, I.; Babkin, E.M.; Heim, B.; Portnov, A.; Babkina, E.A. Gas-emission craters of the Yamal and Gydan peninsulas: A proposed mechanism for lake genesis and development of permafrost landscapes. Permafr. Periglac. Process. 2019, 30, 146–162. [Google Scholar] [CrossRef]
- Chuvilin, E.; Stanilovskaya, J.; Titovsky, A.; Sinitsky, A.; Sokolova, N.; Bukhanov, B.; Spasennykh, M.; Cheremisin, A.; Grebenkin, S.; Davletshina, D. A Gas-emission crater in the Erkuta river valley, Yamal Peninsula: Characteristics and potential formation model. Geosciences 2020, 10, 170. [Google Scholar] [CrossRef]
- Bogoyavlensky, V.; Bogoyavlensky, I.; Nikonov, R.; Yakushev, V.; Sevastyanov, V. Permanent gas emission from the Seyakha crater of gas blowout, Yamal Peninsula, Russian Arctic. Energies 2021, 14, 5345. [Google Scholar] [CrossRef]
- Bogoyavlensky, V. New data on mud volcanism in the Arctic on the Yamal Peninsula. Dokl. Earth Sci. 2023, 512, 847–853. [Google Scholar] [CrossRef]
- Zolkos, S.; Fiske, G.; Windholz, T.; Duran, G.; Yang, Z.; Olenchenko, V.; Faguet, A.; Natali, S.M. Detecting and Mapping Gas Emission Craters on the Yamal and Gydan Peninsulas, Western Siberia. Geosciences 2021, 11, 21. [Google Scholar] [CrossRef]
- Chuvilin, E.; Tipenko, G.; Bukhanov, B.; Istomin, V.; Pissarenko, D. Simulating thermal interaction of gas production wells with relict gas hydrate-bearing permafrost. Geosciences 2022, 12, 115. [Google Scholar] [CrossRef]
- Medvedsky, R.I. Construction and Operation of Oil and Gas Wells in Permafrost; Nedra: Moscow, Russia, 1987; 230p. (In Russian) [Google Scholar]
- STO Gazprom 2-3.2-036-2005; Methodological Guidelines for Taking into Account Geocryological Conditions for Selecting Production Well Designs. IRC Gazprom: Moscow, Russia, 2005; 62p. (In Russian)
- Chuvilin, E.M.; Davletshina, D.A.; Bukhanov, B.A.; Grebenkin, S.I.; Istomin, V.A.; Sergeeva, D.V.; Badetz, C.; Stanilovskaya, J.V. Experimental study of the influence of gas composition and gas pressure on the freezing temperature of pore water in gas saturated sediments. Earth’s Cryosphere 2019, 23, 49–57. [Google Scholar] [CrossRef]
- Chuvilin, E.M.; Davletshina, D.A.; Bukhanov, B.A.; Grebenkin, S.I.; Ogienko, M.V.; Badetz, C.; Stanilovskaya, J.V. Influence of gas composition and pressure on thermophysical properties of gas-saturated frozen and thawed sands. Earth’s Cryosphere 2020, 24, 49–54. [Google Scholar] [CrossRef]
- Chuvilin, E.; Bukhanov, B. Thermal conductivity of frozen sediments containing self-preserved pore gas hydrates at atmospheric pressure: An experimental study. Geosciences 2019, 9, 65. [Google Scholar] [CrossRef]
- Jahn, R.; Blume, H.P.; Asio, V.B.; Spaargaren, O.; Schad, P. Guidelines for Soil Description, 4th ed.; FAO: Rome, Italy, 2006; p. 97. ISBN 92-5-105521-1. [Google Scholar]
- Chuvilin, E.M.; Bukhanov, B.A.; Mukhametdinova, A.Z.; Grechishcheva, E.S.; Alekseev, A.G.; Istomin, V.A. Freezing point and unfrozen water contents of permafrost soils: Estimation by the water potential method. Cold Reg. Sci. Technol. 2022, 196, 103488. [Google Scholar] [CrossRef]
- Babichev, A.P.; Babushkin, N.A.; Bratkovskii, A.M. Physical Values. Reference Book; Energoatomizdat: Moscow, Russia, 1991; 1232p. (In Russian) [Google Scholar]
- Vargaftik, N.B. Reference Book on Thermophysical Properties of Gases and Liquids; Nauka: Moscow, Russia, 1972; 720p. (In Russian) [Google Scholar]
- Yershov, E.D. Cryolithogenesis; Nauka: Moscow, Russia, 1982; 211p. (In Russian) [Google Scholar]
- Yershov, E.D. General Geocryology; Cambridge University Press: Cambridge, UK, 1998; p. 580. [Google Scholar]
Disclaimer/Publisher’s Note: The statements, opinions and data contained in all publications are solely those of the individual author(s) and contributor(s) and not of MDPI and/or the editor(s). MDPI and/or the editor(s) disclaim responsibility for any injury to people or property resulting from any ideas, methods, instructions or products referred to in the content. |
© 2023 by the authors. Licensee MDPI, Basel, Switzerland. This article is an open access article distributed under the terms and conditions of the Creative Commons Attribution (CC BY) license (https://creativecommons.org/licenses/by/4.0/).

