

Application of Tempe Cell to Measure Soil Water Characteristic Curve along with Geotechnical Properties of Oil Sands Tailings


Abstract
:
1. Introduction
2. Materials and Methods
2.1. Characteristic Properties
2.2. Index Properties
2.2.1. Atterberg Limits
2.2.2. Mineralogy
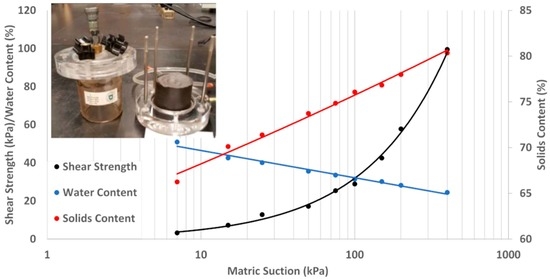
2.3. Tempe Cell
3. Results and Discussions
3.1. Water Content and SWCC
3.2. Solids Content
3.3. Shear Strength
3.4. Volume Change
4. Summary and Conclusions
Author Contributions
Funding
Data Availability Statement
Acknowledgments
Conflicts of Interest
References
- Fredlund, D.G.; Houston, S.L. Interpretation of soil-water characteristic curves when volume change occurs as soil suction is changed. In Advances in Unsaturated Soils; Taylor & Francis Group: London, UK, 2013. [Google Scholar]
- Alberta Government. Alberta Energy Regulator; ST98 Report; Alberta Government: Edmonton, AB, Canada, 2018. [Google Scholar]
- Jeeravipoolvarn, S. Geotechnical Behavior of In-Line Thickened Tailings. Ph.D. Dissertation, University of Alberta, Edmonton, AB, Canada, 2010. [Google Scholar]
- Kabwe, L.K.; Wilson, G.W.; Scott, J.D. Fluid Fine Tailings Dewatering Processes for Oil Sands Reclamation. In Proceedings of the Mine Closure Conference, Leipzig, Germany, 3–7 September 2018. [Google Scholar]
- Scott, J.D.; Kabwe, L.K.; Wilson, G.W.; Sorta, A.; Jeeravipoolvarn, S. Properties which affect the consolidation behavior of Mature Fine Tailings. In Proceedings of the Tailings and Mine Waste Conference, Banff, AB, Canada, 3–6 November 2013. [Google Scholar]
- Houston, W.N.; Dye, H.B.; Zapata, N.A.; Perera, Y.Y.; Harraz, A. Determination of SWCC using one point suction measurement and standard curves. In Proceedings of the Fourth International Conference on Unsaturated Soils, Carefree, AZ, USA, 2–6 April 2006. [Google Scholar]
- Leong, E.C.; Rahardjo, H.; Fredlund, D.G. Application of unsaturated soil mechanics in geotechnical engineering. In Proceedings of the Eighth East Asia-Pacific Conference on Structural Engineering & Construction (EASEC-8), Singapore, 5–7 December 2001. [Google Scholar]
- Zapata, C.E. Uncertainty in Soil-Water Characteristic Curve and Impact on Unsaturated Shear Strength Predictions. Ph.D. Dissertation, Arizona State University, Tempe, AZ, USA, 1999. [Google Scholar]
- Zapata, C.E.; Houston, W.N.; Houston, S.L.; Walsh, K.D. Soil-water characteristic curve variability. In Proceedings of the Sessions of Geo-Denver 2000—Advances in Unsaturated Geotechnics, Denver, CO, USA, 5–8 August 2000. [Google Scholar]
- Fredlund, D.G.; Rahardjo, H.; Fredlund, M.D. Unsaturated Soil Mechanics in Engineering Practice; John Wiley& Sons Inc.: Hoboken, NJ, USA, 2012. [Google Scholar]
- Kabwe, L.K.; Wilson, G.W.; Beier, N.A.; Scott, J.D. Effects of atmospheric drying and consolidation of flocculated thickened tailings and centrifuged cake on near-surface shear strength. In Proceedings of the Second Pan-American Conference on Unsaturated Soils, Dallas, TX, USA, 12–15 November 2017. [Google Scholar]
- Kabwe, L.K.; Barsi, D.; Wilson, G.W.; Beier, N.A.; Umme, S.R. Application of the new HYPROP device to measure the soil water characteristic curve and other soil drying properties. In Proceedings of the 75th Canadian Geotechnical Conference, Calgary, AB, Canada, 2–5 October 2022. [Google Scholar]
- Fredlund, D.G.; Stone, J.; Stianson, J. Determination of water storage and permeability functions for oil sands tailings. In Proceedings of the Tailings and Mine Waste Conference, Vancouver, BC, Canada, 6–9 November 2011. [Google Scholar]
- Schafer, H.L.; Beier, N.A. Estimating soil-water characteristic curve from soil-freezing characteristic curve for mine waste tailings using time domain reflectometry. Can. Geotech. J. 2019, 57, 73–84. [Google Scholar] [CrossRef]
- Agus, S.S.; Leong, E.C.; Rahardjo, H. Soil water characteristic curves of Singapore residual soils. Geotech. Geol. Eng. 2001, 9, 285–309. [Google Scholar] [CrossRef]
- Xiaoli, F.; Shao, M.; Dianquing, L.; Wang, H. Soil water characteristic curve measurement without bulk density changes and its implications in the estimation of soil hydraulic properties. Geoderma 2011, 167–168, 1–8. [Google Scholar]
- Leong, E.C.; Wijaya, M. Universal soil shrinkage curve equation. Geoderma 2015, 237–238, 78–87. [Google Scholar] [CrossRef]
- Rahardjo, H.; Sayanaga, A.; Mohamed, H.; Chui Yee Ip, S.; Shah, R.S. Comparison of Soil Water Characteristic Curves from Conventional Testing and Combination of Small-Scale Centrifuge and Dew Point Methods. Geotech. Geol. Eng. 2019, 37, 659–672. [Google Scholar] [CrossRef]
- Shokrana, M.S.B.; Ghane, E. Measurement of soil water characteristic curve using HYPROP2. MethodsX 2020, 7, 100840. [Google Scholar] [CrossRef] [PubMed]
- Ozturk, H.S.; Durner, W.; Haghverdi, A.; Walter, B. Comparison of soil moisture retention characteristic obtained by the extended evaporation method and the pressure plate/sand box apparatus. In Proceedings of the EGU General Assembly Conference Abstracts, Vienna, Austria, 7–12 April 2013; p. 3911. [Google Scholar]
- D2216-19; Standard Test Method for Laboratory Determination of Water (Moisture) Content of Soil and Rock. ASTM International: West Conshohocken, PA, USA, 2019. [CrossRef]
- Sorta, A.; Beier, N.A.; Kabwe, L.K.; Scott, J.D.; Wilson, G.W. The case for using fines void ratio. In Proceedings of the 68th Canadian Geotechnical Conference, Quebec, QC, Canada, 20–23 September 2015. [Google Scholar]
- Wilson, G.W.; Kabwe, L.K.; Beier, N.A.; Scott, J.D. Effect of various treatments on consolidation of oil sands fluid fine tailings. Can. Geotech. J. 2018, 55, 1059–1066. [Google Scholar] [CrossRef]
- D4221-99; Standard Test Method for Dispersive Characteristics of Clay Soil by Double Hydrometer. ASTM International: West Conshohocken, PA, USA, 2005. [CrossRef]
- D422-63; Standard Test Method for Particle-Size Analysis of Soils. ASTM International: West Conshohocken, PA, USA, 2007. [CrossRef]
- C837-09; Standard Test Method for Methylene Blue Index in Clays. ASTM International: West Conshohocken, PA, USA, 2019. [CrossRef]
- Kaminsky, H.A.W. Demystifying the Methylene Blue Index. In Proceedings of the 4th International Oil Sands Tailings Conference, Lake Louise, AB, Canada, 7–10 December 2014. [Google Scholar]
- Omotoso, O.; Melanson, A. Influence of clay minerals on the storage and treatment of oil sands tailings. In Proceedings of the 17th International Seminar on Paste and Thickened Tailings, Vancouver, BC, Canada, 8–12 June 2014. [Google Scholar]
- D4318-17; Standard Test Method for Liquid Limit, Plastic Limit, and Plasticity Index of Soils. ASTM International: West Conshohocken, PA, USA, 2007. [CrossRef]
- D6836-16; Standard Test Methods for Determination of the Soil Water Characteristic Curve. ASTM International: West Conshohocken, PA, USA, 2016. [CrossRef]
- Fredlund, D.G.; Morgenstern, N.R. Stress state variables for unsaturated soils. ASCE J. Geotech. Eng. 1977, 103, 447–466. [Google Scholar] [CrossRef]
- Fredlund, D.G.; Xing, A. Equations for the Soil-Water Characteristic Curve. Can. Geotech. J. 1994, 31, 521–532. [Google Scholar] [CrossRef]
- Fredlund, M.D.; Wilson, W.G.; Fredlund, D.G. Representation and estimation of the shrinkage curve. In Proceedings of the Third International Conference on Unsaturated Soils, UNSAT 2002, Recife, Brazil.
- Kabwe, L.K.; Wilson, G.W.; Beier, N.A.; Barsi, D. Effect of sand and flyash on unsaturated soil properties and drying rate of oil sands tailings. In Proceedings of the Tailings and Mine Waste Conference, Banff, AB, Canada, 7–10 November 2021. [Google Scholar]
- Abdulnabi, A.; Amoako, K.; Moran, D.; Vanadara, K.; Aldaeef, A.A.; Esmaelizadeah, A.; Beier, N.A.; Soares, J.; Simms, P.H. Evaluation of candidate polymers to maximize the geotechnical performance of oil sands tailings. Can. Geotech. J. 2021, 59, 359–371. [Google Scholar] [CrossRef]
- Amoako, K.A.; Abdulnabi, A.; Beier, N.A.; Soares, J.; Simms, P.H. Long-term consolidation of two new polymer treatments of oil sands fluid fine tailings. In Proceedings of the 73rd Canadian Geotechnical Conference, Virtual, 14–16 September 2020. [Google Scholar]


| Characteristics | FFT | FCT |
|---|---|---|
| Initial solids content (%) | 46 | 54 |
| Void ratio | 3.10 | 2.08 |
| Fines void ratio | 3.23 | 2.44 |
| Fines content (%) | 94 | 82 |
| Clay size content (D) (%) | 54 | 54 |
| Clay size content (ND) (%) | 35 | 30 |
| Clay size by MBI (%) | 44 | 35 |
| Bitumen content by fine mass (%) | 3.0 | 0.37 |
| Characteristics | FFT | FCT |
|---|---|---|
| Liquid limit (%) | 50 | 57 |
| Plastic limit (%) | 21 | 26 |
| Plasticity index | 29 | 32 |
| Specific gravity | 2.44 | 2.48 |
| Clay Minerals | |||
|---|---|---|---|
| Kaolinite | Illite | Total | |
| FFT | |||
| Bulk fraction | 36 | 22 | 58 |
| Clay fraction | 68 | 23 | 91 |
| Bulk + clay | 42 | 22 | 64 |
| FCT | |||
| Bulk fraction | 45 | 28 | 73 |
| Clay fraction | 81 | 16 | 97 |
| Bulk + clay | 56 | 24 | 80 |
Disclaimer/Publisher’s Note: The statements, opinions and data contained in all publications are solely those of the individual author(s) and contributor(s) and not of MDPI and/or the editor(s). MDPI and/or the editor(s) disclaim responsibility for any injury to people or property resulting from any ideas, methods, instructions or products referred to in the content. |
© 2023 by the authors. Licensee MDPI, Basel, Switzerland. This article is an open access article distributed under the terms and conditions of the Creative Commons Attribution (CC BY) license (https://creativecommons.org/licenses/by/4.0/).
Share and Cite
Kabwe, L.K.; Wilson, G.W.; Beier, N.A.; Barsi, D. Application of Tempe Cell to Measure Soil Water Characteristic Curve along with Geotechnical Properties of Oil Sands Tailings. Geosciences 2023, 13, 36. https://doi.org/10.3390/geosciences13020036
Kabwe LK, Wilson GW, Beier NA, Barsi D. Application of Tempe Cell to Measure Soil Water Characteristic Curve along with Geotechnical Properties of Oil Sands Tailings. Geosciences. 2023; 13(2):36. https://doi.org/10.3390/geosciences13020036
Chicago/Turabian StyleKabwe, Louis K., G. Ward Wilson, Nicholas A. Beier, and David Barsi. 2023. "Application of Tempe Cell to Measure Soil Water Characteristic Curve along with Geotechnical Properties of Oil Sands Tailings" Geosciences 13, no. 2: 36. https://doi.org/10.3390/geosciences13020036
APA StyleKabwe, L. K., Wilson, G. W., Beier, N. A., & Barsi, D. (2023). Application of Tempe Cell to Measure Soil Water Characteristic Curve along with Geotechnical Properties of Oil Sands Tailings. Geosciences, 13(2), 36. https://doi.org/10.3390/geosciences13020036