Article

Towards a Hybrid Design Approach of Anchored Drapery Systems

1
DIATI, Politecnico di Torino, Corso Duca degli Abruzzi 24, I-10129 Torino, Italy
2
MAST/GPEM, Université Gustave Eiffel, Bouguenais, F-44344 Paris, France
3
Department ICEA, Universitá degli Studi di Padova, Via Ognissanti 39, I-35129 Padova, Italy
*
Author to whom correspondence should be addressed.
These authors contributed equally to this work.
Geosciences 2023, 13(5), 147; https://doi.org/10.3390/geosciences13050147
Submission received: 3 February 2023 / Revised: 28 April 2023 / Accepted: 10 May 2023 / Published: 14 May 2023
(This article belongs to the Special Issue Rockfall Protection and Mitigation)

Abstract

:
Anchored drapery meshes represent a worldwide adopted protective solution against rockfall. The mechanical performance of a wire mesh is evaluated through laboratory procedures in which the boundary conditions strongly differ from the ones typical of field applications. This shows that the laboratory characterization is, in general, not representative of the field behavior. In this work, referring to a double-twisted wire mesh, a simple approach allowing the extension of the laboratory characteristic values to field conditions is proposed. The approach is based on the definition of analytical relations for evaluating the effects of both the mesh’s system geometry and the loading condition on the force–displacement response. These relations are derived from previously calibrated laboratory tests and are extended to different configurations on the basis of a large number of discrete element simulations. A master curve allowing the prediction of the entire force–displacement response of a general configuration of the drapery system is then defined. The results of this study can provide useful information for designing anchored drapery systems and can be easily associated with standard limit equilibrium calculations to move toward a hybrid design approach that couples forces with mesh deformations.

1. Introduction

Anchored (or reinforced) drapery meshes are among the most widely used structural mitigation measures for preventing and protecting against rockfalls or shallow instability in sub-vertical rock faces directly insisting on transportation infrastructure or structures [1,2]. These kinds of hazardous events involve the disaggregation of the surface part of a slope, which can lead to local slides and/or the detachment of unstable blocks [2]. Global warming and extreme events promote weathering of rock faces [3] and, consequently, the adoption of effective measures that are easy to install with reduced costs, as drapery meshes are, has become a common practice in recent decades.
These structures are mainly composed of steel wire mesh panels combined with regular anchoring patterns (pinned systems), with the possible addition of high-strength ropes (secured systems). The anchors prevent the detachment of single rock blocks or the global instability of shallow layers in a slope, while the net confines granular debris or unstable blocks into delimited mesh sections (Figure 1).
Despite anchored drapery systems being applied worldwide, their design is still mainly based on engineers’ work experience. The few design approaches proposed in the literature [4,5,6,7] are based on limit equilibrium computations and differ in terms of failure mechanisms (i.e., local or global), slope type (i.e., soil-like or rock-like), and the eventual pre-tension of the mesh. Blanco-Fernandez et al. [5] provided an overview of the existing design methods.
Attention has only recently been devoted to understanding the mechanical behaviors of reinforced drapery systems in field conditions. Large-scale experimental tests were conducted for applications on a rocky slope [8] and on a granular slope [9,10] in order to define a more effective design methodology. Moreover, a laboratory-scale experimental study was conducted to analyze the frictional interaction between the mesh and small rock blocks at the interface [11].
In the present paper, anchored drapery meshes applied to rockfall-prone slope faces were considered, with a particular focus on pinned systems. In this particular case, the performance of the mesh is defined in terms of both tensile capacity and puncturing force–displacement behavior. To date, standardized laboratory tests on single mesh panels only are used to calculate these values [12,13,14,15,16,17]. These tests are performed with mesh panels of given sizes and constraints, which are scarcely representative of the on-site configurations and, consequently, of the mesh behaviors in field conditions. The major difference is related to the boundary conditions; the local constraint imposed by the anchors in field applications strongly differs from the laboratory case in which shackles or connecting devices link the entire panel’s outer border to a rigid frame. This determines the overestimation of the mechanical resistance and of the out-of-plane stiffness of the mesh (confirmed by field tests [8] and numerical studies [18,19]). Due to technical and economical limitations related to the realization of large-scale field tests, the adoption of numerical models represents a potential way to test a mesh system in idealized field conditions. From a numerical perspective, both the finite element method (FEM) [20,21,22,23,24,25] and the discrete element method (DEM) [26,27,28,29,30] have been adopted to simulate mesh structures. Focusing on anchored drapery systems only, the DEM has been recently used to analyze its interaction with a single rigid body (i.e., rock block) [18,19,31,32,33,34] or with an unstable granular layer [18,35,36,37,38].
In previous works by the authors [18,19], a DEM approach was used to account for the effect of moving from standard laboratory conditions to idealized field conditions. The ideal case in which all of the mesh panels are subjected to the puncturing effect of detached blocks has been considered (this condition will be referred to as “periodic” loading conditions, in what follows). In this context, analytical relations allowing the estimation of the force and deflection at the failure of an anchored mesh panel have been proposed [34] and implemented in a simple online tool [39] to simulate the entire force–displacement response of an anchored mesh panel.
In a field application, it is more likely to encounter isolated blocks that can eventually detach from the slope face. The conceptual framework proposed in [34] is extended to the case of an anchored drapery mesh system that interacts with an isolated rock block. The 8 × 10 hexagonal double-twisted steel wire mesh with a nominal wire diameter of 2.7 mm (Maccaferri producer) is considered in the present study. The final objective is to define an analytical model that extends standard laboratory characterization [14,15,16,17] to field conditions, forecasting the entire force–displacement response of the mesh system. Equations are provided to estimate the characteristic values of force and deflection at the point of mesh failure.
The paper is structured as follows. Section 2 provides details on the adopted methodology, describing the DEM model (Section 2.1) and the referenced large-scale model (Section 2.3). The effect of the main problem variable on the mechanical response of the mesh is discussed in Section 3. The equations used to determine both the force and displacement at the rupture and the definition of a master curve and application are discussed in Section 4. Finally, the main results are summarized in Section 5.

2. Methodology

2.1. Discrete Element Modeling of the Wire Mesh

A particle-based strategy was adopted to simulate the wire mesh system, enabling efficient handling of the large deformations typical of the problem, allowing for “local” (i.e., wire rupture) and “global” (i.e., tearing off the mesh) failures, and contact with external bodies. When using a discrete element modeling approach for mesh-like structures, one may mainly adopt three different strategies: cell-based (CB) [30,40], node-wire-based (NWB) [19,27,28,38,41,42], and cylinder-wire-based (CWB) [29,36,37,43,44,45].
Here, an NWB approach was used for the numerical description of the mesh. This choice is based on a compromise between: (i) having a faithful representation of geometrical features of the double-twisted hexagonal wire mesh (not possible with a CB approach), and (ii) reducing the computational cost with respect to a more refined description of the mesh (CWB), without losing accuracy [31]. The wire mesh is modeled as a set of spherical particles placed at the physical nodes of the real mesh (the intersection between two wires), as shown in Figure 2a. These nodal particles concentrate the mass of the related wires and are used to handle contact with external bodies. Nodal particles are then connected by long-range interactions according to the geometrical patterns of the wires in the real mesh. These interactions virtually represent the wires and are ruled by a piece-wise linear force–displacement function in the tensile direction (referred to as the “wire” local tensile model, see Figure 2b), while compressive forces are not accounted for. The force–displacement behavior is computed from the stress–strain tensile relations. At each time step, starting with the relative distance L between the two connected particles (with respect to the initial one, L 0 ), the current elongation ( Δ L ) is computed and used to obtain the force acting between the particles (see Figure 2b). A threshold value on the maximum elongation of a wire is used to define the failure criterion for the interactions. Different stress–strain relations (see Figure 2c) are used to describe the tensile behaviors of the single and double-twisted wires (which are taken from [46]). The validation of the mesh for this application was presented in previous works [18,19,38].

2.2. Standardized Laboratory Tests

Despite the strong simplifications made in the standard laboratory punch test procedure [7,18,19,35], the test is global and is used in the design phases of the pinned and secured drapery systems. The laboratory test procedure is defined by international and European standards [14,15,16], which are based on the Italian Standard UNI 11437 [17] (referred to as UNI). This standard prescribes the use of a spherical dome with a diameter of 1 m and a curvature radius of 1.2 m as a punching element, while the curvature radius of the dome edges should be equal to 0.05 m. A rectangular mesh panel with a nominal side of 3 m (tolerance of 20 % ) has to be installed on an externally fixed rigid frame. The punching element is moved along the mesh’s out-of-plane direction at a constant displacement rate (≤0.01 m/s) until the complete failure of the mesh. During the test, the force acting on the punching element, as well as its displacement, are measured, providing a force–displacement relationship.
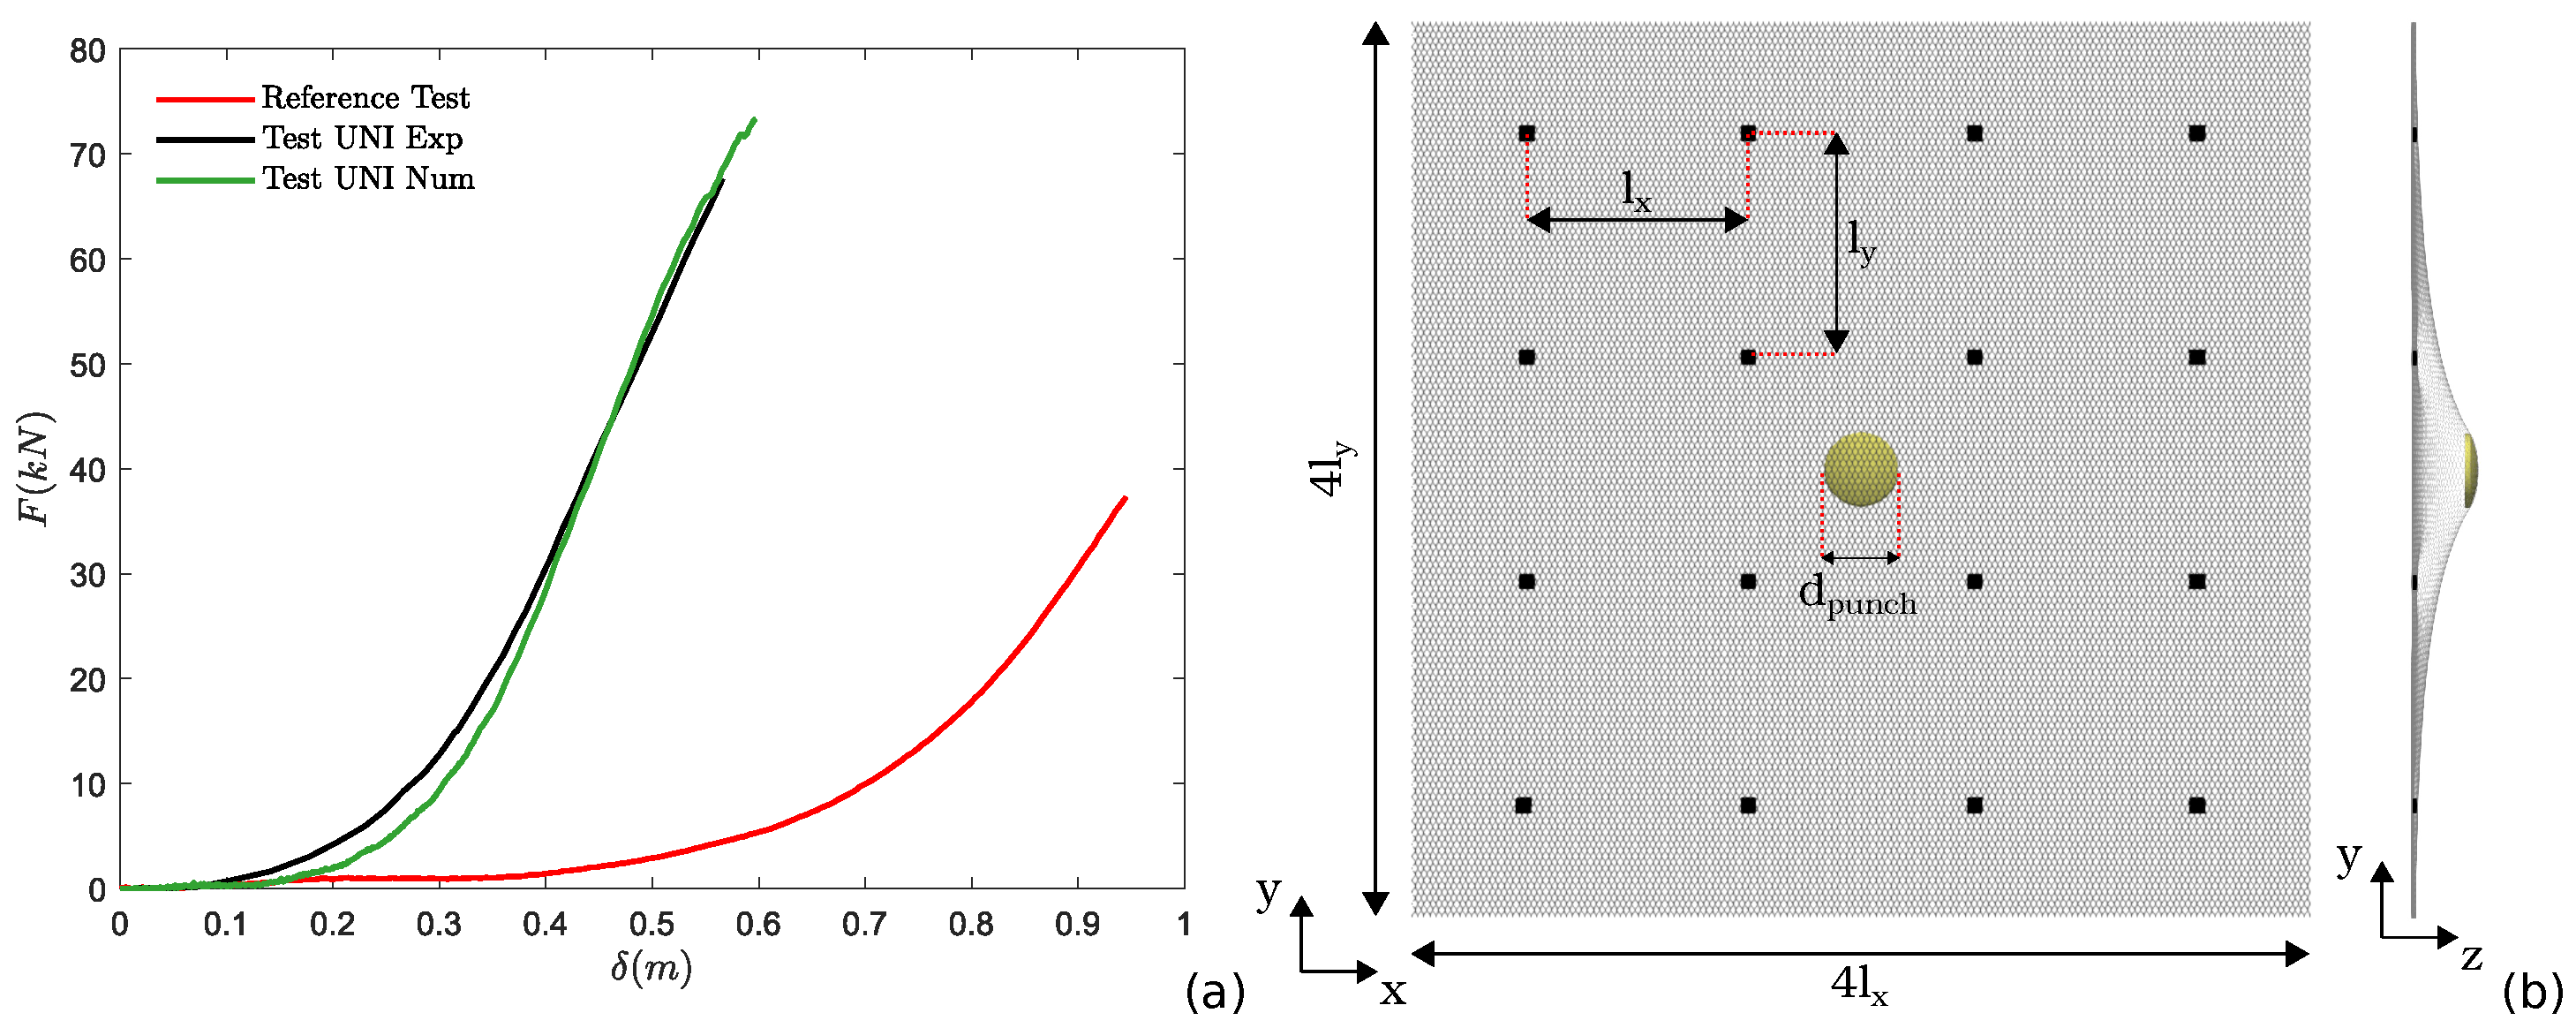
The comparison between the results of the experimental standard UNI punch test and the numerical one is displayed in Figure 3a. The numerical model accurately reproduces the experimental behavior from the small deformation to the failure of the mesh. The slight overestimation of the force at failure (∼7%) may be due to the fact that the intrinsic defects of a real mesh (geometry and material properties of the wires) are not accounted for in the numerical mesh description.

2.3. Large-Scale Model of a Pinned Mesh System

In order to move toward a more realistic description of the field conditions, a large-scale pinned drapery system is considered in this work. The model consists of a pinned mesh system with dimensions of 4 l x × 4 l y , where l x , l y are the horizontal and vertical anchor spacings, respectively ( l x = l y = 3 m), with a square pattern of anchors, each with a side length of d p = 0.20 m. Anchors are simulated by blocking the degrees of freedom of the nodal particles that are virtually intercepted by the anchor plates. Finally, periodic boundary conditions are imposed on the border of the mesh system to simulate the presence of neighboring panels, in analogy with previous works [18,19,37]. A single punching element is located in the middle of the system to simulate the loading condition imposed by an isolated block. To facilitate the comparison with the laboratory results, this element has the same shape and size ( d p u n c h = 1 m) as the one adopted in the standard UNI punch test configuration. The punching element is moved normally to the mesh plane, i.e., z-direction, with a constant displacement rate of v = 0.1 m/s (for sufficiently low displacement rates, the mesh response is unaltered [19]). The mesh–punch contact parameters adopted in the simulations are as follows: contact normal stiffness k n = 6.5 × 10 5 N/m, tangential contact stiffness k t = 0.3 k n , and a contact friction angle ϕ c = 35 (these parameters were chosen according to a previous work [19]). The time step of the explicit integration scheme is equal to d t = 10 5 s. A graphical scheme of the numerical model is displayed in Figure 3b.
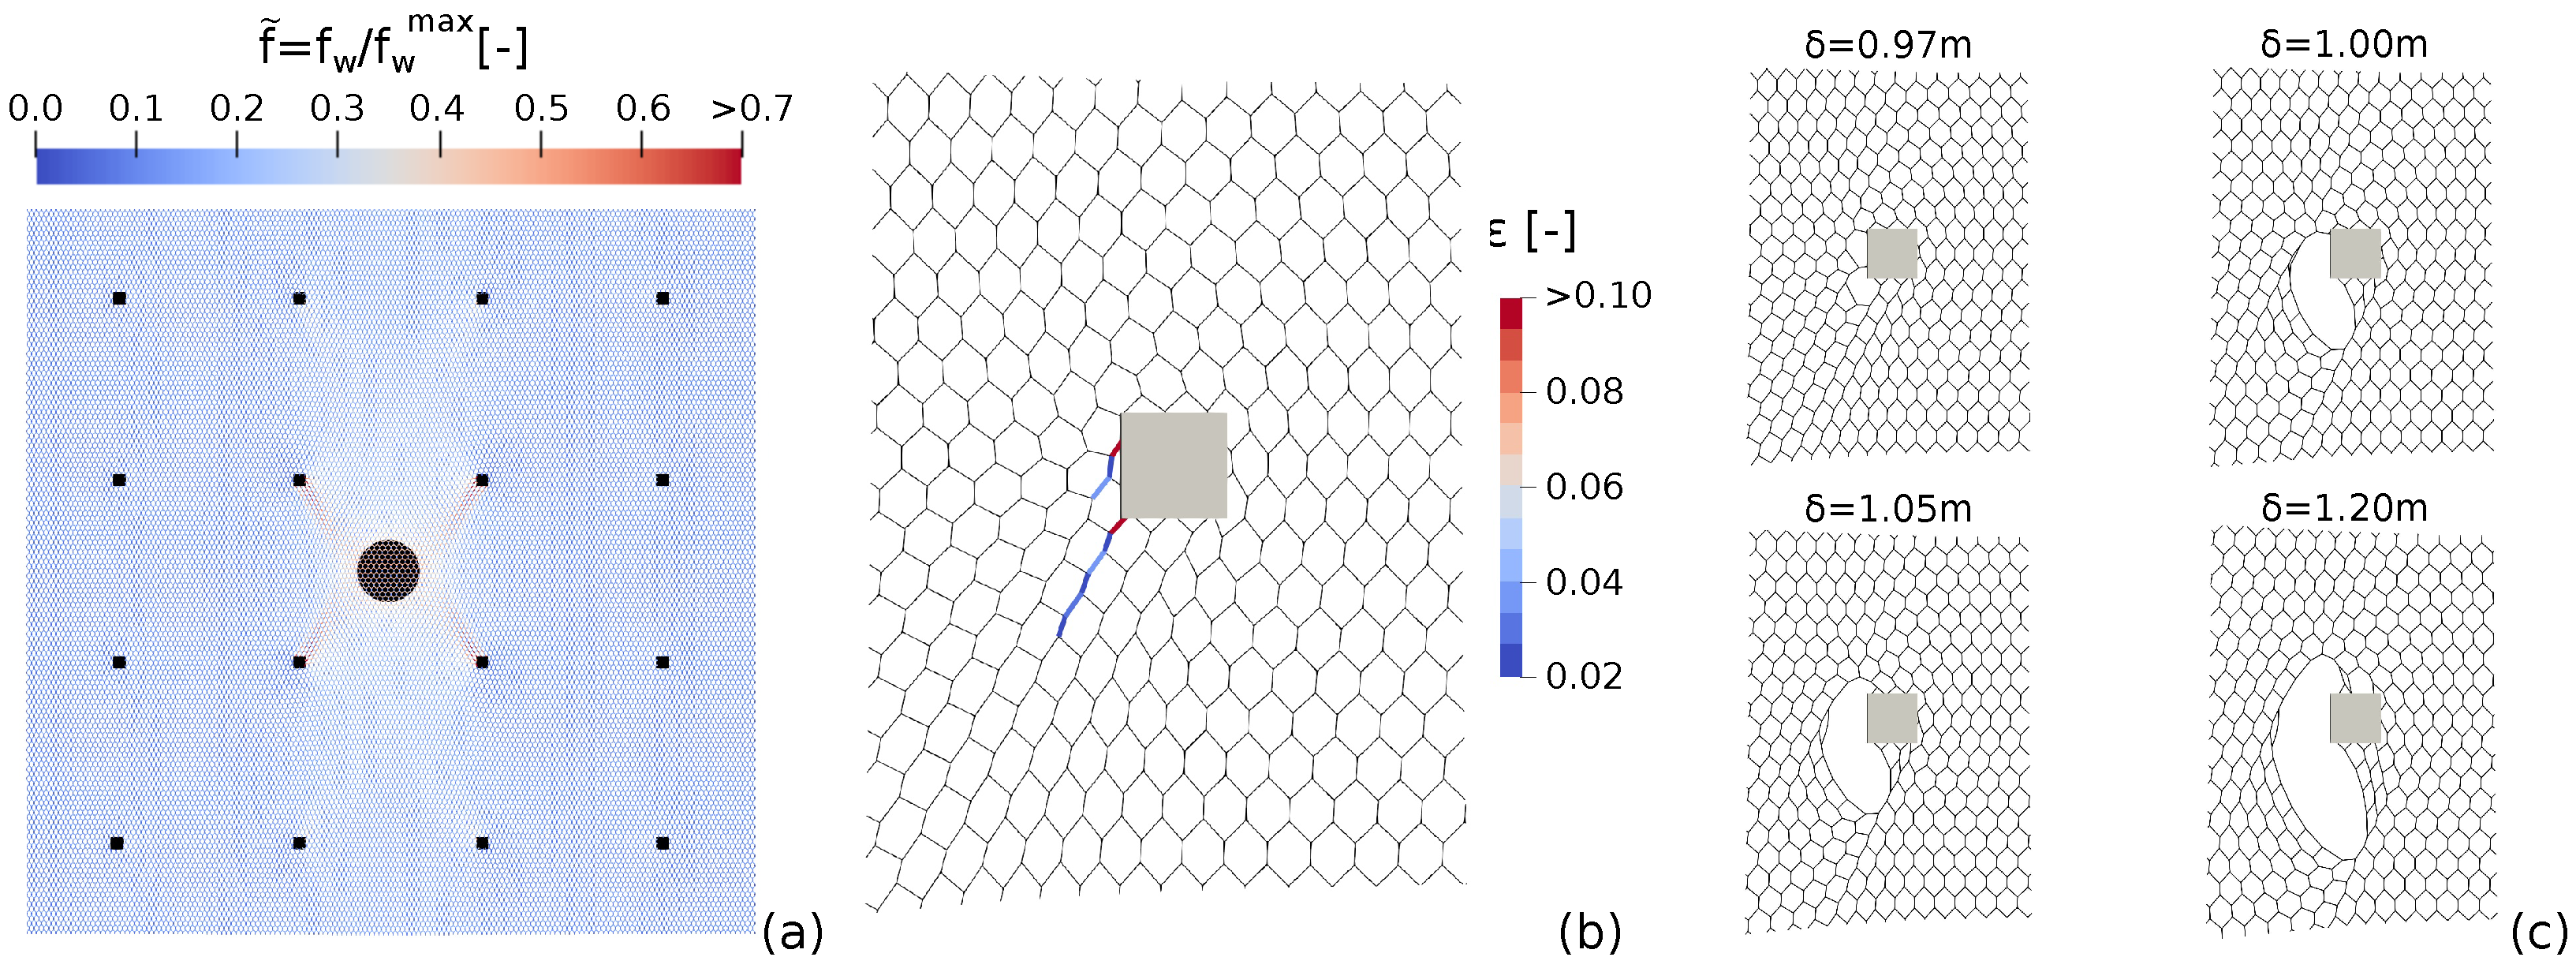
The numerical results are provided in terms of force–displacement ( F δ ) and are displayed in Figure 3a. The system is considered to fail when the mesh is no longer able to contrast the punching element movement or when a significant tear in the mesh has occurred. Force and displacement values at failure are denoted as F r and δ r , respectively. In order to estimate the modification of the mesh mechanical response when moving toward field conditions, the standard UNI F δ curve and the one obtained from the large-scale model described above are compared in Figure 3a. The mesh response significantly modifies when moving to field conditions. A strong reduction in the force that can be supported by the system and a significant increase in the panel’s deformability are observed. The failure mechanism also differs. In the laboratory test, the failure is observed in correspondence with the punching element, while in the large-scale model, the failures occur at the four anchors of the central panel. Considering the values at failure, the maximum force is equal to F r r e f = 37.30 kN ( = γ F F U N I , γ F = 0.55 , and F U N I = 67.60 kN), and the associated deflection is represented by δ r r e f = 0.95 m ( = γ δ δ U N I , γ δ = 1.67 , and δ U N I = 0.565 m). This clearly points out the strong degradation of the mesh mechanical response when moving from laboratory (fixed boundary) to field conditions (local anchored zones). In Figure 4a, the tensile force values are displayed (an instant prior to the mesh failure). Force values are presented as normalized forces f ˜ = f w / f w m a x , with f w being the actual force acting on a wire and f w m a x being the limit force for which the wire fails ( f w m a x , depending on the wire type, with values equal to 3.03 kN and 5.95 kN for the single- and double-twisted types, respectively). The load is transmitted diagonally from the punching element to the anchors and is mostly supported by the anchors pertaining to the central panel. The details of the strain level on the wires surrounding the upper-right anchor plate of the central panel (an instant prior to the mesh failure) are reported in Figure 4b. The same distribution is observed in the other three anchors. It is worth noting that the strains localize on a few wires, from which the failure mechanism develops and rapidly propagates in the mesh, as shown in Figure 4c.

3. Parametric Analysis

A parametric analysis was conducted in order to estimate the effects of the geometrical characteristics of both the anchored mesh system and the punching element on the force–displacement response of the system. Referring to the former, the anchor spacing, anchor plate size, and panel aspect ratio were investigated. For the latter, the punching element size and loading direction were considered, along with the possible influence of the eccentricity of the loading conditions. Parameters were varied in order to cover the range typical in common practice. These are summarized in Table 1.
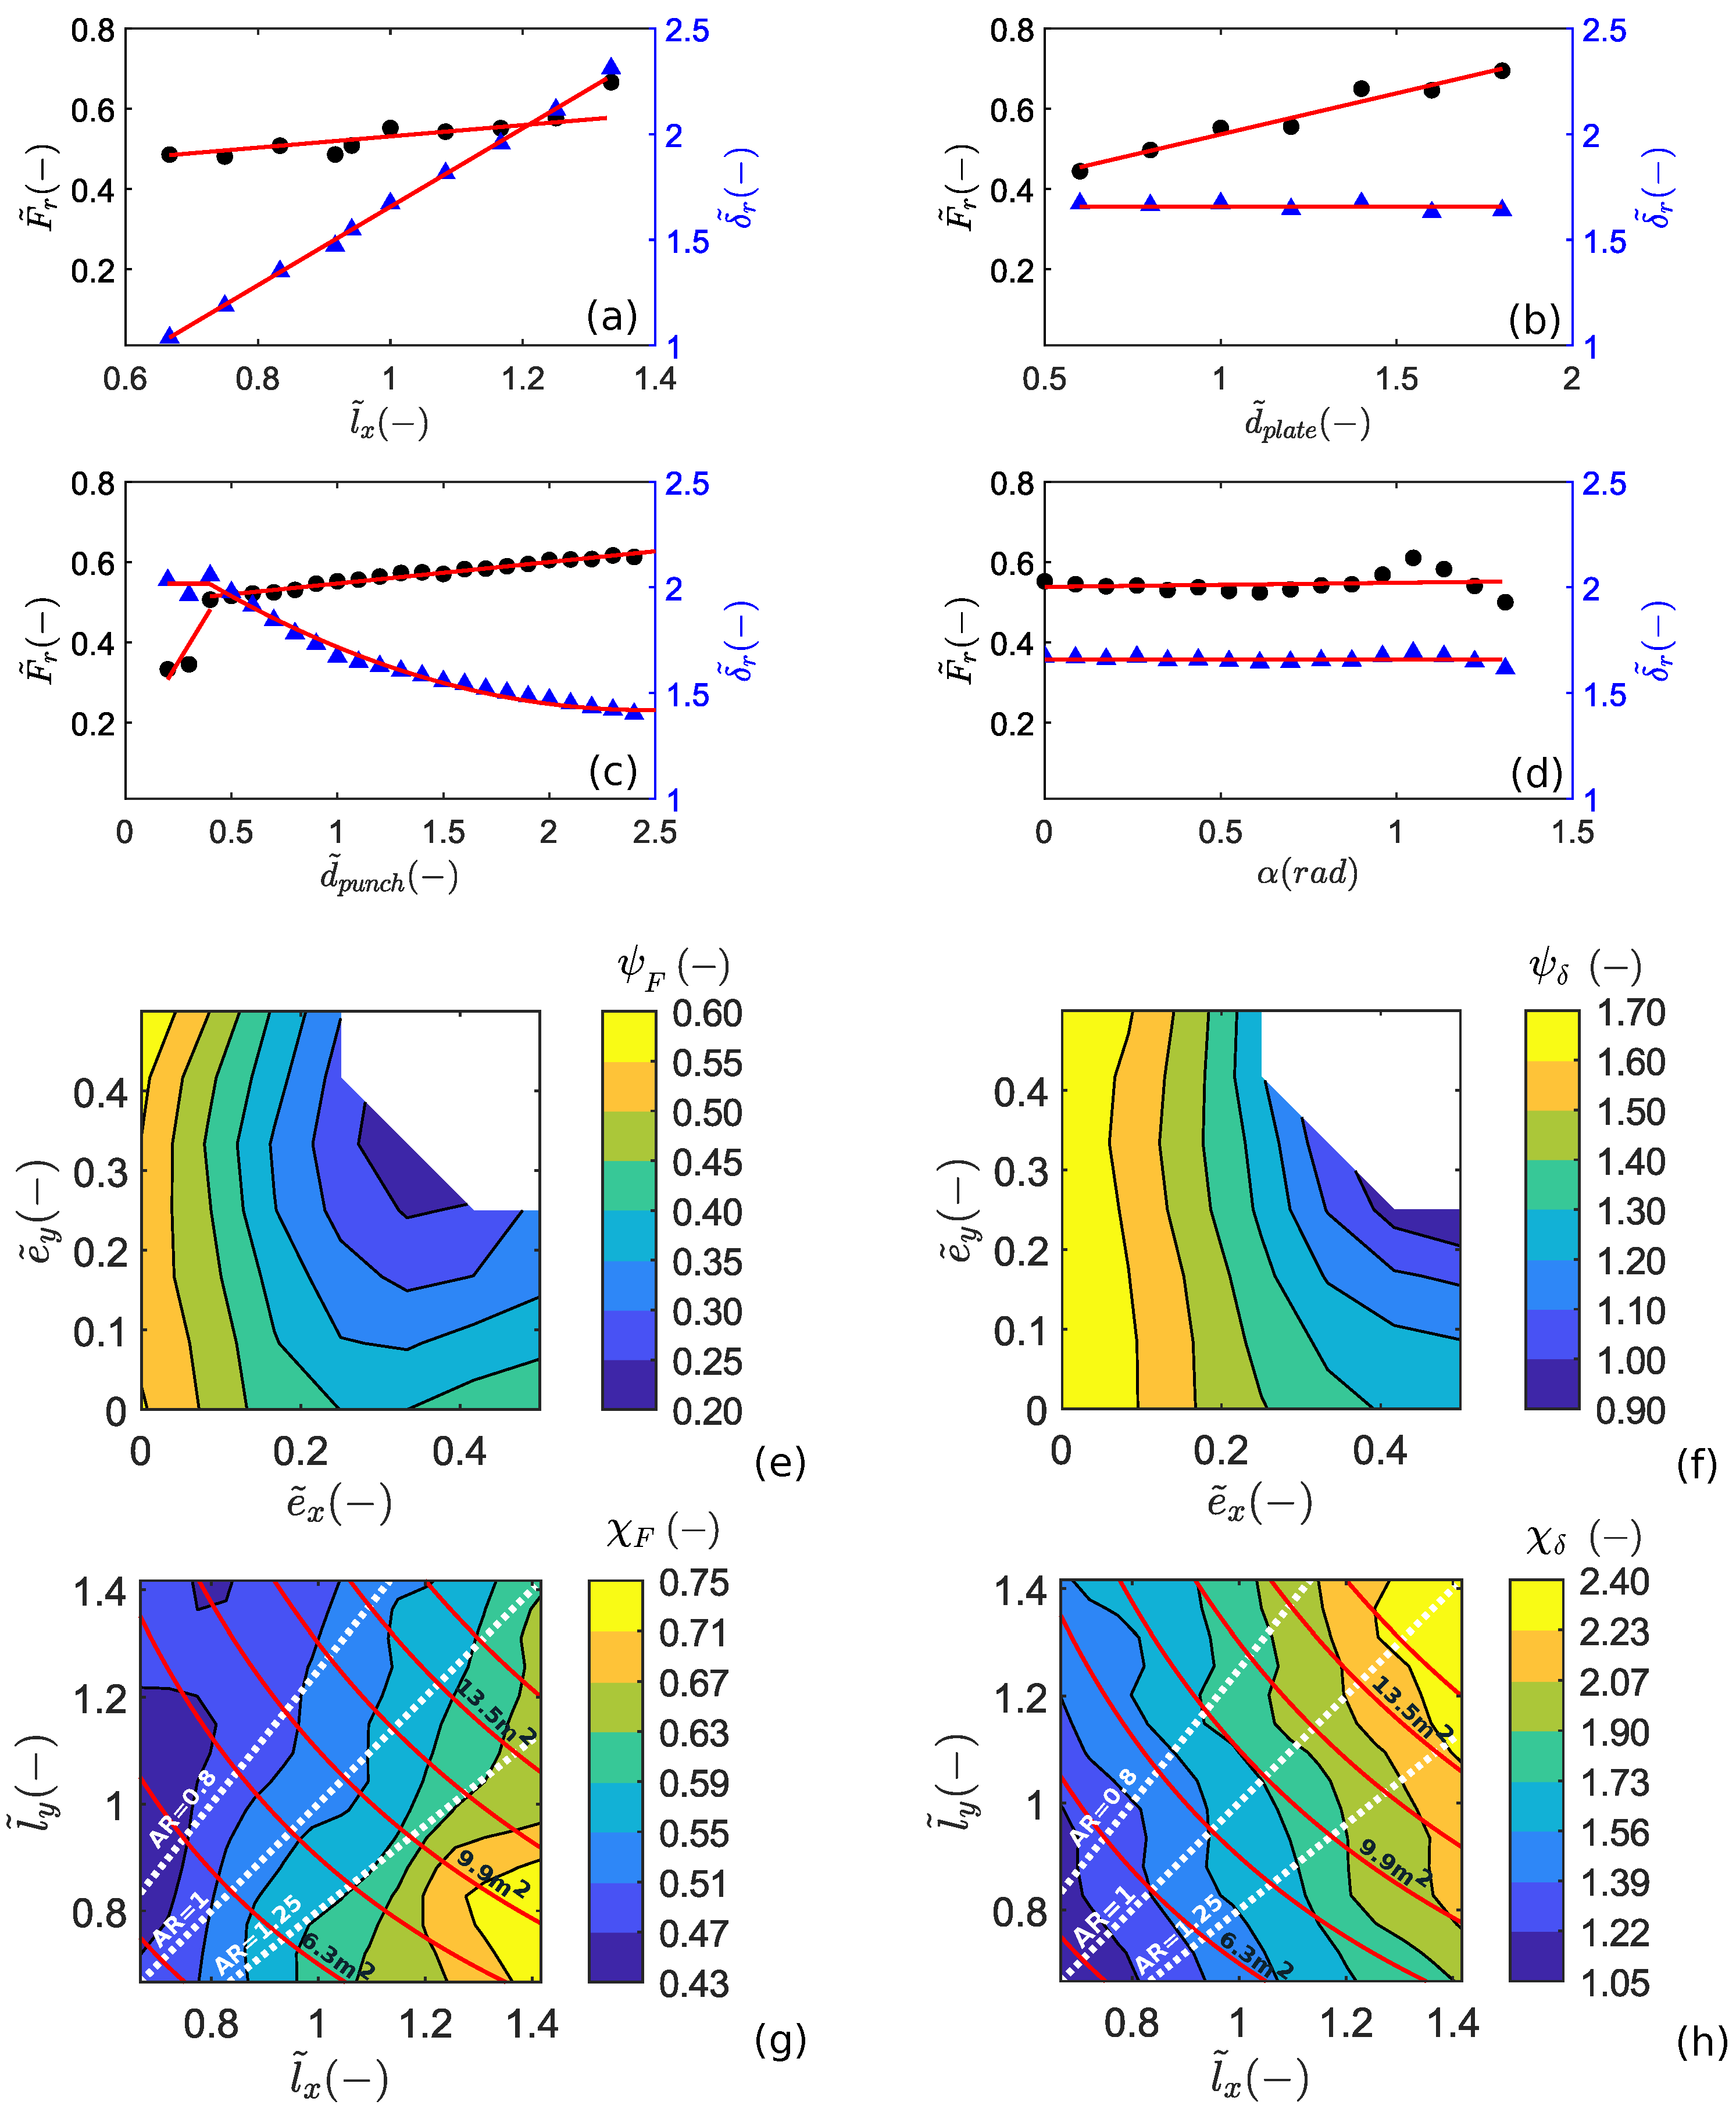
For each of the considered parameters, the force–displacement response of several cases is compared in Figure 5. Values at failure F r and δ r , referred to as characteristic values, are displayed in Figure 6, where the values are normalized with respect to the standard UNI values, i.e., ( F ˜ r = F r / F U N I and δ ˜ r = δ r / δ U N I ). The same notation is used for the parameters (e.g., l ˜ x = l x / l x , U N I ), normalized with respect to the standard UNI values, if specified. For the anchor plate size d p l a t e , the normalization is done on the value adopted in the reference configuration, i.e., 20 cm. The load eccentricity is normalized on the length of the panel’s side (e.g., e ˜ x = e x / l x ).
The influence of the inclination α of the thrust from the punching element was observed to have a negligible effect on the mechanical response of the mesh system and will not be discussed (see Figure 5f).

3.1. Anchor Plate Size

The failure of the mesh is most frequently observed in proximity to the anchor plates [7,47] and this has been observed in numerical analyses [18,19]. Therefore, it is reasonable to assume that, for sufficiently large punching elements, the mesh resistance is controlled by the available resistance at the mesh–anchor connection, which, in turn, is a function of the number of wires intercepted by the anchor plate. In the standard UNI punch test, the failure occurs in correspondence to the punching element and the punching resistance is controlled by the punching element dimension [18,19].
The anchor plate side d p l a t e varied from 12 to 36 cm, with an incremental step of 2 cm. The effects of the anchor plate size on the F δ trend are reported in Figure 5b. The force at failure increases when the anchor plate size is increased (see also Figure 6b), confirming that the available resistance at the mesh–anchor connection is mainly controlled by the anchor plate size in agreement with [19]. The deflection at failure is instead mostly unaffected by the anchor plate dimension (see Figure 6b) and can, therefore, be considered independent of d p l a t e .
The effect of the anchor plate dimension on the characteristic value of the force at failure F r can be estimated with the following linear relation (determined through least squares fit, see Figure 6b):
F r = ( 0.2 d ˜ p l a t e + 0.33 ) F U N I ;

3.2. Punching Element Position

The effect of load eccentricity on the mesh response was analyzed by shifting the initial position of the punching element on a regular grid spaced by 25 cm. Different combinations of horizontal and vertical shifts, e x and e y , respectively, were considered, assuming the origin in the center of the panel. Configurations in which the punching element would interfere with the anchor plates are excluded.
In Figure 5c,d, the F δ curves obtained by shifting the punching element along one direction (per time) are reported; this corresponds to separately analyzing the effects of e ˜ x and e ˜ y . A negligible influence of e ˜ y can be appreciated, with negligible differences in the values at failure as well as in the entire F δ response of the system for all of the values of e ˜ y considered (see Figure 5d). Conversely, the eccentricity along the x-axis affects the mechanical response of the mesh system (see Figure 5c). As a general trend, one may notice a reduction in both the force at failure and the associated deflection when increasing the eccentricity e x . To appreciate the effect of a generic shift on F r and δ r , contour plots are reported in Figure 6e-f; these were obtained from a linear interpolation of the numerical data on the grid used for defining the punch shift. Only one-quarter of the panel is reported, due to the symmetry of the problem. The greater influence of the eccentricity e x on the mesh response is highlighted by the contour plots.

3.3. Punching Element Size

In previous work, the authors have shown that, depending on the relative dimension between the anchor plate and the punching element, two different failure modes can be observed (“block-punching” and “anchor-punching”) [19]. When a relatively small punching element is considered, the available resistance at the mesh–anchor connection (which is a function of the number of wires intercepted by the plate) is higher than the puncturing resistance of the mesh (a function of the number of wires intercepted by the punching element), and so the mesh is expected to fail in alignment with the punching element.
The effect of the size (and indirectly of the sharpness) of the punching element was analyzed by rescaling the standard UNI punching element. In this framework, small elements can represent the case of small or sharp blocks while larger elements can represent the case of relatively large and rounded blocks. The diameter of the punching element ( d p u n c h ) has changed in the range of 0.2–2.5 m, with incremental steps of 0.1 m, having as lower and upper limits the opening size of the mesh and the mesh panel size.
The mechanical response of the mesh panel for different values of d p u n c h is reported in Figure 5e. For a relatively large punching element, the mechanical response of the mesh is improved both in terms of mechanical resistance and out-of-plane deformability. A strong variation can be observed for the threshold value d p u n c h = 0.4 m, see Figure 6c, which is related to a change in the failure modality from a “block-punching” to an “anchor-punching” type. The effect of the punching element size d p u n c h on the characteristic value of the force and deflection at failure can be estimated with the following relations (least squares fit, see Figure 6c):
F r = ( 0.87 d ˜ p u n c h + 0.13 ) F U N I if d ˜ p u n c h 0.4 ; F r = ( 0.05 d ˜ p u n c h + 0.49 ) F U N I if d ˜ p u n c h > 0.4 .
δ r = 2.02 δ U N I if d ˜ p u n c h 0.4 ; δ r = ( 0.14 d ˜ p u n c h 2 0.69 d ˜ p u n c h + 2.27 ) δ U N I if d ˜ p u n c h > 0.4 .
For sufficiently large punching elements ( d p u n c h > 0.4 m), the mechanical resistance of the mesh system is mostly controlled by the anchor plate size; nevertheless, a slight increment of F r with d p u n c h is observed. This may be due to a better redistribution of the forces on the mesh panel for larger punching elements.

3.4. Mesh Panel Geometry

3.4.1. Anchor Spacing

The anchor spacing represents one of the most relevant parameters in the design process controlling the deformability of the mesh system [19]. Considering a square mesh panel, the side length varied from 2 to 4 m, with an incremental step of 0.5 m (an anchor spacing larger than 4 m is not advisable in real applications).
The force–displacement curves obtained for several values of the anchor spacing are compared in Figure 5a. In all cases, the failure of the mesh is observed near the anchors of the central panel. Figure 5a and Figure 6a confirm that increasing the anchor spacing results in an increment in the panel’s out-of-plane deformability and the deflection at failure. A slight increment of the punching force supported by the panel is also observed (Figure 6a). As suggested by Pol et al. [19], this may be related to a better redistribution of the stresses on the wires for larger mesh panels. The effects of the anchor spacing on the characteristic values can be estimated by using the following relations (least squares fit, see Figure 6a):
F r = 0.23 l ˜ x + 0.31 F U N I
δ r = ( 1.88 l ˜ x 0.23 ) δ U N I

3.4.2. Aspect Ratio

Although the use of a square anchor pattern is widespread in practice, the ability to independently vary the lengths of the panel’s sides may be used to optimize the mechanical response of the system while maintaining a constant number of anchors per unit mesh area. In this perspective, the results of Section 3.4.1 are extended by considering a variation in the panel aspect ratio ( A R ) in what follows. This is defined as the ratio between the horizontal and vertical lengths of the panel’s sides ( A R = l x / l y ). The A R varied from 2 4.25 to 4.25 2 by changing the panel’s sides, l x and l y , with intervals of 0.25 m.
The effects of the aspect ratio ( A R ) on the force and deflection values at failure are displayed in the contour plots of Figure 6g,h. Although there is no monotonic trend, a general tendency can be recognized: the force and the deflection at failure increase when increasing the panel aspect ratio, i.e., for l x > l y . In particular, the characteristic values are mostly controlled by the horizontal anchor spacing l x , a variation of the vertical spacing has a much slighter effect on them. For a fixed A R value (white dashed lines), instead, the trend observed when referring to square panels is confirmed (Section 3.4.1).
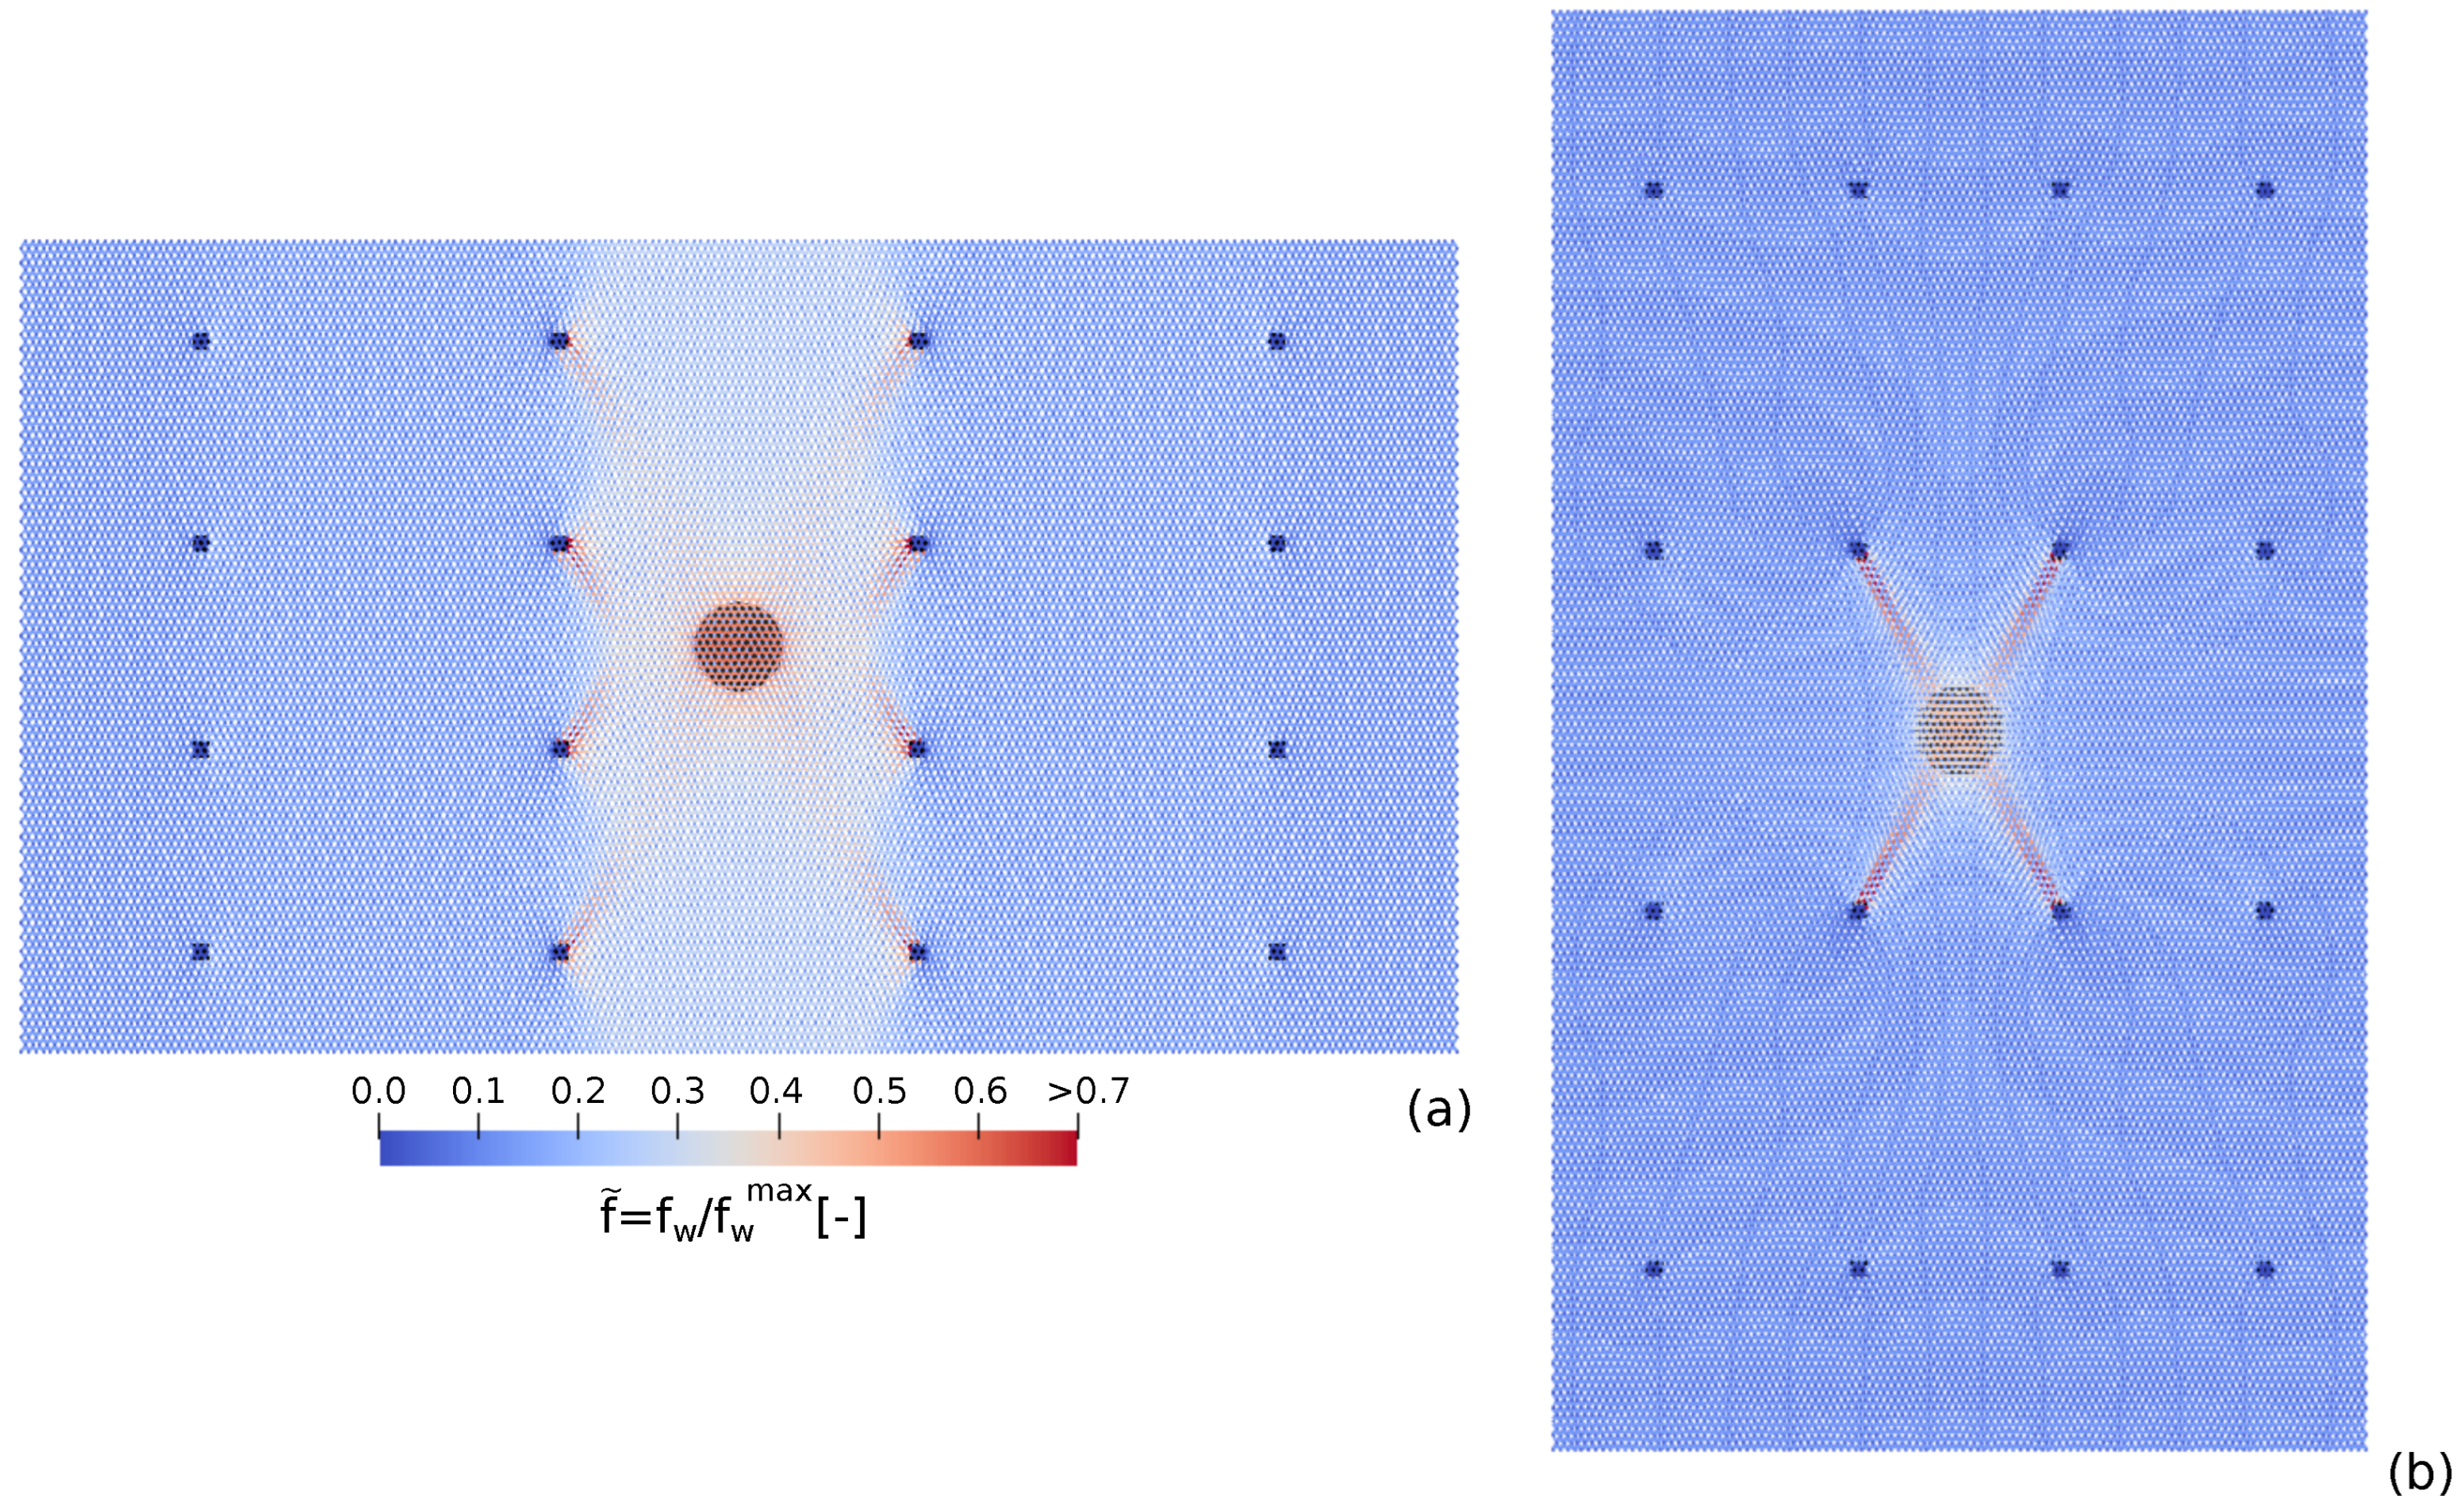
In order to better understand the “pure” effect related to the panel A R , we now refer to the cases with constant panel areas. These are represented by the solid red lines in Figure 6g,h. A comparison of the entire force–displacement response for three panels with different A R is also displayed in Figure 5g (in the panel surface of 9 m 2 ). The panel punching resistance globally increases when increasing the panel aspect ratio as well as the deflection at failure and the panel deformability. This behavior can be explained by the existence of a preferential direction for the force transmission in the hexagonal double-twisted mesh. Due to its peculiar wire pattern (hexagonal cell geometry and the presence of two wire types), the force is preferentially transmitted along the direction of the double-twisted wires [18,19] (y-direction in the present case). Adopting a panel geometry in which the vertical distance between anchor rows is reduced enhances the redistribution of the punching load on the neighboring panels. This allows for the activation of the anchors pertaining to the upper and lower panels and leads to an improvement in the retaining capacity of the system. The above-described force transmission mechanism can be appreciated in Figure 7, where the force distributions on the mesh wires for the cases A R = 1.78 and A R = 0.56 are displayed (the F δ response is shown in Figure 5g).
It is interesting to recall that an opposite trend regarding the maximum force is observed in the case of a “periodic” loading condition (i.e., each mesh panel is equally loaded). In such a case, the characteristic force increases as the A R decreases [19]. This behavior has been related to the fact that when each panel is equally loaded, redistribution on neighboring panels is not possible. Hence, the mechanical performance of a mesh panel is enhanced when the load transmission mechanism is aligned with the double-twisted wires. This shows that there is no optimal aspect ratio, but the choice depends on the loading conditions. It should also be kept in mind that the effect of the aspect ratio on the mechanical response of the mesh is strongly related to the mesh typology and the geometric features of the mesh’s elementary cell; therefore, the results discussed here apply to the hexagonal double-twisted wire mesh only.

4. Extension to Field Conditions

4.1. Estimation of the Mesh System Characteristic Values

The relations derived in Section 3 are combined by a simple linear transformation in order to estimate the characteristic values F r and δ r for the given geometrical and loading configurations. This implies the assumption of non-dependence among the effects of the system’s parameters. Coefficients γ F and γ δ account for the differences in the boundary conditions between the standard laboratory characterization and field conditions. This was estimated in Section 2.3 by considering the reference configuration of the large-scale drapery system. The force obtained in the reference configuration is F r r e f = γ F F U N I with γ F = 0.55 , while the deflection is δ r r e f = γ d δ U N I with γ d = 1.67 . It should be noted that the effects of the punching element eccentricity, the panel dimension, and geometry (anchor spacing and panel aspect ratio) are accounted for in Equations (6) and (7) by means of the coefficients ψ and χ , respectively (the contour plots of Figure 6). The analytical equations used to derive the normalized characteristic values of the force F ˜ r and displacement δ ˜ r for any given plate size, punch size, punching element eccentricity, panel dimension, and geometry, are given by:
F ˜ r = 0.2 d ˜ p l a t e + 0.33 0.87 d ˜ p u n c h + 0.13 γ F 3 ψ F χ F if d ˜ p u n c h 0.4 ; F ˜ r = 0.2 d ˜ p l a t e + 0.33 0.05 d ˜ p u n c h + 0.49 γ F 3 ψ F χ F if d ˜ p u n c h > 0.4 ;
δ ˜ r = 2.02 γ d 2 ψ d χ d if d ˜ p u n c h 0.4 ; δ ˜ r = 0.14 d ˜ p u n c h 2 0.69 d ˜ p u n c h + 2.27 γ d 2 ψ d χ d if d ˜ p u n c h > 0.4 ;
Finally, substituting γ F and γ d with their numerical values:
F ˜ r = 5.95 0.2 d ˜ p l a t e + 0.33 0.87 d ˜ p u n c h + 0.13 ψ F χ F if d ˜ p u n c h 0.4 ; F ˜ r = 5.95 0.2 d ˜ p l a t e + 0.33 0.05 d ˜ p u n c h + 0.49 ψ F χ F if d ˜ p u n c h > 0.4 ;
δ ˜ r = 0.72 ψ d χ d if d ˜ p u n c h 0.4 ; δ ˜ r = 0.35 0.14 d ˜ p u n c h 2 0.69 d ˜ p u n c h + 2.27 ψ d χ d if d ˜ p u n c h > 0.4 ;

4.2. Master Curve

In order to forecast the mechanical response of a given anchored mesh panel with reference to the out-of-plane loading conditions, the characteristic values estimated with Equations (8) and (9) have to be coupled with a master curve that allows for deriving the entire F δ response. For the definition of a master curve, the F δ curve obtained in each of the cases considered in the parametric analysis is normalized with respect to the related characteristic values ( F r and δ r ). The results are summarized in Figure 8. The data collapse very well on a single curve, opening up the possibility to define a master curve. The normalized data are then fitted using a non-linear least square regression model, obtaining the following expression for the master curve:
F ˜ = 2.08 δ ˜ 4 1.45 δ ˜ 3 + 0.3 δ ˜ 2 + 0.07 δ ˜
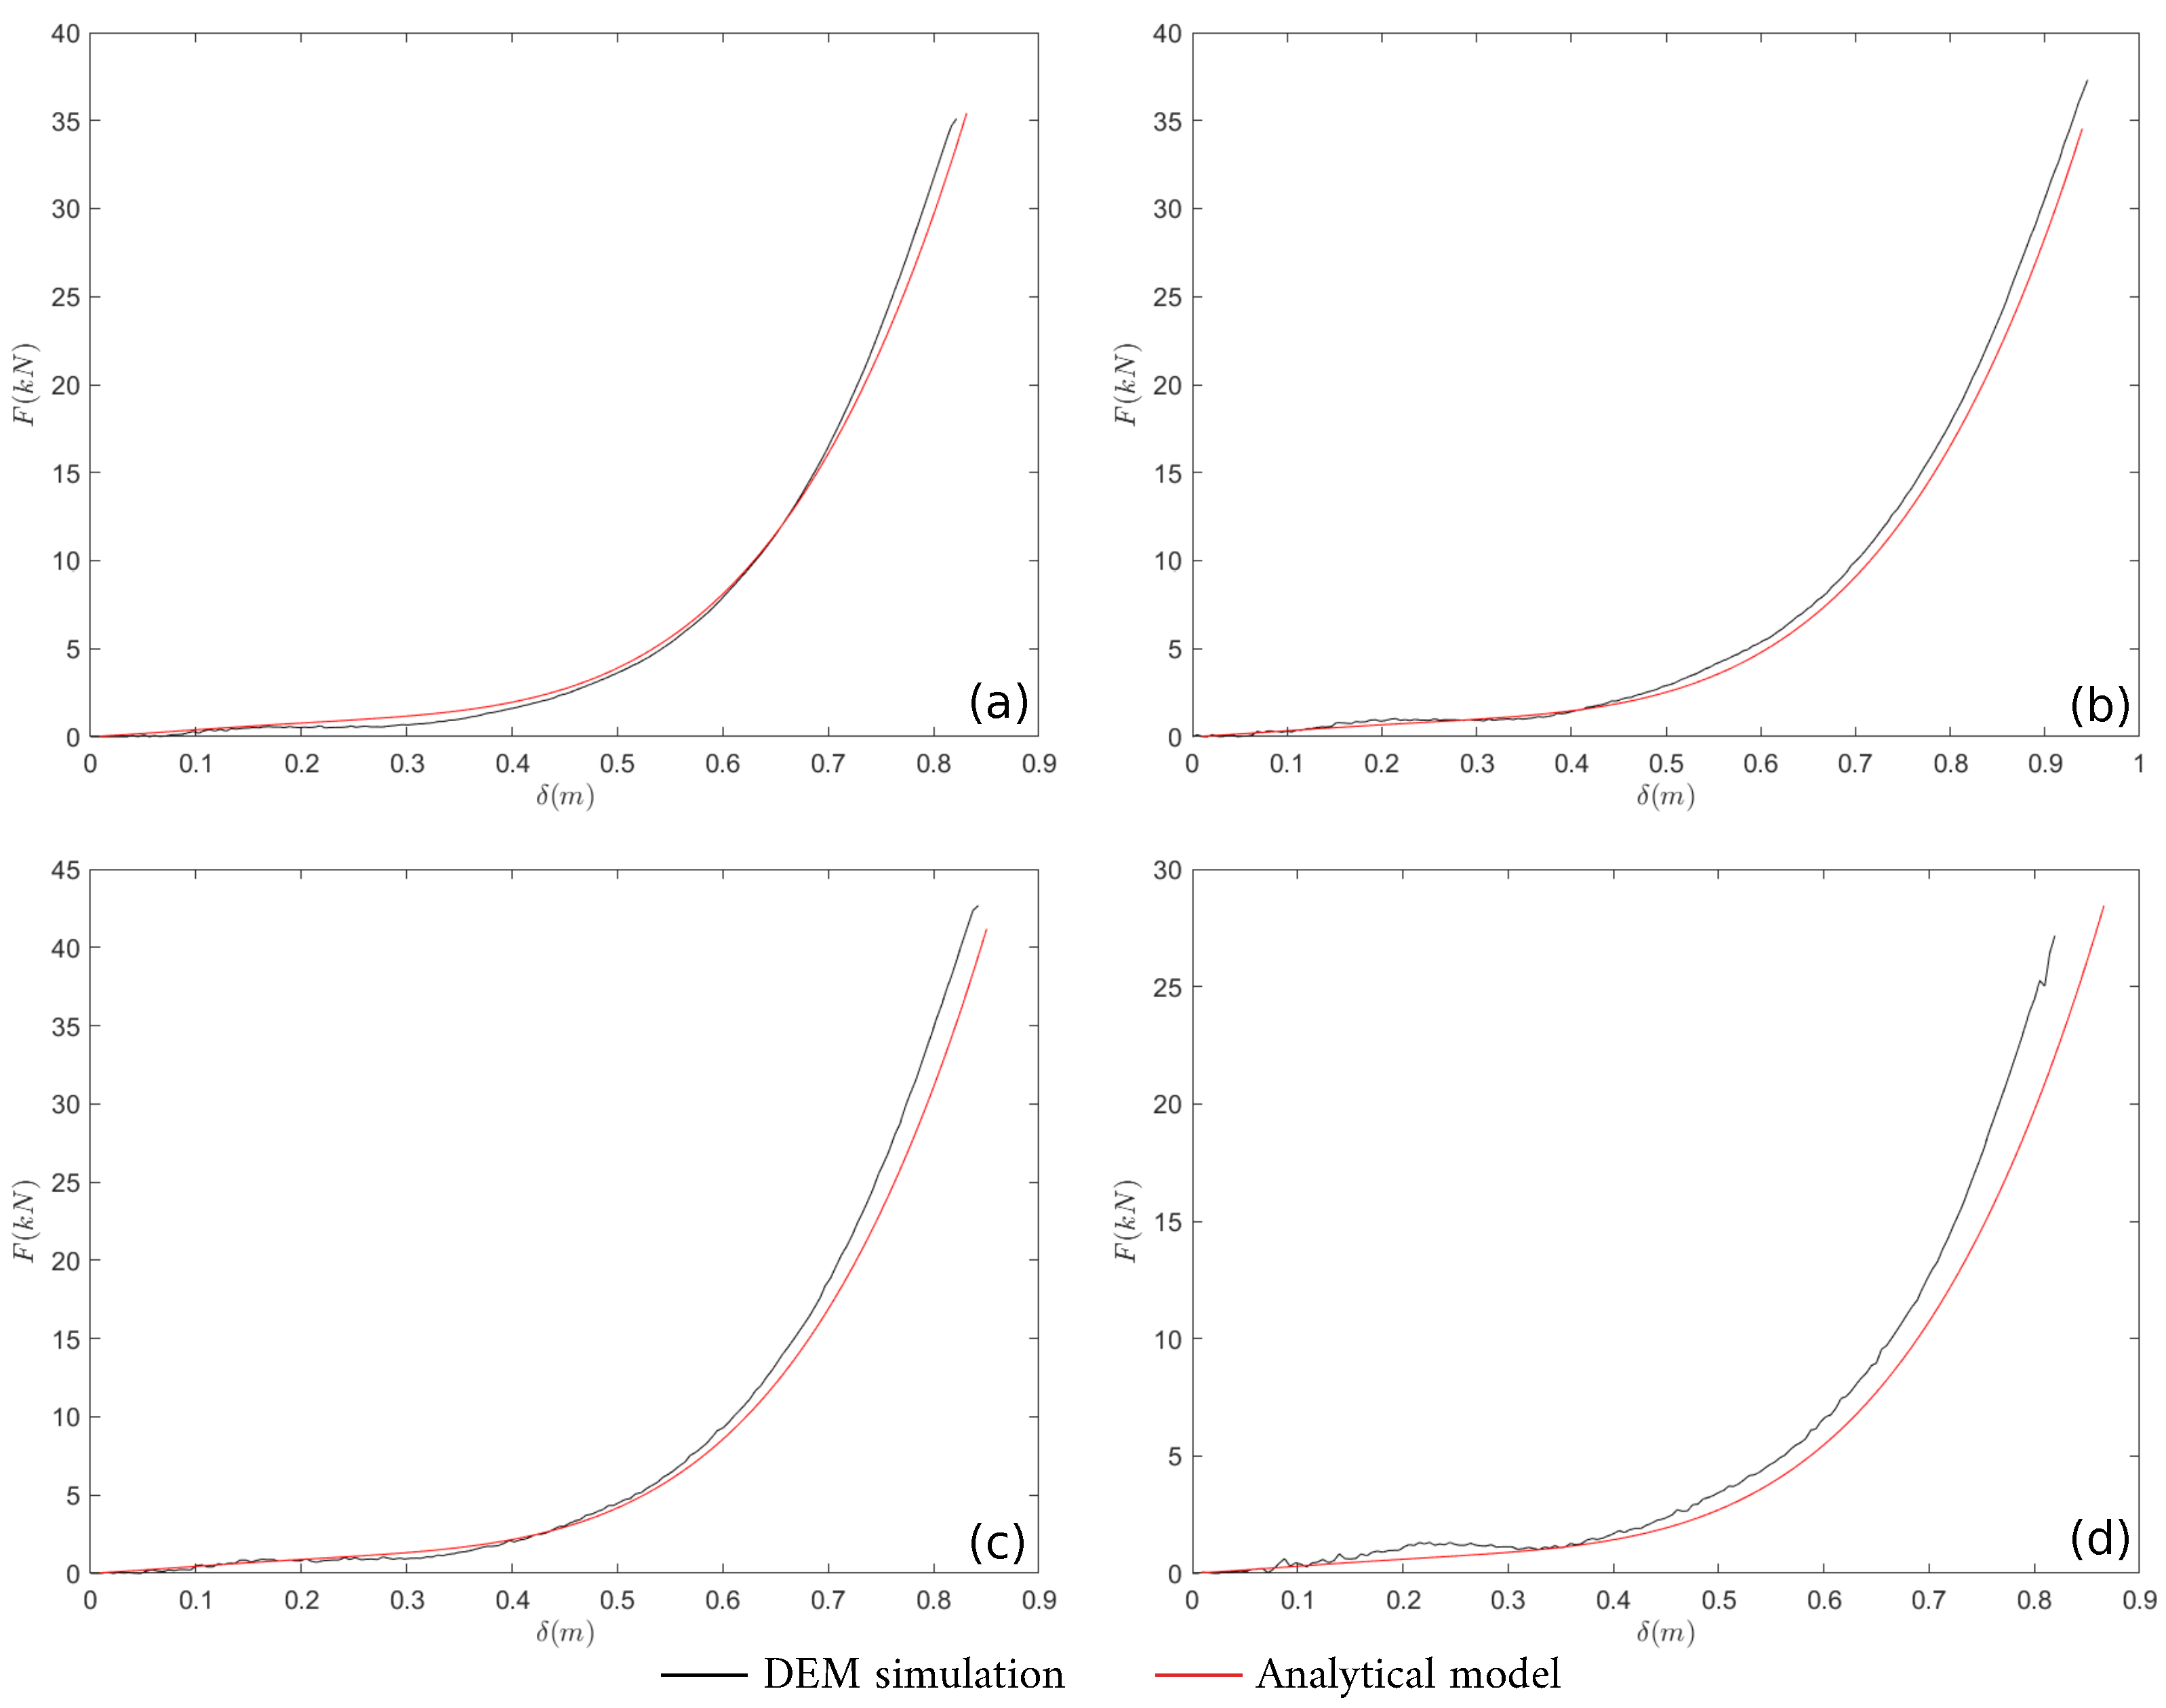
An example of an application of the above-described forecasting approach is provided by considering four geometrical configurations of the mesh system (see Table 2). The predictions of the analytical model as well as the results are compared with ex-post simulations in Figure 9. These are computed as follows:
  • The normalized characteristic values ( F ˜ r and δ ˜ r ) of the mesh system considered in the analysis are computed with Equations (8) and (9);
  • The master curve (Equation (10)) is rescaled with the computed F ˜ r and δ ˜ r values;
  • The F δ curve is obtained by rescaling the normalized F ˜ r δ ˜ r curve with the characteristic values of the standard UNI punch test ( F U N I and δ U N I ).
It should be noted that Equations (8) and (9) are valid inside of the range of the parameters considered in the parametric analysis and cannot be directly used with reference to other mesh types or loading configurations (e.g., retention of a granular layer). The range considered in this analysis reasonably covers the full range of variability that can be adopted in common practice.

4.3. Accuracy of the Analytical Model

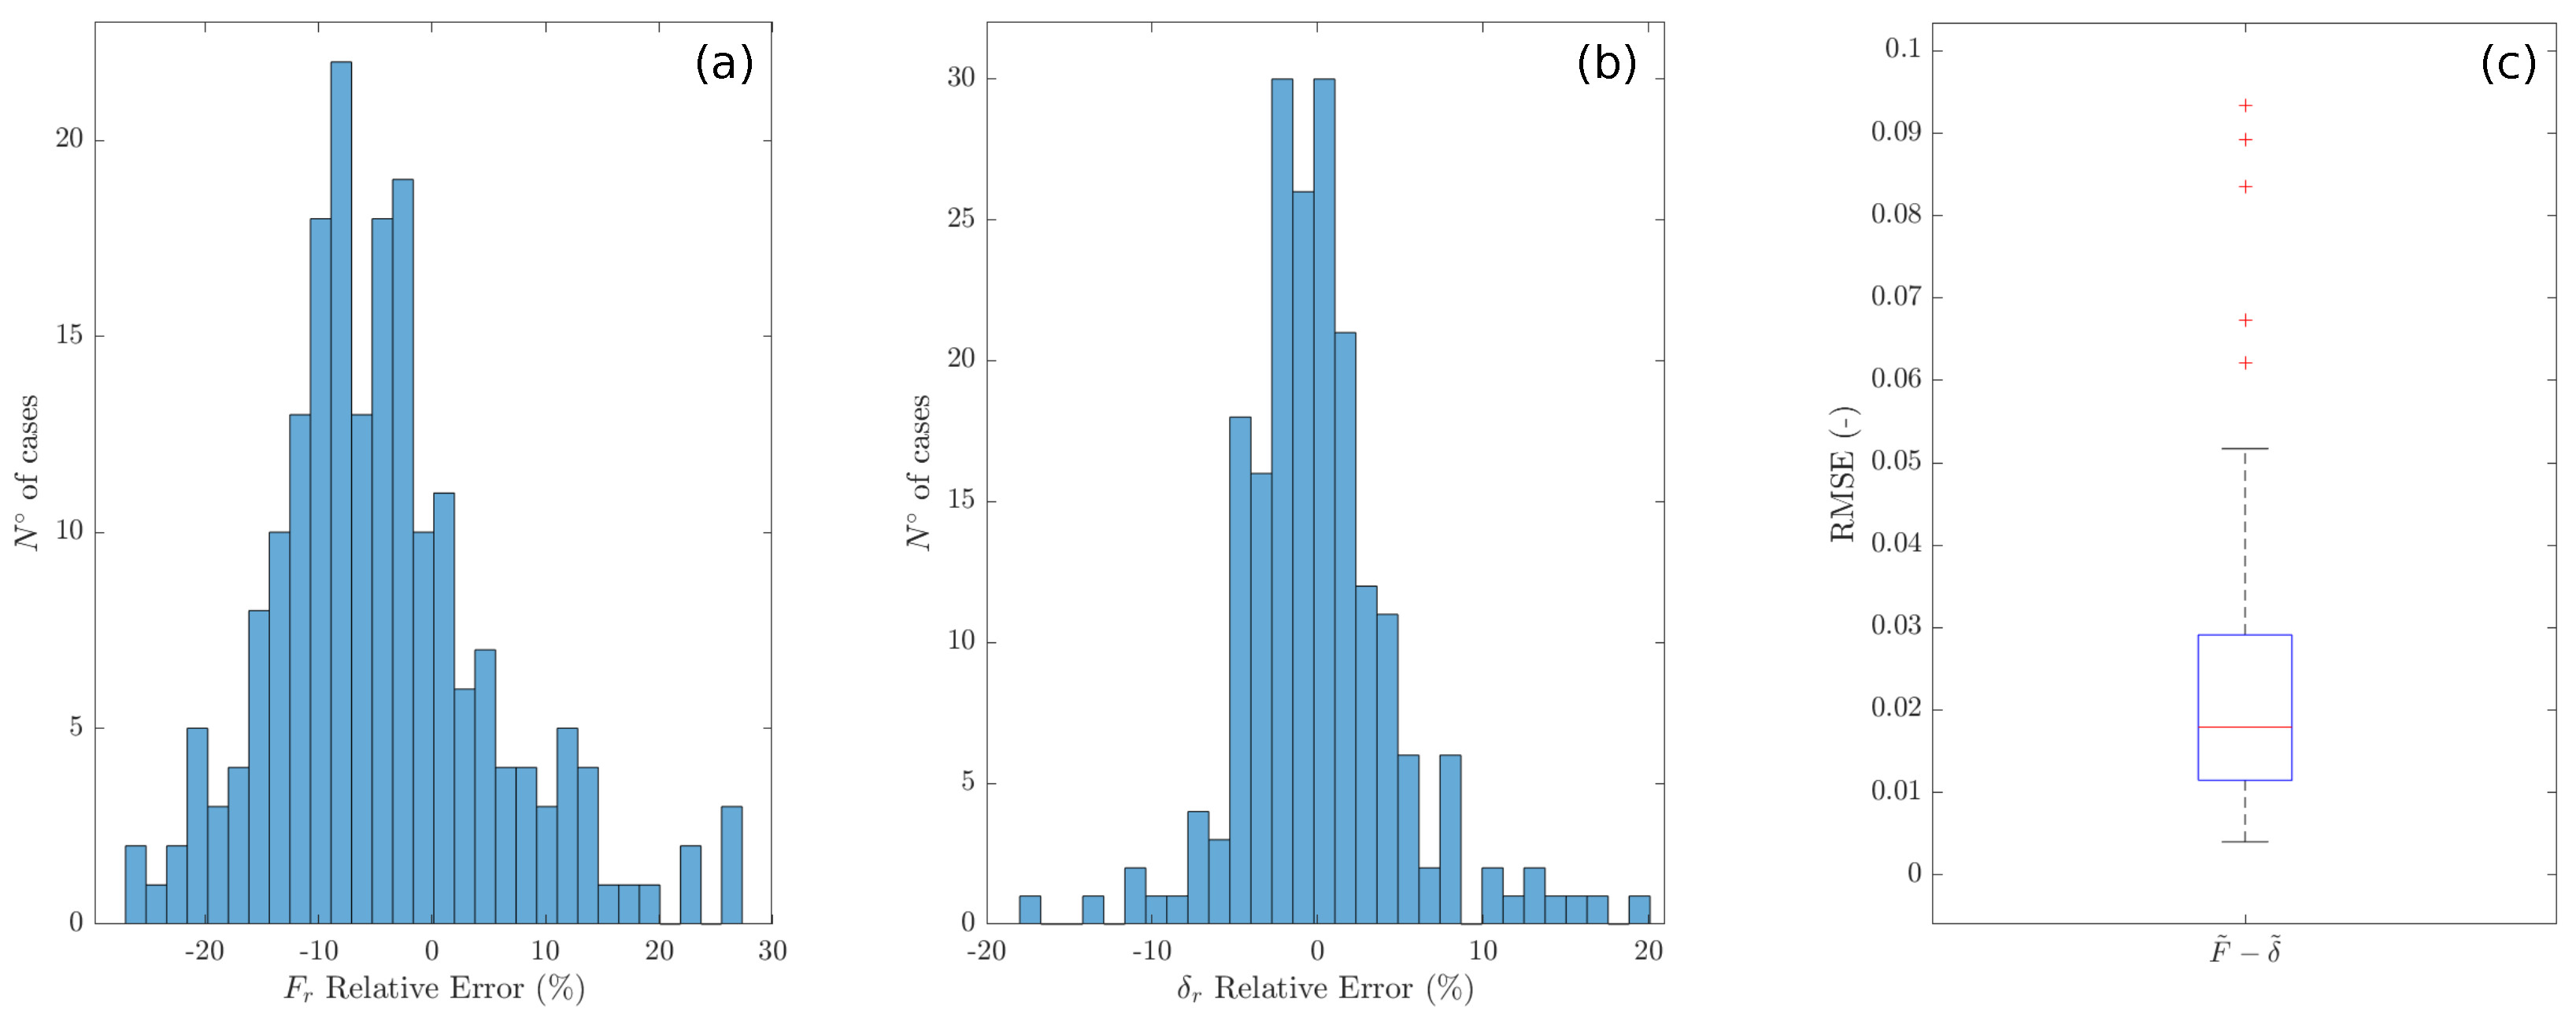
To estimate the accuracy of the analytical model in predicting the values of the force and displacement at rupture, and the whole F δ curve, 200 additional configurations were simulated ex-post and considered as benchmarks. Each case differs from the reference configuration for the entire set of parameters, which were selected on a random basis from a uniform distribution in the range specified in Table 1; hence, scenarios that were even more divergent than the reference one were considered. The predictions of the analytical model are compared with the results from the numerical simulations in Figure 10. As indexes of the accuracy of the analytical model, we report the relative error of F r and δ r and the root-mean-square error (RMSE) of the force–displacement trend. For the first two quantities, histogram plots are shown in Figure 10a,b. Referring to F r , 135 of the studied cases present a relative error within ± 10 % , 187 cases within ± 20 % , while the remaining are within 25 % and + 27 % , with a median of 5.6 % and a mean of 4.4 % . Considering δ r , 187 of the cases fall within ± 10 % , while the remaining are included within 18 % and + 20 % , with a median equal to 0.35 % and a mean value of 0.05 % . In both cases, a slight right-skewed distribution can be observed (0.71 and 0.74 for F r and d r , respectively); thus, with particular reference to F r , a slight underestimation of the predicted value over the numerical one can be noted. To further increase the accuracy of the analytical model, the hypothesis of non-dependence among the effects of the system’s parameters should be relaxed in future studies. The RMSE is instead represented through a boxplot (Figure 10c): the central mark indicates the median and the bottom and top edges of the box indicate the 25th and 75th percentiles, respectively. The whiskers extend to the most extreme data points that are not considered outliers, which, in turn, are plotted individually using the + marker symbol. The median of the RMSE is 0.018, while the 25th and 75th percentiles are 0.011 and 0.028, respectively.

4.4. Towards a Hybrid Design Approach

In this work, we proposed an approach to derive a simple analytical model to forecast the response of an anchored mesh panel when loaded by an isolated block. This represents the first step towards a more reliable design methodology for anchored mesh structures, which in our viewpoint, may be represented by a hybrid approach [48,49].
Anchored mesh systems are nowadays designed by means of force-based approaches (e.g., limit equilibrium methods), in which the deformation of the mesh system and the mesh–block interaction are totally disregarded. The stabilizing action of the mesh is accounted for with reference to its ultimate limit value only (i.e., force at failure). This approach provides no information on the expected deformation of the mesh system, which is increasingly becoming one of the requirements. The concept of a hybrid design approach can be seen as an improvement of this methodology. In fact, it is possible to use a force-based approach (LEM) to calculate the force required to stabilize the unstable block at first, then associate this information with the expected system displacement by means of the mesh characteristic curve, i.e., F δ (obtained from the analytical model of Section 4). It should be noted that the characteristic curve allows reliable estimation of the mesh’s mechanical behavior (e.g., punching resistance), explicitly accounting for the mesh’s system geometry and the mesh–block interaction mechanism. This represents a great improvement with respect to the use of the characteristic values obtained from laboratory punch tests. When using a hybrid design approach, an ultimate limit state (ULS) is applied for the analysis of the block stability (before the intervention) and a serviceability limit state (SLS) for the evaluation of the mesh system behavior. This allows, on the one hand, the verification of the punching resistance of the mesh and, on the other hand, the estimation of the expected mesh deformation under operating conditions. In addition to the definition of a safety factor (as in a standard force-based approach), a hybrid approach allows for the comparison between different design choices (e.g., anchor spacing, panel A R ) in terms of the mechanical performance of the mesh system.

5. Conclusions

In this work, the conceptual framework introduced in [34] is extended to anchored drapery mesh systems interacting with an isolated rock block. The mechanical characterization provided by the standard UNI punch test configuration, which has been shown to overestimate the mesh resistance, has been extended to an idealized field condition.
The effects of the main problem variables (i.e., mesh panel size, punching element position, orientation and size, anchor plate dimension, and pattern) on the system’s mechanical response were investigated using a large number of discrete element simulations. The main results are summarized as follows.
  • Increasing the anchor spacing results in an increment of the panel’s out-of-plane deformability as well as the deflection at failure. A slight but systematic increment of the maximum force supported by the panel is observed, possibly related to a better redistribution of the stresses on the wires for larger mesh panels.
  • Increasing the anchor plate dimension is reflected in an increment of the force at failure. This shows that the available resistance at the mesh–anchor connection is mainly controlled by the anchor plate size. The deflection at failure is instead mostly unaffected by the anchor plate dimension.
  • The eccentricity along the x-axis affects the mechanical response of the mesh system, reducing both the force and the deflection at failure with respect to a centered case. Conversely, the influence of eccentricity along the y-axis is negligible.
  • For relatively large punching elements (larger than the anchor plate), the mechanical response of the mesh is improved both in terms of mechanical resistance and out-of-plane deformability. A strong variation is observed for the threshold value d p u n c h = 0.4 m when the failure modality changes from a “block-punching” to an “anchor-punching” type.
  • The inclination of the thrust imposed by the punching element has a negligible influence on the force–displacement response of the mesh system.
  • The adoption of a panel geometry in which the vertical spacing between the anchors is reduced compared with the horizontal spacing enhances the redistribution of the punching load on the neighboring panels. An opposite trend of the maximum force is observed in the case of a “periodic” loading condition [19], i.e., when each mesh panel is equally loaded.
Starting from a parametric analysis, simple analytical formulations allowing for the estimation of the characteristic values F r and δ r for a generic system configuration were delineated. Then, a master curve was defined in order to forecast the entire F δ response of the mesh system, starting from the standard UNI laboratory characterization. The benchmark analysis highlights that in the majority of the considered configurations, the results of the analytical formulation are within ± 10 % of the results of the numerical analyses. To improve the accuracy of the proposed analytical approach, the hypothesis of non-dependence among the effects of the variation of each parameter will be relaxed in future studies.
Finally, the possible coupling of the proposed forecasting approach with limit equilibrium calculations and the concept of a hybrid design approach were discussed. The adoption of a hybrid approach may allow practitioners to quickly estimate the expected deformations in serviceability conditions and design the system with respect to its performance. The results presented in this work refer to a hexagonal double-twisted mesh and should not be directly applied to other mesh types; nevertheless, the conceptual framework here discussed can be easily extended to other mesh types. A future step to define a database of characteristic curves involves the derivation of analytical models for other commonly adopted mesh typologies.

Author Contributions

Conceptualization, M.M. and A.P.; methodology, M.M., A.P., and F.G.; formal analysis, M.M. and A.P.; data curation, M.M., A.P., and F.G.; writing—original draft preparation, M.M. and A.P.; writing—review and editing, M.M., A.P., F.G., and D.P.; supervision, F.G. and D.P.; funding acquisition, M.M. and D.P. All authors have read and agreed to the published version of the manuscript.

Funding

This research is part of the NODES project, which has received funding from the MUR—M4C2 1.5 of PNRR, grant agreement no. ECS00000036. This research was partially funded by the PNRR NODES project “Nord Ovest Digitale E Sostenibile”.

Data Availability Statement

Data are available on request.

Acknowledgments

We would like to express our gratitude to CloudVeneto for providing us with access to their computing and storage facilities.

Conflicts of Interest

The authors declare no conflict of interest.

References

  1. Shu, S.; Muhunthan, B.; Badger, T.C. Snow loads on wire mesh and cable net rockfall slope protection systems. Eng. Geol. 2005, 81, 15–31. [Google Scholar] [CrossRef]
  2. Muhunthan, B.; Shu, S.; Sasiharan, N.; Hattamleh, O.; Badger, T.; Lowell, S.; Duffy, J. Analysis and Design of Wire/Mesh Cable Net Slope Protection; Technical Report; U.S. Department of Transportation—Federal Highway Administration: Washington, DC, USA, 2005. [Google Scholar]
  3. Savi, S.; Comiti, F.; Strecker, M.R. Pronounced increase in slope instability linked to global warming: A case study from the eastern European Alps. Earth Surf. Process. Landforms 2021, 46, 1328–1347. [Google Scholar] [CrossRef]
  4. Da Costa, A.; Sagaseta, C. Analysis of shallow instabilities in soil slopes reinforced with nailed steel wire meshes. Eng. Geol. 2010, 113, 53–61. [Google Scholar] [CrossRef]
  5. Blanco-Fernandez, E.; Castro-Fresno, D.; Díaz, J.D.C.; Lopez-Quijada, L. Flexible systems anchored to the ground for slope stabilisation: Critical review of existing design methods. Eng. Geol. 2011, 122, 129–145. [Google Scholar] [CrossRef]
  6. Giacchetti, G.; Grimod, A. Superficial consolidation of rock slope: Design at the ultimate and seriviceability limit state. In Engineering Geology for Society and Territory; Springer: Berlin/Heidelberg, Germany, 2015; Volume 2, pp. 1885–1888. [Google Scholar]
  7. Marchelli, M.; Giacchetti, G. Reinforced Drapery Meshes: A Design Method Accounting for Retaining Ropes Contribution. Appl. Sci. 2021, 11, 11176. [Google Scholar] [CrossRef]
  8. Bertolo, P.; Oggeri, C.; Peila, D. Full-scale testing of draped nets for rockfall protection. Can. Geotech. J. 2009, 46, 306–316. [Google Scholar] [CrossRef]
  9. Cala, M.; Stolz, M.; Baraniak, P.; Rist, A.; Roduner, A. Large scale field tests for slope stabilizations made with flexible facings. In Proceedings of the ISRM International Symposium-EUROCK 2013, Wroclaw, Poland, 23–26 October 2013; OnePetro: Richardson, TX, USA, 2013. [Google Scholar]
  10. Bucher, R.; Wendeler, C.; Baraniak, P. New results of large-scale testing of high-tensile steel meshes and soil nails for slope stabilisation and validation of modelling software. In Proceedings of the First Asia Pacific Slope Stability in Mining Conference. Australian Centre for Geomechanics, Perth, Australia, 14–16 November 2016; pp. 709–720. [Google Scholar]
  11. Gratchev, I.; Kim, D.H.; Chung, M. Study of the interface friction between mesh and rock surface in drapery systems for rock fall hazard control. Eng. Geol. 2015, 199, 12–18. [Google Scholar] [CrossRef]
  12. ASTM A975:2021; Standard Specification for Double-Twisted Hexagonal Mesh Gabions and Revet Mattresses (Metallic-Coated Steel Wire or Metallic-Coated Steel Wire With Poly(Vinyl Chloride) (PVC) Coating). ASTM: West Conshohocken, PA, USA, 2021.
  13. EN 15381:2008; Geotextiles and Geotextile-Related Products. Characteristics Required for Use in Pavements and Asphalt Overlays. European Standard: Brussels, Belgium, 2008.
  14. ISO 17745:2016; Steel Wire Ring Net Panels—Definitions and Specifications. ISO: Geneva, Switzerland, 2016.
  15. ISO 17746; Steel Wire Rope Net Panels and Rolls—Definitions and Specifications. ISO: Geneva, Switzerland, 2016.
  16. EN 10223-3:2013; Hexagonal Steel Wire Mesh Products for Civil Engineering Purposes. ISO: Geneva, Switzerland, 2013.
  17. UNI 11437; Opere di difesa dalla caduta massi—Prove su reti per rivestimento di versanti. UNI: Milano, Italy, 2012.
  18. Pol, A. Discrete Element Modelling of Wire Meshes for Secured Drapery Applications. Ph.D. Thesis, Università degli Studi di Padova, Padova, Italy, 2020. [Google Scholar]
  19. Pol, A.; Gabrieli, F.; Brezzi, L. Discrete element analysis of the punching behavior of a secured drapery system: From laboratory characterization to idealized in situ conditions. Acta Geotech. 2021, 16, 2553–2573. [Google Scholar] [CrossRef]
  20. Cazzani, A.; Mongioví, L.; Frenez, T. Dynamic finite element analysis of interceptive devices for falling rocks. Int. J. Rock Mech. Min. Sci. 2002, 39, 303–321. [Google Scholar] [CrossRef]
  21. Volkwein, A. Numerical simulation of flexible rockfall protection systems. In Proceedings of the Computing in Civil Engineering, ASCE, Cancun, Mexico, 12–15 July 2005. [Google Scholar]
  22. Sasiharan, N.; Muhunthan, B.; Badger, T.; Shu, S.; Carradine, D. Numerical analysis of the performance of wire mesh and cable net rockfall protection systems. Eng. Geol. 2006, 88, 121–132. [Google Scholar] [CrossRef]
  23. Govoni, L.; de Miranda, S.; Gentilini, C.; Gottardi, G.; Ubertini, F. Modelling of falling rock protection barriers. Int. J. Phys. Model. Geotech. 2011, 11, 126–137. [Google Scholar] [CrossRef]
  24. Gentilini, C.; Govoni, L.; de Miranda, S.; Gottardi, G.; Ubertini, F. Three-dimensional numerical modelling of falling rock protection barriers. Comput. Geotech. 2012, 44, 58–72. [Google Scholar] [CrossRef]
  25. Mentani, A.; Giacomini, A.; Buzzi, O.; Govoni, L.; Gottardi, G.; Fityus, S. Numerical modelling of a low-energy rockfall barrier: New insight into the bullet effect. Rock Mech. Rock Eng. 2016, 49, 1247–1262. [Google Scholar] [CrossRef]
  26. Giacomini, A.; Thoeni, K.; Lambert, C.; Booth, S.; Sloan, S. Experimental study on rockfall drapery systems for open pit highwalls. Int. J. Rock Mech. Min. Sci. 2012, 56, 171–181. [Google Scholar] [CrossRef]
  27. Bertrand, D.; Nicot, F.; Gotteland, P.; Lambert, S. Modelling a geo-composite cell using discrete analysis. Comput. Geotech. 2005, 32, 564–577. [Google Scholar] [CrossRef]
  28. Thoeni, K.; Giacomini, A.; Lambert, C.; Sloan, S.W.; Carter, J.P. A 3D discrete element modelling approach for rockfall analysis with drapery systems. Int. J. Rock Mech. Min. Sci. 2014, 68, 107–119. [Google Scholar] [CrossRef]
  29. Albaba, A.; Lambert, S.; Kneib, F.; Chareyre, B.; Nicot, F. DEM modeling of a flexible barrier impacted by a dry granular flow. Rock Mech. Rock Eng. 2017, 50, 3029–3048. [Google Scholar] [CrossRef]
  30. Coulibaly, J.B.; Chanut, M.A.; Lambert, S.; Nicot, F. Nonlinear discrete mechanical model of steel rings. J. Eng. Mech. 2017, 143, 04017087. [Google Scholar] [CrossRef]
  31. Gabrieli, F.; Pol, A.; Thoeni, K. Comparison of two DEM strategies for modelling cortical meshes. In Proceedings of the PARTICLES V International Conference on Particle-Based Methods: Fundamentals and Applications, Hannover, Germany, 26–28 October 2017; CIMNE: Barcelona, Spain, 2017; pp. 489–496. [Google Scholar]
  32. Xu, C.; Tannant, D.D.; Zheng, W. Discrete element analysis of the influence of bolt pattern and spacing on the force-displacement response of bolted steel mesh. Int. J. Numer. Anal. Methods Geomech. 2019, 43, 2106–2125. [Google Scholar] [CrossRef]
  33. Xu, C.; Tannant, D.D.; Zheng, W.; Liu, K. Discrete element method and support vector machine applied to the analysis of steel mesh pinned by rockbolts. Int. J. Rock Mech. Min. Sci. 2020, 125, 104163. [Google Scholar] [CrossRef]
  34. Pol, A.; Gabrieli, F.; Bost, M. A simple tool for forecasting the mechanical response of anchored wire mesh panels. IOP Conf. Ser. Earth Environ. Sci. 2021, 833, 012104. [Google Scholar] [CrossRef]
  35. Gabrieli, F.; Pol, A.; Thoeni, K.; Mazzon, N. Particle-based modelling of cortical meshes for soil retaining applications. In Numerical Methods in Geotechnical Engineering IX; CRC Press: Boca Raton, FL, USA, 2018; pp. 391–397. [Google Scholar]
  36. Pol, A.; Gabrieli, F.; Mazzon, N. Enhancement of design methodologies of anchored mesh systems using the discrete element method. In Geotechnical Research for Land Protection and Development: Proceedings of CNRIG 2019 7; Springer: Berlin/Heidelberg, Germany, 2020; pp. 500–508. [Google Scholar]
  37. Pol, A.; Gabrieli, F. Discrete element simulation of wire-mesh retaining systems: An insight into the mechanical behavior. Comput. Geotech. 2021, 134, 104076. [Google Scholar] [CrossRef]
  38. Pol, A.; Gabrieli, F. Anchor plate bearing capacity in flexible mesh facings. Soils Found. 2022, 62, 101222. [Google Scholar] [CrossRef]
  39. Gabrieli, F.; Pol, A.; Bost, M.; Brezzi, L. Design Tool for Pinned Drapery Meshes. Available online: https://geotechlab.dicea.unipd.it/codes/design-tool-for-drapery-mesh/ (accessed on 15 January 2023).
  40. Nicot, F.; Cambou, B.; Mazzoleni, G. Design of rockfall restraining nets from a discrete element modelling. Rock Mech. Rock Eng. 2001, 34, 99–118. [Google Scholar] [CrossRef]
  41. Pol, A.; Gabrieli, F.; Thoeni, K.; Mazzon. Discrete element modelling of punch tests with a double-twist hexagonal wire mesh. In Proceedings of the 6th Interdisciplinary Workshop on Rockfall Protection, Barcelona, Spain, 22–24 May 2017; pp. 22–24. [Google Scholar]
  42. Gabrieli, F.; Pol, A.; Mazzon, N.; Deana, M. Discrete element simulations of punch tests for the mechanical characterization of cortical meshes. In Proceedings of the 14th ISRM Congress, Foz do Iguassu, Brazil, 13–18 September 2019; OnePetro: Richardson, TX, USA, 2019. [Google Scholar]
  43. Effeindzourou, A.; Chareyre, B.; Thoeni, K.; Giacomini, A.; Kneib, F. Modelling of deformable structures in the general framework of the discrete element method. Geotext. Geomembr. 2016, 44, 143–156. [Google Scholar] [CrossRef]
  44. Effeindzourou, A.; Thoeni, K.; Giacomini, A.; Wendeler, C. Efficient discrete modelling of composite structures for rockfall protection. Comput. Geotech. 2017, 87, 99–114. [Google Scholar] [CrossRef]
  45. Marigo, N.; Gabrieli, F.; Pol, A.; Bisson, A.; Brezzi, L. A Discrete Element Framework for the modelling of rock-filled gabions. IOP Conf. Ser. Earth Environ. Sci. 2021, 833, 012102. [Google Scholar] [CrossRef]
  46. Thoeni, K.; Lambert, C.; PGiacomini, A.; Sloan, S.W. Discrete modelling of hexagonal wire meshes with a stochastically distorted contact model. Comput. Geotech. 2013, 49, 158–169. [Google Scholar] [CrossRef]
  47. Marchelli, M.; De Biagi, V.; Peila, D. A quick-assessment procedure to evaluate the degree of conservation of rockfall drapery meshes. Frat. Integrità Strutt. 2019, 13, 437–450. [Google Scholar] [CrossRef]
  48. Galli, A.; Maiorano, R.M.S.; di Prisco, C.; Aversa, S. Design of slope-stabilizing piles: From ultimate limit state approaches to displacement based methods. Riv. Ital. Geotec. 2017, 51, 77–93. [Google Scholar]
  49. Galli, A.; Deana, M.; Mazzon, N. Application of a hybrid approach to the design of anchored wire meshes on steep slopes. In Proceedings of the Slope Stability 2020 International Symposium on Slope Stability in Open Pit Mining and Civil Engineering, Perth, Australia, 12–14 May 2020; Australian Centre for Geomechanics: Crawley, Australia, 2020; pp. 823–830. [Google Scholar]
Figure 1. Reinforced drapery system on a rock slope in Sarre, Autonomous Region of Valle d’Aosta, Italy.
Geosciences 13 00147 g001
Figure 2. (a) NWB description of the double-twisted wire mesh and (b) sketch of the “wire” local tensile model. (c) Tensile stress–strain relationships between the single (SW) and double-twisted (DT) wires (adapted from [46]).
Geosciences 13 00147 g002
Figure 3. (a) Comparison of the force–displacement curve obtained from the standard UNI punch test, displaying both the experimental and numerical results, as well as in the reference configuration (Section 2.3). (b) Layout of the reference configuration.
Geosciences 13 00147 g003
Figure 4. (a) Force distribution on the mesh wires an instant prior to the mesh failure. (b) Strain level on wires surrounding the upper-right anchor of the central panel. (c) Propagation of the failure in the mesh.
Geosciences 13 00147 g004
Figure 5. Effects of the system’s parameters on the F δ response of the mesh system; (a) anchor spacing l x , (b) anchor plate dimension d p l a t e , (c) horizontal eccentricity e x , (d) vertical eccentricity e y , (e) punch dimension d p u n c h , (f) loading angle α , (g) aspect ratio A R , (h) graphical sketch of the parameters.
Geosciences 13 00147 g005
Figure 6. Effects of the system (normalized) parameter on F ˜ r (dots markers) and δ ˜ r (triangles markers): (a) anchor spacing l x , (b) anchor plate dimension d p l a t e , (c) punch dimension d p u n c h , (d) loading angle α . Red and magenta lines represent the considered fits. The contour plots show the effects of (e,f) the punch eccentricity e x and e y and (g,h) the panel geometry on F ˜ r and δ ˜ r (solid red lines indicate panels with a constant area and white dashed lines a constant A R ).
Geosciences 13 00147 g006
Figure 7. Comparison of the force distribution on the mesh wires between cases (a) A R = 1.78 and (b) A R = 0.56 . The force values are normalized on the limit force of each wire type. Both force distributions correspond to an instant prior to the mesh failure.
Geosciences 13 00147 g007
Figure 8. Master curve (red solid line) obtained from the numerical data (cyan solid lines).
Geosciences 13 00147 g008
Figure 9. Comparison of the F δ response of the system between ex-post simulations and predictions of the analytical model. The layouts parameters are reported in Table 2.
Geosciences 13 00147 g009
Figure 10. Relative errors on (a) F r , (b) δ r , and (c) root-mean-square error (RMSE) on the force−displacement trend.
Geosciences 13 00147 g010
Table 1. Considered layouts for the DEM analyses.
ParameterRangeNormalized RangeReference Value
Length side l x (m) 2 ÷ 4 (step 0.25 m) 0.67 ÷ 1.3 3 m
Anchor plate size d p l a t e (cm) 12 ÷ 36 (step 2 cm) 0.6 ÷ 1.8 20 cm
Eccentricity e x , e y (cm) 0 ÷ 150 (step 25 cm) 0 ÷ 0.5 0 cm
Punching element size d p u n c h (m) 0.2 ÷ 2.5 (step 0.1 m) 0.2 ÷ 2.5 1 m
Punching element loading direction α ( ) 0 ÷ 75 (step 5 )- 0
Aspect ratio A R = l x l y (-) 2 4.25 ÷ 4.25 2 (step for l x , l y of 0.25 m)-1
Table 2. Considered layouts for the validation. The errors on F r and δ r are displayed in brackets.
l x AR d plate d punch e x e y F r   Equation (8) δ r   Equation (9) F r DEM δ r DEM
(m)(-)(cm)(m)(m)(m)(kN)(m)(kN)(m)
a2.51240.80035.0 (∼0%)0.83 (+1%)35.00.82
b312010034.2 (−8%)0.94 (−1%)37.30.95
c31.25241.20040.8 (−4%)0.85 (+1%)42.70.84
d3.51321.210.328.2 (+4%)0.87 (+6%)27.20.82
Disclaimer/Publisher’s Note: The statements, opinions and data contained in all publications are solely those of the individual author(s) and contributor(s) and not of MDPI and/or the editor(s). MDPI and/or the editor(s) disclaim responsibility for any injury to people or property resulting from any ideas, methods, instructions or products referred to in the content.