Article

Detecting and Predicting Archaeological Sites Using Remote Sensing and Machine Learning—Application to the Saruq Al-Hadid Site, Dubai, UAE

1
Earth Sciences Department, Khalifa University, Abu Dhabi P.O. Box 127788, United Arab Emirates
2
Geography and Planning Department, Sorbonne University Abu Dhabi, Abu Dhabi P.O. Box 38044, United Arab Emirates
3
Mohamed bin Zayed University of Artificial Intelligence, Abu Dhabi 144534, United Arab Emirates
*
Author to whom correspondence should be addressed.
Geosciences 2023, 13(6), 179; https://doi.org/10.3390/geosciences13060179
Submission received: 9 May 2023 / Revised: 10 June 2023 / Accepted: 12 June 2023 / Published: 15 June 2023
(This article belongs to the Section Geophysics)

Abstract

:
In this paper, the feasibility of satellite remote sensing in detecting and predicting locations of buried objects in the archaeological site of Saruq Al-Hadid, United Arab Emirates (UAE) was investigated. Satellite-borne synthetic aperture radar (SAR) is proposed as the main technology for this initial investigation. In fact, SAR is the only satellite-based technology able to detect buried artefacts from space, and it is expected that fine-resolution images of ALOS/PALSAR-2 (L-band SAR) would be able to detect large features (>1 m) that might be buried in the subsurface (<2 m) under optimum conditions, i.e., dry and bare soil. SAR data were complemented with very high-resolution Worldview-3 multispectral images (0.31 m panchromatic, 1.24 m VNIR) to obtain a visual assessment of the study area and its land cover features. An integrated approach, featuring the application of advanced image processing techniques and geospatial analysis using machine learning, was adopted to characterise the site while automating the process and investigating its applicability. Results from SAR feature extraction and geospatial analyses showed detection of the areas on the site that were already under excavation and predicted new, hitherto unexplored archaeological areas. The validation of these results was performed using previous archaeological works as well as geological and geomorphological field surveys. The modelling and prediction accuracies are expected to improve with the insertion of a neural network and backpropagation algorithms based on the performed cluster groups following more recent field surveys. The validated results can provide guidance for future on-site archaeological work. The pilot process developed in this work can therefore be applied to similar arid environments for the detection of archaeological features and guidance of on-site investigations.

1. Introduction

Since launch, the advances realised by several remote sensors and technologies, such as the potential of providing systematic data over large areas, have led to satellite remote sensing being widely applied to various archaeological studies in several parts of the world [1,2,3,4,5].
The application of imaging radar to archaeological research is gaining momentum [1,6,7,8,9]. These data often offer direct detection of archaeological sites and indirect detection of areas of unknown human activity [10]. Remote sensing allows for regional surveys on a scale that would not be possible from the ground. This reduces the effort and time spent on conventional archaeological reconnaissance and surveys and ameliorates the quality of the intended outcomes. This is particularly valuable in areas that are inaccessible due to difficult or hazardous terrains, such as deserts [11,12].
Research has been performed on the applicability of spaceborne imaging and radar to archaeological surveys focused on geological investigation and vegetation assessment and mapping [7]. While wetland archaeology has placed the focus on vegetation discrimination [13,14], archaeological research in arid environments has emphasised geological applications [15,16,17] and the detection of cultural heritage sites, shedding light on early civilisations about which little is known through the use of direct methods such as surveys, excavations, and dating techniques and/or indirect methods including ground-penetrating radar and aerial photography [6,18].
A major problem in remote sensing studies of arid and semi-arid environments such as the United Arab Emirates (UAE) is the deterioration of the image content by dust particles or cloud cover [19]. The development of radar sensors and signal penetration abilities throughout the atmosphere have precluded this difficulty [7].
Moreover, the application of AI machine learning and deep learning-based classification of remote sensing data has advanced the detection and mapping of archaeological features in arid environments, making the process more accurate and automated [20,21,22].
The study area (Saruq Al-Hadid site, Dubai, UAE) is contained within the Rub’ Al-Khali (the Empty Quarter), a sand desert containing large areas covered by dry sand sheets, sand dunes, and drift sand. Archaeological fieldwork and post-excavation analyses were conducted by several authors e.g., [23,24,25,26,27,28]. However, a very limited number of studies have approached the site using satellite remote sensing [29].
To the best of the authors’ knowledge, the current study is the first to use advanced image processing and machine learning techniques for the detection, prediction, and guidance of archaeology within the area of interest and the Rub’ Al-Khali desert since the pioneering work by Blom et al. [18] which coupled radar remote sensing technologies with traditional archaeology, giving insight into the ancient southern Arabian frankincense trade, including the discovery of the “lost city of Ubar” in present-day Oman. This pilot study is thus incentivised by the main objective of setting up a benchmark for the development of national and regional remote sensing archaeology capabilities while automating the process and investigating its potential errors and accuracy before generalising it to larger areas.
The approach proposed to achieve this objective is based on the hypothesis that the artefacts discovered so far in the study area were produced on site, which might indicate the possible presence of buried settlements in the surroundings of the Saruq Al-Hadid site used by ancient indigenous workers. The methods used to implement this approach are motivated by recent trends in archaeological prospection, remote sensing, artificial intelligence (AI), and machine learning (ML). Results from the implementation of these methods are presented and discussed. The outcomes are expected to be enhanced with the integration of suitable archaeological training and testing data and with the broader application to similar environments.

2. Materials and General Approach
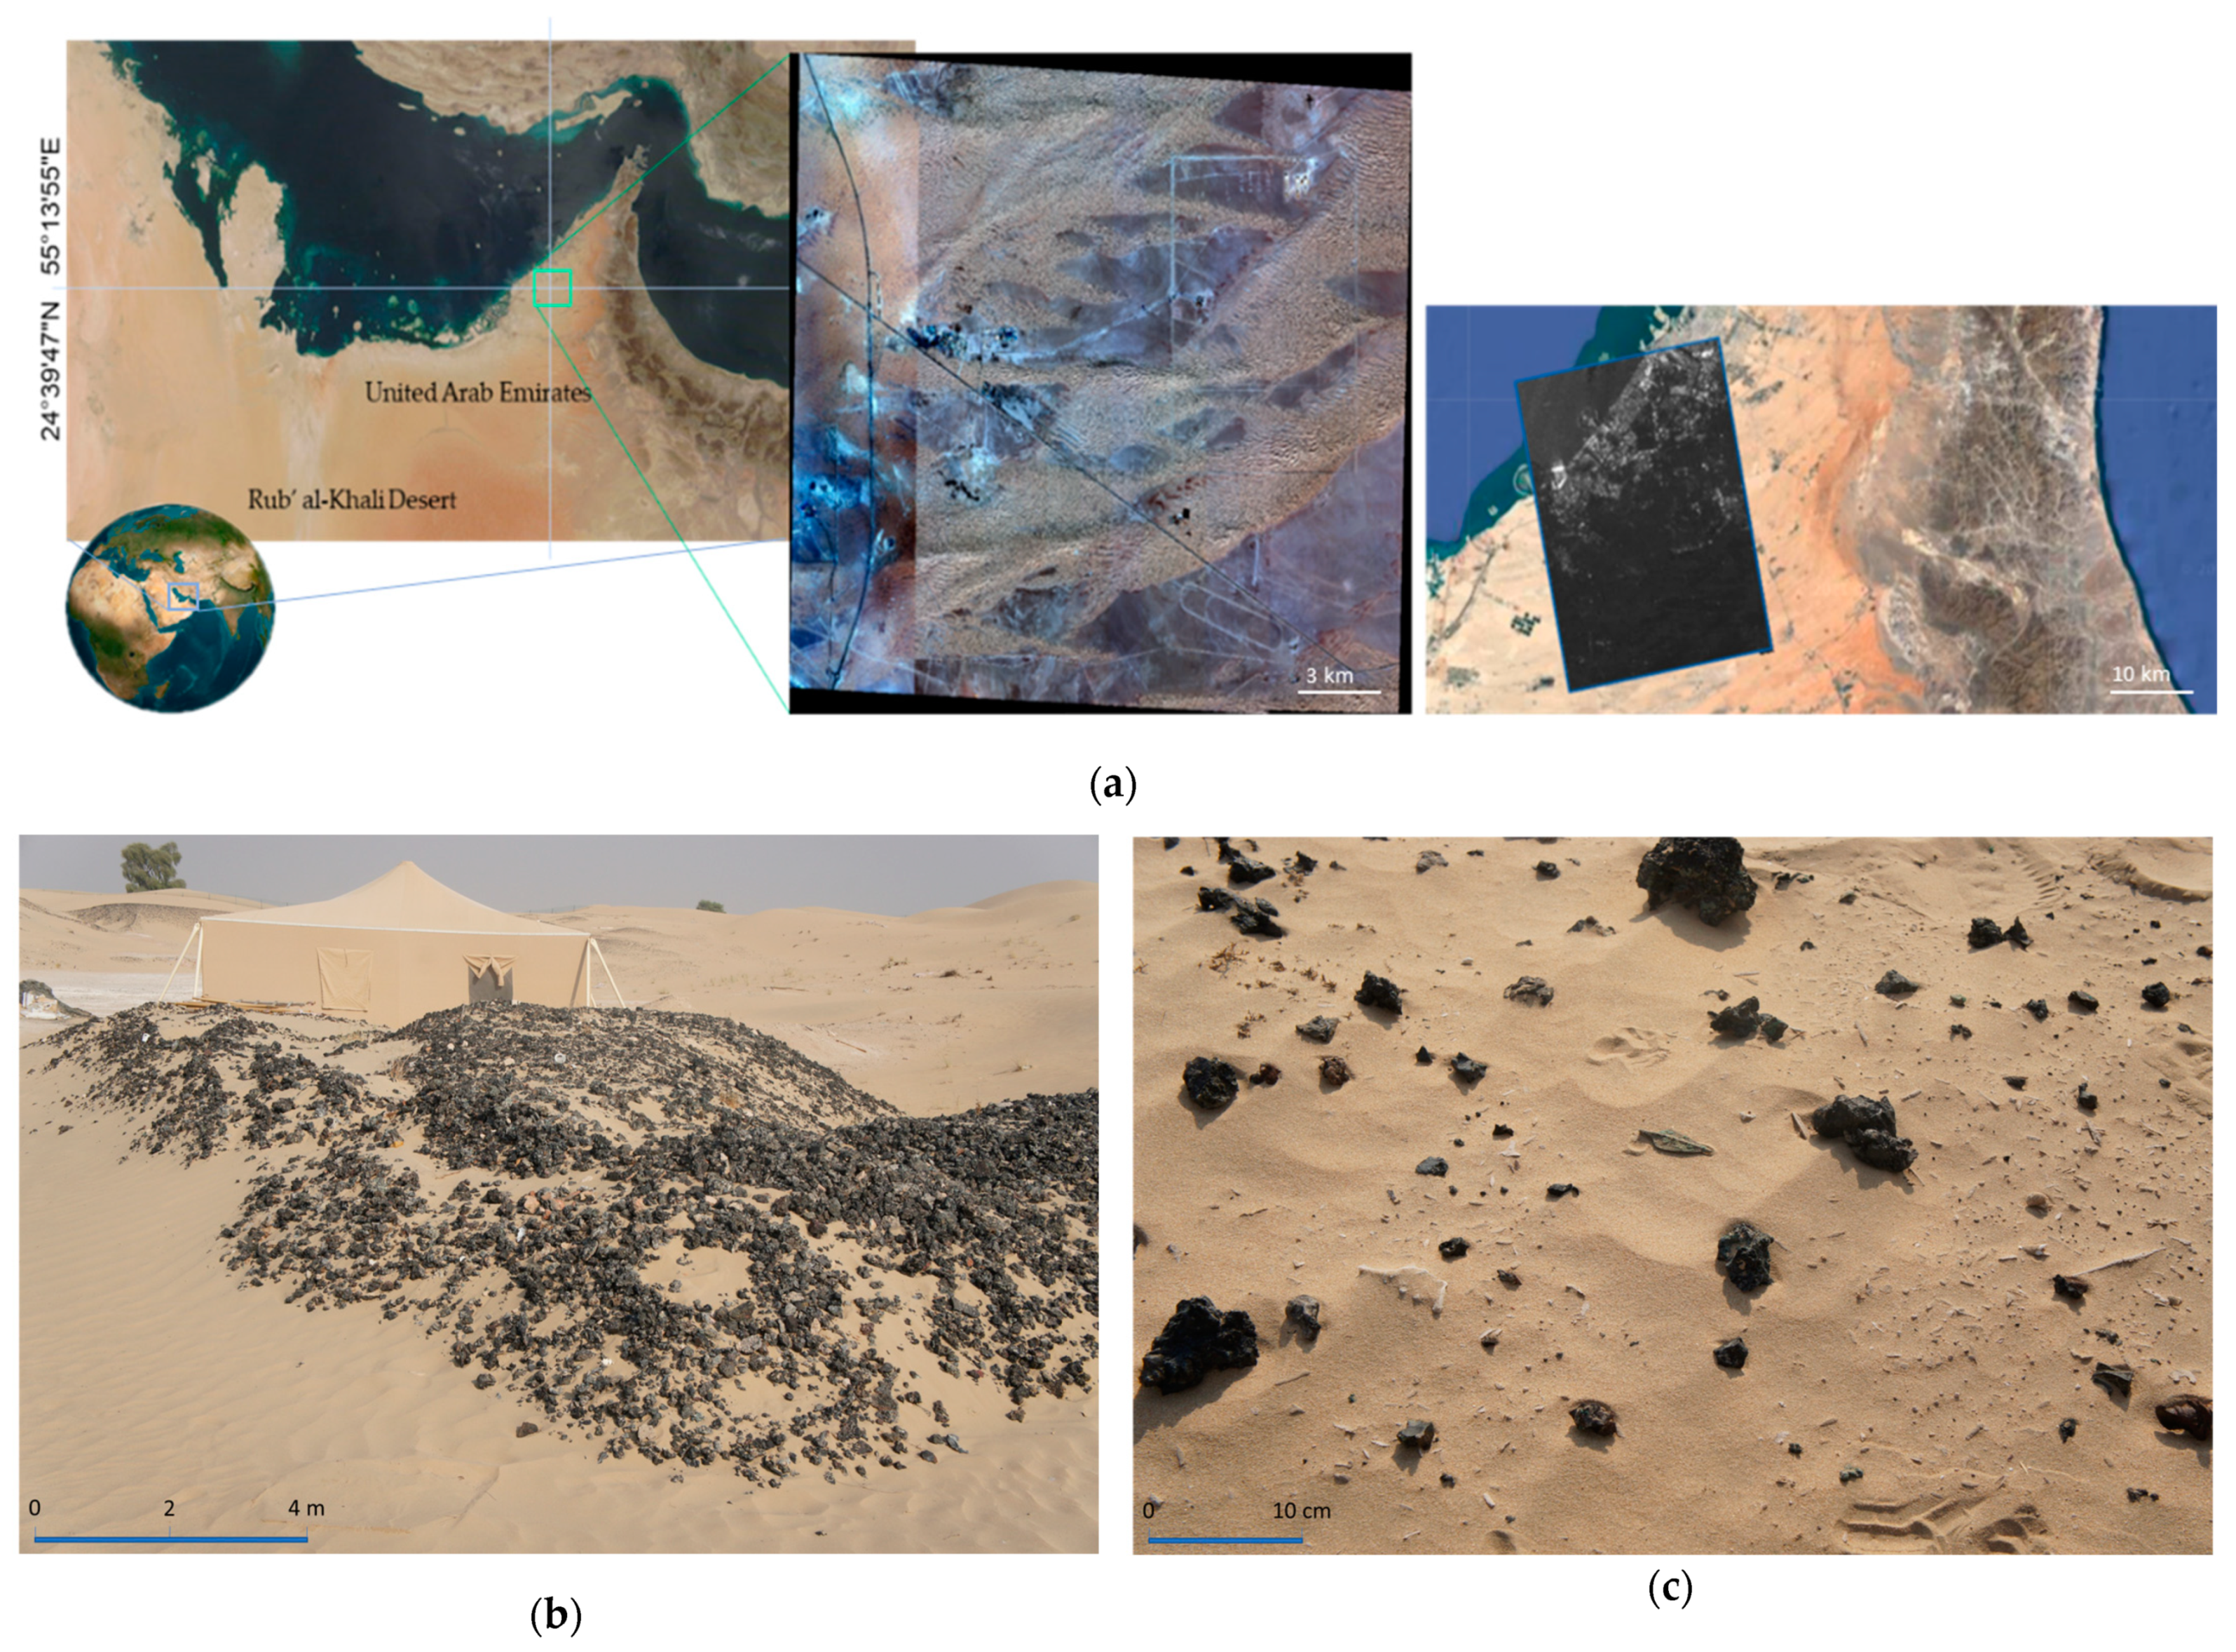
2.1. Study Site

Saruq Al-Hadid (“Valley of iron”) archaeological site (24°39′47″ N, 55°13′55″ E) is located within the northern extension of the Rub’ Al-Khali desert on the southern border of Dubai, UAE (Figure 1a). It is characterised by active dune fields and considered one of the most unique and important archaeological sites uncovered in the past few years in the UAE [25]. In fact, it represents one of the main centres for copper smelting, manufacturing tools, and various utensils in the region since the beginning of the Second Iron Age (1270–800 BC) [27]. It is characterised by the presence of thousands of archaeological artefacts spread over an area of >1 km2 and buried within and beneath dunes up to 6 m deep (Figure 1b,c).

2.2. Geological and Stratigraphic Setting

The lithology of the study area consists of (from youngest to oldest): linear longitudinal dune landforms (mostly low dunes) and dune ridges, with large interdunes underlain by variably dolomitised sandstone, siltstone, and conglomerate of the Barzaman Formation (Miocene) or the Quaternary fluvial sandstones, conglomerates, and carbonate sandstones of the Hili Formation [30]. The dunes vary in height by up to ~20 m. Previous studies e.g., [31] and field observations conducted in 2015 showed that between the two areas of large Barchanoid ridges there are smaller dune ridges, aligned broadly east-west, which cover the site compound and the land to the immediate east (Figure 2a,b).
During the geological field survey, it was observed that the Barzaman Formation outlines the rockhead across most of the area and is locally well exposed in interdune areas. Additionally, carbonate-rich Ghayathi Formation aeolianites were observed to form distinctive palaeodune ridges that trend southwest–northeast across the area, particularly to the west and northwest. These observations align with statements made by other authors [25,30,31], who determined deposits of up to 7 m of stratified layers well conserved beneath the protective crust of slag (Figure 2c). The comprehension of the geological and stratigraphic setting of the study site will complement the geospatial analysis and interpretation conducted in Section 3.3.

2.3. Datasets

2.3.1. Worldview-3

The Worldview-3 satellite sensor is a multispectral Earth-observing satellite that is owned and operated by space technology firm Maxar Technologies Incorporated to collect, in addition to the standard panchromatic and multispectral bands, eight-band short-wave infrared (SWIR) and 12 CAVIS imagery. The Worldview-3 satellite provides 0.31 m panchromatic resolution, 1.24 m multispectral resolution, 3.7 m short-wave infrared resolution (SWIR), and 30 m CAVIS resolution. The satellite has an average revisit time of <1 day and can collect up to 680,000 km2 per day [32]. Such high spatial and spectral resolutions are anticipated to assist archaeological applications such as feature and elevation data extraction and soil classification in a cost-effective manner. Three scenes from January, August, and November 2019 were acquired to cover the study site (Figure 1a). Analysis and interpretation of these imagery data are performed in Section 2.4 and Section 3.1.

2.3.2. ALOS-2/PALSAR-2

The PALSAR-2 aboard the Advanced Land Observation Satellite 2 (ALOS-2) is a synthetic aperture radar (SAR) operated by the Japanese Aerospace Exploration Agency. It transmits and receives the L-band microwave characterised by deeper penetration of the SAR signal in dry sand cover overlying potential buried structures [33]. PALSAR-2 demonstrated its usefulness in achieving high-resolution wide-swath width and image quality (lower noise floor and range ambiguities) by expanding its transmission power and bandwidth and adopting new technologies such as dual-beam receivers, complex chirp modulations, and highly efficient data compression [34]. The Committee on Earth Observation Satellites (CEOS) SAR format of PALSAR-2 stripmap high-sensitive mode full polarisation Level 1.1 data were acquired on 17 May 2015 over the Saruq Al-Hadid site (Figure 1a). These are complex numerical data on the slant range following compression of the range and azimuth. As one-look data, they include phase information and are the basis for later processing. In wide-area mode, image files are created for each scan. The image is fully (quadratic) polarised and comes in single-look complex (SLC) data format. The resolution is approximately 4.3 m (high-sensitive, range resolution 6.0 m/azimuth resolution 4.3 m). Analysis and interpretation of these imagery data are performed in Section 2.4 and Section 3.2.

2.4. Approach

Satellite data and geographic information system (GIS) data from historic and recent maps were blended for a comprehensive geospatial analysis of the site and its geographic context to examine the current archaeological site in its historic context and provide prediction and guidance for new potential sites in the UAE. Data blending involved integrating information from multiple sources with different data characteristics, resolution, and limitations. To ensure a maximum of compatibility and consistency among the used datasets, techniques such as georeferencing and spatial alignment, data format standardisation, colour balancing, resampling, coregistration, etc. were applied. Satellite image analysis required the acquisition, analysis, and interpretation of Worldview-3 and ALOS-2/PALSAR-2 data. Geospatial analysis required the use of AI using ML to automate the classification, clustering, spatial pattern detection, and multivariate prediction of these data. Figure 3 summarises the approach followed in analysing and interpreting the original and transformed multispectral and radar data. Image visualisation and processing were performed using the Exelis® ENvironment for Visualising Images (ENVI) interface and Interactive Data Language (IDL) version 5.3 (Exelis Visual Information Solutions, Boulder, CO, USA). ENVI/IDL handled all pre- and post-processing work for the multispectral and SAR images. Figure 4 summarises the approach undertaken during the geospatial analysis process. Processing of the geospatial input data using AI and ML algorithms was performed following the steps shown in Figure 5. ESRI® ArcGIS Pro platform version 3.0.0 (Redlands, CA; Environmental Systems Research Institute) supported these tasks by providing the tools for the deep learning (DL) workflow, which involved data labelling and preparation, training models and deploying them for inferencing, and disseminating results.

3. Methods and Results

Results from the processing and analysis of the multispectral and radar data are presented and discussed first. Geospatial modelling and analysis are presented and discussed later.

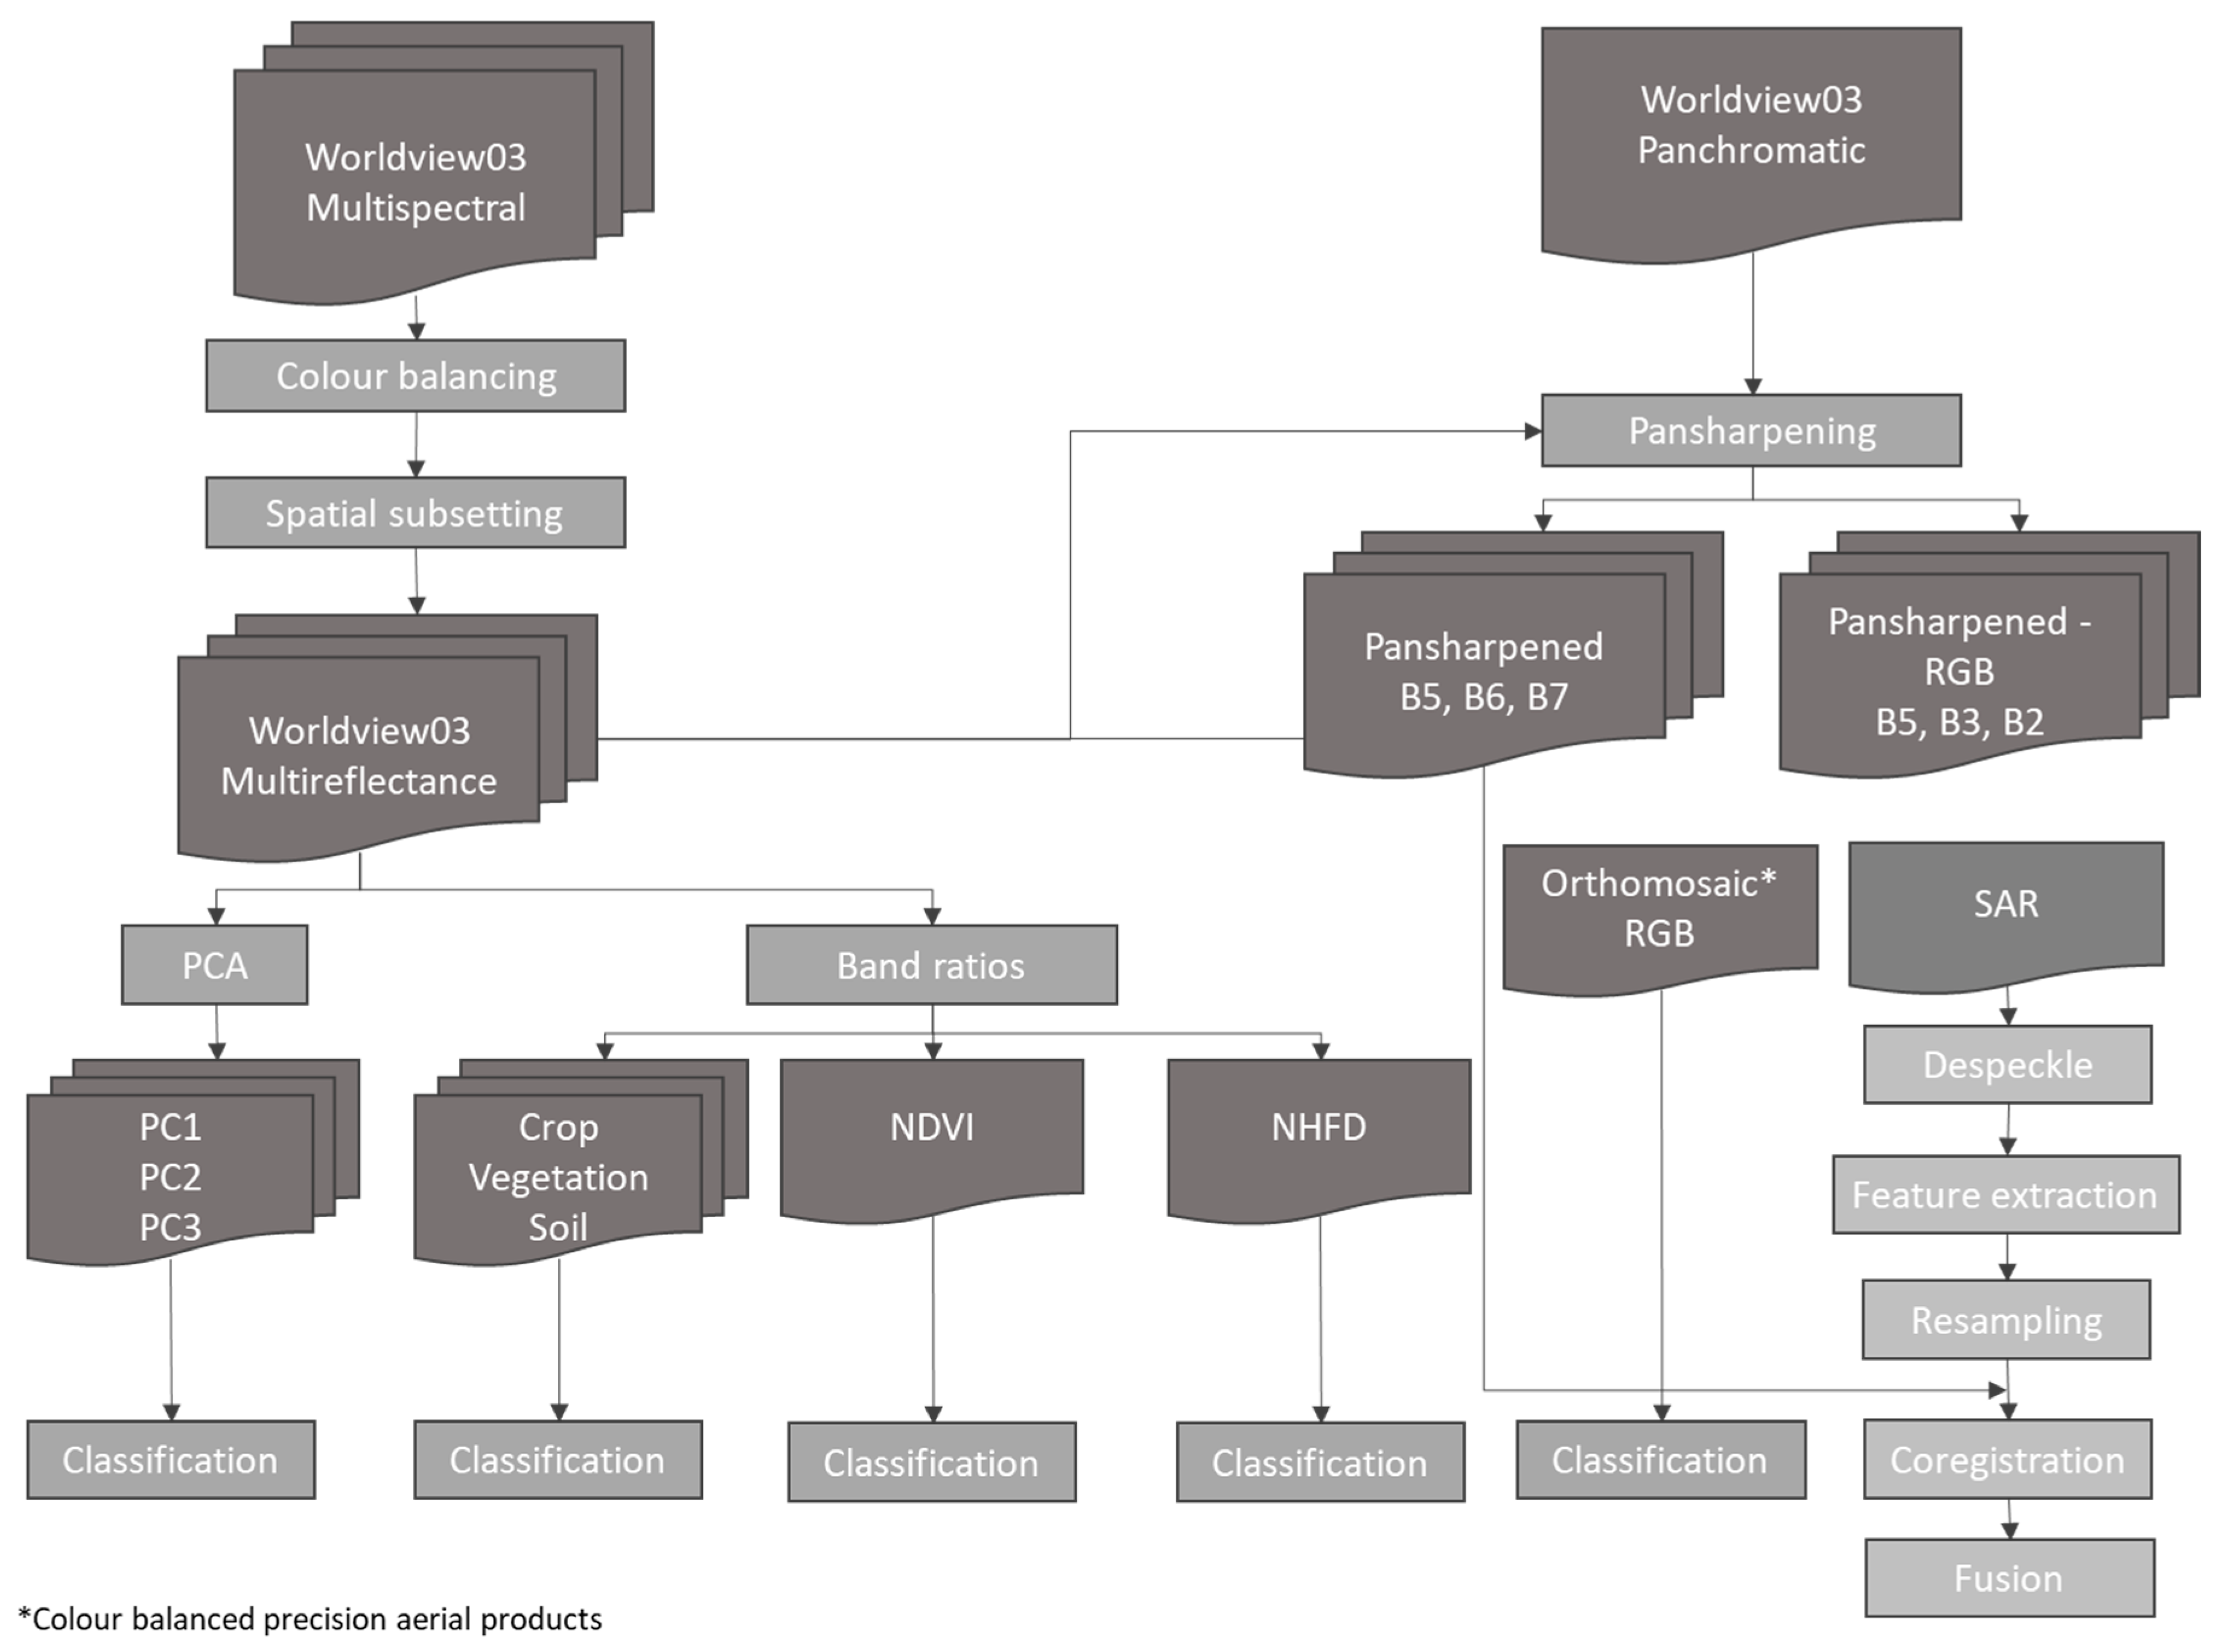
3.1. Spectral Analysis and Classification of Multispectral Data

Worldview-3 multispectral data were used to produce a very high-resolution mosaic (true colour) of the Saruq Al-Hadid site and surrounding areas. Image visual analysis and interpretation were performed after localisation of the site based on the produced orthomosaic. Figure 6 shows a Worldview-3 red-green-blue (RGB) orthomosaic of the Saruq Al-Hadid site located in the mobile dune fields of the northeastern edge of the Rub’ Al-Khali desert, captured on 26 November 2019. The orthomosaic is colour-balanced within the region tiles to minimise the colour differences due to side-to-side shading, contrast variations, time of day, sun angle, atmospheric conditions such as haze, and the use of multiple cameras over multiple days among adjacent region tiles.
Previous and ongoing excavations at several of the Saruq Al-Hadid areas, as reported by [26], were located on the multispectral images (Appendix AFigure A1). Appendix AFigure A2a–c shows some remarkable spots and locations identified in the western zone of observation of the site based on the produced orthomosaic. Appendix AFigure A3 shows some remarkable locations in the eastern zone of observation.

3.1.1. Feature Mark Detection Using Principal Component Analysis (PCA) and Spectral Band Transformation

Prior to classifying the site thematically, principal component analysis (PCA) was performed. PCA is one of the most conventional unsupervised feature extraction methods which extracts features with the largest power [35]. PCA discards the components of data with small variance, while components with small variance may have useful information for discrimination between classes in the classification process. In other words, it helps in finding a low-dimension set of axes that summarise data so that the informative components for classification are extracted instead of being discarded. The produced principal components (PC) are shown in Appendix BFigure A4. Statistical investigation confirmed that most information is contained in the first three PCs (Appendix BFigure A5).
The site contains drought-tolerant floral species. Indeed, the site has Prosopis cineraria trees, also known as Ghaf. Ghaf are particularly present within the interdunal area and are used as biological indicators to support the geospatial analysis in delineating the geomorphological classes. At least 12 Ghaf trees are contained within the study area (Figure 6) and more are present within the surrounding area for which the geospatial modelling is generalised. In addition, relatively denser vegetation can be observed through the growth of shrubs across more than 17 species such as Rubiaceae, Solanaceae, Chenopodiaceae, and Ochradenus arabicus and more than 17 herbs and grass species such as Neuradaceae, Poaceae, and Cyperaceae, depending on the season (assuming the vegetation presence is more suitable to the adopted analytical and modelling approaches). Therefore, spectral band transformation was performed to produce indices such as the crop vegetation soil index, the normalised difference vegetation index (NDVI), and the normalised high-frequency difference index (NHFD) for archaeological prospection and detection of anomalies related to buried archaeological structures [36] (Appendix CFigure A6). Both NHFD and NDVI bands provide valuable information for archaeological remote sensing, but they serve different purposes. NHFD emphasises the detection of archaeological structures and materials based on their spectral characteristics, while NDVI focuses on identifying areas of interest based on vegetation patterns. Integrating the techniques diagrammed in Figure 3 is expected to enhance the effectiveness of the adopted approach. In fact, these techniques were demonstrated to be effective in allowing researchers e.g., [37,38,39], to identify potential sites and prioritise areas for ground-based investigations more efficiently.

3.1.2. Multimodal Analysis: Classification and Geocontextualisation

In the absence of user-defined training classes, unsupervised classification was performed to cluster pixels in a dataset based on statistics using only the ISODATA algorithm. ISODATA unsupervised classification calculates class means evenly distributed in the data space, then iteratively clusters the remaining pixels using minimum distance techniques [40]. Each iteration recalculates means and reclassifies pixels with respect to the new means. This process continues until the number of pixels in each class changes by less than the selected pixel change threshold or the maximum number of iterations is reached. Classification aggregation was used to aggregate smaller adjacent class regions to a larger region. Post-processing, including smoothing and aggregation, was performed to improve the classification results. Aggregation is a useful post-classification clean-up process when the classification output includes many small regions, which is true for the studied area. Classification of the first three PC (PC1, PC2, and PC3) after enhancement and aggregation was performed, including various classes (Figure 7a). Analysis and investigation of the different results have led to the identification of two major categories of classes: “Water classes”—Classes 1 to 3; and “Excavation classes”—Classes 20 to 22 (Figure 7b). This unsupervised classification is complemented with multimodal (geostatistical, geophysical, and ground truth) data, in addition to user expertise and familiarity with the study area for more advanced contextual re-classification in Section 3.3.4.
Multimodal analysis and user expertise [41] were used for studying local relief gradients in the context of geophysical field verification. Local relief gradients refer to the variations in elevation or slope within a specific area. By applying multivariate statistical techniques, insights into the spatial patterns and relationships between different relief features are gained, which proved useful in archaeological investigations [42]. The multivariate statistical method applied to local relief gradients for field verification included the following steps.
  • Data collection
Data on local relief gradients within the study area were collected. This involved the use of surveying equipment such as handheld Global Positioning System (GPS) receivers (Garmin 62S GPS, Garmin International, Olathe, Kansas, USA—~3 m horizontal resolution 95% of the time) and data from the existing topographic grids set by the site archaeologists e.g., [43], using total stations to measure elevation and slope at multiple points across the landscape.
  • Data pre-processing
This involved organising the data into a structured form, a matrix where each row represents a sampling point and each column represents a variable (e.g., elevation, slope, aspect). Additional qualitative attributes, such as vegetation cover or soil characteristics, were also included where relevant.
  • Exploratory data analysis
Before applying multivariate statistical techniques, data were explored to understand their characteristics. This involved visualising the data using scatterplots and contour maps to identify any outliers, trends, or patterns, e.g., dune patterns. Exploratory data analysis helped in identifying potential relationships between variables, e.g., Ghaf trees and dune ridges.
  • Multivariate statistical analysis
The multivariate statistical technique applied to analyse local relief gradients was the PCA and cluster analysis, i.e., ISODATA. These techniques helped to identify underlying patterns (e.g., dune patterns), group similar areas (e.g., metal working slags), differentiate between different relief types, and assess the spatial relationships between variables.
  • Interpretation and field verification
Once the multivariate statistical analysis was performed, the results were interpreted in the context of the research objectives, i.e., archaeological guidance. The identified patterns and relationships could provide insights into the landscape’s geomorphological processes, human activities, and site geological formation processes (Barzaman Formation (Miocene) or the Quaternary fluvial sandstones, conglomerates, and carbonate sandstones of the Hili Formation, etc.). Field verification was crucial to confirm the interpretations made based on geostatistical analysis. However, this verification is limited by natural spatial heterogeneity with diverse and dynamic relief features (e.g., sand dunes) and by data collection challenges such as the inevitable discrepancy in resolution of the multisource data (e.g., the difference among the remote sensing data and the field observations’ spatial resolutions). This challenge is expected to be remedied when differential GPS is deployed during future site visits.
  • Integration with other data sources
Multivariate analysis on local relief gradients was combined with other geospatial data sources such as multispectral and radar imagery, GIS data, and reported archaeological artefact distributions and historical records. Integrating multiple data sets provides a more comprehensive understanding of the landscape and facilitates the identification of potential archaeological sites or features [44].
Despite the limitations stated above, by applying this integrative and multimodal analysis, better quantitative and spatial understandings of the landscape’s topographic characteristics are gained. When combined with further geospatial analysis (Section 3.2 and Section 3.3), these insights are expected to formulate more informed research strategies for further archaeological investigations, thereby fulfilling the main objective of the study.

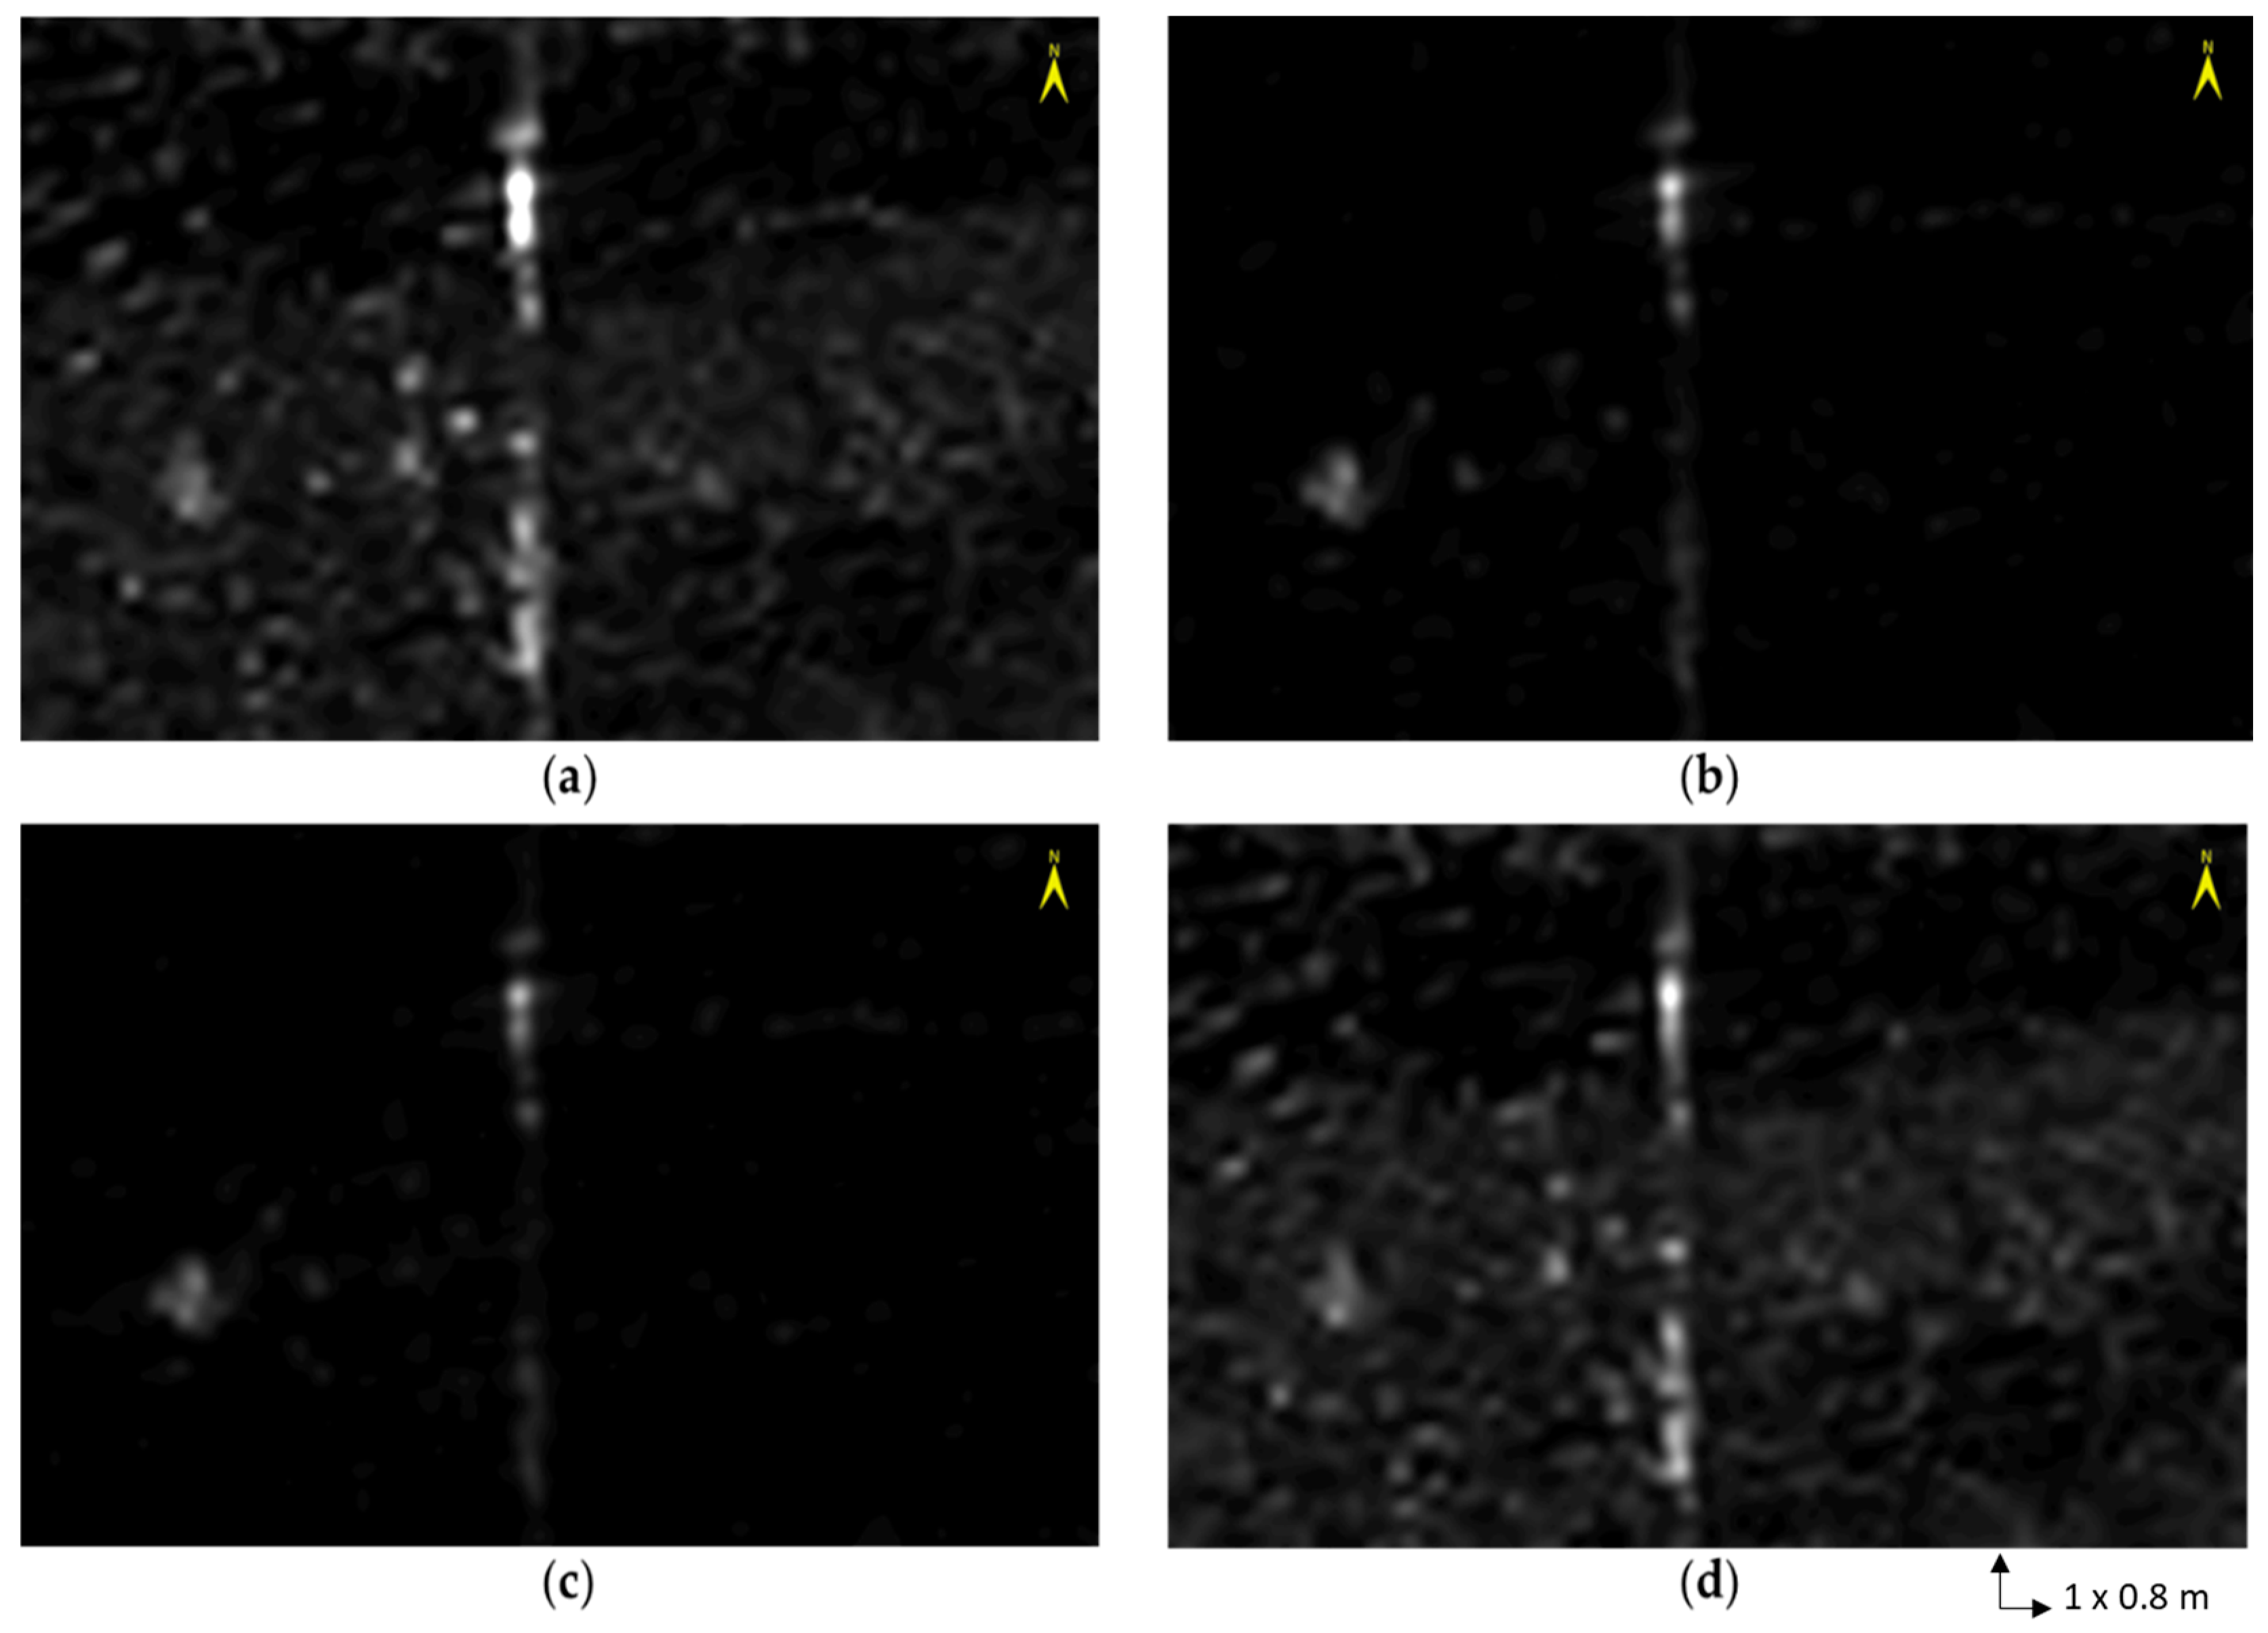
3.2. Processing and Analysis of Synthetic Aperture Radar Data

3.2.1. Pre-Processing for Data Calibration and Intensity Processing

ENVI-integrated SARscape tools were used for the SAR image visualisation, analysis, and processing, such as digital elevation model (DEM) generation. Looks are the sub-images formed during SAR processing. Pre-processing for data calibration was performed to obtain magnitude data. Intensity processing of SLC data (having a rectangular shape of pixels) was performed. A multi-look operator was used with a window of m = 5 pixels in row and n = 1 pixel in column, thus transforming the product into a more familiar geometric visualisation. ENVI produces an intensity image of each input file with four range looks and nine azimuth looks. The range resolution is 24.550900 m, and the azimuth resolution is 22.771800 m.

3.2.2. Image Speckle Filtering

The use of advanced image processing is central to the utilisation of any remotely sensed data for archaeological studies. It is unrealistic to define features at the pixel scale in undespeckled imagery; statistically based algorithms can accomplish this despeckling with minimal loss of detail. SAR images are characterised by speckle. Speckle is a spatially random multiplicative noise due to coherent superposition of multiple backscatter sources within a SAR resolution element [7]. Image speckle filtering was conducted to correct the speckle potential to corrupt the polarimetric observables (phase and intensity). A specific procedure, Lee adaptive filter [45,46], was used to retrieve relevant polarimetric information and to reduce the randomness of the acquired signals. Lee’s filter determines the unspeckled intensity estimate that minimises the mean squared error (MMSE). This MMSE filter is based on a linearised speckle model. The Lee filtering results are shown in Appendix DFigure A7a.

3.2.3. Digital Elevation Model Extraction and Geocoding

SAR systems measure the intensity and phase of the transmitted radar pulses following their reflection (backscatter) from the Earth’s surface. The data are recorded in a 2D coordinate system (slant-range geometry) onto which 3D objects on the Earth’s surface are projected. Geocoding of the SAR image was performed, i.e., 2D SAR coordinates were associated to 3D coordinates in given horizontal and vertical datums. Furthermore, radiometric calibration was conducted to make the radar intensity independent of the acquisition geometry and of the SAR processor. Co-registration was applied to the multiband sensor data layers. Devolution of mixed pixels into ground and vegetation components was also performed. Geocoding and radiometric calibration of the SAR data were performed using the global digital surface model (DSM) (horizontal resolution 1 arcsec) by the ALOS-Panchromatic Remote-sensing Instrument for Stereo Mapping (PRISM) (30 m ground resolution and 5 m elevation accuracy) (Appendix DFigure A7b). The produced DEM (30 m resolution) is used to better understand the environmental context and to create the slope map of the study site.

3.2.4. Creating the Slope Map from the Digital Elevation Model

Given the resulting 30 m DEM (Appendix DFigure A8), the slope is calculated in degrees (°) in the easting and northing directions (Appendix DFigure A9a). The output product is a floating complex datum where the real and imaginary parts are two floating format files containing the easting and northing slope components, respectively (Appendix DFigure A9b,c, respectively). The slope and elevation contribute as input data in predictive modelling as part of the subsequent geospatial analysis to assist in locating potential archaeological features.

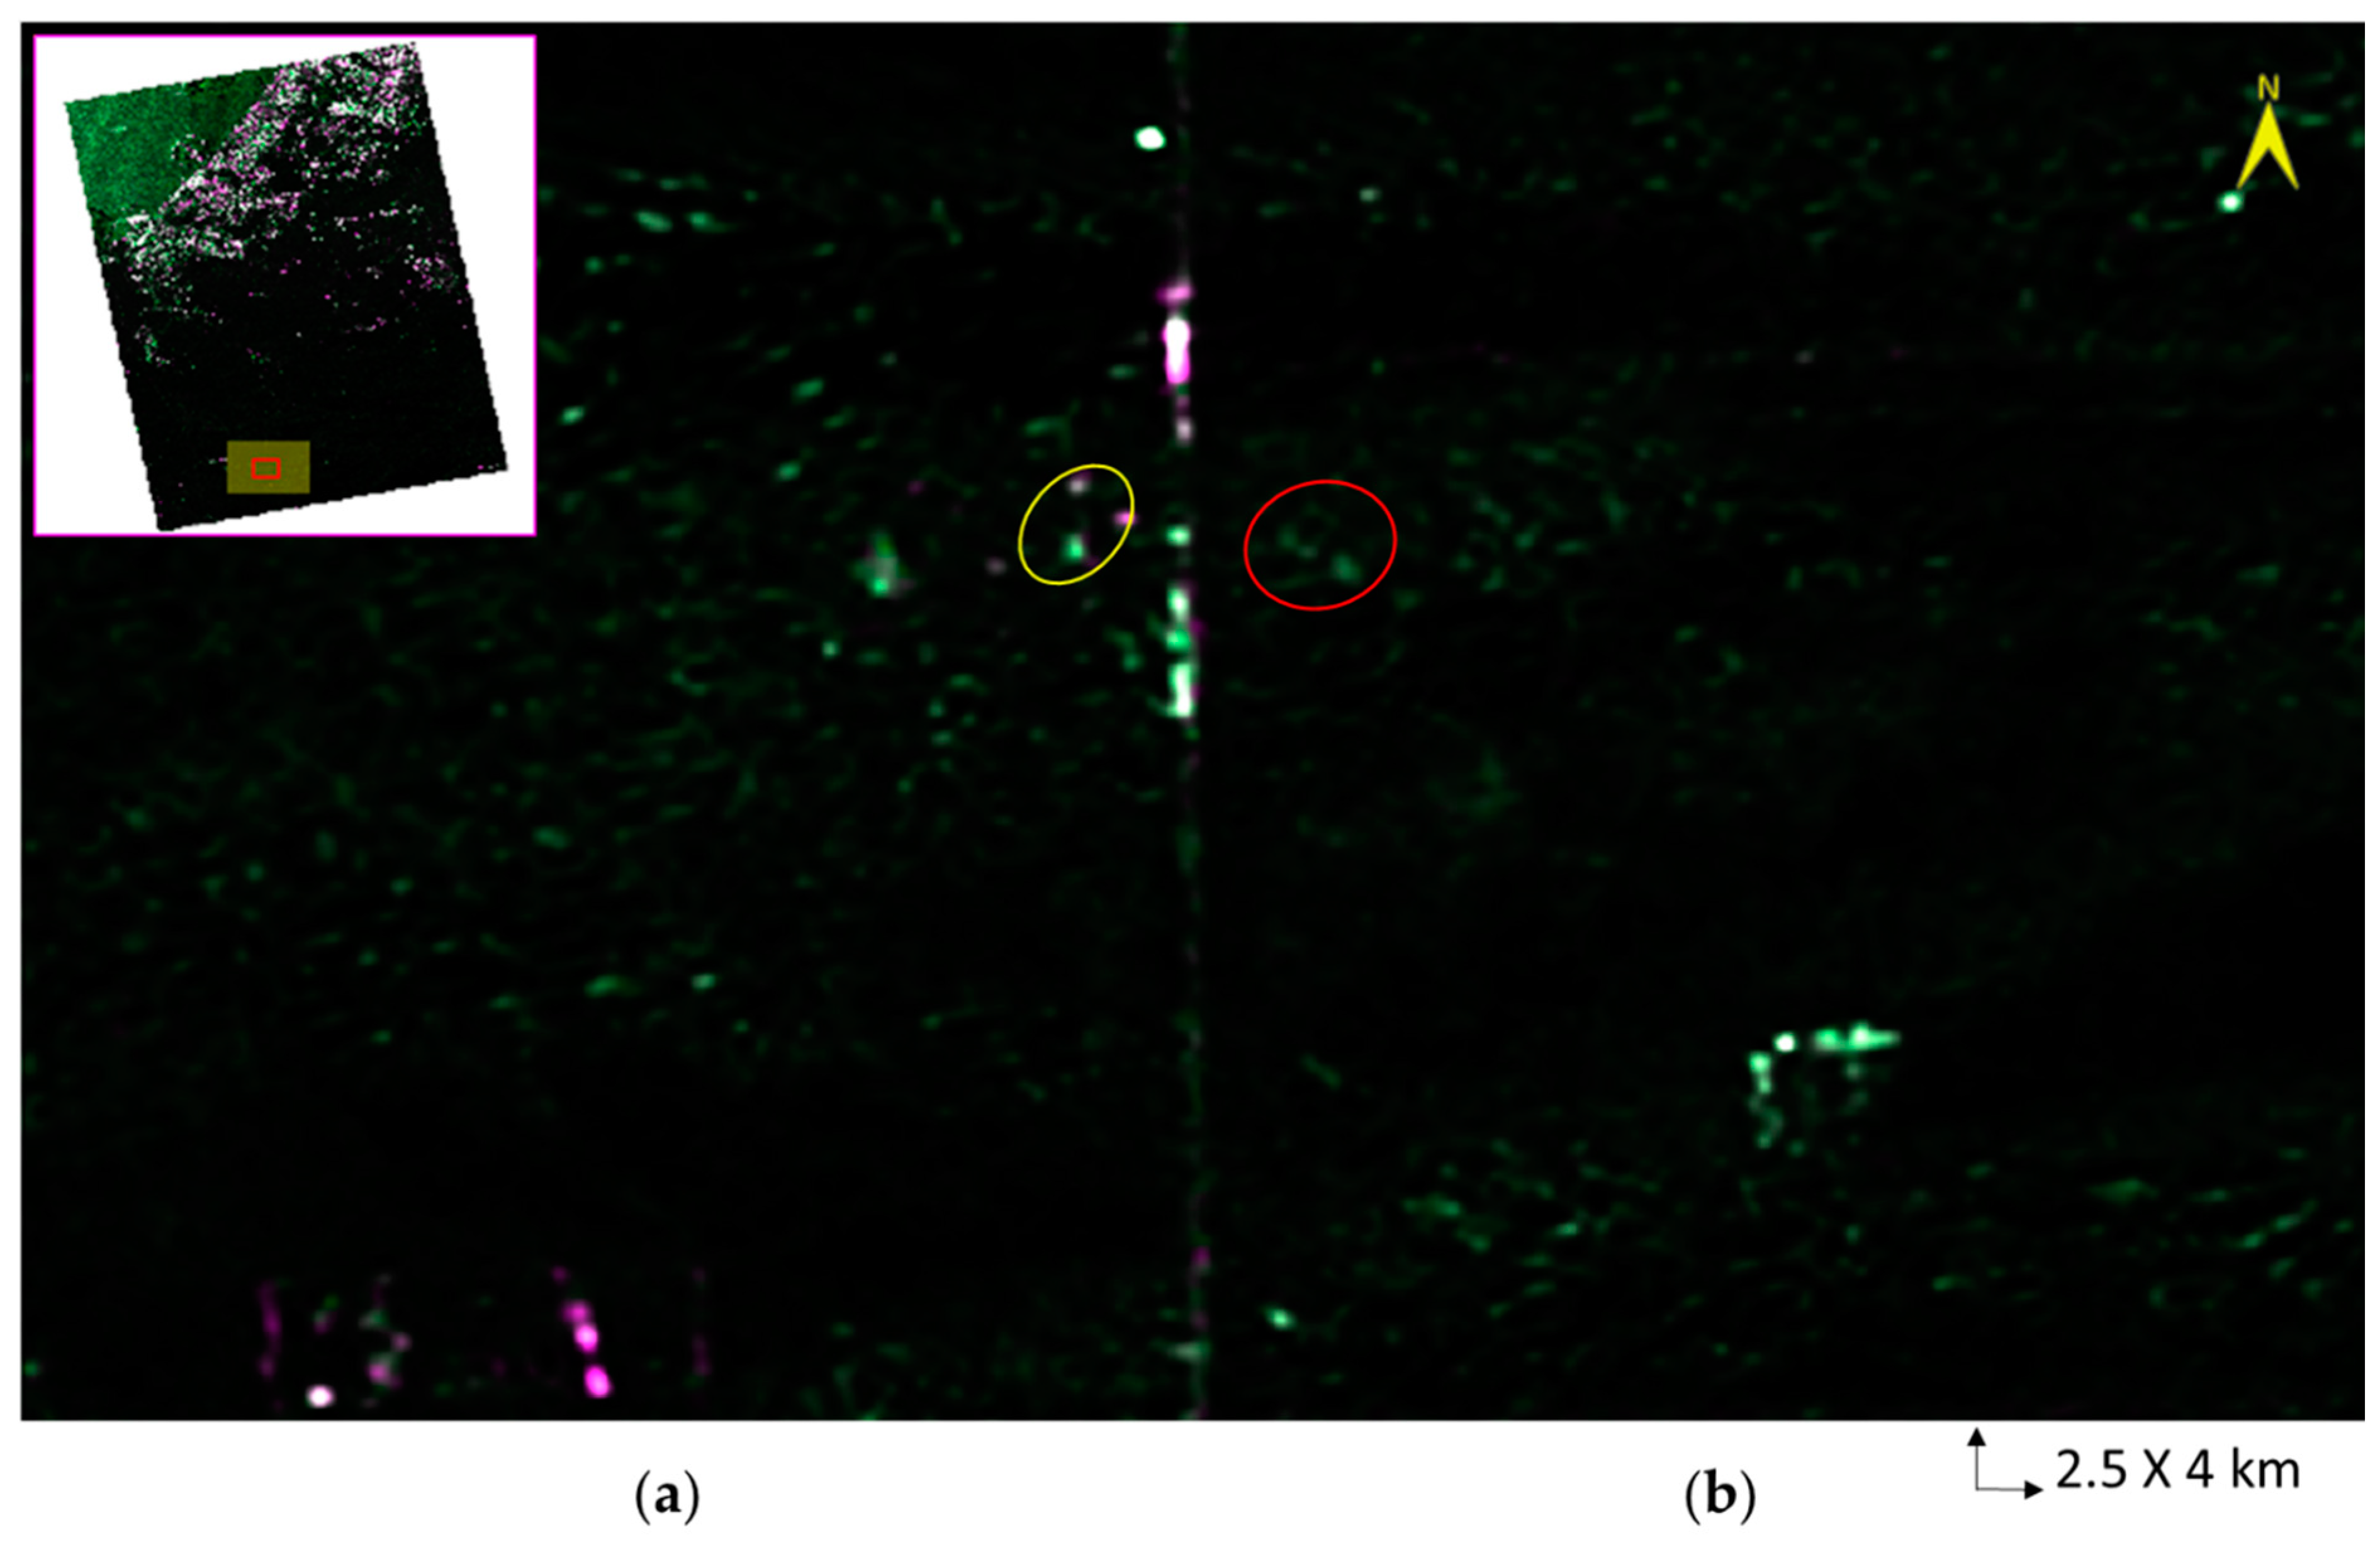
3.2.5. Single-Date Feature Extraction

Single-date features, based on first-order statistics, can be derived from SAR intensity data. Depending on the targeted product, these features facilitate detection and extraction of structures, which can be additionally used for segmentation and/or classification purposes. In desert regions, SAR’s properties, such as the transmissivity of dry sand to microwave wavelengths, the sensitivity of radar to roughness, and micro relief, are exploited for archaeological prospection [12,33]. The feature extraction uses one polarisation at a time (Exelis, 2016). The extracted features are represented using RGB composite showing three different values on the same image, assigning each one to a different channel (Figure 8). The standard deviation index (Std) is assigned to the red channel, the minimum index (Min) to the green channel, and the gradient index (Grad) (maximum absolute variation between consecutive acquisition dates) to the blue channel. Features of higher backscatter in comparison to the surrounding sand are present in both the western and eastern zones. As explained in Section 3.1.2, during the field survey the types of sediments were identified using lithostratigraphic data of previous archaeological reports. Areas of archaeological artefacts and remains are differentiated from areas covered by modern constructions. A comparison of these intermediate results with the optical imagery identifies the high relative backscatter features of the manmade road that separates both zones and the excavation camps. The backscatter properties of artificial linear objects (roads, excavation camps) and of known natural linear objects (sand dune ridges) are similar. This is in conformity with results communicated by other works such as the feature extraction research for archaeological application conducted by Stewart et al. [33] in the North Sinai Desert. In the literature e.g., [47,48,49], features of low relative backscatter possibly correspond to archaeological structures such as buried valleys, geologic structures, and possible prehistoric age occupation sites. Analysis of SAR data is complemented by geospatial analysis to further assess this prediction.

3.2.6. Post-Processing of Synthetic Aperture Radar Data

The main objective of this task was to make archaeological features and sites more visible in imagery to facilitate the generalisation of the approach to similar environments for the detection of archaeological sites while simplifying and reducing field surveys and efforts. The main archaeological features that are expected to be detected within the studied area and similar environments are sludges and metal crafts remains of ~15 m × 15 m surface appearance, wells stone-built orifices of ~1 m diameter, and remains of stone-built structures of irregular ~2 m × 3 m surface with undefined patterns [25] (Weeks et al., 2017). The selected high-sensitive fully polarised SAR data of ~4.3 m resolution (6 m Rg × 4.3 m Az) and 50~70 km swath are well suited to revealing such archaeological features and structures [50,51].
In order to achieve this objective, different combinations of the different polarised bands (HH, HV, VH and VV) [50] (Figure 9) and of the different extracted features (Section 3.2.5) were examined with reference to the content displayed in Appendix AFigure A1 to visually explore the site and its surrounding environment. The best combination is shown in Figure 10, when L-band imagery composite was produced from the three polarised bands (HH, VV, and HH) displaying the majority of the locations explored in Section 3.1. Using this band combination, attempts were made to extend the search area to show new potential archaeological sites to help in guiding the excavation in Saruq Al-Hadid. There are, however, great impracticalities in utilising this “trained eye” approach, the main issue being that not all eyes are equally trained. Moreover, an image may or may not reveal site locations acceptably depending upon the peculiarities of the monitoring display. Brightness is a relative term and is unquantified in the “trained eye” approach.
Consequently, geospatial analyses of the multispectral and SAR data were performed using AI and self-supervised ML techniques for the classification and multivariate clustering of the data in order to understand the spatial distribution of the different elements extracted by the GIS process. Results are described and discussed in the next section.

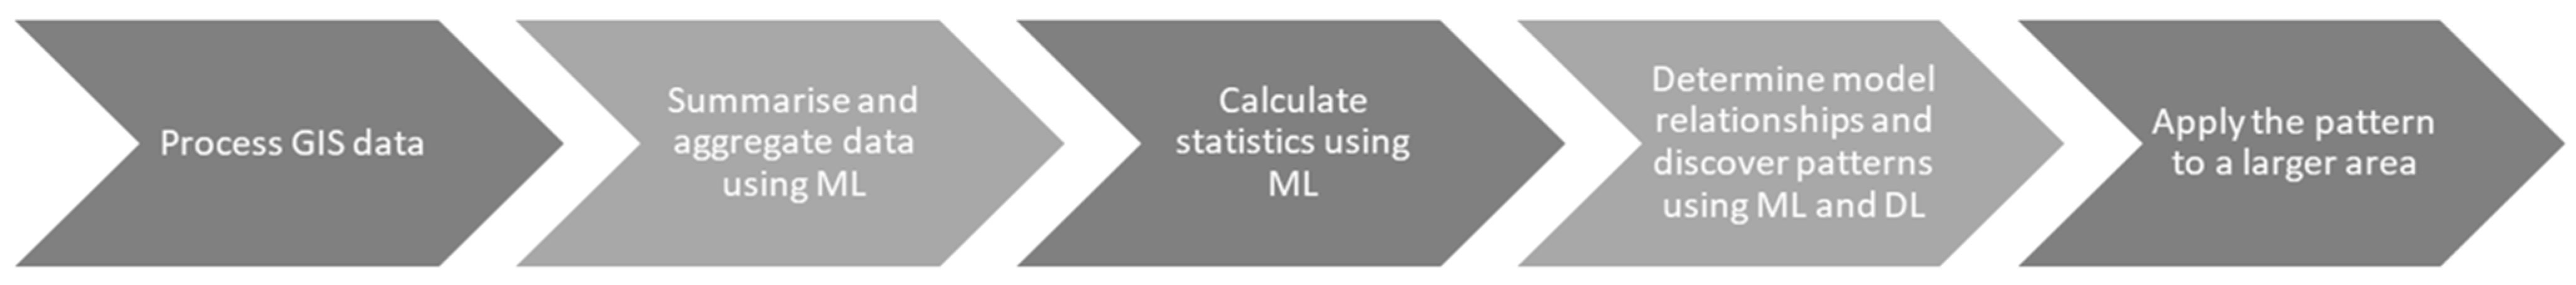
3.3. Geospatial Analysis of Multispectral and Radar Data Using AI and ML

The main objective of this analysis was to create spatial statistics to describe and model the spatial distribution, patterns, processes, and relationships among the various spatial elements of the archaeological site. The results and findings are intended to be generalised to a larger area to predict and guide new potential archaeological sites and activities. The observations collected over Saruq Al-Hadid were clustered based on similarities of values. Then, they were used to generate a model using PCA. Five geospatial analysis procedures were performed to create the model pattern as described in Figure 4.

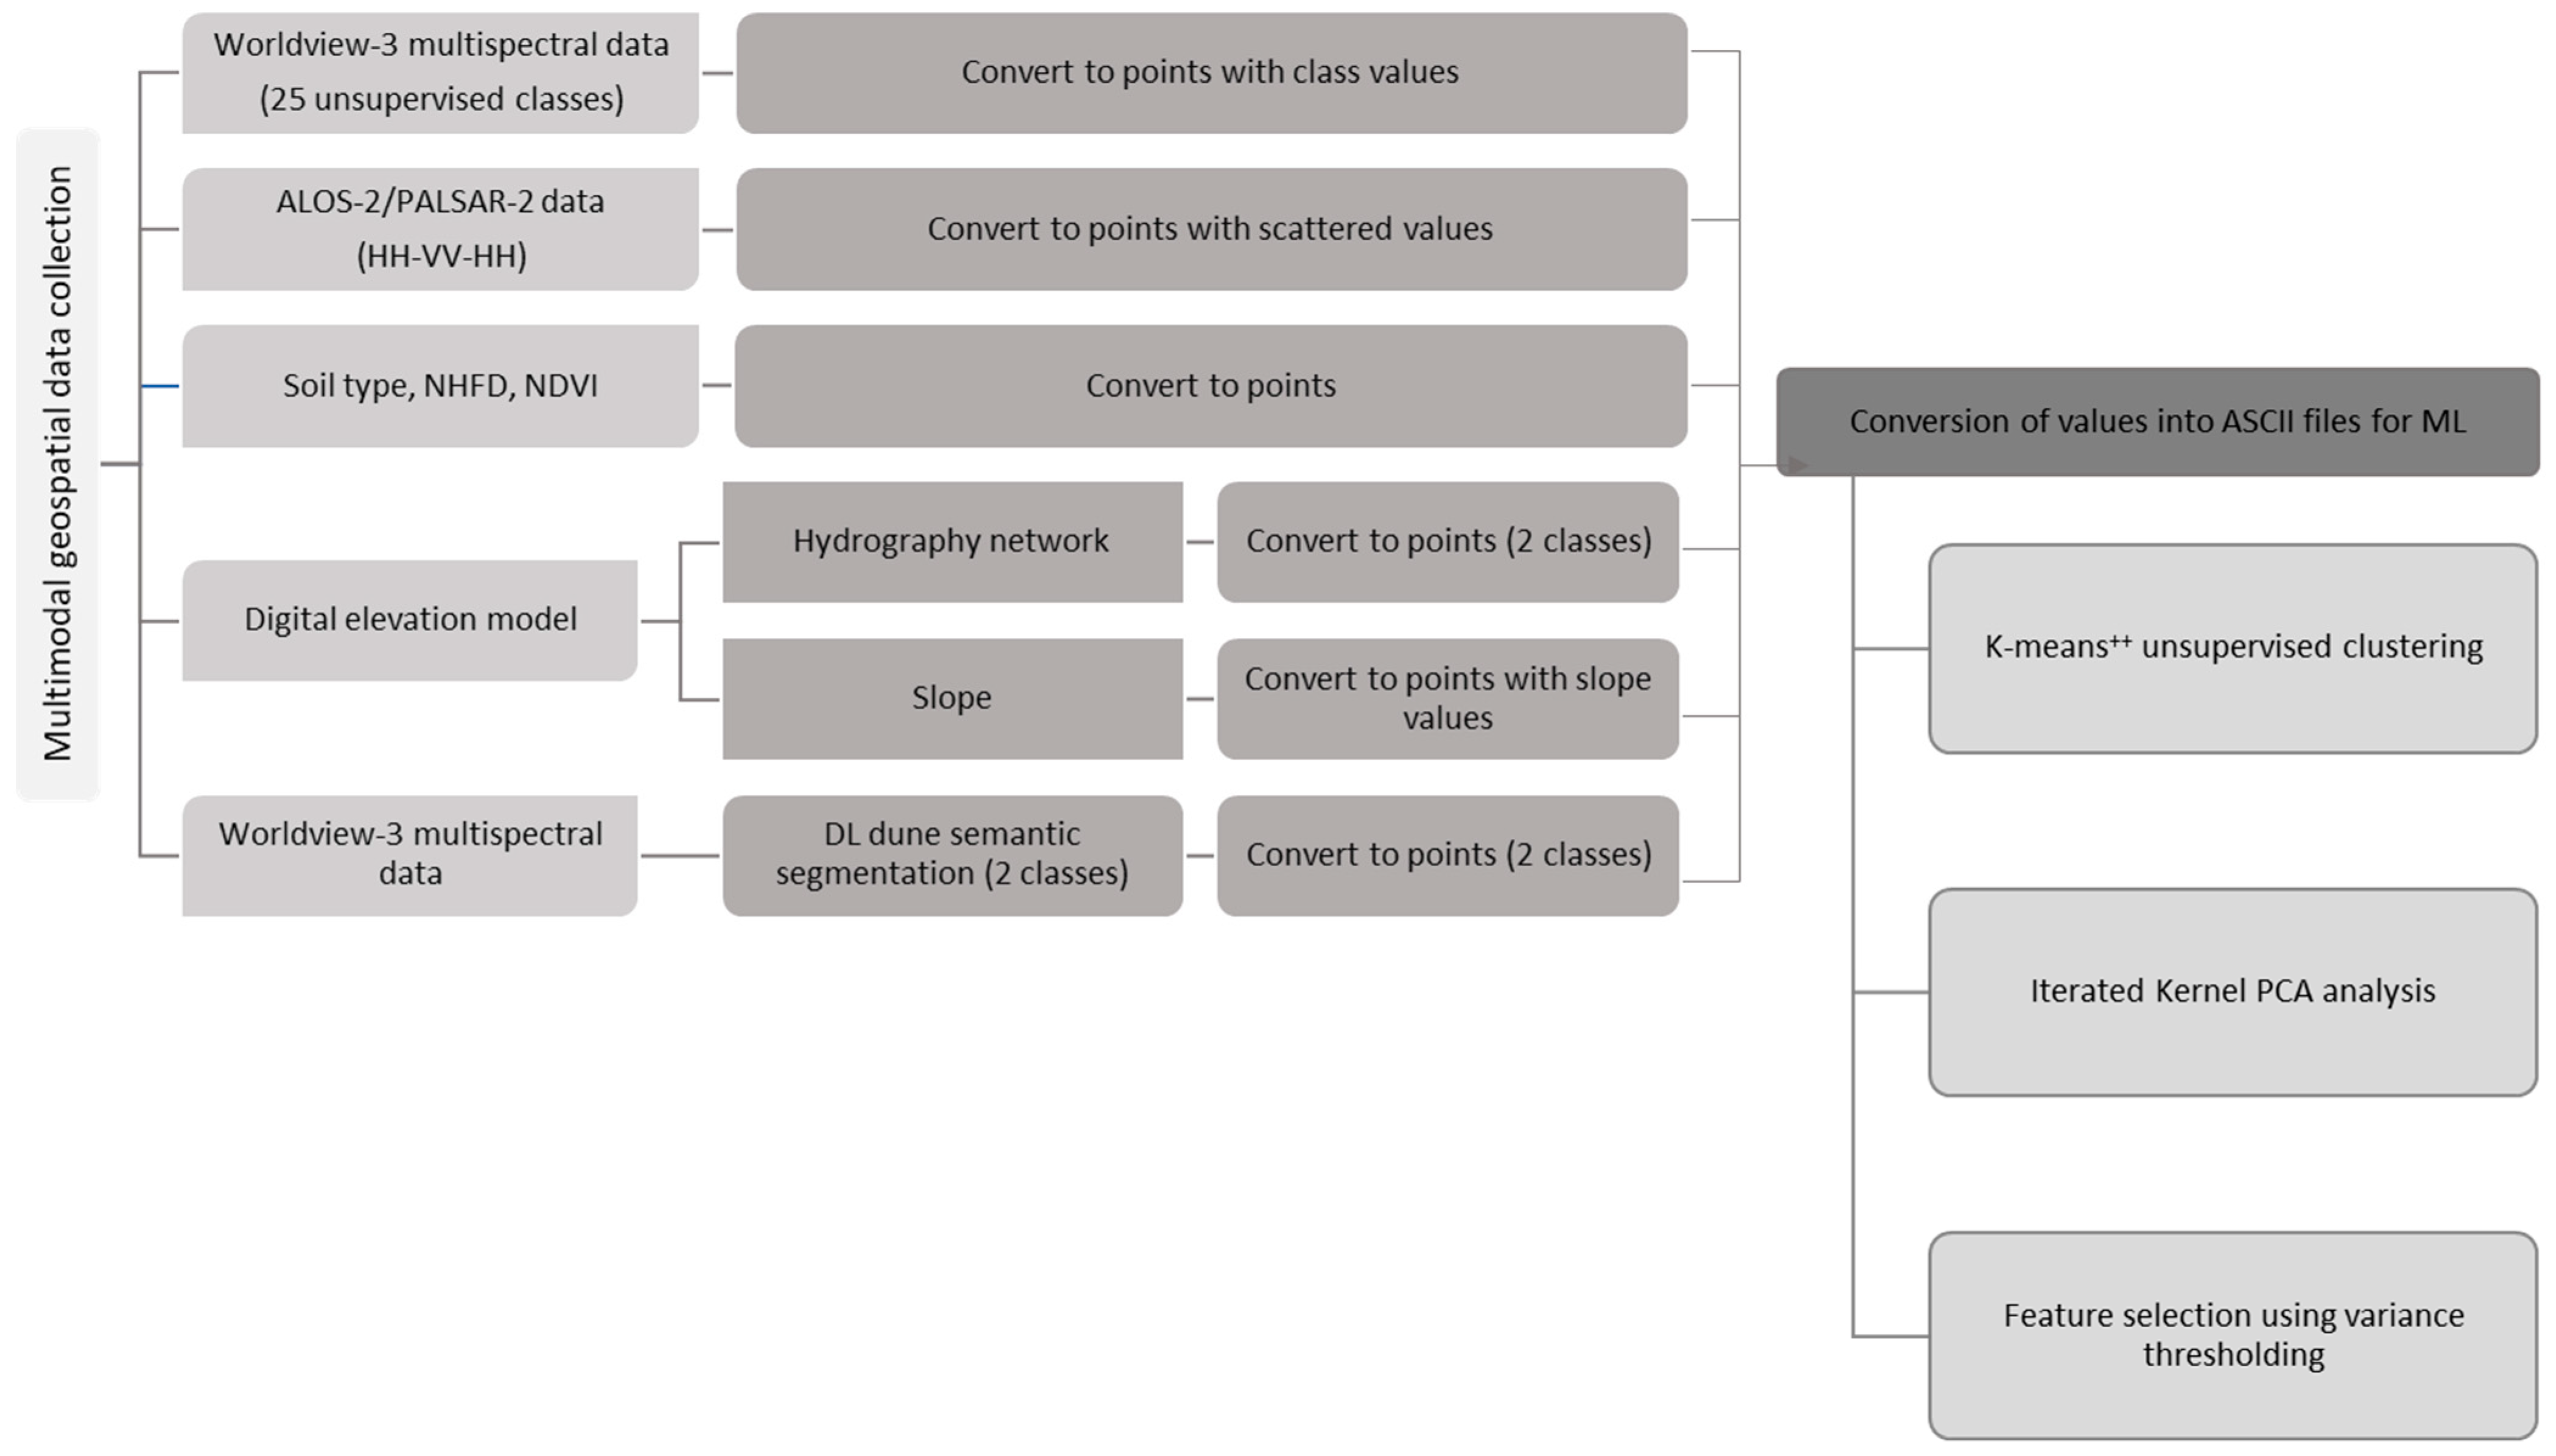
3.3.1. Input GIS Data Extraction
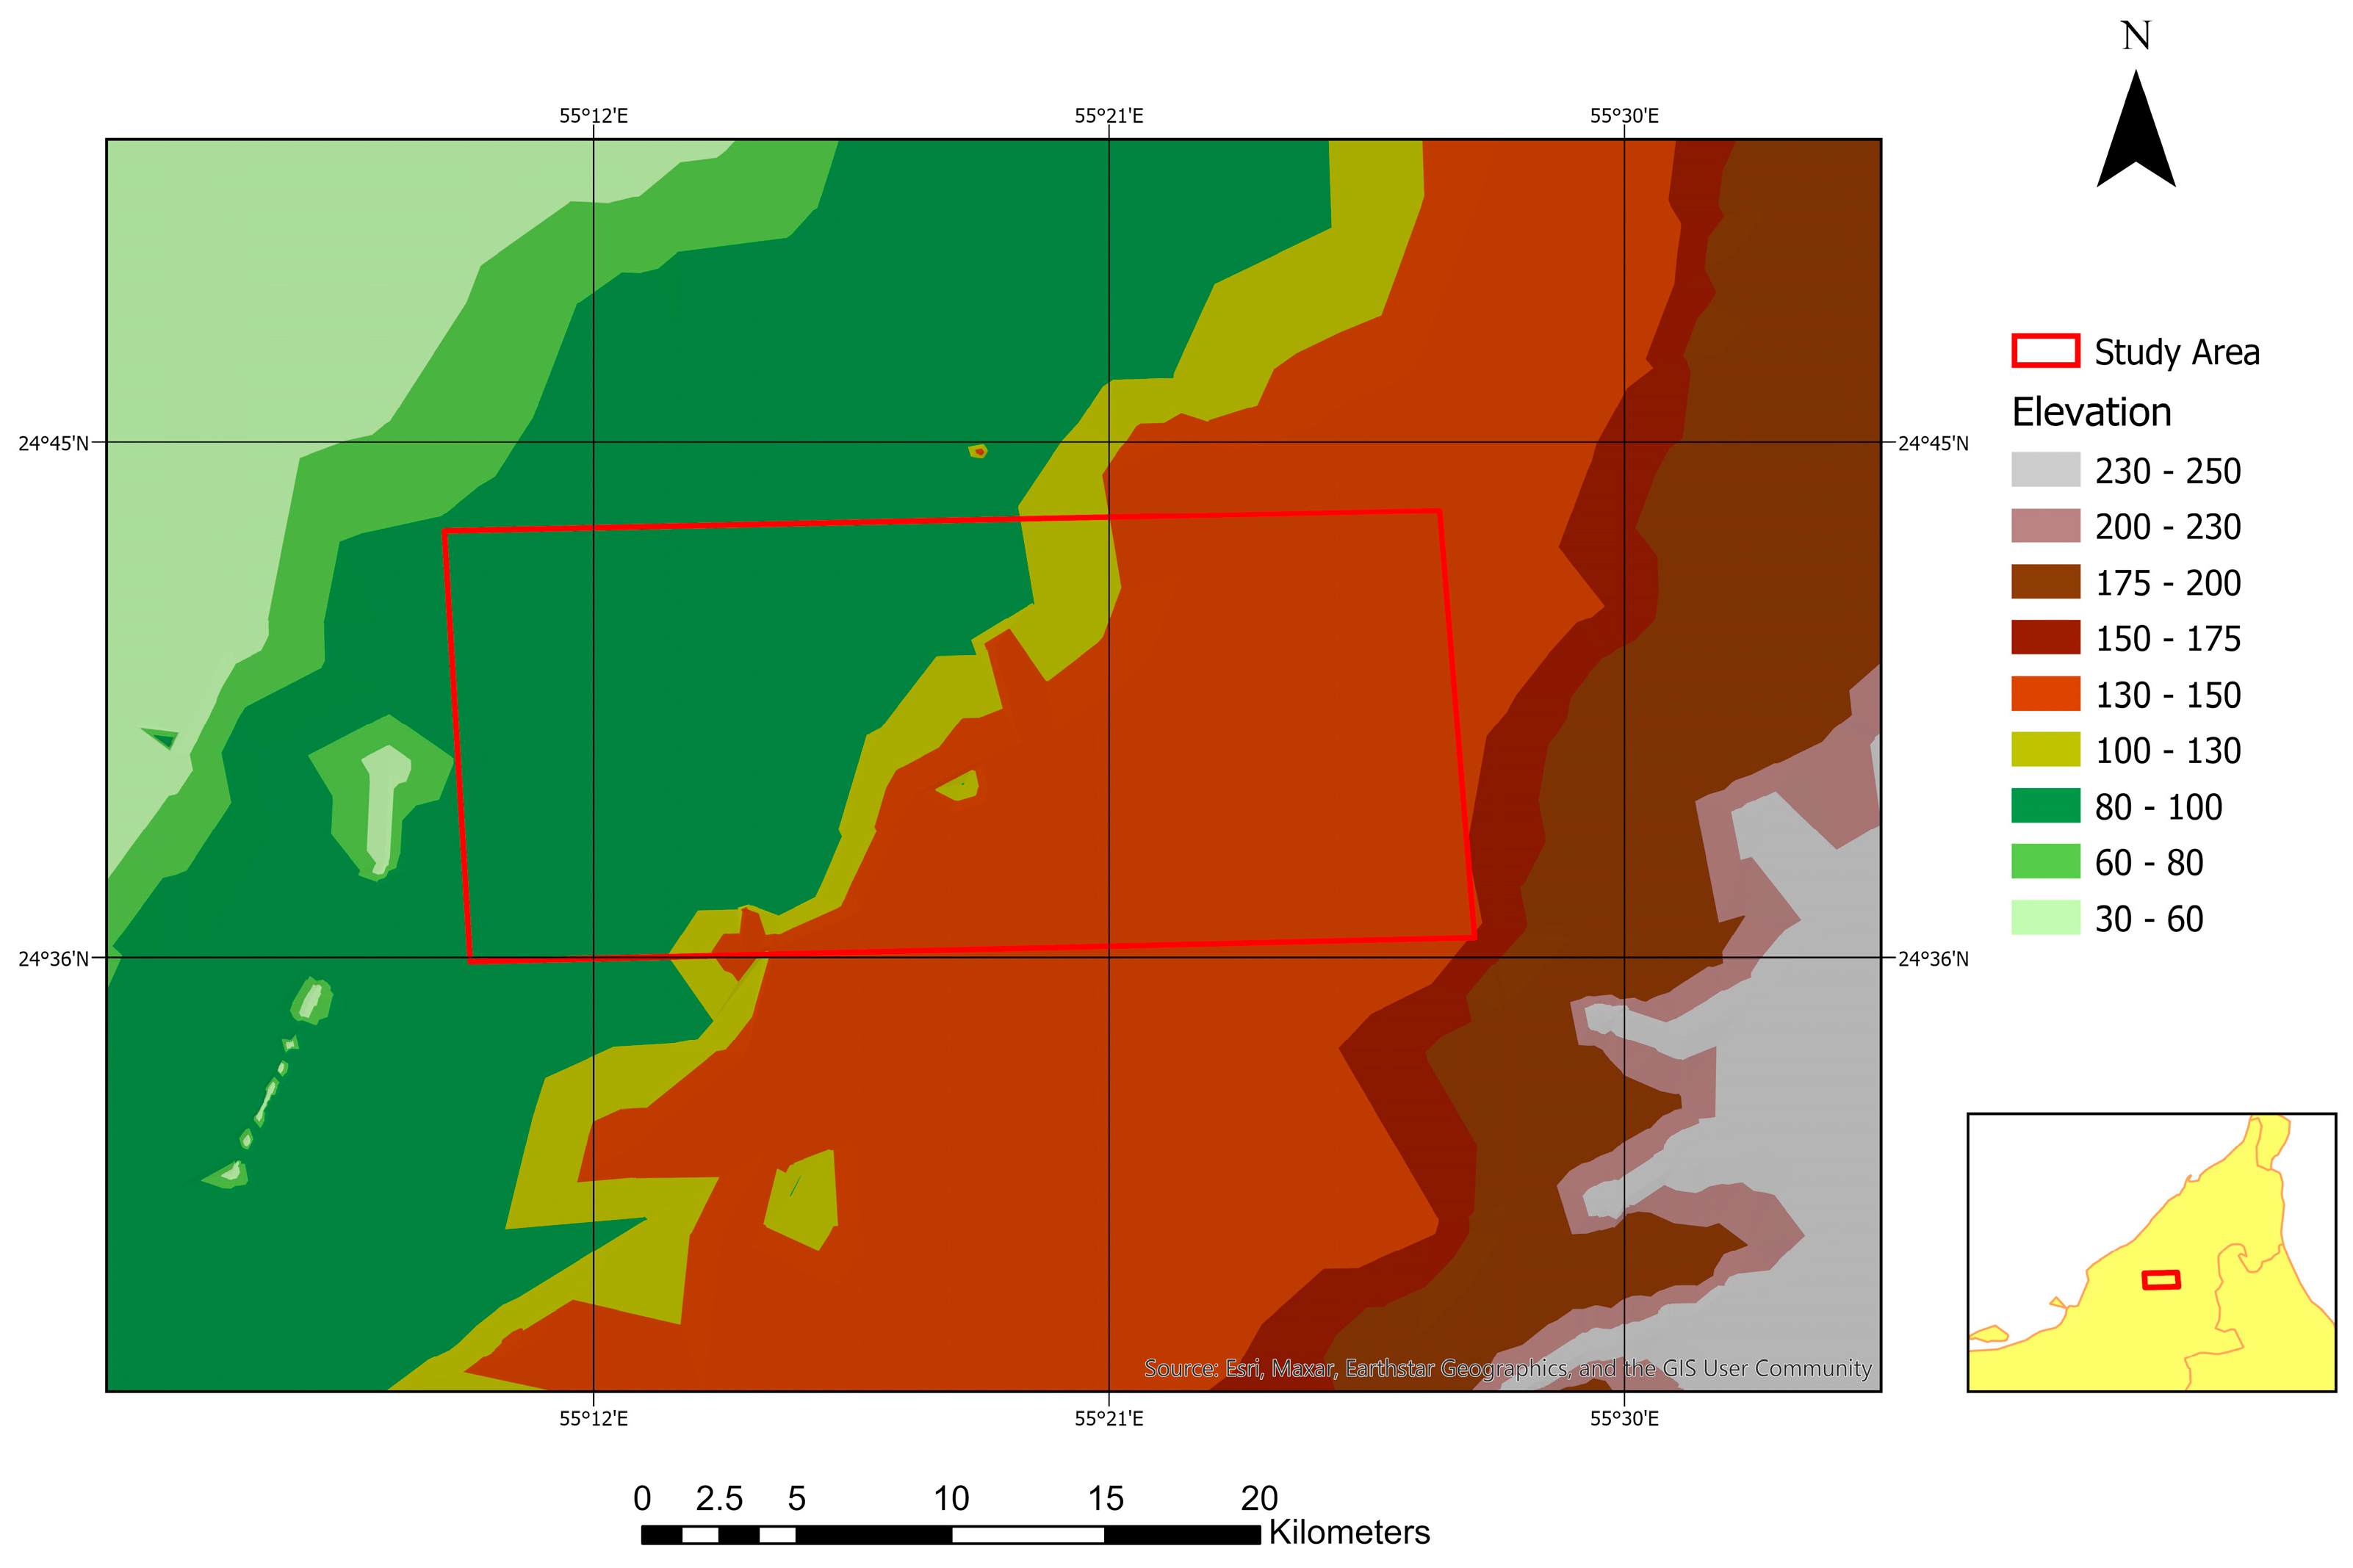
To study the entities that characterise the study site, spatial objects such as topography, slope, soil, and hydrography were extracted. These objects represent the model’s inputs and are defined by their spatial variation.
  • Elevation
To understand the topography and improve the visualisation of the terrain, a triangulated irregular network (TIN) with three-dimensional coordinates x, y, and z was extracted from the DEM generated in Section 3.2.3. Appendix EFigure A10 shows an elevation map of the study area. The elevation within the Saruq Al-Hadid site and surroundings was found to vary between 80 and 130 m.
  • Slope
Weeks et al. [25] reported excavations faced with challenges mainly due to the instability of the sand matrix in the study site. Excavations have therefore proceeded by stepping or terracing trenches, and only the trenches located towards the centre have been excavated to the basal gypsum layer that underlies all deposits in the central sector of the site. It could thus be deduced that the landscape slope plays a crucial role in the stability of the dune flanks which, due to aeolian processes (e.g., erosion, transportation, and deposition of sediment by the wind), expose or bury the archaeological features. Due to its importance in the historical establishment of the habitat, the classification of the slope was carried out from the DEM of the site. The study area was found to be characterised by a moderate slope varying between 1 and 15° (Appendix EFigure A11).
  • Natural resource assessment
Assessing the presence of water resources and features is essential to any studied environment. Following the unsupervised classification which led to the detection of water classes in Section 3.1.2, traces of the historic hydrographic network were mapped. The process of the hydrographic network extraction from the DEM pixels was automated based on the flow routing model [52]. In this method, pixels are centred on the DEM grid points, and each pixel discharges into one of its eight neighbours: the one located in the direction of the steepest descent. The hydrographic network was extracted using ArcGIS Pro hydrology tools (ESRI 2022), and the process was automated to extract streams from the 30 m DEM using ArcGIS model builder (ESRI 2022). Results from the hydrographic network mapping show a stream order of types 2 and 3, i.e., immediate tributaries of the main stem (type 2) and tributaries emptying into the type 2 (type 3) [53] (Appendix EFigure A12).
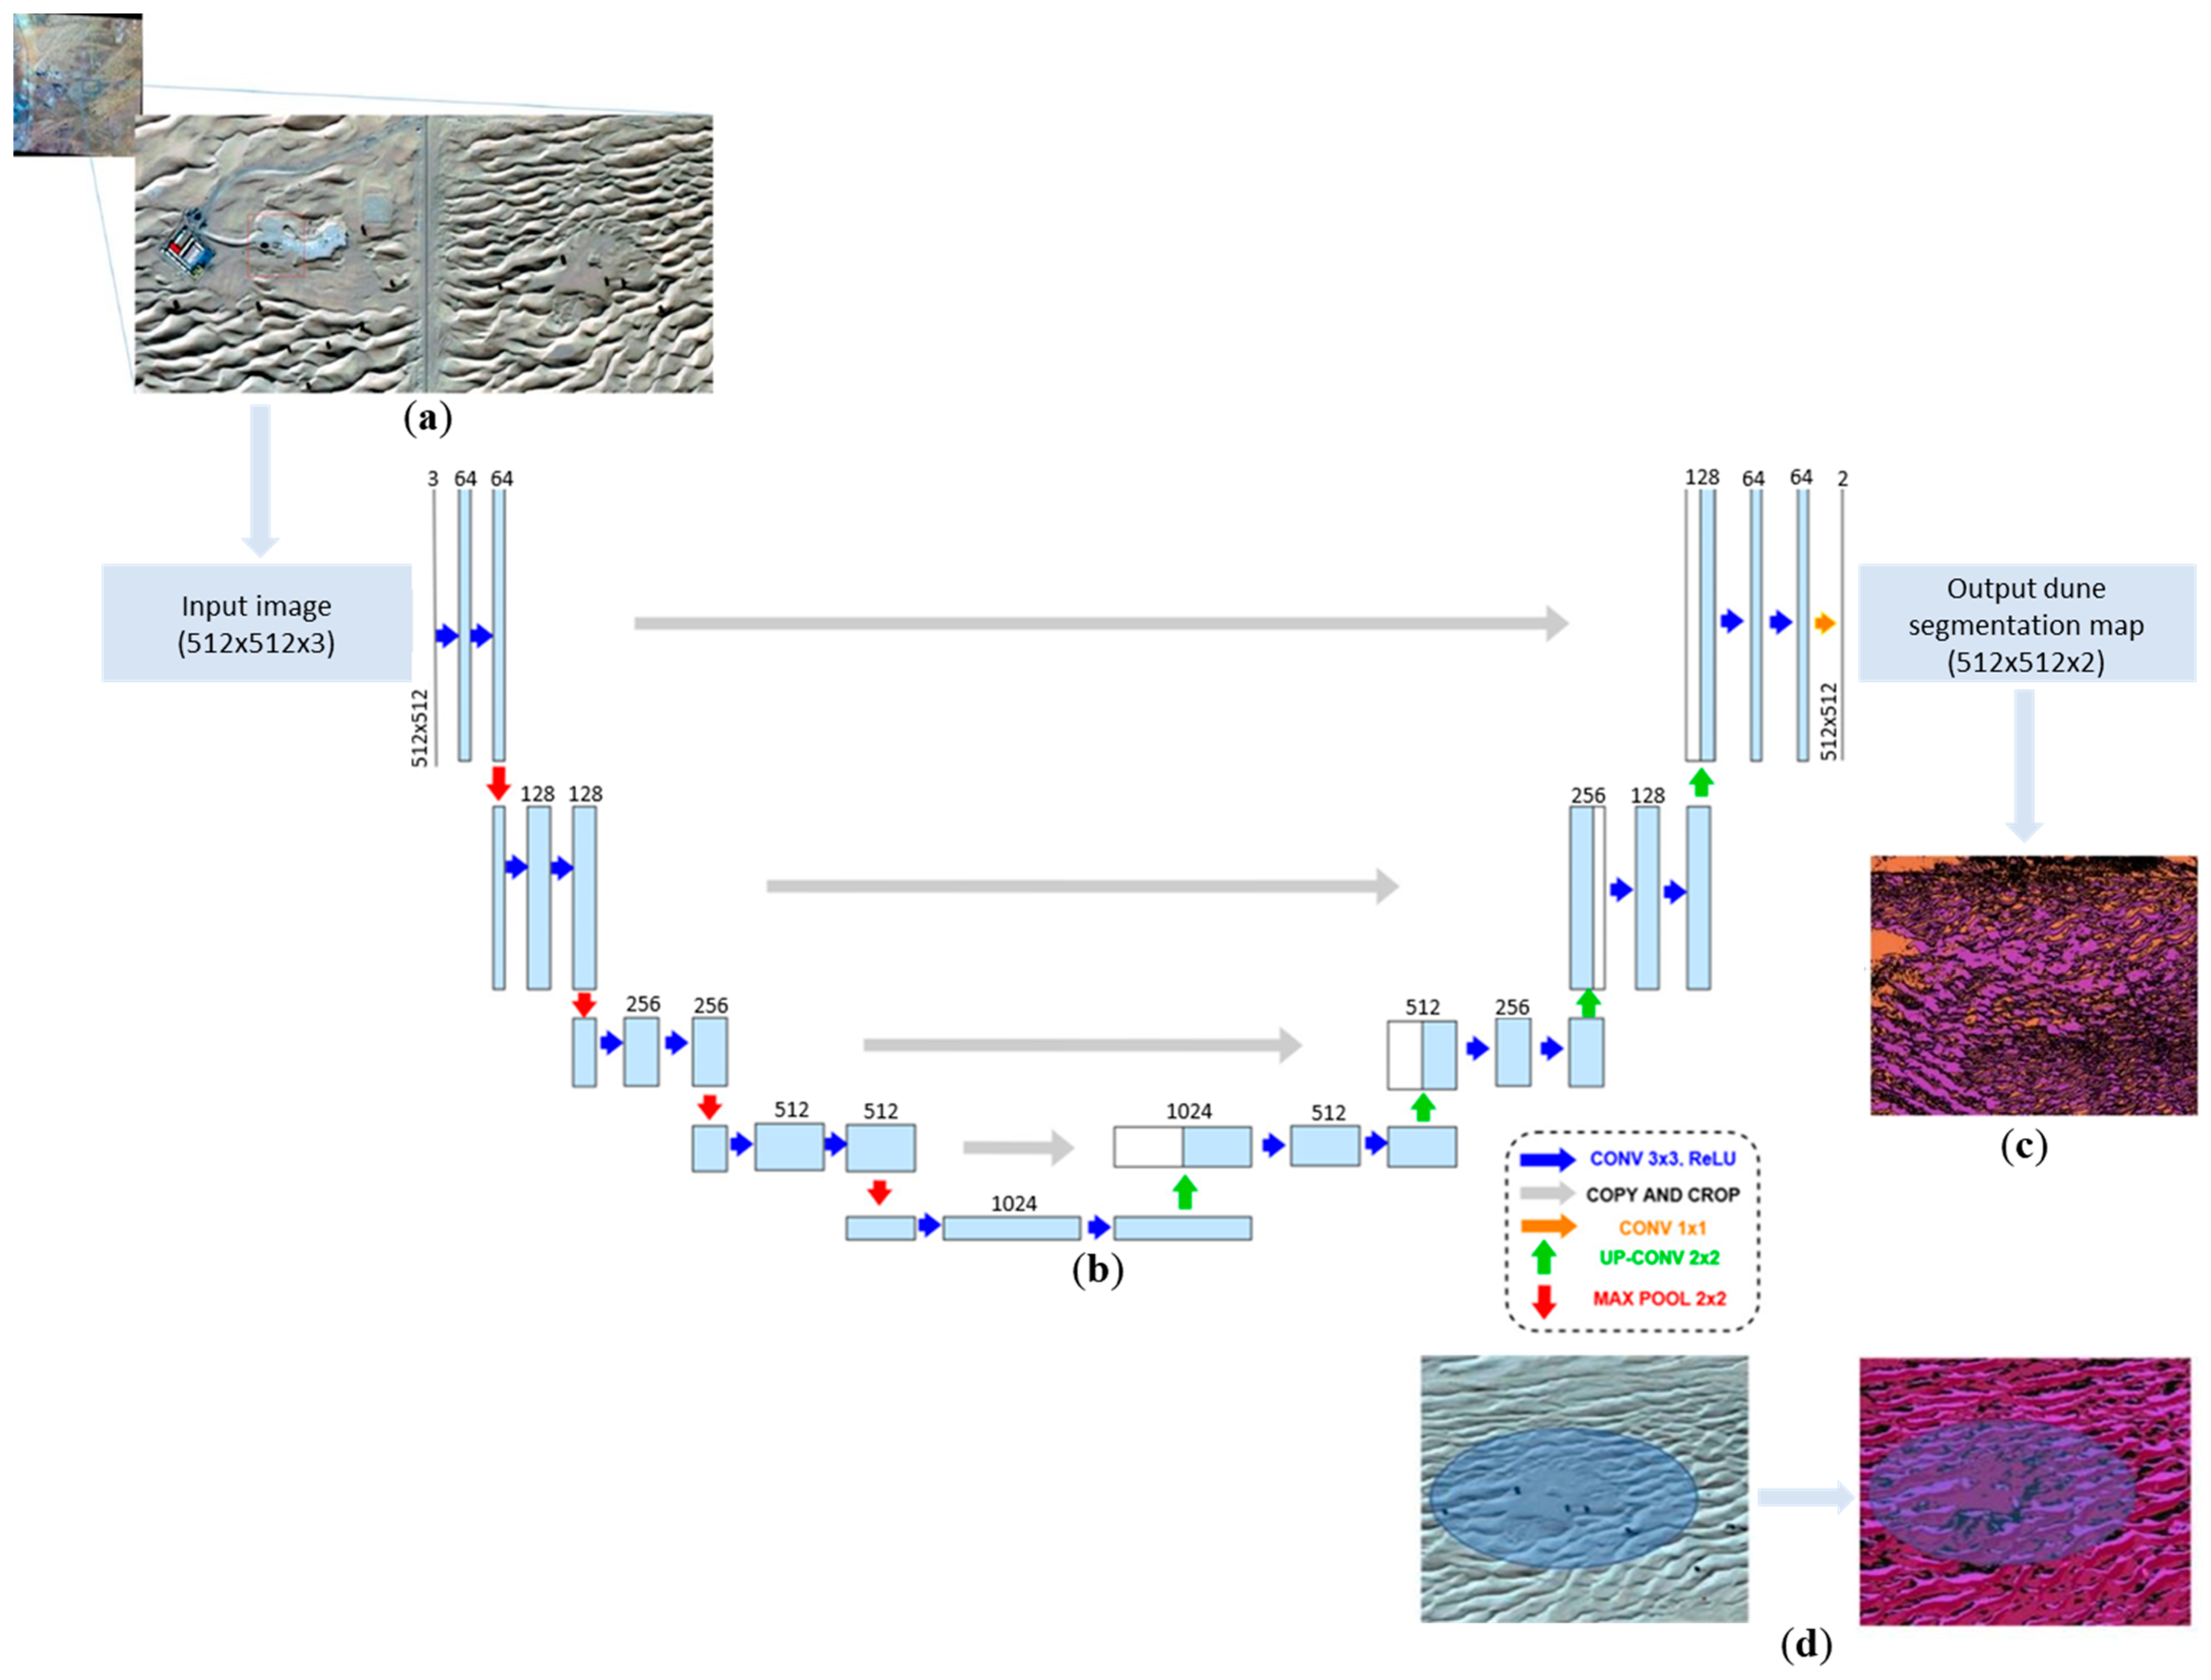
  • Dune Pattern Detection Using DL and Convolutional Neural Networks
The shape variation of the dunes is often due to climatic events. It can be an indication of an archaeological trace if an immediate change of shape is detected in a series of homogeneous dunes [54]. An AI method for the detection of the shape of the dunes was applied using convolutional neural networks (CNN) to classify the acquired multispectral data (Figure 11). DL and CNNs have been exploited in SAR-guided archaeological research to extract valuable information from images and aid in the field, as reviewed by Argyrou and Agapiou [55]. In this study, CNNs were used for semantic segmentation classification of dunes in areas where urban features are absent. The assignment of every pixel in the 30 cm multispectral data is based on the categorisation “dune” or “not dune”. For dune recognition, the CNN architecture used is U-Net to perform semantic segmentation that not only requires discrimination at pixel level but also a mechanism to project the discriminative features learnt at different stages of the encoder onto the pixel space [56]. The model was created using Keras, a DL application programming interface (API) written in Python running on an NVIDIA A40 graphics processing unit (GPU) installed on a high-performance computing (HPC) system. The dataset used for this modelling is composed of 120 RGB images of dune samples and semantic labels over the UAE desert; 96 images (80% of the whole dataset) were used to train the model and 24 images (20%) were used to test it. The loss function is set to binary cross entropy, which is appropriate for binary classification problems with a sigmoid activation function. Additionally, the model is configured to track the BinaryAccuracy metric, which calculates the accuracy of the binary classification predictions. The results were evaluated by experimenting with the model according to several numbers of epochs, but after 30 epochs the validation accuracy, with 0.16 loss and 0.95 binary accuracy, was not improving. Based on the dune pattern estimation, the detection of dune variation within the study site could be automated (Figure 11).

3.3.2. Geoprocessing: Extracting, Summarising, and Aggregating Geospatial Data

Data points extracted from geoprocessing generated a large dataset (Appendix FFigure A13). Using geoprocessing, millions of points were generated, such as points extracted from hydrographic networks, within CNN-classified dunes, etc. These points contain information about each pixel (i.e., soil, elevation, location within or outside hydrographic streams, dune areas, etc.) to be used for clustering. There were undetected patterns within this dataset with no pre-existing labels and with a minimum of human supervision. To overcome these issues, cluster analysis using the K-means++ cluster unsupervised ML algorithm [57] was performed. To determine the optimal number of clusters in the geospatial dataset, the elbow method technique was used. It serves as a useful heuristic to guide the selection process and provide insights into the structure of the data [58]. The chosen clustering algorithm, K-means, was applied to the dataset. K-means partitions the data into a specified number of clusters (K), ranging from a minimum value to a maximum value. For each value of the number of clusters, the within-cluster sum of squares (WCSS) clustering quality metric, also known as the inertia, is calculated. It measures the compactness or coherence of the data points within each cluster. A line plot is then created where the x-axis represents the number of clusters and the y-axis represents the WCSS (Appendix FFigure A14a). The plot is then examined, and the point where the decrease in the WCSS begins to level off, forming an “elbow” shape, is identified. The elbow point 5 was selected to represent the number of clusters that provides a good balance between maximising the similarity within clusters and minimising the similarity between clusters (Appendix FFigure A14). Adding more clusters may not provide substantial improvement of the WCSS, while excessively increasing the number of K clusters can lead to overfitting and reduced interpretability.

3.3.3. Geostatistical Analysis

The main purpose of this step was to calculate the covariances between the different mined variables, i.e., unsupervised classes, radar polarisations, elevation, slope, hydrologic resources, and dune pattern. The covariances were calculated, and the main components were extracted using PCA. The order of PCs was defined based on the calculation of the probability of the independent variables (IV). After decomposition using Kernel PCA, a non-linear dimensionality reduction through the use of kernels [59] of the ML library for the Python programming language scikit-learn, probability 0.369 and 0.193 defined the main PCs (Table 1). The other PCs were considered secondary.

3.3.4. Reclassification Using Multimodal Data and User Expertise

Throughout the study area made of the soil formations described in Section 2.2, there are occasional small tufts of vegetation, and to the east, south, and west of the compound there are very occasional Ghaf trees (Figure 2a and Figure 6). In terms of visible reflectance: (1) at canopy level, reflectance results from various factors, such as vegetation chemical properties, leaf morphology, canopy structure, and tree sizes [60,61,62]; and (2) at soil level, it is a differentiating characteristic for many classes and is an essential part of the definitions for both surface and subsurface diagnostics. Main factors influencing the reflectance for bare soils are roughness and texture, organic matter content, and moisture conditions [63,64].
Reclassification of the study site was conducted using the fusion of multispectral, band ratio (e.g., soil and vegetation bands), GIS (e.g., slope), derived geostatistical, lithological, and hydrographic data, along with user expertise and familiarity with the site’s geomorphological context and setting. This multimodal analysis led to the distinction between three main different geomorphological assemblages.
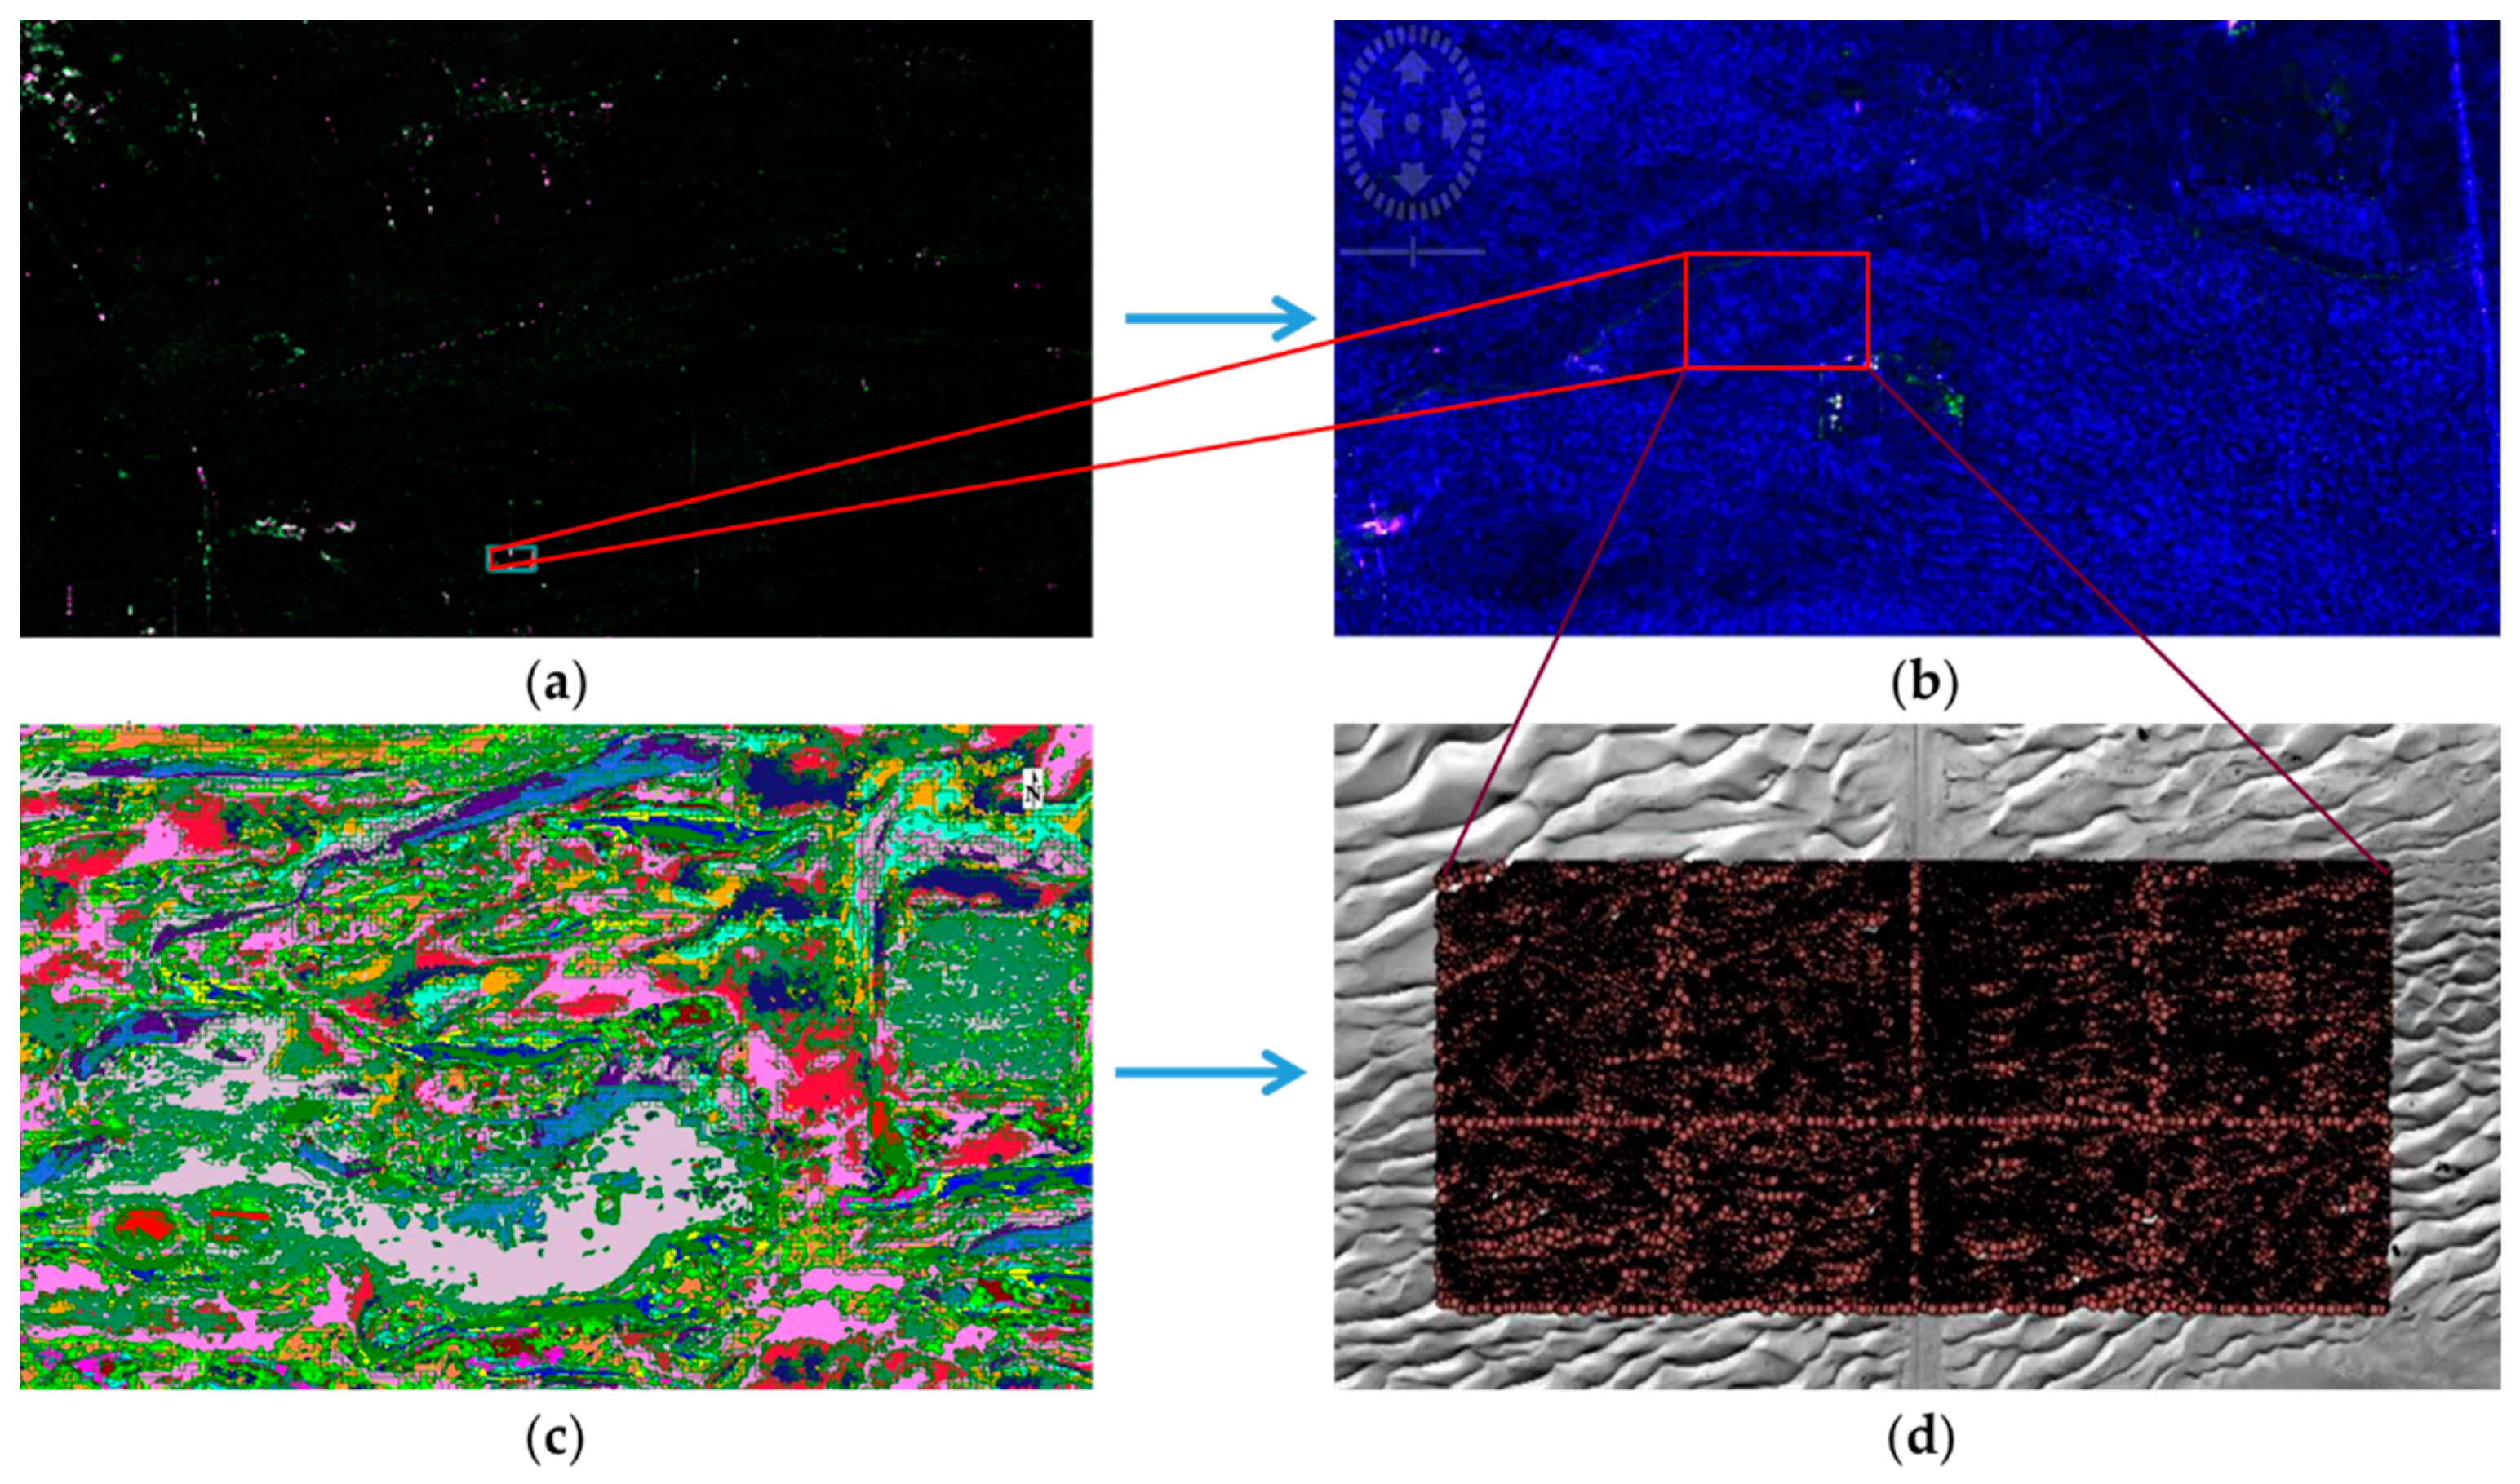
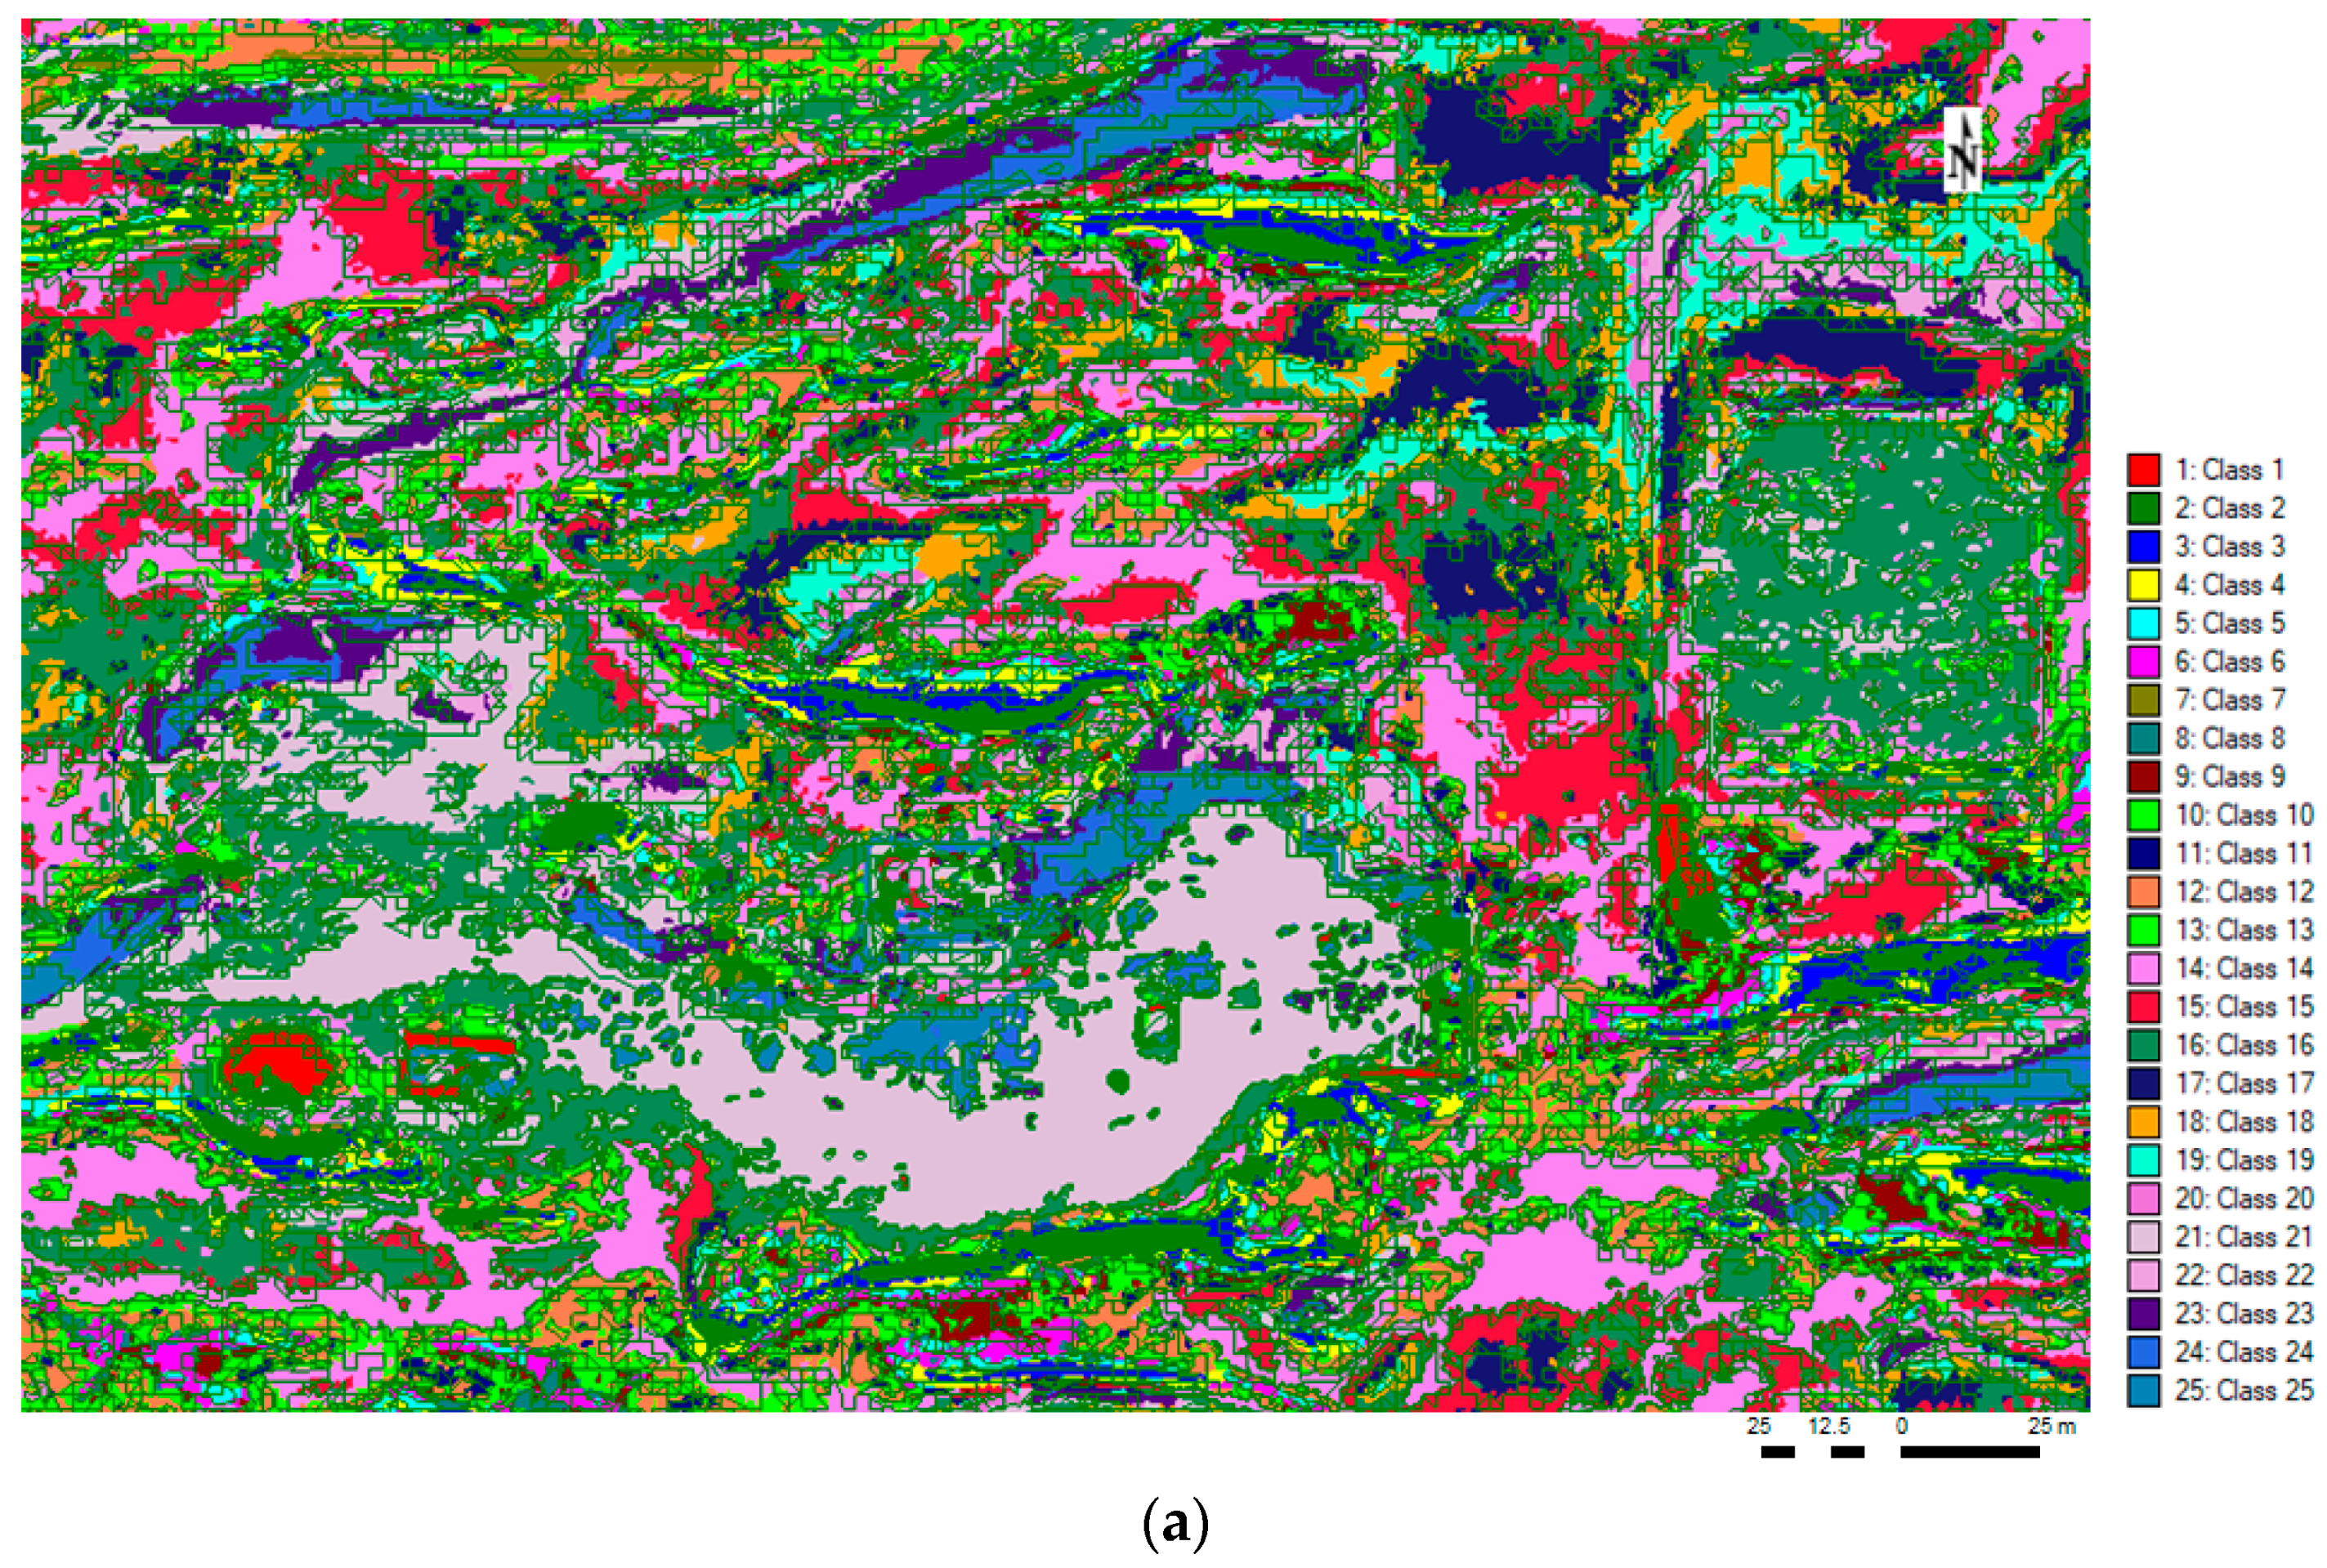
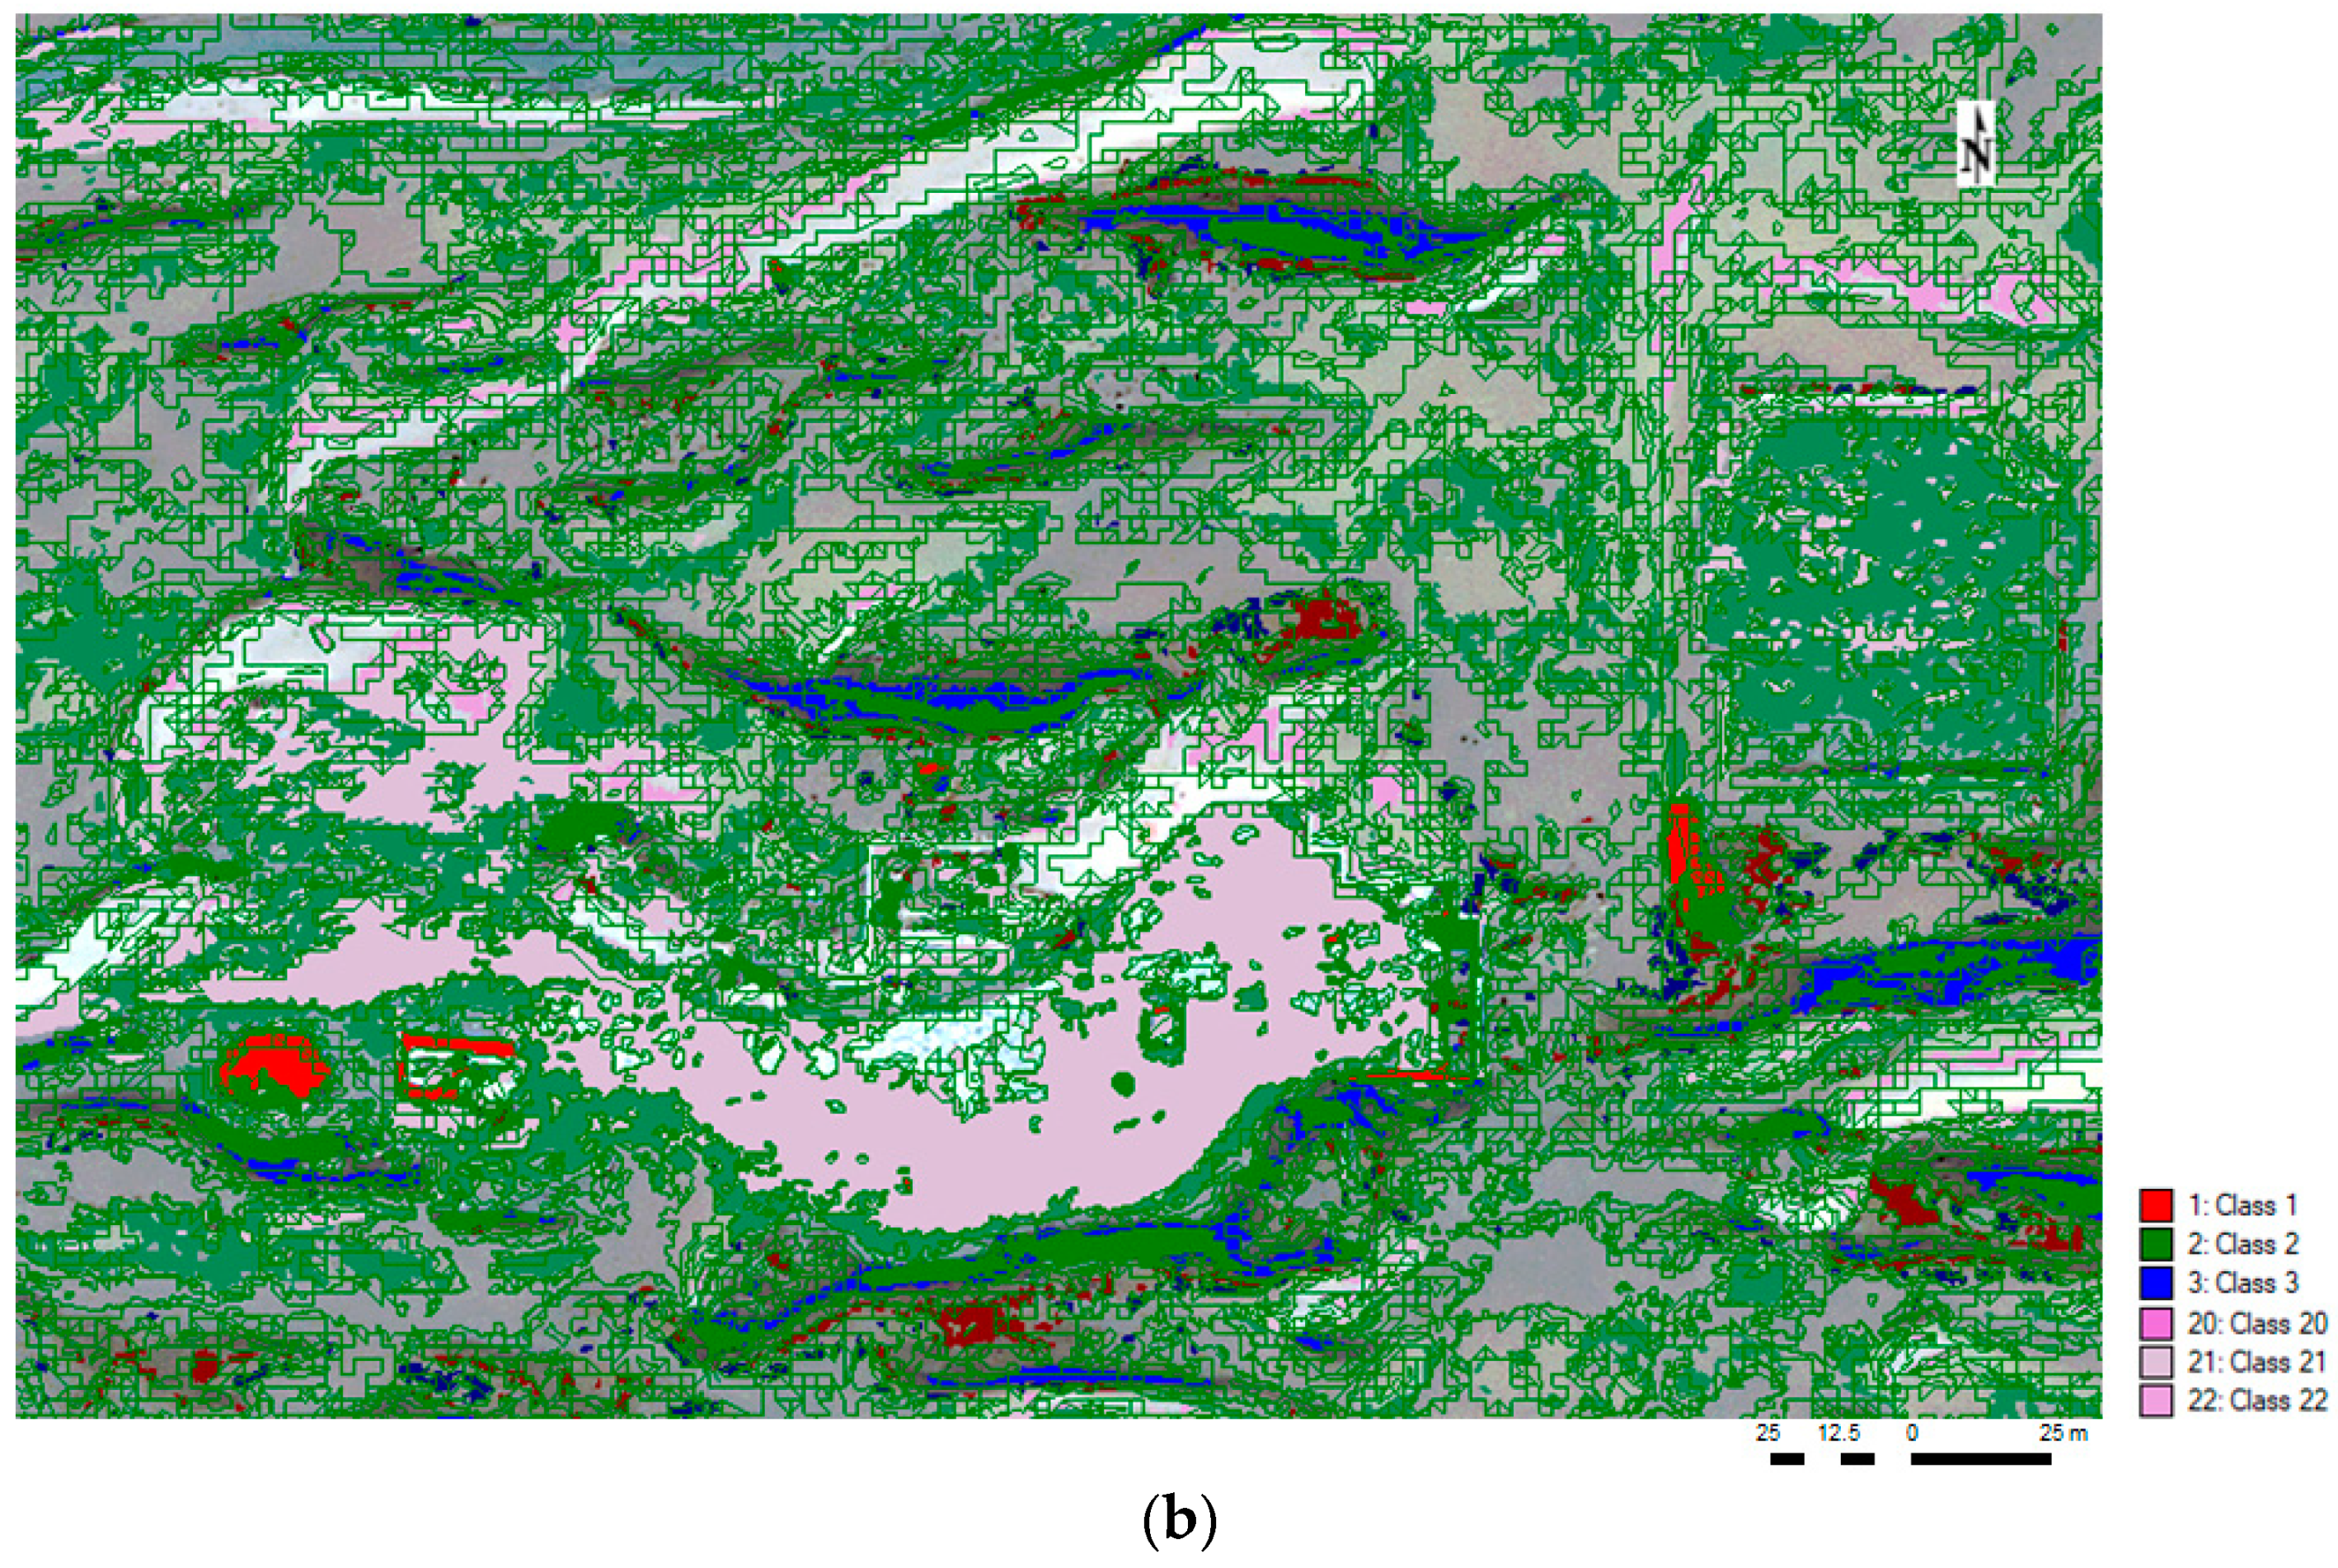
  • Geomorphological assemblage (I) is represented by classes 4 to 10 of the unsupervised classification presented in Section 3.1 (Figure 7a), which correspond to areas related to manmade constructions’ generated shadows such as areas of light intercepted and blocked by tents and buildings; and to vegetation such as Ghaf trees and dune ridges. This geomorphological assemblage consists of sand dune formations with shaded ridges facing north and containing relatively more humidity than the general surroundings, in addition to classes 1 to 3 that were identified as water classes in Section 3.1 (Figure 7b). The multimodal data reclassification regrouped these features into “Geo assemblage I” (Figure 12).
  • Geomorphological assemblage (II) is represented by classes 10 to 15 of the unsupervised classification provided in Section 3.1 (Figure 7a), corresponding to gypsum pavement at the base of the excavated sequences (Figure 2b), sporadic drought-tolerant vegetation in interdune areas such as shrubs and bushes, sand veneer, low dunes, and the exposed formations at the subsurface; the geological substratum of the Barzaman and/or Hili sandstones to siltstones formations. After reclassification, these structures were identified as “Geo assemblage II” (Figure 12).
  • Geomorphological assemblage (III) is represented by classes 16 to 20 of the unsupervised classification in Section 3.1 (Figure 7a), corresponding on the ground to metal working slags. Indeed, these features were detected during the field survey’s direct observations and autopsies and reported by previous geophysical surveys as the three main archaeological excavation sectors, i.e.: (1) the three-year Saruq Al-Hadid Archaeological Research Project (SHARP)’s excavation trenches reported by Cable [43]; (2) the excavation sector ongoing since 2019 that was reported by Weeks et al. [26]; and (3) the previous excavation sector reported by Weeks et al. [25] (Figure A1). This assemblage also contains the longitudinal sand dune ridges facing southward, in addition to the excavation’s areas reported in Section 3.1 (Figure 7b) and artificial infrastructures made of metal or concrete. These geomorphological constituents were reclassified into “Geo assemblage III” (Figure 12).
This multimodal reclassification was verified based on reports that correspond temporally with the SAR data acquisition period (e.g., Cable (2015)), with the geological and geomorphological autopsies conducted in October, November, and December 2015, and with the multispectral data acquisition period, e.g., the pre- and post-archaeological investigations of Weeks et al. [25], Stepanov et al. [65], and Valente et al. [66] (Figure 12). Figure 12 shows the reported main excavation sectors extending as part of the field survey and verification. Based on observations of features of potential archaeological importance during the field surveys (e.g., metal working slags), three site locations (A, B, and C) were elected for future archaeological investigation (Figure 12). As of the current pilot study time frame and to the best knowledge of the authors, there are no reports on excavation works within the area contained in the eastern zone identified using the developed research process. Further investigation on this area was conducted using the ML pattern modelling developed in Section 3.3.5 and Section 3.3.6.
Based on the geological and geomorphological user expertise and the familiarity gained with the study site, multimodal reclassification works best for metal working slags, archaeological remains including artifacts, and rock blocks in dune ridges, especially in Geo-assemblage III. As reported in Section 3.1.2, misclassifications were due to differences in object scale and data resolution; fine-scale variations in relief features and subtle patterns that cannot be captured by this approach.

3.3.5. Pattern Modelling

The penultimate step was the pattern model definition. Given the different statistical distributions of the input elements, PCA and gaussian modelling were chosen. This resulted in a nonlinear model for the precision of the selection of groups. To solve the nonlinear model, the gaussian radial basis function (RBF) kernel was used [67].
This allowed us to iterate the process several times in order to optimise the pattern modelling. The unsupervised ML technique using Kernel PCA was able to detect the excavation areas that had already been reported. The pattern modelling was employed to predict areas of potential archaeological significance, including previously reported excavation sectors and ground-surveyed areas (Figure 13a) as well as areas contained in the eastern zone which were identified in the previous steps of the integrated process (Figure A3 and Figure 13b).
Recalling the main objective of this study, which is to enhance archaeological research in Saruq Al-Hadid desert and similar environments through, among other techniques, the application of a series of successive clustering algorithms (K-means++ and kernel PCA), the three main excavation sectors reported in the literature were retrieved. Results showed: (1) larger variance values (>0.041) for these archaeological sites in comparison to the other locations within the study site, with the largest variance (0.369) corresponding to the area that was elected, using remote sensing data and throughout the different steps of the process, to be of potential archaeological importance; and (2) lower variances (<0.019) or rejection from the model corresponding to dune areas or recent constructions identified in situ or remotely. This proves that the model has worked fairly well for the area of interest and has the potential to provide further insights into the spatial patterns and relationships between different relief features, thus aiding in archaeological investigations. Recent site visits and verification are required and planned to validate these findings as soon as access to the site is granted by the governing authority.

3.3.6. Pattern Prediction and Application to Similar Environments

The final step was to predict and guide archaeological activities and research through the identification of potential areas for further on-site investigation. This was achieved based on the ML and DL techniques. With a more precise decomposition of clusters based on a mathematical representation of geospatial distribution, areas of reported archaeological significance were identified. Areas of potential significance were predicted. The prediction of these potential areas is in conformity with the reclassification performed in Section 3.3.4 (“Geo assemblage III” (Figure 12)). This modelling, based on the succession of the unsupervised ML analysis steps, can be applied to similar environments for the extraction of geographic information. Transfer learning, which involves leveraging pre-trained models on similar tasks or datasets, can help overcome the scarcity of labelled archaeological data in desert environments. Additionally, data augmentation techniques, such as image rotation, scaling, etc., can increase the diversity of training data and improve the generalisability of the developed ML model. Additionally, it is expected that data collected during future geophysical field and ground-truthing surveys will help to further validate the model-predicted areas. The pattern can then be inferred to a larger extent in the same environment (Figure 14) and the approach can be applied to similar arid environments, although with Saruq Al-Hadid being a pilot study for the testing of the efficiency of the developed approach, limitations were faced due to several factors such as the lack of more up-to-date in situ data and the heterogeneity in the resolution of the multisource data. Previous studies show that best results are obtained through the use of a combination of remotely sensed data sources, i.e., multispectral, thermal, SAR, ground-penetrating radar (GPR), as supported by field research [37,68,69,70,71,72,73].

4. Discussion and Conclusions

Arid regions, such as the Saruq Al-Hadid site, offer a challenging environment for the detection of historical monuments using ground-visual or physical methods due to challenging abiotic factors such as high sand dunes. These factors, however, make these environments some of the most promising sites for satellite SAR penetration and applications in archaeology. These applications were demonstrated in the literature to have successfully guided archaeological works and research [12,33,47,48,49]. SAR’s potential has been further evidenced when integrated with ML- and DL-based classification of multitemporal data [20,21,22]. Advanced image processing techniques and multimodal data analysis using ML and DL were integrated within the geological context to develop an automated process and investigate its accuracy before generalising it to larger areas. Results from SAR feature extraction and geospatial analyses allowed for detection of the areas of the site that were already under excavation as well as further geomorphological assemblages. The geospatial modelling highlighted anomalies to predict areas of potential archaeological value. Potential archaeological areas were predicted with the implementation of a more precise decomposition of clusters based on a mathematical representation of geospatial distribution. The validation of these results was performed using reported archaeological research findings that temporally coincide with the used datasets, e.g., [43,65,66], as well as geological and geomorphological autopsies, along with direct observations conducted during the field surveys.
While the field verification is valuable [16], it was dependent on the scale and resolution of the data; fine-scale variations in relief features and subtle patterns might have been missed. In addition, it was contingent on contextual factors; local relief gradients are influenced by a variety of factors, including distinct geomorphological and geological processes, land use and cover (such as sparse vegetation and limited surface water), and human activities. The complex interplay of these factors potentially limits the accurate guidance of the archaeological research.
These limitations, also discussed in the literature, e.g., [74], highlight the need for further validation and integration of the developed process with recent archaeological knowledge; especially in desert landscapes, which often present limited spectral signatures and complex surface interactions [75,76].
In fact, desert environments often exhibit limited spectral variability, especially when dominated by sand and sparse vegetation, as is the case in Saruq Al-Hadid and the larger geographic area. This limited range of spectral signatures poses challenges for ML algorithms that rely on distinct spectral patterns for classification or feature detection [22]. Discriminating between different archaeological features or materials may therefore become more difficult in these environments.
Moreover, they can have complex surface interactions due to the presence of sand dunes, rocky outcrops, and various surface materials. These surface interactions can result in complex spectral mixtures and scattering effects, making it challenging to accurately interpret remote sensing data (Figure 14). This complexity can affect the performance of ML algorithms, which may struggle to differentiate between different surface materials or archaeological features.
The modelling and prediction accuracies are expected to improve using the insertion of a neural network and backpropagation algorithms based on the performed cluster groups following more recent field surveys. The validated results can provide guidance for future on-site archaeological work. The study’s findings are also essential for reliable mapping of paleo-drainage systems within the study area, which is characterised by low topographic variations [77]. The applicability and efficiency of the developed process are anticipated to improve following imminent, more recent field surveys and further validation efforts using multitemporal data. The analysis was carried out with the expectation that the techniques described would be adjusted to better fit the requirements of archaeological research in larger areas and similar environments.
This research is recommended for long-term, multimodal, and multitemporal investigations into the prehistoric landscape of the study site. An integrated workflow would combine ML and DL techniques with automated feature detection in multisensory, multitemporal, remotely sensed data and suitable archaeological training data and knowledge in the interpretation process. Such an innovative process is expected to more accurately generate and validate detections of hitherto unidentified archaeological objects and sites in the surroundings of the study site and similar environments. This would contribute to the creation of reliable, labelled archaeological training datasets, thus guiding archaeological studies through the identification of significant areas, the prediction of potential site locations, and the formulation of more informed research strategies for further investigations while cutting down on extensive and costly ground-based sensing. In addition, mapping watersheds of continental scale could be enabled, thus assisting in the reconstruction of the paleo-hydrology of desert regions in other areas around the world.
Furthermore, local and regional archaeological and geophysical databases can be expanded through the large spatial and temporal coverages offered from space, the unique resolutions of recent optical remote sensors, the penetrating capabilities of remote sensing, and AI.

Author Contributions

Conceptualisation, H.B.-R. and H.G.; data curation, H.B.-R. and C.C.; formal analysis, H.B.-R., D.F. and C.C.; funding acquisition, D.F. and S.G.; investigation, H.B.-R. and C.C.; methodology, H.B.-R. and C.C.; visualization and software, H.B.-R. and C.C.; interpretation and contextualisation, H.B.-R. and K.P.; project administration, S.G.; resources, D.F.; supervision, D.F.; writing—original draft, H.B.-R.; review and editing, D.F. and H.B.-R. All authors have read and agreed to the published version of the manuscript.

Funding

This research was funded by Khalifa University, grant number ‘8474000305’.

Data Availability Statement

The data presented in this study are available on request from the corresponding author, Diana Francis.

Acknowledgments

The authors would like to thank the ALOS data distribution team of the PASCO Corporation for supporting with the ALOS-2/PALSAR-2 data acquisition and the data distribution team at Bayanat AI for facilitating the Worldview-3 data acquisition.

Conflicts of Interest

The authors declare no conflict of interest.

Appendix A

Figure A1. Main previous and ongoing excavation sectors at the western zone of the Saruq Al-Hadid site as per Weeks et al. (2019). Worldview-3 RGB composite of the western zone of observation. * A three-year programme of archaeological fieldwork and post-excavation analysis in 2017.
Geosciences 13 00179 g0a1
Figure A2. (ac). Some remarkable spots and locations on the site based on the produced orthomosaics—western zone of observation. Projection: UTM, Zone 40 North. Map: 321634.89 E, 2729207.78 N Meters. LL: 24°40′0.76″ N, 55°14′14.40″ E.
Geosciences 13 00179 g0a2aGeosciences 13 00179 g0a2b
Figure A3. Some remarkable spots and locations on site based on the produced orthomosaics—eastern zone of observation. Projection: UTM, Zone 40 North. Map: 321634.89 E, 2729207.78 N Meters. LL: 24°40′0.76″ N, 55°14′14.40″ E.
Geosciences 13 00179 g0a3

Appendix B

Figure A4. Principal components.
Geosciences 13 00179 g0a4
Figure A5. Statistical analysis of the principal components. (a) Resulting statistics; (b) basic statistics for each PC band; (c) eigenvalues plot.
Geosciences 13 00179 g0a5

Appendix C

Figure A6. Geocoding and radiometric calibration using the global DSM (horizontal resolution 1 arcsec) by the ALOS-Panchromatic Remote-sensing Instrument for Stereo Mapping (PRISM).
Geosciences 13 00179 g0a6

Appendix D

Figure A7. (a) Complex data multi-looking (HH, HV, VH, VV), speckle-filtered using Lee filtering (3 × 3). (b) Geocoding and radiometric calibration using the global DSM (horizontal resolution 1 arcsec) by the ALOS-Panchromatic Remote-sensing Instrument for Stereo Mapping (PRISM) (30 m ground resolution and 5 m elevation accuracy). Saruq Al-Hadid study site is delineated in red.
Geosciences 13 00179 g0a7
Figure A8. The produced digital elevation model (DEM) over Saruq Al-Hadid site.
Geosciences 13 00179 g0a8
Figure A9. (a) DEM slope. (b) S2N. (c) W2E.
Geosciences 13 00179 g0a9

Appendix E

Figure A10. A triangulated irregular network of the Saruq Al-Hadid site (in red) and surroundings.
Geosciences 13 00179 g0a10
Figure A11. Slope map classification of the Saruq Al-Hadid site (in red) and surroundings.
Geosciences 13 00179 g0a11
Figure A12. Hydrographic network map of the Saruq Al-Hadid site (in red) and surroundings.
Geosciences 13 00179 g0a12

Appendix F

Figure A13. Geoprocessing: extracting data from radar and optical satellite images. (a) Radar composition. (b) High-volume scattering. (c) Unsupervised classes. (d) Classification centroids.
Geosciences 13 00179 g0a13
Figure A14. Geoprocessing: cluster analysis using the K-means++ Cluster Algorithm. (a) Cluster groups detection. The relationship between the number of clusters and the WCSS is graphed. The number of clusters where the change in WCSS begins to level off is then selected (elbow method). (b) Data aggregation.
Geosciences 13 00179 g0a14

References

  1. Parcak, S. Archaeology from Space: How the Future Shapes Our Past; Henry Holt and Company: New York, NY, USA, 2019. [Google Scholar]
  2. Alexakis, D.; Sarris, A.; Astaras, T.; Albanakis, K. Detection of Neolithic settlements in Thessaly (Greece) through multispectral and hyperspectral satellite imagery. Sensors 2009, 9, 1167–1187. [Google Scholar] [CrossRef] [PubMed] [Green Version]
  3. Alexakis, D.; Sarris, A.; Astaras, T.; Albanakis, K. Integrated GIS, remote sensing and geomorphologic approaches for the reconstruction of the landscape habitation of Thessaly during the neolithic period. J. Archaeol. Sci. 2011, 38, 89–100. [Google Scholar] [CrossRef]
  4. Altaweel, M. The use of ASTER satellite imagery in archaeological contexts. Archaeol. Prospect. 2005, 12, 151–166. [Google Scholar] [CrossRef]
  5. Agapiou, A.; Lysandrou, V. Remote sensing archaeology: Tracking and mapping evolution in European scientific literature from 1999 to 2015. J. Archaeol. Sci. Rep. 2015, 4, 192–200. [Google Scholar] [CrossRef]
  6. Chen, F.; Lasaponara, R.; Masini, N. An overview of satellite synthetic aperture radar remote sensing in archaeology: From site detection to monitoring. J. Cult. Herit. 2017, 23, 5–11. [Google Scholar] [CrossRef]
  7. Henderson, F.M.; Lewis, A.J. (Eds.) Principles and applications of imaging radar. In Manual of Remote Sensing; John Wiley and Sons, Inc.: Hoboken, NJ, USA, 1998; Volume 2, ISBN 0-471-29406-3. [Google Scholar]
  8. Comer, D.C.; Harrower, M.J. Mapping Archaeological Landscapes from Space; Springer Science & Business Media: Berlin, Germany, 2013; Volume 5, ISBN 1-4614-6074-3. [Google Scholar]
  9. Lasaponara, R.; Masini, N.; Rizzo, E.; Orefici, G. New discoveries in the Piramide Naranjada in Cahuachi (Peru) using satellite, Ground Probing Radar and magnetic investigations. J. Archaeol. Sci. 2011, 38, 2031–2039. [Google Scholar] [CrossRef]
  10. Philibert, R. Archaeology from Space: Advanced Satellite Imagery Through the Work of Sarah Parcak. Spectrum 2017, 6, 6. [Google Scholar]
  11. Lasaponara, R.; Masini, N. Satellite Synthetic Aperture Radar in Archaeology and Cultural Landscape: An Overview; Wiley Online Library: Hoboken, NJ, USA, 2013; ISBN 1075-2196. [Google Scholar]
  12. Stewart, C.; Montanaro, R.; Sala, M.; Riccardi, P. Feature extraction in the North Sinai desert using spaceborne synthetic aperture radar: Potential archaeological applications. Remote Sens. 2016, 8, 825. [Google Scholar] [CrossRef] [Green Version]
  13. Cox, C. Satellite imagery, aerial photography and wetland archaeology: An interim report on an application of remote sensing to wetland archaeology: The pilot study in Cumbria, England. World Archaeol. 1992, 24, 249–267. [Google Scholar] [CrossRef]
  14. Sever, T.L.; Irwin, D.E. Landscape archaeology: Remote-sensing investigation of the ancient Maya in the Peten rainforest of northern Guatemala. Anc. Mesoam. 2003, 14, 113–122. [Google Scholar] [CrossRef] [Green Version]
  15. Hu, N.K.; Li, X. Historical ruins of remote sensing archaeology in arid desertified environment, northwestern China. In Proceedings of the IOP Conference Series: Earth and Environmental Science; IOP Publishing: Bristol, UK, 2017; Volume 57, p. 012028. [Google Scholar]
  16. Breeze, P.S.; Drake, N.A.; Groucutt, H.S.; Parton, A.; Jennings, R.P.; White, T.S.; Clark-Balzan, L.; Shipton, C.; Scerri, E.M.; Stimpson, C.M. Remote sensing and GIS techniques for reconstructing Arabian palaeohydrology and identifying archaeological sites. Quat. Int. 2015, 382, 98–119. [Google Scholar] [CrossRef]
  17. Deroin, J.-P.; Téreygeol, F.; Heckes, J. Evaluation of very high to medium resolution multispectral satellite imagery for geoarchaeology in arid regions–Case study from Jabali, Yemen. J. Archaeol. Sci. 2011, 38, 101–114. [Google Scholar] [CrossRef]
  18. Blom, R.; Zairins, J.; Clapp, N.; Hedges, G. Space Technology and the Discovery of the Lost City of Ubar; IEEE: Piscataway, NJ, USA, 1997; Volume 1, pp. 19–28. [Google Scholar]
  19. Sultan, M.; Sturchio, N.; Al Sefry, S.; Milewski, A.; Becker, R.; Nasr, I.; Sagintayev, Z. Geochemical, isotopic, and remote sensing constraints on the origin and evolution of the Rub Al Khali aquifer system, Arabian Peninsula. J. Hydrol. 2008, 356, 70–83. [Google Scholar] [CrossRef]
  20. Orengo, H.A.; Conesa, F.C.; Garcia-Molsosa, A.; Lobo, A.; Green, A.S.; Madella, M.; Petrie, C.A. Automated detection of archaeological mounds using machine-learning classification of multisensor and multitemporal satellite data. Proc. Natl. Acad. Sci. USA 2020, 117, 18240–18250. [Google Scholar] [CrossRef] [PubMed]
  21. Garcia-Molsosa, A.; Orengo, H.A.; Lawrence, D.; Philip, G.; Hopper, K.; Petrie, C.A. Potential of deep learning segmentation for the extraction of archaeological features from historical map series. Archaeol. Prospect. 2021, 28, 187–199. [Google Scholar] [CrossRef] [PubMed]
  22. Bachagha, N.; Elnashar, A.; Tababi, M.; Souei, F.; Xu, W. The Use of Machine Learning and Satellite Imagery to Detect Roman Fortified Sites: The Case Study of Blad Talh (Tunisia Section). Appl. Sci. 2023, 13, 2613. [Google Scholar] [CrossRef]
  23. Soriano, I.; Perea, A.; Escanilla, N.; Rodrigo, F.C.; Al Ali, Y.Y.A.; Karim, M.B.R.; Zein, H. Goldwork technology at the Arabian Peninsula. First data from Saruq al Hadid Iron Age site (Dubai, United Arab Emirates). J. Archaeol. Sci. Rep. 2018, 22, 1–10. [Google Scholar] [CrossRef]
  24. Herrmann, J.T.; Casana, J.; Qandil, H.S. A sequence of inland desert settlement in the Oman peninsula: 2008–2009 excavations at Saruq al-Hadid, Dubai, UAE. Arab. Archaeol. Epigr. 2012, 23, 50–69. [Google Scholar] [CrossRef]
  25. Weeks, L.; Cable, C.; Franke, K.; Newton, C.; Karacic, S.; Roberts, J.; Stepanov, I.; David-Cuny, H.; Price, D.; Bukhash, R.M. Recent archaeological research at Saruq al-Hadid, Dubai, UAE. Arab. Archaeol. Epigr. 2017, 28, 31–60. [Google Scholar] [CrossRef]
  26. Weeks, L.; Cable, C.M.; Franke, K.A.; Karacic, S.; Newton, C.; Roberts, J.; Stepanov, I.; McRae, I.K.; Moore, M.W.; David-Cuny, H. Saruq al-Hadid: A persistent temporary place in late prehistoric Arabia. World Archaeol. 2019, 51, 157–182. [Google Scholar] [CrossRef]
  27. Weeks, L.; Cable, C.M.; Karacic, S.; Franke, K.A.; Price, D.M.; Newton, C.; Roberts, J.; Al Ali, Y.Y.; Boraik, M.; Zein, H. Dating persistent short-term human activity in a complex depositional environment: Late Prehistoric Occupation at Saruq al-Hadid, Dubai. Radiocarbon 2019, 61, 1041–1075. [Google Scholar] [CrossRef]
  28. Karacic, S.; Weeks, L.; Cable, C.; Méry, S.; al-Ali, Y.; Boraik, M.; Zein, H.; Glascock, M.D.; MacDonald, B.L. Integrating a complex late prehistoric settlement system: Neutron activation analysis of pottery use and exchange at Saruq al-Hadid, United Arab Emirates. J. Archaeol. Sci. Rep. 2018, 22, 21–31. [Google Scholar] [CrossRef]
  29. El Rai, M.C.; Al-Saad, M.; Aburaed, N.; Al Mansoori, S.; Al-Ahmad, H.; Marshall, S. Automatic detection of potential buried archaeological sites in Saruq Al-Hadid, United Arab Emirates. In Proceedings of the Remote Sensing Technologies and Applications in Urban Environments V, Online, 21–25 September 2020; International Society for Optics and Photonics: Bellingham, WA, USA, 2020; Volume 11535, p. 115350G. [Google Scholar]
  30. Farrant, A.R.; Price, S.J.; Arkley, S.L.B.; Finlayson, A.; Thomas, R.J.; Leslie, A. Geology of the Al Lisaili 1: 100 000 Map Sheet, 100-6, United Arab Emirates; British Geological Survey: Nottingham, UK, 2012; ISBN 0-85272-716-X. [Google Scholar]
  31. Herrmann, J.T. Three-Dimensional Mapping of Archaeological and Sedimentary Deposits with Ground-penetrating Radar at Saruq al-Hadid, Dubai, United Arab Emirates. Archaeol. Prospect. 2013, 20, 189–203. [Google Scholar] [CrossRef]
  32. Longbotham, N.; Pacifici, F.; Malitz, S.; Baugh, W.; Camps-Valls, G. Measuring the spatial and spectral performance of WorldView-3. In Hyperspectral Imaging and Sounding of the Environment; Optical Society of America: Washington, DC, USA, 2015; p. HW3B.2. [Google Scholar]
  33. Stewart, C.; Lasaponara, R.; Schiavon, G. ALOS PALSAR analysis of the archaeological site of Pelusium. Archaeol. Prospect. 2013, 20, 109–116. [Google Scholar] [CrossRef]
  34. Kankaku, Y.; Sagisaka, M.; Suzuki, S. PALSAR-2 launch and early orbit status. In Proceedings of the 2014 IEEE Geoscience and Remote Sensing Symposium, Quebec City, QC, Canada, 13–18 July 2014; pp. 3410–3412. [Google Scholar]
  35. Bro, R.; Smilde, A.K. Principal component analysis. Anal. Methods 2014, 6, 2812–2831. [Google Scholar] [CrossRef] [Green Version]
  36. Calleja, J.F.; Pagés, O.R.; Díaz-Álvarez, N.; Peón, J.; Gutiérrez, N.; Martín-Hernández, E.; Relea, A.C.; Melendi, D.R.; Álvarez, P.F. Detection of buried archaeological remains with the combined use of satellite multispectral data and UAV data. Int. J. Appl. Earth Obs. Geoinf. 2018, 73, 555–573. [Google Scholar] [CrossRef]
  37. Wiseman, J.; El-Baz, F. Remote Sensing in Archaeology; Springer: Berlin/Heidelberg, Germany, 2007. [Google Scholar]
  38. Lasaponara, R.; Masini, N. Satellite remote sensing in archaeology: Past, present and future perspectives. J. Archaeol. Sci. 2011, 9, 1995–2002. [Google Scholar] [CrossRef]
  39. Tapete, D.; Cigna, F. Detection of archaeological looting from space: Methods, achievements and challenges. Remote Sens. 2019, 11, 2389. [Google Scholar] [CrossRef] [Green Version]
  40. Ball, G.H.; Hall, D.J. ISODATA, a Novel Method of Data Analysis and Pattern Classification; Stanford Research Inst.: Menlo Park, CA, USA, 1965. [Google Scholar]
  41. Adediran, A.O.; Parcharidis, I.; Poscolieri, M.; Pavlopoulos, K. Computer-assisted discrimination of morphological units on north-central Crete (Greece) by applying multivariate statistics to local relief gradients. Geomorphology 2004, 58, 357–370. [Google Scholar] [CrossRef]
  42. Orlando, P.; Villa, B. de Remote sensing applications in archaeology. Archeol. E Calc. 2011, 22, 147–168. [Google Scholar]
  43. Cable, C. SHARP S1 Excavation; University of New England: Armidale, NSW, Australia, 2015. [Google Scholar]
  44. Orengo, H.A.; Garcia, A.; Conesa, F.C.; Green, A.; Singh, R.N.; Petrie, C.A. Combining TanDEM-X with multi-temporal, multi-source satellite data for the reconstruction of the Bronze Age landscapes of the Indus Civilisation. In Proceedings of the IGARSS 2019-2019 IEEE International Geoscience and Remote Sensing Symposium, Yokohama, Japan, 28 July–2 August 2019; pp. 4581–4584. [Google Scholar]
  45. Lee, J.-S. Refined filtering of image noise using local statistics. Comput. Graph. Image Process. 1981, 15, 380–389. [Google Scholar] [CrossRef]
  46. Lee, J.-S.; Jurkevich, L.; Dewaele, P.; Wambacq, P.; Oosterlinck, A. Speckle filtering of synthetic aperture radar images: A review. Remote Sens. Rev. 1994, 8, 313–340. [Google Scholar] [CrossRef]
  47. Holcomb, D.W. Imaging radar and archaeological survey: An example from the Gobi Desert of Southern Mongolia. J. Field Archaeol. 2001, 28, 131–141. [Google Scholar]
  48. McHugh, W.P.; Breed, C.S.; Schabers, G.G.; McCauley, J.F.; Szabo, B.J. Acheulian sites along the “radar rivers” southern Egyptian Sahara. J. Field Archaeol. 1988, 15, 361–379. [Google Scholar]
  49. McCauley, J.F.; Schaber, G.G.; Breed, C.S.; Grolier, M.J.; Haynes, C.V.; Issawi, B.; Elachi, C.; Blom, R. Subsurface valleys and geoarcheology of the eastern Sahara revealed by shuttle radar. Science 1982, 218, 1004–1020. [Google Scholar] [CrossRef]
  50. Chapman, B.D.; Comer, D.C.; Isla, J.A.; Silverman, H. The measurement by airborne synthetic aperture radar (SAR) of disturbance within the Nasca world heritage site. Conserv. Manag. Archaeol. Sites 2015, 17, 270–286. [Google Scholar] [CrossRef]
  51. Comer, D.C.; Blom, R.G. Detection and Identification of Archaeological Sites and Features Using Synthetic Aperture Radar (SAR) Data Collected from Airborne Platforms; Springer: Berlin/Heidelberg, Germany, 2007; ISBN 0-387-44453-X. [Google Scholar]
  52. Stanislawski, L.V.; Shavers, E.J.; Wang, S.; Jiang, Z.; Usery, E.L.; Moak, E.; Duffy, A.; Schott, J. Extensibility of U-Net neural network model for hydrographic feature extraction and implications for hydrologic modeling. Remote Sens. 2021, 13, 2368. [Google Scholar] [CrossRef]
  53. Hack, J.T. Studies of Longitudinal Stream Profiles in Virginia and Maryland; US Government Printing Office: Washington, DC, USA, 1957; Volume 294. [Google Scholar]
  54. Knight, J.; Burningham, H. Sand dune morphodynamics and prehistoric human occupation in NW Ireland. Geol. Soc. Am. Spec. Pap. 2011, 476, 81–92. [Google Scholar]
  55. Argyrou, A.; Agapiou, A. A Review of Artificial Intelligence and Remote Sensing for Archaeological Research. Remote Sens. 2022, 14, 6000. [Google Scholar] [CrossRef]
  56. Ronneberger, O.; Fischer, P.; Brox, T. U-net: Convolutional networks for biomedical image segmentation. In Proceedings of the Medical Image Computing and Computer-Assisted Intervention–MICCAI 2015: 18th International Conference, Munich, Germany, 5–9 October 2015; Part III 18. Springer: Berlin/Heidelberg, Germany, 2015; pp. 234–241. [Google Scholar]
  57. Min, Z.; Kai-fei, D. Improved Research to K-means Initial Cluster Centers. In Proceedings of the 2015 Ninth International Conference on Frontier of Computer Science and Technology, Dalian, China, 26–28 August 2015; pp. 349–353. [Google Scholar]
  58. Hastie, T.; Tibshirani, R.; Friedman, J.H.; Friedman, J.H. The Elements of Statistical Learning: Data Mining, Inference, and Prediction; Springer: Berlin/Heidelberg, Germany, 2009; Volume 2. [Google Scholar]
  59. Schölkopf, B.; Smola, A.; Müller, K.-R. Kernel principal component analysis. In Proceedings of the Artificial Neural Networks—ICANN’97: 7th International Conference, Lausanne, Switzerland, 8–10 October 1997; Springer: Berlin/Heidelberg, Germany, 2005; pp. 583–588. [Google Scholar]
  60. Colwell, J.E. Vegetation canopy reflectance. Remote Sens. Environ. 1974, 3, 175–183. [Google Scholar] [CrossRef]
  61. Strahler, A.H. Vegetation canopy reflectance modeling—Recent developments and remote sensing perspectives. Remote Sens. Rev. 1997, 15, 179–194. [Google Scholar] [CrossRef]
  62. Lin, Y.; Tian, Q.; Qiao, B.; Wu, Y.; Zuo, X.; Xie, Y.; Lian, Y. A Synthetic Angle Normalization Model of Vegetation Canopy Reflectance for Geostationary Satellite Remote Sensing Data. Agriculture 2022, 12, 1658. [Google Scholar] [CrossRef]
  63. Ben-Dor, E.; Irons, J.R.; Epema, G.F. Soil reflectance. Remote Sens. Earth Sci. Man. Remote Sens. 1999, 3, 111–188. [Google Scholar]
  64. Heiden, U.; d’Angelo, P.; Schwind, P.; Karlshöfer, P.; Müller, R.; Zepp, S.; Wiesmeier, M.; Reinartz, P. Soil Reflectance Composites—Improved Thresholding and Performance Evaluation. Remote Sens. 2022, 14, 4526. [Google Scholar] [CrossRef]
  65. Stepanov, I.; Weeks, L.; Franke, K.; Rodemann, T.; Salvemini, F.; Cable, C.; Al Ali, Y.; Radwan, M.B.; Zein, H.; Grave, P. Scrapping ritual: Iron Age metal recycling at the site of Saruq al-Hadid (UAE). J. Archaeol. Sci. 2019, 101, 72–88. [Google Scholar] [CrossRef]
  66. Valente, T.; Contreras Rodrigo, F.; Mahmud, A.; Boraik Radwan Karim, M.; Al Mansoori, M.S.; Zein, H. Five seasons of excavations in Areas 2A and G of Saruq al-Hadid (Dubai, UAE): Iron Age II evidences of copper production, workshop area and ceremonial activities. Isimu 2020, 23, 169–195. [Google Scholar] [CrossRef]
  67. Chang, Y.-W.; Hsieh, C.-J.; Chang, K.-W.; Ringgaard, M.; Lin, C.-J. Training and testing low-degree polynomial data mappings via linear SVM. J. Mach. Learn. Res. 2010, 11, 1471–1490. [Google Scholar]
  68. Clark, C.D.; Garrod, S.M.; Pearson, M.P. Landscape archaeology and remote sensing in southern Madagascar. Int. J. Remote Sens. 1998, 19, 1461–1477. [Google Scholar] [CrossRef]
  69. Maktav, D.; Crow, J.; Kolay, C.; Yegen, B.; Onoz, B.; Sunar, F.; Coskun, G.; Karadogan, H.; Cakan, M.; Akar, I. Integration of remote sensing and GIS for archaeological investigations. Int. J. Remote Sens. 2009, 30, 1663–1673. [Google Scholar] [CrossRef]
  70. Agapiou, A.; Hadjimitsis, D.G.; Alexakis, D.D. Development of an image-based method for the detection of archaeological buried relics using multi-temporal satellite imagery. Int. J. Remote Sens. 2013, 34, 5979–5996. [Google Scholar] [CrossRef]
  71. Agapiou, A.; Lysandrou, V.; Sarris, A.; Papadopoulos, N.; Hadjimitsis, D.G. Fusion of satellite multispectral images based on ground-penetrating radar (GPR) data for the investigation of buried concealed archaeological remains. Geosciences 2017, 7, 40. [Google Scholar] [CrossRef] [Green Version]
  72. Parcak, S. Moving from space-based to ground-based solutions in remote sensing for archaeological heritage: A case study from Egypt. Remote Sens. 2017, 9, 1297. [Google Scholar] [CrossRef] [Green Version]
  73. Wheatley, D.; Gillings, M. Spatial Technology and Archaeology: The Archaeological Applications of GIS; CRC Press: Boca Raton, FL, USA, 2013. [Google Scholar]
  74. Brooke, C. Thermal imaging for the archaeological investigation of historic buildings. Remote Sens. 2018, 10, 1401. [Google Scholar] [CrossRef] [Green Version]
  75. Gxokwe, S.; Dube, T.; Mazvimavi, D. Multispectral remote sensing of wetlands in semi-arid and arid areas: A review on applications, challenges and possible future research directions. Remote Sens. 2020, 12, 4190. [Google Scholar] [CrossRef]
  76. Govender, T.; Dube, T.; Shoko, C. Remote sensing of land use-land cover change and climate variability on hydrological processes in Sub-Saharan Africa: Key scientific strides and challenges. Geocarto Int. 2022, 37, 10925–10949. [Google Scholar] [CrossRef]
  77. Ghoneim, E. Optimum groundwater locations in the northern United Arab Emirates. Int. J. Remote Sens. 2008, 29, 5879–5906. [Google Scholar] [CrossRef]
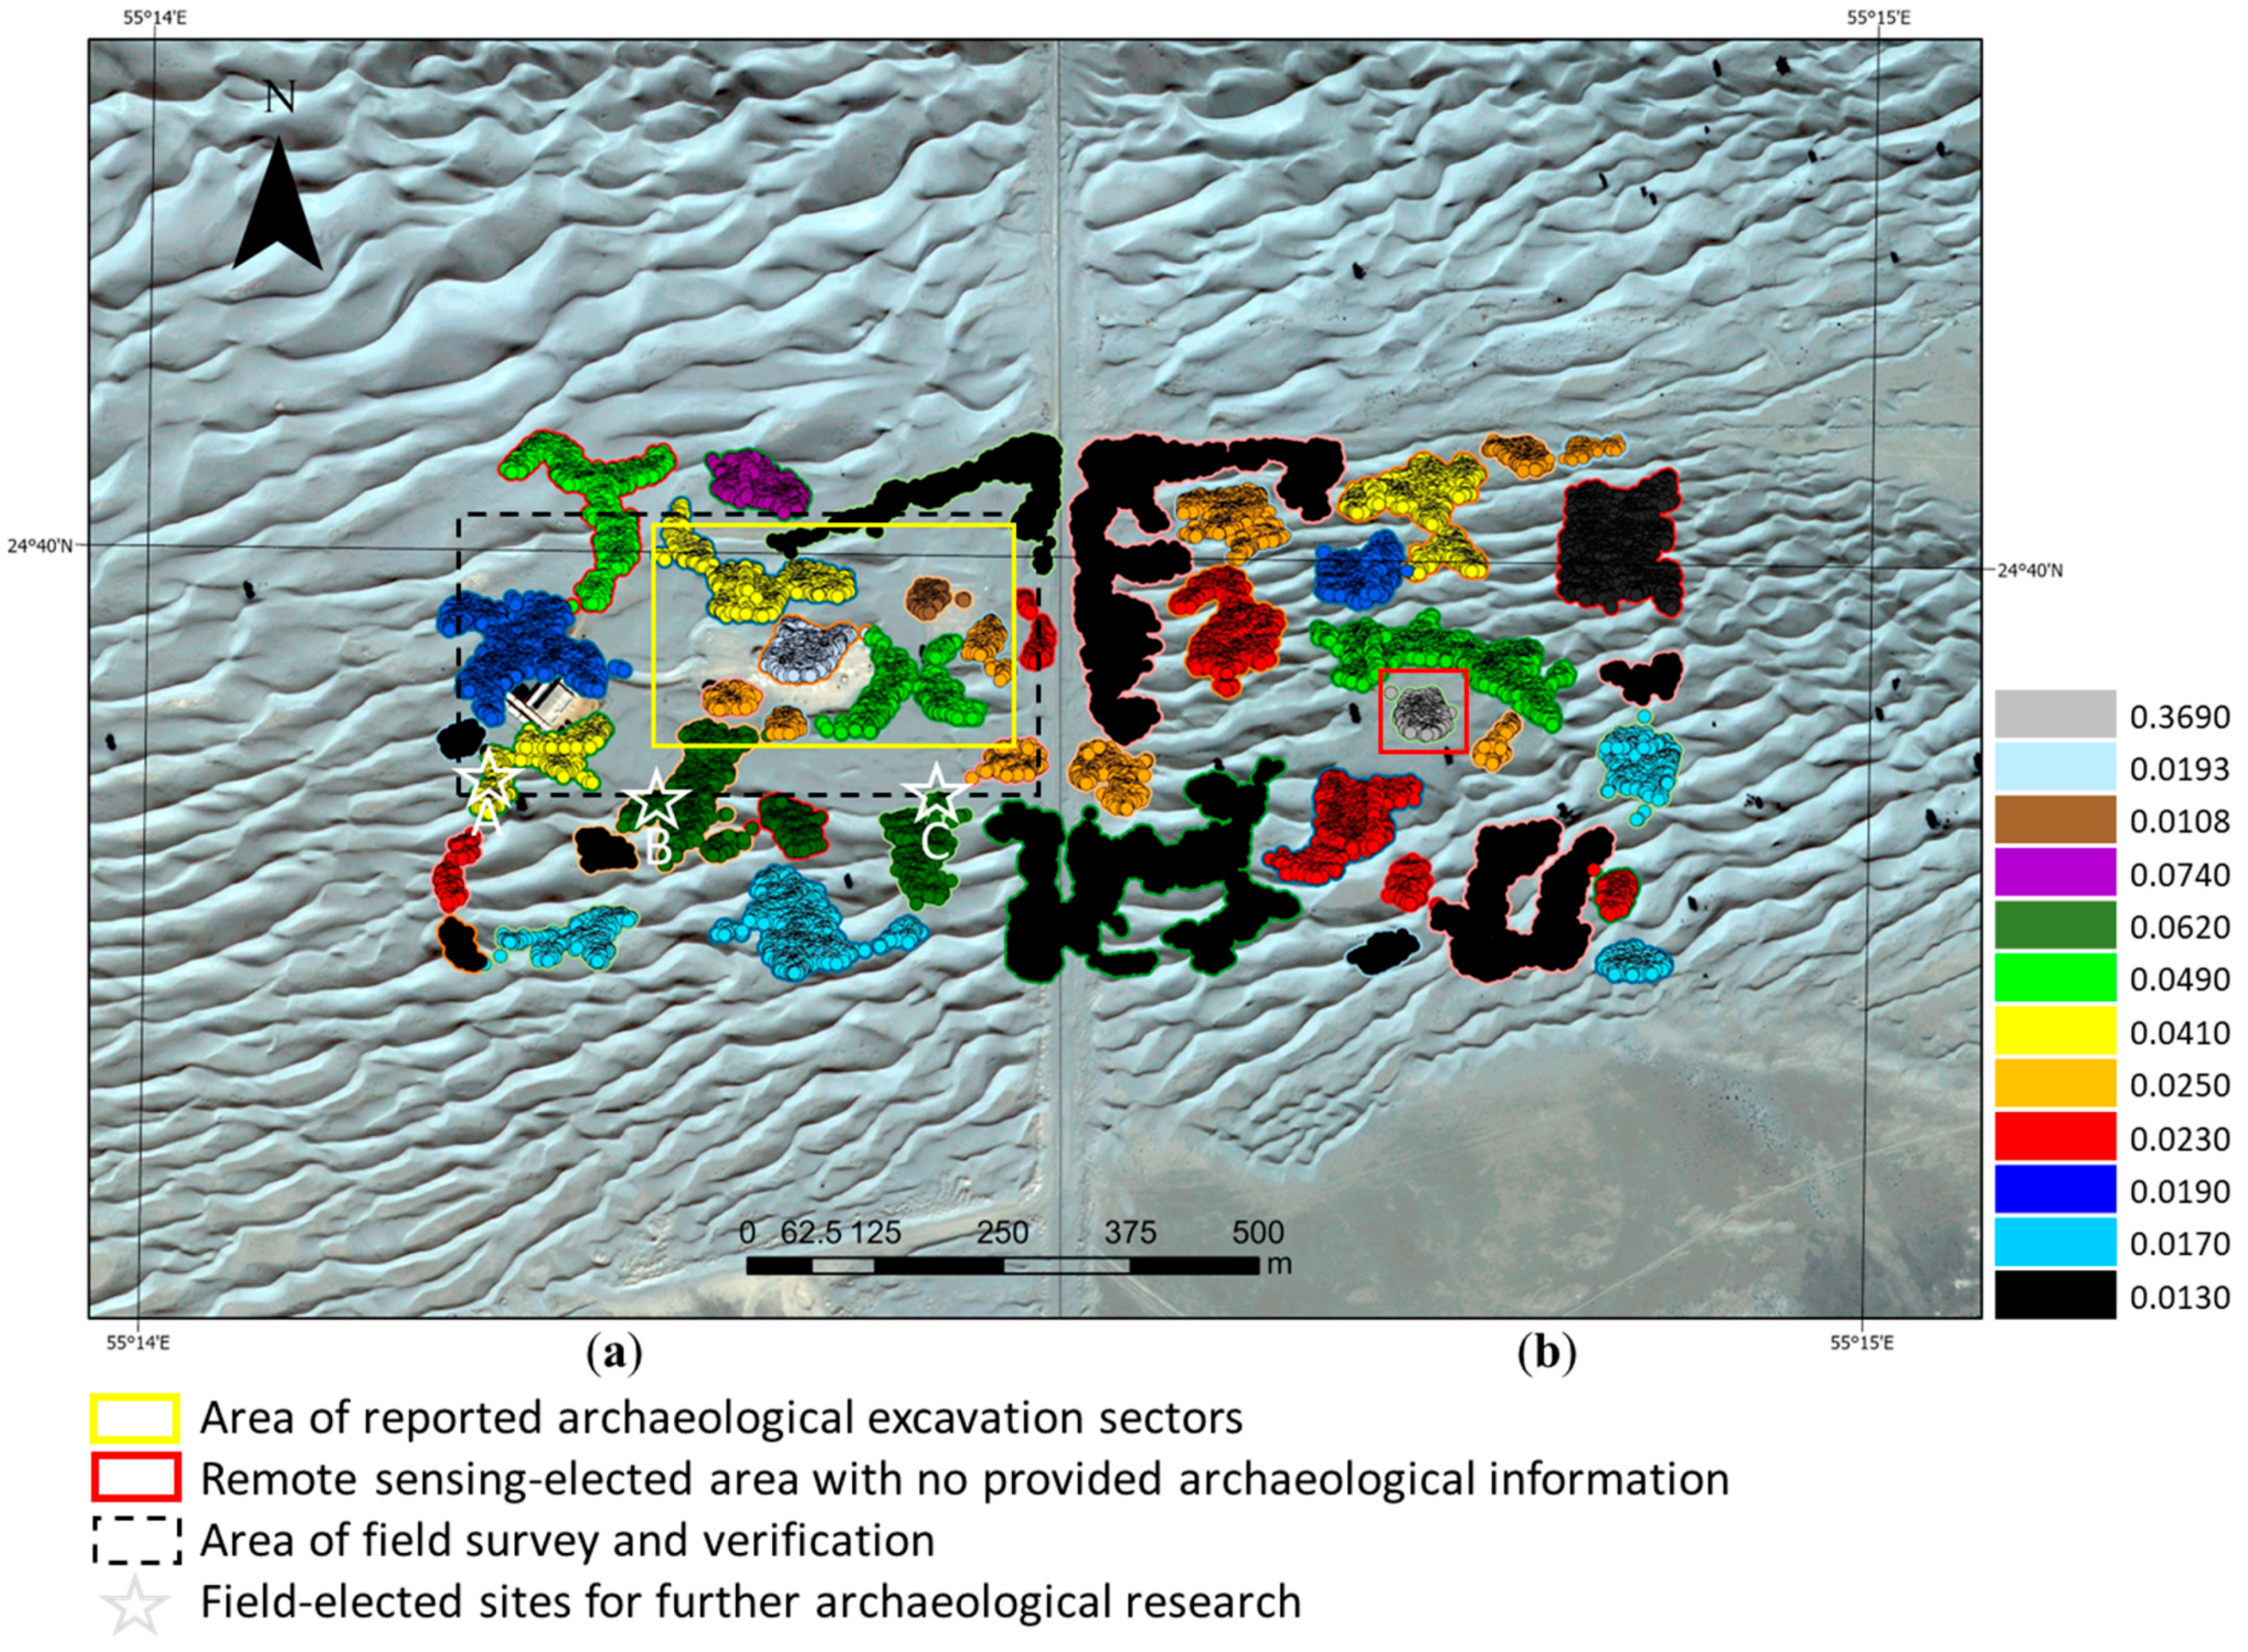
Figure 1. (a) Left inset: Saruq Al-Hadid archaeological site (24°39′47″ N 55°13′55″ E). Middle inset: Worldview-3 multispectral image (left scene—19 August 2019; central scene—19 November 2019; right scene—9 January 2019). Right inset: ALOS-2/PALSAR2 (L-band) image (2015-05-17T20:15:36Z). (b) Metalworking slag interspersed with metal artefacts, ceramics, and other cultural material. (c) Slag artefacts on the dune surface extending to over 1 km2 post-excavation.
Geosciences 13 00179 g001
Figure 2. (a) The basic stratigraphy of the study area consisting of the geological bedrock of the Barzaman Formation and the overlying longitudinal dune ridges. Prosopis cineraria trees, also known as Ghaf, can be seen in the interdunal area. (b) The gypsum pavement which underlies the excavation in the middle of the site has an elevation of approximately 100 m above sea level. This pavement is exposed at several locations in the study area. (c) The general stratigraphic setting of (1) the surface deposits with abundant evidence of metallurgical production debris and other artifacts and archaeological remains; (2) the thick series of intermittent occupation/deposition activities represented by diffuse material remains in a sandy matrix, including a variety of artefacts and slag; (3) a buried dune horizon marked by a particularly dense concentration of artefacts laid down over what may have been an informal ‘platform’ incorporating a high frequency of rough sandstone blocks; and (4) a series of midden deposits characterised by a very high frequency of animal bone, often forming concentrated layers that may reflect deflation.
Geosciences 13 00179 g002
Figure 3. The adopted approach for analysing and interpreting the multispectral and radar data. Number-indexed bands correspond to multispectral bands acquired in the different regions of the electromagnetic spectrum: B2 (Blue (B): 450–510 nm), B3 (Green (G): 510–580 nm), B5 (Red (R): 630–690 nm), B6 (Red Edge: 705–745 nm), and B7 (Near Infrared 1: 770–895 nm). Number-indexed principal components (PC) were obtained using the principal component analysis (PCA). The PCs are ranked using the variation in the data (largest to smallest), as elaborated in Section 3.1.1 and Appendix B. Band ratios, e.g., the normalised difference vegetation index (NDVI) and the normalised high-frequency difference index (NHFD), were produced used spectral band transformation, as detailed in Section 3.1.1 and Appendix C.
Geosciences 13 00179 g003
Figure 4. The adopted geospatial analysis process.
Geosciences 13 00179 g004
Figure 5. Processing the geospatial data using the AI’s DL and ML algorithms.
Geosciences 13 00179 g005
Figure 6. Worldview-3 colour-balanced RGB orthomosaic of the Saruq Al-Hadid site located in the mobile dune fields of the northeastern edge of the Rub’ Al-Khali desert, captured on 26 November 2019. (a) Western zone of observation. (b) Eastern zone of observation.
Geosciences 13 00179 g006
Figure 7. Thematic classification. (a) Unsupervised classification of PC1PC2PC3 (enhanced/aggregated) followed by smoothing using smooth kernel size = 3 pixels. (b) Aggregation and class relabelling. Aggregate minimum size = 9 regions. Classes 1 to 3 = water classes. Classes 20 to 22 = excavation classes.
Geosciences 13 00179 g007aGeosciences 13 00179 g007b
Figure 8. RGB composite is made of the standard deviation, minimum, and gradient indices produced during the single-date feature extraction of the area visualised in Figure 6. The vertical alignment of bright areas corresponds to the road that separates the western zone from the eastern zone of the study area. The area encircled in yellow represents an approximate zonation of previous and ongoing excavations.
Geosciences 13 00179 g008
Figure 9. The different post-processed polarised bands. (a) HH. (b) HV. (c) VH. (d) VV.
Geosciences 13 00179 g009
Figure 10. RGB composite is made of the HH-VV-HH band combination. Area encircled in yellow represents previous and ongoing excavations. Area encircled in red represents areas with no information provided to date on excavation works.
Geosciences 13 00179 g010
Figure 11. Dune pattern detection using convolutional neural networks (CNN) in the Saruq Al-Hadid site and surroundings. (a) Input image. (b) Feature extraction and pattern classification. (c) Dune pattern map. (d) Automation of dune pattern detection.
Geosciences 13 00179 g011
Figure 12. Reclassification of the study site, based on its landscape context and multimodal data, into three main geomorphological assemblages. The area of field survey and verification contained the reported main excavation sectors and surroundings. Based on the field surveys, three site locations were elected for future archaeological investigation: A (55°14′11.616″ E 24°39′52.58″ N), B (55°14′18.603″ E 24°39′51.519″ N), and C (55°14′28.123″ E 24°39′51.499″ N). To the best knowledge of the authors as of the current study time frame, there are no reports on excavation works within the area contained in the eastern zone of the study area.
Geosciences 13 00179 g012
Figure 13. Cluster decomposition and geospatial distribution in the Saruq Al-Hadid site. Throughout the study area, dunes and recent constructions have low variances (<0.0190). (a) Reported excavations areas and field-elected site locations for archaeological investigation (A, B and C) showed higher values (>0.0250). (b) The remote-sensing elected area (eastern zone) was clustered using the highest variance (0.3690).
Geosciences 13 00179 g013
Figure 14. Extending the search area geographically to guide the archaeological activities and research provided that more recent data are collected for further validation and improvement of the modelling and prediction accuracies. (a) Area encircled in yellow is at the convergence of previous and ongoing excavations. (b) Area encircled in red is predicted to contain archaeological features, as elected by the integrated remote sensing and geospatial research approach. This area is considered the focus of future investigations.
Geosciences 13 00179 g014
Table 1. Covariance of independent variables calculated using the ML Kernel PCA decomposition algorithm.
123456789101112
Probability of IV0.3690.1930.1080.0740.0620.0490.0410.0250.0230.0190.0170.013
Disclaimer/Publisher’s Note: The statements, opinions and data contained in all publications are solely those of the individual author(s) and contributor(s) and not of MDPI and/or the editor(s). MDPI and/or the editor(s) disclaim responsibility for any injury to people or property resulting from any ideas, methods, instructions or products referred to in the content.

