Article

Compilation of Regional Homogeneous Seismic Catalog for Identification of Tsunamigenic Zones in the Black Sea Region

1
National Institute of Geophysics, Geodesy and Geography—Bulgarian Academy of Sciences (NIGGG—BAS), 1113 Sofia, Bulgaria
2
Department of Earth and Environmental Sciences, Ludwig Maximilian University of Munich (LMU), 80539 München, Germany
*
Author to whom correspondence should be addressed.
Geosciences 2023, 13(8), 221; https://doi.org/10.3390/geosciences13080221
Submission received: 22 June 2023 / Revised: 15 July 2023 / Accepted: 20 July 2023 / Published: 25 July 2023
(This article belongs to the Special Issue Management of Natural Disaster in Coastal Zones)

Abstract

:
Although tsunamis in the Black Sea are rare and less destructive, recently, their study has been the subject of interest due to the increasing concentration of population and infrastructure in low-lying coastal areas. This study aims to elucidate the spatial–temporal characteristics of earthquakes in the Black Sea region (27° E–42° E and 40° N–47° N) over a century to clarify the seismicity pattern further to be used for probabilistic seismic and tsunami hazard analysis. Significant volumes of seismic data from international and national databases were analyzed, and the results obtained from previous research were supplemented and expanded. Earthquakes over the period 1905–2022 from eight up-to-date seismic catalogs were used to compile a unified catalog after conversion to the moment magnitude scale Mw. The best-fit linear relationship between several magnitude scales and Mw was determined using the general orthogonal regression (GOR) and the least squares method (LSM). After the declustering procedure, the compiled catalog consists of 18,528 unique events. To assess the catalog data quality, the magnitude of completeness Mc was estimated for the entire catalog (1905–2022) and the so-called instrumental catalog (1977–2022). In addition, the spatial distribution of the completeness magnitude Mc and the recurrence b-plot slope in the Gutenberg–Richter distribution law were assessed using the goodness-of-fit and maximum likelihood methods from the instrumental catalog data. Finally, the most significant earthquakes within the Black Sea boundaries were estimated with their parameters and focal mechanisms. A possibility of the realization of strong quakes in the near future with tsunamigenic potential in the Black Sea region was concluded.

Graphical Abstract

1. Introduction

Adequate quantification of tsunami risk on populated seashores is a theoretical and practical problem in the Earth sciences. The consequences of the tsunamis in the Indian Ocean in 2004, Tohoku, Japan, in 2011, Sulawesi, Indonesia, in 2018, and the Aegean Sea in 2020 showed that the underestimating of this hazard has led to catastrophic long-term effects for coastal populations, the economy, and the environment [1,2,3,4]. The lack of reliable historical data on tsunami occurrences, characteristic of many coasts, stimulated the development of methods for assessing the tsunami hazard and the risk based on information about the seismic activity described in the scientific literature [5,6,7], as well as magnitude scales for tsunamis [8]. Modern methods for calculating the maximum heights of tsunami waves with a particular frequency are based on the statistics of known tsunami events, instrumental measurements, historical data, and oral accounts of eyewitnesses.
The analysis of tsunamis in the Black Sea region has been the subject of scientific interest in the past several decades due to the increasing concentration of population, the construction of infrastructure, and tourist sites in low-lying coastal areas [9,10,11,12]. Although there have been no observations of strong or catastrophic effects of tsunami waves in the Black Sea compared to other parts of the world, such as the Pacific and Indian Oceans, in the last century, there are historical tide gauge records of tsunami events at specific coastal locations in the study area. Such events are, for example, due to offshore earthquakes in 1927 and 1966 close to the northern and northeastern coast of the Black Sea [12]. Another tsunami phenomenon occurred after the very strong earthquake on land known as the Erzincan earthquake in 1939, when the sea receded in the coastal cities of Ordu, Fatsa, and Uniye (Northern Turkey) by about 15 m, 50 m, and 100 m, respectively, and then it advanced to the land [13].
Experimental research through numerical modeling and simulation under different scenarios is a necessary step to clarify the tsunamigenic potential in the Black Sea region due to the small number of tsunamis documented in the chronicles and the limited number of recorded post-earthquake events through continuous tide-gauge observations along the coast [14,15,16,17]. Many studies have been published in the scientific literature using different software programs for single or multiple-event numerical model simulations, different input parameters for earthquakes or other sources generating tsunamis (subaerial or submarine landslides, meteorological phenomena, etc.), various scenarios, and different spatial and temporal resolutions of the data used [18,19,20,21,22,23,24,25]. However, targeted studies of seismogenic faults as a major source that can trigger tsunamis are very rare. For example, such analyses have been conducted for specific coastal locations, such as those in [26,27,28,29,30]. In the case of commercial oil and natural gas exploration, e.g., [31], the data are difficult to access for scientific research.
In scientific studies, modeling and simulations of tsunamigenic phenomena in the Black Sea region are necessary to consider different tsunamigenic geometric dimensions, correctly interpret different responses at distant and local sources, and reliably determine the input parameters of the source zones. The lack of digital and analog pen-and-paper records from tide gauge stations along the coast further limits achieving a certain accuracy of the estimated wave parameters. For this reason, recent tsunami hazard and risk assessment studies of the entire Black Sea region are usually performed with a dataset of varying quality and completeness regardless of what source they are generated from and are based on previously published data or research [9,12,16,22,24,32]. More than 20 tsunami events, established from the recorded and described historical data in the scientific literature, were mainly caused by earthquakes in the coastal zone or on land near the coastline of the Black Sea. Therefore, the availability of a complete and comprehensive earthquake catalog for a specific study area is a prerequisite for performing a qualitative and thorough probabilistic seismic and tsunami hazard analysis. Furthermore, each seismic catalog is an essential source of information about the background earthquakes and earthquake sequences in the studied region and its local sub-areas, with specific seismotectonic settings [6].
Several publications on historical Black Sea seismicity and tsunami catalogs report earthquakes of a magnitude greater than 7 (M ≥ 7) [8,22,32], most of which have generated tsunamis in the past. From 1650 to the present, evidence of five moderate intensity 4 ≤ K < 7 tsunamis on the 12-point tsunami intensity scale has been identified [8]. According to the study of Triantafyllou et al. [32] for tsunami intensities 5, 6, and 7 in the Black Sea, the return periods in this basin are 46, 128, and 1660 years, respectively.
In order to determine the seismogenic zones in the Black Sea region that can cause tsunamis, it is necessary to analyze a lot of geological, tectonic, and seismological information, which is assumed to be complete, accurate, and reliable for scientific conclusions. Therefore, a homogeneous data set of seismic events in the study area related to activated tectonic faults or their segments and properly defined earthquake parameters is needed to determine the seismogenic sources. These requirements are often difficult to meet from the available observational data. Although tectonic fault databases have been developed, such as those presented in [33,34], a comprehensive study of individual seismogenic zones in the Black Sea Basin with a detailed exploration of active faults related to their tsunamigenic potential is still limited or at an initial stage, as described above.
Following this trend, this study aims to analyze the spatial and temporal seismic activity from 1905 to 2022 in the Black Sea region and adjacent coastal territories as potential tsunami sources supplementing the research presented by Dimitrova et al. [35]. As a first step for a detailed assessment of the tsunamigenic potential of fault zones in the Black Sea region, 
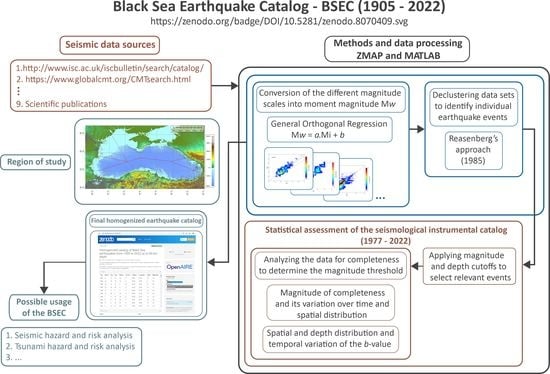
Section 2 presents the study region, data, and methods used to compile a regional seismic catalog called the Black Sea Earthquake (BSE) catalog, which is described in Section 3. The catalog has been compiled using earthquake bulletins published by the international data centers ISC, GCMT, USGS, EMSC, Romanian and Turkish catalogs, and earthquake bulletins extracted from scientific publications. In addition, the newly compiled Bulgarian national catalog by Solakov et al. [36] has also been added to the produced earthquake catalog. The unification of the seismic events from the used catalogs was performed after converting the different magnitude scales into moment magnitude for five distinct geographical polygons. The obtained results polygon by polygon are given in Section 4. Next, the completeness and quality of a newly compiled catalog have been assessed and discussed in Section 5. In addition, we investigated the distribution of the strongest earthquakes (Mw ≥ 5) that occurred offshore and inland in the Black Sea region. With focal mechanisms and spatial distribution of the b-values assessed from a newly compiled regional seismic catalog of completeness, an interpretation of future seismic activity is suggested. Section 6 reviews the newly compiled catalog and its applications for other seismicity and hazard assessment investigations in the Black Sea region. Finally, some inferences related to the tsunamigenic potential of earthquake sources are summarized in the conclusion section.

2. Study Region

For the presented study, we outlined a region within the boundaries 27° E–42° E and 40° N–47° N covering the Black Sea basin (Figure 1). Seismic sources and zones in the Black Sea region, including those with tsunamigenic potential, are defined according to various indicators presented in the scientific literature. Different zoning schemes have been proposed depending on the seismic sources of tsunamis. For example, Ranguelov and Gospodinov [37] suggested that the primary seismic sources are located in the Eastern, North Caucasus, Crimea, Shabla-Kaliakra and the Southern part of the basin. Based on the maps of earthquake locations and the zones with active tectonics, Moldovan et al. [22] suggested seismic zoning consisting of ten areas with different spatial extents and seismic sources falling in and along the Black Sea coast.
In this study, we conditionally divide the Black Sea region into five sub-areas (polygons), shown in Figure 1, following the Grünthal and Wahlström approach [37]. These polygons are a Northwestern Polygon (NWP) covering the territory of eastern Romania, southern Moldova and Southwestern Ukraine; a Northern Polygon (NP) covering Southeastern Ukraine and Southern Russia; an Eastern Polygon (EP) covering Southeastern Russia and Western Georgia; a Southern Polygon (SP) covering Northern Turkey; and a Western Polygon (WP), covering the eastern coast of Bulgaria. The grounds for such zoning are based on following the coastal state borders and almost coincide with those of the exclusive economic zones of the individual countries, as Ukrainian and Russian are united, within which the local seismic catalogs are preferably prepared. In each of the polygons thus selected, data from one or more seismic catalogs were used to ensure a sufficient number of seismic events with reliably determined parameters.

3. Materials and Methods

3.1. Seismic Datasets

Updating and maintaining magnitude-homogeneous earthquake catalogs is an ongoing commitment of international and national seismic services. The goal is to integrate local data sources on a region-by-region basis in any current catalog, selecting sources by hierarchy and applying established empirical models to convert magnitudes from disparate locally reported scales to a standard proxy magnitude scale, equivalent to a moment magnitude Mw [38]. However, inevitable changes in the configuration of national seismic networks and analysis procedures lead to bias in the hypocenter parameters of recorded earthquakes and the uncertainty estimates reported in such catalogs.
Over the past few decades, the monitoring and analysis of regional seismicity have been greatly improved by upgrading and densifying the national seismic networks of coastal countries in the Black Sea region. The earthquake catalogs covering the study area’s seismic activity have been compiled and unified by various international and national institutions (as mentioned in Section 2), providing services for real-time seismic events and other seismic products. Unlike a previous study by Dimitrova et al. [35] in which seismic events with a magnitude of M ≥ 3 were analyzed for the period AD 20–2021, this one uses collected earthquake records from more sources, including earthquakes with a magnitude of M ≥ 1 from the beginning of the last century (1905–2022). We used data from nine up-to-date global and local earthquake catalogs, namely:
Table 1 describes the local catalogs used in the polygons and their time range. The global catalogs (1), (2), (3), and (4) are used in all polygons for the cited periods.
The seismic events extracted from the catalogs used in this study have different parameters and magnitude scales, such as mb, MPVA, ML, Ms, md, and unreported type of magnitude or without magnitude. The data set used in this study contains 54,918 earthquakes; a significant number of them, 46,532, are without specified magnitude. The minimum magnitude values of analyzed events are equal to that in the individual catalogs. For all used catalogs, the magnitude estimates from different scales are reported in Table 2.

3.2. Methods

The compilation and homogenization of the BSE catalog are based on the five geographic polygons shown in Figure 1, with local data sources and selection hierarchies applied polygon-by-polygon given in Table 1. Different magnitude estimates were converted to the more reliable and valuable scale, namely the moment magnitude Mw. The resulting magnitude is written as Mw-proxy—homogenized quantity.
The most common methods presented in the scientific literature to derive empirical relationships between different magnitudes and Mw are ordinary least squares (OLS), general orthogonal regression (GOR), and maximum likelihood (ML) [55,56,57,58,59]. Although each method has advantages and disadvantages compared to the others, in this study, magnitude conversion relationships were derived using the GOR procedure, which considers errors of both magnitude scales [55,56]. The GOR method minimizes the absolute difference of the residuals; therefore, the extreme values have less influence on the fit. Using such orthogonal regressed transformation of the discrete magnitude scales into a single instantaneous magnitude subsequently leads to a more realistic assessment of the seismic hazard.
We determined the empirical magnitude conversion relationship by performing regression analysis following the procedures and recommendations described by Castellaro et al. [57], Scordilis [58], and Gasperini et al. [59]. Different magnitude scales were converted into Mw-proxies based on empirically derived inter-magnitude relations via the MATLAB platform [60]. Calculations were conducted using seismic events available in the respective catalogs for each of the five polygons shown in Figure 1. The regression equation between two magnitude scales is as follows:
Mw = a Mi + b,
where Mi is, respectively, Mb, Md, ML, or Ms and Mw magnitude available in the used seismic catalogs determined by international agencies or regional or domestic networks for the same event. The empirical coefficients a and b are estimated separately by the least squares method for each of the five polygons. As a result of the evaluation, negligible bias was observed in the linear equations derived by the GOR. The residual for the i-th data point ri is defined as the difference between the observed value (in the case magnitudes Mb, ML, Md, Ms), and the response yi (in the case Mw) is identified as associated with the data error [61].
The next necessary step is to decluster the compiled BSE catalog to produce a homogenized catalog that can be used to analyze the seismicity in the region under study, hazard analyses, etc. The declustering algorithm by Reasenberg [62] is applied to homogenize the earthquake catalog (1905–2022) based on connecting events in clusters according to adaptive space–time interaction zones and suggesting that both the space and time marginal components of an appropriate background field are Poissonian [63]. This declustering algorithm has been applied in several approaches to create homogenized catalogs, including for the Black Sea regions, for example, by Tan [64]. Seismic data sets have been processed by the ZMAP seismology software [65] using the MATLAB platform [60], which is routinely applied in seismological practice to evaluate catalog quality and the performance of seismic networks. In addition, uncertainties on Mc and b-value are determined using a bootstrap approach [66].

4. Results

4.1. Empirical Relation between Different Magnitude Scales

The equations obtained after applying the regression analysis method GOR are given in tabular form for each outlined polygon shown in Figure 1. The obtained empirical relations between moment magnitude (Mw-proxy) and any other magnitude in the catalogs (mb, ML, Ms, etc.), are given in the first column of the presented in the following tables of this Section 4. The second and the third columns are the standard deviations (degree of uncertainty) of the empirical parameters a and b. The other two columns fill out the number used in the relations and their magnitude range earthquakes. The value of the so-called linear correlation coefficient R-square is in the last column. The magnitude relations in the tables are presented graphically, and the data density is shown with a relative color scale ranging from 0–10. The used number of magnitude pairs N is indicated upper left in each panel. The solid blue lines are the best linear fit of the regressions. The dashed lines represent the 95% (±2σ) confidence interval.

4.1.1. Northwestern Polygon (NWP)

Magnitude relations between Mw (Mw-proxy) and mb, md, and ML are given in Table 3 and the three graphs in Figure 2. In the first column, the analyzed data sets are presented graphically, and in the second column, the obtained estimates of the parameters of the linear dependencies are shown. The relation md-Mw is derived using the most data set—576 pairs of earthquakes (Figure 2b) compared to the relation Ml-Moment using 190 (Figure 2c) and mb-Mw—167 (Figure 2a), respectively. The largest magnitude range (2.1 < mb < 6.6) refers to the mb-Mw relation, and the most population of the data is in the magnitude interval from 2.0 to 4.6. A narrower range of 2.0 < md < 4.6 refers to the md-Mw relation, where the most significant density above 5 ranges from 2 to 3.8. The relation Ml-Mw refers to the narrowest range (2.3 < Ml < 4.5), where the data population is concentrated in the magnitude range between 2.3 and 3.5. According to the correlation coefficients (R2) and the degrees of uncertainty (±2σ) in Table 3, the best correlation relates to the Moment and md magnitude scales.

4.1.2. Northern Polygon (NP)

The inferred relations of Mw-proxy as a function of mb, ML, and MPVA are given in Table 4 and graphically in Figure 2.
The regression lines of minimum discrepancy are well correlated with the data distribution. For example, the relation between mb and Mw (Figure 3a) shows that the difference at low magnitude values (mb = 2.1) is 0.7, decreasing to 0.1 at mb = 3.3. and increases to 0.5 magnitude units at the largest values. The ML/Mw regression (Figure 3b) is determined from 46 pairs of earthquakes; the magnitude difference at ML = 2.0 is 0.7 at ML = 3.3, it is 0.2, and at high magnitude values, two scales almost coincide—ML = 4.0 and Mw = 4. The least amount of data (only 12 pairs) is used to find the linear regression MPVA/ Mw (Figure 3c). The magnitude difference for all considered earthquakes is about 0.5, which is also noticeable from the regression equation obtained. The resulting relations show the strongest correlation (adjusted R-square = 0.9027) between the local magnitude ML and the moment magnitude Mw.

4.1.3. Eastern Polygon (EP)

Table 5 gives the relations Mw as a function of mb, md, ML, and MS. Figure 3 shows the graphs of the relations, respectively.
We found that all relations are linear, and the regression lines of minimal discrepancy correlate well with the data distribution. The slopes of the mb and ML regression lines are close to 1 (parameter a is almost equal to 1), and their intercept values with the vertical axis are negative (parameter b has negative values). Typically, the Ml magnitude scales relate to the smaller earthquakes, which are below ML < 4. Data density varies between 5 and 10 according to the vertical color bar on the right side of the graph in Figure 4c. The relation between the body wave magnitude mb and Mw (Figure 4a) is related to the magnitude range above 3.3 (3.3 < mb ≤ 6.1) as the most population of the earthquakes is below 5 (M < 5).
The regression line of the pair Ms/Mw has a slope of 0.7. and the b-parameter is 2.07 (Figure 4d). The relation covers the largest magnitude range from 2.5 to 6.8. It should be noted that at the smallest magnitude, the difference between Ms and Mw is greater than one magnitude unit, and at the largest magnitude, the two scales coincide.
The slope of the md/Mw regression line is greater (a = 1.5), as shown in Figure 4b compared to the other three lines. The biggest difference is observed between the magnitudes md and Mw at the low values (0.45 magnitude units at md = 2); gradually, the difference decreases, and for md = 3.1, the two magnitude scales coincide.
For the EP, the relations Mw-mb and Mw-ML have the best correlations; the adjusted correlation coefficients R2 are close to 1, the uncertainty is minimal, and the coefficients a and b are almost equal to 1 and 0, respectively.

4.1.4. Southern Polygon (SP)

Table 6 shows the produced relations between Mw-proxy and mb, md, Ml, and M based on 812, 813, 780, and 37 magnitude pairs, respectively.
As with the other polygons, all relations are linear, and the regression lines of minimum discrepancy are well correlated with the data distribution. The slopes of all regression lines are equal to 1 except the mb, which a-parameter is 1.139. The intercept points are minimal and equal to –0.5 and −0.1 for mb (Figure 5a) and md (Figure 5b) scales and +0.00001 and +0.4 for the ML (Figure 5c) and M (Figure 5d) magnitude scales.
The relation between ML and Mw has the best fit (Figure 5c), but it refers to the small magnitude range (2.1 < ML < 4). The data have the greatest density in the magnitude interval 2.1 < ML < 3.2. The regression line almost coincides with the y = x line (b = 1.156 × 10⁻⁵). The md/Mw regression (Figure 5b) is almost identical to the ML/Mw one. The parameters a and b are equal to 1 and −0.1, respectively. This relation relates to magnitudes in the range 2.3 < md < 4.4; the greatest density covers the range 2.3 < md < 3.3.
The M/Mw relation (Figure 5d) is derived based on the smallest number of data—37 pairs of earthquakes in the interval of 1.3 magnitude units—3.4 < M < 4.7. The magnitude scale for volume waves covers the widest range of magnitudes from mb = 2.2 to mb = 5.8. The relationship between mb and Mw (Figure 5a) shows that both scales are almost the same for the lowest magnitudes; the difference is less than −0.2 and increases to 0.3 magnitude units for the largest values. The largest number of earthquakes is between 2.4 to 5.2 magnitude units.
It can be concluded that all established relations between Mw and, respectively, mb/md/ML/M have a strong correlation and could be applied to homogenize the Southern Polygon catalog data.

4.1.5. Western Polygon (WP)

The data used in this study for the Western Polygon (WP) are derived from the Bulgarian national homogenized catalog [35], as shown in Table 1. The number of earthquakes is 1023 covering the period from 1981 to 2019 in the magnitude range Mw ≥ 3.2. The earthquakes in the Bulgarian catalog are presented in [67] by Mw magnitude scale, and we have directly included them in the compiled catalog for the Black Sea region.

5. Homogenization and Evaluation of the Completeness of the Compiled BSE Catalog

We compiled a new regional declustered catalog, including the earthquakes in the Black Sea region since the beginning of the past century. The complete catalog comprises the earthquakes with moment magnitudes Mw, if available in the downloaded catalogs used, and Mw-proxy magnitudes produced with the obtained relations, which express the best data fit. According to the maximum earth crust in the region [68], the depth of the listed earthquakes is limited to 40 km. As a result, the catalog of 54,647 events was obtained for the region 27° E–42° E; 40° N–47° N covering the period 1905 to 2022. The data of these earthquakes are saved in the CSV format and proved via Zenodo on the following link: https://zenodo.org/badge/DOI/10.5281/zenodo.8070409.svg (accessed on 22 June 2023). The catalog has been released under an open license and integrates data from global and local earthquake catalogs based on each of the five polygons. Figure 6 shows the cumulative curve of the catalog events from 1905 to 2022. It is seen that the number of registered earthquakes exponentially increased after 1970.
The BSE catalog contains the following information:
  • Date: year, month, day;
  • Origin time in standardized GMT: hour, minute, and second;
  • Epicenter coordinates: Latitude φ° N and Longitude λ° E;
  • Focal depth in km;
  • Moment magnitude, Mw.
To assess the catalog data quality, we estimate the magnitude of completeness Mc, which, theoretically, is the lowest magnitude above which 100% of the earthquakes in the given region and time range are detected [69]. The minimum magnitude of completeness Mc for a given catalog is an essential parameter for many studies of the seismic regime and the earthquake hazard assessment in a particular region (see, e.g., [70,71]). Before calculating the completeness magnitude [66,72], the catalog must be declustered. Applying Reasenberg’s declustering algorithm [62], the earthquakes are grouped into clusters according to spatial and temporal interaction zones in the Black Sea region, and the aftershocks and foreshocks are identified and removed. Thus, the catalog includes 18,528 unique events with Mw ≥ 1.0. Using a non-instrumental catalog or a catalog created by merging non-instrumental and instrumental often results in a higher value of Mc due to undersampling [65,72]. The estimated magnitude of completeness Mc is equal to 5 (Mc = 5). Therefore, the estimated value of Mc shows that there are earthquakes below 5, omitted in the catalog 1905–2022.
The Mc value obtained can be explained by incompleteness in the used catalogs in this study or incorrect magnitude estimations, especially around the 70s of the last century. This assumption is supported by the distribution of magnitude estimates over time for the declustered 1905–2022 catalog depicted in Figure 6b. This Figure shows that till the middle of the last century, in the studied region, stronger and moderate earthquakes (Mw ≥ 4) have been predominantly registered. Over time, the recorded magnitude gradually and steadily decreases to 2.5. The number of events in the magnitude intervals is as follows: 49,040 are in 3 > Mw; 3876 are in 3.0 ≤ Mw < 3.5; 949 are in 3.5 ≤ Mw < 4, 468 are in 4.0 ≤ Mw < 4.5; 190 are in 4.5 ≤ Mw < 5.0, 72 are in 5.0 ≤ Mw < 5.5, 24 are in 5.5 ≤ Mw < 6.0, and 28 earthquakes with magnitude greater than 6 (Mw ≥ 6).
After the first half of the past century, significant progress has been made in increasing the number of seismic stations and earthquake detection capabilities in the Black Sea region, as seen in Figure 6a. The sensitivity of national networks for recording weak earthquakes through installing modern broadband seismic stations has increased significantly, as well as the refinement of procedures and software for locating and estimating the magnitude of small to moderate earthquakes. Thus, the earthquake detection capabilities of the networks have been significantly improved. As a result, the number of recorded events has considerably increased, especially after 1980 (Figure 6a,b), and the minimum magnitudes in the catalogs have been significantly reduced. The years around 1980 can be considered as a dividing line for non-instrumental and instrumental seismic observation. As a rule, the Mc is calculated for the instrumental earthquake catalog, which is more comprehensive than the non-instrumental catalog, predominantly based on the macroseismic observations.
Based on these circumstances and after several approaches made to calculate the magnitude of completeness for different starting times, we considered that 1977 could be accepted as the starting year from which the seismic data catalogs could be used for in-depth analysis, comparison and use for seismic hazard and tsunami hazard assessment. The declustered catalog 1977–2022 comprises 18,295 earthquakes within the magnitude range from 2.5 to 6.1 (2.5 ≤ M ≤ 6.1) and a maximum depth of 40 km (h ≤ 40 km).
Figure 7a shows the distribution of the number of earthquakes over the years in 1/12-year-long bins. The maximum number of earthquakes was in 1999, when two earthquakes of magnitude greater than 7 (Mw > 7) and many events of smaller magnitude occurred in SP. Figure 7b shows the magnitude distribution over time for the declustered catalog 1977–2022. It is shown that there are no missing estimates over the entire magnitude range from 2.5 to 6.1.
The number of earthquakes distributed in bins with size 0.1 is shown in Figure 7b. Most of the events in the studied region are in a magnitude range of 2.5–4.5, accounting for about 95% of the total number of events in the catalog. The largest part comprises the earthquakes with a magnitude of around 2.5 (2.6 ≥ M ≥ 2.5), and the number of the stronger earthquakes exponentially reduces.
This trend is evidenced by the distribution of earthquakes’ depths (Figure 7d), especially for depths over 5 km. The hypocenters of events in the compiled catalog are distributed, respectively: 4133 events (7.6%) within the range 1–5 km, 30,041 (55%) are from 5 km to 10 km, 17,446 events (32%) are from 10 km to 20 km, and 3027 (5.5%) are below 20 km, as shown in Figure 7d. Moreover, 85% (105) of earthquakes with Mw ≥ 5 were identified in the 10–40 km depth range.
The magnitude of completeness Mc is estimated using the maximum curvature method with bootstrapping [65,66]. The frequency–magnitude distribution (FMD) of the earthquakes listed in the declustered catalog from 1977 to 2022 is modeled using the Gutenberg–Richter power law shown in Figure 8a. The FMD of the data fits the synthetic distribution well, plotted as a red line. The more considerable differences are in magnitudes above 5.1 (Mw > 5.1), where a simple power law cannot adequately explain the observed FMD. The calculated parameters of the values of b and a are 1.17 ± 0.01 and 7.192, respectively. Therefore, considering the completeness of Mc, b-value, and a-value, we can conclude that all earthquakes with a magnitude above 2.5 (Mw ≧ 2.5) are reliably recorded and presented in the newly compiled catalog.
The right panel of Figure 8b presents the variations of the magnitude completeness Mc over the years. The temporal variation of Mc is estimated using a window with 500 events and a step of 25 events. The standard deviation of the Mc is depicted with a black dashed line, and it is not more than 0.2 (Mc ± σ: Mc ± 0.1). Considering Figure 8b, the completeness magnitude is very stable over the years.
Figure 9a shows the spatial distribution of the completeness magnitude within the studied region. The spatial distribution of Mc is performed on a 20 km grid and at least 100 events greater than the magnitude (Mw > 2.5) within a 100 km radius for each grid node. To avoid the statistical errors arising from under-sampling and inhomogeneous data, we calculated the spatial–temporal distribution of the Mc and b-value according to Amorese et al. [73]. The completeness magnitude varies from 2.5 to 4.2.
The compiled catalog is complete for the NW, W, S, and E polygons, and the magnitude of completeness is within the interval 2.5–3.0. The higher value of Mc is likely due to the poor coverage of the local seismic networks and the not registered earthquakes with smaller magnitudes.
The value of Mc in the NP increases above 3 (Mc > 3) as in a few parts reaches 4.0 where there is not enough data in the catalog to fulfill the criterion for calculating the Mc. The white zones in the polygon are due to a lower level of seismicity.
Figure 9b shows the spatial distribution of the b-value, which variations are calculated using the maximum likelihood method of Aki [74]. The map is drawn with the same parameters as the map of the magnitude of completeness, i.e., executed on a 20 km grid size and at least 100 events within a 100 km radius for each grid node. Such parameters are sufficient to avoid erroneous b-value statistical results due to undersampling and inhomogeneous subsets [75,76,77,78,79,80,81,82,83,84,85]. As a result, relatively low b-values are obtained for the WP and the EP (see Figure 1 for the outlined polygons), while relatively high b-values characterize the SP and NWP.
The temporal variation of the b-value is shown in Figure 9c. The standard deviation is drawn with black dashed curves. and it is within ± 0.1 (σb= ± 0.1). The shape of this curve largely repeats the curve of the completeness magnitude distribution over the years (Figure 8b). In both curves, the variations of the calculated b-value and Mc magnitude are strongly dependent on the maximum and minimum magnitude of realized earthquakes as well as the number of recorded earthquakes of the corresponding magnitude (Figure 7a,b).
The depth distribution of the b-value is given in Figure 9b. Variations in depth are calculated over 5 km depth layers that contain at least 150 events. The maximum b-value is at a depth of 7 km, where most of the events in the catalog are realized. There are four other peaks in the curve at depths of 5 km, 8 km, 10 km, and 12 km, and two distinct minima at 11 km and below 30 km depth. Figure 9b and Figure 7d prove that the prevailing part of the earthquakes occurs at the depth range from 5 km to 15 km, and there are no seismically inactive layers of the Earth’s crust in the study region.

6. Discussion

The Black Sea is located within the Anatolian sector of the Alpine Himalayan orogenic system. The geodynamic processes in this region are related to the northward movement of the African and Arabian plates, which collide with the Eurasian tectonic plate. The Anatolian block is moving westward with a rotational motion focused northward from the Sinai Peninsula [86]. These processes delineate specific zones of concentration of seismic epicenters along tectonic units [35,87,88]. As previously described by Oynakov et al. [89], the seismic events in the Black Sea region could be clustered into the strongest earthquakes and outlined the main seismic zones: Shabla-Kaliakra, the Crimean Peninsula, three clusters located on the eastern shores of the Black Sea (west coasts of Georgia and Russia), and one on the southern coast near Bartin, Northern Turkey. A large number of earthquakes are related to the Vrancea seismic zone. The present study demonstrates the same seismic pattern in the Black Sea region. Figure 1 shows the distribution of the denoted by grey dot epicenters. According to the compiled catalog, the hypocentral depth of the earthquakes in the study region is not more than 40 km. The strongest earthquakes above 5 (Mw ≥ 5) are mainly realized along the Northern Black Sea coast of Turkey (offshore and on land), the Western Black Sea coast of Georgia (offshore and on land), the offshore of the Northern Bulgaria Black Sea coast and the Vrancea seismic zone.
In order to give a quality estimation of the compiled in the study catalog, we compare its parameters Mc, b-value, and a-value to such ones calculated by Dimitrova et al. [35]. The produced magnitude of completeness Mc is equal to 2.5. The value is smaller than those in [35] (hereafter, the parameters related to the catalog by Dimitrova et al. [35] will be marked with a suffix 21), namely Mc21= 3.0. The relatively lower Mc value is the result of the addition of the national catalogs of the Black Sea countries in the current catalog. As a rule, the local networks can detect and process the smaller magnitude (M ≤ 3) events included in the local catalogs. Thus, the Mc of the newly compiled catalog was reduced to 2.5. Nevertheless, the FMD of both compiled catalogs is linear with parameters as follows: b21-value = 1.09 and b-value = 1.17 (Figure 8a); a21-value = 7.279 and a = 7.192 (Figure 8a). The spatial distribution of the completeness magnitude for both catalogs follows the model of higher values in the Northeastern Black Sea region and smaller values in the west and south parts. In addition, the present study gives the spatial distribution of the Mc in more detail (Figure 9a) due to the above-explained reasons.
The spatial distribution of the b-values, calculated for both catalogs, has a similar behavior; the highest values are mapped in the eastern part of the Southern Black Sea coast. For the current catalog, there are higher b-values in the southwestern and northwestern parts of the region and distinctly low values in the eastern and western parts (Figure 9b). This behavior could be explained with more comprehensive local catalogs (Turkish, Romanian, Bulgarian).
There are several studies on the temporal and spatial variations of b-values; they reflect stress conditions [81,82,83,84] or in strong connections with the different types of faulting [84] and are considered as a precursor of upcoming small or strong events [84,85]. It was found that a high b-value indicates a higher proportion of events with smaller magnitudes and vice versa—a small b-value indicates earthquakes with larger magnitudes. In general, our results conform with those obtained by other authors cited above.
The variations of the temporal and depth distribution curves of the b-value (see Figure 9a,b) are the same as those of the corresponding curves for the b21-value. The curve in Figure 9a gives a more detailed temporal distribution of the b-value, and the curve in Figure 9b is smoother than that of the b21-value. The appearance of the two curves is due to the more comprehensive national catalogs included.
The most significant earthquakes in the Black Sea region, which could affect the population, infrastructure, and tourist sites in low-lying coastal areas. have a magnitude above 5 (Mw≥ 5). According to the compiled catalog from 1977 to 2022, these earthquakes and their parameters extracted from relevant sources are listed in Table 7. The focal mechanisms of the listed earthquakes are given in column 11, and the source is given in column 12 of the table. Unfortunately, the information on the focal moment tensor mechanisms of several earthquakes before 2000 is missing or not freely available.
Most of the earthquakes listed in Table 7 have occurred in Northern Turkey and are associated with the branches of the North Anatolian Fault Zone [86,87,88]. Four earthquakes (with numbers 1, 5, 8, and 25) are realized offshore in the aquatorium of the Black Sea, respectively: 1 is close to the NW coast of Turkey; 5 and 25 are close to the west coast of Georgia; 8 are close to the NE coast of Bulgaria (near Balchik). Two earthquakes (3 and 30) are related to the Vrancea seismic zone. The strongest event has a magnitude of Mw = 6.1 and is realized in the aquatorium of the Marmara Sea [85].
The fault plane solutions of earthquakes in the Black Sea (near the coasts of NE Bulgaria and West Georgia) have strike-slip faulting. The reverse faulting component dominates for the Southwestern Black Sea (event 1) and Western Georgia (event 4). The focal mechanism of the events realized on the mainland of Northern Turkey (eastern, central, and western parts) has a predominantly strike-slip component. Therefore, we can conclude that the focal mechanisms of the earthquakes with Mw ≥ 5.0 in the Black Sea region agree with the primary fault neotectonics.
Several studies of the b-value show that its variations are in strong connections with the different types of faulting [81,82,83,84,85]. It is concluded that the areas where faults are located and subjected to greater stress (thrust faults) demonstrate a lower b-value; those with seismic events associated with normal faults and strike-slip faults have the highest and intermediate b-values, respectively. We do not notice such behavior of the b-value in the presented study. To accurately determine spatial and temporal variations in the b-value, high-precision seismic catalogs of all determined polygons are required, which is the goal of the next study.
The disruptive seismic events triggered tsunamis in the past fall within the main seismic zones outlined in the Black Sea region. According to the BSE catalog, from 1977 to 2022, a strong earthquake occurred in the offshore region of NW Turkey in the Marmara Sea in 1983 and had a magnitude Mw = 6.1 (see Table 7, first column, event 4).
In 1999, the strongest earthquakes with magnitudes Mw = 7.5 and Mw = 7.1 were realized on the land of NW Turkey (events 19 and 38 in Table 7). In 2000, an earthquake with magnitude Mw = 6 (event 47 in Table 7) was realized in N Turkey. However, there was no evidence for the realization of the tsunami waves.
Based on the spatial distribution of the b-value in the Black Sea region, which is mapped in Figure 8b, the earthquake catalog, and the information on the geodynamic potential of the faults in the Black Sea region, we could conclude that stronger earthquakes can occur in the region in the near future. Nevertheless, the tsunami frequency in the Black Sea is rated as low [9,32], and the estimated tsunami hazard in the Black Sea is low to moderate; it cannot be neglected.
The recent Triantafyllou et al. [32] study, regardless of the tsunami generation mechanisms, shows that more realistic results for a probabilistic tsunami risk for the Mediterranean and connected seas can be obtained using complete data sets than incomplete and uncertain historical impact records. Specifically for the Black Sea, the authors found that the tsunami risk is lowest compared to the other parts of the studied area, examining 22 tsunami events—10 historical (fifth century BC to 1899 AD) and 12 for the instrumental period (1900–2021). It should be noted that for the instrumental period of registered seismic events from the beginning of the last century, there are a small number of registered tsunami events by tide gauge observations along the Black Sea coast, especially for the western part. Also, a comprehensive tsunami hazard and risk analysis are difficult due to the incompleteness and uncertainties of all data files. Therefore, as an initial step to clarify the tsunamigenic potential of the seismic zones in the Black Sea region, the parameters of the active or potentially active faults that can generate earthquakes with a magnitude greater than M > 5.0 should be clarified. So far, geophysical and seismic studies, apart from some exceptions, are rare in this region. The exchange of seismic data between coastal countries is one of the obstacles to a comprehensive and in-depth analysis of the seismic activity in the region as a whole. Furthermore, the ambiguous attachment of specific focal mechanisms of earthquakes to active faults or their segments leads to contradictory results, complicating the subsequent analysis and interpretation of seismic and tsunami hazards and risks. Therefore, conducting detailed interdisciplinary research for local or site-specific assessments is necessary, including collecting data and evidence from past tsunami events.
We compiled the BSE catalog based on statistical data processing and calculation procedures with the specialized software ZMAP [65], analyzing many seismic events realized at different seismic sources and registered by different sensors. Therefore, the results of our research have certain limitations of a different nature. For example, some of them are due to the completeness, accuracy, and reliability of the data sets contained in the analyzed catalogs. Regarding data completeness, it should be noted that the analyzed data may not include all seismic events, especially those that were of low magnitude or unreported, due to different procedures used by seismic data centers. Also, data on seismic events can be subject to various sources of error, such as sensor issues or data transmission disruptions. Due to the absence or poorly presented seismic data in all analyzed datasets, there are certain incompletenesses in the compiled BSE catalog, which is evident for the Northern and Eastern Polygons in the studied region. In complex cases or ambiguous seismic events, subjective decisions may affect the inaccurate representation of seismic events in the studied region. Also, we derived linear dependences for transformation from different magnitude scales into moment magnitude Mw for the corresponding geographic polygon using different numbers of events. The number of seismic event pairs available to derive these linear relationships is critical in estimating the parameters of the corresponding linear regression. Other factors that should be considered are the calculation procedures and software algorithms, where expert knowledge is used in analyzing and interpreting the results, for example, in the procedure for declustering, applying the Reasenberg algorithm [62].
Further work is needed (1) to include seismic events, which are not so far included in the BSE catalog, to complement and improve it; (2) for detailed local studies to identify potentially active faults triggering earthquakes with tsunamigenic potential; (3) to derive unambiguous empirical dependences when transforming between different magnitude scales into moment magnitude for the identified seismically active seismic zones, and (4) to derive maximum-likelihood parameters used as inputs in modeling and simulations of earthquake-triggered tsunamis in the study area.

7. Conclusions

We used freely available data catalogs of four international data centers, namely USGS, ISC, EMSC, and five national catalogs, respectively, Romanian, Turkish, Bulgarian, and published catalog information on events on the territory of Russia to compile a new catalog of the Black Sea earthquakes. Initially, the summary catalog of earthquakes from 1905 to 2022 in the specified region 27° E–42° E and 40° N–47° N included 54,918 earthquakes. First, we calculated numerically empirical model dependencies for five geographically defined polygons to convert magnitudes from heterogeneous locally reported magnitude scales into standard proxy magnitude scales equivalent to the moment magnitude Mw. Second, a declustering procedure was applied to remove duplicate events. As a result, a catalog of precisely defined earthquakes in the Black Sea region was compiled, comprising 54,647 events, and published in CSV format under an open license. The created catalog can be helpful to seismologists, geologists, and other specialists studying seismic phenomena in the Black Sea region. The BSE catalog will be freely available and can be regularly updated, including recent earthquakes registered by the available and updated national seismic networks in the studied region. In addition, the part of the homogenized catalog from 1977 to 2022 related to the instrumental monitoring of the seismicity of the Black Sea region is studied. A declustering procedure was applied to remove duplicate events in the catalog. The catalog comprises as many as 18.528 unique earthquakes within the magnitude range from 2.5 to 6.1 (2.5 ≤ Mw ≤ 6.1) and realized at a depth not more than 40 km. Then, the quality of the newly compiled catalog was assessed by evaluating the magnitude of completeness Mc and its uncertainty. According to the Gutenberg–Richter law, the frequency–magnitude distribution is calculated. The magnitude of completeness is equal to 2.5 (Mc = 2.5), and the b-value and the a-value are 1.17 (±0.01) and 7.192, respectively. Based on the three parameters’ estimations, we can conclude that the new BSE catalog is representative and can be used in the presented study and for further seismic and tsunami hazard analyses of the Black Sea region.
The spatial distribution of the magnitude of completeness shows as follows: the Northwestern, Western, and Southern Polygons demonstrate the lowest values of Mc-below 3; the regions of Southern Crimea and Western Russia (parts of the NP and the EP) have completeness magnitudes around 3.5, for which, the most likely reason is a lack of free available catalogs. The spatial distribution of the b-value is obtained and plotted on the map, delineating areas of low values in the WP and the EP, and areas of relatively higher values in the SP and the NWP. Making a separate spatio-temporal analysis for specific low-lying locations along the Black Sea coast is necessary to obtain more meaningful results in studying the tsunamigenic potential of seismically active fault zones. Finally, the strongest earthquakes with a magnitude above 5 (Mw ≥ 5), which are realized in the studied region, are estimated based on their focal mechanisms and spatial–temporal distribution.
In this study, newly collected and analyzed information about the seismic regime during the last century in the Black Sea region shows that the probability of a strong earthquake in the future should not be underestimated. Tsunamis in the Black Sea are not as large, destructive, and frequent as in other tsunami-prone areas. However, the tsunami risk for some local Black Sea coastal areas such as the Balchik–Kaliakra region (Northeastern Bulgaria), Northwestern Turkey, the southern coast of the Crimean Peninsula, and the western coast of Georgia is relatively high compared to others and should be studied in detail.

Author Contributions

Conceptualization, E.O., L.D., and L.P.; methodology, E.O. and L.D.; software, E.O.; investigation, E.O., L.D., and L.P.; formal analysis, E.O., L.D., L.P., and D.D.; data curation, E.O., L.D., and D.D.; writing—original draft preparation, E.O., L.D., and L.P.; writing—review and editing, E.O., L.D., L.P., and D.D.; visualization, E.O. and L.P.; project administration, L.P.; funding acquisition, L.P. All authors have read and agreed to the published version of the manuscript.

Funding

This study was funded by the Bulgarian National Science Fund under the Contract KΠ-06-KOCT/8. It contributes to the European Cooperation in Science and Technology COST project “AGITHAR—Accelerating Global Science in Tsunami Hazard and Risk Analysis”.

Data Availability Statement

The newly compiled regional seismic catalog for the Black Sea region (BSEC) will be published at https://zenodo.org/badge/DOI/10.5281/zenodo.8070409.svg (accessed on 22 June 2023). All data used for this study were mentioned in the text and relevant data sources are properly cited. Data analysis was performed using ZMAP and Matlab tools. Figure 1 was created through Global Mapper®, and the rest of the figures were created by ZMAP and Matlab.

Acknowledgments

The authors are grateful to the World Data Centres USGS, ISC, EMSC, and IDC for the freely available seismic data catalogs, as well as to the seismologists on duty at the National Operative Telemetric System for Seismological Information (NOTSSI) operated by the National Institute of Geophysics, Geodesy, and Geography at the Bulgarian Academy of Sciences. We acknowledge Dogan Kalafat and Didem Musavver for providing data from the Turkish seismic catalog.

Conflicts of Interest

The authors declare no conflict of interest. The funders had no role in the study’s design; in the collection, analyses, or interpretation of data; in the writing of the manuscript; or in the decision to publish the results. The authors are not responsible for any consequences arising from the reuse of this publication.

References

  1. Behrens, J.; Løvholt, F.; Jalayer, F.; Lorito, S.; Salgado-Gálvez, M.A.; Sørensen, M.; Abadie, S.; Aguirre-Ayerbe, I.; Aniel-Quiroga, I.; Babeyko, A.; et al. Probabilistic Tsunami Hazard and Risk Analysis: A Review of Research Gaps. Front. Earth Sci. 2021, 9, 628772. [Google Scholar] [CrossRef]
  2. Cugliari, L.; Cerase, A.; Amato, A. Tsunami risk perception, a state-of-the-art review with a focus in the NEAM region. Front. Earth Sci. 2022, 10, 995536. [Google Scholar] [CrossRef]
  3. Reid, J.A.; Mooney, W.D. Tsunami Occurrence 1900–2020: A Global Review, with Examples from Indonesia. Pure Appl. Geophys. 2022, 180, 1549–1571. [Google Scholar] [CrossRef]
  4. Hu, G.; Feng, W.; Wang, Y.; Li, L.; He, X.; Karakaş, Ç.; Tian, Y. Source Characteristics and Exacerbated Tsunami Hazard of the 2020 Mw 6.9 Samos Earthquake in Eastern Aegean Sea. J. Geophys. Res. Solid Earth 2022, 127, e2022JB023961. [Google Scholar] [CrossRef]
  5. Geist, E.L.; Parsons, T. Probabilistic Analysis of Tsunami Hazards. Nat. Hazards 2006, 37, 277–314. [Google Scholar] [CrossRef]
  6. Løvholt, F.; Griffin, J.; Salgado-Gálvez, M. Tsunami Hazard and Risk Assessment on the Global Scale. In Encyclopedia of Complexity and Systems Science; Meyers, R., Ed.; Springer: Berlin/Heidelberg, Germany, 2015. [Google Scholar] [CrossRef]
  7. Selva, J.; Amato, A.; Armigliato, A.; Basili, R.; Bernardi, F.; Brizuela, B.; Cerminara, M.; Vitturi, M.D.M.; Di Bucci, D.; Di Manna, P.; et al. Tsunami risk management for crustal earthquakes and non-seismic sources in Italy. Riv. Nuovo Cim. 2021, 44, 69–144. [Google Scholar] [CrossRef]
  8. Papadopoulos, G.A.; Imamura, F.; Nosov, M.; Charalampakis, M. Tsunami magnitude scales. In Geological Records of Tsunamis and Other Extreme Waves, 1st ed.; Engel, M., Pilarczyk, J., May, S.M., Brill, D., Garrett, E., Eds.; Elsevier: Amsterdam, The Netherlands, 2020; pp. 33–46. [Google Scholar] [CrossRef]
  9. Papadopoulos, G.A.; Diakogianni, G.; Fokaefs, A.; Ranguelov, B. Tsunami hazard in the Black Sea and the Azov Sea: A new tsunami catalogue. Nat. Hazards Earth Syst. Sci. 2011, 11, 945–963. [Google Scholar] [CrossRef]
  10. Papadopoulos, G.A.; Gràcia, E.; Urgeles, R.; Sallares, V.; De Martini, P.M.; Pantosti, D.; González, M.; Yalciner, A.C.; Mascle, J.; Sakellariou, D.; et al. Historical and pre-historical tsunamis in the Mediterranean and its connected seas: Geological signatures, generation mechanisms and coastal impacts. Mar. Geol. 2014, 354, 81–109. [Google Scholar] [CrossRef]
  11. Dimova, L.; Armigliato, A.; Pagnoni, G.; Tinti, S.; Raykova, R. Atmosphere and Space Tsunami Radiation Pattern from Seismic Sources in the Black Sea. In Proceedings of the 3rd National Congress on Physical Sciences, Section: Physics of Earth, Sofia, Bulgaria, 29 September–2 October 2016; Available online: http://upb.phys.uni-sofia.bg/conference/3kongres/disk/html/pdf/S0655.pdf (accessed on 7 June 2023).
  12. Nikonov, A.; Gusiakov, V.; Fleifel’, L. Assessment of the tsunami hazard on the Russian coast based on a new catalogue of tsunamis in the Black Sea and the Sea of Azov. Russ. Geol. Geophys. 2018, 59, 193–205. [Google Scholar] [CrossRef]
  13. Cambaz, M.D.; Turhan, F.; Yılmazer, M.; Kekovalı, K.; Necmioglu, Ö.; Kalafat, D. An Investigation on the Evaluation of Seismic Network and Catalogue of Regional Earthqauke-Tsunami Monitoring Center (RETMC-KOERI). Yerbilimleri 2019, 40, 110–135. [Google Scholar] [CrossRef]
  14. Grigorash, Z.K. Review of remote tide gauge records of some tsunamis in the Black Sea. In Trudy SakhKNII, SahKNII; Far East Scientific Center, USSR Academy of Sciences: Sakhalin, Russia, 1972; pp. 271–278. [Google Scholar]
  15. Dotsenko, S.F.; Konovalov, A.V. Tsunami waves in the Black Sea in 1927: Observations and numerical modelling. Phys. Oceanogr. 1996, 7, 389–401. [Google Scholar] [CrossRef]
  16. Pelinovsky, E. Preliminary estimates of tsunami danger for the northern part of the Black Sea. Phys. Chem. Earth Part A 1999, 24, 175–178. [Google Scholar] [CrossRef]
  17. Dotsenko, S.F.; Ingerov, A.V. Characteristics of tsunami waves in the Black Sea according to the data of measurements. Phys. Oceanogr. 2007, 17, 17–28. [Google Scholar] [CrossRef]
  18. Yalçiner, A.; Pelinovsky, E.; Talipova, T.; Kurkin, A.; Kozelkov, A.; Zaitsev, A. Tsunamis in the Black Sea: Comparison of the historical, instrumental, and numerical data. J. Geophys. Res. Atmos. 2004, 109, C12023. [Google Scholar] [CrossRef]
  19. Altinok, Y.; Alpar, B.; Özer, N.; Aykurt, H. Revision of the tsunami catalogue affecting Turkish coasts and surrounding regions. Nat. Hazards Earth Syst. Sci. 2011, 11, 273–291. [Google Scholar] [CrossRef]
  20. Mazova, R.; Kiselman, B.; Kolchina, E. Numerical simulation of tsunami wave height distribution for Turkish Black Sea coast in nonlinear dynamic keyboard model of underwater seismic source. J. Comput. Appl. Math. 2014, 259, 887–896. [Google Scholar] [CrossRef]
  21. Partheniu, R.; Diaconescu, M.; Ioane, D.; Marmureanu, A. Tsunami Modeling Scenarios for Some of the Seismic Sources in the Black Sea Area, Using Tsunami Analysis Tool Software. In Proceedings of the 8th Congress of the Balkan Geophysical Society, Chania, Greece, 5–8 October 2015; pp. 1–5. [Google Scholar] [CrossRef]
  22. Moldovan, I.A.; Diaconescu, M.; Partheniu, R.; Constantin, A.P.; Popescu, E.; Toma-Danila, D. Probabilistic seismic hazard assessment in the Black Sea area. Rom. J. Phys. 2017, 62, 809. [Google Scholar]
  23. Bazykina, A.Y.; Mikhailichenko, S.Y.; Fomin, V.V. Numerical Simulation of Tsunami in the Black Sea Caused by the Earthquake on September 12, 1927. Phys. Oceanogr. 2018, 25, 295–304. [Google Scholar] [CrossRef]
  24. Dimova, L.; Raykova, R. Tsunami Hazard on the Black Sea Coast by Numerical Modelling. C. R. Acad. Bulg. Sci. 2018, 71, 350–1356. [Google Scholar] [CrossRef]
  25. Baranova, E.A.; Mazova, R.K. Tsunami Hazard for the Crimean Coast of the Black Sea and the Kerch Strait at the Catastrophic Tsunamigenic Earthquakes, the Locations of which are Close to that of the Historical Yalta Earthquake on 12 September 1927. Phys. Oceanogr. 2020, 27, 110–125. [Google Scholar] [CrossRef]
  26. Emre, Ö.; Duman, T.Y.; Özalp, S.; Şaroğlu, F.; Olgun, Ş.; Elmacı, H.; Çan, T. Active fault database of Turkey. Bull. Earthq. Eng. 2016, 16, 3229–3275. [Google Scholar] [CrossRef]
  27. Gobarenko, V.S.; Murovskaya, A.V.; Yegorova, T.P.; Sheremet, E.E. Collision processes at the northern margin of the Black Sea. Geotectonics 2016, 50, 407–424. [Google Scholar] [CrossRef]
  28. Shumlyanskaya, L.A.; Burmin, V.Y. Parameters of the fault planes for the Crimean Black Sea region by averaged mechanism of close earthquakes. Geofiz. Zhurnal. 2017, 38, 100–116. [Google Scholar] [CrossRef]
  29. Diaconescu, M.; Craiu, A.; Toma–Danila, D.; Craiu, G.M. Main active faults from the eastern part of Romania (Dobrogea and Black Sea). Part I: Longitudinal faults system. Rom. Rep Phys. 2019, 71, 702. [Google Scholar]
  30. Işcan, Y.; Ocakoğlu, N.; Kılıç, F.; Özel, O. Active tectonics of offshore Cide–Sinop (southern Black Sea shelf): From seismic and multibeam bathymetry data. Geo-Marine Lett. 2019, 39, 279–294. [Google Scholar] [CrossRef]
  31. Simmons, M.D.; Tari, G.C.; Okay, A.I. Petroleum geology of the Black Sea: Introduction. Geol. Soc. London Spec. Publ. 2018, 464, 1–18. [Google Scholar] [CrossRef]
  32. Triantafyllou, I.; Papadopoulos, G.A.; Kijko, A. Probabilistic Tsunami Risk Assessment from Incomplete and Uncertain Historical Impact Records: Mediterranean and Connected Seas. Pure Appl. Geophys. 2023, 180, 1785–1809. [Google Scholar] [CrossRef]
  33. Basili, R.; Tiberti, M.M.; Kastelic, V.; Romano, F.; Piatanesi, A.; Selva, J.; Lorito, S. Integrating geologic fault data into tsunami hazard studies. Nat. Hazards Earth Syst. Sci. 2013, 13, 1025–1050. [Google Scholar] [CrossRef]
  34. Zelenin, E.; Bachmanov, D.; Garipova, S.; Trifonov, V.; Kozhurin, A. The Database of the Active Faults of Eurasia (AFEAD): Ontology and Design behind the Continental-Scale Dataset. Earth Syst. Sci. Data 2022, 14, 4489–4503. [Google Scholar] [CrossRef]
  35. Dimitrova, L.; Oynakov, E.; Pashova, L.; Dragomirov, D. Assessment of the historical and recent seismicity of the Black Sea region. SGEM2021 Book: 21st International Multidisciplinary Scientific Geo Conference. Sect. Appl. Environ. Geophys. 2021, 21, 419–426. Available online: https://www.sgem.org/index.php/jresearch-article?citekey=20215645652 (accessed on 3 June 2023).
  36. Solakov, D.; Simeonova, S.; Raikova, P.; Aleksandrova, I. Catalog of the Earthquakes in Bulgaria and Surroundings since 1981; Funds NIGGG-BAS; National Institute of Geophysics, Geodesy and Geography-AS: Sofia, Bulgaria, 2020. [Google Scholar] [CrossRef]
  37. Ranguelov, B.; Gospodinov, D. Tsunami vulnerability modelling for the bulgarian black sea coast. Water Sci. Technol. 1996, 32, 47–53. [Google Scholar] [CrossRef]
  38. Grünthal, G.; Wahlström, R. The European-Mediterranean Earthquake Catalogue (EMEC) for the last millennium. J. Seism. 2012, 16, 535–570. [Google Scholar] [CrossRef]
  39. Storchak, D.A.; Harris, J.; Brown, L.; Lieser, K.; Shumba, B.; Verney, R.; Di Giacomo, D.; Korger, E.I.M. Rebuild of the Bulletin of the International Seismological Centre (ISC), part 1: 1964–1979. Geosci. Lett. 2017, 4, 32. [Google Scholar] [CrossRef]
  40. Storchak, D.A.; Harris, J.; Brown, L.; Lieser, K.; Shumba, B.; Di Giacomo, D. Rebuild of the Bulletin of the International Seismological Centre (ISC)—Part 2: 1980–2010. Geosci. Lett. 2020, 7, 18. [Google Scholar] [CrossRef]
  41. Dziewonski, A.M.; Chou, T.-A.; Woodhouse, J.H. Determination of earthquake source parameters from waveform data for studies of global and regional seismicity. J. Geophys. Res. Atmos. 1981, 86, 2825–2852. [Google Scholar] [CrossRef]
  42. Ekström, G.; Nettles, M.; Dziewoński, A. The global CMT project 2004–2010: Centroid-moment tensors for 13,017 earthquakes. Phys. Earth Planet. Inter. 2012, 200–201, 1–9. [Google Scholar] [CrossRef]
  43. Oncescu, M.C.; Marza, V.I.; Rizescu, M.; Popa, M. The Romanian earthquake catalog between 984-1997. In Vrancea Earthquakes: Tectonics, Hazard and Risk Mitigation; Advances in Natural and Technological Hazards Research; Wenzel, F., Lungu, D., Novak, O., Eds.; Springer: Dordrecht, The Netherlands, 1999; Volume 11, pp. 43–47. [Google Scholar] [CrossRef]
  44. Kozinenko, N.M.; Svidlova, V.A.; Sykchina, Z.N.; Antonyuk, G.P.; Antonyuk, V.A.; Bondar, M.N.; Kuryanova, I.V.; Lukyanova, Z.N.; Podvintsev, A.V.; Roslyakov, A.V. Catalog and Detailed Data on Earthquakes in the Crimean-Black Sea Region for 2012, Seismological Bulletin of Ukraine for 2012, Sevastopol, SPC “ECOSY-Hydrophysics”. 2013; pp. 57–85. Available online: http://dspace.nbuv.gov.ua/handle/123456789/145810 (accessed on 2 June 2023). (In Russian)
  45. Pustovitenko, B.G.; Kalinyuk, I.V.; Merzhej, E.A.; Porechnova, E.I.; Sykchin, Z.N. Dynamic parameters of earthquake foci of the Crimean, Zemletryaseniia Severnoj Evrazii, (Earthquakes of Northern Eurasia). Geophys. J. 2008, 35, 289–296. [Google Scholar]
  46. Pustovitenko, B.G.; Kalinyuk, I.V.; Merzhej, E.A. Dynamic parameters of earthquake foci of the Crimean—Black Sea region. In Zemletryaseniia Severnoj Evrazii; Earthquakes in Northern Eurasia 2010; GS RAS: Obninsk, Russia, 2016; pp. 296–304. Available online: http://www.gsras.ru/zse/uploads/files/eq_ne_2010/2010-Spectra_and_dinamic_param-Dynamic_parameters_Crimean-296-304.pdf (accessed on 1 June 2023). (In Russian)
  47. Pustovitenko, B.G.; Kalinyuk, I.V. Earthquake Focus Parameters in the Crimean-Black Sea Region, Zemletryaseniia Severnoj Evrazii, (Earthquakes in Northern Eurasia, 2019). 2013. Volume 22. pp. 296–304. Available online: https://cyberleninka.ru/article/n/ochagovye-parametry-zemletryaseniy-krymsko-chernomorskogo-regiona (accessed on 21 June 2023).
  48. Pustovitenko, B.G.; Merger, E.A.; Pustovitenko, A.A. Dynamic parameters of the earthquake foci of Crimea according to digital seismic stations. Geofiz. Zhurnal. 2013, 35, 172–186. [Google Scholar] [CrossRef]
  49. Pustovitenko, B.G. Updated focal parameters of 1990 earthquakes in Crimea, Scientific notes of the Crimean Federal University named after V. I. Vernadsky. Geography 2014, 27, 169–178. [Google Scholar]
  50. Pustovitenko, B.G.; Eredzhepov, E.E. Focal parameters of earthquakes in the Crimean-of the Black Sea region 2016, Scientific notes of the V. I. Vernadsky Crimean Federal University. Geogr. Geol. 2017, 3, 51–69. [Google Scholar]
  51. Pustovitenko, B.G.; Eredzhepov, E.E.; Bondar, M.N. Spectral and dynamic parameters of the foci of 2019 Crimean earthquakes, Scientific notes of the V. I. Vernadsky Crimean Federal University. Geogr. Geol. 2020, 6, 67–85. [Google Scholar]
  52. Pustovitenko, B.G.; Eredzhepov, E.E. Corrected focal parameters of the earthquakes of the Crimea 2018–2019, Scientific notes of the Crimean Federal University named after V. I. Vernadsky. Geogr. Geol. 2021, 7, 164–175. [Google Scholar]
  53. Pustovitenko, B.G.; Eredzhepov, E.E. Spectral and dynamic parameters of the foci of 2015 Crimean earthquakes, Scientific notes of the V. I. Vernadsky Crimean Federal University. Geogr. Geol. 2021, 2, 53–68. [Google Scholar]
  54. Pustovitenko, B.G.; Eredzhepov, E.E.; Bondar, M.N. Spectral and dynamic parameters of the foci of 2020 Crimean earthquakes, Scientific notes of the V. I. Vernadsky Crimean Federal University. Geogr. Geol. 2021, 7, 70–86. [Google Scholar]
  55. Stromeyer, D.; Grünthal, G.; Wahlström, R. Chi-square regression for seismic strength parameter relations, and their uncertainties, with applications to an M w based earthquake catalog for central, northern and northwestern Europe. J. Seismol. 2004, 8, 143–153. [Google Scholar] [CrossRef]
  56. Das, R.; Wason, H.; Sharma, M. Magnitude conversion to unified moment magnitude using orthogonal regression relation. J. Asian Earth Sci. 2012, 50, 44–51. [Google Scholar] [CrossRef]
  57. Castellaro, S.; Mulargia, F.; Kagan, Y.Y. Regression problems for magnitudes. Geophys. J. Int. 2006, 165, 913–930. [Google Scholar] [CrossRef]
  58. Scordilis, E.M. Empirical Global Relations Converting M S and m b to Moment Magnitude. J. Seism. 2006, 10, 225–236. [Google Scholar] [CrossRef]
  59. Gasperini, P.; Lolli, B.; Castellaro, S. Comparative Analysis of Regression Methods Used for Seismic Magnitude Conversions. Bull. Seism. Soc. Am. 2015, 105, 1787–1791. [Google Scholar] [CrossRef]
  60. Gilat, A. (Ed.) MATLAB: An Introduction with Applications, 5th ed.; John Wiley & Sons: New York, NY, USA, 2014. [Google Scholar]
  61. Celmins, A. The method of Gauss in 1799. Stat. Sci. 1998, 3, 123–135. [Google Scholar]
  62. Reasenberg, P. Second-order moment of central California seismicity, 1969–1982. J. Geophys. Res. Atmos. 1985, 90, 5479–5495. [Google Scholar] [CrossRef]
  63. Gardner, J.K.; Knopoff, L. Is the sequence of earthquakes in Southern California, with aftershocks removed, Poissonian? Bull. Seism. Soc. Am. 1974, 64, 1363–1367. [Google Scholar] [CrossRef]
  64. Tan, O. A homogeneous earthquake catalogue for Turkey. Nat. Hazards Earth Syst. Sci. 2021, 21, 2059–2073. [Google Scholar] [CrossRef]
  65. Wiemer, S. A Software Package to Analyze Seismicity: ZMAP. Seism. Res. Lett. 2001, 72, 373–382. [Google Scholar] [CrossRef]
  66. Mignan, A.; Woessner, J. Estimating the magnitude of completeness in earthquake catalogs. Community Online Resour. Stat. Seism. Anal. 2012, 1–45. [Google Scholar] [CrossRef]
  67. Solakov, D.; Simeonova, S.; Raykova, P.; Aleksandrova, I. Empirical Relations Converting Md and Mp Magnitudes Applied in Bulgarian Seismological Routine Practice to Moment Magnitude. C. R. Acad. Bulg. Sci. 2018, 71, 1076–1085. [Google Scholar] [CrossRef]
  68. Bilim, F.; Aydemir, A.; Ateş, A.; Dolmaz, M.N.; Koşaroğlu, S.; Erbek, E. Crustal thickness in the Black Sea and surrounding region, estimated from the gravity data. Mar. Pet. Geol. 2020, 123, 104735. [Google Scholar] [CrossRef]
  69. Wiemer, S. Minimum Magnitude of Completeness in Earthquake Catalogs: Examples from Alaska, the Western United States, and Japan. Bull. Seism. Soc. Am. 2000, 90, 859–869. [Google Scholar] [CrossRef]
  70. Woessner, J. Assessing the Quality of Earthquake Catalogues: Estimating the Magnitude of Completeness and Its Uncertainty. Bull. Seism. Soc. Am. 2005, 95, 684–698. [Google Scholar] [CrossRef]
  71. Wiemer, S.; Wyss, M. Mapping spatial variability of the frequency-magnitude distribution of earthquakes. Adv. Geophys. 2002, 45, 259–302. [Google Scholar] [CrossRef]
  72. Godano, C.; Petrillo, G. Estimating the Completeness Magnitude mc and the b-Values in a Snap. Earth Space Sci. 2023, 10, e2022EA002540. [Google Scholar] [CrossRef]
  73. Amorãse, D.; Grasso, J.-R.; Rydelek, P.A. On varying b-values with depth: Results from computer-intensive tests for Southern California. Geophys. J. Int. 2010, 180, 347–360. [Google Scholar] [CrossRef]
  74. Aki, K. Maximum likelihood estimate of b in the formula log(N) = a − bM and its confidence limits. Bull. Earthq. Res. Inst. Tokio. Univ. 1965, 43, 237–239. [Google Scholar]
  75. Kagan, Y.Y. Universality of the Seismic Moment-frequency Relation. Pure Appl. Geophys. 1999, 155, 537–573. [Google Scholar] [CrossRef]
  76. Kagan, Y.Y. Seismic moment distribution revisited: I. Statistical results. Geophys. J. Int. 2002, 148, 520–541. [Google Scholar] [CrossRef]
  77. Kagan, Y.Y. Earthquake size distribution: Power-law with exponent β ≡ 12? Tectonophysics 2010, 490, 103–114. [Google Scholar] [CrossRef]
  78. Kamer, Y. Minimum Sample Size for Detection of Gutenberg-Richter’s b-Value. 2013. Available online: https://arxiv.org/ftp/arxiv/papers/1410/1410.1815.pdf (accessed on 2 June 2023).
  79. Kamer, Y.; Hiemer, S. Comment on “Analysis of the b-values before and after the 23 October 2011 Mw 7.2 Van–Erciş, Turkey, earthquake”. Tectonophysics 2013, 608, 1448–1451. [Google Scholar] [CrossRef]
  80. Shi, Y.; Bolt, B.A. The standard error of the magnitude-frequency b value. Bull. Seism. Soc. Am. 1982, 72, 1677–1687. [Google Scholar] [CrossRef]
  81. Schorlemmer, D.; Wiemer, S.; Wyss, M. Variations in earthquake-size distribution across different stress regimes. Nature 2005, 437, 539–542. [Google Scholar] [CrossRef]
  82. Geffers, G.-M.; Main, I.G.; Naylor, M. Biases in estimating b-values from small earthquake catalogues: How high are high b-values? Geophys. J. Int. 2022, 229, 1840–1855. [Google Scholar] [CrossRef]
  83. Nasir, A.; Hintersberger, E.; Decker, K. The temporal evolution of seismicity and variability of b-values along the Vienna Basin Transfer Fault System. Austrian J. Earth Sci. 2023, 116, 1–15. [Google Scholar] [CrossRef]
  84. Nanjo, K.Z.; Yoshida, A. Changes in the b value in and around the focal areas of the M6.9 and M6.8 earthquakes off the coast of Miyagi prefecture, Japan, in 2021. Earth, Planets Space 2021, 73, 176. [Google Scholar] [CrossRef]
  85. Schorlemmer, D.; Wiemer, S.; Wyss, M. Earthquake statistics at Parkfield: 1. Stationarity of b values. J. Geophys. Res. Atmos. 2004, 109, B12307–B12317. [Google Scholar] [CrossRef]
  86. Tari, E.; Sahin, M.; Barka, A.; Reilinger, R.; King, R.W.; McClusky, S.; Prilepin, M. Active tectonics of the Black Sea with GPS. Earth, Planets Space 2000, 52, 747–751. [Google Scholar] [CrossRef]
  87. Kalafat, D. An Overview of the Seismicity and Tectonics of the Black Sea. In Moment Tensor Solutions; D’Amico, S., Ed.; Springer Natural Hazards: Berlin/Heidelberg, Germany, 2018; pp. 573–588. [Google Scholar] [CrossRef]
  88. Kalafat, D.; Kekovalı, K.; Güneş, Y.; Yilmazer, M.; Kara, M.; Deniz, P.; Berberoglu, M. A Catalogue of Source Parameters of Moderate and Strong Earthquakes for Turkey and its Surrounding Area (1938–2008); Kandili Observatory, Istanbul, Report; Boğaziçi Üniversitesi: Istanbul, Turkey, 2009; 43p. (In Turkish) [Google Scholar]
  89. Oynakov, E.; Dimitrova, L.; Pashova, L.; Dragomirov, D. Analysis of potential seismic sources of tsunamis in the Black Sea region, using data from various catalogs. In Proceedings of the EGU General Assembly 2021, online, 19–30 April 2021. EGU21-8278. [Google Scholar] [CrossRef]
Figure 1. Location and topography of the study Black Sea region. It is divided into five polygons denoted by NWP, NP, EP, SP, and WP, the boundaries of which are indicated by a dashed red line. Earthquakes with magnitude M ≥ 1.0 from 1905 to 2022 extracted from international and national seismic data sources are shown with tiny gray dots (more explanations are given in Section 3).
Geosciences 13 00221 g001
Figure 2. Magnitude relations between Mw and the other magnitude scales for the Northwestern Polygon (NWP). The left panels graphically represent the general orthogonal regression (GOR) with used magnitude pairs (N), and the right shows the linear regression estimates. Linear regression is determined for the pairs between the Mw-mb (a), Mw-md (b), and Mw-ML (c) magnitude scales, respectively. The solid blue line is the best linear fit calculated by the GOR. The dashed lines indicate the 95% confidence interval. The red line represents a 1:1 relationship between Mw and other magnitudes. Please note the scale changes along the x and y axes of the left panels.
Geosciences 13 00221 g002aGeosciences 13 00221 g002b
Figure 3. Magnitude relations between Mw and the other scales for the Northern Polygon (NP). Linear regression is determined for the pairs between the Mw-mb (a), Mw-ML (b), and Mw-MPVA (c) magnitude scales, respectively. Other notations are the same as in Figure 2.
Geosciences 13 00221 g003
Figure 4. Magnitude relations between Mw and mb, md, ML, MS scales for the Eastern Polygon (EP). Linear regression is determined for the pairs between the Mw-mb (a), Mw-md (b), Mw-ML (c) and Mw-Ms (d) magnitude scales, respectively. Other notations are the same as in Figure 2.
Geosciences 13 00221 g004aGeosciences 13 00221 g004b
Figure 5. Magnitude relations between Mw and mb, md, ML, and M scales for the Southern Polygon (SP). Linear regression is determined for the pairs between the Mw-mb (a), Mw-md (b), Mw-ML (c) and Mw-M (d) magnitude scales, respectively. Other notations are the same as in Figure 2.
Geosciences 13 00221 g005
Figure 6. (a) Cumulative curve of the earthquakes collected from the used catalog, covering the 1905–2022 period; (b) magnitude distribution over time for the declustered catalog 1905–2022.
Geosciences 13 00221 g006
Figure 7. (a) Histogram of the number of earthquakes covering the 1977–2022 period listed in the catalog calculated in bin size of 1/12 year; (b) distribution of hypocenters in depth over time; (c) histogram of the magnitude distribution within 0.11 bin size of the magnitude; (d) histogram of depth distribution within 5 km size bins.
Geosciences 13 00221 g007
Figure 8. (a) Frequency–magnitude distribution (FMD) of the seismic events within the Black Sea region from the compiled catalog 1977–2022; (b) variations of the magnitude of completeness Mc over the years.
Geosciences 13 00221 g008
Figure 9. (a) Spatial distribution of the magnitude of completeness of the homogenized catalog 1977–2022; (b) spatial distribution of b-value distribution obtained in this stud; (c) variations of b-value over the years; (d) depth distribution of b-value.
Geosciences 13 00221 g009
Table 1. Seismic data catalogs used in this study.
PolygonTime RangeSource Catalogs
Northwestern (NWP)1900–2022(8), (4), (9), (1), (3), (2) *
Northern (NP)2006–2020(9), (4), (1), (3), (2) *
Eastern (EP)2006–2020(9), (4), (1), (3), (2) *
Southern (SP)1900–2021(7), (6), (4), (1), (3), (2) *
Western (WP)1981–2021(5), (4), (1), (3), (2) *
* The catalogs used are sorted by priority.
Table 2. Types of the magnitude scales in the catalogs.
ScaleNumber of EarthquakesDescription
Mw3436Moment magnitude
mb1071Short-period body wave magnitude
MPVA12Regional short-period body wave magnitude
ML1930Richter magnitude
Ms48Surface wave magnitude
md1853Duration magnitude
M36Unreported type magnitude
No magnitude46,532
Table 3. Relations between Mw (Mw-proxy) and mb, md and ML derived for the NWP.
Relation±2σ (a)±2σ (b)Number of DataMagnitude RangeR-Square
Mw-proxy = 0.9 × mb + 0.3±0.0862±0.29981672.1–6.60.7223
Mw-proxy = 0.6667 × md + 0.7667±0.0008±0.00185762.0–4.60.9995
Mw-proxy = 0.5 × ML + 1.15±0.0131±0.04001902.2–4.20.9875
Table 4. Relations Mw-proxy as a function of mb, ML, MPVA for the NP.
Relation±2σ (a)±2σ (b)Number of DataMagnitude RangeR-Square
Mw-proxy = 0.6117 × mb + 1.42±0.1384±0.4779512.1–4.80.5829
Mw-proxy = 0.7333 × ML + 1.133±0.0764±0.2446462.0–4.00.9052
Mw-proxy = 0.99 × MPVA − 0.4995±0.5741±2.3615123.4–4.90.5610
Table 5. Relations Mw as a function of mb, md, ML, and MS for the EP.
Relation±2σ (a)±2σ (b)Number of DataMagnitude RangeR-Square
Mw-proxy = 1.064 × mb − 0.1681±0.1004±0.4725413.3–6.10.9284
Mw-proxy = 1.5 × md − 1.55±0.0170±0.04904632.0–3.40.9961
Mw-proxy = 1.0 × ML − 6.064 × 10⁻¹⁴±0.0009±0.00219310.7–5.50.9997
Mw-proxy = 0.6517 × Ms + 2.07±0.0198±0.0875482.5–6.80.9921
Table 6. Relations between Mw-proxy mb, md, ML, and M for the SP.
Relation±2σ (a)±2σ (b)Number of DataMagnitude RangeR-Square
Mw-proxy = 1.139 × mb − 0.5111±0.004±0.01498122.2–5.90.9986
Mw-proxy = 1.0 × md − 0.1±0.0508±0.00428132.3–4.40.9992
Mw-proxy = 1.0 × ML + 0.00001±0.0009±0.00197802.1–4.00.9995
Mw-proxy = 1.0 × M +0.4±0.0548±0.2095373.4–4.70.9776
Table 7. The earthquakes with a magnitude above 5 (Mw ≥ 5) in the region of the Black Sea.
NYearMonthDayHourMinuteLat (N°)Long (E°)Depth (km)MwFocal Tensor MechanismSourceRegion
12345678910111213
1197710553441.12633.61477.75.8Geosciences 13 00221 i001(1)North Turkey
219813124640.832928.15795.2N/A NW Turkey
3198111139745.1729155.1Geosciences 13 00221 i002(5)Vrancea Region
419837512140.376727.286910.46.1Geosciences 13 00221 i003(1)Offshore NW Turkey Marmara Sea
519831021203440.154929.343714.95.4Geosciences 13 00221 i004(1)NW Turkey
61985610114140.679736.064812.85.1N/A North Turkey
71988424204940.913428.279313.95.3Geosciences 13 00221 i005(1)NW Turkey
8198896191642.027441.667112.35.1N/A Offshore Georgia Black Sea
91990420233040.021940.056115.65.4Geosciences 13 00221 i006(1)NE Turkey
10199085183140.289133.913927.75.2N/A North Turkey
11199121295540.875728.823212.45.3Geosciences 13 00221 i007(4)West Turkey
121992212155940.617935.89269.85.3N/A NW Turkey
1319954134840.82927.803325.75.2N/A NW Turkey
14199681415540.718235.223216.55.8Geosciences 13 00221 i008(1)NW Turkey
15199681425940.730835.244915.65.6Geosciences 13 00221 i009(1)NW Turkey
1619968143140.335435.184115.9Geosciences 13 00221 i010(1)NW Turkey
1719972280340.748135.37748.85.2Geosciences 13 00221 i011(4)NW Turkey
1819981219161540.121641.995195N/A NE Turkey
1919998170140.796829.995216.37.5Geosciences 13 00221 i012(1)NW Turkey
20199981701540.701830.8455115.1 N/ANW Turkey
21199981701640.730829.9134125 N/ANW Turkey
22199981713340.754529.049115.6 N/ANW Turkey
23199981723440.646330.5892115.7N/A NW Turkey
24199981724240.682230.61527.85.4N/A NW Turkey
25199981725040.79629.965115.45.3N/A NW Turkey
26199981731440.723730.550719.45.3N/A NW Turkey
27199981742040.710130.348115N/A NW Turkey
28199981762840.813731.0329115N/A NW Turkey
291999819151740.63329.107417.65.1Geosciences 13 00221 i013(1.2.3)NW Turkey
30199982010040.657830.5559115N/A NW Turkey
311999822143140.70730.6945115.3N/A NW Turkey
32199983181040.786629.90916.75.1Geosciences 13 00221 i014(1)NW Turkey
331999913115540.787330.085315.75.9Geosciences 13 00221 i015(1)NW Turkey
341999920212840.710227.59413.45.2N/A NW Turkey
35199992901340.79929.377114.65.2Geosciences 13 00221 i016(1)NW Turkey
361999102023840.799428.9655135.1N/A NW Turkey
3719991111144140.806930.218313.15.7Geosciences 13 00221 i017(1)NW Turkey
3819991112165740.824331.207314.97.1Geosciences 13 00221 i018(1)NW Turkey
3919991112171740.792130.9896115.6N/A NW Turkey
4019991112172940.820431.446395.1N/A NW Turkey
411999111305440.841630.9473115N/A NW Turkey
4219991116175140.765531.504212.75N/A NW Turkey
431999111701540.842831.3081115N/A NW Turkey
441999111781540.851531.499795N/A NW Turkey
451999112084440.832331.478695N/A NW Turkey
46200021465641.03631.738105.2Geosciences 13 00221 i019(3)NW Turkey
4720006624140.732.982106Geosciences 13 00221 i020(1)North Turkey
4820006931440.72332.9213.95N/A North Turkey
492000823134140.78230.7610.55.3Geosciences 13 00221 i021(1)NW Turkey
502000127121641.40929.362105.1N/A Offshore NW Turkey
51200182604140.95831.5448.85.1Geosciences 13 00221 i022(3)NW Turkey
52200551292540.437637.398455Geosciences 13 00221 i023(1)NE Turkey
5320098574943.421628.663614.55Geosciences 13 00221 i024(1.2)Offshore Bulgaria Black Sea
542011725175740.824427.747412.25.1Geosciences 13 00221 i025(1)NW Turkey
55201267205440.845927.93427.75Geosciences 13 00221 i026(1)NW Turkey
5620121223133142.440741.057712.95.7Geosciences 13 00221 i027(1)Offshore Georgia Black Sea
5720121225224442.455440.98213.55.3Geosciences 13 00221 i028(1.2)Offshore Georgia Black Sea
5820135280943.228341.63519.25.1Geosciences 13 00221 i029(1)West Georgia
592015109143940.700536.68714.35Geosciences 13 00221 i030(1)North Turkey
602016101581842.190530.68686.45.1Geosciences 13 00221 i031(1)Offshore NW Turkey Black Sea
N/A means not applicable; (1) Global CMT Catalog. https://www.globalcmt.org/ (accessed on 3 June 2023); (2) Kalafat (2018) [84]. https://doi.org/10.1007/978-3-319-77359-9_25 (accessed on 3 June 2023); (3) European-Mediterranean Regional Centroid-Moment Tensors. http://rcmt2.bo.ingv.it/ (accessed on 3 June 2023); (4) Kalafat et al. (2009) [85]. Report (In Turkish); (5) Gobarenko et al. (2016) [25]. https://doi.org/10.1134/S0016852116040026 (accessed on 3 June 2023).
Disclaimer/Publisher’s Note: The statements, opinions and data contained in all publications are solely those of the individual author(s) and contributor(s) and not of MDPI and/or the editor(s). MDPI and/or the editor(s) disclaim responsibility for any injury to people or property resulting from any ideas, methods, instructions or products referred to in the content.

