Abstract
The Yacoraite Fm. (Salta rift basin, Argentina) consists of a mixed carbonate–siliciclastic lacustrine succession, interbedded with volcanic ash layers and organised in four third-order stratigraphic sequences. It is one of the few sites in South America that encompass the Cretaceous–Paleogene (K–Pg) transition, the position of which remains debated. Here, samples were collected along a depocentral stratigraphic section that was previously dated by zircon and carbonate U-Pb geochronology. The consistency between zircon and carbonate U-Pb ages, together with an accurate petrographic analysis, allowed the selection of carbonates potentially preserving the original geochemical signature. Accordingly, C-O stable isotopes were analysed from microbialites, oncoids, ooids and lacustrine cements. The available depositional age model from zircon geochronology defined the stratigraphic interval, potentially including the K–Pg transition. Within this interval, carbonates provided negative δ13C values consistent with the negative C anomaly recorded in various K–Pg sites elsewhere. Additionally, spherical particles resembling spherulites related to meteorite impacts were found in two samples. Accordingly, the K–Pg transition could be placed at the top of the second stratigraphic sequence. These findings encourage further investigation of the Yacoraite Fm. to gain insights into the response of South American terrestrial settings to the K–Pg palaeoenvironmental crisis.
1. Introduction
The Cretaceous–Paleogene (K–Pg) transition marks one of the main environmental crises in Earth’s history [1]. This global-scale event was triggered at 66 Ma [2,3,4,5] by the impact of a large asteroid on the Yucatán peninsula (Chicxulub impact structure, Mexico; Figure 1A), e.g., [1,6,7]. The role of additional events, such as the Deccan trap volcanism, is an ongoing subject of debate [8,9,10,11].
In marine and terrestrial geologic records, the K–Pg transition is marked by the occurrence of a diagnostic thin layer of clays, named ‘K–Pg boundary clays’, with high contents of siderophilic elements (e.g., iridium and other platinum group elements), and by the presence of impact-related spherulites and shocked quartz grains [1,12,13,14,15,16]. The K–Pg transition is also associated with various pieces of geochemical evidence, such as the negative carbon excursion [3,17,18] and the sulphur and osmium anomalies [9,19].
In terrestrial palaeoenvironments, the meteorite impact ejecta material caused extensive wildfires. This, together with the impact winter, induced major disruption of plant species and severe ecological cascade effects [7]. Climatic/ecologic changes and post K–Pg recovery dynamics in terrestrial settings were also strongly influenced by site-specific factors such as latitude, distance from the Chicxulub impact site and atmospheric/ocean circulations, e.g., [20]. Nowadays, reviews on the distribution of the K–Pg sites worldwide underline that terrestrial K–Pg sites are poorly represented, e.g., [16,20,21,22,23,24,25]. Consequently, terrestrial ecosystem changes across the K–Pg transition are, as of today, not well resolved [24], in particular in South America, where the few sites displaying the K–Pg boundary diagnostic features are mainly from marine and transitional environments (e.g., Gorgonilla Island and the Paraibà Basin; [26,27,28]) (Figure 1A).
The Yacoraite Formation (Fm.) is a Maastrichtian–Danian lacustrine sedimentary succession from the Salta Rift Basin (NW Argentina; Figure 1B) consisting of carbonate and siliciclastic deposits interbedded with volcanic ash layers, e.g., [29,30]. The succession represents a distal K–Pg site from South America since it encompasses the K–Pg transition, e.g., [31,32], and it is located >5000 Km from the Chicxulub crater [33]; Figure 1A). Such sites are particularly relevant for assessing climate and biotic conditions in correspondence with the K–Pg crisis because they were not influenced by the immediate force of the meteorite impact. However, the stratigraphic position of the K–Pg transition in this formation remains highly debated [30,34,35,36,37,38].
U-Pb geochronologic data from ash layers and carbonates along one stratigraphic section of the Metán sub-basin furnish a new accurate chronostratigraphic framework for further investigating the position of the K–Pg transition in this formation. [39,40]. Field work and petrographic analysis along the same stratigraphic section provided an accurate macro- and micro-facies analysis, one that was also aimed at detecting the occurrence of possible impact-related particles (e.g., spherulites and shocked quartz grains). Then, C-O stable isotope analyses were achieved on single carbonate phases (microbialites, ooids, oncoids and lacustrine cements) that demonstrated preservation of their original geochemical signatures [39,40]. Pre-existing and new sedimentologic, bio-stratigraphic, geochronologic and geochemical data allowed the proposal of a most-probable stratigraphic position for the K–Pg transition in the Yacoraite Fm.

Figure 1.
(A) Location of the Chicxulub impact crater in Mexico and of the study area from the Salta region in NW Argentina (yellow dots) together with the distribution map of the K–Pg sites of South America from marine (blue stars) and transitional (purple stars) environments. Asterisks indicate the occurrence of impact-related spherulites. 1. Colon Fm. [41]; 2. Gorgonilla Island [28]; 3. ODP Leg 207 [42]; 4. Pernambuco–Paraíba Basin, Poty quarry section [26,27]; 5. Neuquén Basin [43,44]; 6. La Colonia Fm. [45]; 7. Lafpán Fm. [46,47]; 8. López de Bertodano Fm. [48]; 9. Sites 516 from DSDP Leg 72 and site 356 from DSDP Leg 39 [42,46,49]. The dashed circles indicate the distance from the Chicxulub crater after [42]. (B) Present-day thickness map of the Yacoraite Fm. in the Metán–Alemania sub-basins in the Salta region with the position of the Juramento stratigraphic section. Modified from [38].

2. Geological Context
The Salta rift basin (NW Argentina; Figure 1B) belongs to the Andean basin system: a group of extensional basins that developed during the Mesozoic continental rifting of South America [50,51,52]. In the Salta rift basin, structural elements and different subsidence rates led to the formation of seven sub-basins that were interconnected at the end of Cretaceous time [53]. These are the Tres Cruces, Lomas de Olmedo, Metán, Alemania, El Rey, Sey and Brealito sub-basins [54] (Figure 1B).
The Salta rift sedimentary infill (Salta Group) is subdivided into Pirgua (syn–rift phase), Balbuena (transitional sag phase) and Santa Bárbara (post-rift phase) subgroups [55]. The Balbuena subgroup comprises, from the base to the top, the Lecho, the Yacoraite and the Tunal/Olmedo Formations [52].
The Yacoraite Fm. deposited during the main sag phase of the rift and consists of a lacustrine mixed carbonate–siliciclastic succession deposited in a hydrologically closed lake characterised by semi-arid palaeoclimatic conditions [30]. The formation reaches 220 m in thickness in the main depocentres and comprises mudstones, oolitic packstones to grainstones and a large diversity of microbial boundstones, interbedded with fine- to coarse-grained sandstones, as well as organic-rich deposits, e.g., [30,56,57,58,59,60,61,62,63]. The predominance of shallow marginal facies (Figure 2) suggests a low to medium gradient ramp-type margin depositional environment where siliciclastic-dominated facies are mainly located along previous footwall margins, and carbonate-dominated ones preferentially occur in palaeohighs away from siliciclastic inputs [30,38].
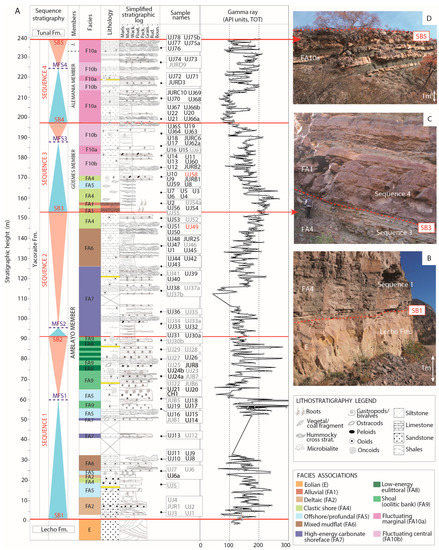
Figure 2.
Sedimentology, stratigraphy, and sampling of the Yacoraite Fm. from the Juramento section. (A) Sedimentological column with sequence stratigraphy, facies associations (FA), lithology, stratigraphy, location of the samples investigated and gamma ray log. The positions of sequence boundaries (SB, in red) and maximum flooding surfaces (MFS, in blue) along the section are appended [30,38]. FA identified based on [30]. Lithostratigraphic units indicated in yellow and pink correspond, respectively, to volcanic ash layers and massive bodies of reddish fine-grained alluvial deposits. Carbonate textures along the simplified stratigraphic log are: Boun., boundstone; Float., Floatstone; Grain., grainstone; Mud., mudstone; Pack., packstone; Rud., rudstone; Wack., wackestone. The names of carbonate samples are reported with the following colour code: Black = samples analysed for C-O stable isotopes. Grey = samples with no C-O stable isotope analyses. Red = samples including spherulites. The scale of the Gamma Ray log is in American Petroleum Institute (API) units. (B) Field photograph illustrating an erosional transgressive boundary (SB1) separating the Lecho and Yacoraite Formations. (C) Field photograph illustrating the transition from shallow lacustrine deposits (FA4) toward massive bodies of siliciclastic alluvial deposits with distinctive reddish colour (FA1) along a regressive sequence boundary (SB3). (D) Field photograph of the top of Sequence 4 (below SB5), displaying alternation between stromatolite beds and green marly deposits representing the FA10a facies association.
The palaeontological record includes gastropods, ostracods, avian and non-avian dinosaur tracks and few preserved palynomorphs that agree with a Maastrichtian–Danian age for the formation [31,32,35,55,63,64,65,66,67,68,69,70,71,72,73,74,75]. A recent U-Pb zircon geochronology survey on interbedded volcanic ash layers established a sedimentation time between 68.1 ± 0.9 Ma and 62.3 ± 0.5 Ma [40].
The stratigraphic architecture of the Yacoraite Fm. was primarily controlled by climate changes [30,38] and the sedimentation pattern and stratigraphic framework are characterised by multiple hierarchies of cyclicity [30,38,57,58,59,63,76,77,78,79]. The present study considers the mid-term cyclicity reported by [30,38] for the Metán–Alemania sub-basins. Accordingly, the Yacoraite Fm. was divided into four mid-term (third-order) stratigraphic sequences (Sequences 1, 2, 3 and 4) bounded by five sequence boundaries (from the base to the top, SB1 to SB5; Figure 2). The duration of each sequence is included, ranging between 0.6 and 2.8 Ma, based on zircon (ash layer) geochronology [40]. The four third-order stratigraphic sequences mentioned correspond to the lithostratigraphic members [29,57] as in the following: Sequence 1 and Sequence 2 correspond to the Amblayo Member, Sequence 3 to the Güemes Member and Sequence 4 to the Alemania and Juramento Members (Figure 2).
The stratigraphic position of the K–Pg transition in the Yacoraite Fm. was hypothesised based on various bio- litho- chemo- chrono-stratigraphic data. However, the authors did not converge on a single stratigraphic position, since no iridium anomaly of K–Pg boundary clays has ever been recovered in the seven sub-basins [30,34,35,36,37,38].
3. Materials and Methods
3.1. Field Survey and Sampling Different
Field survey and sampling was achieved in the Cabra Corral Lake area from the Metán sub-basin, near the Rio Juramento dam, along the 238 m thick Juramento stratigraphic section (25°18′08.01″ S, 65°17′42.91″ W) (Figure 1B). This section was previously investigated for U-Pb dating on syn-depositional carbonates and interbedded volcanic ash layers [39,40].
The available sedimentology and stratigraphy of the Juramento section [39] were here complemented with a continuous sampling (120 samples, approximately one every 2 m) and a high frequency spectral gamma ray acquisition (Figure 2). The patterns and shapes of gamma-ray logs are used to assist facies and stratigraphic analysis and the interpretation of depositional environments. Macroscopic observations allowed the collection of samples far from mineralized fractures and emersion surfaces to avoid potential overprinting by later fluids of the carbonate pristine geochemistry. Naturally occurring spectral gamma ray radiation was acquired via a hand-held RS-230 BGO Super-SPEC spectrometer (813 measurements, one every ~30 cm). Spectral signatures consist of the total radioactivity (API) obtained as a combined sum of potassium (K), uranium (U) and thorium (Th) contents using Equation (1), as provided by [80]:
API (TOTAL) = 16 K [%] + 8 U [ppm] + 4Th [ppm]
The present contribution also considers the sedimentologic and stratigraphic studies conducted in the Alemania, Metán and El Rey sub-basins that have established 10 facies associations (FA, Figure 2) and a robust basin-scale stratigraphic framework [30,38].
3.2. Petrography
One hundred twenty polished and uncovered thin sections (50–60 μm thick), one for each sample collected, were prepared for petrographic examination. Conventional optical petrography was performed using a Nikon ECLIPSE LV100 POL polarised light microscope which allowed observations under plane-polarised and cross-polarised light (PPL and XPL). Cathodoluminescence (CL) microscopy was accomplished with a CITL 8200 Mk5 cold CL instrument, the electron beam of which worked under vacuum conditions (<0.1 mbar) with an acceleration voltage of 10 kV and a current of 250 μA. The thin sections were partially stained with a solution of 10% diluted HCl, Alizarin red-S and potassium ferricyanide [81]. Carbonate textures were described by using the classification from [82], whereas FA and depositional environments were attributed following the scheme proposed by [30]. In this study the term stromatolite, which includes the microbialite boundstone, is used when referring to the macro-facies, whereas the term ‘microbialite’ is employed when referring to the micro-facies. In this respect, microbialite microfabrics have been described using the classification and terminology defined by [83,84]. The habitus of calcite cements was described based on [85] classification scheme.
3.3. Micro-Raman Spectroscopy
Micro-Raman spectroscopy was carried out on one thin section using a high-resolution micro-Raman system (Horiba LabRam HR Evolution spectrometer) at the Department of Earth Sciences ‘A. Desio’ of the University of Milan (Italy). Material was excited via a green laser source, Nd-Yag at 532 nm/100 mW with Ultra Low Frequency (ULF) filters. All spectra in the range 100–3900 cm−1 were collected to observe all the vibrational modes of the material analysed. Plotting and mineral identification of Raman spectra were done with CrystalSleuth software [86] and by relying on the pre-existing literature.
3.4. C-O Stable Isotope Analysis
The analysis of C-O stable isotopes was achieved on 112 carbonate phases from 88 samples.
Powders were carefully extracted from polished rock slabs by means of a dental drill (Dremel 225, drill tip size of 0.8 mm) under a binocular microscope from single carbonate phases: microbialites (n = 67), ooids (n = 40), oncoids (n = 3) and early cements (n = 2). Among them, 66 were calcites, 26 were dolomites and 20 had mixed mineralogy (i.e., dolomite and calcite). Powders were reacted with 100% phosphoric acid at 70 °C using a Gasbench II connected to a ThermoFisher Delta V Plus mass spectrometer and analysed for C and O stable isotopes at Geozentrum Nordbayern (Germany). Δ13C and δ18O are reported in per mil (‰) relative to the Vienna Pee Dee Belemnite (V-PDB) standard. Reproducibility and accuracy were monitored by replicate analyses of laboratory standards calibrated by assigning δ13C values of +1.95 to NBS19 and −47.30 to IAEA-CO9, and δ18O values of −2.2 to NBS19 and −23.2 to NBS18. Reproducibility for δ13C and δ18O values measured on the studied carbonates was ±0.04 and ±0.03 (1σ), respectively. Oxygen isotope values of dolomite were corrected using the phosphoric acid fractionation factors of [87]. This correction was not applied to carbonates with mixed mineralogy.
4. Results
4.1. Field Acquisitions
The Yacoraite Fm. along the Juramento section shows a mixed carbonate–siliciclastic composition. In this work, we mainly refer to previous literature for FA definition and stacking pattern interpretation [30]. Accordingly, nine FA were identified: alluvial deposits (FA1), deltaic deposits (FA2), clastic shore (FA4), offshore/profundal deposits (FA5), mixed mudflat deposits (FA6), high-energy carbonate shoreface deposits (FA7), low-energy eulittoral deposits (FA8), shoal (oolitic bank) (FA9) and highly alternating lacustrine deposits (FA10), the last subdivided into fluctuating marginal (FA10a) and fluctuating central (FA10b) (Figure 2).
Consistent with this, the four main sequences established by [30] can be grouped into two main cycles, subdivided by a major boundary corresponding to SB3 (Figure 2).
Sequence 1 consists of m-scale sequences, primarily organised in a prograding–aggrading trend in the overall transgressive trend up to MFS1 as underlined by the funnel shapes in the gamma ray log (Figure 2). The overall prograding trend of Sequence 1 above MFS1 is then organised in a m-scale aggrading–retrograding trend, as underlined by the bell shape in the gamma ray log (Figure 2).
Sequence 2 shows the same organisation as Sequence 1. The top of Sequence 2 (above ca. 126 m; Figure 2) is characterised by a transition from carbonate- to siliciclastic-dominated deposits, with mixed mudflat deposits (FA6) followed by shoreface and low-energy shore deposits (FA4). SB3 then marks an abrupt basin-ward shift of the facies associations. Here, shallow lacustrine deposits (FA4) are overlayed by siliciclastic alluvial deposits (FA1) (Figure 2) which correspond to a massive body of red alluvial deposits and palaeosoils (Figure 2C) hosting root traces and small gastropod shells. SB3 is not marked by a main decrease in the gamma ray log, as was observed for the other sequence boundaries.
Sequence 3 started with high and blocky gamma ray values (Figure 2) corresponding with FA1. The overall transgressive trend of Sequence 3 is then characterised by an m-scale prograding–aggrading trend up to MFS3, as underlined by the funnel shapes in the gamma ray log. As for sequences 1 and 2, the overall prograding trend of Sequence 3 from MFS3 to SB4 is organised in an m-scale aggrading–retrograding sequence, as underlined by the bell shape in the gamma ray log (Figure 2). The topmost part of Sequence 3 shows a funnel shape in the gamma ray log, suggesting a prograding–aggrading sequence preserved just below SB4.
Sequence 4 started with some of the lowest gamma ray values in the Yacoraite Fm. (Figure 2). As with previous sequences, Sequence 4 consists of m-scale sequences, primarily organised in an aggrading–prograding trend in the overall transgressive trend up to MFS4, as underlined by the funnel shapes in the gamma ray log (Figure 2). The overall prograding trend of Sequence 4 above MFS4 is then organised in an m-scale aggrading–retrograding sequence as underlined by the bell shape in the gamma ray log (Figure 2).
Stromatolites represent important palaeoenvironmental indicators, especially in association with the extinction events. Since the formation hosts a large diversity of stromatolite forms, field acquisition also aimed at observing their distribution along the section. Sequence 1 includes mainly planar laminated stromatolites as dominant forms. A general decrease in the frequency and size of stromatolites is observed at the top of Sequence 2, with the last stromatolite occurring at 147 m, a few metres below SB3. Sequence 3 showed the lowest content of stromatolites, with the first few thin stromatolites reappearing at ca. 161 m. Sequence 4 was then characterised by development of m-scale coalescent domes of stromatolites found in alternation with silty dolomitic marls-to-mudstones, which is the typical expression of FA10.
4.2. Carbonate Petrography
Petrographic analysis allowed for the characterisation of the micro-facies of the investigated samples and the discarding of those with evidence of post-depositional diagenetic modifications. Accordingly, depositional (i.e., microbialites, ooids, and oncoids) and early diagenetic (i.e., lacustrine cements) carbonate phases were selected to be further investigated for C-O stable isotope analyses (see Section 4.4).
Ooids are present in various carbonate (e.g., oolitic grainstone and stromatolite) and siliciclastic (e.g., oolitic sandstone and silty oolitic wackestone-to-grainstone) facies. They are round to sub-round, up to 1000 µm in size and are frequently grouped in lumps (Figure 3A,B). They generally consist of radial calcite crystals, and display a concentric arrangement of multiple cortex laminae with thicknesses between few microns to almost half of the ooid diameter (Figure 3A–C). They display micritic (Figure 3A,B) or detrital nuclei; the latter may consist of quartz grains, bioclasts, or peloids. Ooids were differentiated based on their mineralogy in (1) calcitic ooids (OC; Figure 3A); (2) dolomitic ooids (OD; Figure 3B); and (3) mixed ooids (MIC-M; Figure 3C), which are those characterised by the alternation of calcitic and dolomitic laminae.
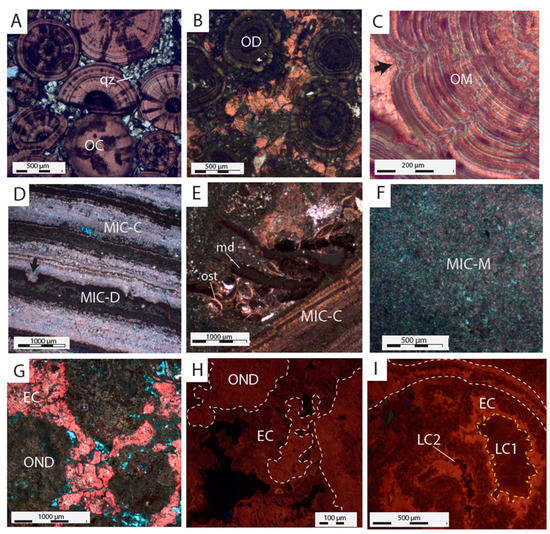
Figure 3.
Petrographic images of the carbonate samples investigated. (A) Oolitic sandstone made of concentric, pink-stained, non-ferroan, calcitic ooids (OC) occurring within a groundmass of fine quartz grains (qz). Ooids show radial features. UJ7a sample, PPL view, stained section. (B) Oolitic grainstone made of un-stained non-ferroan dolomitic concentric ooids cemented by a pink-stained, non-ferroan, equant blocky calcite (EC). UJ30a sample, PPL view, stained section. (C) Detail of an ooid with cortex indentations (black arrow). It consists in an alternation of pink-stained non-ferroan calcite laminae and un-stained non-ferroan dolomite laminae. UJ68 sample, PPL view, stained section. (D) Microbialite consisting of pink-stained non-ferroan calcitic laminae (MIC-C) and un-stained non-ferroan dolomitic laminae (MIC-D) affected by bioturbation (black arrow). Sample UJ56, PPL view, stained section. (E) Packstone, including laminated pink-stained calcitic microbialite (MIC-C), ostracods (ost) and un-stained dolomitic mud clasts (md). Sample UJ56, PPL view, section stained. (F) Laminated microbialite with mixed mineralogy (MIC-M) composed by pink-stained calcite and un-stained dolomite micrite grains. Sample UJ45, PPL view, stained section. (G) Oncoidal rudstone composed of porous un-stained dolomitic spongiostromate oncoids (OND) cemented by early calcite with equant blocky crystals (EC). Sample CH1, PPL view, stained section. (H) Oncoidal rudstone composed of spongiostromate oncoids (OND) cemented by an early calcite with zoned dull orange luminescence (EC). CL view, JUB6 sample. (I) Gastropod shell cemented by early calcite with equant blocky crystals showing zoned bright orange luminescence (EC), followed by an equant blocky calcite with dull orange luminescence (LC1) and an equant blocky calcite generating no luminescence (LC2). UJ53 sample, CL view.
Microbialite was observed in various carbonate facies (e.g., stromatolite and packstone; Figure 3D,E) and shows fine-grained or clotted thrombolite microfabrics. In the laminated microbialite, planar to convoluted microbial laminae reach a thickness of few millimetres and often show a “moustache-like’’ wavy lamination pattern. Similar to ooids, microbialites have calcitic (calcitic microbialite, MIC-C; Figure 3C), dolomitic (dolomitic microbialite, MIC-D; Figure 3C) and mixed (mixed microbialite; MIC-M; Figure 3D) mineralogies. The latter is made either by alternation between mm-size calcitic and dolomitic laminae (Figure 3D) or by a mixing of calcite and dolomite microcrystals. Authigenic pyrite and quartz grains may also occur (Figure 3E).
Oncoids are found in the oncoid rudstone facies. They consist of spongiostromate dolomite oncoids (OND) with sizes up to 2 mm. They have a roundish shape and irregular surfaces, carry micro-pores (Figure 3G,H) and may nucleate around ostracod shell fragments.
The samples analysed host various diagenetic phases. Among the earliest phases is a calcite cement given by fibrous-to-bladed crystals that locally forms pendants and shows a dull orange luminescence (PEC). These may reach a thickness of 150–200 µm, and presumably formed in the vadose meteoric zone. PEC is only observed in the oolitic grainstone facies. Most samples are instead cemented by an early diagenetic calcite (EC; Figure 3G) which consists of equant blocky crystals (up to150 μm in size) with zoned dull-to-bright orange luminescence (Figure 3H,I). EC is a lacustrine cement precipitated in the interparticle and framework pores and pre-dated mechanical compaction, as suggested by the limited grain-to-grain contacts observed in samples where this cement occurs (Figure 3B). PEC and EC are post-dated by other calcite cements, named LC1 and LC2, which fill interparticle pores (Figure 3I). LC1 is composed of equant blocky crystals (up to 200 µm) and locally shows a drusy arrangement and displays an un-zoned dull orange luminescence (Figure 3I). LC2 post-dated LC1 and is composed of equant blocky non-luminescent crystals (Figure 3I).
4.3. Petrography and Raman Spectroscopy of Spherulites
Round to sub-round, locally ellipsoidal particles, here named spherulites, were detected in two layers, at 145 m (UJ49 sample; Figure 2 and Figure 4) and at 170 m (UJ58 sample; Figure 2 and Figure 5) from the base of the Juramento section. The first layer consists of a bed of ~20 cm thickness made of coalescent domes of laminated stromatolite given by the alternation of greyish calcitic and yellowish dolomitic laminae (Figure 4A,B). The second layer consists of 10–20 cm thick grainstone-to-floatstone that exhibits coarsening upward mm sized trend and no lamination (Figure 5A,B).
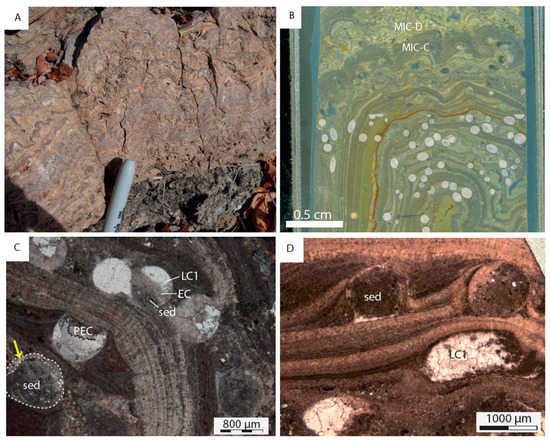
Figure 4.
Field photograph, thin section scan and petrographic images of a stromatolite sample (UJ49) containing spherulites 500–1000 μm in size. (A) Coalescent domes of laminated stromatolite forming a 20 cm thick continuous bed. Field photograph. (B) Laminated microbialite displaying wavy laminations alternatively with calcitic (grey, MIC-C) and dolomitic (yellowish, MIC-D) mineralogy. Spherulites are visible, and were highlighted in white in the lower part of the image. Thin section scan. (C) Details of rounded to sub-rounded spherulites with a calcite rim (yellow arrow). Spherulites may contain internal and geopetal sediments (sed) or calcite cements which are made by fibrous-to-bladed crystals forming pendants (PEC) and by equant blocky crystals (LC1). PPL view. (D) Details of rounded-to-ellipsoidal spherulites. Calcitic microbialite laminae encrust the spherulites. Moldic porosity is occupied by internal and geopetal sediments (consisting of carbonate mud, peloids and rare quartz grains) and equant blocky calcite crystals (LC1) locally with a drusy mosaic. PPL view, stained section.
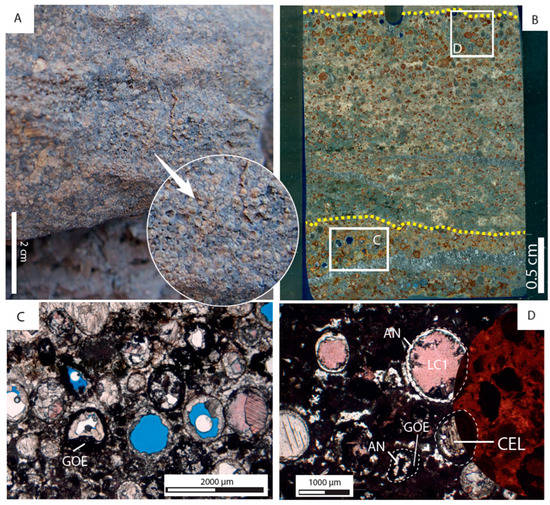
Figure 5.
Field photograph, thin section scan and petrographic images of a grainstone-to-floatstone sample (UJ58) containing spherulites 250–1000 μm in size. (A) 10 cm thick grainstone layer hosting sub-millimetric, yellowish and locally hollow spherulites (see circle of magnification). Field photograph. (B) Coarsening upward distribution of spherulites having a yellowish-reddish colour. Porosity is in blue. The white frames indicate where images C and D are located. Yellow dashed lines bound a coarsening upward cycle. Thin section scan. (C) Hollow and partially hollow spherulites of heterogeneous sizes locally displaying a sub-millimetric rim of dark opaque goethite (GOE). Porosity is filled by various cements. PPL view. (D) Spherulites show a rim of opaque non-luminescent goethite (GOE), and internally, a non-isopachous rim of clear un-stained analcime cement (AN). The remaining intraparticle porosity is filled by pink-stained calcite cement composed of equant blocky crystals with un-zoned dull orange luminescence (LC1) or by a yellowish celestite cement made by fibrous non luminescent crystals (CEL). PPL (left) and CL (right) view, stained.
In sample UJ49, the spherulites are clear and poorly abundant (~10/cm2; Figure 4B) with a size usually ~800 µm. In sample UJ58, they instead are in relief on weathered surfaces and appear as yellowish/reddish, locally hollow grains (Figure 5A). They are more abundant (>50/cm2) and less sorted than in the previous sample, with sizes of 250–1000 µm (Figure 4B).
In sample UJ49, the spherulites are encrusted by microbial laminae and hold geopetal and internal sediments which also include small ooids and ostracods (Figure 4C,D). Here, spherulites present a partially preserved 50 µm size calcite rim (Figure 4C) and are cemented by early calcite cements PEC and EC (Figure 4C). Later cementation is witnessed by the presence of the later blocky calcite LC1 in the intraparticle porosity (Figure 4C,D).
Sample UJ58 was affected by multi-stage diagenesis, causing the precipitation of various phases (Figure 5C,D). Since their mineralogy was not easily identified based on petrography, they were additionally analysed by Raman spectroscopy. The spherulites presented a 10 to 200 µm thick external rim of non-luminescent opaque phases (GOE; Figure 5C,D) which was locally fractured due to mechanical compaction. The Raman spectrum of these opaque phases is characterised by three main narrow peaks at the bandwidths 210–225, 280–300 and 370–405 cm−1, and two accessory larger peaks, one in the bandwidth of 605–715 and another around 1300 cm−1. The three main peaks are consistent with those detected in goethite [88], although the band configuration reveals the presence of alteration products. The GOE rim is internally lined by a non-isopachous rim of clear, un-stained cement crystals with trapezohedral habitus (AN; Figure 5C). AN may be followed by an additional GOE rim (Figure 5D). Raman analysis provided a spectrum with one main narrow peak at 482 cm−1 and four accessory peaks at 298, 385, 1110 and 3560 cm−1, the last suggesting the presence of water. This combination of bands is typical of pure analcime, e.g., [89].
The remaining intraparticle porosity was filled by various generations of cements: a yellowish un-stained cement made by fibrous crystals with sweeping extinction and non- to-very-dull orange luminescence (CEL; Figure 5D) and the blocky calcite LC1 (Figure 5D,E). The CEL cement yields a Raman spectrum with one main narrow peak at 996 cm−1 and accessory peaks at 459 and 1153, in the bandwidth 620–652 and at 3580 cm−1, the last indicating the presence on water. These bands agree with those from celestite, e.g., [90].
4.4. C-O Stable Isotope Data
The C-O stable isotopes values obtained for the different depositional (MIC-C, MIC-D, MIC-M, OC, OD, OM and OND) and early diagenetic (EC) carbonate phases from the four third-order stratigraphic sequences are summarised in Table 1 and Figure 6. The pendant early calcite (PEC) could be not sampled due to the limited volume.

Table 1.
C-O stable isotope data of the carbonate phases investigated.
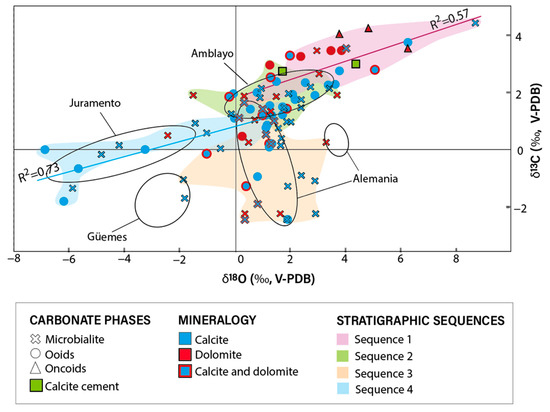
Figure 6.
δ13C versus δ18O cross-plot of the single carbonate phases analysed. For each data point the symbol refers to the carbonate phase and the colour to its mineralogy. Note the δ13C-δ18O covariance in Sequence 1 and Sequence 4 (purple and blue regression lines, respectively). No δ13C-δ18O covariance is recorded in Sequence 2 or Sequence 3. The black ellipses include the results of C-O stable isotope analysis of bulk carbonate samples from the Metán-Alemania sub-basins reported by [36]. Amblayo Member corresponds to Sequence 1 and Sequence 2, Güemes Member corresponds to Sequence 3) and Alemania and Juramento Members correspond to Sequence 4. Members are presented in Figure 2.
The δ13C and δ18O values are included between −2.46 and 8.67‰, and between −6.85 and 8.67‰, respectively, with no discernible difference among carbonate phases (Figure 6). However, a possible correlation stands among the third-order stratigraphic sequences. In sequences 1 and 4 carbonates exhibit covariance between δ13C and δ18O values (R2 = 0.57 and R2 = 0.73, respectively). Sequence 1 (n = 26) is characterised by positive δ18O values (0.31 to 8.67‰; mean = 3.26‰) and positive δ13C values (1.65 to 4.44‰; mean = 2.87‰), whereas Sequence 4 (n = 27) mostly displays negative δ18O values (−6.85 to 1.87‰; mean= −0.95‰) and lower δ13C values (−1.83 to 1.54‰; mean = 0.57‰). In sequences 2 and 3 carbonates exhibit no covariance between the δ13C and δ18O values. Samples from Sequence 2 (n = 23) mostly fall in the first quarter of the cross-plot (Figure 6) and are thus characterised by positive δ18O (−1.80 to 3.71‰; mean = 1.46‰) and δ13C (−1.71 to 2.96‰; mean = 1.56‰) values. Conversely, samples from Sequence 3 (n = 36) mostly fall in the fourth quarter of the cross-plot, with lower δ18O (−1.84 to 3.29‰; mean = 1.29‰) and δ13C (−2.46 to 1.87‰; mean= −0.81‰) values.
5. Discussion
5.1. K–Pg Transition in the Yacoraite Fm.
The stratigraphic position of the K–Pg transition in the Salta rift basin has long been debated, since no iridium anomaly or impact clays have ever been recovered [30,34,35,36,37,38]. Initially, the lack of stratigraphic discontinuity between Yacoraite and Tunal/Olmedo Fm. led to the assumption that the K–Pg transition was preserved in the Tunal/Olmedo Fm. [91]. Afterwards, the transition was placed at the top of the Yacoraite Fm. in correspondence with a negative carbon excursion [34]. Both hypotheses are disproved by the presence of Danian palynomorphs at the top of the Yacoraite Fm. [32,66,92]. The following studies suggest that the K–Pg transition should be placed within Sequences 2 or 3, since abrupt lithologic and geochemical changes are found in this stratigraphic interval: [35,36,38]. However, some geochronologic data seem to be in contrast with this last hypothesis [93].
To locate the K–Pg transition in the Yacoraite Fm., pre-existing biostratigraphic, lithostratigraphic, geochemical and geochronologic data from different sub-basins of the Salta rift were discussed considering the new data acquired in this study.
The 238 m thick Juramento stratigraphic section from the Metán sub-basin (Figure 1B) was selected for this purpose for several reasons. (1) It is included in pre-existing basin-scale chronostratigraphic correlations [30], allowing the easily reporting of data (e.g., biostratigraphic data) from other sub-basins along this section. (2) The section is located close to the main depocentre of the Metán–Alemania sub-basin (Figure 1B); here, carbonate sedimentation was predominant and major hiatuses that usually characterise the proximal domains are not expected [30], enhancing the probability of detecting a preserved K–Pg boundary layer. (3) The depositional age along this section was previously constrained by zircon (ash layer) U-Pb geochronology [40]. (4) Finally, carbonates along the Juramento section underwent minor diagenetic overprint [40]; this is of prime importance, since the use of C- and O-stable isotope data to locate the K–Pg transition is generally limited by the high sensitivity of carbonates to geochemical modifications during diagenesis.
Biostratigraphic analysis, in particular the study of palynomorphs, is one of the most-used approaches for locating the K–Pg transition in terrestrial settings, since the limit between Cretaceous and Paleogene notoriously corresponds to an important biologic turnover [24]. However, the calcareous composition of the Yacoraite Fm. limited palynomorph preservation, and thus, only a few palynomorphs have been recovered, one in the western part of the Alemania sub-basin (Don Otto mine section), and one from the Lomas de Olmedo sub-basin [32,66,92] (Figure 1B). The Yacoraite Fm. is known to host well-preserved Senonian dinosaur ichnofossils, which were found in the costal domains of the Tres Cruces sub-basin, e.g., [31,32,35,64,65,67,74]. By correlating these biostratigraphic data along the Juramento section, it can be derived that the K–Pg transition should be preserved in a ~90 m thick (~130–220 m) stratigraphic interval included between the middle of Sequence 2 and the middle of Sequence 4. This interval is bounded by the position of the youngest dinosaur ichnofossil and the oldest Danian palynomorph [66,67] (Figure 7).
Additional information regarding the position of the K–Pg transition can be obtained from zircon (ash layer) geochronology, a well-established chronostratigraphic tool in terrestrial settings [94]. Various authors provide U-Pb ages from ash layers in the Cobra Corral Lake area of the Metán–Alemania sub-basin [38,40,93,95]. However, these ages do not always agree (see discussion in [40]), and consequently do not converge on the same stratigraphic interval for the location of the K–Pg transition (Figure 7). Indeed, by linearly interpolating the single age datasets from different authors, determines that the K–Pg transition is located: (1) inside the Tunal/Olmedo Fm., based on the ages from [ì93]; (2) between 125 and 175 m (50 m thick interval), based on the ages from [95]; and (3) between 40 and 180 m (140 m thick interval), based on the ages from [38,40] (Figure 7). The first scenario is in contrast with the presence of Danian palynomorphs at the top of the Yacoraite Fm., as already mentioned [32,66,92]. The second scenario agrees with the hypothesis of the K–Pg transition occurring somewhere inside sequences 2 and 3 [35,36]. Nevertheless, the two ages published in [95] are both younger than 66 Ma and associated with large uncertainties (see the discussion in [40]). Finally, the third scenario yields a large stratigraphic interval included between sequences 1 and 3 (Figure 7). In contrast with previous scenarios, this last scenario relies on robust depositional age depth models obtained by interpolating 11 ages younger and older than 66 Ma, which are well-distributed along the Juramento section [40]. The important thickness of this stratigraphic interval is due to the unresolvable uncertainty of the zircon depositional age model (0.9%, 2σ) and to the high sedimentation rates (up to 150 m/Ma) recorded in this stratigraphic interval [40].
By jointly applying biostratigraphy and U-Pb zircon geochronology, it is possible to define a ~50 m thick stratigraphic interval (between ~130 and 180 m) that most possibly includes the K–Pg transition (Figure 7).
The end of Cretaceous—and the beginning of Paleogene time was a period characterised by drastic climate changes. Perturbation of the carbon cycle is recorded in organic matter and carbonates as important anomalies of δ13C and δ18O [3,17,18]. In terrestrial settings, the negative δ13C excursion reaches down to −1.5/−2‰ [17]. Fluctuation of carbonate C-O stable isotope ratios were investigated in three different studies [34,36,38] in the Metán–Alemania, Sey and Tres-Cruces sub-basins, although they were mainly obtained from bulk analysis. Given the presence of later carbonate phases (Figure 3), bulk analysis represents a limiting factor for the accuracy of C-O stable isotope results (Figure 8). Similar to that which has been discussed for the U-Pb zircon ages, these studies do not converge on the same stratigraphic position for the K–Pg transition (Figure 8). The first study [34] places the transition at the top of the Yacoraite Fm./base of Tunal Fm., although, as previously stated, this hypothesis has been disproved. The second study [36] locates the transition inside sequence 3, where various geochemical anomalies have been detected; these are decreased Mg/Ca and Mn/Sr ratios and the lower concentration of certain elements (i.e., Si, Al, and Fe); positive peaks of Hg and Sr; and a positive anomaly of siderophile elements (i.e., PGE; Cr, Ni and Co) [34,35,36,37]. Finally, the third study [38] places the transition in an interval included between the top of Sequence 2 and the base of Sequence 3 based on a multiproxies survey conducted in the Metán–Alemania sub-basin.
New C-O stable isotope data were obtained for the first time in this case study on single depositional and early diagenetic carbonate phases after a careful petrographic analysis that aimed to discard those phases affected by later diagenetic modifications. The preservation of the pristine geochemical signal of these carbonates was further assessed based on the consistency between zircon and carbonate U-Pb ages along the Juramento section [39,40]. Indeed, U-Pb geochronology proves to be an excellent tool for constraining accurate depositional ages in lacustrine systems from carbonates not affected by post-depositional diagenetic modifications [96,97].

Figure 7.
Sequence stratigraphy (Seq. strat.), biostratigraphy (Bio.) and U-Pb zircon (ash layer) geochronology from previous studies. Sequence stratigraphy from [30,38]:SB in red are Sequence Boundaries, MFS in blue are Maximum Flooding Surfaces. Bibliographic source for biostratigraphic data from: 1. [72]; 2. [71,73]; 3. [32]; 4. [67]; 5. [72]; 6. [66]; and 7. [98]. U-Pb zircon ages from: green [93]; blue [95]; grey [38] and black [40]. Green, blue, and purple areas are depositional age models obtained by linear interpolating the ages from each age dataset. The stratigraphic interval where the K–Pb transition (66 Ma) is preserved according to the different age datasets is indicated by the dashed lines. Stratigraphic position of fossils and U-Pb ages along the section derive from basin-scale stratigraphic correlation from [30].

In the ~60 m thick stratigraphic interval (between ~130 and 180 m) identified by biostratigraphy and U-Pb zircon geochronology (Figure 7), carbonates provided negative δ13C values down to −2.5‰ between 151 and 176 m (~25 m interval), values which correspond with the top of Sequence 2 and the base of Sequence 3 (Figure 8). This negative shift is consistent with the negative C anomaly recorded in various K–Pg sites elsewhere [3,17,18]. The anomaly starts two metres below SB3 and reaches its peak between 163 and 176 m. The recovery was drastic, with δ13C returning to positive values at around 180 m, 29 m above the onset of the negative shift (Figure 8). Based on the sedimentation rates of 150 m/Ma already known for this stratigraphic interval [39], the time interval between onset and recovery of the negative shift was around 0.2 Ma.

Figure 8.
δ13C and δ18O values of carbonates along different sedimentary sections of the Yacoraite Fm. from the Metán–Alemania sub-basins. Yellow areas represent the location of the K–Pg according to different authors: (A) [34]; (B) [36]; (C) [38]; (D) this study where, for each data point, the symbol refers to the carbonate phase and the colour to its mineralogy. Lith. = lithology. Sph. = spherulites. Cr-Co-Ni refers to the positive anomaly of siderophile elements from [35]. Red and blue horizontal lines are respectively Sequence Boundaries (SB) and Maximum Flooding Surfaces (MFS). SB and MFS were reported along the different stratigraphic sections based on the chronostratigraphic correlations of [30].

In terrestrial settings, the K–Pg negative carbon excursion is associated with other indicators of ecosystem disruption. In the framework of the Juramento section, the top of Sequence 2 (starting at ~126 m) was characterised by the progressive transition from carbonate- to siliciclastic-dominated sedimentary facies (Figure 2). The basin-ward shift reached its acme at SB3 with the deposition of a massive clastic blanket of red alluvial deposits (Figure 2 and Figure 7). In addition, the top of Sequence 2 also saw the decrease of carbonate production, as witnessed by the reduced frequency and size of stromatolite buildups (Figure 2). The last stromatolite was detected at ~147 m, which, based on the depositional age model from [40], formed less than 0.03 Ma before the onset of the carbon excursion (Figure 2).
Previous authors have highlighted, below and in correspondence with SB3, changes in catchment dynamics, increase of clastic supply and sedimentation rates, and modification of source rock quality (i.e., higher hydrogen index and total organic carbon). A tectonic trigger for these changes was excluded by these authors; they rather hypothesised the occurrence of abrupt climate changes affecting vegetation cover and architecture of the Salta rift basin [30,38].
The Chicxulub meteorite impact is known to have produced a massive cloud of dust and acid aerosol that, in terrestrial settings, caused extensive wildfires and inhibited photosynthesis, accounting for the extinction of plants [1] and the decrease/shut-down of carbonate production [19]. Changes in depositional environment and catchment dynamic, as well as the increase in clastic supply and sedimentation rates, are also expected due to the loss of vegetation cover [24]. These palaeoenvironmental indicators are observed along the Juramento section below SB3, as previously discussed.
Pre-existing biostratigraphic and geochronologic data, together with stratigraphic position of the negative carbon excursion and sedimentologic/palaeoenvironmental evidence, suggest that the K–Pg transition possibly occurred before SB3, which is located at 153 m along the Juramento stratigraphic section (Figure 7 and Figure 8).
5.2. Spherulites from the Yacoraite Fm.
Distal K–Pg boundary layers, including impact spherulites and other components (e.g., shocked quartz grains), represent the late-stage fallout from a mixed-target meteorite vapor plume. Spherulites, together with the iridium anomaly, are considered as the best proxies for correctly locating the K–Pg transition [1]. Distal spherulites were transported for thousands of kilometres in the atmosphere, and thus have been described in multiple distal K–Pg sites worldwide, e.g., [15,99,100,101]. In contrast with glassy spherulites from proximal K–Pg sites (i.e., microtektites), distal impact spherulites (i.e., microkrysites) consist of spherical to sub-spherical particles with diameters of only a few 100 µm [102]. They contain microlites (i.e., minerals precipitated during cooling) and various diagenetic replacement products of a pristine unknown composition [15]. The correct recognition of distal impact spherulites in sedimentary rocks is critical, since these particles have a variable composition [102], and, due to diagenetic alterations, they can be mistaken for other spherical particles such as dissolved ooids, algal resting cysts or calcispheres (pithonellids), microbial spherules (Figure 9), or volcanic glass spherules [103].
In the framework of the Juramento stratigraphic section of the Yacoraite Fm., partially hollow spherical and sub-spherical particles with sizes of 250–1000 µm were detected in two layers, specifically, at 145 m (UJ49 sample; Figure 4) and 170 m (UJ58 sample; Figure 5).
At 145 m, spherulitic particles are hosted in a microbial boundstone buildup formed in a mixed mudflat depositional environment [30]. Microbial spherules were observed in various stromatolite buildups in the Yacoraite Fm. [75,76,104] and consist of spherical-to-elliptical particles, up to 1–2 mm size, which are composed of a fine-grained nucleus surrounded by a cortex of radiating crystals (Figure 9A) of either aragonite or calcite [103]. Spherulitic particles from sample UJ49 do not show any nucleus or crystals radiating from the core (Figure 9) but rather host geopetal and internal sediments (Figure 4C,D), and sometimes partially preserve a former external rim of calcite (Figure 4C). A microbial origin theory would imply that these particles were affected by a very early dissolution that created space for internal sedimentation. In this sample, dissolution did not affect microbialite laminae, nor were the ooids hosted in the internal sediment. This suggests that these may have been hollow grains embodied during the trapping processes of microbialite formation. The literature provides various examples of impact spherulites having a complete carbonate composition due to post-depositional dissolution and cementation [105,106,107,108,109]. Additionally, the UJ49 sample is located 2 metres below the last microbialite of Sequence 2, before the shut-down of carbonate production at SB3 (Figure 2 and [38]) and it is located only 6 m below the negative δ13C excursion. Its stratigraphic position, together with the specific diagenetic features, may suggest that these are impact-related spherulites trapped during stromatolite formation (Figure 8).
At 170 m along the Juramento section, spherulitic particles are instead hosted in a grainstone–floatstone deposited in a clastic shoreface depositional environment [30]. In contrast with previous spherulites, these do not have a carbonate composition, but rather consist of an external rim of goethite which is internally lined by an analcime cement (Figure 5 and Figure 10). Remnant porosity is filled by other phases, such as celestite and later blocky calcites (Figure 5 and Figure 10). Given the depositional environment, these hollow grains could potentially consist of dissolved ooids. However, none of the spherulitic particles from this sample preserve ooid features (e.g., radial features and internal lamination), and UJ58 is the only sample characterised by such diagenetic features among those investigated. These factors support the hypothesis that the spherulitic particles from the UJ58 sample are not dissolved ooids.
Distal impact spherules with goethite composition are one of the most-studied types of K–Pg distal spherulites, described in various sites including Italy, Spain, Denmark and New Zealand, e.g., [15,99,110,111,112,113,114,115,116]. They are characterised by a variable composition, with a microcrystalline groundmass of impure goethite containing variable amounts of silica, aluminium and iron [15]. The Raman spectrum of goethite phase from the UJ58 sample slightly differs from the one of pure goethite, disclosing a heterogeneous mineralogical composition. Similar variation in band peaks of goethite from distal impact spherulites were interpreted by previous authors as being due to the typical olivine-to-goethite diagenesis, e.g., [15,117] or pseudomorphic replacement of FeS2-rich spherules [118]. Concerning the other phases detected, authigenic analcime and celestite have already been described in the Yacoraite Fm. by [76] as early diagenetic cements reflecting higher flux of freshwater into the lake. However, analcime may also derive from the alteration of clay minerals, feldspars and feldspathoids [119] and has been described as a diagenetic product of pristine siliceous glass in impact spherulites [120].
Among the 120 samples examined along the 238 m Juramento section, only the two at 145 and 170 m hosted spherulitic particles whose concentration, size, morphology and mineralogy support an impact-related origin. The stratigraphic position of these layers falls between the 151–176 m interval proposed for the K–Pg transition based on biostratigraphic, geochronologic and geochemical analysis (Figure 11).
The literature provides various examples of K–Pg sites hosting multiple layers with impact spherulites, e.g., [121,122]. The first spherulite-rich deposits are found slightly below or in correspondence with the negative δ13C excursion, which agrees with the position of the first layer of this study, and the additional deposits are usually interpreted as being reworked, which is also in line with the size-graded bedding observed in the second layer.
Conclusively, this multiproxy approach suggests that the K–Pg transition could have occurred along the Juramento stratigraphic section in correspondence with or slightly below the first spherulite layer located at 145 m. A future study with higher sampling frequency could sustain this interpretation.

Figure 9.
Microphotographs of microbial spherules and impact spherulites. (A) Microbial spherules from the Yacoraite Fm. Calcite crystals radiate from a core (dashed circle). Modified from [76]. (B) Carbonate spherulite from sample UJ49 (this study). (C) Distal K–Pg spherulite from North Dakota entirely filled by a calcite cement. Modified from [123].


Figure 10.
Microphotographs and Raman spectroscopy of the grainstone-to-floatstone UJ58 sample hosting spherulites. (A) Detail of a spherulite internally lined by a non-isopachous rim of clear analcime cement and filled by yellowish celestite cement made by fibrous crystals (C). (B) Detail of a partially hollow spherulite showing a sub-millimetric rim of dark opaque goethite (E) lined internally by a non-isopachous rim of clear analcime cement (D). (C) The Raman spectrum of the fibrous cement is consistent with the one of celestite from [90]. (D) The Raman spectrum of the clear cement is consistent with the one of analcime from [89]. (E) The Raman spectrum of the opaque phases is consistent with the one of goethite from [88].


Figure 11.
Possible location of the K–Pg boundary (green area) in the Yacoraite Fm. along the Juramento stratigraphic section, based on lithostratigraphy, biostratigraphy, C-stable isotope and U-Pb zircon geochronology. Sequence strat. = sequence stratigraphy, after [30,38]. SB in red are Sequence Boundaries; MFS in blue are Maximum Flooding Surfaces. Litho. = lithology (this study) includes the position of the spherulite rich layers (green stars) and of the red siliciclastic bodies (red); Bio. = biostratigraphy, including the position of the last stromatolite of Sequence 2 and first stromatolite of Sequence 3 (str., in red, this study). The last dinosaur track of Sequence 2 [67] and the first Danian palynomorph in sequence 4 [66] were reported along the Juramento section based on the chronostratigraphic correlation of [30]. Carbonate δ13C from this study; depositional age model based on zircon (ash layer) geochronology after [39] is shown in pink. Ages estimated for SB are in red. The yellow areas represent the stratigraphic intervals that include the K–Pg transition based on each proxy.

6. Conclusions
The Yacoraite Formation (Maastrichtian–Danian, Salta rift basin) consist of lacustrine carbonate and siliciclastic deposits organised in four third-order stratigraphic sequences. It represents a distal terrestrial K–Pg site, which makes it an ideal target to comprehend the response of terrestrial ecosystems from South America to the K–Pg environmental crisis. The position of the K–Pg transition in the formation has long been debated and was investigated in this study along a depocentral stratigraphic section of the Metán sub-basin that was previously dated via zircon and carbonate U-Pb geochronology.
Pre-existing biostratigraphic data from other sub-basins and U-Pb zircon (ash layer) ages from this section indicate that the K–Pg transition falls in a stratigraphic interval included between sequences 2 and 3.
New C-O stable isotope data were obtained from single carbonate phases, including microbialites, ooids, oncoids and early lacustrine cements, whose preservation was assessed based on the consistency between zircon and carbonate U-Pb ages. Carbonates provided negative δ13C values in a narrow interval which starts slightly below SB3 and falls within the stratigraphic interval defined in biostratigraphic and geochronologic data. Here, changes in lake dynamic regime and catchment areas, abrupt transitions from carbonate-dominated to siliciclastic-dominated sedimentary facies and general decrease of carbonate production were also identified.
Partially hollow spherical and sub-spherical particles whose concentration, size, morphology, and mineralogy support an impact-related origin were detected in two layers. The first represents the last stromatolite buildup before SB3 and is located few metres below the onset of the negative carbon excursion. The second, showing evidence of transport and reworking, is located slightly below the end of the negative carbon excursion. These data suggest that the K–Pg transition is located below SB3, in proximity to the occurrence of the first spherulite layer detected.
The findings of this study encourage further investigation on the Yacoraite Fm. to attempt to detect the iridium anomaly in the stratigraphic interval here identified.
Author Contributions
D.M.: Conceptualization, formal analysis, investigation, visualization, writing—original draft; M.G.: conceptualization, funding acquisition, investigation, formal analysis, project administration, supervision, writing—review and editing; S.R.: funding acquisition, investigation, formal analysis, supervision, writing—review and editing. R.D.L.: funding acquisition. All authors have read and agreed to the published version of the manuscript.
Funding
This research was undertaken during the PhD project of D. Montano, funded by IFP Energies nouvelles, and in the framework of a post-doctoral research contract at the University of Milan. This publication was also supported by the Khalifa University of Science and Technology under Award No. CIRA-2021-048.
Acknowledgments
We thank Thin Section Lab (TSL) for high quality thin section manufacturing, M. Joachimski (GeoZentrum Nordbayern) for C-O stable isotope analysis of carbonates, and P. Fumagalli (University of Milan) for the micro-Raman analysis of spherulites.
Conflicts of Interest
The authors declare no conflict of interest. The funders had no role in the design of the study; in the collection, analyses, or interpretation of data; in the writing of the manuscript; or in the decision to publish the results.
References
- Alvarez, L.W.; Alvarez, W.; Asaro, F.; Michel, H.V. Extraterrestrial cause for the cretaceous-tertiary extinction. Science 1980, 208, 1095–1108. [Google Scholar] [CrossRef]
- Swisher, C.C.; Grajales-Nishimura, J.M.; Montanari, A.; Margolis, S.V.; Claeys, P.; Alvarez, W.; Renne, P.; Cedillo-Pardoa, E.; Maurrasse, F.J.-M.R.; Curtis, G.H.; et al. Coeval 40Ar/39Ar ages of 65.0 million years ago from Chicxulub crater melt rock and Cretaceous-Tertiary boundary tektites. Science 1992, 257, 954–958. [Google Scholar] [CrossRef]
- Renne, P.R.; Deino, A.L.; Hilgen, F.J.; Kuiper, K.F.; Mark, D.F.; Mitchell, W.S.; Morgan, L.E.; Mundil, R.; Smit, J. Time scales of critical events around the Cretaceous–Paleogene boundary. Science 2013, 339, 684–687. [Google Scholar] [CrossRef]
- Clyde, W.C.; Ramezani JJohnson, K.R.; Bowring, S.A.; Jones, M.M. Direct high-precision U–Pb geochronology of the end-Cretaceous extinction and calibration of Paleocene astronomical timescales. Earth Planet. Sci. Lett. 2016, 452, 272–280. [Google Scholar] [CrossRef]
- Sprain, C.J.; Renne, P.R.; Vanderkluysen, L.; Pande, K.; Self, S.; Mittal, T. The eruptive tempo of Deccan volcanism in relation to the Cretaceous-Paleogene boundary. Science 2019, 363, 866–870. [Google Scholar] [CrossRef]
- Sprain, C.J.; Renne, P.R.; Clemens, W.A.; Wilson, G.P. Calibration of chron C29r: New high-precision geochronologic and paleomagnetic constraints from the Hell Creek region, Montana. GSA Bull. 2018, 130, 1615–1644. [Google Scholar] [CrossRef]
- Hull, P.M.; Bornemann, A.; Penman, D.E.; Henehan, M.J.; Norris, R.D.; Wilson, P.A.; Blum, P.; Alegret, L.; Batenburg, S.J.; Bown, P.R.; et al. On impact and volcanism across the Cretaceous-Paleogene boundary. Science 2020, 367, 266–272. [Google Scholar] [CrossRef]
- Schoene, B.; Samperton, K.M.; Eddy, M.P.; Keller, G.; Adatte, T.; Bowring, S.A.; Khadri, S.F.R.; Gertsch, B. U-Pb geochronology of the Deccan Traps and relation to the end Cretaceous mass extinction. Science 2015, 347, 182–184. [Google Scholar] [CrossRef]
- Schoene, B.; Eddy, M.P.; Samperton, K.M.; Keller, C.B.; Keller, G.; Adatte, T.; Khadri, S.F.R. U-Pb constraints on pulsed eruption of the Deccan Traps across the end-Cretaceous mass extinction. Science 2019, 363, 862–866. [Google Scholar] [CrossRef]
- Schoene, B.; Eddy, M.P.; Keller, C.B.; Samperton, K.M. An evaluation of Deccan Traps eruption rates using geochronologic data. Geochronology 2021, 3, 181–198. [Google Scholar] [CrossRef]
- Gilabert, V.; Batenburg, S.J.; Arenillas, I.; Arz, J.A. Contribution of orbital forcing and Deccan volcanism to global climatic and biotic changes across the Cretaceous-Paleogene boundary at Zumaia, Spain. Geology 2022, 50, 21–25. [Google Scholar] [CrossRef]
- Bohor, B.F.; Triplehorn, D.M.; Nichols, D.J.; Millard, H.T., Jr. Dinosaurs, spherules, and the “magic” layer: A new K-T boundary clay site in Wyoming. Geology 1987, 15, 896–899. [Google Scholar] [CrossRef]
- Bohor, B.F.; Betterton, W.J. K-T spherules—Clarifying the concept. Lunar Planet. Sci. 1990, XXI, 107–108. [Google Scholar]
- King, D., Jr.; Petruny, L. Impact spherule-bearing, Cretaceous-Tertiary boundary sand body, Shell Creek stratigraphic section, Alabama, USA. Spec. Pap. Geol. Soc. Am. 2007, 437, 179–187. [Google Scholar] [CrossRef]
- Belza, J.; Goderis, S.; Montanari, F.; Vanhaecke, F.; Claeys, P. Petrography and geochemistry of distal spherules from the K–Pg boundary in the Umbria–Marche region (Italy) and their origin as fractional condensates and melts in the Chicxulub impact plume. Geochim. Cosmochim. Acta 2017, 202, 231–263. [Google Scholar] [CrossRef]
- Goderis, S.; Sato, H.; Ferrière, L.; Schmitz, B.; Burney, D.; Kaskes, P.; Vellekoop, J.; Wittmann, A.; Schulz, T.; Chernonozhkin, S.M.; et al. Globally distributed iridium layer preserved within the Chicxulub impact structure. Sci. Adv. 2021, 7, eabe3647. [Google Scholar] [CrossRef] [PubMed]
- Therrien, F.; Eberth, D.A.; Braman, D.R.; Zelenitsky, D.K. High-resolution organic carbon isotope record across the Cretaceous-Tertiary boundary in south-central Alberta: Implications for the post-impact recovery rate of terrestrial ecosystems and use of d13C as a boundary marker. Can. J. Earth Sci. 2007, 44, 529–542. [Google Scholar] [CrossRef]
- Grandpre, R.; Schauer, A.; Samek, K.; Veeger, A.; Ward, P.; Fastovsky, D. Testing the terrestrial δ13C Cretaceous–Paleogene (K–Pg) chemostratigraphic marker. Palaeogeogr. Palaeoclimatol. Palaeoecol. 2013, 381–382, 67–75. [Google Scholar] [CrossRef]
- Witts, J.D.; Newton, R.J.; Mills, B.J.W.; Wignall, P.B.; Bottrell, S.H.; Hall, J.L.O.; Francis, J.E.; Crame, J.A. The impact of the Cretaceous–Paleogene (K–Pg) mass extinction event on the global sulfur cycle: Evidence from Seymour Island, Antarctica. Geochim. Cosmochim. Acta 2018, 230, 17–45. [Google Scholar] [CrossRef]
- Claeys, P.; Kiessling, W.; Alvarez, W. Distribution of Chicxulub ejecta at the Cretaceous-Tertiary boundary. Geol. Soc. Am. 2002, 356, 55–68. [Google Scholar] [CrossRef]
- Nichols, D.J.; Johnson, K.R. Plants and the K–T Boundary; Cambridge University Press: Cambridge, UK, 2008. [Google Scholar] [CrossRef]
- Schulte, P.; Alegret, L.; Arenillas, I.; Arz, J.A.; Barton, P.J.; Bown, P.R.; Bralower, T.J.; Christeson, G.L.; Claeys, P.; Cockell, C.S.; et al. The Chicxulub Asteroid Impact and Mass Extinction at the Cretaceous-Paleogene Boundary. Science 2010, 327, 1214–1218. [Google Scholar] [CrossRef] [PubMed]
- Punekar, J.; Keller, G.; Khozyem, H.; Hamming, C.; Adatte, T.; Tantawy, A.A.; Spangenberg, J.E. Late Maastrichtian–early Danian high-stress environments and delayed recovery linked to Deccan volcanism. Cretac. Res. 2014, 49, 63–82. [Google Scholar] [CrossRef]
- Vajda, V.; Bercovici, A. The Global Vegetation Pattern across the Cretaceous-Paleogene Mass Extinction Interval: A Template for Other Extinction Events. Glob. Planet. Chang. 2014, 122, 29–49. [Google Scholar] [CrossRef]
- Sial, A.N.; Chen, J.; Lacerda, L.D.; Frei, R.; Higgins, J.A.; Tewari, V.C.; Gaucher, C.; Ferreira, V.P.; Cirilli, S.; Korte, C.; et al. Chemostratigraphy Across the Cretaceous-Paleogene (K-Pg) Boundary. In Chemostratigraphy across Major Chronological Boundaries: Testing the Impact and Volcanism Hypotheses; American Geophysical Union: Washington, DC, USA, 2019; Volume 240, pp. 223–257. [Google Scholar] [CrossRef]
- Albertão, G.A.; Grassi, A.D.A.; Marini, F.; Martins, P.P.M., Jr.; De Ros, L.F. The K-T boundary in Brazilian marginal sedimentary basins and related spherules. Geochem. J. 2004, 38, 121–128. [Google Scholar] [CrossRef]
- Rodrigues, G.B.; Fauth, G.; Santos, R.V.; Koutsoukos, E.A.M.; Colin, J.P. Tracking paleoecological and isotopic changes through the K-Pg boundary from marine ostracodes: The Poty quarry section, northeastern Brazil. Cretac. Res. 2014, 47, 105–116. [Google Scholar] [CrossRef]
- Bermúdez, H.D.; Arenillas, I.; Arz, J.A.; Vajda, V.; Renne, P.R.; Gilabert, V.; Rodríguez, J.V. The Cretaceous/Paleogene boundary deposits on Gorgonilla Island. In The Geology of Colombia, Volume 3 Paleogene—Neogene. Servicio Geológico Colombiano; Gómez, J., Mateus–Zabala, D., Eds.; Publicaciones Geológicas Especiales: Bogotá, Colombia, 2019; pp. 1–19. [Google Scholar] [CrossRef]
- Marquillas, R.A.; Salfity, J.A. Distribución Regional de los Miembros de la Formación Yacoraite (Cretácico Superior) en el Noroeste Argentino; Contribuciones de los Simposios sobre Cretácico de América Latina, Parte A, Eventos y Registro Sedimentario: Buenos Aires, Argentina, 1989; pp. 253–272. [Google Scholar]
- Deschamps, R.; Rohais, S.; Hamon, Y.; Gasparrini, M. Dynamic of a lacustrine sedimentary system during late rifting at the Cretaceous-Palaeocene transition: Example of the Yacoraite Formation, Salta Basin, Argentina. Depos. Rec. 2020, 6, 490–523. [Google Scholar] [CrossRef]
- Cónsole-Gonella, C.; De Valais, S.; Marquillas, R.A.; Sánchez, M.C. The Maastrichtian–Danian Maimará tracksite (Yacoraite Formation, Salta Group), Quebrada de Humahuaca, Argentina: Environments and ichnofacies implications. Palaeogeogr. Palaeoclimatol. Palaeoecol. 2017, 468, 327–350. [Google Scholar] [CrossRef]
- Llorens, M.; Pérez Loinaze, V.S.; Narváez, P.L.; Zelaya, A.M.; Pincheira, E.P.; Gorustovich, S. A mid-latitude Maastrichtian palynological record from the Yacoraite Formation (Salta Group), northwestern Argentina. Cretac. Res. 2022, 140, 105332. [Google Scholar] [CrossRef]
- Kring, D.A. The Chicxulub impact event and its environmental consequences at the Cretaceous–Tertiary boundary. Palaeogeogr. Palaeoclim. Palaeoecol. 2007, 255, 4–21. [Google Scholar] [CrossRef]
- Sial, A.; Ferreira, V.; Toselli, A.; Parada, M.; Aceñolaza, F.; Pimentel MAlonso, R. Carbon and Oxygen Isotope Compositions of Some Upper Cretaceous–Paleocene Sequences in Argentina and Chile. Int. Geol. Rev. 2001, 43, 892–909. [Google Scholar] [CrossRef]
- Marquillas, R.A.; del Papa, C.; Sabino, I.; Heredia, J. Prospección del límite K/T en la cuenca del Noroeste, Argentina. Rev. Asoc. Geol. Argent. 2003, 58, 271–274. [Google Scholar]
- Marquillas, R.A.; Sabino, I.; Sial, N.A.; Del Papa, C.; Ferreira, V.; Matthews, S. Carbon and oxygen isotopes of Maastrichtian-Danian shallow marine carbonates: Yacoraite Formation, northwestern Argentina. J. S. Am. Earth Sci. 2007, 23, 304–320. [Google Scholar] [CrossRef]
- Sial, A.; Lacerda, L.; Ferreira, V.; Frei, R.; Marquillas, R.; Barbosa, J.; Gaucher, C.; Windmöller, C.; Pereira, N. Mercury as a proxy for volcanic activity during extreme environmental turnover: The Cretaceous-Paleogene transition. Palaeogeogr. Palaeoclim. Palaeoecol. 2013, 387, 153–164. [Google Scholar] [CrossRef]
- Rohais, S.; Hamon, Y.; Deschamps, R.; Beaumont, V.; Gasparrini, M.; Pillot, D.; Romero-Sarmiento, M.-F. Patterns of organic carbon enrichment in a lacustrine system across the K-T boundary: Insight from a multi-proxy analysis of the Yacoraite Formation, Salta rift basin, Argentina. Int. J. Coal Geol. 2019, 210, 103208. [Google Scholar] [CrossRef]
- Montano, D. Carbonate U-Pb Dating via LA-ICPMS: Insights into Chronostratigraphy in Lacustrine Settings. Ph.D. Thesis, Earth Sciences, Sorbonne Université, Paris, France, 2021. [Google Scholar]
- Montano, D.; Gasparrini, M.; Rohais, S.; Albert, R.; Gerdes, A. Depositional age models in lacustrine systems from zircon and carbonate U-Pb geochronology. Sedimentology 2022, 69, 2507–2534. [Google Scholar] [CrossRef]
- De la Parra, F.; Jaramillo, C.; Kaskes, P.; Goderis, S.; Claeys, P.; Villasante-Marcos, V.; Bayona, G.; Hatsukawa, Y.; Caballero, D. Unraveling the record of a tropical continental Cretaceous-Paleogene boundary in northern Colombia, South America. J. S. Am. Earth Sci. 2022, 114, 103717. [Google Scholar] [CrossRef]
- Schulte, P.; Deutsch, A.; Salge, T.; Berndt, J.; Kontny, A.; MacLeod, K.G.; Neuser, R.D.; Krumm, S. A dual-layer Chicxulub ejecta sequence with shocked carbonates from the Cretaceous–Paleogene (K–Pg) boundary, Demerara Rise, western Atlantic. Geochim. Cosmochim. Acta 2009, 73, 1180–1204. [Google Scholar] [CrossRef]
- Scasso, R.A.; Concheyro, A.; Kiessling, W.; Aberhan, M.; Hecht, L.; Medina, F.A.; Tagle, R. A tsunami deposit at the Cretaceous/Paleogene boundary in the Neuquén Basin of Argentina. Cretac. Res. 2005, 26, 283–297. [Google Scholar] [CrossRef]
- Sial, A.; Chen, J.; Lacerda, L.; Frei, R.; Tewari, V.; Pandit, M.; Gaucher, C.; Ferreira, V.; Cirilli, S.; Peralta, S.; et al. Mercury enrichment and Hg isotopes in Cretaceous-Paleogene boundary successions: Links to volcanism and palaeoenvironmental impacts. Cretac. Res. 2016, 66, 60–81. [Google Scholar] [CrossRef]
- Clyde, W.C.; Krause, J.M.; De Benedetti, F.; Ramezani, J.; Cúneo, N.R.; Gandolfo, M.A.; Haber, P.; Whelan, C.; Smith, T. New South American record of the Cretaceous–Paleogene boundary interval (La Colonia Formation, Patagonia, Argentina). Cretac. Res. 2021, 126, 104889. [Google Scholar] [CrossRef]
- Scasso, R.; Aberhan, M.; Ruiz, L.; Weidemeyer, S.; Medina, F.; Kiessling, W. Integrated bio- and lithofacies analysis of coarse-grained, tide-dominated deltaic marginal marine environments across the Cretaceous/Paleogene boundary in Patagonia, Argentina. Cretac. Res. 2012, 36, 37–57. [Google Scholar] [CrossRef]
- Stiles, E.; Wilf, P.; Iglesias, A.; Gandolfo, M.A.; Cúneo, N.R. Cretaceous–Paleogene plant extinction and recovery in Patagonia. Paleobiology 2020, 46, 445–469. [Google Scholar] [CrossRef]
- Elliot, D.H.; Askin, R.A.; Kyte, F.T.; Zinsmeister, W.J. Iridium and dinocysts at the Cretaceous-Tertiary boundary on Seymour Island, Antarctica: Implications for the K-T event. Geology 1994, 22, 675–678. [Google Scholar] [CrossRef]
- Williams, D.F.; Thunell, R.C.; Hodel, D.A.; Vergnaud-Grazzini, C. Synthesis of late Cretaceous, Tertiary and Quaternary stable isotope records of the South Atlantic based on Leg 72 DSDP core material. In South Atlantic Paleoceanography; Hsfi, K.J., Weissert, H.J., Eds.; Cambridge University Press: Cambridge, UK, 1985; pp. 205–242. [Google Scholar]
- Uliana, M.A.; Biddle, K.T.; Cerdan, T. Mesozoic extension and the formation of Argentine sedimentary basins. In Extensional Tectonics and Stratigraphy of the North Atlantic Margins; Tankard, A.J., Balkwill, H.R., Eds.; GeoScienceWorld: McLean, VA, USA, 1989; AAPG Memoir; Volume 46, pp. 599–614. [Google Scholar] [CrossRef]
- Viramonte, J.G.; Kay, S.M.; Becchio, R.; Escayola, M.; Novitski, I. Cretaceous rift related magmatism in central-western South America. J. South Am. Earth Sci. 1999, 12, 109–121. [Google Scholar] [CrossRef]
- Marquillas, R.A.; Del Papa, C.E.; Sabino, I.F. Sedimentary aspects and paleoenvironmental evolution of a rift basin: Salta Group (Cretaceous-Paleogene), northwestern Argentina. Int. J. Earth Sci. 2005, 54, 94–113. [Google Scholar] [CrossRef]
- Mon, R.; Salfity, J.A. Tectonic Evolution of the Andes of Northern Argentina. In Petroleum Basins of South America; Tankard, A.J., Suárez, W.R., Eds.; AAPG: Tulsa, OK, USA, 1995; Volume 62, pp. 269–283. [Google Scholar]
- Gomez Omil, R.J.; Boll, A.; Hernandez, R.M. Cuenca cretacicoterciaria del Noroeste argentino (Grupo Salta). In Cuencas Sedimentarias Argentinas; Chebli, G.A., Spalletti, L.A., Eds.; Serie de Correlacion Geologica; Universidad Nacional de Tucuman: Tucumán, Argentina, 1989; Volume 6, pp. 43–64. [Google Scholar]
- Turner, J.C.M. Estratigrafia del cordon de Escaya y de la sierra Rinconada (Jujuy). Rev. Asoc. Geológica Argent. 1959, 13, 15–39. [Google Scholar]
- Salfity, J.A. Paleogeologıa de la cuenca del Grupo Salta (Cretacico-Eogenico) del norte de Argentina. Actas VII Congreso Geológico Argentino, Neuquén, Asociación Geológica Argentina. Volume 1, pp. 505–515. Available online: https://www.academia.edu/96370100/La_cuenca_c%C3%A1mbrica_del_Grupo_Mes%C3%B3n_en_el_Noroeste_Argentino_desarrollo_estratigr%C3%A1fico_y_paleogeogr%C3%A1fico (accessed on 19 July 2023).
- Marquillas, R.A. Estratigrafıa, Sedimentologıa y Paleoambientes de la Formacion Yacoraite (Cretacico Superior) en el Tramo Austral de la Cuenca, Norte Argentino. Ph.D. Thesis, Universidad Nacional de Salta, Salta, Argentina, 1985; pp. 1–139. [Google Scholar]
- Salfity, J.A.; Marquillas, R.A. Tectonic and sedimentary evolution of the Cretaceous-Eocene Salta Group Basin, Argentina. In Cretaceous Tectonics of the Andes; Earth Evolution Sciences; Salfity, J.A., Ed.; Friedrich Vieweg & Sohn: Hamburg, Germany, 1994; pp. 266–315. [Google Scholar] [CrossRef]
- Hernandez, R.; Disalvo, A.; Boll, A.; Gomez Omil, R. Sequence Stratigraphy of Salta Group, focusing at sub-basins Metan-Alemania, Northwest Argentine. In Congreso Geologico Argentino; National University of Salta: Salta, Argentina, 1999; pp. 264–284. [Google Scholar]
- Romero-Sarmiento, M.-F.; Rohais, S.; Littke, R. Lacustrine type I kerogen characterization at different thermal maturity levels: Application to the late cretaceous Yacoraite Formation in the Salta Basin—Argentina. Int. J. Coal Geol. 2019, 203, 15–27. [Google Scholar] [CrossRef]
- Granier, B.; Lapointe, P. The Kalkowsky Project—Chapter II. Wobbly ooids in a stromatolite from the Yacoraite Formation (Argentina). Carnets Géologie Noteb. Geol. 2022, 22, 149–160. [Google Scholar] [CrossRef]
- Granier, B.; Lapointe, P. The Kalkowsky Project—Chapter III. Significance of primary radial fabrics associated with ancient partly leached or recrystallized calcareous ooids. Carnets Géologie Noteb. Geol. 2022, 22, 149–160. [Google Scholar] [CrossRef]
- Mutti, M.; Vallati, M.; Tomás, S.; Galli, C.; Bahniuk Rumbelsperger, A.M.; Maerz, A.; Coira, B. Constraining depositional evolution and reservoir compartmentalization in a mixed carbonate-siliciclastic lacustrine system: The Yacoraite formation, Salta Group, NW Argentina. Mar. Pet. Geol. 2023, 149, 106049. [Google Scholar] [CrossRef]
- Raskovsky, M.A. Relevamiento Geológico del Sector sur Delyacimiento Los Berthos [Seminario II]; Universidad Nacional de Tucumán, Facultad de Ciencias Naturales: Salta, Argentina, 1968; Volume 41. [Google Scholar]
- Reyes, F.C. Correlaciones en el Cretácico de la cuenca andinade Bolivia, Perú y Chile: La Paz. Rev. Técnica De Yaci-Mientos Pet. Fisc. Boliv. 1972, 1, 101–144. [Google Scholar]
- Moroni, A.M. Correlación palinológica en la Formaciones Olmedo y Yacoraite. Cuenca del Noroeste Argentino. 3th Congreso Geológico Chileno (Concepción). Actas 1982, 340–349. [Google Scholar]
- Alonso, R.N.; Marquillas, R.A. Nueva localidad con huellas de dinosaurios y primer hallazgo de huellas de aves en la Formacion Yacoraite (Maastrichtiano) del Norte Argentino. Actas 1986, 2, 33–41. [Google Scholar]
- Quattrocchio, M.; Volkheimer, W.; Marquillas, R.; Salfity, J. Palynostratigraphy, palaeobiogeography and evolutionary significance of the Late Senonian and Early Palaeogene palynofloras of the Salta Group, northern Argentina. Rev. Española Micropaleontol. 2005, 37, 259–272. [Google Scholar]
- Quattrocchio, M. Palynology and palaeocommunities of the Paleogene of Argentina. Rev. Bras. De Paleontol. 2006, 9, 101–108. [Google Scholar] [CrossRef]
- Cónsole-Gonella, C.; De Valais, S.; Sánchez, M.C.; Marquillas, R. Nuevo registro de huellas de vertebrados en la Formación Yacoraite (Mastrichtiano-Daniano), Maimará, Cordillera Oriental argentina. Ameghiana 2012, 49, R141. [Google Scholar]
- Cónsole-Gonella, C.; De Valais, S.; Zelayac, A.; Gorustovichc, S. Vertebrate trace fossils and environments of the Yacoraite Formation (Maastrichtian-Danian). New records from the Valle del Tonco tracksite, northwestern Argentina. Terc. Simp. Lationoamericano Icnología 2015. [Google Scholar]
- Díaz-Martínez, I.; De Valais, S.; Cónsole-Gonella, C. First evidence of Hadrosauropodus in Gondwana (Yacoraite Formation, Maastrichtian–Danian), northewestern Argentina. J. Afr. Earth Sci. 2016, 122, 79–87. [Google Scholar] [CrossRef]
- Díaz-Martínez, I.; De Valais, S.; Cónsole-Gonella, C. New sauropod tracks from the Yacoraite Formation (Maastrichtian–Danian), Valle del Tonco tracksite, Salta, northwestern Argentina. J. Iber. Geol. 2018, 44, 113–127. [Google Scholar] [CrossRef]
- De Valais, S.; Cónsole Gonella, C.A. An Updated Review of the Avian Footprint Record from the Yacoraite Formation (Maastrichtian-Danian), Northwestern Argentina. Ichnos 2019, 26, 224–241. [Google Scholar] [CrossRef]
- Ceolin, D.; Dos Santos Filho, M.A.B.; Salamoni Terra, G.J.; Carnier Fragoso, D.G.; Bunevich, R.B.; Fauth, G.; Hernández, J.I.; Hernández, R.M. Ostracods from upper Yacoraite Formation (Danian), Salta Basin, Western Argentina: Taxonomy and paleoenvironmental indicators of climatic signals in lacustrine deposits. J. S. Am. Earth Sci. 2022, 116, 103836. [Google Scholar] [CrossRef]
- Gomes JP, B.; Bunevich, R.B.; Tonietto, S.N.; Alves, D.B.; Santos, J.F.; Whitaker, F.F. Climatic signals in lacustrine deposits of the Upper Yacoraite Formation, Western Argentina: Evidence from clay minerals, analcime, dolomite and fibrous calcite. Sedimentology 2020, 67, 2282–2309. [Google Scholar] [CrossRef]
- Magalhães, A.; Gabaglia, G.R.; Fragoso, D.; Freire, E.B.; Lykawka, R.; Arregui, C.; Silveira, M.; Carpio, K.; De Gasperi, A.; Pedrinha, S.; et al. High-resolution sequence stratigraphy applied to reservoir zonation and characterisation, and its impact on production performance—Shallow marine, fluvial downstream, and lacustrine carbonate settings. Earth Sci. Rev. 2020, 210, 26. [Google Scholar] [CrossRef]
- Vallati, M.; Tomás, S.; Winterleitner, G.; Galli, C.; Mutti, M. Exploring Hypotheses about Mixed Carbonate-Siliciclastic Successions in Lacustrine Settings: A Case Study from the Yacoraite Formation, Tres Cruces Sub-Basin, Argentina; SEG/AAPG International Meeting for Applied Geoscience & Energy: Houston, TX, USA, 2022. [Google Scholar] [CrossRef]
- Teles, V.; Hamon, Y.; Deschamps, R.; Rohais, S.; Nader, F.H.; Heckenmeyer, E.; Gasparrini, M.; Barbier, M.; Lerat, O.; Joseph, P.; et al. Modelling the coupled heterogeneities of the lacustrine microbialite-bearing carbonate reservoir of the Yacoraite Formation (Salta, Argentina). Comptes Rendus. Géosci. 2023, 355 (Suppl. S1), 1–20. [Google Scholar] [CrossRef]
- Ellis, D.V.; Singer, J.M. Well Logging for Earth Scientists; Springer: New York, NY, USA, 2008. [Google Scholar]
- Dickson, J.A.D. Carbonate identification and genesis as revealed by staining. J. Sediment. Res. 1966, 36, 491–505. [Google Scholar] [CrossRef]
- Dunham, R.J. Classification of Carbonate Rocks according to depositional texture. In Classification of Carbonate Rocks; Ham, W.E., Ed.; American Association of Petroleum Geologists: Tulsa, OK, USA, 1962; Volume 1, pp. 108–121. [Google Scholar]
- Riding, R. Microbial carbonates: The geological record of calcified bacterial–algal mats and biofilms. Sedimentology 2000, 47, 179–214. [Google Scholar] [CrossRef]
- Riding, R.E. Abiogenic, microbial and hybrid authigenic carbonate crusts: Components of Precambrian stromatolites. Geol. Croat. 2008, 6, 73–103. [Google Scholar] [CrossRef]
- Flügel, E. Microfacies of Carbonate Rocks. Analysis, Interpretation and Application; Springer: Berlin/Heidelberg, Germany, 2004; Volume 976. [Google Scholar]
- Laetsch, T.; Downs, R. Software For Identification and Refinement of Cell Parameters From Powder Diffraction Data of Minerals Using the RRUFF Project and American Mineralogist Crystal Structure Databases. In Proceedings of the 19th General Meeting of the International Mineralogical Association, Kobe, Japan, 23–28 July 2006. [Google Scholar]
- Rosenbaum, J.; Sheppard, S.M.F. An isotopic study of siderites, dolomites and ankerites at high temperatures. Geochim. Cosmochim. Acta 1986, 50, 1147–1150. [Google Scholar] [CrossRef]
- DeFaria, D.L.A.; Lopez, F.N. Heated Goethite and Natural Hematite: Can Raman Spectroscopy be Used to Differentiate Them? Vib. Spectrosc. 2007, 45, 117–121. [Google Scholar] [CrossRef]
- Presser, V.; Kloužková, A.; Mrázová, M.; Kohoutková, M.; Berthold, C. Micro-raman spectroscopy on analcime and pollucite in comparison to X-ray diffraction. J. Raman Spectrosc. 2008, 39, 587–592. [Google Scholar] [CrossRef]
- Buzgar, N.; Buzatu, A.; Sanislav, I.V. The Raman study on certain sulfates. Ann. Stiintifice Ale Univ. 2009, 55, 5–23. [Google Scholar]
- Palma, R.M. Característica Sedimentológicas y Estratigraficas de las Formaciones en el Limite CRETÁCICO Superior-Terciario Inferior, en la Cuenca Salteña; Universidad Nacional de Tucuman, Facultad de Ciencias Naturales: Tucumán, Argentina, 1984; Volume 239. [Google Scholar]
- Moroni, A.M. Mtchedlishvilia saltenia n. sp. en sedimentitasdel Grupo Salta, provincia de Salta. In Actas, Congreso Argentino de Paleontología y Bioestratigrafía, 3rd ed.; Buenos Aires, Asociación Paleontológica Argentina: Corrientes, Argentina, 1984; pp. 129–139. [Google Scholar]
- Marquillas, R.A.; Salfity, J.A.; Matthews, S.J.; Matteini, M.; Dantas, E. U-Pb zircon age of the Yacoraite Formation and its significance to the Cretaceous-Tertiary boundary in the Salta Basin, Argentina. In Cenezoic Geology of the Central Andes of Argentina; Salfity, J.A., Marquillas, R.A., Eds.; SCS Publisher: Prague, Czech Republic, 2011; pp. 227–246. [Google Scholar]
- Rossignol, C.; Hallot, E.; Bourquin, S.; Poujol, M.; Jolivet, M.; Pellenard, P.; Ducassou, C.; Nalpas, T.; Heilbronn, G.; Yu, J.; et al. Using volcaniclastic rocks to constrain sedimentation ages: To what extent are volcanism and sedimentation synchronous? Sed. Geo. 2019, 381, 46–64. [Google Scholar] [CrossRef]
- Pimentel, M.; Carmo, I.O.; Terra, G.J.S. U-Pb Age of Tuffs from the Balbuena Group, Salta Basin, NW Argentina. In VIII Simposio Sudamericano de Geologia Isotopica, Medellın. Resumos; Universidad Nacional de Colombia: Medellın, Colombia, 2012. [Google Scholar]
- Montano, D.; Gasparrini, M.; Gerdes, A.; Albert, R.; Della Porta, G. In-situ U-Pb dating of Ries Crater lacustrine carbonates (Miocene, South-West Germany): Implications for continental carbonate chronostratigraphy. Earth Planet. Sci. Lett. 2021, 568, 117011. [Google Scholar] [CrossRef]
- Roberts, N.M.W.; Drost, K.; Horstwood, M.S.A.; Condon, D.J.; Chew, D.; Drake, H.; Milodowski, A.E.; McLean, N.M.; Smye, A.J.; Walker, R.J.; et al. Laser ablation inductively coupled plasma mass spectrometry (LA-ICP-MS) U-Pb carbonate geochronology: Strategies, progress, and limitations. Geochronology 2020, 2, 33–61. [Google Scholar] [CrossRef]
- Volkheimer, W.; Novara, M.; Narváez, P.; Marquillas, R. Palynology and paleoenvironmental significance of the Tunal Formation (Danian) at its type locality, El Chorro creek (Salta, Argentina). Ameghiniana 2006, 43, 567–584. [Google Scholar]
- Montanari, A.; RLHay Alvarez, W.; Asaro, F.; Michel, H.V.; Alvarez LWSmit, J. Spheroids at the Cretaceous-Tertiary boundary are altered impact droplets of basaltic composition. Geology 1983, 11, 668–671. [Google Scholar] [CrossRef]
- Smit, J.; Alvarez, W.; Montanari, A.; Swinburne, N.; Kempen Van, T.M.; Klaver, G.T.; Lustenhouwer, W.J. “Tektites” and microtektites at the Cretaceous Tertiary boundary: Two strewn fields, one crater? Proc. Lunar Planet. Sci. 1992, 22, 87–100. [Google Scholar]
- Robin, E.; Froget, L.; Jehanno, C.; Rocchia, R. Geochemistry of DSDP Hole 86-577B samples. Pangea 1993, 83, 137–158. [Google Scholar] [CrossRef]
- Glass, B.P.; Simonson, B.M. Distal Impact Ejecta Layers: Spherules and more. Elements 2012, 8, 43–48. [Google Scholar] [CrossRef]
- Chafetz, H.; Barth, J.; Cook, M.; Guo, X.; Zhou, J. Origins of carbonate spherulites: Implications for Brazilian Aptian pre-salt reservoir. Sediment. Geol. 2018, 365, 21–33. [Google Scholar] [CrossRef]
- Bunevich, R.B.; Borghi, L.; Gabaglia, G.P.R.; Terra, G.J.S.; Bento Freire, E.; Lykawka, R.; Fragoso, D.G.C. Microbialitos de Sequência Balbuena IV (Daniano), Bacia de Salta, Argentina: Caracterização de intrabioarquiteturas e de microciclos. Pesqui. Em Geociências 2017, 44, 177–202. [Google Scholar] [CrossRef]
- Wallace, M.W.; Gostin, V.A.; Keays, R.R. Spherules and shard-like clasts from the late Proterozoic Acraman impact ejecta horizon, South Australia. Meteoritics 1990, 25, 161–165. [Google Scholar] [CrossRef]
- Bohor, B.F.; Glass, B.P. Origin and diagenesis of K/T impact spherules—From Haiti to Wyoming and beyond. Meteoritics 1990, 30, 182–198. [Google Scholar] [CrossRef]
- Sweeney, D.; Simonson, B.M. Textural constraints on the formation of impact spherules: A case study from the Dales Gorge BIF, Paleoproterozoic Hamersley Group of Western Australia. Meteorit. Planet. Sci. 2008, 43, 2073–2087. [Google Scholar] [CrossRef]
- Huber, M.S.; Crne, A.E.; Lepland, A.; Melezhik, V.A.; Koeberl, C. Far Deep Science Team. Possible occurrence of distal impact ejecta from the Vredefort impact event in drill cores from the Onega Basin, Russia. In Proceedings of the 42nd Annual Lunar and Planetary Science Conference, The Woodlands, TX, USA, 7–11 March 2011; pp. 1487–1488. [Google Scholar]
- Schulte, P.; Stinnesbeck, W.; Stüben, D.; Kramar, U.; Berner, Z.A.; Keller, G.; Adatte, T. Fe-rich and K-rich mafic spherules from slumped and channelized Chicxulub ejecta deposits in the northern La Sierrita area, NE Mexico. Int. J. Earth Sci. 2003, 92, 114–142. [Google Scholar] [CrossRef]
- Smit, J.; Kyte, F.T. Siderophile-rich magnetic spheroids from the Cretaceous-Tertiary boundary in Umbria, Italy. Nature 1984, 310, 403–405. [Google Scholar] [CrossRef]
- Hansen, H.J.; Gwozdz, R.; Bromley, R.G.; Rasmussen, K.L.; Vogensen, E.W.; Pedersen, K.R. Cretaceous-Tertiary boundary spherules from Denmark, New Zealand and Spain. Bull. Geol. Soc. 1986, 35, 75–82. [Google Scholar] [CrossRef]
- Kyte, F.T.; Smit, J. Regional variations in spinel compositions: An important key to the Cretaceous/Tertiary event. Geology 1986, 14, 485–487. [Google Scholar] [CrossRef]
- Martínez Ruiz, F.; Ortega Huertas, M.; Palomo, I.; Acquafredda, P. Quench textures in altered spherules from the Cretaceous-Tertiary boundary layer at Agost and Caravaca, SE Spain. Sediment. Geol. 1997, 113, 137–147. [Google Scholar] [CrossRef]
- Montanari, A. Authigenesis of impact spheroids in the K/T boundary clay from Italy: New constraints for high-resolution stratigraphy of terminal cretaceous events. J. Sediment. Petrol. 1991, 61, 315–339. [Google Scholar] [CrossRef]
- Smit, J. The Global Stratigraphy of the Cretaceous Tertiary boundary Impact Ejecta. Annu. Rev. Earth. Planet. Sci. 1999, 27, 75–113. [Google Scholar] [CrossRef]
- Rodriguez-Tovar, F.J. Fe-oxide spherules infilling Thalassinoides burrows at the Cretaceous-Paleogene (K-P) boundary: Evidence of a near-contemporaneous macrobenthic colonization during the K-P event. Geology 2005, 33, 585–588. [Google Scholar] [CrossRef]
- Kuebler, K.; Wang, A.; Haskin, L.; Jolliff, B. A Study of Olivine Alteration to Iddingsite Using Raman Spectroscopy. In Proceedings of the Lunar and Planetary Science Conference, Houston, TX, USA, 17–21 March 2003. [Google Scholar]
- Schmitz, B. Metal Precipitation in the Cretaceous–Tertiary Boundary Clay at Stevns Klint, Denmark. Geochim. Cosmochim. Acta 1985, 49, 2361–2370. [Google Scholar] [CrossRef]
- Hay, R.L.; Sheppard, R.A. Occurrence of zeolites in sedimentary rocks: An overview. Rev. Mineral. Geochem. 2011, 45, 217–234. [Google Scholar] [CrossRef]
- Pitakpaivan, K.; Byerly, G.R.; Hazel, J.E. Pseudomorphs of impact spherules from a Cretaceous-Tertiary boundary section at Shell Creek, Alabama. Earth Planet. Sci. Lett. 1994, 124, 49–56. [Google Scholar] [CrossRef]
- Stinnesbeck, W.; Keller, G.; Adatte, T.; Stuben, D.; Kramar, U.; Berner, Z.; Desremeaux, C.; Moliere, E. Beloc, Haiti, revisited: Multiple events across the KT boundary in the Caribbean. Terra Nova 2002, 11, 303–310. [Google Scholar] [CrossRef]
- Keller, G.; Stinnesbeck, W.; Adatte, T.; Holland, B.; StÜben, D.; Harting, M.; Leon, C.; Cruz, J. Spherule deposits in Cretaceous–Tertiary boundary sediments in Belize and Guatemala. J. Geol. Soc. 2003, 160, 783–795. [Google Scholar] [CrossRef]
- De Palma, R.A.; Smit, J.; Burnham, D.A.; Kuiper, K.; Manning, P.L.; Oleinik, A.; Larson, P.; Maurasse, F.J.; Vellekoop, J.; Richards, M.A.; et al. A seismically induced onshore deposit at the K-Pg boundary, North Dakota. Proc. Natl. Acad. Sci. USA 2019, 116, 8190–8199. [Google Scholar] [CrossRef]


Disclaimer/Publisher’s Note: The statements, opinions and data contained in all publications are solely those of the individual author(s) and contributor(s) and not of MDPI and/or the editor(s). MDPI and/or the editor(s) disclaim responsibility for any injury to people or property resulting from any ideas, methods, instructions or products referred to in the content. |
© 2023 by the authors. Licensee MDPI, Basel, Switzerland. This article is an open access article distributed under the terms and conditions of the Creative Commons Attribution (CC BY) license (https://creativecommons.org/licenses/by/4.0/).