Article

Monitoring CO2 Hazards of Volcanic Origin: A Case Study at the Island of Vulcano (Italy) during 2021–2022

by
Sergio Gurrieri
*,
Roberto Maria Rosario Di Martino
*,
Marco Camarda
and
Vincenzo Francofonte
Istituto Nazionale di Geofisica e Vulcanologia, Sezione di Palermo, Via Ugo La Malfa 153, 90146 Palermo, Italy
*
Authors to whom correspondence should be addressed.
Geosciences 2023, 13(9), 266; https://doi.org/10.3390/geosciences13090266
Submission received: 8 June 2023 / Revised: 22 August 2023 / Accepted: 1 September 2023 / Published: 3 September 2023
(This article belongs to the Section Geochemistry)

Abstract

:
The La Fossa volcano is near the inhabited zone of the island of Vulcano and is a suitable case for studying gas sources of different geological origins. Since the last eruption, fumarolic-solfataric activity has interested this area with fumarolic emissions, mainly at the top of the volcanic cone and at Vulcano Porto. In recent decades, the anomalous degassing zones on the island have not significantly changed their location. On the contrary, there have been several significant changes in the emission rate due to the addition of volcanic gas. In these zones, CO2 flux from the ground is responsible for a decrease in the indoor air quality. A recent increase in volcanic degassing led to an increase in the gas hazard in the inhabited area of Vulcano Island, and people were temporarily displaced from Vulcano Porto. The results of this study show that a monitoring system can be used for the early detection of transients in soil CO2 flux (φCO2) in the anomalous degassing zone of Vulcano. Synchronous monitoring of φCO2 and outdoor air CO2 concentration has shown variations in volcanic degassing that affect outdoor air CO2 concentration in the populated zone of Faraglione.

1. Introduction

Volcanoes affect the environment by ejecting lava and releasing gas into the atmosphere. CO2 is the most important magmatic gas after H2O vapor [1], and emissions of these components can increase during eruptive and pre-eruptive phases. In recent years, quantification of volcanic CO2 in the atmosphere has provided crucial insights into the influence of volcanoes on global CO2 emissions [2,3]. Gas emissions from active volcanoes have attracted attention because of their importance in modeling and predicting the evolution of global warming [3,4,5] and their application in tracking the evolution of volcanic activity. However, there have been fewer attempts to estimate the degassing of dormant volcanoes and its impact on atmospheric CO2 levels [6,7,8,9,10,11]. In particular, the diffuse degassing of CO2 has been used to track either the evolution of eruptive activity at open conduit volcanoes [12,13,14,15,16] or the resumption of volcanic degassing at dormant volcanoes [17,18,19,20,21,22,23,24,25,26] because diffuse degassing increases during periods of volcanic unrest, similar to an increase in degassing from volcanic crater plumes [27].
A better estimate of the amount of CO2 released by diffuse degassing is important not only for volcano monitoring, but also for quantifying gas hazards, since CO2 can reach high concentrations in weakly or poorly ventilated areas [28,29,30,31,32,33,34]. The accumulation of CO2 presents potential hazards for humans, animals, and ecosystems at the local scale, while also having the capacity to influence global climate patterns. Gas hazards arise from the toxic and/or asphyxiating nature of gas species, considering their concentration and dispersion in the atmosphere [35]. This subject is of particular significance due to incidents documented in volcanic regions [36,37,38,39,40,41]. Volcanic sulfur gases (i.e., SO2 and H2S), upon inhalation, can lead to sudden discomfort such as throat irritation and itching in humans, even in small quantities. These gases are readily detectable in the atmosphere owing to their pungent odors. However, the principal contributor to the gas hazard is CO2, which lacks any distinctive odor. Elevated levels of CO2 in the air (e.g., >5000 ppm vol, in line with [42]) can induce headaches; more severe outcomes, including asphyxiation in extreme instances, are contingent upon the absolute concentration and duration of exposure [43,44]. The gas hazard occurs when CO2 is released from soil emissions in the outdoor air or in enclosed spaces such as bedrooms, bathrooms, and house basements. In general, this problem can be addressed in two different ways. The first and most obvious way consists of preventing people from entering areas subject to this hazard, regardless of the possible evolution of CO2 levels in the air. A more sophisticated way to address this problem is through various measures aimed at raising awareness of the gas hazard and sharing information and responsibilities among people living in the hazardous zones, civil defense authorities, and scientists. These actions include informing the public about the extent of the gas hazard and the spatial and temporal changes in gas emissions, as well as timely civil defense actions tailored to each situation. Understanding local diffuse degassing trends can help researchers form a better understanding of how volcanic emissions affect both outdoor and indoor air CO2 concentrations. Studying diffuse degassing can also provide new insights for developing effective warning systems. The complex problem of controlling the gas hazard with appropriate measures may be exacerbated by the lack of an effective monitoring network. Since late September 2021, volcanic outgassing on the island of Vulcano has increased rapidly [45,46,47,48,49,50], prompting civil defense authorities to warn the public and intensify monitoring efforts.
The objective of this study is to investigate recent changes in volcanic CO2 emissions and gas hazards on Vulcano. An appropriate monitoring network for soil CO2 flux (φCO2) and outdoor air CO2 concentrations was established in the high-risk zone of the island (i.e., Faraglione) because of the large number of people living in this area, especially during the summer months. In spite of the concept of risk [51], this paper focuses on the notion of gas hazard. Gas hazard pertains to the likelihood that gas emissions, specifically CO2, within a studied area attain elevated concentrations that pose a threat to human safety. An analysis of data shows that the mitigation of gas hazards includes several measures in the populated zones of Vulcano Porto, including the continuous monitoring of diffuse degassing [35]. The measurement of φCO2 and outdoor air CO2 concentrations are both useful measures that can suggest the most useful gas hazard mitigation actions. However, comprehensive risk management should lead people living in these areas to (i) become more aware of the hazards to which they are exposed, and (ii) self-assess the extent of the hazard and the mitigation measures to be taken.

2. Study Area

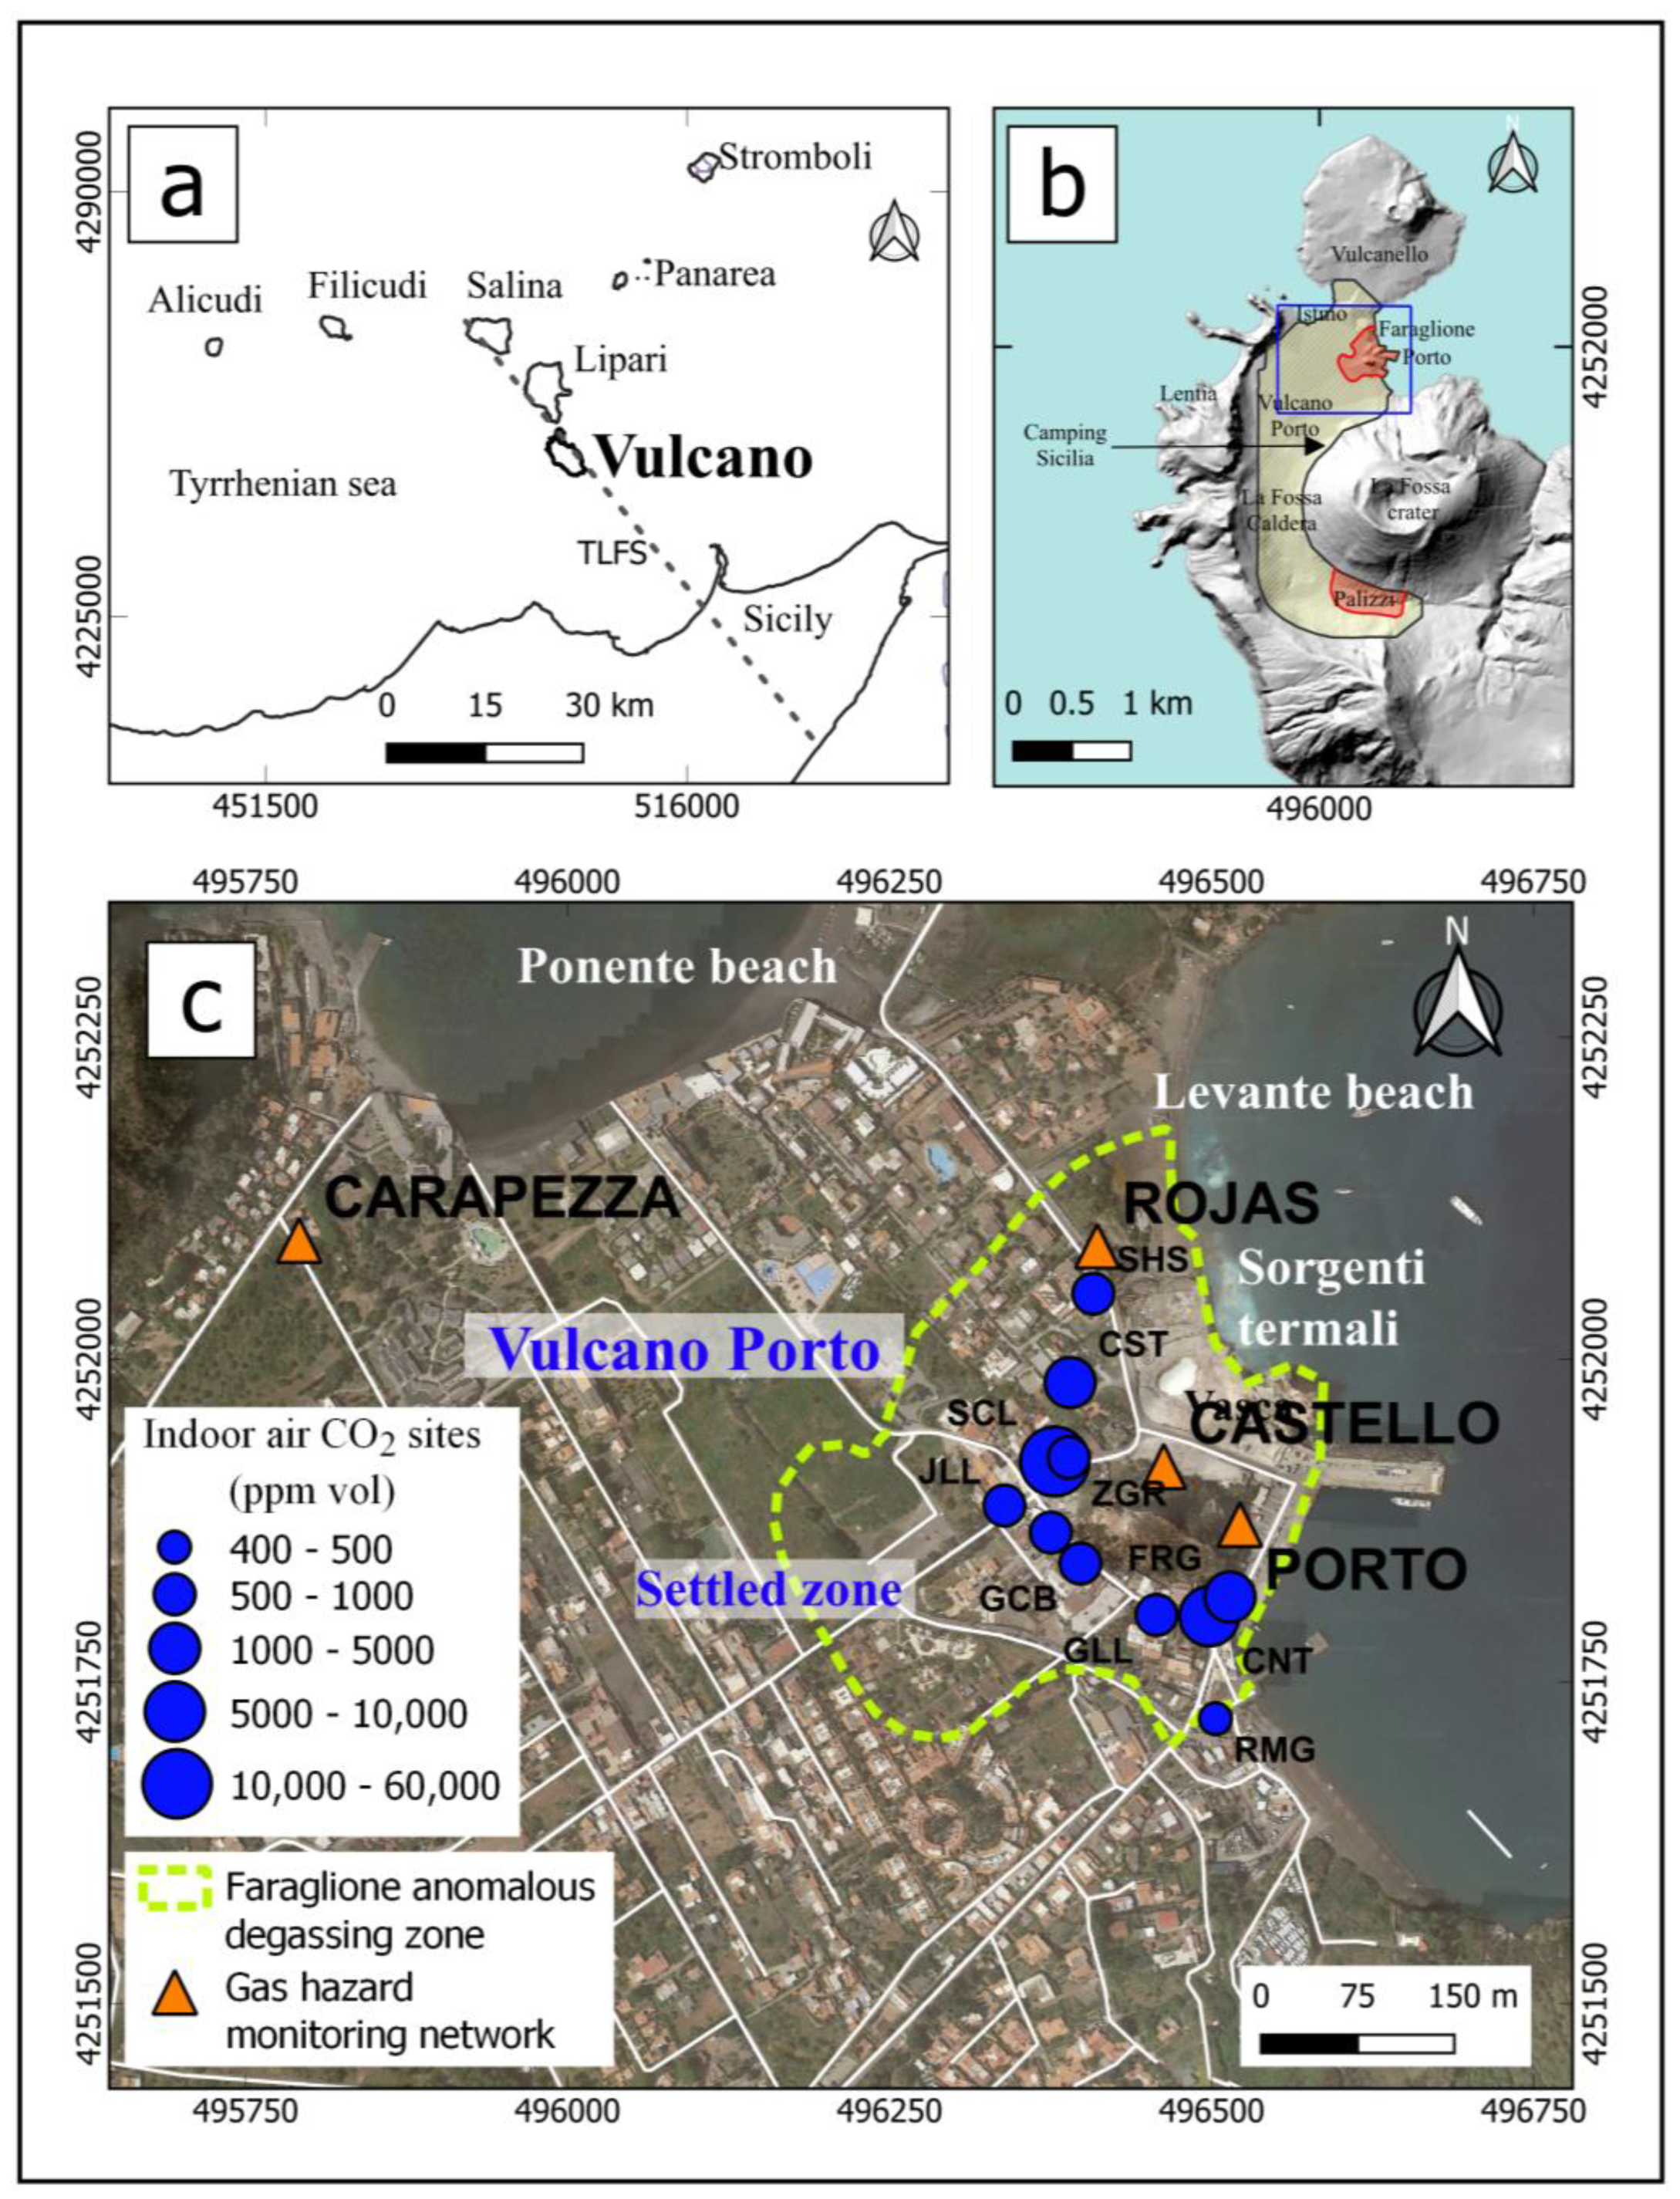
The Aeolian Archipelago comprises seven volcanic islands in the southeastern part of the Tyrrhenian Sea (Figure 1). The extinct volcanic systems are located on the islands of Alicudi, Filicudi, and Salina, which are lined up E-W along the northern coast of Sicily.
Currently, active volcanism is concentrated in the eastern sector of the Aeolian arc at NE-SW, where Stromboli shows persistent explosions of medium intensity and the island of Panarea shows active submarine degassing. The islands of Vulcano, Lipari, and Salina form a volcanic belt aligned along NNW-SSE, consistent with the direction of the Tindari-Letojanni strike-slip fault (TLFS) [52,53,54,55,56,57,58,59,60,61,62].
On the island of Vulcano, the solfataric activity started after the 1888–1890 eruption of La Fossa volcano. Volcanic degassing occurs through fumaroles at the crater rim of La Fossa [63], at Faraglione, and at Levante beach (Figure 1c). Surface manifestations of the upward migration of volcanic fluids (i.e., thermal groundwater, Vasca pool, sulfur deposits, gas emissions from the seafloor, steaming grounds, and CO2 emissions from the ground) occur near the inhabited zone of Vulcano Porto [45,64,65,66,67,68]. According to recent studies [18,19,33,45,63,64,67,68,69,70,71], the diffuse degassing of CO2 at Vulcano Porto shows two anomalous degassing zones at Palizzi and Faraglione areas (Figure 1b). These studies identified the anomalous soil CO2 degassing zones through statistical-graphical analysis [72] that has provided a threshold value of φCO2 = 117 g m−2 d−1 [24,26,45,66] for measurements performed on the above-described sampling grid. The volcanic origin of the soil CO2 was demonstrated through the carbon isotope composition of the soil CO2 [24,26,45,66,71,73,74].
Figure 1. (a) The Aeolian Island arc and the island of Sicily, Italy. The Tindari−Letojanni fault system (TLFS) is shown; (b) the study area on the island of Vulcano. The yellow-dashed area shows the 2.2 km2 zone selected to monitor the soil CO2 flux for volcano surveillance purposes in the La Fossa Caldera. The red areas show the main anomalous degassing zones: Faraglione and Palizzi [18,19,33,45,63,64,67,68,69,70,71]. The blue rectangle shows the study area at Vulcano Porto. (c) The study area at Vulcano Porto. Three of the four automated monitoring stations (orange triangles) are situated near the anomalous degassing zone of Faraglione. The fourth station is used as a reference for both background outdoor air CO2 concentration and soil CO2 flux. Blue circles show the sites for indoor air CO2 concentration survey.
Geosciences 13 00266 g001
A comparison of the land use at Vulcano Porto showed that several accommodation buildings and facilities are in the zone of Faraglione, whereas Palizzi lies on the south side of the volcanic cone and is not habited by residents or visitors. Therefore, the surveys for the detailed investigation of the gas hazard in the inhabited zone of Vulcano Porto focused on the Faraglione area.
The large variation in the number of inhabitants of Vulcano during the autumn and winter seasons (i.e., less than a thousand) compared to the spring and summer months (i.e., more than 10,000 visitors per day), determines a very different volcanic risk during the year, even in case of stable volcanic conditions. Among other factors, gas hazard varies chiefly with CO2 emissions, and the continuous monitoring of φCO2 plays a key role in assessing gas hazard variations in risk zones. These zones can be identified by spatial soil gas surveys. On Vulcano, the monitoring of φCO2 has been carried out on a sampling grid with 53 sampling sites covering an area of 2.2 km2 (Figure 1b) between the Istmo area, Mount Lentia, Palizzi, and the western side of the La Fossa caldera [21,67,70]. These measurements began in 1984 [17,18,21,68] and the geometry of the grid has not changed over time. The φCO2 measurements have been made monthly for volcano monitoring purposes since 1984 [18,19,21,33,45,63,64,67,68,69,70,71]. Several studies show that anomalous CO2 emissions from the ground occur mainly in the Palizzi and Faraglione areas [18,19,45,63,64,67,68,69,70,71,73,74] and at the base of the La Fossa cone (Figure 1). In the inhabited zones of Vulcano Porto, the monitoring of indoor CO2 concentration allows an assessment of the potential hazard posed by the diffuse degassing of CO2 [65,67,75,76,77]. Indoor CO2 concentration measurements were carried out in the Faraglione zone, since the inhabited zone of Vulcano Porto is located in the zone of the islands where volcanic degassing is most evident at the surface.

3. Materials and Methods

3.1. Investigation Strategies

Activities to implement a gas hazard monitoring system at Volcano Porto required (i) identification of anomalous outgassing areas; (ii) verification of the effects of volcanic emissions on air CO2 concentrations outdoor; and (iii) monitoring of short-term variations in both soil CO2 flux (φCO2) and outdoor air CO2 concentrations.
To identify areas of anomalous soil CO2 emissions and their temporal variability, numerous measurements have been made since 1988 to quantify CO2 degassing from the soil over a fixed grid of 53 measurement points [17,21,24,66,67,70,73,74]. In May 2019 and March 2020, a second grid was used to obtain more detailed information on diffuse degassing in the area between Porto di Ponente, Lentia, and Camping Sicilia towards the central part of the La Fossa caldera (Figure 1b). This grid consisted of 80 measurement points distributed almost uniformly over an area of 1.2 Km2.

3.2. Soil CO2 Flux Measurements (φCO2)

The φCO2 measurements were performed by the dynamic concentration method [68,70]. This method has been implemented in the field using a special designed sampling probe, which is inserted in the soil up to a depth of 50 cm. The bottom of the probe is open to the soil gases, while the top side is open to the atmosphere. A pumping unit collected the mixture of soil gases and air which forms inside the probe and sends it to an IRGA spectrophotometer (Models: RI—550 A, Gascard—Edinburg Gas Sensors IR spectrophotometer, with accuracy 2% full scale; range 0–10%vol and range 0–3000 ppm vol for indoor air CO2 concentration measurements). After a few minutes of pumping at a constant flux rate (0.8 L min−1), the CO2 concentration in the gas mixture achieves a constant value (i.e., the so-called “dynamic concentration”), which is proportional to the φCO2. The experimental relationship between φCO2 (g m−2d−1) and dynamic concentration (i.e., Cd expressed as ppm vol) was established in the laboratory by simulating the soil degassing under controlled conditions of CO2 flux, soil permeability, pump flux rate, and depth of probe insertion in the soil. The CO2 flux was calculated by using the following equation [70]:
φCO2 = (32 − 5.8 × k0.24) × Cd + 6.3 × k0.6 × Cd3
where Cd is the dynamic concentration of CO2 and k (μm2) is the soil gas permeability measured in the field [71,73]. This equation is useful when the pumping flux is equal to 0.8 L min−1 and the probe is inserted in the soil at a depth of 50 cm.
Implementing an effective monitoring system for gas hazard in volcanic zones involves monitoring φCO2 and the outdoor air CO2 concentration. At Faraglione, an innovative monitoring network was deployed for a continuous survey of these parameters. The architecture of this network includes four monitoring stations for measuring φCO2 and the outdoor CO2 concentration at two heights above the ground, and a server to host the data collected in the field. This network also includes a weather station with several sensors (i.e., air temperature, atmospheric pressure, wind speed and direction, rain gauge, and air humidity) to evaluate the effects of the weather on the gas hazard. All remote stations are equipped with sensors for measuring air temperature (T), atmospheric pressure (P), relative humidity (Rh), and the CO2 concentration (Gascard—Edinburg Gas Sensors IR spectrophotometer, with accuracy 2% full scale; range 0–10 vol%). A solar panel, a charger regulator, and a lead battery (12 V; 100 A) generally obtain the power supply for each monitoring station; in one case (carapezza station), the electric network was used.
The control unit of the monitoring system is the GASNET datalogger, based on processor Atmel SAMD21, 32-bit ARM Cortex® M0, and implements both the measurements and the delivering of data to the observatory. The datalogger was designed and fully developed at the laboratories of Istituto Nazionale di Geofisica e Vulcanologia. It allows multiple sensor connections and is fully programmable (channel configuration, scheduling the acquisition, number of measurements and some other settings). Each remote station is able to measure: (a) the soil CO2 flux measurements in agreement with the above-described dynamic concentration method; (b) the outdoor air CO2 concentration at two heights above the ground level (i.e., 20 cm and 150 cm, respectively), and (c) the environmental parameters (i.e., T, P, Rh). The measurements are scheduled on an hourly basis, and each measurement routine consists of almost 4 min of active signal acquisition. The GASNET board stores the data locally in SD memory card (i.e., files are yyyymmdd.csv for each day) and delivers the new data to a web service at the end of each acquisition.
The software gasnet.cgi (version 1.0) allows collecting data acquired by the remote stations through the webservice program (“gasnet.cgi”) written in C language and installed together with a web server “Apache2”, a “MariaDB” database and other modules to process acquired data. Data are encrypted from the remote stations and decrypted by the server. “gasnet.cgi” software (version 1.0) was developed by us and includes modules for managing the station network, data storage, data analysis, data visualization, and remote station functionality tests. The software also exhibits the capacity to mitigate spikes, which may arise sporadically due to the switching actions of solenoid valves and current regulators of solar panel system. Simultaneously, it showcases the ability to perform data interpolation in scenarios where data gaps are encountered. A module allows interactive data processing (plotnet.cgi) as time-series visualization using customizable parameters (i.e., axis scale, time window, variables). This software also allows data mining in other databases in order to obtain data acquired by stations of other networks mainly located in other sectors of the island of Vulcano [65,67,74].
The selection criteria that were adopted for establishing the suitable sites for deployment of the stations were (i) the spatial distribution of the anomalous degassing zone and (ii) people’s exposure to the volcanic gas emissions. With this qualitative approach, the continuous monitoring activity would focus mainly on the high-risk zone of the island of Vulcano.

3.3. Measurements of the Environmental Variables

The gas hazard monitoring network includes one weather station (i.e., rojas) equipped with sensors for measuring air temperature, atmospheric pressure, wind speed, wind direction, relative humidity, and rain. Rojas area was selected as the suitable site for monitoring the weather variables because its location is far from both vertical barriers (i.e., Faraglione and Mt Lentia) and close to the sea. These are the main morphological features of the surveying zone that plausibly influence the wind pattern and the air turbulence at Vulcano Porto. In synchrony with air CO2 concentration measurements, the station measures sequentially all the environmental variables except the rain. This last parameter is continuously recorded and hourly cumulated.

3.4. CO2 Concentration Measurement Indoor

Data of the CO2 concentration indoor were collected in August 2020 for assessing the effects of diffuse degassing on the indoor air CO2 concentration in the zone of Faraglione. The measurements were performed with a portable instrument equipped with spectrophotometers (Gascard—Edinburg Gas Sensors IR spectrophotometer, with accuracy 2% full scale) working in the ranges 0–3000 ppm vol and 0–10% vol. A typical experiment in the building with either private or public access by people consisted in collecting air at 2–10 cm above the ground floor. The experiment duration in each site was almost 12 min, owing to the estimated average residence time in these closed environments, with a regular sampling frequency of 2 min. One experiment was carried out outdoors (i.e., RMG site in Figure 1c) to assess the effects of the diffuse degassing in the air at the edge of the anomalous degassing zone. Although air CO2 dilution in outdoor air differs from the indoor dilution, this survey on Vulcano was performed during the summer period, when windows kept open maintain active ventilation into buildings. The data analysis reveals this site as suitable as a reference for both the indoor and outdoor air CO2 concentration near the anomalous degassing zone of Faraglione. The dataset of the indoor experiments includes some accommodation buildings, facilities, and private houses with people access.

3.5. Soil Gas Surveys Data Processing

Maps showing the spatial distribution of φCO2 were produced by interpolating the field measurements using the Kriging method. The prediction layers of φCO2 were obtained from the scattered set of points by applying the Kriging algorithm considering the spherical model of spatial autocorrelation. The continuous grid surfaces were created using Surfer 13 software, which simulates the spatial distribution of CO2 flux throughout the study area.

3.6. Continuous Monitoring of φCO2 Clustering

Cluster analysis was performed to examine the relationships between soil CO2 emissions and air CO2 concentrations. Cluster analysis allows the classification of observational data sets into some classes according to a set of similarity criteria. The goal of this analysis is to identify a few groups of data that are internally homogeneous (i.e., similarity criteria) and heterogeneous among themselves. Several clustering methods are available for partitioning datasets (e.g., k-means, hierarchical, and two-way clustering), which differ in that they require either preselection of the number of clusters to be identified in the dataset, some statistics of the dataset, or computational effort. Hierarchical clustering allows objects to be grouped so that objects within one group are similar to each other and different from objects in other groups.
Hierarchical clustering has an advantage over other existing clustering methods because it does not require specifying the number of clusters. The hierarchy of clusters can be created by partitioning algorithms, where first all objects in a single cluster are considered. Then, through an iterative partitioning process, each object is placed in a different cluster by applying some principles that maximize the distance between adjacent objects in the cluster. Another type of hierarchical method is agglomerative clustering, where each object first forms its own cluster. Then, the agglomerative algorithms gradually merge pairs of small clusters into a single, larger cluster until, at the end of the iterations, all the data are grouped into a single cluster. Basically, hierarchical clustering measures the similarity between objects (i.e., distance) to create a new cluster. Several metrics allow the computation of distances between objects (e.g., Euclidean, Chebyshev, Manhattan, etc.). The Euclidean distance function allows the calculation of the proximity matrix, which is the basis for assigning each data point to a cluster. Merging two clusters into one cluster is based on the Euclidean distance metric for similarity between clusters, which refers to the sum of squares of object coordinates in Euclidean space. The calculations of the Euclidean distances lead to an update of the distance matrix. The iterative process of updating the distance matrix and merging clusters ends when the last two clusters are merged into a final cluster that encompasses the entire dataset. There are many different approaches to computing the distance between clusters and updating the proximity matrix. Only a few approaches (i.e., either single linkage or complete linkage) calculate either minimum or maximum distances between objects of different clusters. In the cluster analysis of our dataset, we used the Ward approach, which analyzes the variance of the clusters instead of measuring the distances directly, and tries to minimize the variance between the clusters. In Ward’s method, the distance between two clusters depends on how much the value of the sum of squares increases when the clusters are combined. In other words, the implementation of Ward’s method tries to minimize the sum of squares distances of the points from the cluster centroids. Compared to other distance-based methods described above, the Ward method is less susceptible to noise and outliers. Therefore, in this paper the Ward method is preferred over other methods for clustering.

4. Results

4.1. Diffuse Degassing of CO2 at Faraglione Zone (φCO2)

Figure 2 shows the results of φCO2 measurements made in the inhabited zone of Vulcano Porto to study in detail the spatial pattern of diffuse degassing. This study focused on soil CO2 emissions at Faraglione. The φCO2 measurements were performed in May 2019 (Figure 2a) and repeated in March 2020 (Figure 2b) to evaluate possible spatial variations of the anomalous degassing zone due to variations in the volcanic degassing of La Fossa volcano. The total CO2 output was calculated for each campaign by multiplying the average φCO2 value by the surface of the investigated area (1.1 km2). Comparison of the results of these surveys reveals several similarities in the spatial distribution of φCO2 in the studied area. The highest CO2 emission (i.e., φCO2 > 100 g m−2 d−1) is observed in the anomalous degassing zones at Sorgenti Termali, Faraglione, and Porto di Levante. Low CO2 emissions from the soil were observed near Monte Lentia. Overall, the results of these studies show comparable values for total CO2 output (i.e., 85 ton d−1 and 87 ton d−1 for May 2019 and March 2020, respectively).
Focusing on the areas with low and medium φCO2 values (i.e., φCO2 in the range of 1.04–15 g m−2 d−1 and 15–50 g m−2 d−1, respectively), some differences are observed in the central part of the study area. Diffuse degassing in zones A, B, and C with intermediate values of φCO2 disappeared in 2020 and soil CO2 flux decreased by almost 23% in Porto di Ponente zone and φCO2 decreased in zones with low φCO2. The increase in φCO2 in the anomalous degassing zone (Faraglione) offset the trend in the other zones, so that φCO2 in 2019 had a similar average value to 2020.

4.2. CO2 Concentration Indoor

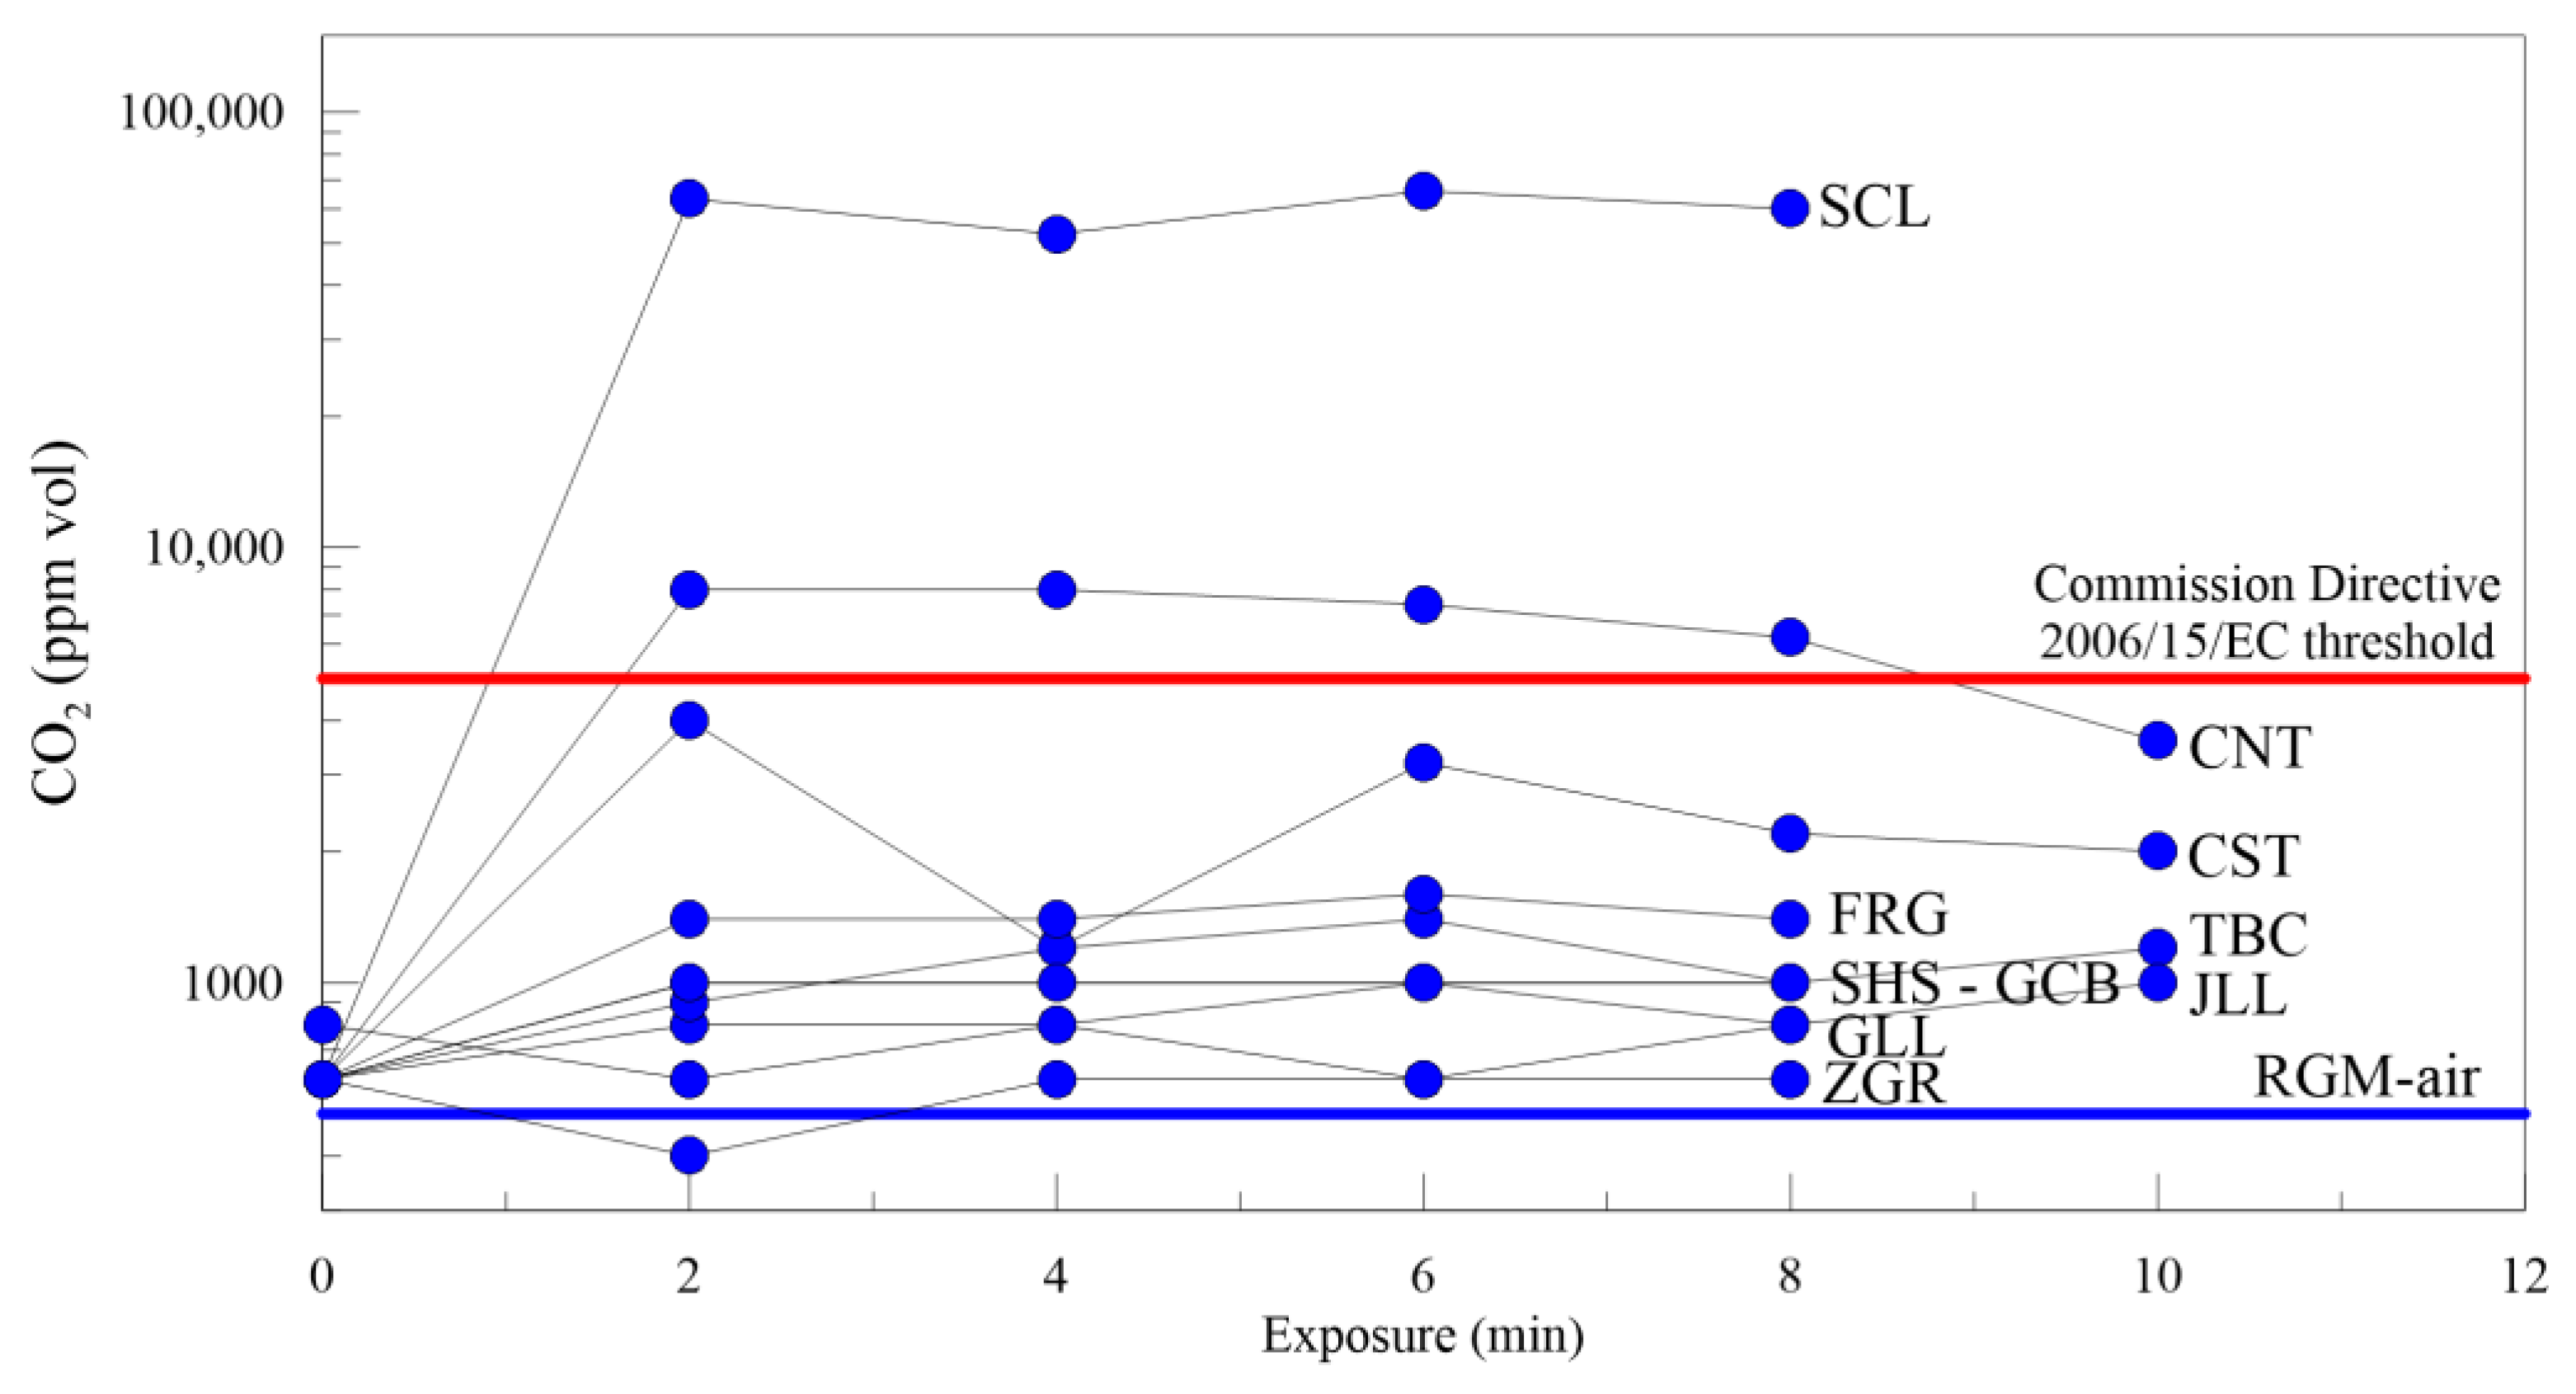
Figure 3 shows the results of indoor air CO2 concentration measurements performed on Vulcano in August 2020. It is important to emphasize that Vulcano was in a dormant phase at the time of the measurements. This data set shows that the CO2 concentration in the closed environment was higher than the outdoor CO2 concentration at the RMG reference site.
Overall, the average indoor pattern shows that the CO2 concentration in air was highly site-dependent and generally below 5000 ppm vol. According to the Commission Directive 2006/15/EC, an indoor air CO2 concentration > 5000 ppm vol for an estimated exposure time of 8 h can be dangerous for human health [42]. CO2 hazard rises due to an increase in air CO2 concentration, even for smaller exposure times. At the worst conditions, air CO2 concentrations > 100,000 ppm vol cause unconsciousness [43,44] and can be lethal for CO2 > 90,000 ppm vol for an exposure time longer than 5 min [43]. At the SCL site, indoor CO2 concentration reached a value of 10,000 ppm vol a few minutes after isolating the room from the external environment. This high value of indoor air CO2 concentration affects the metabolism after a few hours of exposure and can be harmful either if the CO2 concentration increases further or the CO2 concentration remains stable and exposure times become longer. It is worth noting that the above-reported references for the health effects of indoor air CO2 concentration refer to environments occupied by people at work, which can be very different from houses or buildings occupied also by children or elderly. For these environments, health organizations in several countries have recommended limits significantly lower than 5000 ppm vol. For example, the Istituto Superiore di Sanità recommended CO2 < 1000 ppm vol for indoor air [78], while the permitted value for indoor air CO2 concentrations in Canada is 3500 ppm vol [79], and in UK schools is 1500 ppm vol [80].
At a steady state, indoor air CO2 concentration at most sites was <5000 ppm vol, which is the threshold value that has a slight effect on metabolism after a prolonged exposure of several hours. In Figure 3, the first part of each plot represents the accumulation rate of the indoor CO2 in the measurement site when the air circulation was restricted by closing the door of the environment. Despite the low level of volcanic activity at Vulcano in 2020, indoor air CO2 concentrations can achieve high values, especially near the ground in an enclosed environment. These conditions can significantly worsen during periods of volcanic crisis, when the CO2 emission around the volcanic edifice increases considerably. Furthermore, gradual increases in outdoor air CO2 concentration could be due to meteorological effects (i.e., atmospheric pressure, wind, and rainfall), human activities (e.g., excavation and borehole drilling), or the specific conformation of buildings (e.g., cellars). For example, the CO2 concentration at the SCL site reached levels dangerous to humans (i.e., nearly 10% vol s−1) within minutes and remained at this high level even though the measurement site door was open to the atmosphere. CO2 accumulation occurs near the ground because the molecular weight of CO2 is higher than the average weight of air (28 u.m.a.).
Natural or forced air turbulence will stir up the CO2 in the air and remove any stratification caused by the density difference in the gas composition. The SCL site is a basement near Faraglione that is occasionally entered by residents to store personal items. Since the gas hazard depends on the CO2 concentration and the duration of exposure, it is not surprising that no injuries have occurred at these sites on Vulcano. Arguably, in this case and in similar buildings, the indoor air CO2 concentration can easily achieve hazardous levels (e.g., indoor air CO2 > 10,000 ppm vol), especially at night when air turbulence is at a low level, CO2 dilution is less effective, and chemical layering may occur in indoor air.

4.3. Soil CO2 Flux Continuous Monitoring (φCO2)

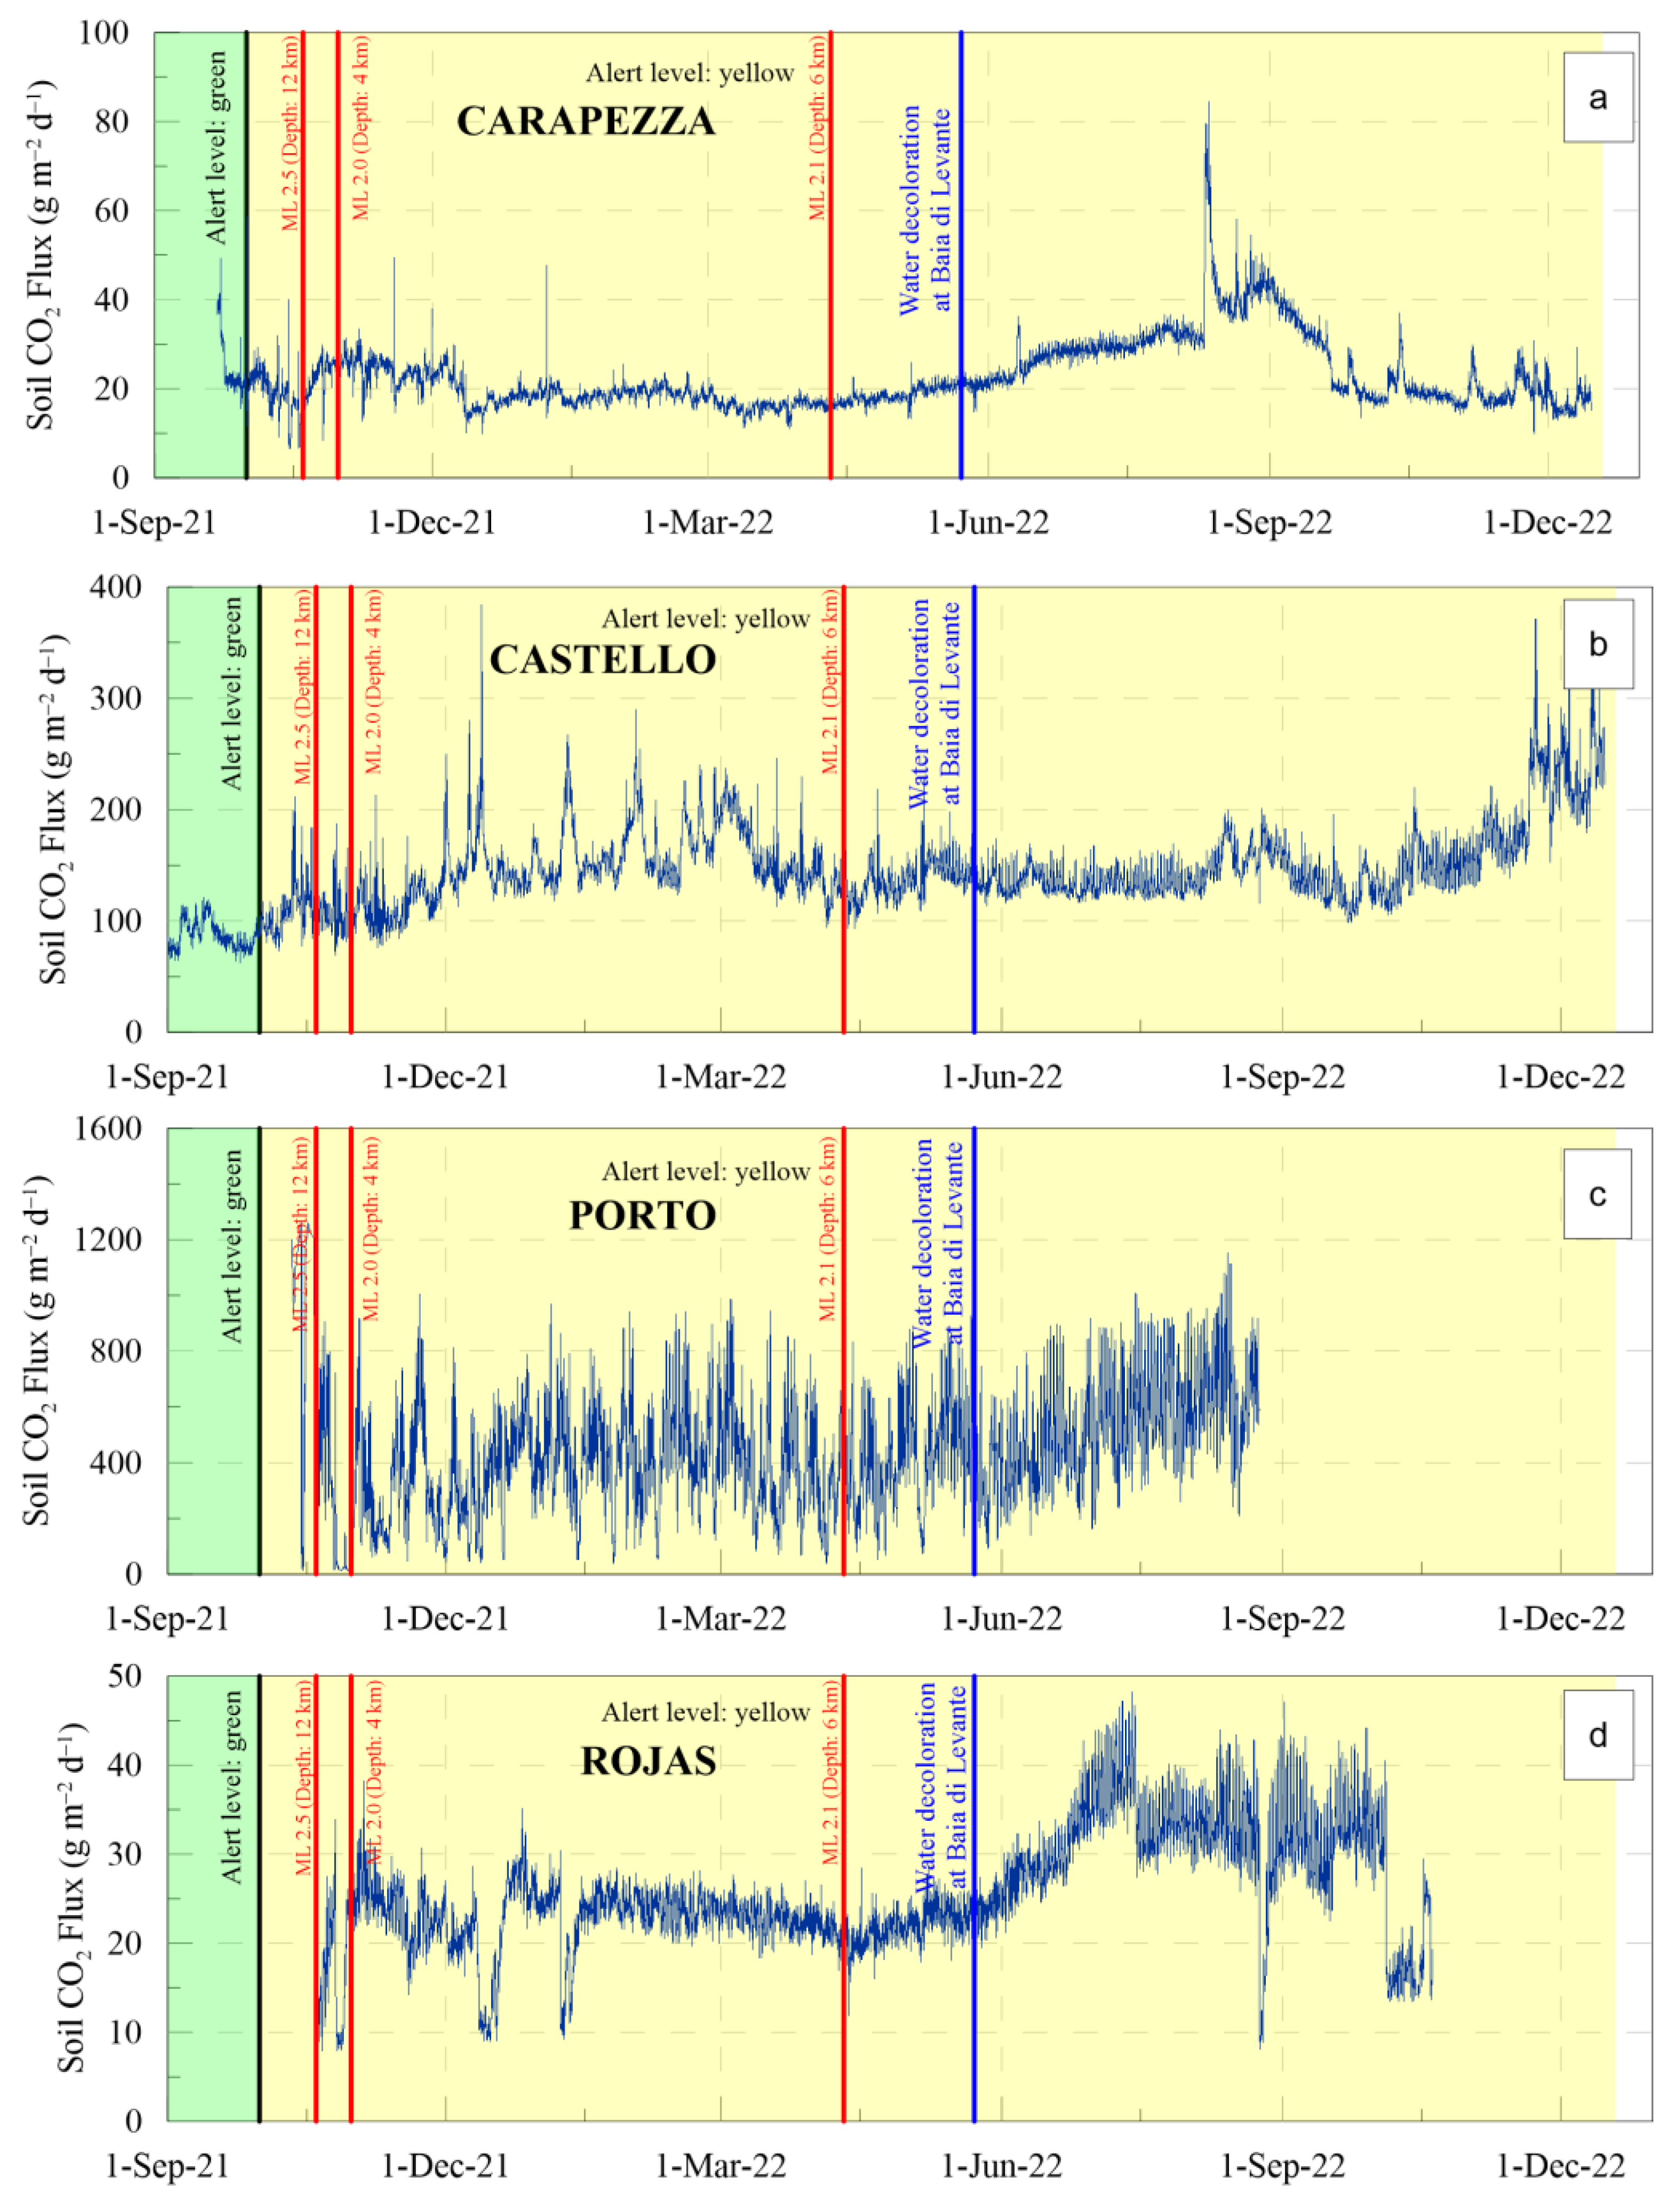
Figure 4 shows the time series for φCO2 measured at the Faraglione site from September 2021 to December 2022. The four stations measure the φCO2 in the inhabited zone of Vulcano Porto. This study includes the recording of φCO2 during a period of remarkable changes in volcanic degassing due to an increase in magmatic degassing at depth [45,46,47,48]. Overall, statistics for the data collected from each station during the September 2021–December 2022 time window (Table 1) show that the φCO2 at Carapezza and Rojas is within the range of emissions from soil respiration [81,82,83], while the average φCO2 at both Porto and Castello is an order of magnitude higher. According to [66], which combined φCO2 measurements and carbon isotopic data for soil CO2, a significant amount of soil CO2 of volcanic origin is released throughout the Vulcano Porto zone, although the magnitude of the CO2 flux is within the range of φCO2 sustained by soil respiration. The Carapezza station is located outside the anomalous degassing zone (i.e., the Faraglione zone) and can be considered a suitable reference for the background of φCO2 in the Vulcano Porto zone, at least during period of quiescent degassing (i.e., in 2019 and 2020).
Throughout the observation period, the φCO2 in the peripheral zones of the La Fossa cone showed a clear evolution. The φCO2 at Castello was almost constant at 100 g m−2 d−1 until the end of September 2021. On September 21, an increasing trend started at the Castello monitoring station and the φCO2 value reached 200 g m−2 d−1, which was almost 100% higher than the previously measured values. The φCO2 value at the Carapezza station remained constant from the end of September to October 2021.

4.4. Variations of the CO2 Concentration in the Outdoor Air

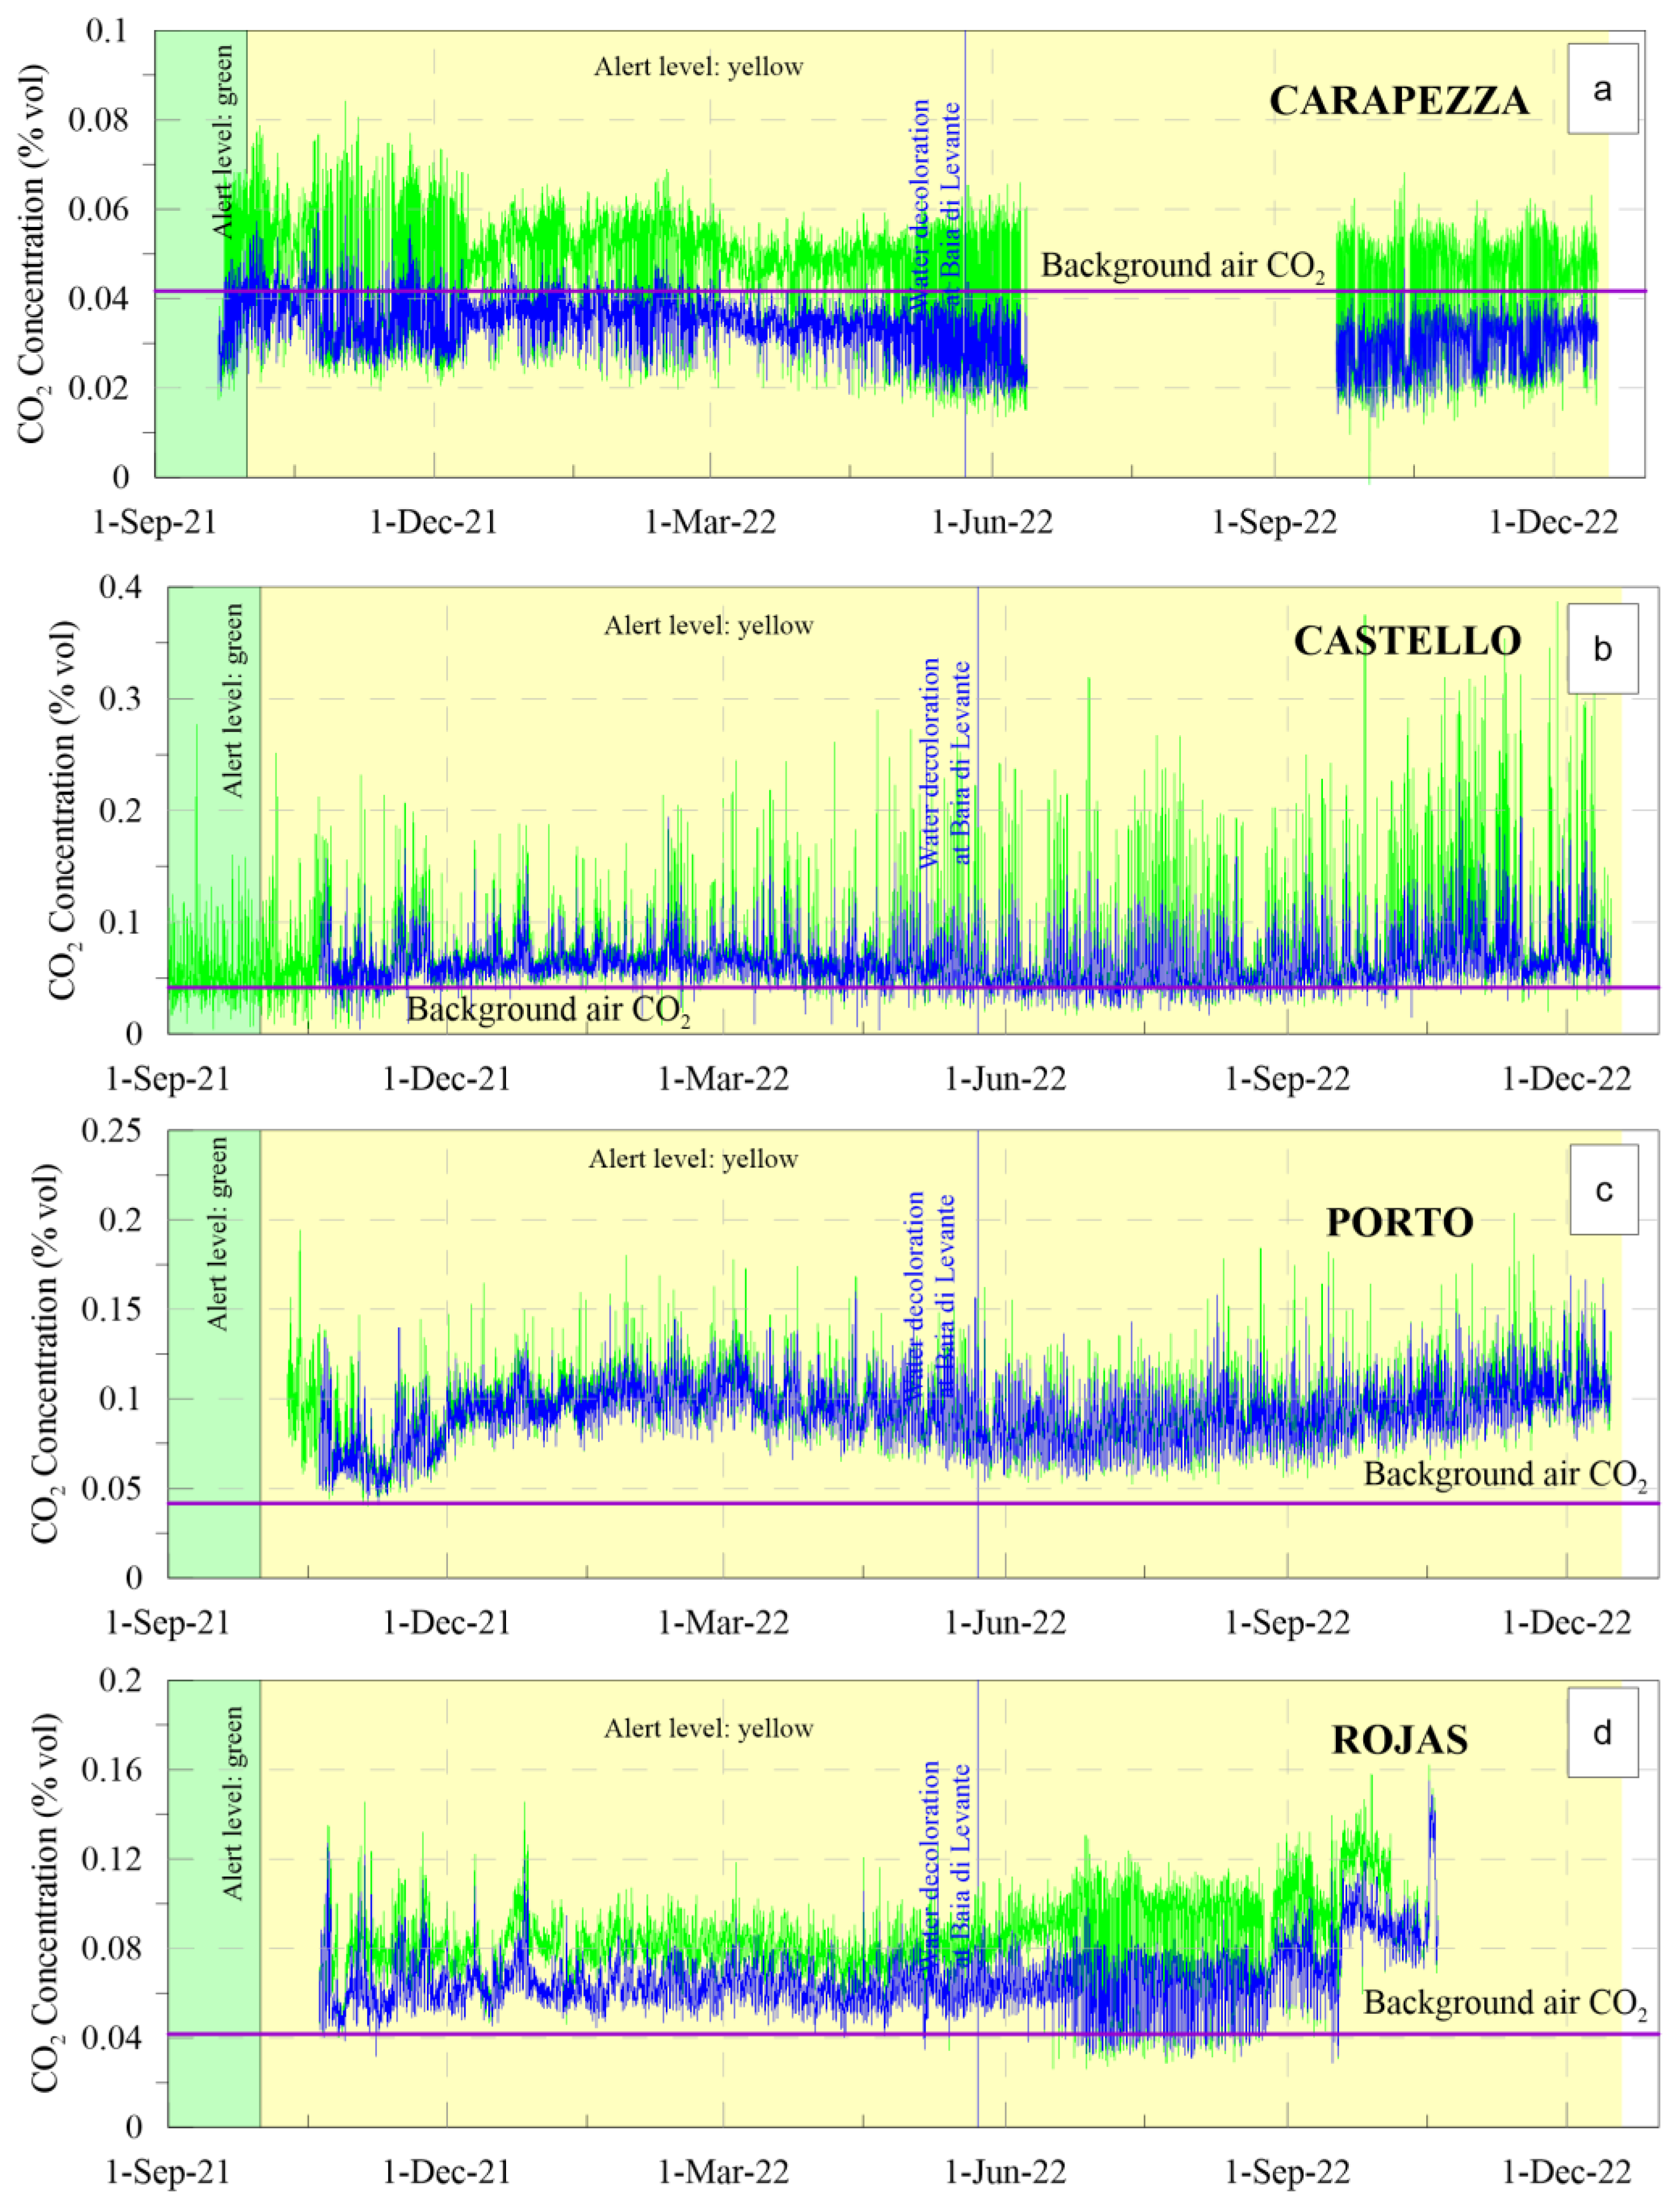
Gas hazard monitoring on Vulcano is based on integrated measurements of φCO2 and CO2 concentrations in the outdoor air, which allow us to detect the possible transition to hazardous conditions. Figure 5 shows the time series of CO2 concentration in the outdoor air at each measurement point in the Faraglione anomalous degassing zone. The dataset includes the measurements of CO2 concentration at the heights of 20 cm and 150 cm above the ground. Figure 5 shows that the average CO2 concentration in outdoor air measured at 20 cm above ground level at the Carapezza site is 42.8%, 55.5%, and 42.8% lower than the CO2 concentration at Castello, Porto, and Rojas, respectively.
The CO2 concentration of the outdoor air at 150 cm above the ground gave similar trends to those at 20 cm, although the absolute values were different (Table 1). In addition, the maximum values at both heights above ground indicate that the air CO2 concentration at the Carapezza site was an order of magnitude lower than the maximum value at the other sites throughout the monitoring window. Figure 5b shows that the CO2 concentration in the air near the ground at the Castello site is high (i.e., CO2 > 2500 ppm vol). The measurements taken at two different distances from the ground allow us to study the dispersion of volcanic gas in the lower layers of the atmosphere.
A closer look at the time series reveals site-specific differences in the vertical evolution of CO2 concentrations. CO2 concentrations at the Carapezza and Rojas sites are nearly 200 ppm vol and 400 ppm vol higher, respectively, at a 20 cm altitude than those measured at a 150 cm altitude. This indicates that diffuse degassing releases volcanic CO2 that accumulates near the ground and causes chemical stratification in the lower layers of the atmosphere. CO2 concentration in the air shows a negative correlation with distance from the ground. Although the CO2 concentration in the air at the Castello and Porto sites reached more than 2500 ppm vol. several times during the observation period, the measurements made at 20 cm above the ground are comparable to those made at 150 cm.
At the Porto station, the CO2 concentration measured at 20 cm above the ground is even indistinguishable from the CO2 concentration at 150 cm above the ground, and thus independent of the height above the ground.
Each monitoring station was equipped with sensors for monitoring some environmental variables (i.e., air temperature, relative humidity, and atmospheric pressure) in order to evaluate the possible site-specific effects of these variables on the outdoor air CO2 concentration. Recordings of these measurements have shown no statistically significant differences in air temperature, relative humidity, and atmospheric pressure at the four sites (Figure S1).

4.5. Changes in the Atmospheric Variables

The gas hazard in volcanic regions is an interface problem caused by the interplay among diffuse degassing, plume dispersal into the La Fossa caldera from the crater rim, and atmospheric turbulence conditions [34,46,77,84,85]. The Rojas monitoring station includes sensors to measure several weather variables that affect both φCO2 and the dispersion of CO2 in the air in the inhabited zone of Vulcano Porto. The site-specific characteristics of the atmospheric circulation at the Rojas site can be considered representative of average conditions throughout the study area (Figure S1).
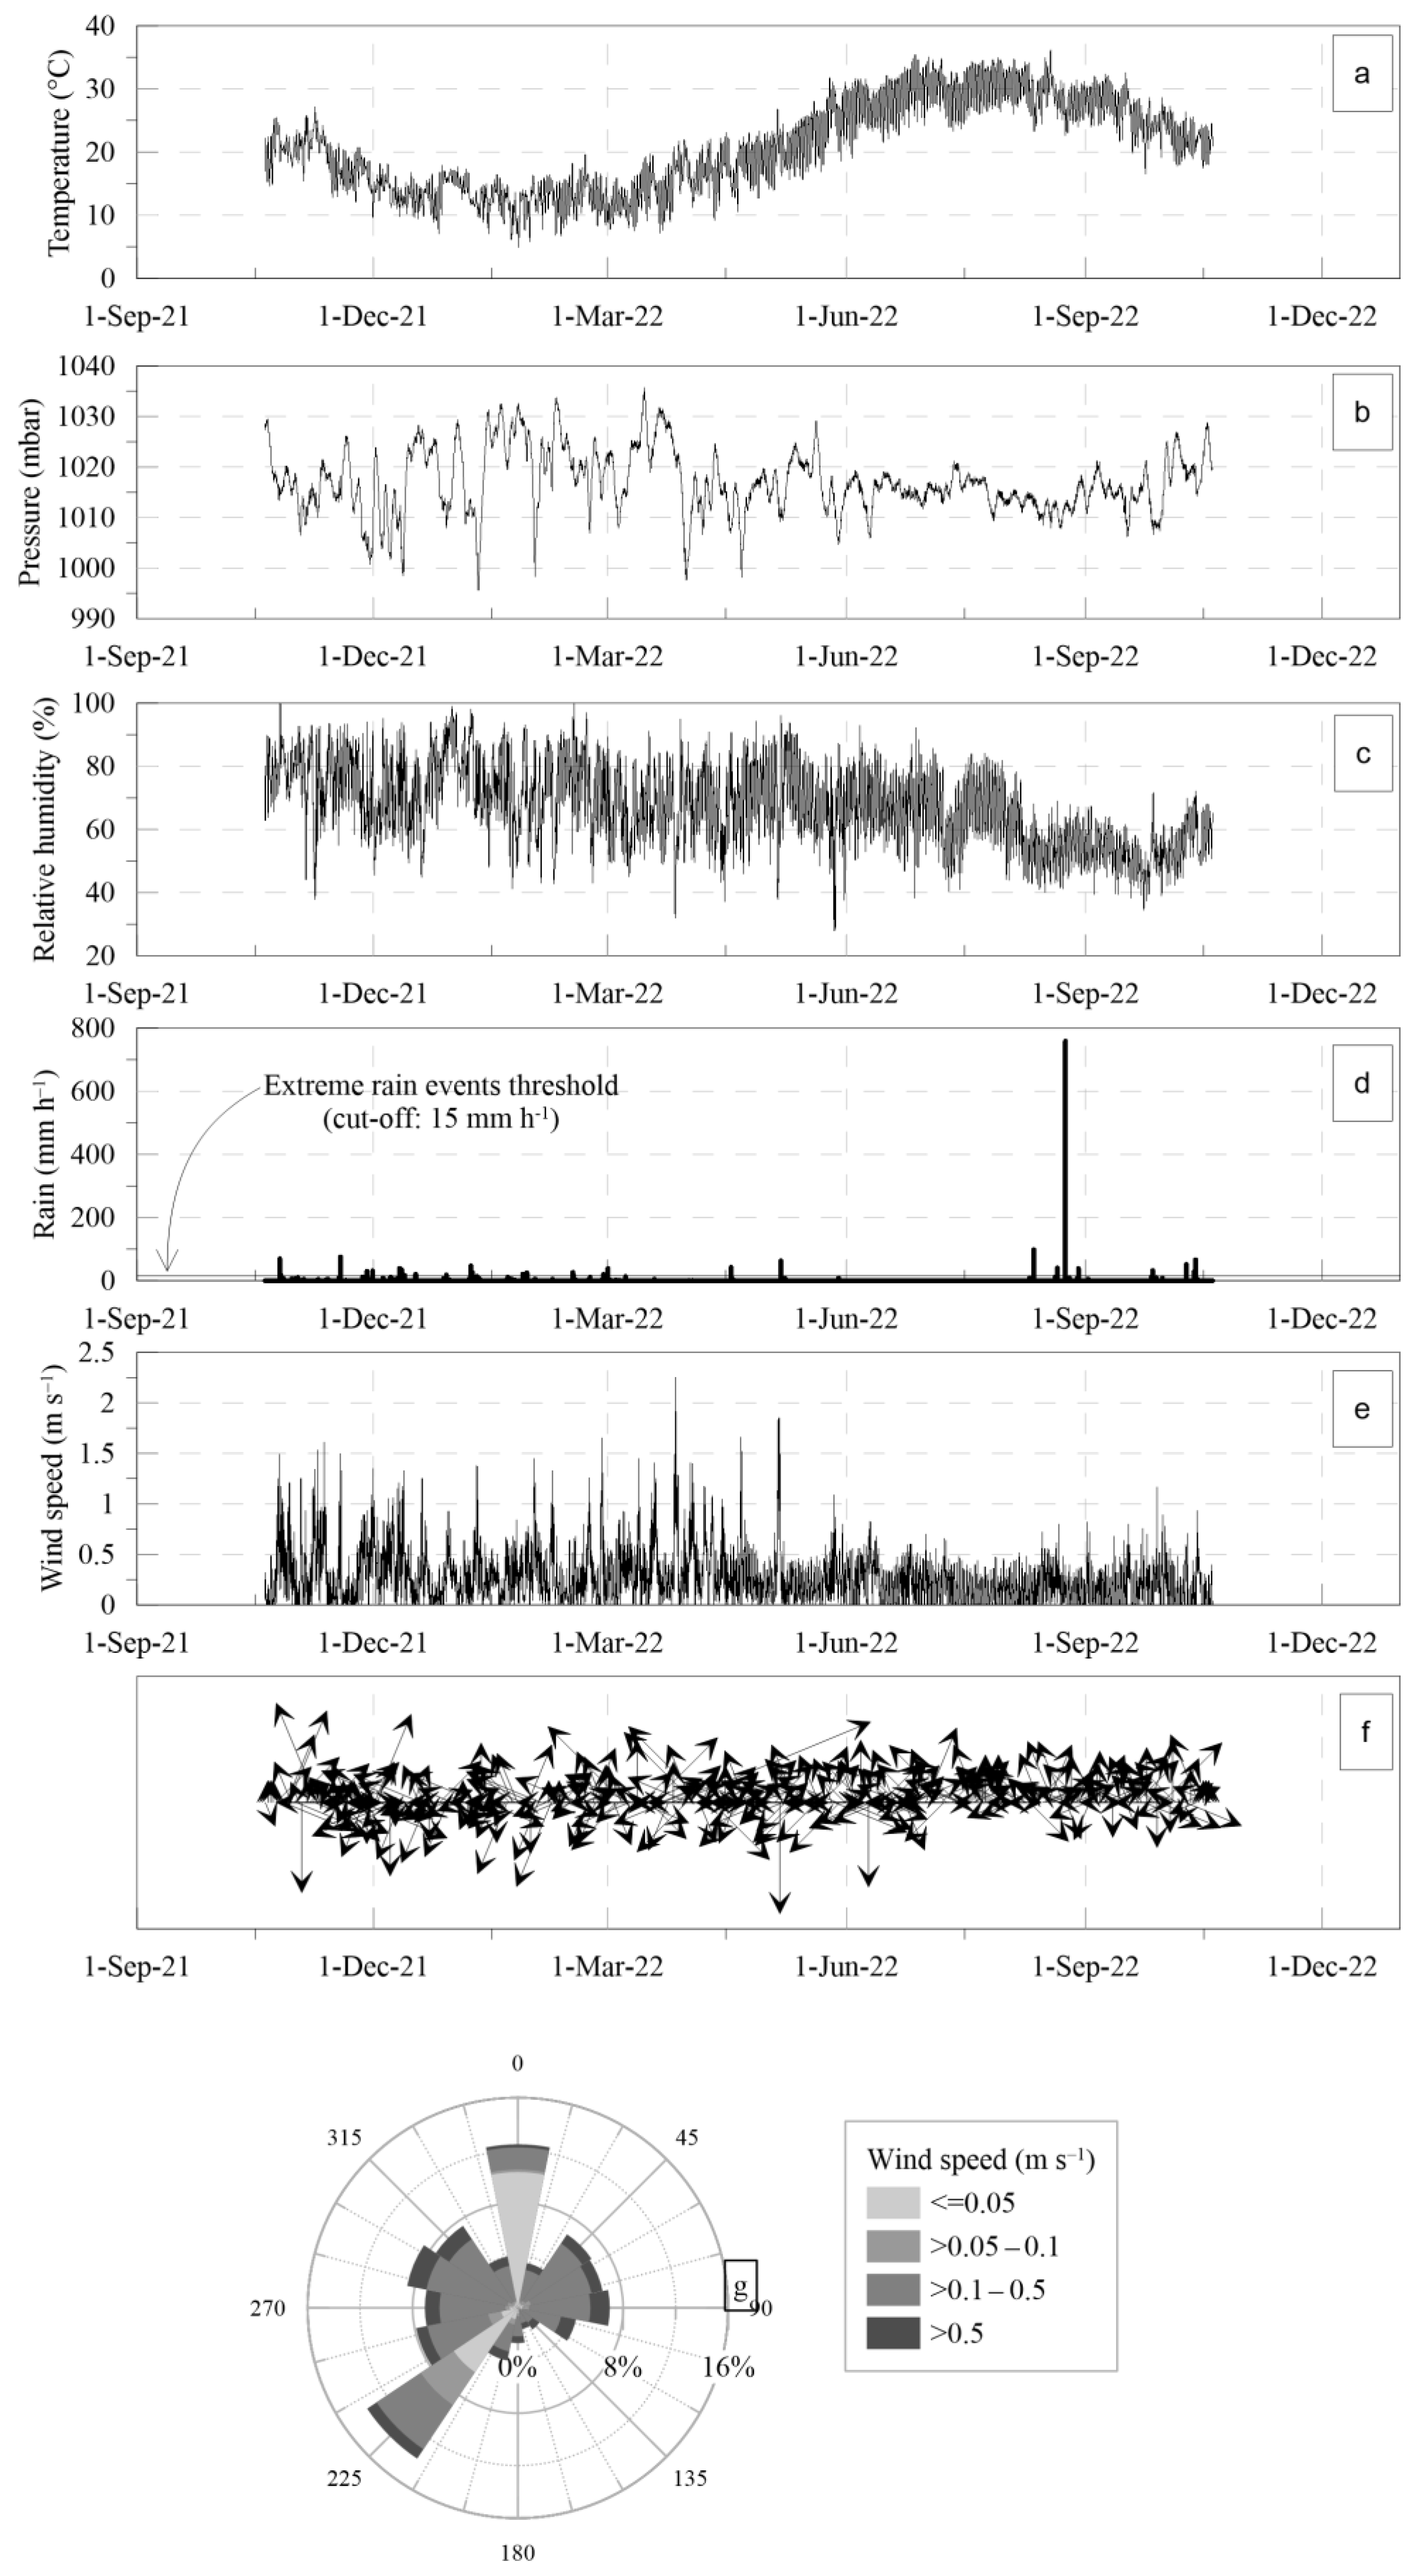
The air temperature on Vulcano (Figure 6a) showed a sinusoidal pattern throughout the period of monitoring, with the highest values measured in summer (i.e., T > 25 °C), while the lowest values were measured in winter, when the average temperature was 14 °C. During the whole observation period, the average temperature was 20.6 °C, which corresponds to the average air temperature of the Mediterranean region.
Atmospheric pressure (Figure 6b) exhibited a nearly constant pattern in September 2022. Large fluctuations occurred during the fall period, resulting in sensitive changes in weather conditions (Figure 6d). In particular, several rain events brought 313.6 mm of cumulative rain, which is more than half of the average annual cumulative rain on Vulcano, based on observations over the past decade. The relative humidity (Figure 6c) ranges from 27.33% to 99.97%, with low values in summer 2021 and higher values from fall 2021 to spring 2022.
Figure 6d shows that rainfall is irregularly distributed throughout the observation window (i.e., average rain rate = 0.37 mm h−1, skewness = 79.93, kurtosis = 7023.36), with 41 extreme rain events (12.46% of the 329 rain vents causing a rain rate > 0.2 mm h−1) having a rain rate > 15 mm h−1. The highest rain rate (758 mm h−1) occurred on 24 August 2022. Wind speed (Figure 6e) is among the most important weather variables for studying the gas hazard of volcanic origin because it affects the dispersion of CO2 in the air, which plays a crucial role in the chemical stratification of the air near the ground. The average wind speed at Rojas site was 0.26 m s−1, a value slightly higher than the most common value of 0.21 m s−1 (i.e., the median value), since the wind speed was 40.92% times higher than the average value. The highest value for wind speed at the Rojas measurement site was 2.25 m s−1. Figure 6g summarizes that the air circulation during the observation period was mainly determined by air masses from WSW and N (i.e., 13.8% and 12.45% of the dataset, respectively).

5. Discussion

5.1. Spatial Variations in φCO2 across the Target Area and Air CO2 Concentration Indoors

Results from two soil gas surveys conducted on Vulcano in 2019 and 2020 show variations in air CO2 concentrations due to variations in φCO2. The anomalous CO2 emissions occurred throughout the island of Vulcano, where faults and fractures in the crustal rocks provide a preferential pathway for volcanic gas to rise to the Earth’s surface [86,87]. Accordingly, as shown by several studies performed on Vulcano [18,19,21,33,45,63,64,67,68,69,70,71,73,74], the soil CO2 flux survey in 2020 shows that anomalous degassing zones have similar positions as in 2019 (Figure 2). A detailed analysis of these results shows a kind of accommodation of φCO2 due to minor variations in volcanic degassing (i.e., the areas marked as A, B, and C in Figure 2). While the average value of φCO2 was constant throughout the target area, the increase in CO2 emissions at Faraglione compensated for the decrease in φCO2 at Lentia. These findings suggest that the anomalous degassing zone in Faraglione can be sensitive to small changes in volcanic degassing that bring volcanic/hydrothermal CO2 into the atmosphere.
Diffuse degassing releases volcanic CO2 into buildings and houses on Vulcano Porto, determining indoor CO2 concentrations that can reach high levels which are potentially harmful to human health, depending on the time of exposure [34]. The indoor measurements showed that CO2 concentrations in indoor air reached higher values than those measured in a non-anomalous area, as shown by a comparison with the reference background for CO2 concentrations in outdoor air in August 2020 (Figure 3).
In certain instances, indoor measurements exhibited values > 5000 ppm vol, substantially higher than the air CO2 concentration present in the adjacent outdoor atmosphere. This phenomenon implies that the rise of indoor CO2 within structures is predominantly attributed to soil CO2 emissions beneath the edifices, rather than to the influx of CO2 from the exterior surroundings (i.e., outdoor air from windows). Arguably, this is particularly noticeable in inadequately ventilated zones or areas where the prevalence of drains, vents, and sewage pipes fosters conditions of heightened permeability to subsurface gases. The results of detailed investigations conducted through spatial surveys of stable isotopes of carbon and oxygen in the air CO2 suggest that variations in volcanic outgassing and daily evolution of the planetary boundary layer affect the volcanic gas dispersal in the Vulcano Porto area [11,46]. Since the outdoor air CO2 concentration is a suitable background for both indoor and outdoor CO2 concentration at the local scale, these results show that the greatest gas hazard can be detected late at night and under conditions of increased volcanic degassing.
The CO2 increase in these environments can persist for about 10 min, a period equivalent to the average time people spends in spaces such as kitchens, bathrooms, or basements. The hazard posed by volcanic gases is arguably greater in bedrooms, where people tend to spend more time at night. Although diffuse degassing on Vulcano was at a low level during our study in 2020, indoor air CO2 concentrations suddenly increased to nearly 10 percent by volume under conditions favorable to chemical stratification near the ground These conditions prevailed at the Faraglione sites (i.e., the SCL site) located below ground level.
The results of the surveys conducted on Vulcano island in 2019 and 2020 exhibit agreement with previous findings concerning spatial variations in soil CO2 emissions at Vulcano Porto. These investigations have identified a persistent anomalous degassing zone at Faraglione, where CO2 has volcanic origin [17,18,23,24,66,86]. However, there may be significant variations in gas hazards due to variations in magma degassing at depth. As a result, the strategic implementation of land use planning can effectively mitigate human exposure to volcanic hazards. It is important to note that a comprehensive approach to risk management demands the continuous monitoring of φCO2 and a thorough understanding of its implications for fluctuations in outdoor CO2 concentrations [35]. A sensor alarm system for monitoring gas hazards within buildings is useful when the CO2 hazard primarily involves the local φCO2. However, the overall gas hazard at Vulcano Porto involves φCO2 and gas plume emitted through both the crater area and the areas near the anomalous degassing zones (e.g., Vasca). A continuous monitoring of outdoor air CO2 concentrations allows to distinguish site-specific effects caused by diffuse degassing from a potentially more hazardous increase in outdoor CO2 concentrations across the Vulcano Porto area.
From a practical point of view, if certain sectors of the monitoring area may be affected by escalated gas hazards due to increased volcanic outgassing (i.e., as observed since September 2021), a recommended response from risk management stakeholders could involve temporarily relocating the population from zones with elevated outdoor air CO2 concentrations to areas on the island less affected by volcanic gas emissions. According to [88], the costs related to a partial evacuation of the island of Vulcano prior to a volcanic eruption surpass those associated with a complete evacuation after an eruption onset. However, the gas hazard remains a vital volcanic risk factor in all levels of volcanic activity, though eruptive activity is not involved.
It is worth nothing that individuals spend considerable time in buildings, particularly during winter. Few buildings are currently equipped with gas detection sensors, alarms, proper ventilation system, or electrical tools for producing artificial turbulence to mitigate gas hazards. The hazard threshold value for outdoor air CO2 concentration in this study adheres to the European directive of 5000 ppm vol, although several countries set-up more restrictive values in environments widely used by children (i.e., schools). However, it should be noted that the CO2 concentration values included in [42] are set for the workplace in the event that the exposed subjects are aware of the hazard and can provide an autonomous response to exposure to CO2 emissions. This is not necessarily the case for homes built in gas-exposed areas. For example, at night, when occupants are less vigilant and elderly or children, the concentration values given in the guidelines may be insufficiently conservative. Furthermore, individual countries transpose these guidelines differently, often adopting concentration values < 5000 ppm vol based on their assessments [78,79,80].

5.2. Continuous Monitoring of φCO2 and Outdoor Air CO2 Concentration at Faraglione Zone

Synchronous measurements of outdoor air CO2 concentration at two different heights above the ground allow studying the dispersion of volcanic gas in the lower layers of the atmosphere. Figure 5 shows some site-specific differences in the vertical evolution of CO2 concentration. At the Carapezza and Rojas sites, the air at 20 cm altitude has CO2 concentration values that are nearly 200 ppm vol and 400 ppm vol higher, respectively, than the values measured at 150 cm above the ground. The CO2 concentration at 150 cm was only higher than the value measured at 20 cm a few times. The development of negative air CO2 concentration differences (i.e., ΔCO2 = CO2 (20 cm) − CO2 (150 cm)) indicates CO2 uptake from the highest level of the atmosphere at Vulcano Porto, possibly as an effect of volcanic crater plume spreading. The vertical difference at the Castello site (Figure 5b) was an order of magnitude higher than the difference in air CO2 concentration at the Porto site (Figure 5c).
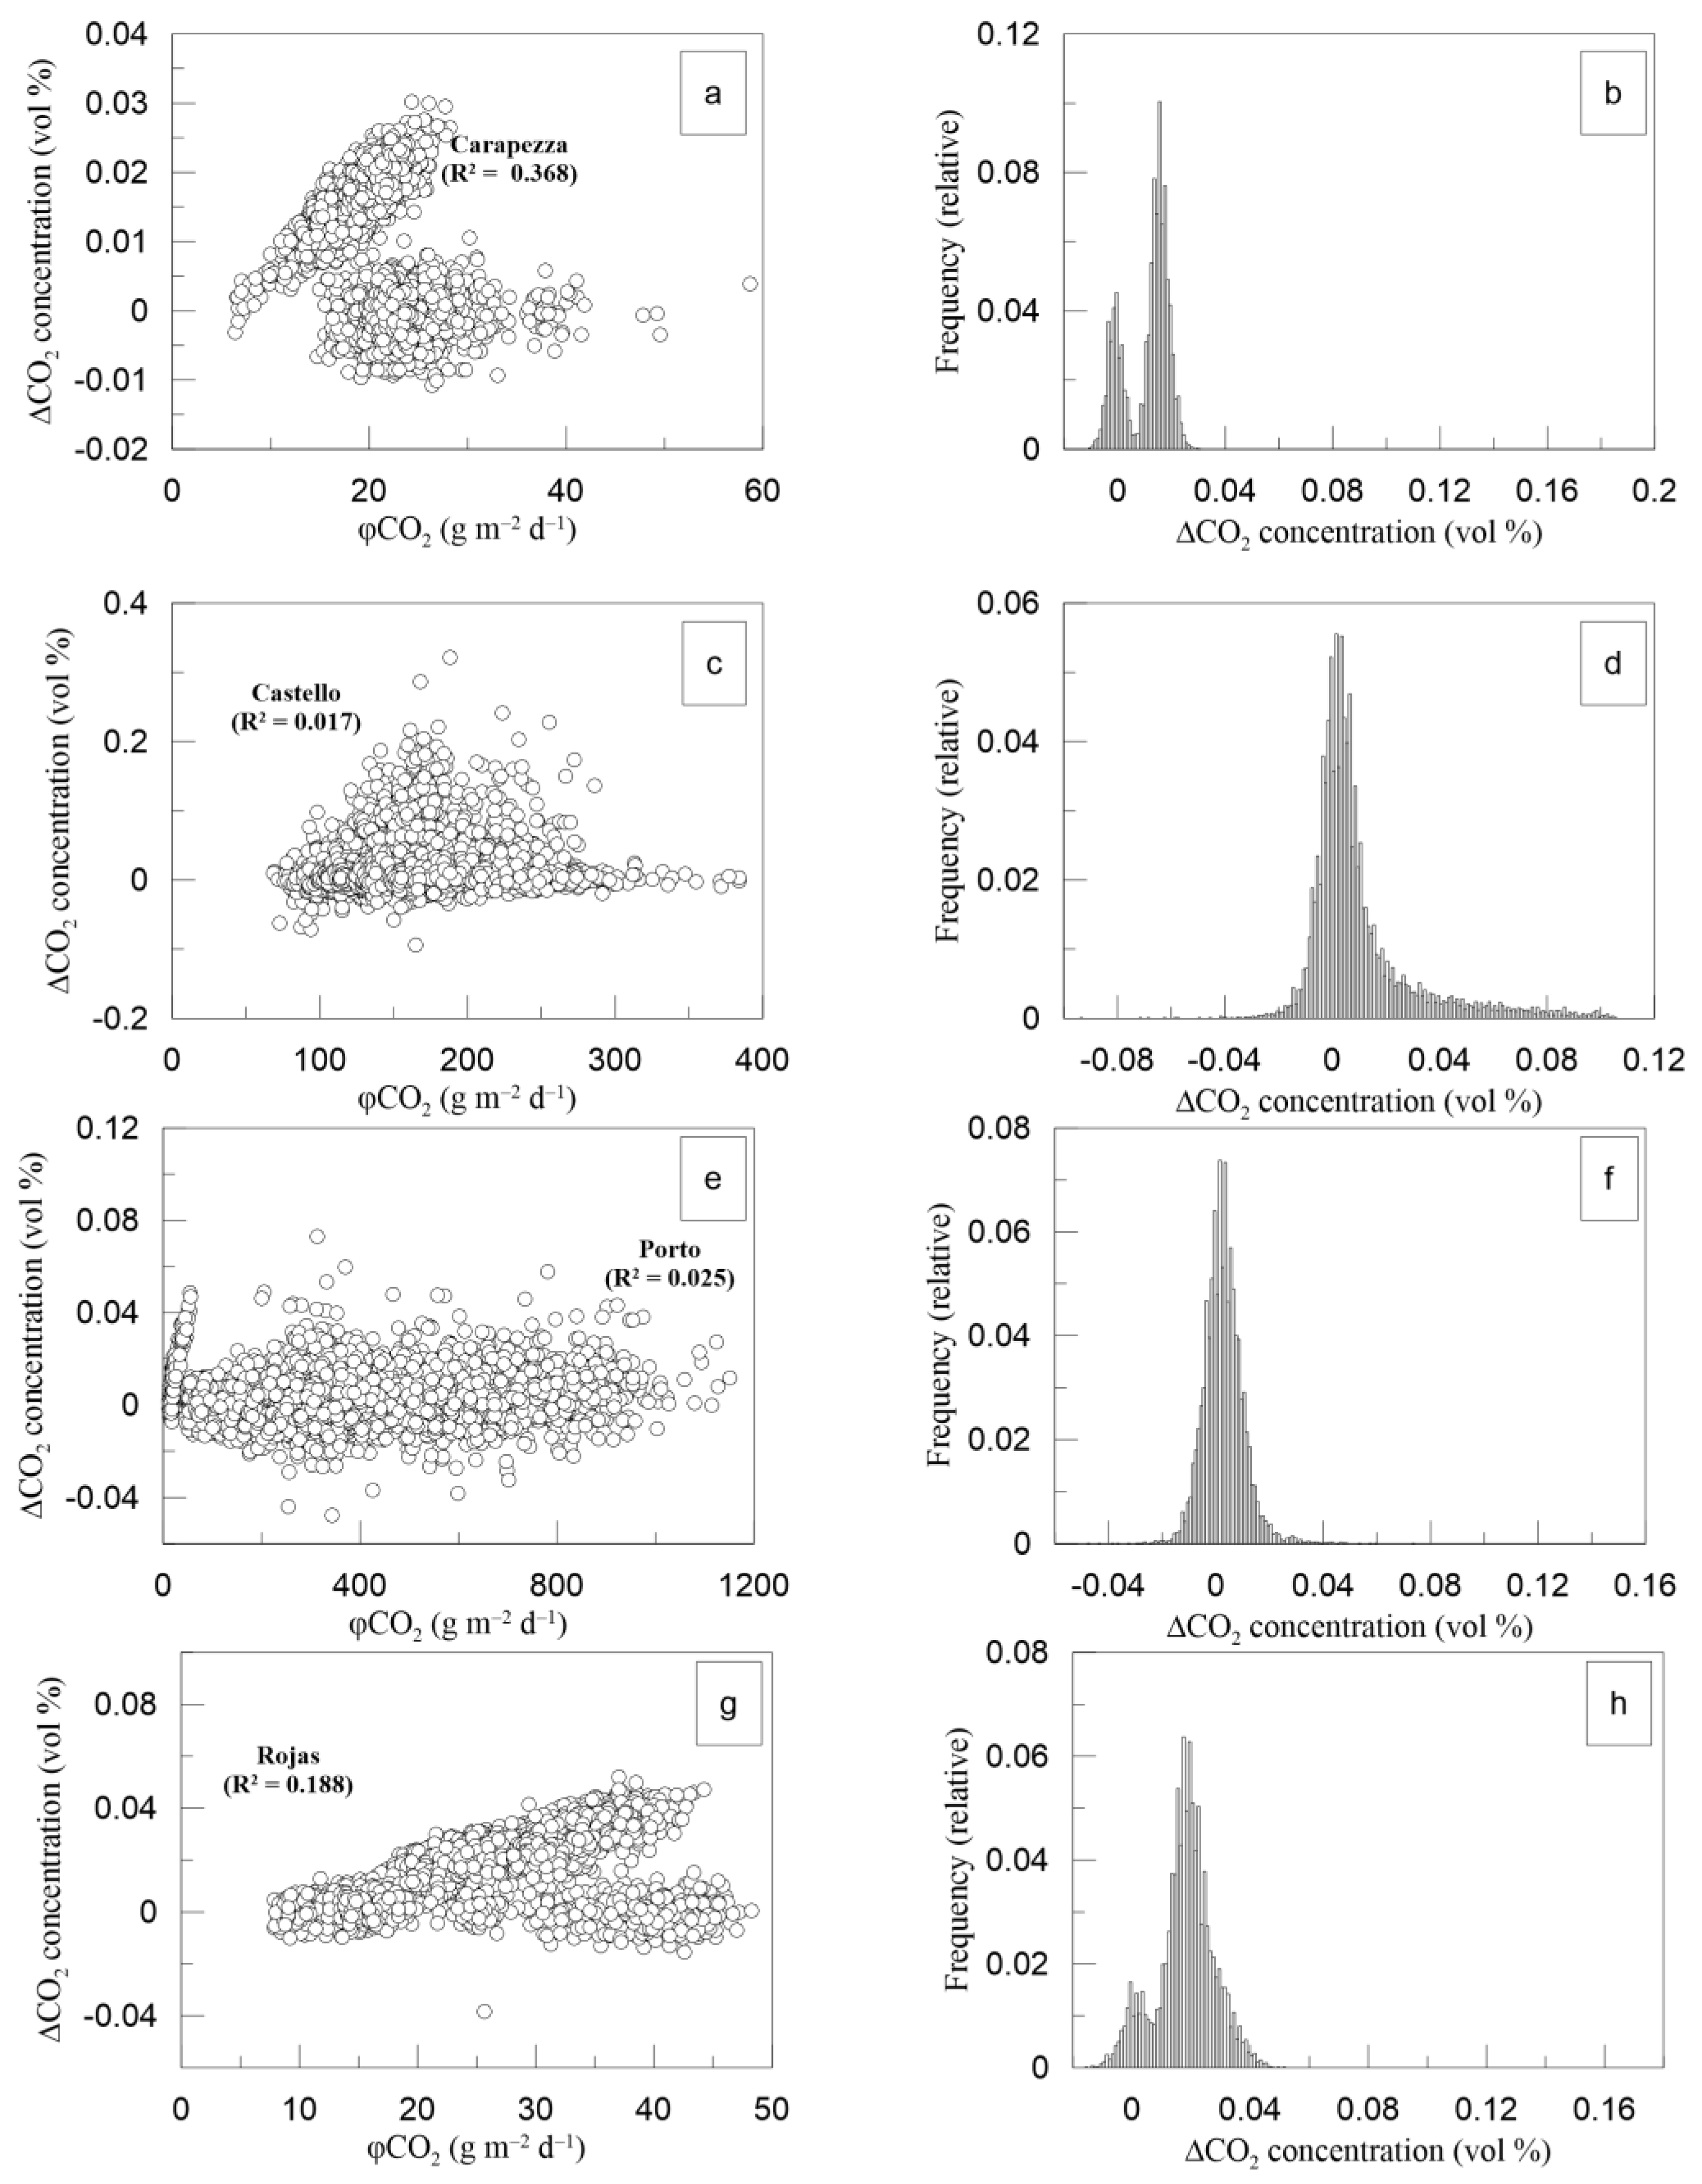
These observations suggest that diffuse degassing is capable of inducing chemical layering within the lower strata of the atmosphere, as the influx of volcanic CO2 leads to its accumulation in proximity to the ground. It can be inferred that this atmospheric stratification fosters the establishment of a vertical concentration gradient, which is linked to φCO2 measured at each specific site and is disrupted by turbulent air motions. A correlation test can help quantify the extent of correlation between CO2 concentration differences and φCO2 (Figure 7). The results of this test highlight a weak correlation between ΔCO2 and φCO2 and a variety of patterns in the magnitude distribution with respect to height above ground (i.e., either positive or negative values by calculating the differences in CO2 concentration measured at 20 cm and 150 cm above ground, respectively). The magnitudes of outdoor air CO2 concentration in air at both Porto and Castello (Figure 5) are an order of magnitude higher than the theoretical background for CO2 in air (i.e., ~417 ppm vol, average values calculated from June 2021 to December 2022 from the records of Mauna Loa Observatory [89]), and the vertical CO2 concentration differences are independent of φCO2 at both sites (Figure 7c–e, respectively).
The distributions of gradient magnitude for both Porto and Castello have peaks around the zero gradient (i.e., median values are 0.002 and 0.005 vol%, respectively) and have positive tails (i.e., skewness of the distributions of gradient magnitude are 0.755 and 3.146, respectively). This result shows that air CO2 concentration has a negative correlation with height above ground, indicating a measurable effect of volcanic CO2 dispersion in the air. Therefore, the gas hazard at these sites is high due to the high outdoor air CO2 concentration and is almost independent of site-specific φCO2. Indeed, both stations are installed near surface manifestations of the volcanic/hydrothermal system on Vulcano Island (i.e., Vasca mud pools and various steaming ground zones at Faraglione). Anomalous emissions of CO2 from the soil and fumaroles in this area cause high values of CO2 concentration in the outdoor air compared to the theoretical background and affects the gas hazard at Faraglione (i.e., the anomalous degassing zone, as shown in Figure 1). Other environmental variables (e.g., wind speed, air temperature, and atmospheric pressure) can foster an increase in the outdoor air CO2 concentration. Therefore, Faraglione is the zone with the most serious volcanic gas hazard, regardless of variations in volcanic degassing (i.e., variations in φCO2 of volcanic origin). The additional sites examined beyond the anomalous degassing zone of Faraglione (i.e., the Carapezza and Rojas stations) exhibit a more complex correlation with φCO2.

5.3. Identification of the Environmental Conditions Promoting Elevated CO2 Hazard

5.3.1. Cluster Analysis

The results of the cluster analysis for the datasets collected from the monitoring stations show that at least two subclusters can be distinguished for Carapezza, Castello, and Rojas, while the application of a clustering method to the Porto station dataset yielded only one cluster. Cluster-1 in the Carapezza site dataset has a range for air CO2 concentration of 0.037–0.080 vol% and 0.02–0.06 vol% at the heights of 20 cm and 150 cm above the ground, respectively (Table 2).
The φCO2 for Cluster-1 is <25 g m−2 d−1. Cluster-2 has a small range for air CO2 concentration (0.01–0.05 vol% for both heights above ground) and includes φCO2 values from 15 to 58 g m−2 d−1. Cluster analysis results for the dataset collected at Castello show that Cluster-1 has a wider range for outdoor air CO2 concentration at 20 cm above ground level than outdoor air CO2 concentration at 150 cm (i.e., 0.09–0.4 vol% and 0.08–0.25 vol%, respectively) and that φCO2 has values (i.e., from 100 to 280 g m−2 d−1) that are an order of magnitude greater than φCO2 at the Carapezza site. Cluster-2 for the Castello dataset shows a similar range for air CO2 concentration compared to Carapezza at both heights above ground, while the range of φCO2 is larger (i.e., from 80 to 380 g m−2 d−1), consistent with the Castello location which lies in the anomalous degassing zone, while the Carapezza site can be considered a background reference for φCO2 on Vulcano, outside the Faraglione anomalous degassing zone.
Cluster-1 for the Rojas site shows an intermediate range of air CO2 concentrations between those observed at the Carapezza and Castello sites, for both measurements at 20 cm and 150 cm above ground level (Table 2). Cluster-2 at the Rojas, Castello, and Carapezza sites shows a smaller range of CO2 concentration in air than Cluster-1 at each site, while the range of φCO2 is larger at all sites except the Rojas site.

5.3.2. Correlations between Air CO2 Concentration and φCO2

Classification of the dataset using cluster analysis allows an in-depth study of the effects of φCO2 on outdoor air CO2 concentrations at different heights above the ground and allows some inferences about environmental variables affecting gas hazards at Vulcano Porto. The slopes of the best fit indicate the relationship between outdoor air CO2 concentrations and φCO2 at different clusters, allowing quantification of its effects on the atmospheric dispersion of volcanic CO2. A comprehensive analysis of the correlation between outdoor air CO2 concentration and φCO2 (Figure 8) shows that Cluster-1 has generally greater slopes than Cluster-2 for all stations.
Moreover, the slopes of the fit lines for the dataset collected at 20 cm above ground level were almost an order of magnitude higher than the slopes at 150 cm above ground level. All stations exhibit these patterns, regardless of whether the particular measurement location of each station is inside or outside the anomalous degassing zone. These findings show that even a minor rise in φCO2 resulting from intensified magma degassing at depth can foster a remarkable increase in outdoor air CO2 concentration and, thus, increases the gas hazard. The closer the atmospheric layer is to the ground, the greater the influence of φCO2 on the CO2 concentration in the outdoor air. The φCO2 significantly affected the CO2 concentration in outdoor air at a height of 20 cm at both Rojas and Carapezza sites, while the correlation between CO2 concentration and φCO2 is more than an order of magnitude lower at Faraglione (i.e., Porto and Castello sites). Air turbulence helps to smooth vertical differences in air CO2 concentrations by disturbing stratification in the ground-level planetary boundary layer (PBL), especially during daytime hours [9,11,46]. When either hot or less dense air is rising or winds are blowing at high speeds (i.e., >~3 m s−1), turbulent motions prevent chemical stratification in the lower layers of the atmosphere. Whether the gas hazard increases or decreases depends on the φCO2 value. In the anomalous degassing zones where the φCO2 value is high (i.e., φCO2 > ~100 g m−2 d−1), considering a widely used threshold to distinguish anomalous CO2 emissions from the soil from soil respiration [81,82,83] and turbulent motions of the air reduce the concentration differences and result in a nearly uniform CO2 concentration value in the outdoor air. Although the concentration differences may be modest, the absolute concentration of outdoor air CO2 can exhibit a homogeneity at elevated levels. Under these conditions, the outdoor air CO2 concentrations can reach levels above the threshold recommended by health authorities (i.e., 5000 ppm vol according [42,43,44]) at least at heights below 150 cm above the ground, increasing the gas hazard. When φCO2 values are lower compared to those of the anomalous degassing zone (i.e., φCO2 << ~100 g m−2 d−1), turbulent motions reduce both the vertical differences and the maximum values of CO2 concentration in air, which has never reached a value > 5000 ppm vol. It is noteworthy that in the anomalous degassing zone (e.g., at the Porto and Castello sites, where φCO2 in some cases can reach ~100 g m−2 d−1) the CO2 concentration in outdoor air hardly depends on φCO2 variations and can be at a high due to the dispersion of the volcanic CO2 emitted by fumaroles or mud pools (e.g., Vasca mud pool).
Turbulent motions play a crucial role in CO2 dispersion and gas hazard evolution, especially where soils release large amounts of CO2 into the atmosphere [90,91,92,93]. A reduction in atmospheric turbulence can lead to less mixing of the air, creating the most favorable conditions for atmospheric stratification near the ground. These conditions are easily established on Vulcano Porto, which lies on the floor of a caldera (i.e., the La Fossa caldera, a valley bounded by the Lentia Mountains to the west and the La Fossa cone to the east). The development of atmospheric stratification during periods of low air turbulence can foster a gradual outdoor air CO2 accumulation, and gas hazard rise [11,46,93].

5.4. Variations of the Gas Hazard during 2021–2022

The results of the on-site investigation in 2019 and 2020 on Vulcano are consistent with those of previous studies [17,18,21,23,24,26,32,66,74] and show that the positions of the anomalous degassing zones have not changed over time. Faults and fractures form few zones of high permeability in the volcanic edifice, which provide a preferential pathway for ascending gases [86,87]. High φCO2 values were observed in the fall of 2021 in an extensive area of Vulcano Porto that includes Lentia and much of the floor of the La Fossa caldera [11,45,46,48,67]. The resumption of volcanic activity on Vulcano consisted of a remarkable increase in the outlet temperature of fumarolic gases, changes in the chemical and isotopic composition of major and trace components in volcanic emissions, variations in the temperature and chemistry of thermal groundwater, and an increase in φCO2 [45,46,47,48,49]. This period of unrest is currently ongoing and has been attributed to an increase in magma degassing at depth [11,45,47,48,49,50], creating the most favorable conditions for an increase in volcanic gas hazard.
Since early summer 2021, four automatic stations have been installed on Vulcano for the integrated monitoring of volcanic degassing of CO2 and its effects on the air. Therefore, most of the dataset discussed in this study relates to the period of the crisis that began in late summer 2021 [45,46,47,48,49,50]. Throughout the period from June 2021 to December 2022, the network was used to monitor φCO2 and outdoor air CO2 concentrations at two altitudes above the ground. Atmospheric turbulence resulting from the integrated effects of atmospheric pressure, air temperature, and wind had a crucial influence on the dispersion of CO2 emissions and, consequently, on the concentration of CO2 in the outdoor air. The latter parameter serves as the primary driver of the gas hazard at Vulcano Porto. Continuous monitoring of φCO2 played a pivotal role in monitoring the variations in volcanic degassing at Vulcano during the observation time window [48,85]. Remarkable variations in φCO2 were observed between October 2021 and December/January 2022, as well as from April to October 2022, particularly in locations distanced from the persistent anomalous degassing area at Faraglione (e.g., Figure 4 for the Carapezza and Rojas sites). While the available time span does not facilitate the establishment of a baseline value for each station, recent studies provide clear evidence of substantial volcanic CO2 input into the Vulcano degassing system [45,46,47,48,49,50,85]. During the initial part of the aforementioned periods, the φCO2 value exhibited an increase, likely attributable to a notable increase in magma degassing from depth [45,46,47,48,49,50,76,77,85]. Another indication of increased volcanic activity at depth < 15 km were two earthquakes of magnitude ML > 2 that occurred on 19 and 30 October 2021 (ML 2.5 at a depth 12 km and ML 2.0 at a depth 4 km, respectively). However, since spring 2022 (Figure 4), a sustained increase in φCO2 began when the increase in submarine degassing affected Levante beach and caused a significant discoloration of seawater due to the precipitation of white insoluble sulfate minerals on the seafloor. On 10 April 2022, an earthquake of magnitude ML 2.1 occurred at a depth of 6 km and was located almost 4.6 km SE from La Fossa crater on the southeast coast of Vulcano Island. In fact, both monitoring sites near Faraglione (i.e., Porto and Castello) show persistently high levels of φCO2. Steaming ground are common surface manifestations of volcanic activity in this zone, and an increase in volcanic CO2 was observed during the monitoring period. The φCO2 value nearly doubled from October 2021 to March 2022 at both the Castello and Porto sites, mirroring the increased magma degassing at depth that caused volcanic unrest on Vulcano [45,46,47,48,49,50]. A further increase in φCO2 began at the Castello site in late summer 2022, and a transient increase in φCO2 that is still continuing at this site caused significant φCO2 variations (i.e., fluctuations in soil CO2 emissions from φCO2 = ~100 g m−2 d−1 to φCO2 = ~250 g m−2d−1 with several peaks at φCO2 > ~350 g m−2 d−1). During this period, a transient increase occurred at the Porto site from φCO2 = ~200 g m−2 d−1 to φCO2 = ~400 g m−2 d−1. In Faraglione and the surrounding areas, φCO2 shows significant lateral variations when volcanic degassing from magmatic/hydrothermal degassing is low. These fluctuations recorded in the recent years [45,92] are larger and more noticeable during periods of unrest, such as throughout 2021–2022 [45], when either the hydrothermal system or magma at depth releases large amounts of CO2 to the atmosphere from the degassing of crater plumes and soils.
Variations in φCO2 had a remarkable impact on the CO2 concentration in the outdoor air and, consequently, on the evolution of the gas hazard on Vulcano during the whole period of the 2021–2022 unrest. The civil defense authorities (i.e., the Italian Department of Civil Protection—DPC and Department of Civil Protection of Sicily—DPCR) have not yet lowered the alert code for Vulcano to the green level because several volcano monitoring parameters are still above background levels at the time of publication of this article (i.e., the temperature, chemistry, and isotopic composition of fumarolic gas, as reported in the weekly INGV bulletins, which are available at https://cme.ingv.it/bollettini-e-comunicati/bollettini-settimanali-vulcano, accessed on 21 August 2023). Thus, the gas hazard at Faraglione is still evolving. As shown by the data collected at the Porto and Castello sites, the gas hazard is high in the zones close to the surface manifestation of volcanic activity (i.e., Vasca mud pool, Levante beach, and Faraglione fumaroles/steaming grounds). Although the outdoor air CO2 concentration did not achieve values > 5000 ppm vol during the whole observation period at Castello and Porto sites (Figure 5), the vertical differences in outdoor air CO2 concentration are small, especially at Porto station. These results indicate that air turbulence can homogenize the atmospheric layers near the ground, but does not lead to dilution of CO2 because the outdoor air CO2 concentration is at a high throughout the surrounding area. In these zones, a combination of local φCO2 and plume dispersal from fumaroles at Levante beach, Faraglione, and Vasca lead to high outdoor air CO2 concentrations (e.g., CO2 concentration > 1000 ppm vol), and the gas hazard.
Remarkable variations also occurred near the anomalous degassing zone throughout the time window of observations. The outdoor air CO2 concentration at Rojas was above the value of 1000 ppm vol recommended by Italian Istituto Superiore di Sanità [78], although the outdoor air CO2 concentration has never reached values > 5000 ppm vol [42,43,44]. This result was frequently observed at a height of 20 cm above the ground, while the air CO2 concentration rarely exceeded this value at a height of 150 cm. Accordingly, the vertical difference in air CO2 concentration at this site averaged nearly 0.02 vol%. From October 2021 to the end of June 2022, the average difference in air CO2 concentration at this site doubled to 0.04 vol%. Air CO2 concentrations were generally lower at the Carapezza site than at the Rojas site because it is far enough away from the crater cone and the Faraglione area. Therefore, outdoor air CO2 concentrations measured at this site are considered as a reference for background outdoor air CO2 at Vulcano Porto, especially during the quiescent phase of volcanic activity. In fact, remarkable φCO2 fluctuations also occurred at the Carapezza site after the onset of volcanic unrest in 2021, as shown through discontinuous measurements of both φCO2 and the carbon isotope composition of the soil CO2 [45]. The value of CO2 concentration in outdoor air never exceeded the threshold of 5000 ppm vol at both measurement heights above ground. Although the outdoor air CO2 concentration reached 800 ppm vol a few times from October to November 2021, the gas hazard was lowest at the Carapezza site compared to the other measurement sites.
The results of continuous monitoring of φCO2 and outdoor air CO2 concentrations suggest that the gas hazard at Vulcano is an interaction of volcanic degassing, air circulation, weather variables, and probably plant photosynthesis [11,46]. The combination of these variables can lead to chemical stratification of the atmosphere near the ground and create a variety of conditions favorable to gas hazards.
The implementation of the gas hazard monitoring network on Vulcano occurred several weeks before the onset of a volcanic unrest in 2021, which is still ongoing at the time of publication of this article. Continuous φCO2 monitoring results showed an increase in φCO2 that correlated with variations in magma degassing at depth. Notable variations in φCO2 occurred from September to December 2021, and a corresponding increase in outdoor air CO2 concentrations was observed at all monitoring sites. These results indicate a significant increase in gas hazards over a large area of Vulcano Porto. From April 2022 to September 2022, a further increase in the gas hazard occurred due to the increase in φCO2 and outdoor air CO2 concentrations that began a few weeks before the increase in submarine degassing at Levante beach.

6. Conclusions

This study addresses the implementation of a network of automatic stations for the continuous monitoring of φCO2 and outdoor air CO2 concentrations to monitor the gas hazards on the island of Vulcano, Italy. The Vulcano Porto area was selected because it is most vulnerable to various volcanic hazards due to high human exposure, especially during the summer, when thousands of tourists visit Vulcano Island for its priceless natural and scenic heritage.
The results of two soil gas surveys, conducted in 2019 and 2020, respectively, showed a remarkable φCO2 in the area near Faraglione. Both surveys were conducted during a period of quiet fumarolic-solfataric activity, and the total CO2 output was almost indistinguishable when calculated for the same study area (i.e., 85 t d−1 and 87 ton d−1 in May 2019 and March 2020, respectively). However, remarkable differences in the spatial variations of φCO2 were observed in the investigated area (i.e., the A, B, and C areas). The results of these surveys show that gas hazards can evolve in different zones of Vulcano Porto, although volcanic degassing does not change. φCO2 affects air CO2 concentrations both outdoors and indoors. Turbulent air movement and weather variables (i.e., air temperature, atmospheric pressure, and wind) reduce the outdoor gas hazards, especially during a period of quiet fumarolic-solfataric degassing. However, indoor air CO2 concentrations in anomalous degassing zones (e.g., Faraglione) can reach levels above 0.5 percent by volume. This threshold, recommended by health authorities, can persist for some minutes, based on the φCO2 value at each site (i.e., ~10 min on average). A sensor-alarm system allows monitoring localized CO2 hazards within buildings. However, at Vulcano Porto, the broader gas hazard involves both φCO2 and emitted gas plumes. Monitoring outdoor CO2 concentrations distinguishes site-specific effects from potential hazardous increases. If certain areas face escalated gas hazards due to volcanic outgassing, temporary population relocation to less affected zones on the island is preferred. Partial pre-eruption evacuations’ costs exceed post-eruption evacuations’, yet the gas hazard remains significant across volcanic activity levels.
The implementation of the on-site gas hazard monitoring network began in June 2021 and record measurements began after a period of on-site testing. Since late summer 2021, Vulcano has experienced notable variations in volcanic degassing. This period of volcanic unrest is ongoing and is associated with an increase in magma degassing at depth. The φCO2 increase affected the outdoor air CO2 concentration during both periods, from September 2021 to December 2021 and from June 2022 to September 2022. Variations in the outdoor air CO2 concentration were observed at both the Rojas and Carapezza sites, which are far from the Faraglione anomalous degassing zone. However, outdoor air CO2 concentration did not exceed the 5000 ppm vol threshold at both Porto and Castello, two sites close to the surface manifestation of volcanic/hydrothermal activity on Vulcano. Therefore, the air CO2 concentration in the anomalous degassing zones is quite independent of φCO2, since its value is permanently high. Far from the anomalous degassing zones, φCO2 has variable effects on outdoor air CO2 concentration under unfavorable environmental conditions, even at φCO2 < ~50 g m−2 d−1. For instance, employing equations derived from the fitted regression lines specific to Cluster-1 at both the Carapezza and Rojas sites, the CO2 concentration in the outdoor air, measured at a height of 20 cm, reaches concentrations exceeding 1000 ppm volume when the φCO2 falls within the range of 40–50 g m−2 d−1. What is noteworthy is the fact that this concentration value corresponds to a threshold endorsed by the Italian Istituto Superiore di Sanità [78], although it remains below the threshold value of 5000 ppm volume established by Commission Directive 2006/15/EC [42]. Thus, remarkable variations in gas hazard occurred at Vulcano due to an increase in both φCO2 and outdoor air CO2 concentration. When volcanic degassing resumed in 2021, the gas hazard increased throughout the study area. Otherwise, the gas hazard remained at a high level during a period of comparatively low volcanic degassing in the Faraglione anomalous degassing zone.
The volcanic degassing unrest at Vulcano was a suitable case study for monitoring the evolution of gas hazards in the inhabited zones of a volcanic island. The results of this experimental study show that the integrated monitoring of φCO2, outdoor air CO2 concentration, and weather variables is useful for suggesting appropriate measures to mitigate the gas hazard and thus reduce volcanic risk dependent on volcanic gas emissions. In a comprehensive perspective of updating the current volcano monitoring infrastructures, the gas hazard monitoring network can be further improved either by adding some new stations or by updating the ground CO2 flux stations already deployed at Vulcano.

Supplementary Materials

The following supporting information can be downloaded at: https://www.mdpi.com/article/10.3390/geosciences13090266/s1, Figure S1: Environmental variables.

Author Contributions

Conceptualization, S.G. and R.M.R.D.M.; methodology, S.G., M.C. and R.M.R.D.M.; software, S.G. and R.M.R.D.M.; validation, S.G. and R.M.R.D.M.; formal analysis, R.M.R.D.M.; investigation, S.G., M.C., R.M.R.D.M. and V.F.; resources, R.M.R.D.M.; data curation, S.G. and R.M.R.D.M.; writing—original draft preparation, R.M.R.D.M.; writing—review and editing, S.G. and M.C.; visualization, R.M.R.D.M.; supervision, R.M.R.D.M.; project administration, S.G.; funding acquisition, S.G. All authors have read and agreed to the published version of the manuscript.

Funding

This research was funded by Dipartimento di Protezione Civile—Convenzione DPC-INGV 2019–2021 All.B2, WP Vulcani, Task 16; Scientific Advisor and Project Manager: Sergio Gurrieri.

Data Availability Statement

The authors declare that the data discussed in this paper can be made available on request.

Acknowledgments

This study has benefited from funding provided by the Italian Presidenza del Consiglio dei Ministri—Dipartimento della Protezione Civile (DPC)—Convenzione DPC-INGV 2019–2021 All.B2, WP Vulcani, Task 16. This paper does not necessarily represent DPC official opinion and policies. The authors would thank two anonymous reviewers for their constructive comments and suggestions, which greatly improved the previous draft of the manuscript.

Conflicts of Interest

The authors declare no conflict of interest. The funders had no role in the design of the study; in the collection, analyses, or interpretation of data; in the writing of the manuscript; or in the decision to publish the results.

References

  1. Wallace, P.; Anderson, A.T. Volatiles in magmas. In Haraldur Sigurdsson, The Encyclopedia of Volcanoes, 1st ed.; Academic Press: Cambridge, MA, USA, 2000; ISBN 9780080547985. [Google Scholar]
  2. Burton, M.R.; Sawyer, G.M.; Granieri, D. Deep Carbon Emissions from Volcanoes. Rev. Mineral. Geochem. 2013, 75, 323–354. [Google Scholar] [CrossRef]
  3. Werner, C.; Fischer, T.; Aiuppa, A.; Edmonds, M.; Cardellini, C.; Carn, S.; Allard, P. Carbon Dioxide Emissions from Subaerial Volcanic Regions: Two Decades in Review. In Deep Carbon: Past to Present; Orcutt, B., Daniel, I., Dasgupta, R., Eds.; Cambridge University Press: Cambridge, UK, 2019; pp. 188–236. [Google Scholar]
  4. Denman, K.L.; Brasseur, G.; Chidthaisong, A.; Ciais, P.; Cox, P.M.; Dickinson, R.E.; Hauglustaine, D.; Heinze, C.; Holland, E.; Jacob, D.; et al. Couplings Between Changes in the Climate System and Biogeochemistry. In Climate Change 2007: The Physical Science Basis. Contribution of Working Group I to the Fourth Assessment Report of the Intergovernmental Panel on Climate Change; Solomon, S., Qin, D., Manning, M., Chen, Z., Marquis, M., Averyt, K.B., Tignor, M., Miller, H.L., Eds.; Cambridge University Press: Cambridge, UK; New York, NY, USA, 2007. [Google Scholar]
  5. Giorgi, F. Climate change hot-spots. Geophys. Res. Lett. 2006, 33, L08707. [Google Scholar] [CrossRef]
  6. Di Martino, R.M.R.; Capasso, G. Fast and accurate both carbon and oxygen isotope determination in volcanic and urban gases using laser-based analyzer. Geophys. Res. Abstr. 2019, 21, EGU2019-5095. [Google Scholar]
  7. Fawzy, S.; Osman, A.I.; Doran, J.; Rooney, D.W. Strategies for mitigation of climate change: A review. Environ. Chem. Lett. 2020, 18, 2069–2094. [Google Scholar] [CrossRef]
  8. Di Martino, R.M.R.; Capasso, G. On the complexity of anthropogenic and geological sources of carbon dioxide: Onsite differentiation using isotope surveying. Atm. Environ. 2021, 2556, 118446. [Google Scholar] [CrossRef]
  9. Di Martino, R.M.R.; Gurrieri, S. Theoretical principles and application to measure the flux of carbon dioxide in the air of urban zones. Atm. Environ. 2022, 288, 119302. [Google Scholar] [CrossRef]
  10. Zhang, L.; Guo, Z.; Sano, Y.; Zhang, M.; Sun, Y.; Cheng, Z.; Yang, T.F. Flux and genesis of CO2 degassing from volcanic-geothermal fields of Gulu-Yadong rift in the Lhasa terrane, South Tibet: Constraints on characteristics of deep carbon cycle in the India-Asia continent subduction zone. J. Asian Earth Sci. 2017, 149, 110–123. [Google Scholar] [CrossRef]
  11. Di Martino, R.M.R.; Gurrieri, S. The effects of volcanic degassing on the air composition revealed by stable isotope surveys. Misc. INGV 2022, 70, 1340. [Google Scholar] [CrossRef]
  12. Camarda, M.; De Gregorio, S.; Gurrieri, S. Magma–ascent processes during 2005-2009 at Mt Etna inferred by soil CO2 emissions in peripheral areas of the volcano. Chem. Geol. 2012, 330–331, 218–227. [Google Scholar] [CrossRef]
  13. Di Martino, R.M.R.; Camarda, M.; Gurrieri, S.; Valenza, M. Continuous monitoring of hydrogen and carbon dioxide at Mt Etna. Chem. Geol. 2013, 357, 41–51. [Google Scholar] [CrossRef]
  14. Liuzzo, M.; Gurrieri, S.; Giudice, G.; Giuffrida, G. Ten years of soil CO2 continuous monitoring on Mt. Etna: Exploring the relationship between processes of soil degassing and volcanic activity. Geochim. Geophys. Geosys. 2013, 14, 2886–2899. [Google Scholar] [CrossRef]
  15. Di Martino, R.M.R.; Camarda, M.; Gurrieri, S.; Valenza, M. Asynchronous changes of CO2, H2 and He concentrations in soil gases: A theoretical model and experimental results. J. Geophys. Res. Solid Earth. 2016, 121, 1565–1583. [Google Scholar] [CrossRef]
  16. Di Martino, R.M.R.; Camarda, M.; Gurrieri, S. Continuous monitoring of hydrogen and carbon dioxide at Stromboli volcano (Aeolian Islands, Italy). Ital. J. Geosci. 2021, 141, 79–94. [Google Scholar] [CrossRef]
  17. Badalamenti, B.; Gurrieri, S.; Hauser, S.; Parello, F.; Valenza, M. Soil CO2 output in the island of Vulcano during the period 1984–1988: Surveillance of gas hazard and volcanic activity. Rend. Soc. It. Miner. Petrol. 1988, 43, 893–899. [Google Scholar]
  18. Badalamenti, B.; Gurrieri, S.; Hauser, S.; Parello, F.; Valenza, M. Change in the soil CO2 output at Vulcano during the summer. Acta Vulcanol. 1998, 1, 219–221. [Google Scholar]
  19. Barberi, F.; Neri, G.; Valenza, M.; Villari, L. 1987–1990 unrest at Vulcano. Acfa Volcanol. 1991, 1, 95–106. [Google Scholar]
  20. Giammanco, S.; Gurrieri, S.; Valenza, M. Soil CO2 degassing along tectonic structures of Mt. Etna Sicily: The Pernicana Fault. Appl. Geochem. 1997, 12, 429–436. [Google Scholar] [CrossRef]
  21. Diliberto, I.S.; Gurrieri, S.; Valenza, M. Relationships between diffuse CO2 emissions and volcanic activity on the island of Vulcano (Aeolian Islands, Italy) during the period 1984–1994. Bull. Volcanol. 2002, 64, 219–228. [Google Scholar] [CrossRef]
  22. Giammanco, S.; Inguaggiato, S.; Valenza, M. Soil and fumarole gases of Mount Etna: Geochemistry and relations with volcanic activity. J. Volcanol. Geoth. Res. 1998, 81, 297–310. [Google Scholar] [CrossRef]
  23. Granieri, D.; Carapezza, M.L.; Chiodini, G.; Avino, R.; Caliro, S.; Rinaldi, M.; Ricci, T.; Tarchini, L. Correlated increase in CO2 fumarolic content and diffuse emission from La Fossa crater (Vulcano, Italy): Evidence of volcanic unrest or increasing gas release from a stationary deep magma body? Geoph. Res. Lett. 2006, 33, L13316. [Google Scholar] [CrossRef]
  24. Di Martino, R.M.R.; Capasso, G.; Camarda, M.; De Gregorio, S.; Prano, V. Deep CO2 release revealed by stable isotope and diffuse degassing surveys at Vulcano (Aeolian Islands) in 2015–2018. J. Volcanol. Geotherm. Res. 2020, 401, 106972. [Google Scholar] [CrossRef]
  25. Viveiros, F.; Chiodini, G.; Cardellini, C.; Caliro, S.; Zanon, V.; Silva, C.; Rizzo, A.; Hipólito, A.; Moreno, L. Deep CO2 emitted at Furnas do Enxofre geothermal area (Terceira Island, Azores archipelago). An approach for determining CO2 sources and total emissions using carbon isotopic data. J. Volcanol. Geoth. Res. 2020, 401, 106968. [Google Scholar] [CrossRef]
  26. Di Martino, R.M.R.; Capasso, G.; Camarda, M.; De Gregorio, S.; Prano, V. Evidence of a new gas input of deep origin at Vulcano (Aeolian Islands) observed in the shallow groundwater and soil gas emissions. Miscellanea INGV 2020, 52, 200–201. [Google Scholar]
  27. Allard, P.; Carbonnelle, J.; Dajlevic, D.; Le Bronec, J.; Morel, P.; Robe, M.C.; Maurenas, J.M.; Faivre-Pierret, R.; Martin, D.; Sabroux, J.C.; et al. Eruptive and diffuse emissions of CO2 from Mount Etna. Nature 1991, 35, 387–391. [Google Scholar] [CrossRef]
  28. Carapezza, M.L.; Badalamenti, B.; Cavarra, L.; Scalzo, A. Gas hazard assessment in a densely inhabited area of Colli Albani Volcano (Cava dei Selci, Roma). J. Volcanol. Geotherm. Res. 2003, 23, 81–94. [Google Scholar] [CrossRef]
  29. Barberi, F.; Carapezza, M.L.; Ranaldi, M.; Tarchini, L. Gas blowout from shallow boreholes at Fiumicino (Rome): Induced hazard and evidence of deep CO2 degassing on the Tyrrhenian margin of Central Italy. J. Volcanol. Geotherm. Res. 2007, 165, 17–31. [Google Scholar] [CrossRef]
  30. Carapezza, M.L.; Lelli, M.; Tarchini, L. Geochemistry of the Albano and Nemi crater lakes in the volcanic district of Alban Hills (Rome, Italy). J. Volcanol. Geothrerm. Res. 2008, 178, 297–304. [Google Scholar] [CrossRef]
  31. Costa, A.; Chiodini, G.; Granieri, D.; Folch, A.; Hankin, R.K.S.; Caliro, S.; Cardellini, C.; Avino, R. A shallow layer model for heavy gas dispersion from natural sources: Application and hazard assessment at Caldara di Manziana, Italy, Geochem. Geophys. Geosyst. 2008, 9, Q03002. [Google Scholar] [CrossRef]
  32. Carapezza, M.L.; Barberi, F.; Rinaldi, M.; Ricci, T.; Tarchini, L.; Barrancos, J.; Fischer, C.; Perez, N.; Weber, K.; Di Piazza, A.; et al. Diffuse CO2 soil degassing and CO2 and H2S concentrations in air and related hazards at Vulcano Island (Aeolian arc Italy). J. Volcanol. Geotherm. Res. 2011, 207, 130–144. [Google Scholar] [CrossRef]
  33. Carapezza, M.L.; Barberi, F.; Ranaldi, M.; Ricci, T.; Tarchini, L.; Barrancos, J.; Fisher, C.; Granieri, D.; Lucchetti, C.; Melian, G.; et al. Hazardous gas emissions from the flanks of the quiescent Colli Albani volcano (Rome, Italy). J. Volcanol. Geoth. Res. 2012, 27, 1767–1782. [Google Scholar] [CrossRef]
  34. Granieri, D.; Carapezza, M.L.; Barberi, F.; Ranaldi, M.; Ricci, T.; Tarchini, L. Atmospheric dispersion of natural carbon dioxide emissions on Vulcano Island, Italy. J. Geophys. Res. Solid Earth 2014, 119, 5398–5413. [Google Scholar] [CrossRef]
  35. Selva, J.; Bonadonna, C.; Branca, S.; De Astis, G.; Gambino, S.; Paonita, A.; Pistolesi, M.; Ricci, T.; Sulpizio, R.; Tibaldi, A.; et al. Multiple hazards and paths to eruptions: A review of the volcanic system of Vulcano (Aeolian Islands, Italy). Earth-Sci. Rev. 2020, 207, 103186. [Google Scholar] [CrossRef]
  36. Le Guern, F.; Tazieff, H.; Faivre-Pierret, R. An example of health hazard: People killed by gas during a phreatic eruption, Dieng Plateau (Java, Indonesia), February 20th, 1979. Bull. Volcanol. 1982, 45, 153–156. [Google Scholar] [CrossRef]
  37. Sigurdsson, H.; Devine, J.D.; Tchoua, F.M.; Presser, T.S.; Pringle, M.K.W.; Evans, W.C. Origin of the lethal gas burst from Lake Monoun, Cameroon. J. Volcanol. Geotherm. Res. 1987, 31, 1–16. [Google Scholar] [CrossRef]
  38. Barberi, F.; Chelini, F.; Marinelli, G.; Martini, M. The gas cloud of Lake Nyos (Cameroon, 1986): Results of the Italian technical mission. J. Volcanol. Geotherm. Res. 1989, 39, 125–134. [Google Scholar] [CrossRef]
  39. Baubron, J.C.; Allard, P.; Toutain, J.P. Diffuse volcanic emission of carbon dioxide from Vulcano Island, Italy. Nature 1990, 344, 51–53. [Google Scholar] [CrossRef]
  40. Giggenbach, W.F.; Sano, Y.; Schminckle, H.U. CO2-rich gases from Lakes Nyos and Monoun, Cameroon; Laacher See, Germany; Dieng, Indonesia and Mt. Gambier, Australia—Variations on a common theme. J. Volcanol. Geotherm. Res. 1991, 45, 311–323. [Google Scholar] [CrossRef]
  41. Chiodini, G.; Granieri, D.; Avino, R.; Caliro, S.; Costa, A.; Minopoli, C.; Vilardo, G. Non-volcanic CO2 Earth degassing: Case of Mefite d’Ansanto (southern Apennines), Italy. Geophys. Res. Lett. 2010, 37, L11303. [Google Scholar] [CrossRef]
  42. Commission Directive 2006/15/EC of 7 February 2006 establishing a second list of indicative occupational exposure limit values in implementation of Council Directive 98/24/EC and amending Directives 91/322/EEC and 2000/39/EC. Available online: https://osha.europa.eu/it/legislation/directives/all (accessed on 21 August 2023).
  43. National Institute for Occupational Safety and Health (NIOSH) (1997). Documentation for Immediately Dangerous to Life or Health Concentrations (IDLHs) for Carbon Dioxide. Available online: http://www.cdc.gov/niosh/idlh/124389.html (accessed on 15 August 2023).
  44. NIOSH. Pocket Guide to Chemical Hazard, DHHS (NIOSH); Publ. N.97-140; U.S. Gov. Print Office: Washington, DC, USA, 1997. [Google Scholar]
  45. Di Martino, R.M.R.; Gurrieri, S.; Camarda, M.; Capasso, G.; Prano, V. Hazardous changes in soil CO2 emissions at Vulcano, Italy, in 2021. J. Geophys. Res. Solid Earth 2022, 127, e2022JB024516. [Google Scholar] [CrossRef]
  46. Di Martino, R.M.R.; Gurrieri, S. Quantification of the volcanic carbon dioxide in the air of Vulcano Porto by stable isotope surveys. J. Geophys. Res. Atmos. 2023, 128, e2022JD037706. [Google Scholar] [CrossRef]
  47. Aiuppa, A.; Bitetto, M.; Calabrese, S.; Delle Donne, D.; Lages, J.; La Monica, F.P.; Chiodini, G.; Tamburello, G.; Cotterill, A.; Fulignati, P.; et al. Mafic magma feeds degassing unrest at Vulcano Island, Italy. Comm. Earth Environ. 2022, 3, 255. [Google Scholar] [CrossRef]
  48. Federico, C.; Cocina, O.; Gambino, S.; Paonita, A.; Branca, S.; Coltelli, M.; Italiano, F.; Bruno, V.; Caltabiano, T.; Camarda, M.; et al. Inferences on the 2021 ongoing volcanic unrest at Vulcano Island (Italy) through a comprehensive multidisciplinary surveillance network. Remote Sens. 2023, 15, 1405. [Google Scholar] [CrossRef]
  49. Inguaggiato, S.; Vita, F.; Diliberto, I.S.; Inguaggiato, C.; Mazot, A.; Cangemi, M.; Corrao, M. The volcanic activity changes occurred in the 2021–2022 at Vulcano island (Italy), inferred by the abrupt variations of soil CO2 output. Sci. Rep. 2022, 12, 21166. [Google Scholar] [CrossRef] [PubMed]
  50. Vita, F.; Schiavo, B.; Inguaggiato, C.; Inguaggiato, S.; Mazot, A. Environmental and Volcanic Implications of Volatile Output in the Atmosphere of Vulcano Island Detected Using SO2 Plume (2021–23). Remote Sens. 2023, 15, 3086. [Google Scholar] [CrossRef]
  51. Blong, R. Volcanic hazard and risk management. In Encyclopedia of Volcanoes, 2nd ed.; Sigurdsson, H., Houghton, B., McNutt, S., Rymer, H., Stix, J., Eds.; Academic Press: Cambridge, MA, USA, 2015; pp. 1215–1227. [Google Scholar]
  52. Ghisetti, F. Relazioni tra strutture e fasi trascorrenti e distensive lungo i sistemi Messina–Fiumefreddo, Tindari–Letojanni e Alia–Malvagna (Sicilia nord–orientale): Uno studio microtettonico. Geol. Romana 1979, 18, 23–58. [Google Scholar]
  53. Locardi, E.; Nappi, G. Tettonica e vulcanismo recente nell’isola di Lipari (implicazioni geodinamiche). Boll. Soc. Geol. It. 1979, 98, 447–456. [Google Scholar]
  54. Ventura, G. Tectonics, structural evolution and caldera formation on Vulcano Island, Aeolian Archipelago, Southern Tyrrhenian Sea. J. Volcanol. Geoth. Res. 1994, 60, 207–224. [Google Scholar] [CrossRef]
  55. Lanzafame, G.; Bousquet, J.C. The Maltese escarpment and its extension from Mt. Etna to the Aeolian Islands (Sicily): Importance and evolution of a lithosphere discontinuity. Acta Vulcanol. 1997, 9, 113–120. [Google Scholar]
  56. De Astis, G.; Ventura, G.; Vilardo, G. Geodynamic significance of the Aeolian volcanism (Southern Tyrrhenian Sea, Italy) in light of structural, seismological and geochemical data. Tectonics 2003, 22, 1040. [Google Scholar] [CrossRef]
  57. Argnani, A.; Serpelloni, E.; Bonazzi, C. Pattern of deformation around the central Aeolian Islands: Evidence from multichannel seismics and GPS data. Terra Nova 2007, 19, 317–323. [Google Scholar] [CrossRef]
  58. Chiarabba, C.; De Gori, P.; Speranza, F. The southern Tyrrhenian subduction zone: Deep geometry, magmatism and Plio-Pleistocene evolution. Earth Planet. Sci. Lett. 2008, 268, 408–423. [Google Scholar] [CrossRef]
  59. Palano, M.; Ferranti, L.; Monaco, C.; Mattia, M.; Aloisi, M.; Bruno, V.; Cannavò, F.; Siligato, G. GPS velocity and strain fields in Sicily and southern Calabria, Italy: Updated geodetic constraints on tectonic block interaction in the central Mediterranean. J. Geophys. Res. 2012, 117, B07401. [Google Scholar] [CrossRef]
  60. De Astis, G.; Lucchi, F.; Dellino, P.; La Volpe, L.; Tranne, C.A.; Frezzotti, M.L.; Peccerillo, A. Geology, volcanic history and petrology of Vulcano (central Aeolian Archipelago). In The Aeolian Islands Volcanoes; Lucchi, F., Peccerillo, A., Keller, J., Tranne, C.A., Rossi, P.L., Eds.; Geological Society, London, Memoirs: London, UK, 2013; Volume 37, pp. 281–348. [Google Scholar]
  61. Forni, F.; Lucchi, F.; Peccerillo, A.; Tranne, C.A.; Rossi, P.L.; Frezzotti, M.L. Stratigraphy and geological evolution of the Lipari volcanic complex (central Aeolian archipelago. In The Aeolian Islands Volcanoes; Lucchi, F., Peccerillo, A., Keller, J., Tranne, C.A., Rossi, P.L., Eds.; Geological Society, London, Memoirs: London, UK, 2013; Volume 37, pp. 213–279. [Google Scholar]
  62. Barreca, G.; Bruno, V.; Cultrera, F.; Mattia, M.; Monaco, C.; Scarfì, L. New insights in the geodynamics of the Lipari-Vulcano area (Aeolian Archipelago, southern Italy) from geological, geodetic and seismological data. J. Geodyn. 2014, 82, 150–167. [Google Scholar] [CrossRef]
  63. Chiodini, G.; Frondini, F.; Raco, B. Diffuse emission of CO2 from the Fossa crater, Vulcano Island (Italy). Bull. Volcanol. 1996, 58, 41–50. [Google Scholar] [CrossRef]
  64. Chiodini, G.; Cioni, R.; Guidi, M.; Marini, L.; Raco, B. Soil CO2 flux measurements in volcanic and geothermal areas. Appl. Geochem. 1998, 13, 543–552. [Google Scholar] [CrossRef]
  65. Di Martino, R.M.R.; Gurrieri, S.; Diliberto, I.S.; Vita, F.; Camarda, M.; Francofonte, V.; Italiano, F. Design and implementation of the gas hazard early warning system at Vulcano—Aeolian Islands, 2021. In Proceedings of the 90° Congresso della Società Geologica Italiana, Trieste, Italy, 14–16 December 2021. [Google Scholar] [CrossRef]
  66. Di Martino, R.M.R.; Capasso, G.; Camarda, M. Spatial domain analysis of carbon dioxide from soils on Vulcano Island: Implications for CO2 output evaluation. Chem. Geol. 2016, 444, 59–70. [Google Scholar] [CrossRef]
  67. Gurrieri, S.; Di Martino, R.M.R.; Camarda, M.; Francofonte, V. Gas emissions in volcanic islands: From data acquisition to warning information. In Proceedings of the Cities on Volcanoes 11, Heraklion, Crete, 12–17 June 2022. [Google Scholar]
  68. Gurrieri, S.; Valenza, M. Gas transport in natural porous mediums: A method for measuring CO2 flows from the ground in volcanic and geothermal areas. Rend. Soc. It. Miner. Petrol. 1988, 43, 1151–1158. [Google Scholar]
  69. Carapezza, M.L.; Granieri, D. CO2 soil flux at Vulcano (Italy): Comparison of active and passive methods and application to the identification of actively degassing structure. Appl. Geochem. 2004, 19, 73–88. [Google Scholar] [CrossRef]
  70. Camarda, M.; Gurrieri, S.; Valenza, M. CO2 flux measurements in volcanic areas using the dynamic concentration method: Influence of soil permeability. J. Geophys. Res. 2006, 111, B05202. [Google Scholar] [CrossRef]
  71. Camarda, M.; Gurrieri, S.; Valenza, M. In situ permeability measurements based on a radial gas advection model: Relationships between soil permeability and diffuse CO2 degassing in volcanic areas. Pure Appl. Geophys. 2006, 163, 897–914. [Google Scholar] [CrossRef]
  72. Sinclair, A.J. Selection of threshold values in geochemical data using probability graphs. J. Geochemical Explor. 1974, 3, 129–149. [Google Scholar] [CrossRef]
  73. Camarda, M.; Prano, V.; Cappuzzo, S.; Gurrieri, S.; Valenza, M. Temporal variations in air permeability and soil CO2 flux in volcanic ash soils (island of Vulcano, Italy). Geochem. Geophys. Geosyst. 2017, 18, 3241–3253. [Google Scholar] [CrossRef]
  74. Camarda, M.; De Gregorio, S.; Capasso, G.; Di Martino, R.M.R.; Gurrieri, S.; Prano, V. The monitoring of natural soil CO2 emissions: Issue and perspectives. Earth Sci. Rev. 2019, 198, 102928. [Google Scholar] [CrossRef]
  75. Carapezza, M.L.; Diliberto, I.S.; Granieri, D. Identification and quantification of CO2 and SO2 emission from fumarolic and diffuse sources of La Fossa caldera (Vulcano, Italy) to contribute to the ga hazard assessment in Vulcano Porto village in the present unrest crisis. In Proceedings of the Cities on Volcanoes 11, Heraklion, Crete, 12–17 June 2022. [Google Scholar]
  76. Carapezza, M.L.; Granieri, D.; Patera, A.; Pruiti, L.; Ranaldi, M.; Rubino, C.; Sortino, F.; Tarchini, L. Hazard associated with the diffuse release of CO2 in the village of Vulcano Porto during the 2021–2022 unrest crisis of La Fossa volcano (Vulcano Island, Italy). In Proceedings of the Cities on Volcanoes 11, Heraklion, Crete, 12–17 June 2022. [Google Scholar]
  77. Carapezza, M.L.; Amend, D.; Di Gangi, F.; Fisher, C.; Pagliuca, N.M.; Pruiti, L.; Ranaldi, M.; Tarchini, L.; Vallocchia, M.; Weber, K. The 2021–2022 volcanic unrest crisis of La Fossa volcano (Vulcano Island, Italy): A new CO2-H2S-SO2 air concentration-monitoring network at Vulcano Porto. In Proceedings of the Cities on Volcanoes 11, Heraklion, Crete, 12–17 June 2022. [Google Scholar]
  78. Settimo, G.; Brini, S.; Baldassarri, L.T.; De Martino, A.; Lepore, A.; Moricci, F. Presenza di CO2 e H2S in Ambienti Indoor-Residenziali: Analisi Critica delle Conoscenze di Letteratura, Report by ISS. 2011. Available online: https://www.iss.it/documents/20126/45616/16_15_web.pdf/a9142047-b81d-3e0b-6e6f-10860f855b67?t=1581095582421 (accessed on 10 August 2023).
  79. Minister of Supply and Services. Exposure Guidelines for Residential Indoor Air Quality; Minister of Supply and Services Canada: Ottawa, ON, Canada, 1995. [Google Scholar]
  80. UK Department for Education and Skills. Ventilation of School Buildings; Version 1.4; Department for Education and Skills: London, UK, 2006. [Google Scholar]
  81. Raich, J.W.; Potter, C.S. Global patterns of carbon dioxide emissions from soils. Global. Biogeochem. Cycles 1995, 9, 23–36. [Google Scholar] [CrossRef]
  82. Raich, J.W.; Schlesinger, W.H. The global carbon dioxide flux in soil respiration and its relationship to vegetation and climate. Tellus B 1992, 44, 81–99. [Google Scholar] [CrossRef]
  83. Raich, J.W.; Tufekcioglu, A. Vegetation and soil respiration: Correlations and controls. Biogeochemistry 2000, 48, 71–90. [Google Scholar] [CrossRef]
  84. Viveiros, F.; Ferreira, T.; Cabral Vieira, J.; Silva, C.; Gaspar, J.L. Environmental influences on soil CO2 degassing at Furnas and Fogo volcanoes (São Miguel Island, Azores archipelago). J. Volcanol. Geoth. Res. 2008, 177, 883–893. [Google Scholar] [CrossRef]
  85. Camarda, M.; Capasso, G.; Di Martino, R.M.R.; Gurrieri, S.; Prano, V. Soil CO2 flux surveys during 2020 at Vulcano—Aeolian Island, Italy. In Proceedings of the Cities on Volcanoes 11, Heraklion, Crete, 12–17 June 2022. [Google Scholar]
  86. Camarda, M.; De Gregorio, S.; Di Martino, R.M.R.; Favara, R. Temporal and spatial correlations between soil CO2 flux and crustal stress. J. Geophys. Res. Solid Earth 2016, 121, 7071–7085. [Google Scholar] [CrossRef]
  87. Camarda, M.; De Gregorio, S.; Di Martino, R.M.R.; Favara, R.; Prano, V. Relationships between soil CO2 flux and tectonic structures in SW Sicily. Ann. Geophys. 2020, 63. [Google Scholar] [CrossRef]
  88. Bonadonna, C.; Asgary, A.; Romerio, F.; Zulemyan, T.; Frischknecht, C.; Cristiani, C.; Rosi, M.; Gregg, C.E.; Biass, S.; Pistolesi, M.; et al. Assessing the effectiveness and the economic impact of evacuation: The case of Vulcano Island, Italy. Nat. Hazard. Earth Sys. 2022, 22, 1083–1108. [Google Scholar] [CrossRef]
  89. Keeling, C.D.; Piper, S.C.; Bacastow, R.B.; Wahlen, M.; Whorf, T.P.; Heimann, M.; Meijer, H.A. Exchanges of Atmospheric CO2 and 13CO2 with the Terrestrial Biosphere and Oceans from 1978 to 2000. I. Global Aspects; SIO Reference Series, No. 01-06; Scripps Institution of Oceanography: San Diego, CA, USA, 2001; 88p. [Google Scholar]
  90. Capasso, G.; Di Martino, R.M.R.; Caracausi, A.; Favara, R. Distinguishing Human Related, Biological and Geological Carbon Dioxide in the Air through Isotopic Surveying; EGU21-9620; European Geoscience Union General Assembly: Vienna, Austria, 2021. [Google Scholar] [CrossRef]
  91. Venturi, S.; Tassi, F.; Cabassi, J.; Vaselli, O.; Minardi, I.; Neri, S.; Caponi, C.; Capasso, G.; Di Martino, R.M.R.; Ricci, A.; et al. A multi-instrumental geochemical approach to assess the environmental impact of CO2-rich gas emissions in a densely populated area: The case of Cava dei Selci (Latium, Italy). App. Geochem. 2019, 101, 109–126. [Google Scholar] [CrossRef]
  92. Capasso, G.; Di Martino, R.M.R.; Camarda, M.; Prano, V. Dissolved carbon in groundwater versus gas emissions from the soil: The two sides of the same coin. Procedia Earth Planet. Sci. 2017, 17, 116–119. [Google Scholar] [CrossRef]
  93. Di Martino, R.M.R.; Gurrieri, S. Stable isotope surveys reveal variations in the air CO2 during the unrest event at Vulcano, Italy, in 2021. EGU23-11463. In Proceedings of the EGU General Assembly 2023, Vienna, Austria, 24–28 April 2023. [Google Scholar] [CrossRef]
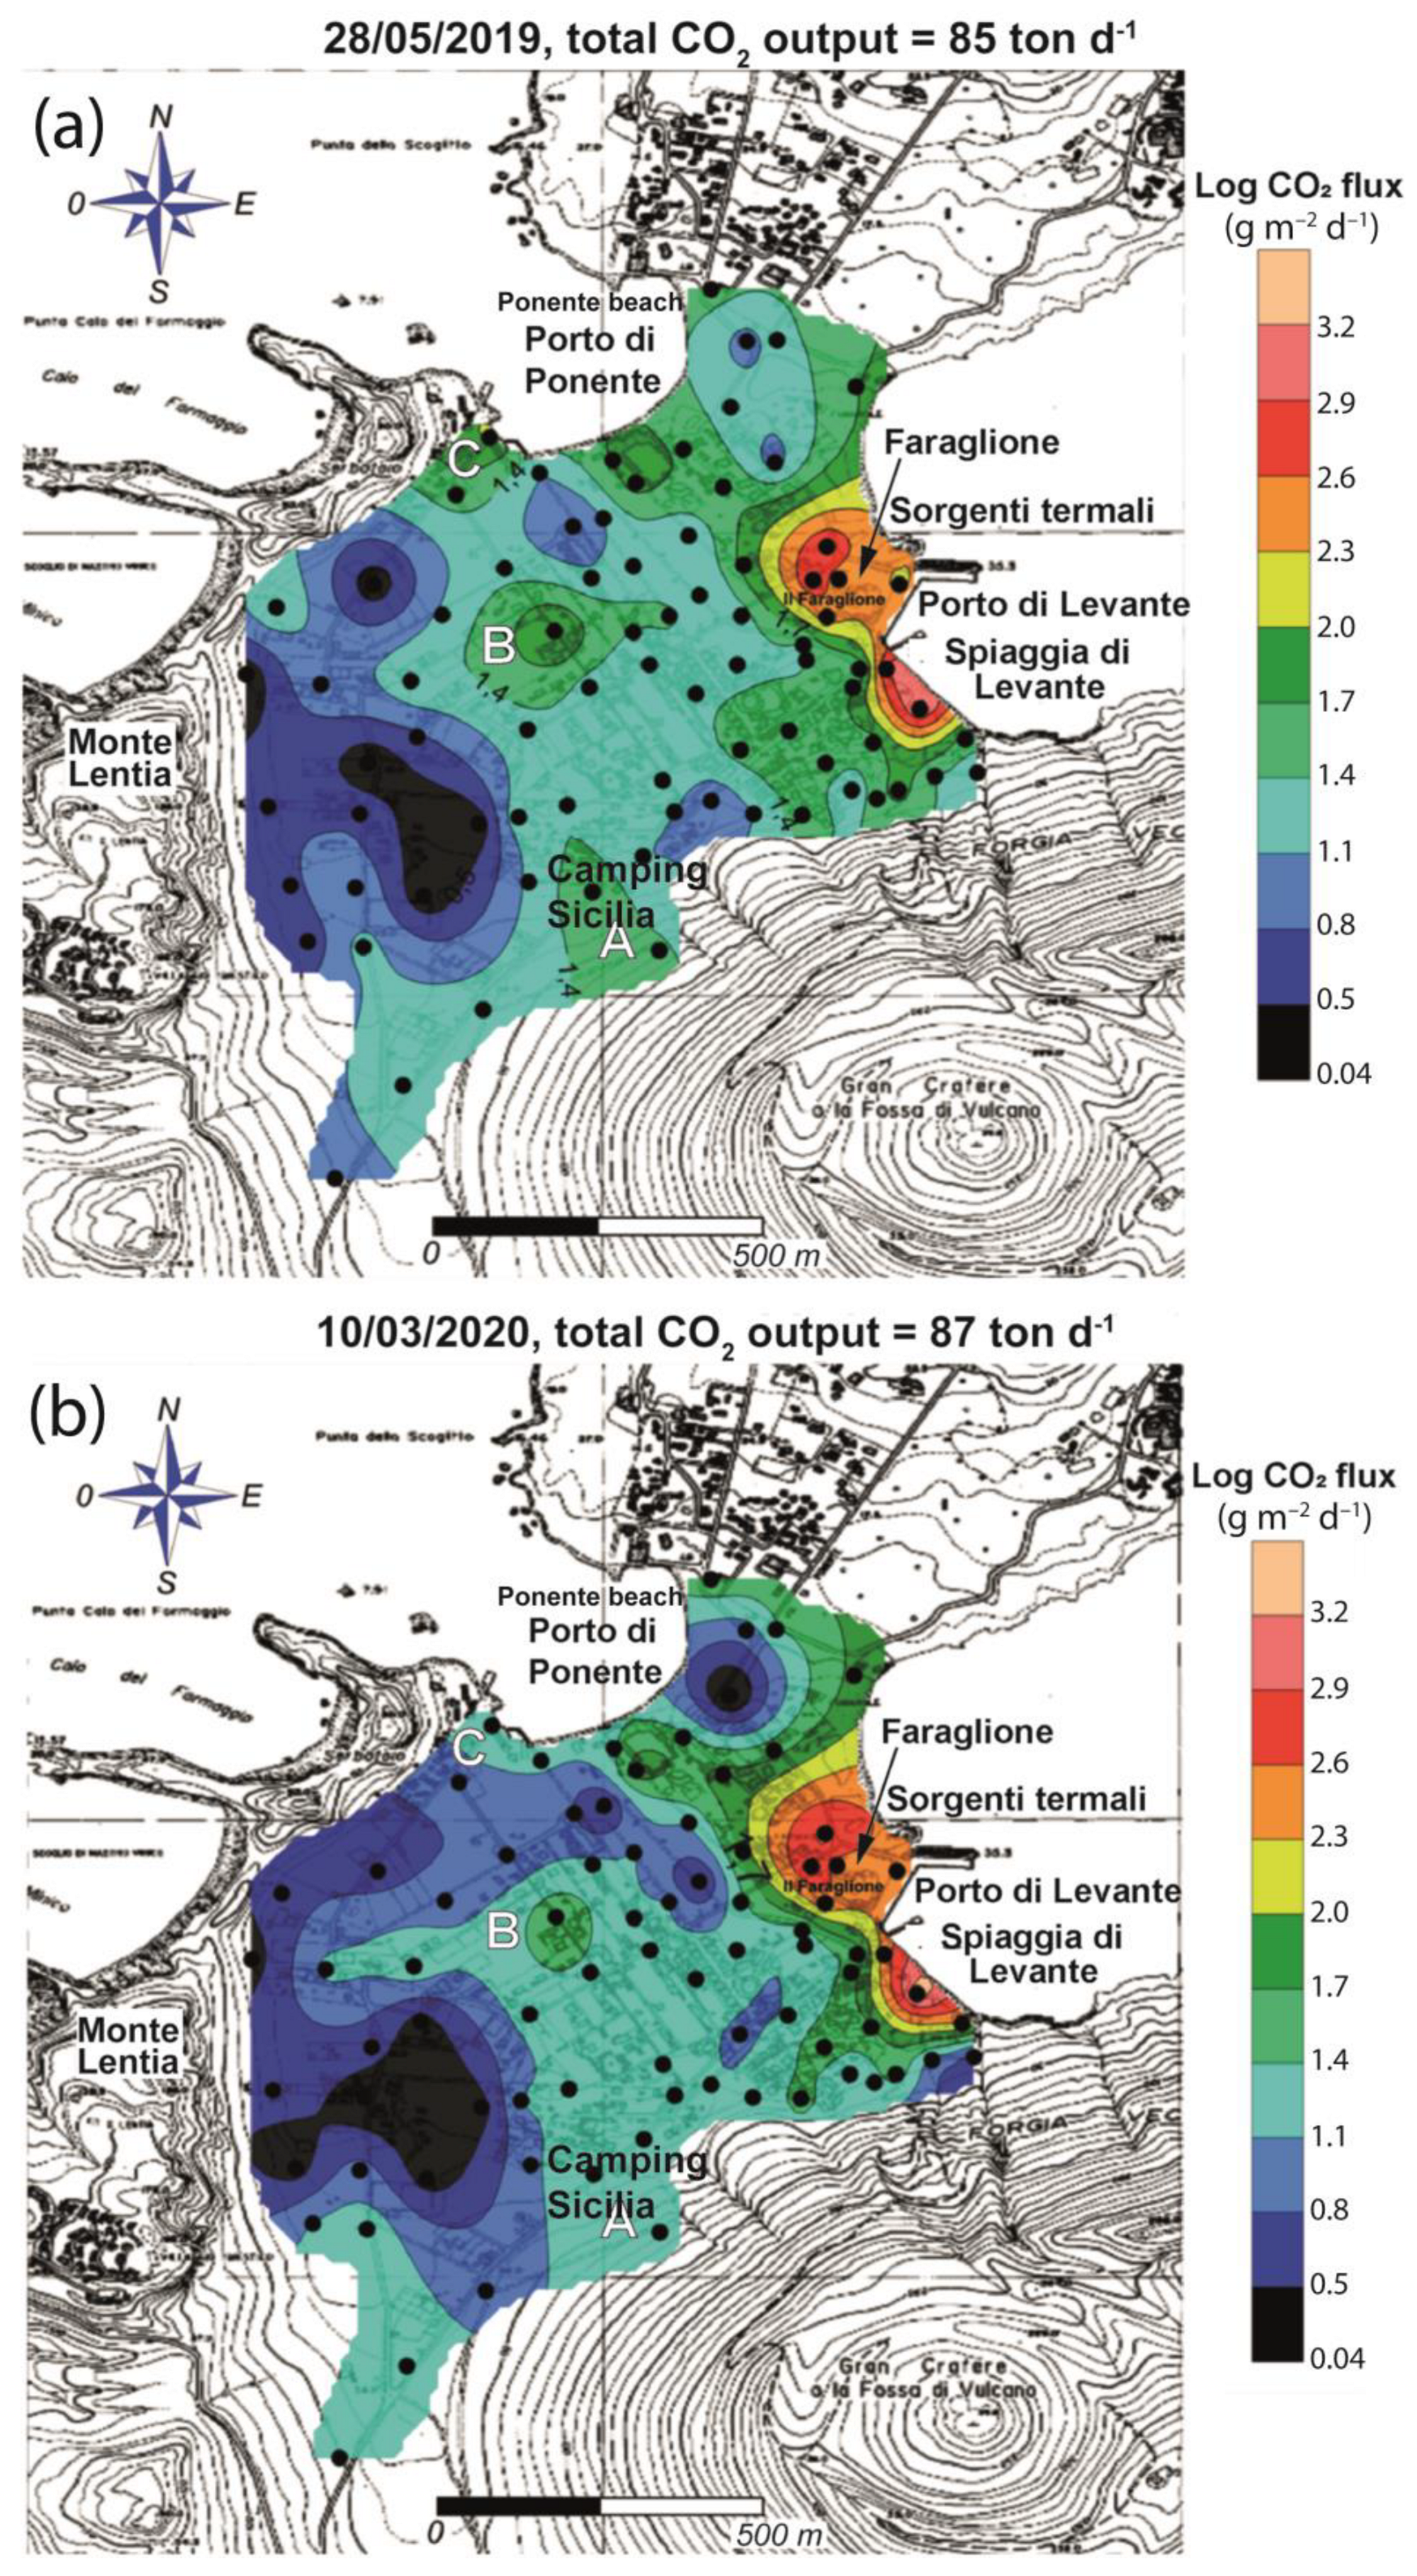
Figure 2. Contour plots of soil CO2 flux (logarithmic scale) expressed in g m−2 d−1 at Vulcano Porto. Black dots indicate the φCO2 measurement points. The A, B, and C show different degassing areas as discussed in the text. (a) Survey performed on 28 May 2019; (b) survey performed on 10 March 2020.
Geosciences 13 00266 g002
Figure 3. The CO2 concentration measurement indoors at Vulcano during a survey performed in August 2020. The site RMG is considered a suitable reference for both the outdoor and indoor air CO2 concentration near the anomalous degassing zone of Faraglione (blue line). Threshold value for indoor CO2 concentration according to the Commission Directive 2006/13/EC is shown (red line).
Geosciences 13 00266 g003
Figure 4. Time series of the φCO2 at the four monitoring stations. Background colors show the alert code established by Dipartimento della Protezione Civile for the state of activity of Vulcano (https://rischi.protezionecivile.gov.it/static/f2e294052045b305219e246cd1ae895e/vulcano-tabella-sui-livelli-di-allerta.pdf, accessed on 21 August 2023); the alert code change from “green” to “yellow” occurred on 30 September 2021. A notable seawater decoloration at Baia di Levante occurred on 23 May 2022 (vertical blue bar in subplots), while seismicity at a depth < 12 km with ML > 2 occurred on 19 October 2021, 30 October 2021, and 10 April 2022 (vertical red lines). Time series of data collected by the stations: (a) Carapezza, which is the most peripheral station of the network. This station can be considered as a reference for φCO2 because of its positioning far from the anomalous degassing zone. (b) Castello, which lies in the anomalous degassing zone. (c) Porto, which is located in the anomalous degassing zone. (d) Rojas. The comparison of the average φCO2 values shows few differences between the volcanic emissions near Faraglione zone and the most peripheral zone, at least 1 km from the base of La Fossa cone (i.e., Carapezza and Rojas monitoring sites).
Geosciences 13 00266 g004
Figure 5. Time series of the outdoor air CO2 concentration at four monitoring stations. Background colors show the alert code established by Dipartimento della Protezione civile for the state of activity of Vulcano (https://rischi.protezionecivile.gov.it/static/f2e294052045b305219e246cd1ae895e/vulcano-tabella-sui-livelli-di-allerta.pdf, accessed on 21 August 2023); the transition from “green” to “yellow” occurred on 30 September 2021. A notable seawater decoloration at Baia di Levante occurred on 23 May 2022 (vertical blue bar in subplots). The average value for air CO2 concentration calculated by measurements recorded at Mauna Loa Observatory (https://scrippsco2.ucsd.edu/data/atmospheric_co2/primary_mlo_co2_record.html, accessed on 21 August 2023) has been selected as background value for outdoor air CO2 concentration (purple line). Time series of the data collected by the station at 20 cm (green line) and 150 cm (blue line) above the ground, respectively: (a) Carapezza; (b) Castello, (c) Porto; (d) Rojas.
Geosciences 13 00266 g005
Figure 6. Weather variables at Rojas station. (a) Air temperature; (b) air pressure; (c) relative humidity; (d) rain rate; (e) wind speed; (f) wind direction; arrows’ length is relative to the wind speed; (g) rose diagram of the wind direction and speed (the axis scale is frequency).
Geosciences 13 00266 g006
Figure 7. (a) Vertical differences of CO2 concentration vs. φCO2 at Carapezza site; (b) frequency distribution of the vertical differences in CO2 concentrations at Carapezza site; (c) vertical differences of CO2 concentration vs. φCO2 at Castello site; (d) frequency distribution of the vertical differences in CO2 concentrations at Castello site; (e) vertical differences in CO2 concentration vs. φCO2 at Porto site; (f) frequency distribution of the vertical differences in CO2 concentrations at Porto site; (g) vertical differences in CO2 concentration vs. φCO2 at Rojas site; (h) frequency distribution of the vertical differences in CO2 concentrations at Rojas site.
Geosciences 13 00266 g007
Figure 8. CO2 concentration vs. φCO2 plots resulting from cluster analysis; Cluster-1 (magenta circle) and Cluster-2 (yellow circles). (a) Carapezza site at the height of 20 cm; (b) Carapezza site at the height of 150 cm a; (c) Castello site at the height of 20 cm; (d) Castello site at the height of 150 cm; (e) Porto site at the height of 20 cm; (f) Porto site at the height of 150 cm; (g) Rojas site at the height of 20 cm; (h) Rojas site at the height of 150 cm.
Geosciences 13 00266 g008
Table 1. Statistics of the continuous monitoring for soil CO2 flux (g m−2 d−1) and air CO2 concentration (vol%) at two different heights above the ground (i.e., 20 cm and 150 cm, respectively).
StationMinimumAverageMaximumStandard DeviationSkewnessKurtosis
Soil CO2 flux
(g m−2 d−1)
Carapezza6.4122.6984.527.611.905.97
Castello50.02134.84384.0841.160.731.64
Porto0.47358.231261.33227.550.25−0.51
Rojas0.0025.4862.678.27−0.150.85
Air CO2 concentration 20 cm
(vol%)
Carapezza0.010.040.080.01−0.58−0.75
Castello0.000.070.400.06−16.87664.04
Porto0.000.090.210.03−0.620.57
Rojas0.000.070.170.03−0.700.97
Air CO2 concentration 150 cm
(vol%)
Carapezza0.010.030.060.01−0.020.17
Castello0.000.060.230.03−28.861875.45
Porto0.040.090.170.020.050.06
Rojas0.000.060.160.020.240.85
Table 2. Statistics of the clustering results.
StationCluster IDφCO2 Max
(g m−2 d−1)
φCO2 Min
(g m−2 d−1)
Height above the Ground
(cm)
Air CO2 Concentration—Max
(vol%)
Air CO2 Concentration—Min
(vol%)
CarapezzaCluster-128.26.4200.080.03
1500.060.02
Cluster-259.514.7200.050.01
1500.050.01
CastelloCluster-1286.290.4200.400.07
1500.230.06
Cluster-2384.168.8200.190.00
1500.120.00
PortoCluster-21261.30.5200.210.00
1500.170.04
RojasCluster-144.27.9200.160.04
1500.150.03
Cluster-248.325.6200.080.00
1500.080.03
Disclaimer/Publisher’s Note: The statements, opinions and data contained in all publications are solely those of the individual author(s) and contributor(s) and not of MDPI and/or the editor(s). MDPI and/or the editor(s) disclaim responsibility for any injury to people or property resulting from any ideas, methods, instructions or products referred to in the content.