

The Lambousa (Cyprus) Fishtank in a Quasi-Stable Coastal Area of the Eastern Mediterranean, a Notable Marker for Testing GIA Models
 , and
, and 
Abstract
:1. Introduction and State of the Art
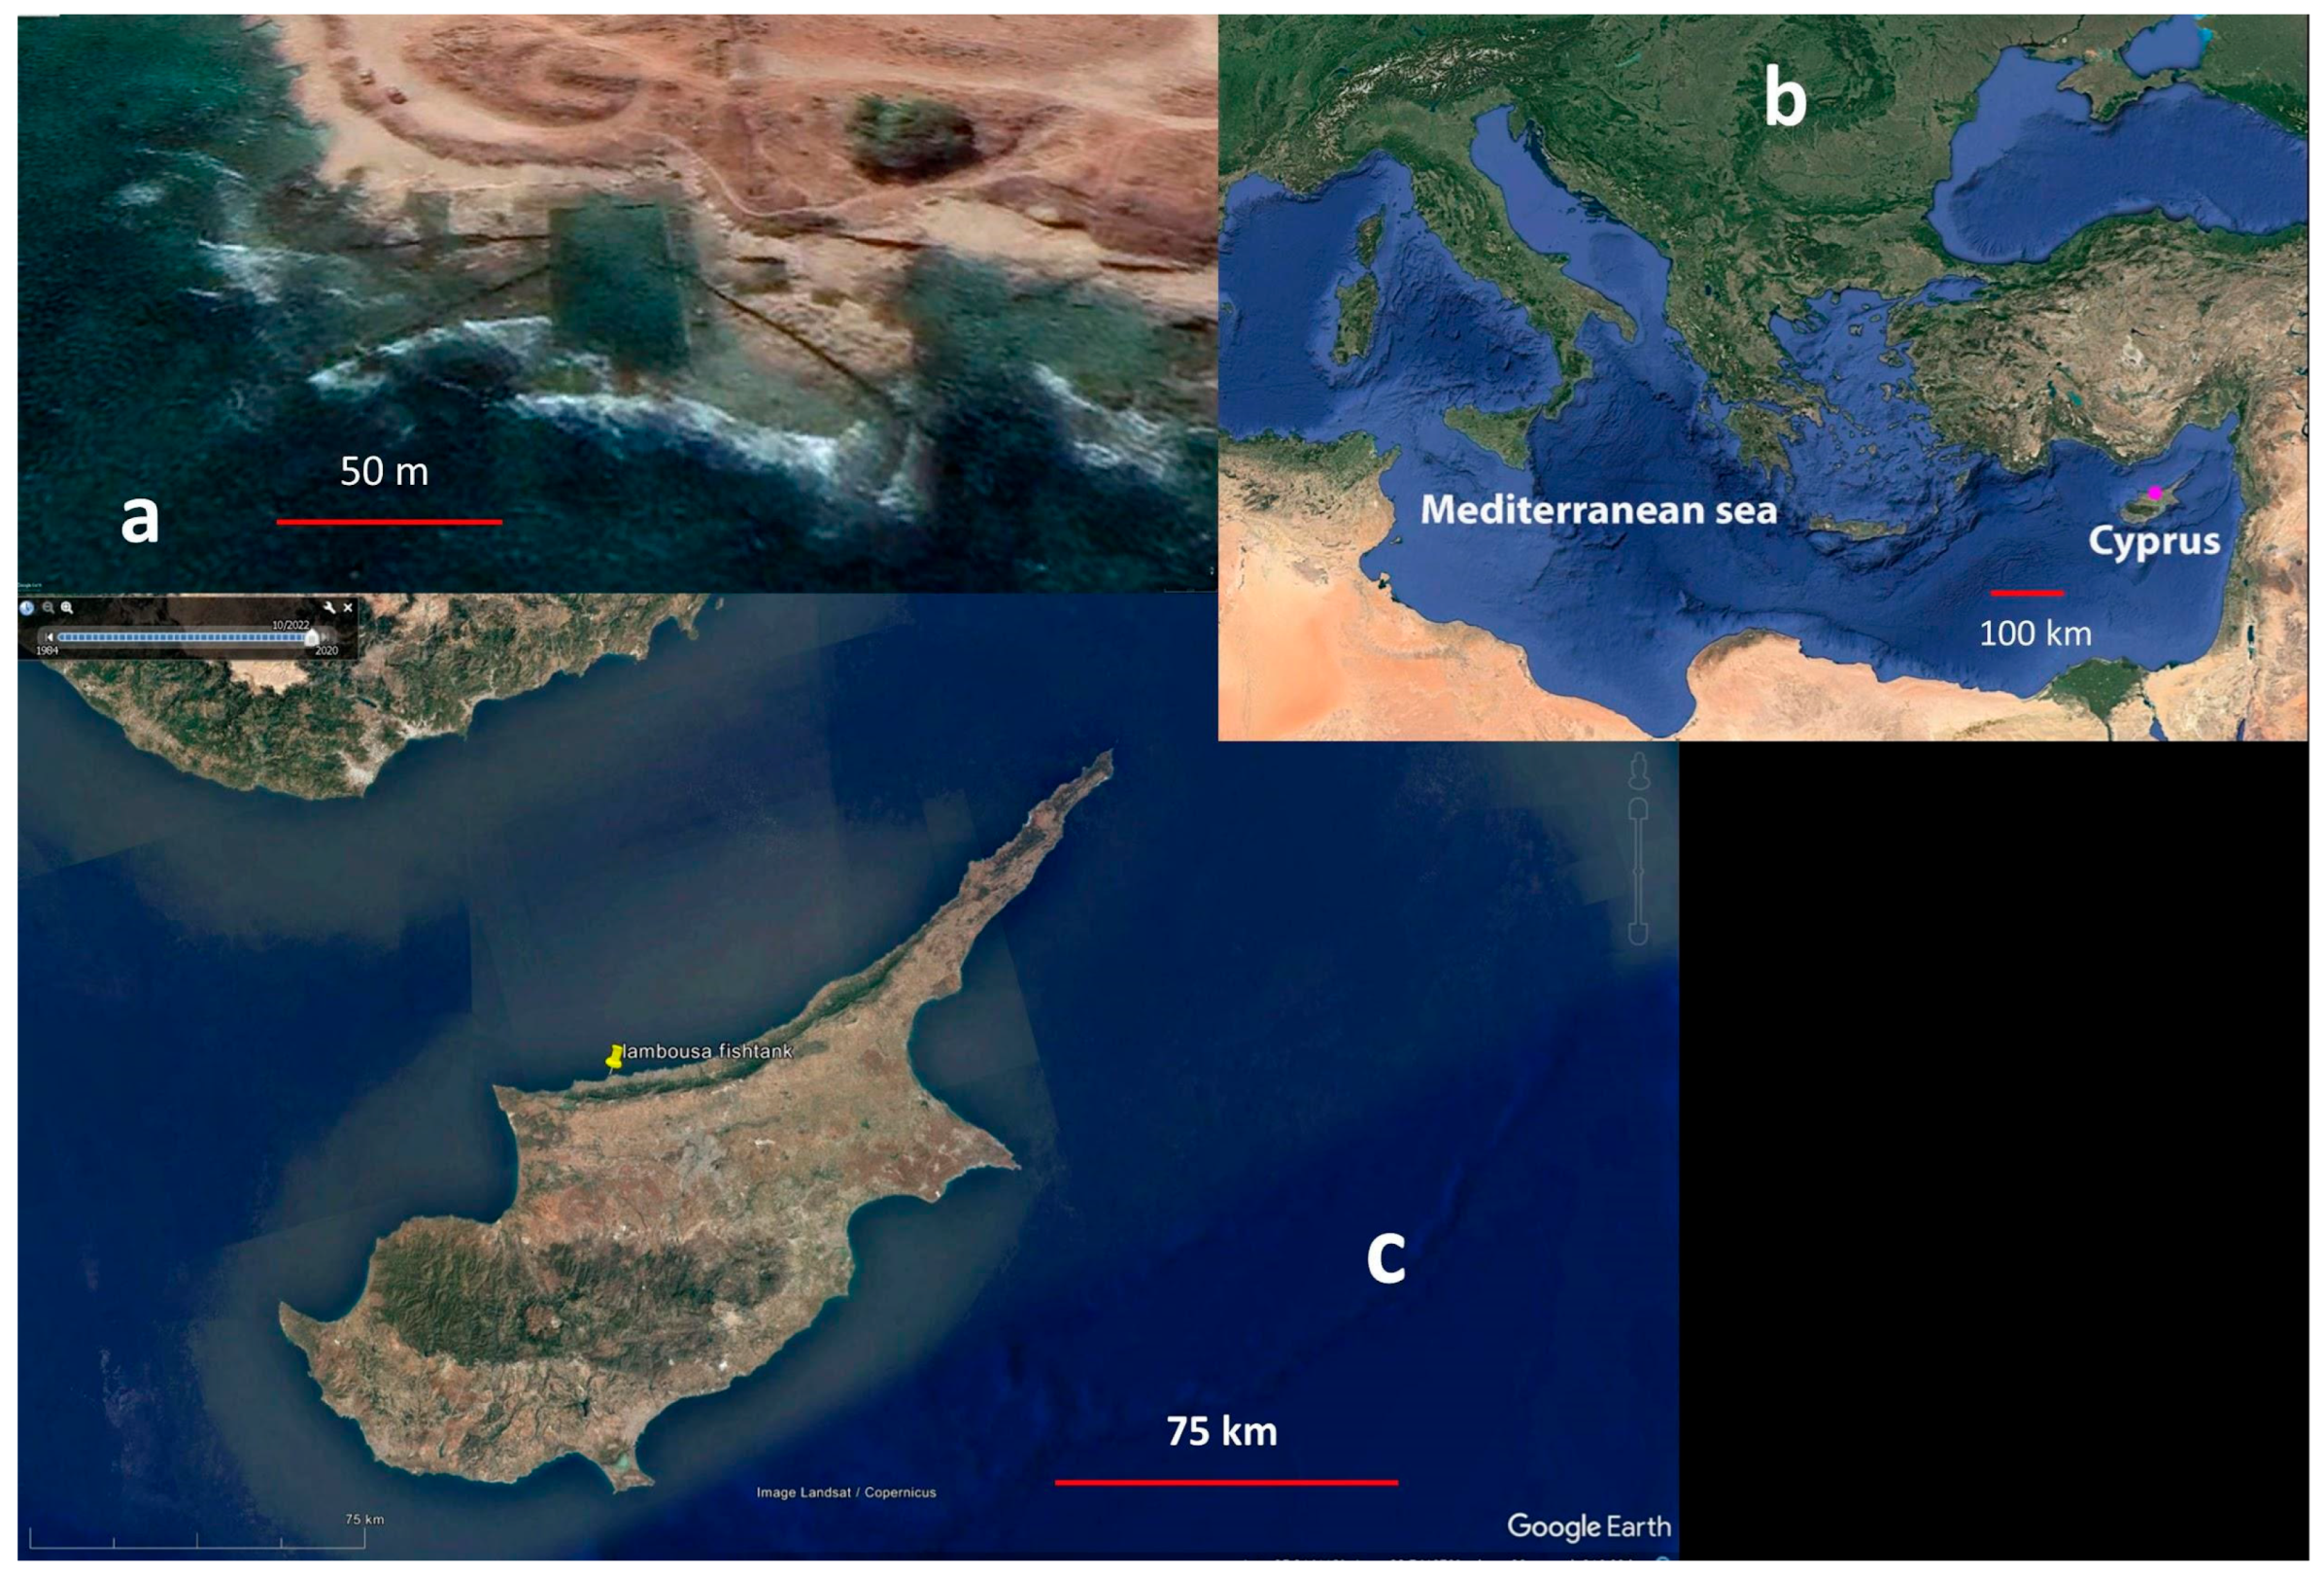
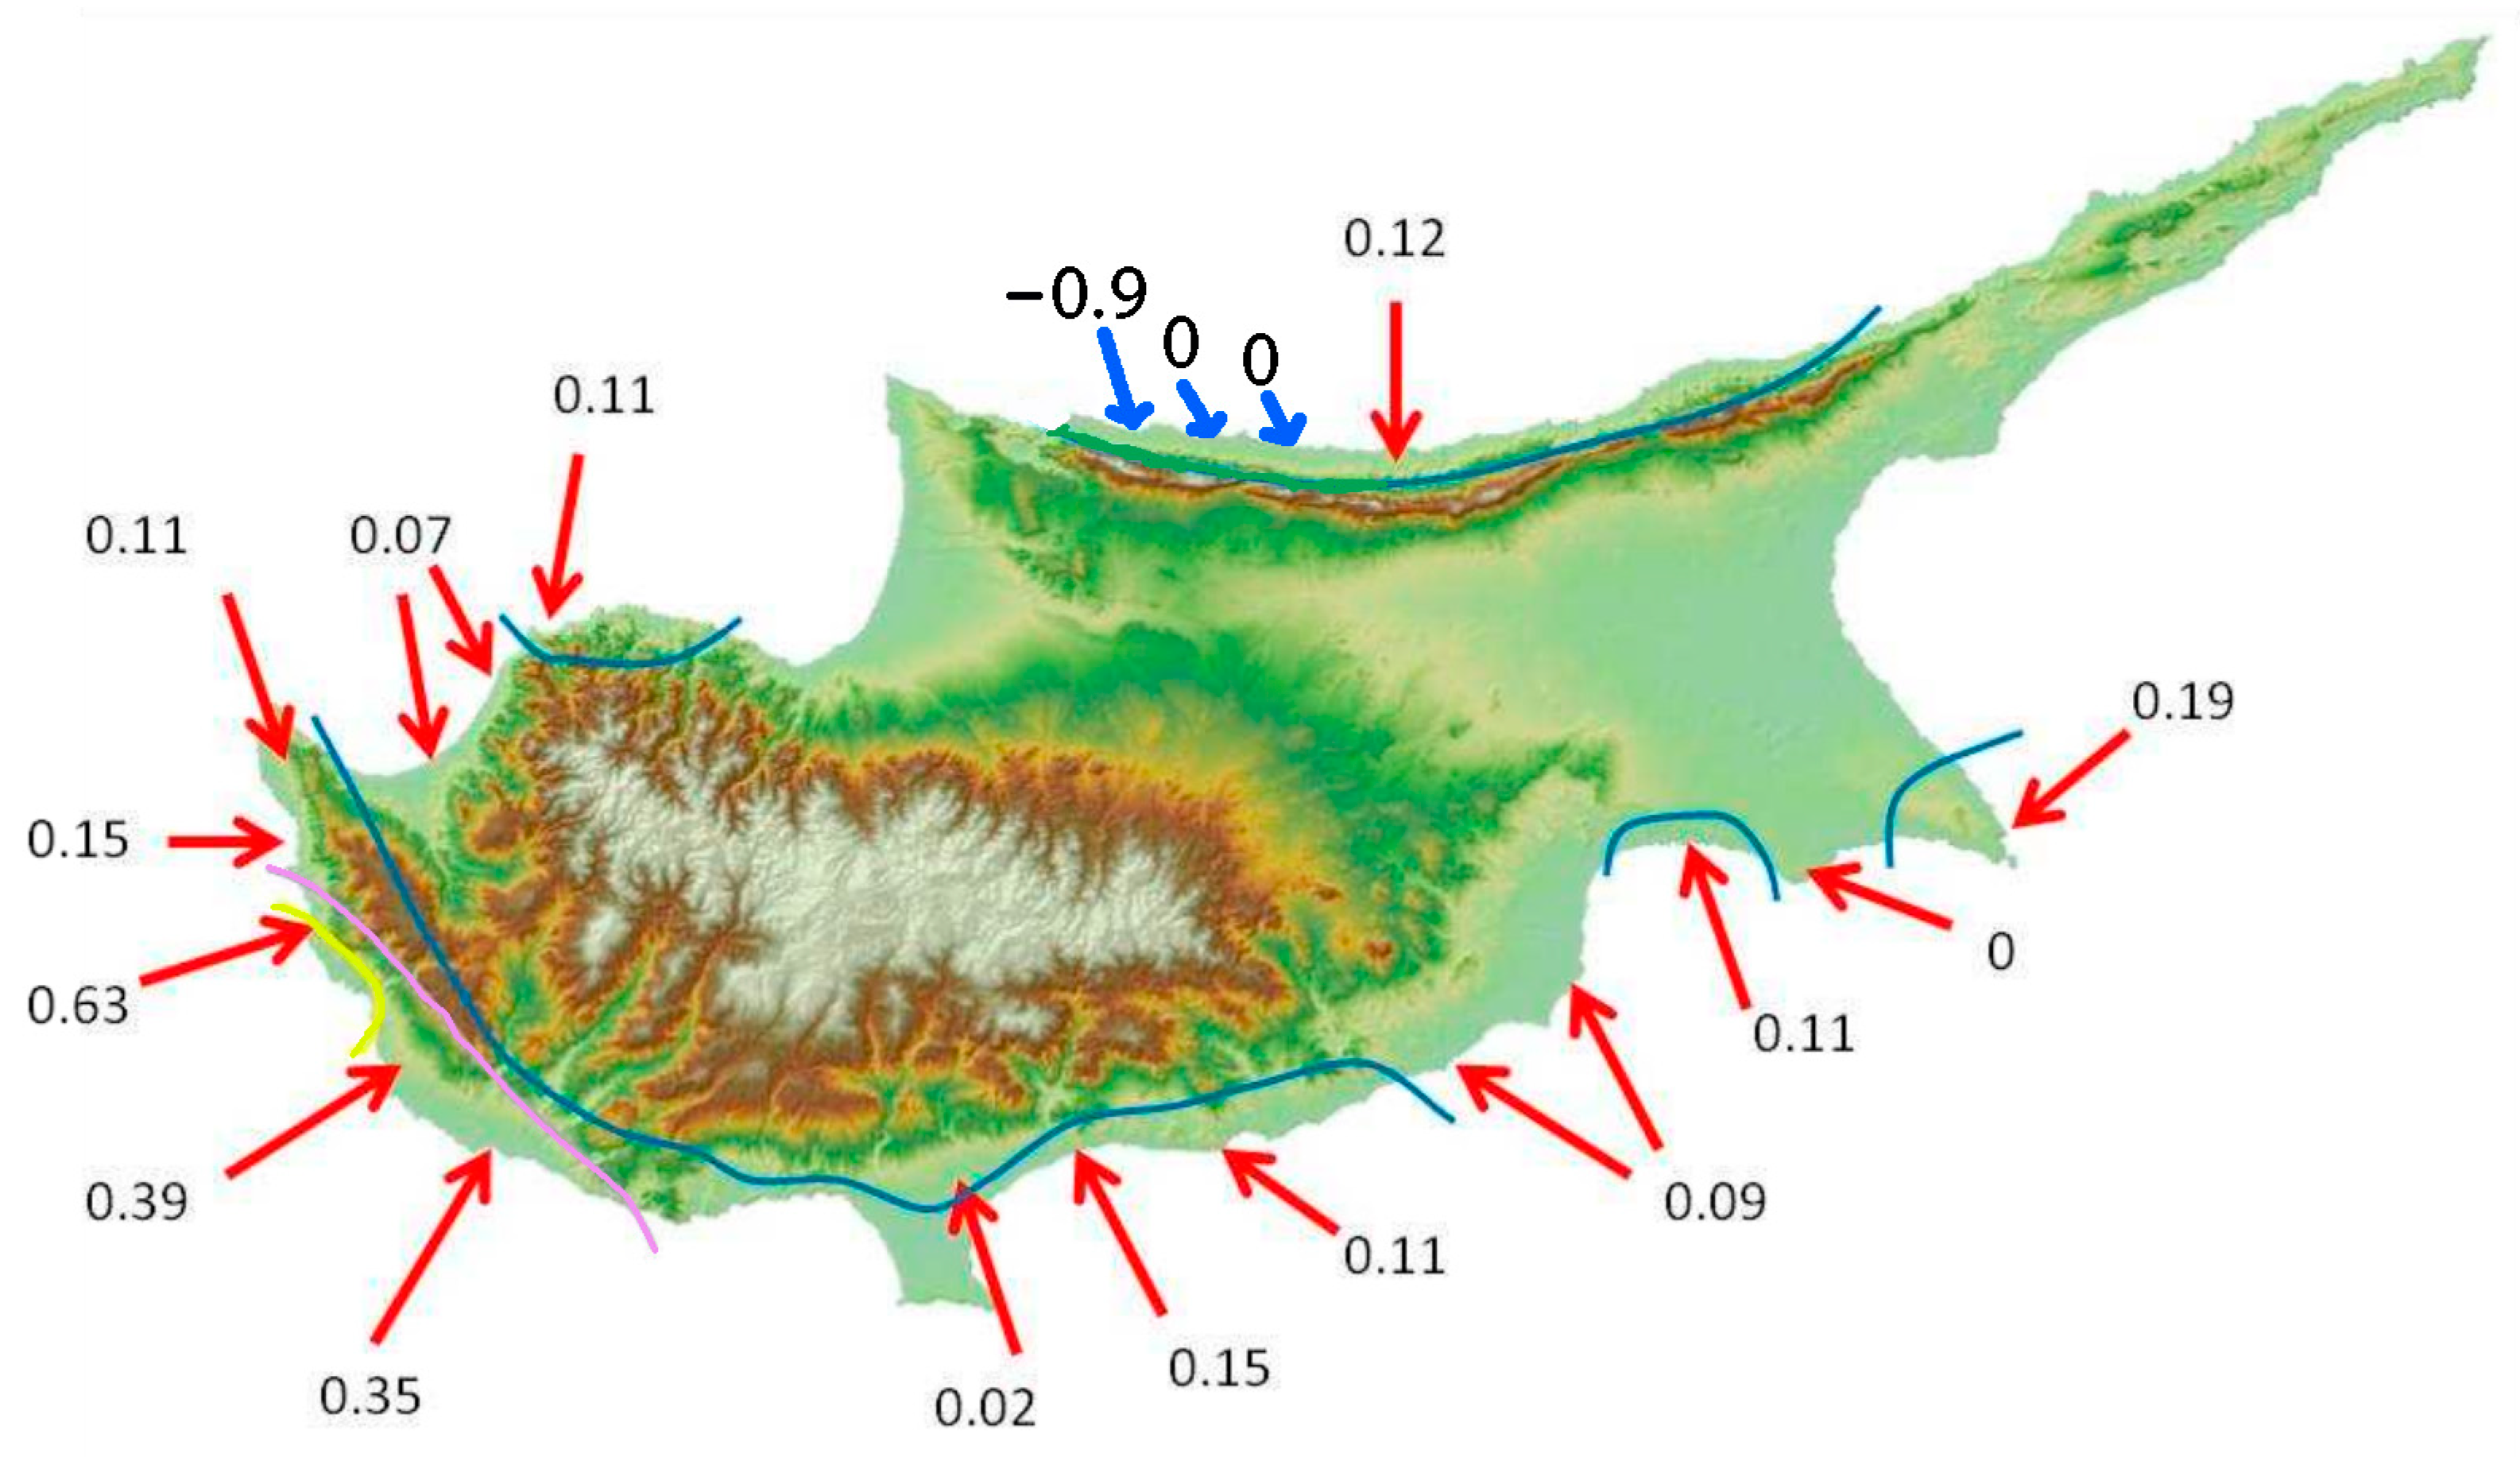
2. Study Area
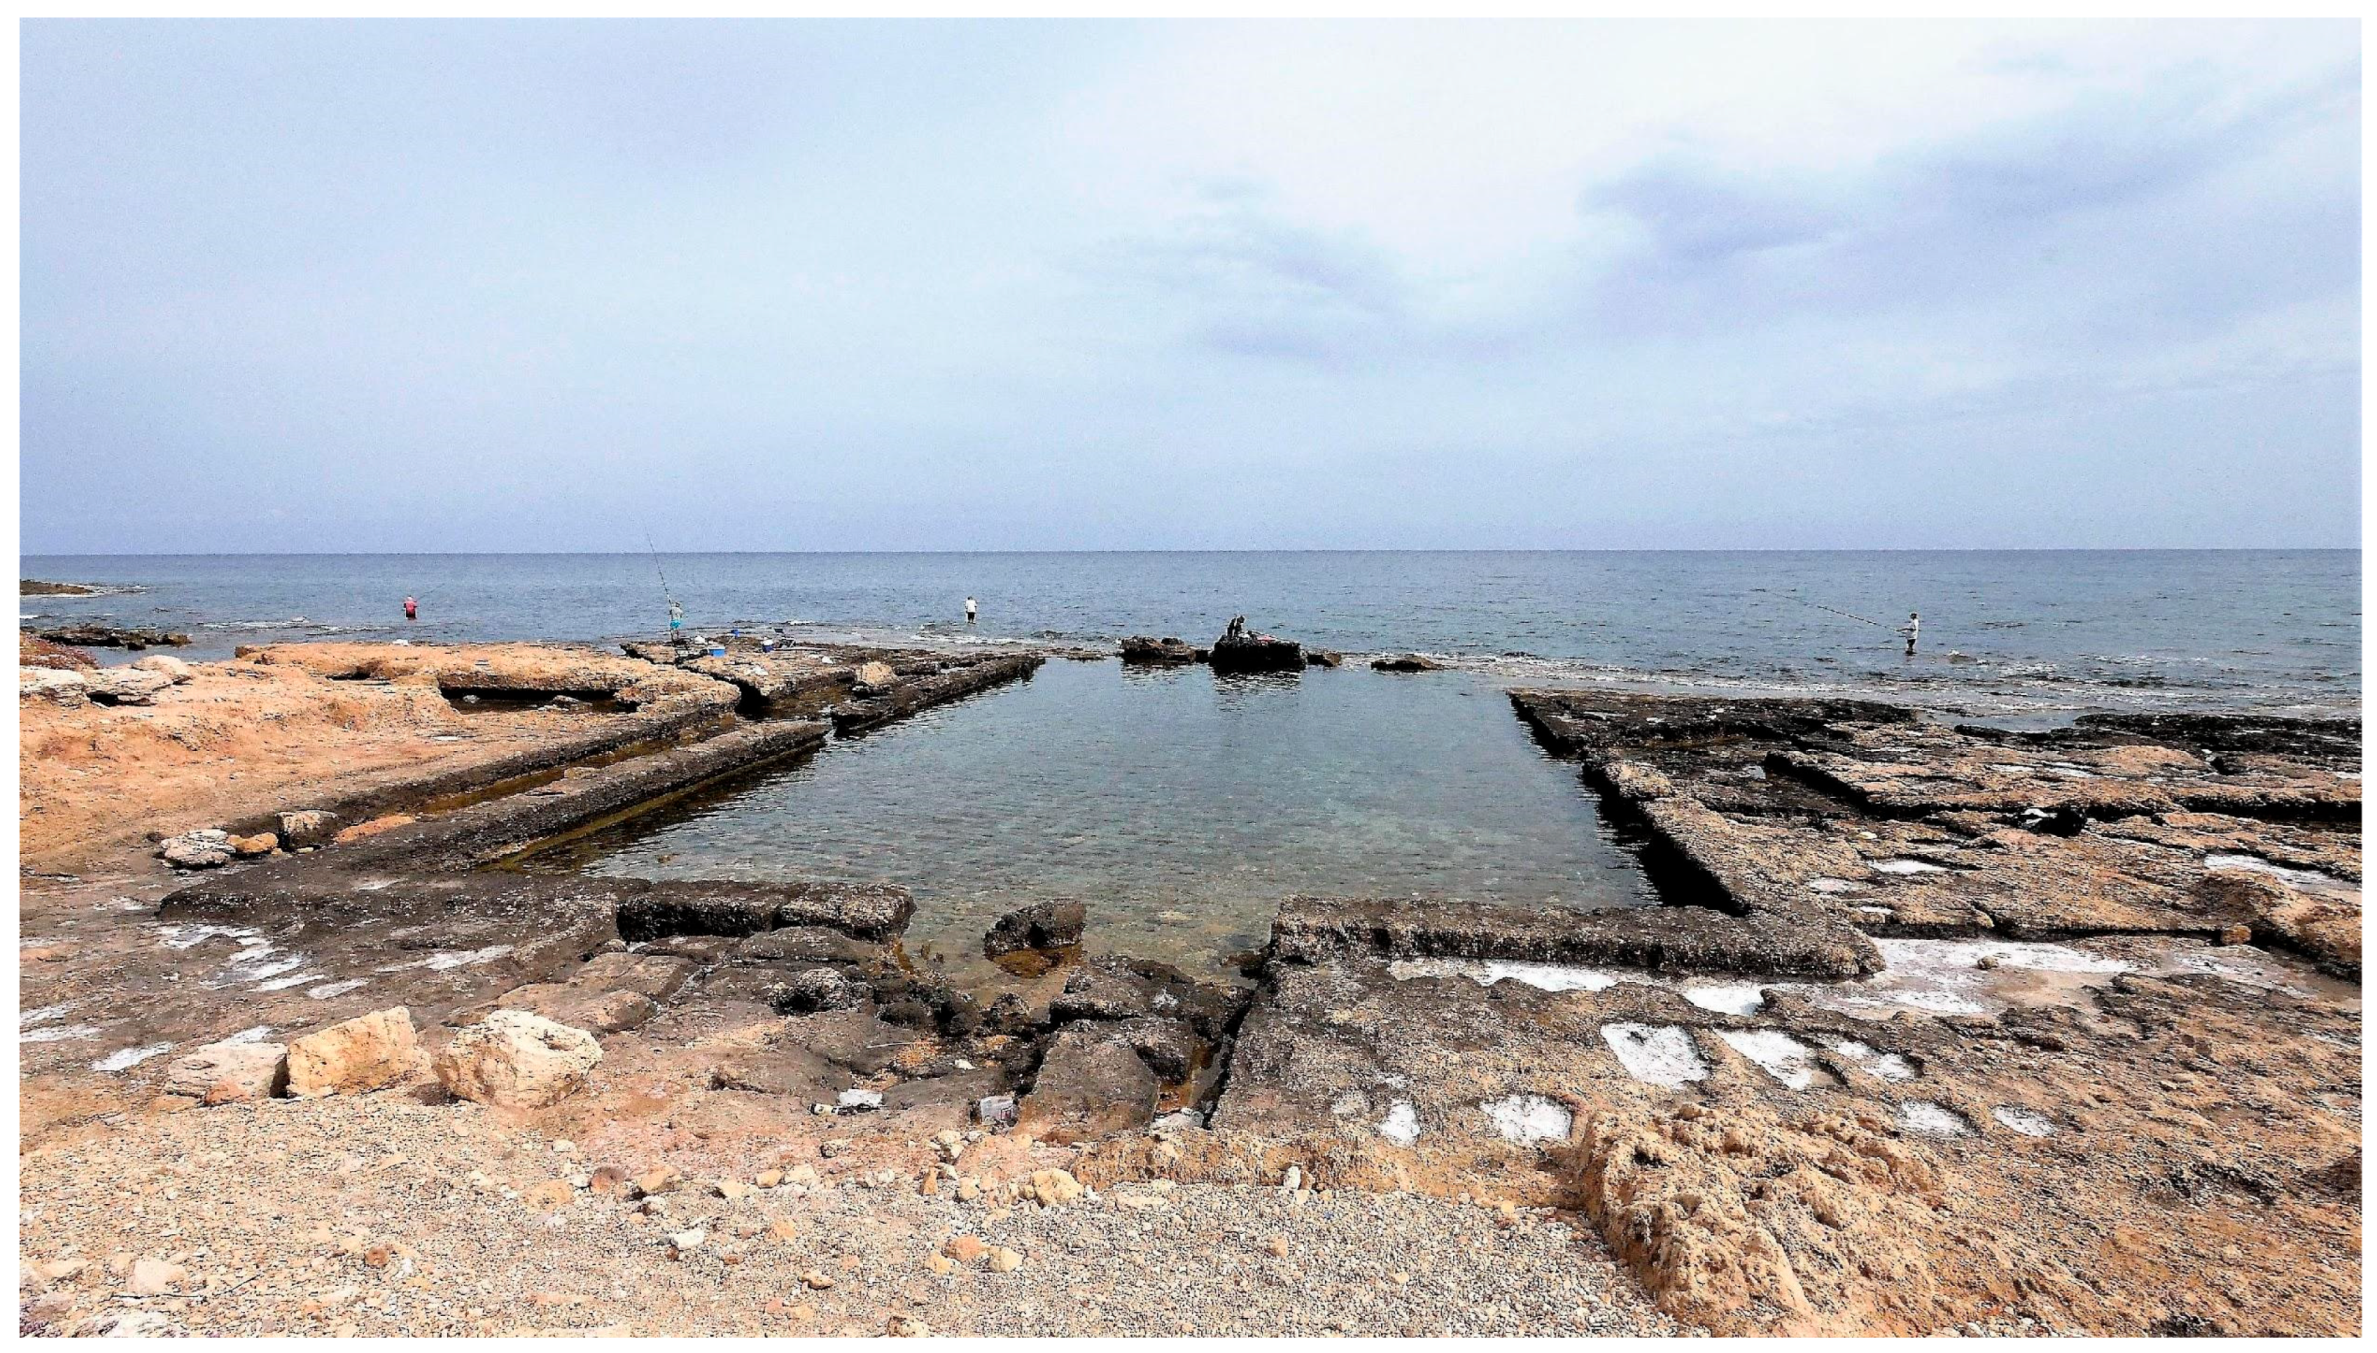
“Lapithos (Lambousa) remained an important city into Graeco-Roman times for we know from Ptolemy, the geographer that in the middle of the second century AD, Lapithos was one of the four districts of Cyprus, the others being Salamis, Paphos, and Amathus. Again, a principal oblong tank of similar proportion contains feeder channels, straddled by secondary tanks, slotted sluice gates, and smaller tanks unconnected to the main tank. Both sites also possess similar traditional names: Caesarea, The Pool of Cleopatra, and Lapithos, The Pool of the Queen.”
3. Materials and Methods
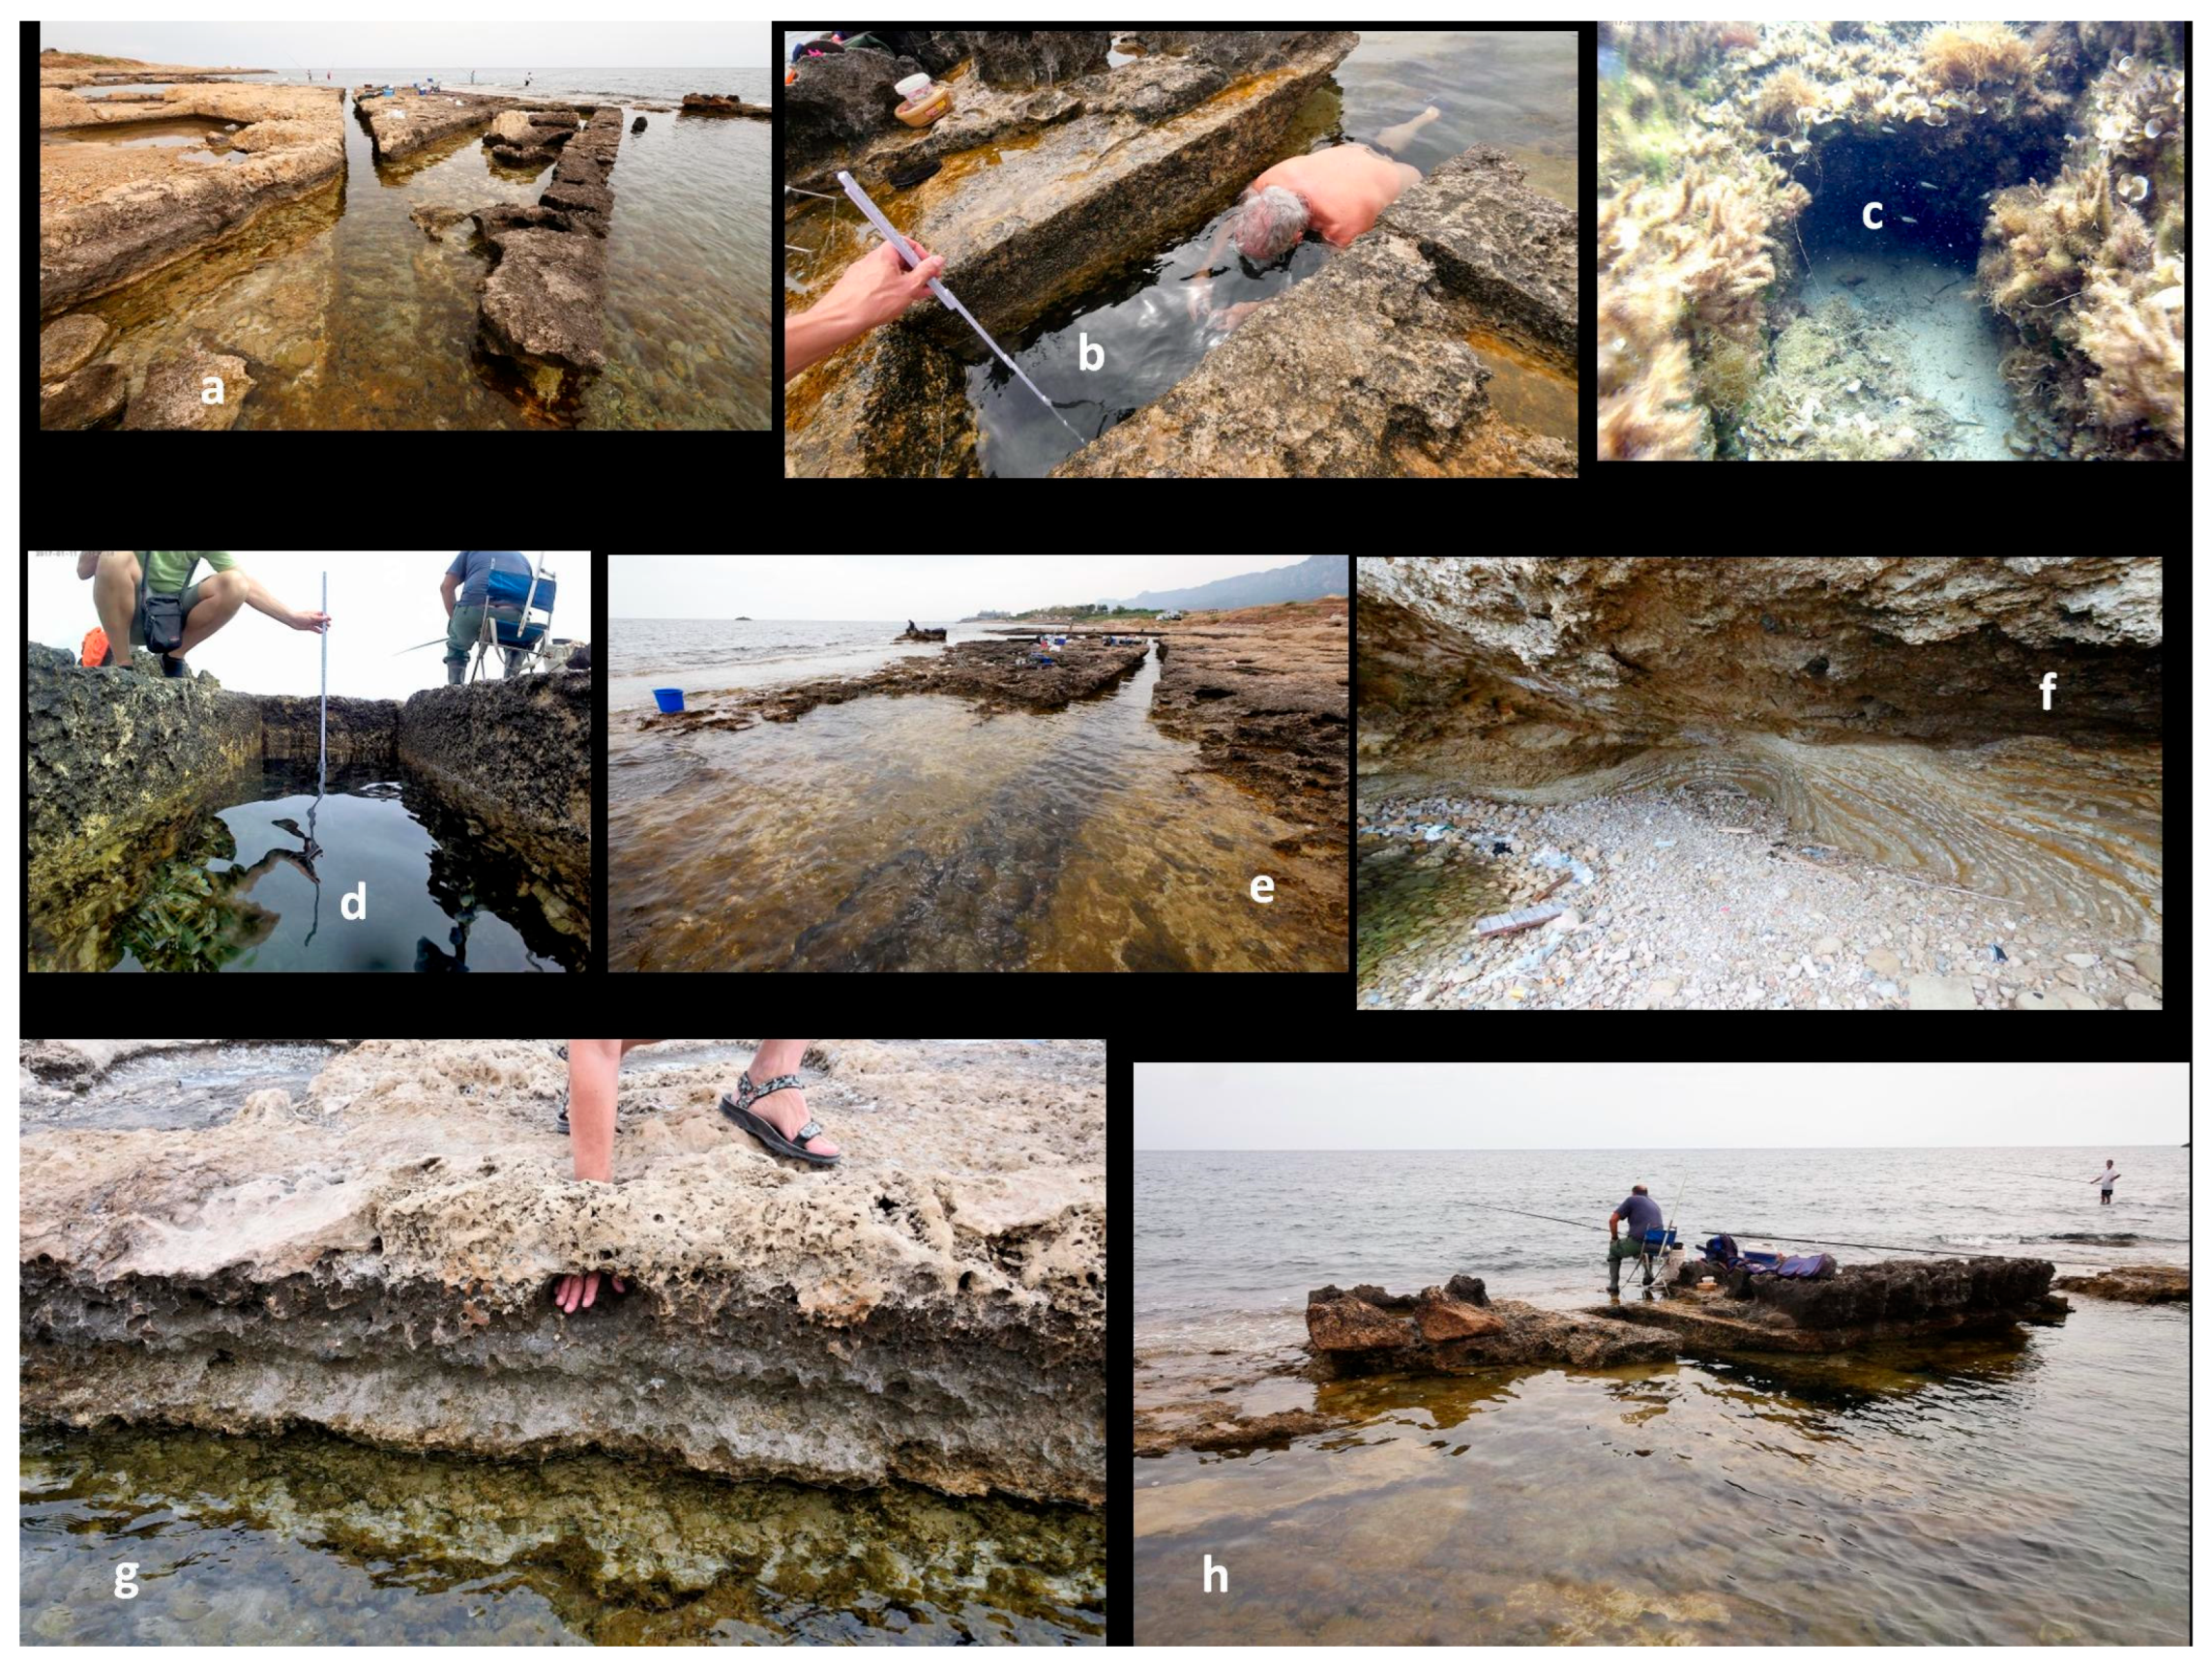
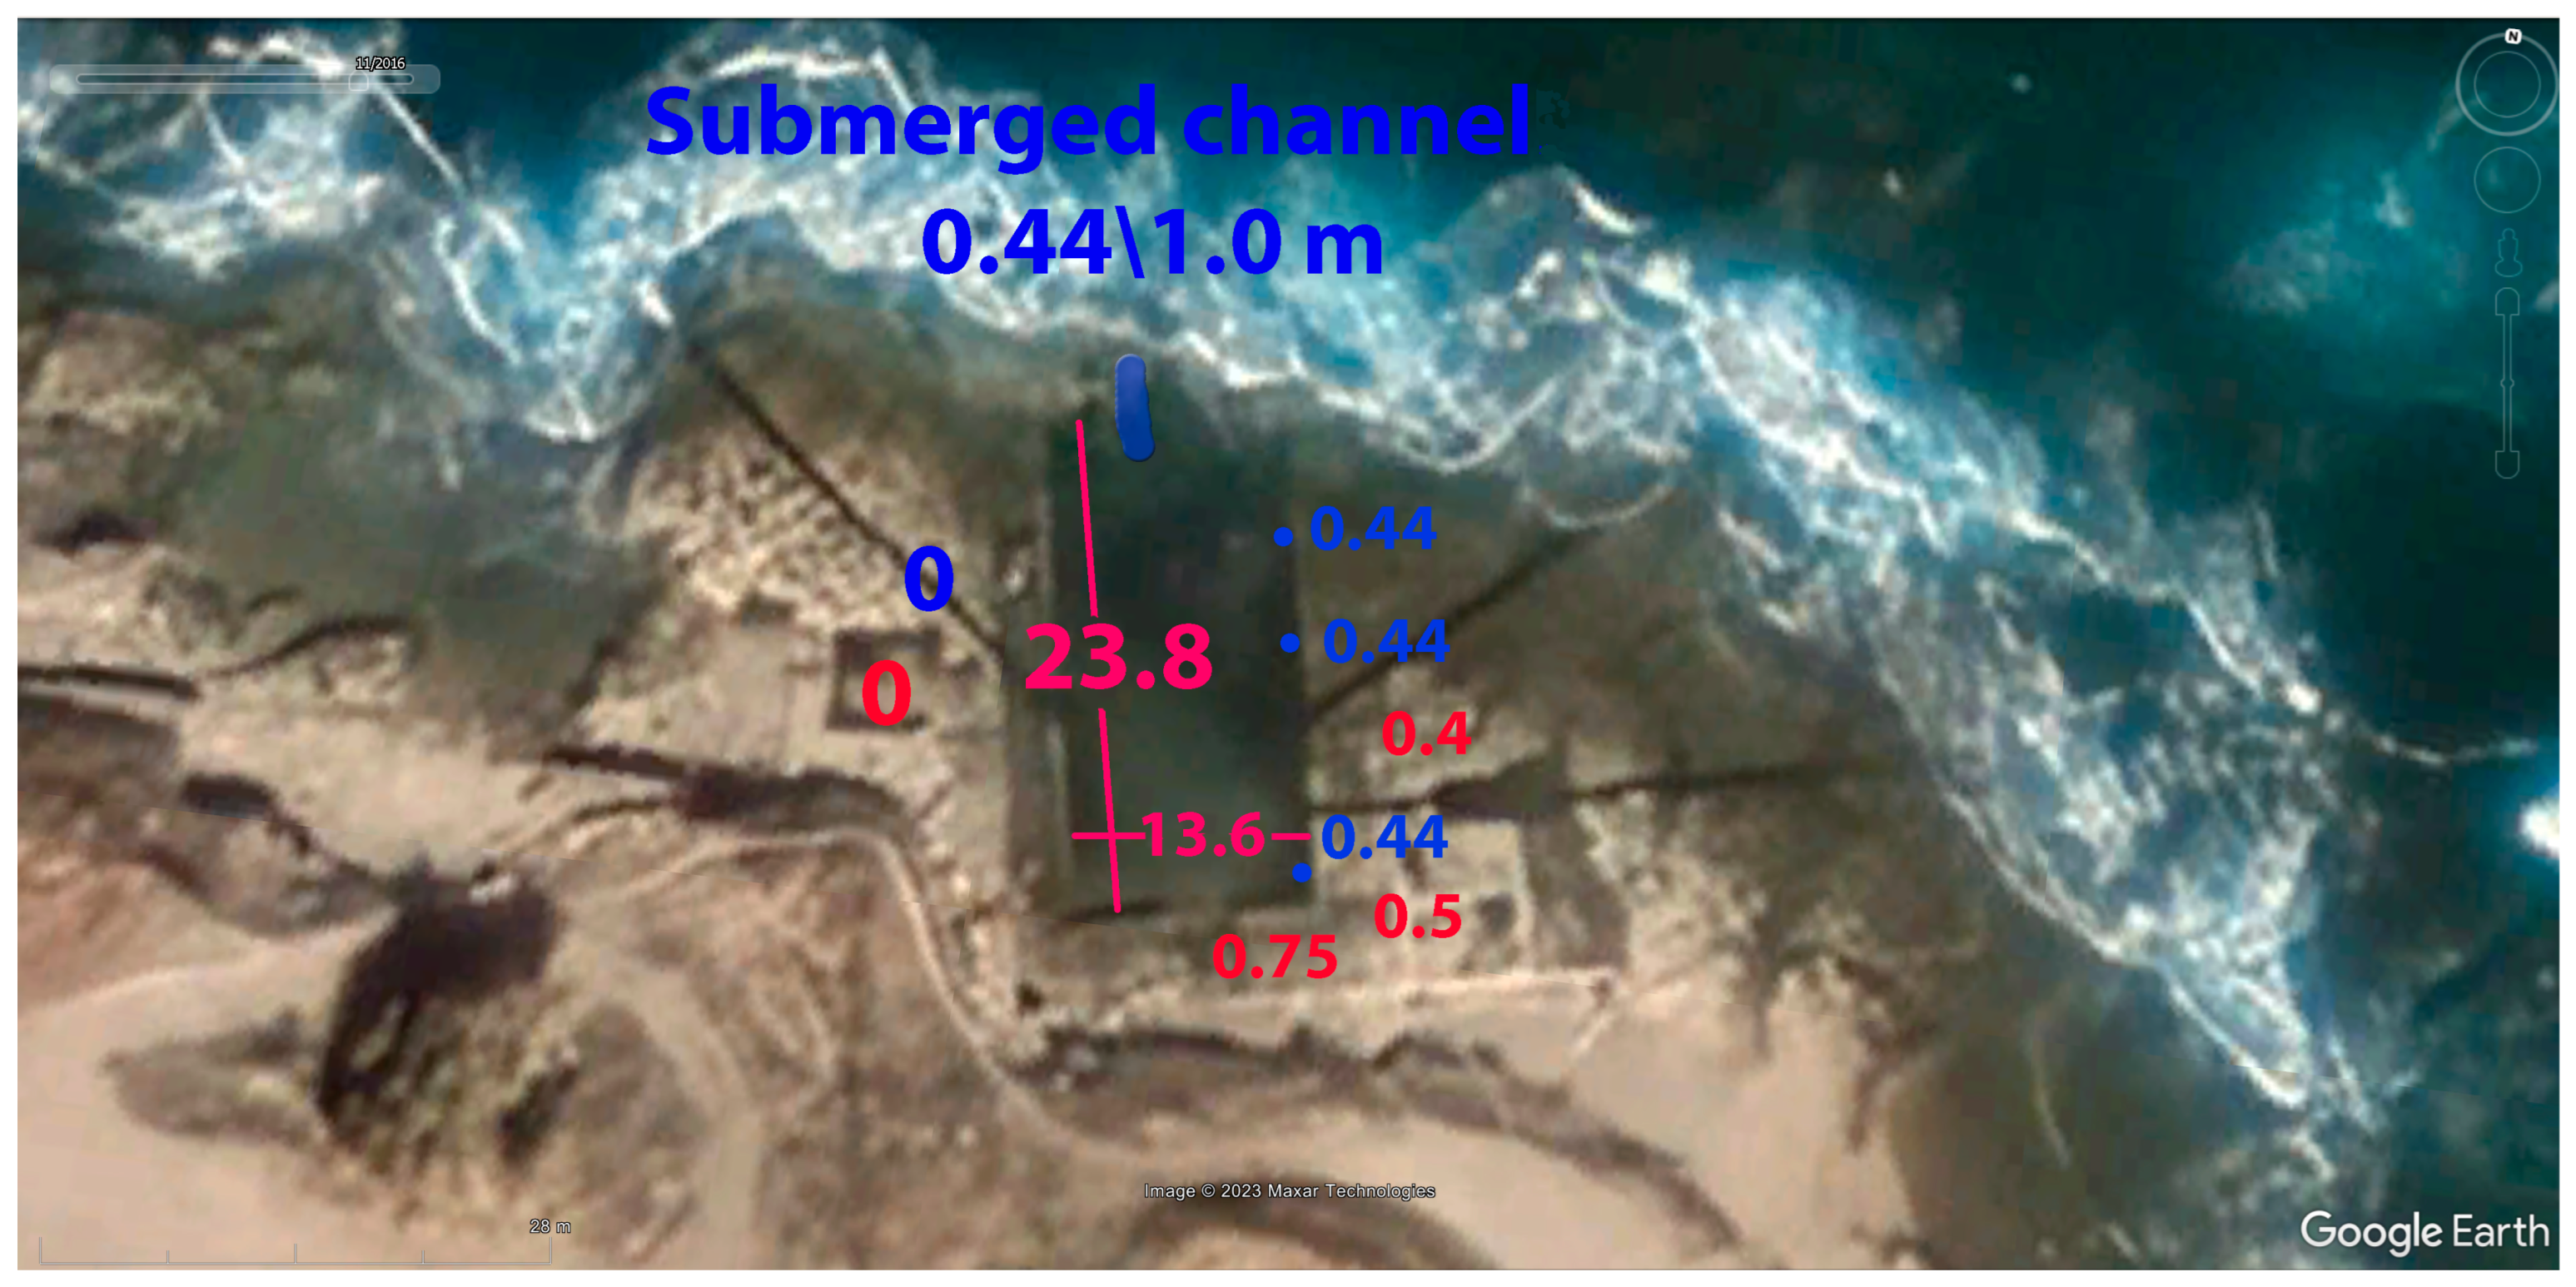
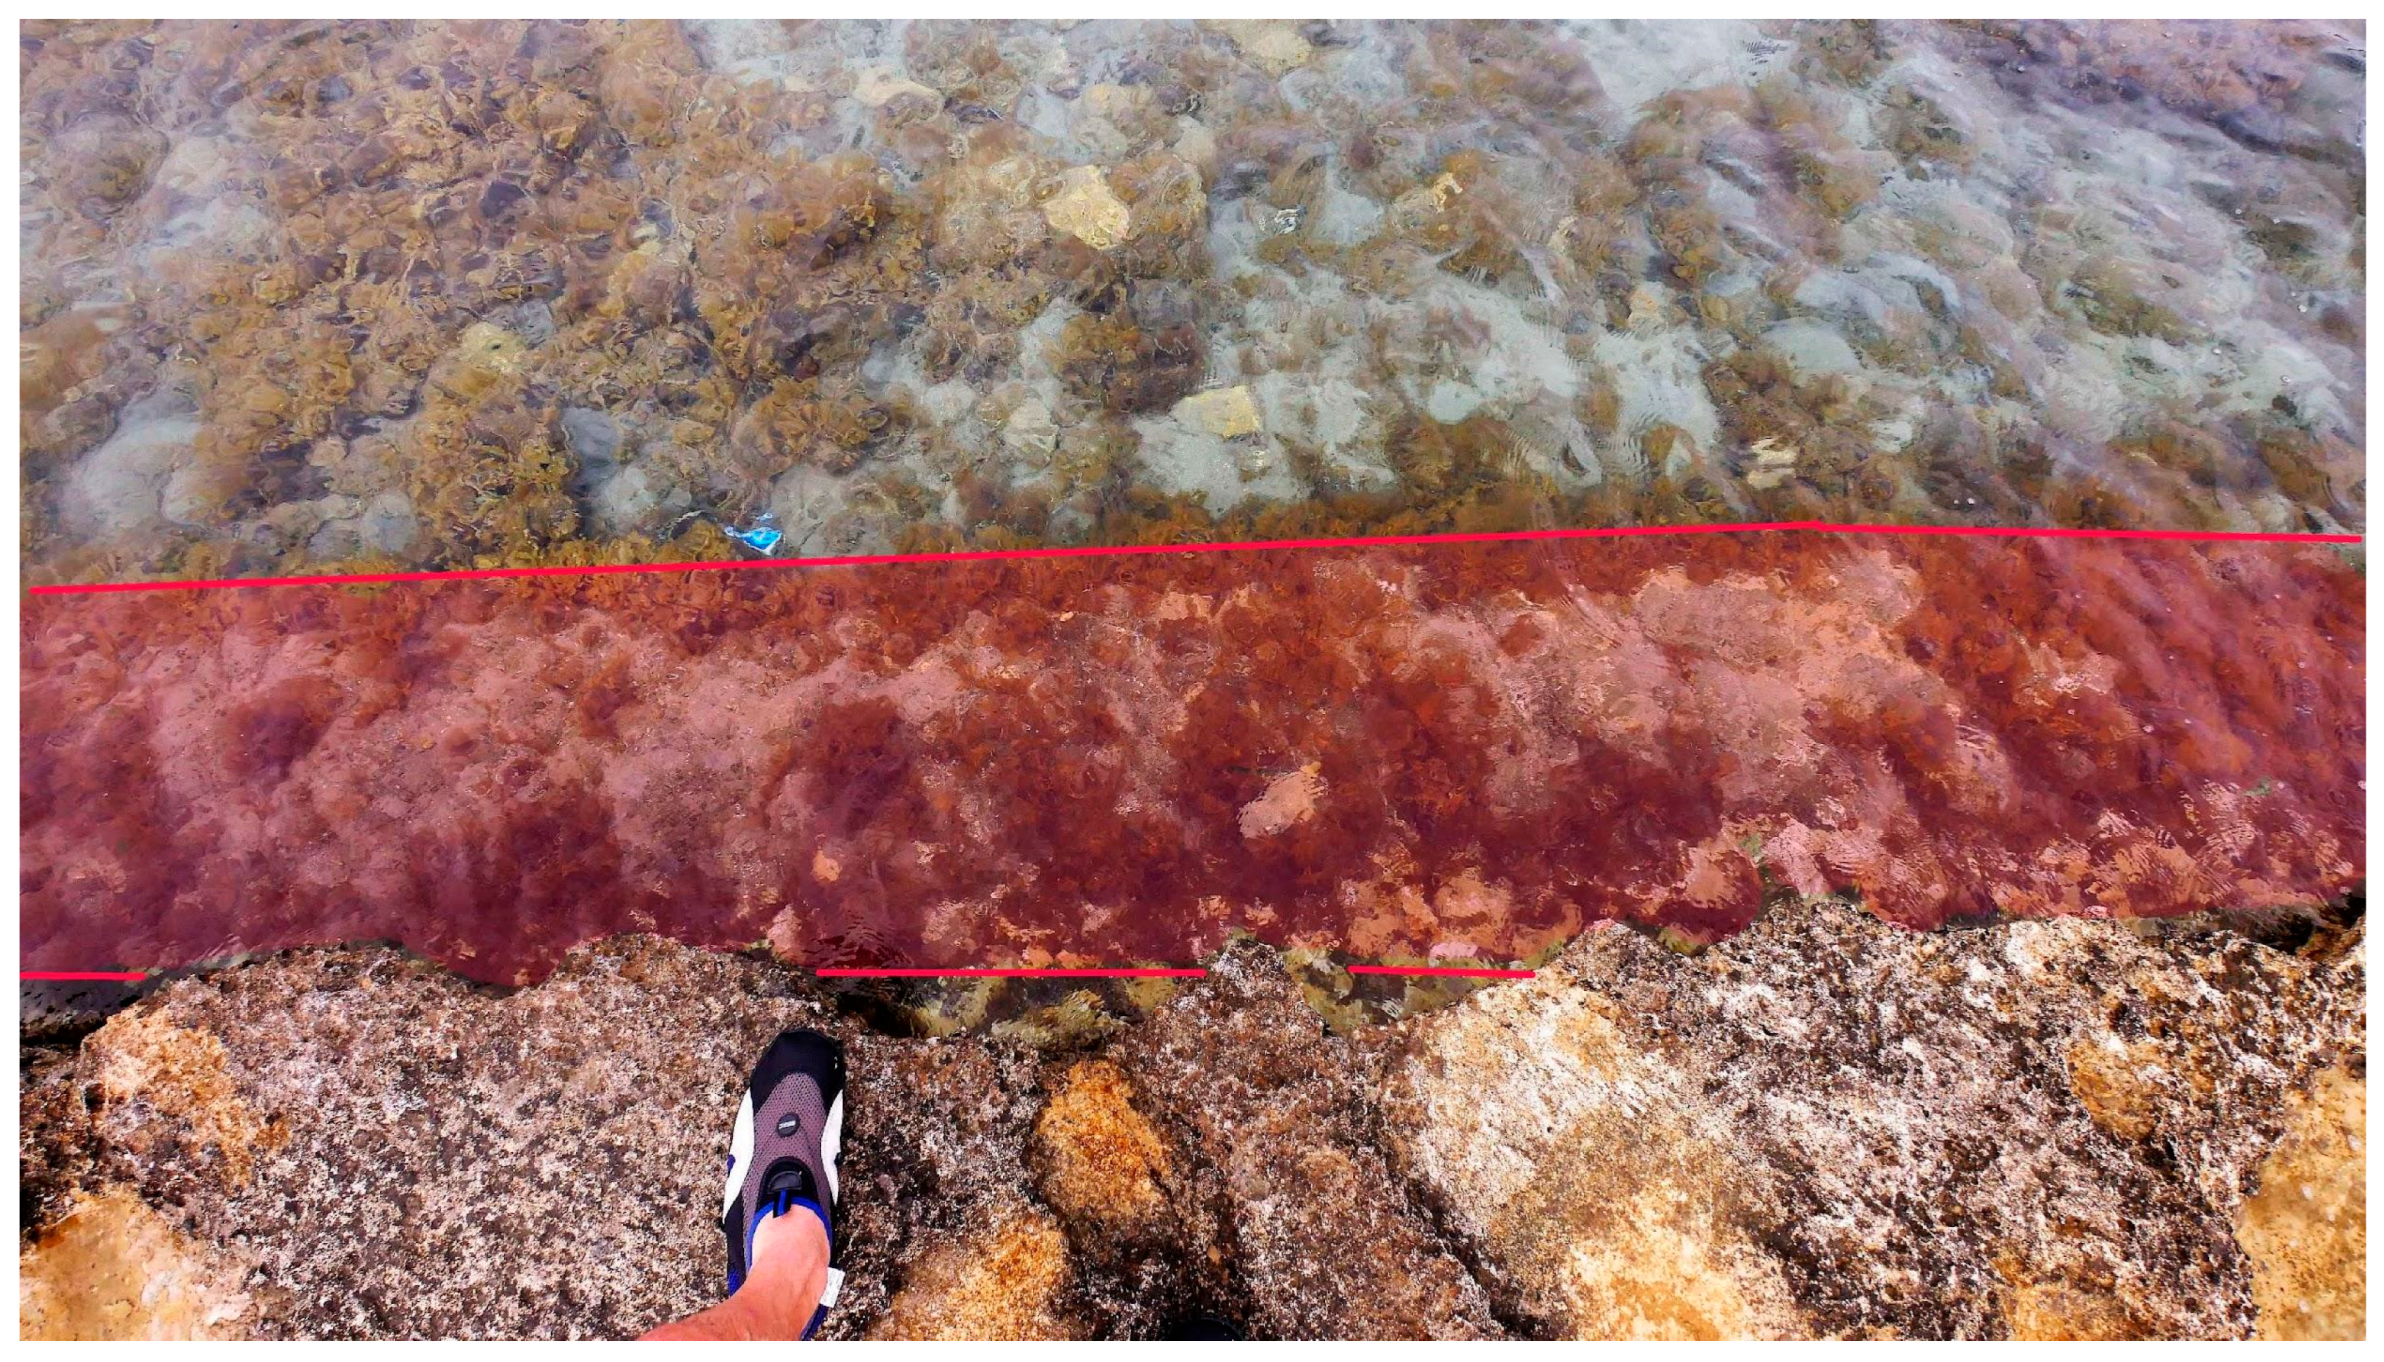
3.1. Surveys
3.2. GIA
4. Data
4.1. Field Data
4.2. GIA
5. Discussion
6. Conclusions
Author Contributions
Funding
Data Availability Statement
Acknowledgments
Conflicts of Interest
References
- Galili, E.; Sevketoglu, M.; Salamon, A.; Zviely, D.; Mienis, H.K.; Rosen, B.; Moshkovitz, S. Late Quaternary beach deposits and archaeological relicts on the coasts of Cyprus, and the possible implications of sea-level changes and tectonics on the early populations. Geol. Soc. Lond. Spec. Publ. 2015, 411, 179–218. [Google Scholar] [CrossRef]
- Auriemma, R.; Solinas, E. Archaeological remains as sea level change markers: A review. Quat. Int. 2009, 206, 134–146. [Google Scholar] [CrossRef]
- Schmiedt, G. Il Livello Antico del Mar Tirreno, Testimonianze da Resti Archeologici; E. Olschki: Firenze, Italy, 1972; 323p. [Google Scholar]
- Florido, E.; Auriemma, R.; Faivre, S.; Radi’c Rossi, I.; Antonioli, F.; Furlani, S.; Spada, G. Istrian and Dalmatian fishtanks as sea-level markers. Quat. Int. 2011, 232, 105–113. [Google Scholar] [CrossRef]
- Lambeck, K.; Anzidei, M.; Antonioli, F.; Benini, A.; Esposito, A. Sea level in Roman time in the Central Mediterranean and implications for recent change. Earth Planet. Sci. Lett. 2004, 224, 563–575. [Google Scholar] [CrossRef]
- Lambeck, K.; Anzidei, M.; Antonioli, F.; Benini, A.; Verrubbi, V. Tyrrhenian sea level at 2000 BP: Evidence from Roman age fish tanks and their geological calibration. Rend. Lincei. Sci. Fis. Nat. 2018, 29, 69–80. [Google Scholar] [CrossRef]
- Mourtzas, N. Fish tanks of eastern Crete (Greece) as indicators of the Roman sea level. J. Archaeol. Sci. 2012, 39, 2392–2408. [Google Scholar] [CrossRef]
- Mourtzas, N. Archaeological indicators for sea level change and coastal neotectonics deformation: The submerged Roman fish tanks of the gulf of Matala, Crete, Greece. J. Archaeol. Sci. 2012, 39, 884–895. [Google Scholar] [CrossRef]
- Flinder, A. The fish-tanks. Int. J. Naut. Archaeol. 1976, 5, 136–141. [Google Scholar] [CrossRef]
- Mart, Y.; Ryan, B.F. The complex tectonic regime of the Cyprus Arc: A short review. Isr. J. Earth Sci. 2015, 51, 117–123. [Google Scholar] [CrossRef]
- Zomeni, Z. Quaternary Marine Terraces on Cyprus: Constraints on Uplift and Pedogenesis, and the Geoarchaeology of Palaipafos. Ph.D. Thesis, Oregon State University, Corvallis, OR, USA, 2012. [Google Scholar]
- Ferranti, L.; Antonioli, F.; Mauz, B.; Amorosi, A.; Dai Pra, G.; Mastronuzzi, G.; Monaco, C.; Pappalardo, M. Markers of the last interglacial sea-level high stand along the coast of Italy: Tectonic implications. Quat. Int. 2006, 145, 30–54. [Google Scholar] [CrossRef]
- Farrell, W.E.; Clark, J.A. On postglacial sea level. Geophys. J. R. Astron. Soc. 1976, 46, 647–667. [Google Scholar] [CrossRef]
- Spada, G.; Melini, D. SELEN4 (SELEN version 4.0): A Fortran program for solving the gravitationally and topographically self-consistent sea-level equation in glacial isostatic adjustment modeling. Geosci. Model Dev. 2019, 12, 5055–5075. [Google Scholar] [CrossRef]
- Spada, G.; Melini, D. New estimates of ongoing sea level change and land movements caused by Glacial Isostatic Adjustment in the Mediterranean region. Geophys. J. Int. 2022, 229, 984–998. [Google Scholar] [CrossRef]
- Peltier, W.R. Global glacial isostasy and the surface of the ice-age Earth: The ICE-5G (VM2) model and GRACE. Annu. Rev. Earth Planet. Sci. 2004, 32, 111–149. [Google Scholar] [CrossRef]
- Mitrovica, J.X.; Milne, G.A. Glaciation-induced perturbations in the Earth’s rotation: A new appraisal. J. Geophys. Res. Solid Earth 1998, 103, 985–1005. [Google Scholar] [CrossRef]
- Argus, D.F.; Peltier, W.R.; Drummond, R.; Moore, A.W. The Antarctica component of postglacial rebound model ICE-6G_C (VM5a) based upon GPS positioning, exposure age dating of ice thicknesses, and relative sea level histories. Geophys. J. Int. 1988, 198, 537–563. [Google Scholar] [CrossRef]
- Peltier, W.R.; Argus, D.F.; Drummond, R. Space geodesy constrains ice-age terminal deglaciation: The global ICE-6G_C (VM5a) model. J. Geophys. Res. Solid Earth 2015, 120, 450–487. [Google Scholar] [CrossRef]
- Roy, K.; Peltier, W.R. Glacial isostatic adjustment, relative sea level history and mantle viscosity: Reconciling relative sea level model predictions for the US East coast with geological constraints. Geophys. J. Int. 2015, 201, 1156–1181. [Google Scholar] [CrossRef]
- Roy, K.; Peltier, W.R. Space-geodetic and water level gauge constraints on continental uplift and tilting over North America: Regional convergence of the ICE-6G_C (VM5a/VM6) models. Geophys. J. Int. 2017, 210, 1115–1142. [Google Scholar] [CrossRef]
- Lambeck, K.; Purcell, A. Sea-level change in the Mediterranean Sea since the LGM: Model predictions for tectonically stable areas. Quater. Sci. Rev. 2005, 24, 1969–1988. [Google Scholar] [CrossRef]
- Roy, K.; Peltier, W.R. Relative sea level in the Western Mediterranean basin: A regional test of the ICE-7G_NA (VM7) model and a constraint on Late Holocene Antarctic deglaciation. Quat. Sci. Rev. 2018, 183, 76–87. [Google Scholar] [CrossRef]
- Melini, D.; Spada, G. Some remarks on glacial isostatic adjustment modelling uncertainties. J. Geophys. Int. 2019, 218, 401–413. [Google Scholar] [CrossRef]
- Cardello, G.; Antonioli, F.; Barreca, G.; Monaco, C. First comparison of instrumental European Ground Motion Service by Copernicus data with short and long term geological vertical movements for the Italian coasts. In Proceedings of the XXI INQUA Congress, From Natural Processes to Geohazards Session 176: Tectonic and Climate-Driven Landscape Evolution a Never-Ending Challenge for Modern, Roma, Italy, 14–20 July 2023; Volume #4107. [Google Scholar]
- Antonioli, F.; Ferranti, L.; Stocchi, P.; Deiana, G.; Lo Presti, V.; Furlani, S.; Marino, C.; Orru, P.; Scicchitano, G.; Trainito, E.; et al. Morphometry and elevation of the last interglacial tidal notches in tectonically stable coasts of the Mediterranean Sea. Earth-Sci. Rev. 2018, 185, 600–623. [Google Scholar]
- Howes, D.; Dawson, A.; Smith, D. Late Holocene coastal tectonics at Falasarna_western_Crete a sedimentary sedimentary. Geol. Soc. Lond. Spec. Publ. 1998, 146, 343–352. [Google Scholar] [CrossRef]
- Anzidei, M.; Antonioli, F.; Benini, A.; Gervasi, A.; Guerra, I. Evidence of vertical tectonic uplift at Briatico (Calabria, Italy) inferred from Roman age maritime archaeological indicators. Quat. Int. 2012, 288, 158–167. [Google Scholar] [CrossRef]
- Faccenna, C.; Becker, T.; Auer, L.; Billi, A.; Boschi, L.; Brun, J.P.; Capitanio, F.; Funiciello, F.; Horvàth, F.; Jolivet, L.; et al. Mantle dynamics in the Mediterranean. Rev. Geophys. 2014, 52, 283–332. [Google Scholar] [CrossRef]
- Oikonomou, P.; Karkani, A.; Evelpidou, N.; Kampolis, I.; Spada, G. The Fish Tanks of the Mediterranean Sea. Quaternary 2023, 6, 24. [Google Scholar] [CrossRef]


Disclaimer/Publisher’s Note: The statements, opinions and data contained in all publications are solely those of the individual author(s) and contributor(s) and not of MDPI and/or the editor(s). MDPI and/or the editor(s) disclaim responsibility for any injury to people or property resulting from any ideas, methods, instructions or products referred to in the content. |
© 2023 by the authors. Licensee MDPI, Basel, Switzerland. This article is an open access article distributed under the terms and conditions of the Creative Commons Attribution (CC BY) license (https://creativecommons.org/licenses/by/4.0/).
Share and Cite
Antonioli, F.; Furlani, S.; Spada, G.; Melini, D.; Zomeni, Z. The Lambousa (Cyprus) Fishtank in a Quasi-Stable Coastal Area of the Eastern Mediterranean, a Notable Marker for Testing GIA Models. Geosciences 2023, 13, 280. https://doi.org/10.3390/geosciences13090280
Antonioli F, Furlani S, Spada G, Melini D, Zomeni Z. The Lambousa (Cyprus) Fishtank in a Quasi-Stable Coastal Area of the Eastern Mediterranean, a Notable Marker for Testing GIA Models. Geosciences. 2023; 13(9):280. https://doi.org/10.3390/geosciences13090280
Chicago/Turabian StyleAntonioli, Fabrizio, Stefano Furlani, Giorgio Spada, Daniele Melini, and Zomenia Zomeni. 2023. "The Lambousa (Cyprus) Fishtank in a Quasi-Stable Coastal Area of the Eastern Mediterranean, a Notable Marker for Testing GIA Models" Geosciences 13, no. 9: 280. https://doi.org/10.3390/geosciences13090280