

An Enhanced Catalog of Repeating Earthquakes on the 1980 Irpinia Fault System, Southern Italy


1
Department of Physics “Ettore Pancini”, University of Naples “Federico II”, Via Cinthia, 21, 80126 Napoli, Italy
2
Seismological Research Centre, OGS Istituto Nazionale di Oceanografia e di Geofisica Sperimentale, Borgo Grotta Gigante 42/C, 34010 Sgonico, Italy
*
Author to whom correspondence should be addressed.
Geosciences 2024, 14(1), 8; https://doi.org/10.3390/geosciences14010008
Submission received: 27 October 2023
/
Revised: 15 December 2023
/
Accepted: 19 December 2023
/
Published: 24 December 2023
(This article belongs to the Section Natural Hazards)
Abstract
:A pilot study employing a template-matching approach on the detection of repeating earthquakes (or repeaters) in a small volume of the Irpinia fault (Southern Italy) is presented here. A catalog of repeaters nucleating over about a decade with local magnitudes ranging between 0.4 and 1.7 is generated. The events nucleate at depths of about 11 km over a fault patch with a size of about 600 m. Assuming a constant stress drop for all repeaters, the yearly coseismic slip rate of the patch is estimated in the range of 1–4.8 mm with a mean value of about 3.4 mm, which is close to the fault slip rate estimated by geodetic approaches. Given the mechanical properties of the medium in the source region of the repeaters revealed by previous tomographic studies, and in particular the high Vp/Vs ratio (close to 1.95), it is postulated that these events are fluid triggered, consistently with the mechanism proposed for the generation of most of the microseismicity in the area. The encouraging outcomes of this study suggest to focus future measurement campaigns on this area and open perspectives to extend this approach to other segments of the Irpinia fault to reveal small-scale frictional properties in an area capable to generate M7 earthquakes.
1. Introduction
Improving our understanding of the physical processes leading to large earthquakes is one of the main goals of near fault observatories [1]. This goal is tightly connected to the knowledge of the mechanical and frictional conditions of a fault or a network of faults, which in turn can be inferred by studying the source of small or moderate earthquakes [2,3].
A very peculiar class of seismicity that can be used to precisely constrain the local spatiotemporal interface slip and related frictional properties is constituted by the repeating earthquakes or repeaters. Repeaters are defined as earthquakes displaying very similar waveforms when recorded at the same sensor and repeating over time [4].
Repeaters nucleate stably on a segment of the fault, so that path and site effects between source and station are common [5,6]. Due to their stability over time, the source of the repeaters is usually modeled as the repeated activation of an asperity surrounded by domains with different frictional properties. Moreover, repeaters appear to be a good proxy of the interface coupling, can give insights on the very local interface frictional properties, and can be considered as a natural strainmeter located at depth. The size of the asperities producing the repeaters can be as small as few hundreds of meters or even less, making the analysis of the repeaters a powerful and unique tool to map the local interface stress state at depth [7].
Repeaters usually show a time pattern with typical recurrence intervals of a few years or less and are often modeled as nucleating over locked patches distributed on an otherwise creeping fault zone. This modeling accounts for the evidence that the crustal stress accumulation rates (1–50 kPa/year in plate boundary zones [4]) are a small fraction of typical earthquake stress drops (1–10 MPa), indicating a heterogeneous loading rate over the fault interface—higher over the asperities producing the repeaters [4,6,8].
Repeaters have been found in several areas all over the world and in different tectonic contexts, ranging from subduction margins to volcanic areas and geothermal fields [9,10]. Advanced studies of the phenomenon have been carried out along the Japan subduction trench and the San Andreas fault, where they have been related with the standard seismicity and the aseismic slips allowing the modeling of the strike-dependent segmentation of the interface [11,12,13]. In Italy, near-repeaters have been detected in the Central Apennines including the Alto Tiberina Fault and the areas of the 2009 and the 2012 Emilia L’Aquila earthquakes [14,15,16,17].
Recently, near-repeating earthquakes have been observed to nucleate within a volume of the Cervialto segment of the Irpinia fault, in Southern Apennines, by using a multi-channel clustering approach [18]. The Irpinia area hosts an active extensional fault system arranged in subparallel structures with trends mainly ranging from WNW-ESE to NW-SE disseminated predominantly over the Apennines axial sector [19,20,21]. This area was hit on 23 November 1980 by the Ms 6.9 Irpinia earthquake, which was characterized by three main rupture episodes occurring within 40 s and which caused about 3000 fatalities and severe damage [22,23,24]. The seismicity of the Irpinia area has been monitored since 2005 by the Irpinia Seismic Network (ISNet http://isnet.fisica.unina.it [25], accessed on 22 December 2023), which consists of 31 seismic stations. The present-day seismicity is distributed over a large crustal volume around the fault segments that generated the Ms 6.9 Irpinia earthquake; the hypocentres span depths from 2 km to 20 km and show the largest earthquake density around the depths of 7 km and 12 km, that is, in carbonate lithology [20,26].
Recent studies on the microseismicity characteristics have provided evidence for structural segmentation and evolution of both crustal and source properties, as, for instance, the medium properties (e.g., [27]), the stress drop [3] and the ground motion intensity [28].
It is noteworthy that although this sector of central-southern Apennines is rather far from active volcanism (>70 km), several works have reported high outgassing of volatiles of deep origin, with CO2 being the dominant gaseous species [29,30]. Crustal fluids have been shown to play an important role in driving regional seismicity [31]. Similarly to other forms of crustal seismicity in different tectonic contexts [32,33], also in Irpinia, the background microseismicity appears partially controlled by fluids of different origin [34,35,36]. For instance, 3D velocity images and rock physical modeling suggest a porosity in carbonates around 4–5% and a fluid composition consisting of brine-CO2 and/or CH4-CO2 for the crustal area where the 1980 earthquake nucleated [37]. Often, the seismicity in the area occurs in seismic sequences, for which a mainshock triggers aftershocks by local stress re-distribution [38,39]. Recent evidence from studies on sequences [2,40] highlighted both stress drops and focal mechanisms compatible with the main orientation of the large faults that generated the 1980 Irpinia earthquake.
The main goal of this work was the identification and characterization of repeating earthquakes in the volume of the 1980 Irpinia earthquake. Given the source mechanism of these events, they can provide a unique constraint on the fault slip at depth. This kind of estimates is especially important in low-tectonic rate regions, where the limited resolution of geodetic observations does not allow an accurate measurement of small-scale co- and inter-seismic fault slips. This is also the case of Irpinia, where this limitation prevents detailed knowledge of the seismic (and potentially aseismic) accommodation over the complex fault network. In that sense, this work may be intended as a pilot study on the feasibility of detecting the slippage of very small fault domains, and thus eventually on the identification of small-scale segments of the Irpinia fault system by repeaters. The extent tp which these events can enlighten the local fault slip kinematics was investigated given the characteristics of the current monitoring seismic network and the low-magnitude earthquakes of the area, and we tried to depict how a proper development of the monitoring system can promote their detection and characterization. For these aims, the densest cluster of near-repeaters defined in Palo et al. [18] was focused on, and an enhanced catalog of repeating earthquakes was built using the events of this cluster as template and scanning the continuous seismic signal with a similarity search approach; eventually, a set of events radiated from a common small-scale fault patch was identified.
The paper is structured as follows: the dataset and the numerical approach used to generate the catalog are first introduced. Then, the events of the enhanced catalog are characterized in terms of magnitude, fault size, coseismic slip and differential to constrain the size of a slipping fault patch. Finally, the results are critically discussed in the context of the seismotectonic setting of Irpinia.
2. Data and Methods
This work took advantage of the results shown in Palo et al. [18], a paper that critically analyzed the spatial pattern of medium properties and source parameters of a set of 487 earthquakes detected at the ISNet spanning about 14 years, manually revised, and broadly located in a volume enclosing the Cervialto and Marzano fault segments of the Irpinia fault (see Figure 1). The authors found indications of an along-strike segmentation of the fault network, that is, of high- and a low-coupling segments. The high-coupling segment was characterized by high fraction of clustered seismicity, low b-value, high relative coseismic slip, low Vp/Vs (1.7–1.75). Moreover, in this segment, using multi-channel hierarchical agglomerative clustering, the authors identified a domain where clusters of microearthquakes with the characteristics of repeaters nucleate. Specifically, they found five clusters of “near-repeaters”: this term was adopted (similarly to the definitions used by other authors, e.g., [41,42]) because the clusters were defined based on the similarity between only the P phases of earthquake pairs and because the “near-repeater” clusters showed a relatively large dispersion of the hypocentres (up to about 1 km). The number of earthquakes over the 14 years composing these clusters ranged between 4 and 20. Here, the focus was on the largest of these clusters (Cluster 14 of the indexing of Palo et al. [18]—hereinafter SET-CL) and on the ISNet station where all events of the cluster were detected (labelled as SNR3 and referred to as reference station hereinafter). However, as the differential P and S arrival times of four events of SET-CL appeared inconsistent with the others, only 16 earthquakes of SET-CL were relocated in Palo et al. [18]. In Figure 1, the epicenters of the template set and the reference station together with the background seismicity of the area are displayed.
The catalog of repeaters searching for similar earthquakes (missing in the starting catalog of Palo et al. [18]) was extended using the template matching technique EQCorrscan [41] on velocimetric data. EQcorrscan is a template matching detection algorithm tailored for the analysis of similar earthquakes and repeating seismicity. It computes the normalized cross-correlations between the templates and the continuous data according to relation
where is the normalized cross-correlation coefficient for every sample y, t is the template, n is the length of the template, d is continuous data, is the local mean of continuous data between sample y and sample , and is the mean value of the template. Differently from other template matching detectors, EQCorrscan also returns a cross-correlation arrival time for the P/S waves on the detected events grounding on the time lag in the cross-correlation alignment with the most similar template.
The daily velocimetric recordings at the reference station were scanned from 1 January 2012 to 22 April 2022, which is the time interval of the available continuous signal at this station. For the scan, the same parametrization of Palo et al. [18] for the clustering analysis was adopted: the template events for Cluster 14 were extracted by bracketing the vertical component of 50 Hz downsampled velocity records from 0.4 s before to 1 s after the manual identification of P arrival times. As in Palo et al. [18], templates were filtered in the frequency band of 1–20 Hz using a 4th-order Butterworth bandpass filter. Continuous data were preprocessed matching the parameterization adopted for generating the templates. In both cases, preprocessing also included a linear detrend and a demeaning of the signals.
An event was declared when the cross-correlation (CC) between the portion of the continuous window and a template overcame 0.8, which was the threshold fixed in Palo et al. [18] to localize via a double-difference approach the events of SET-CL. In this way, 59 events (SET-A hereafter) were detected over the scanned time interval. This set of events also included some earthquakes belonging to the original SET-CL; in fact, the template-matching algorithm correctly recognized the events of SET-CL as one of the templates. It should be remarked that SET-A was defined based on only the P phase, according to the approach of Palo et al. [18], and hence only potentially formed an extended set of repeaters originating from the slip of a common fault patch. For this reason, SET-A was then refined introducing a threshold in the value of CC between P and S phases of each event of SET-A and an event (master event—EV-M) chosen from SET-CL, selecting in this way only the waveforms with high similarity over the whole signals and therefore sharing a common source fault area. EV-M was chosen as the earthquake with the largest Mw (2.7) and signal-to-noise ratio (about 15) among the events of SET-CL. Expected S arrival was fixed using the value of predicted by the 3D velocity model of De Landro et al. [27] and the hypocenter of EV-M from Palo et al. [18]. The vertical ground motion component was used for the P phase, and NS or EW components were used for the S phase.
Different lengths of time windows enclosing P and S phases, frequency intervals of a 4th order Butterworth band-pass filter, and CC thresholds were tested; eventually, the combination that allowed extraction of a subset of SET-A with clearly overlapping waveforms and aligned P and S phases was selected, that is, a set of repeating earthquakes. In the end, the parameters were chosen as follows: 0.6 s () for the time windows used for CC for both P and S phases, a band-pass frequency filter between 5 Hz and 20 Hz, and 0.75 and 0.6, respectively, for the CC thresholds between P and S phases. In all cases, preprocessing included a linear detrend and a demeaning of the traces. The time windows for CC started 0.1 s and 0.2 s before the manually picked P arrival and the expected S arrival, respectively. With these criteria, 12 events were selected that formed the SET-REP. From this set, EV-M was excluded as occurring in 2009, that is, beyond the analyzed time interval. On the other hand, at this stage, the inclusion of the 4 events already belonging to SET-CL was imposed to check the relation between near-repeaters and repeaters in terms of relative position of the radiating fault patches; further selection was performed, detailed below, based on the differential times to exclude events of SET-CL far from a common slipping fault patch.
For the sake of clarity, in summary, SET-CL was the original cluster of near-repeaters (occurring broadly in the time interval 2008–2021) from Palo et al. [18] that was used as a template to first identify SET-A, which in turn was composed of 59 events occurring in the time interval analyzed in this paper (2012–2021). A subset of SET-A with very high similarity with EV-M formed SET-REP, which was composed of 12 events over 2012–2021. It must be remarked that SET-A was introduced as an intermediate numerical step for the definition of SET-REP and neglected in the rest of the analysis.
Retrieval of SET-REP was also attempted at the other two stations of the ISNet relatively close to the source area of SET-CL (see Figure 1). However, due to several breaks in the acquisition of these stations, only a subset of SET-A was available (40 events at most). Moreover, and more importantly, no events were found for which the conditions on the CC of P and S phases were met–as a reference, only few events (5 at most) showed a CC on the P phase relative to EV-M higher than 0.6. Similar results were found, also changing the reference event.
3. Results
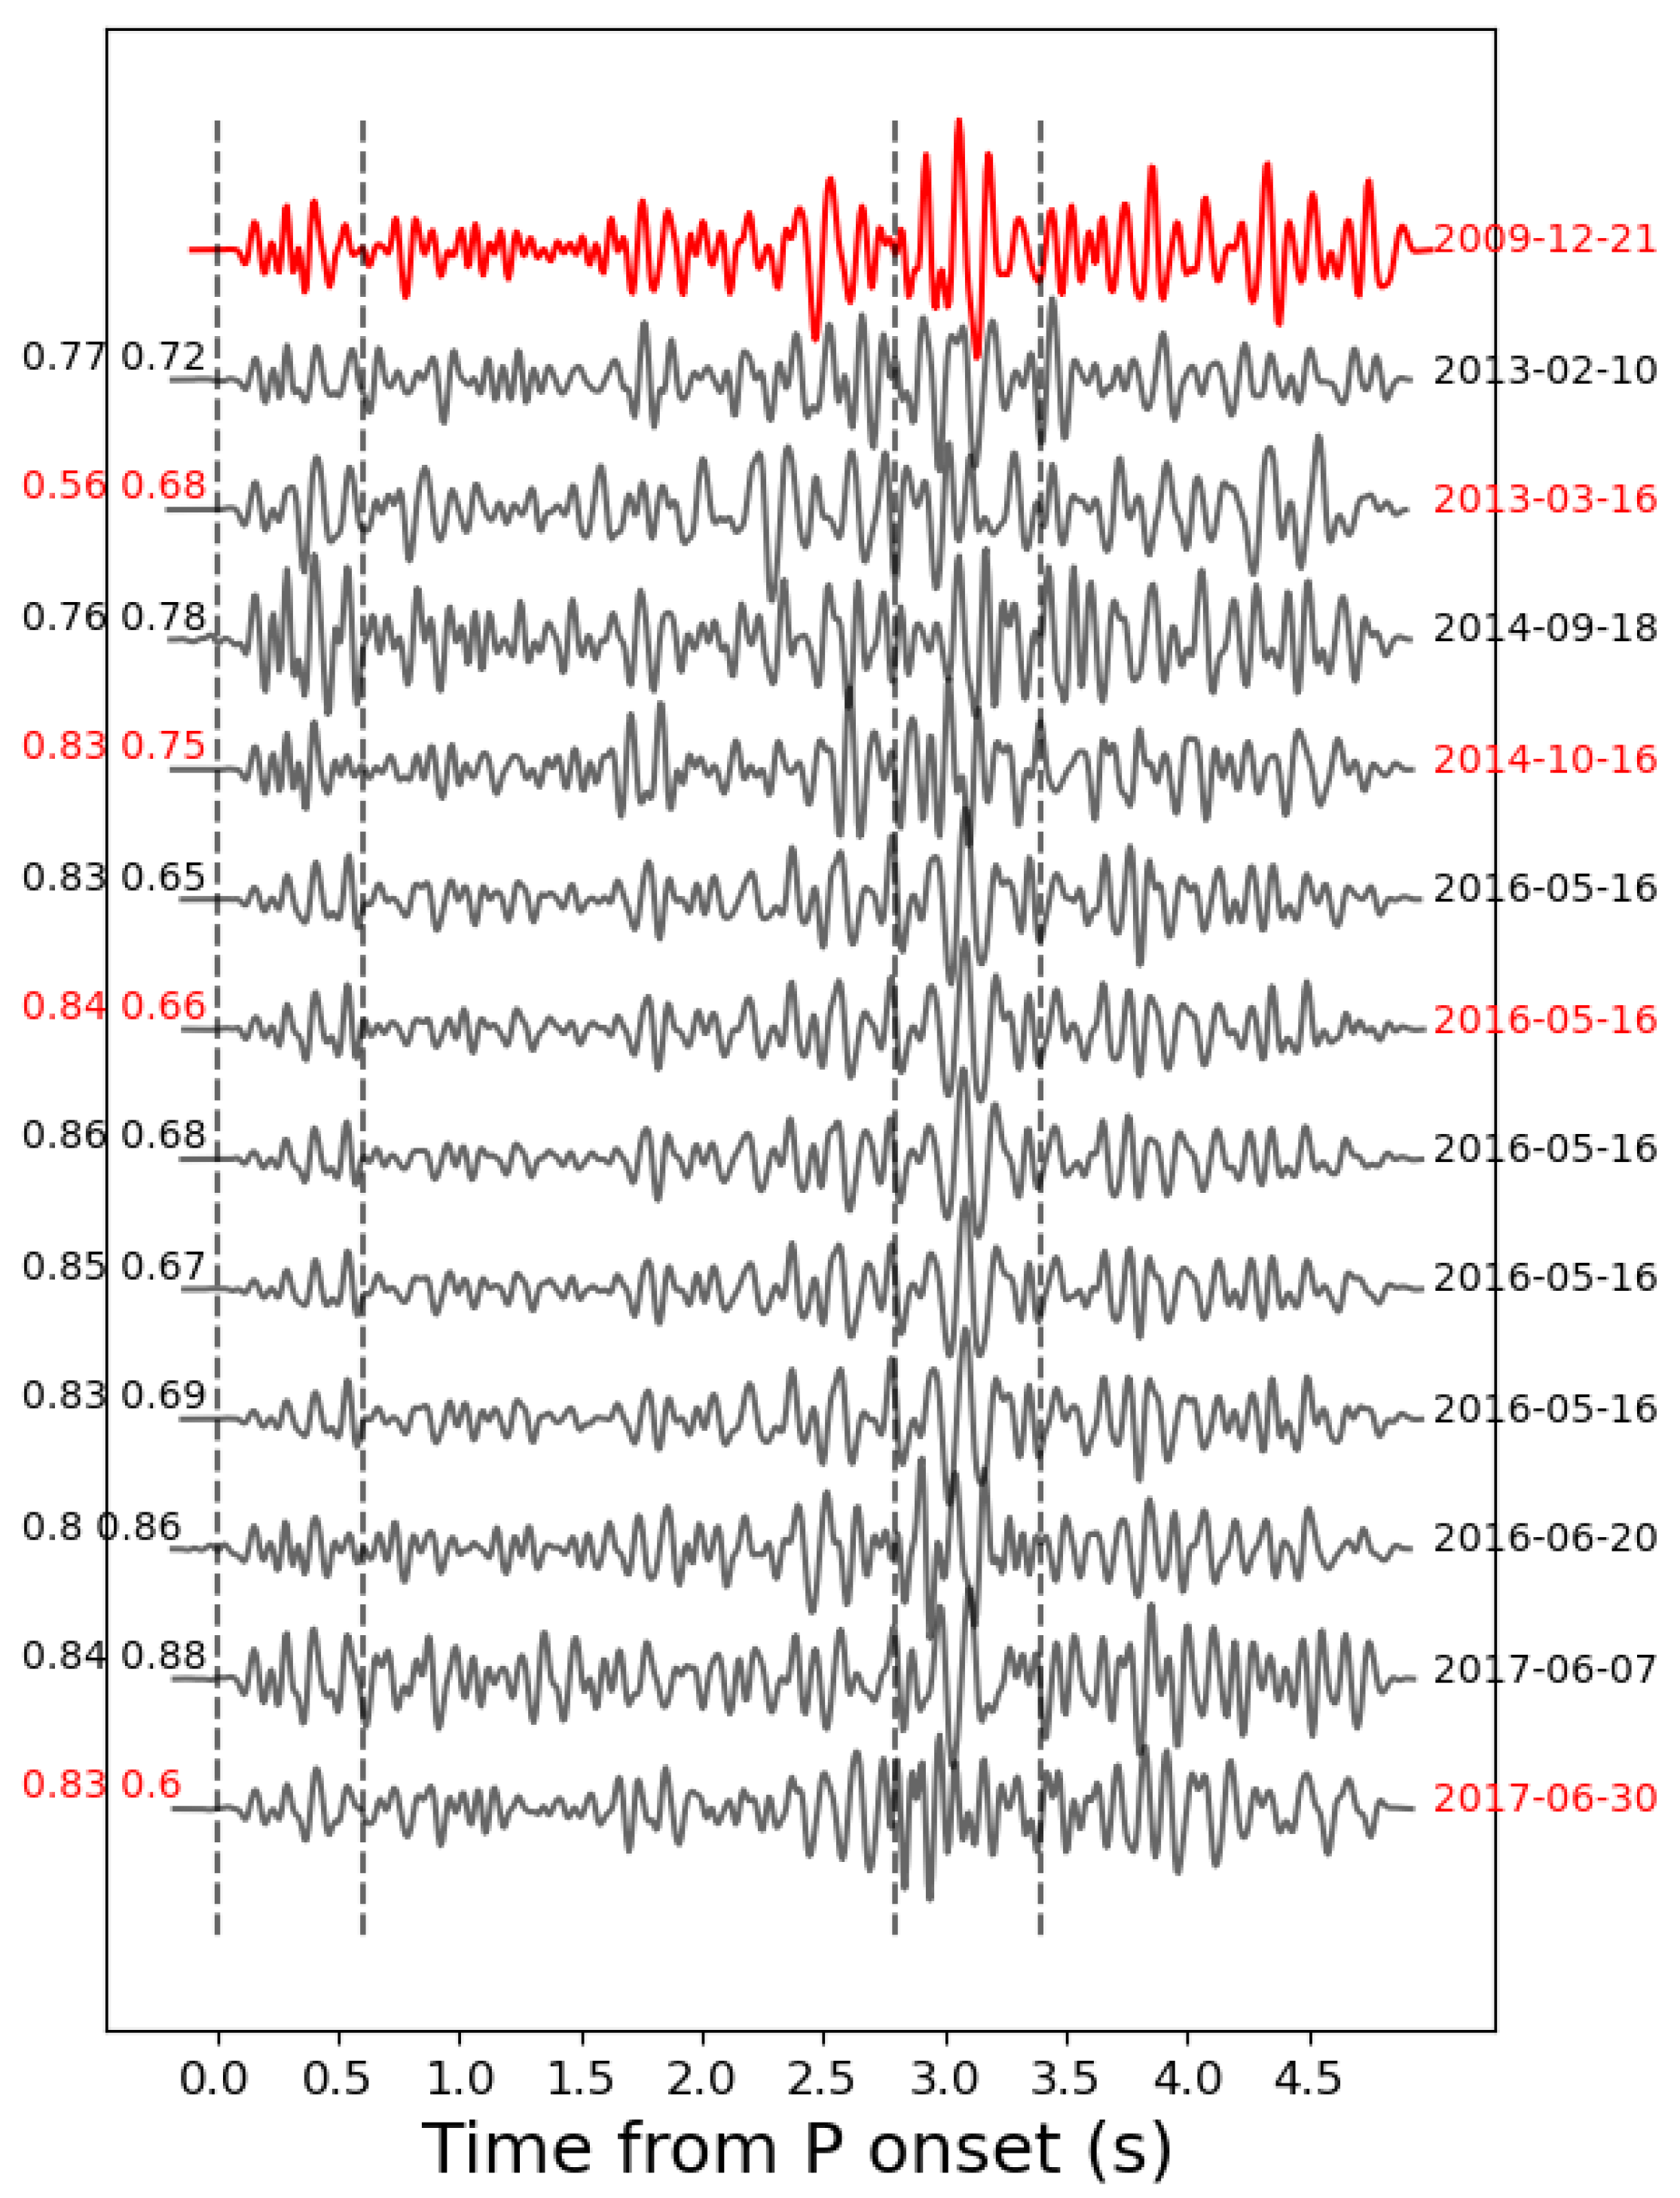
In Figure 2, the signals (vertical ground motion component) of the earthquakes of SET-REP are displayed. At the top of the figure, EV-M is plotted (red line). All amplitudes are normalized, in that the maximum amplitude of each earthquake plotted in the figure is made equal to one. On the right, the occurrence time of the earthquake is shown; in red, the events belonging to SET-CL are indicated. On the left, the CC values for the P and S phase between each event and EV-M are displayed. The dotted vertical lines mark the time windows adopted for the calculation of the CC for P and S phases. Events belonging to a seismic sequence are visible on 16 May 2016, when five events occurred on the same day.
Earthquakes of SET-CL were extracted from the ISNet bulletin, which included a value of local magnitude . We assigned an value to the earthquakes of SET-REP through the amplitude ratio, a well-established approach [40], by assuming co-location with EV-M. Specifically, was estimated by equation , where is the magnitude of EV-M; A and are half of the peak-to-peak amplitudes of events of SET-REP and EV-M, respectively. In this way, the inferred of SET-REP ranged between 0.4 and 1.7 (see Table 1).
In Palo et al. [18], the authors considered the source parameters obtained by Picozzi et al. [28] and estimated the mean stress drop of the repeating earthquakes by averaging those of the events nucleating over the fault subsegment that hosts the clusters of repeaters (see Figures 6 and S8 in the original paper). Here, the stress drops inferred in Picozzi et al. [28] were considered again, and the mean value of the events of SET-CL was calculated; a common stress drop was assigned to all events of SET-REP equal to this mean stress drop (). Moreover, an uncertainty to equal to the standard deviation of the stress drops of SET-CL was assigned. In this way, it was fixed = 4.0 ± 3.3 MPa. Interestingly, this value appears to be higher than the mean stress drops of the Irpinia microearthquakes [43], in line with many observations worldwide showing that repeaters have, on average, larger stress drops than usual interface seismicity [44].
Starting from the inferred values of , of each event of SET-REP was estimated using an empirical relation proposed in Malagnini and Munafó [45]. The relation was calibrated using a large set of - data points from earthquakes of the central and northern Apennines, that is, in tectonic conditions similar to those of the Irpinia region. The relation proposed in Malagnini and Munafó [45] is
In turn, from these values of , estimates of the seismic moment were inferred using relation [46]
Finally, to associate a size and a co-seismic slip to the source fault of each event of SET-REP from the moment magnitudes, an earthquake source model was adopted that assumes an instantaneous and homogeneous stress release on a circular fault of size a; in this model, the stress drop , the radius a of the fault, and the co-seismic slip s are related by equations [47,48]
where is medium rigidity. Using the Equations (2)–(5), the fault size and the co-seismic slip of each event of SET-REP were eventually inferred, as listed in Table 1.
Then, the differential between EV-M and all events of SET-REP was estimated, that is, the difference in the waiting time from P to S arrival times between the earthquakes of SET-REP and the reference event. The following numerical workflow was adopted: was defined as the difference between P (S) arrivals of event i of SET-REP and of EV-M:
where is the P (S) arrival time of event i of SET-REP, is the P (S) arrival time of EV-M, and i runs over the events of SET-REP. Quantity was defined as
that is, the differential between the ith event of SET-REP and EV-M. Assuming that EV-M and the events of SET-REP are nearly co-located (a reasonable assumption for repeaters), could be connected to and at the source and to the distance between hypocentres of EV-M and event i:
where and is the distance between the hypocentres of EV-M and the ith event of SET-REP. As the travel path of the seismic rays from the hypocentres of EV-M and the events of SET-REP differed from each other only at the source, and of Equation (8) corresponded to those of the source volume of the repeaters. In Palo et al. [18], the events of SET-CL were localized at a depth of 11–12 km. At these depths, tomographic studies assigned values of = 1.95 and = 6 km/s [34,49], which were then the values that were assumed for the application of Equation (8).
was estimated as the time shift that maximizes the CC function between EV-M and the ith event of SET-REP, both windowed by starting 0.1 s before the P onset, as explained above. was estimated in the same way, but started, in this case, 0.2 s before S onset.
Using Equation (8), estimates of the intra-hypocenter distances were thus inferred. These values are plotted in Figure 3 (right y scale) as a function of time. On the same plot, each point is referred also to the corresponding . It was found that all solutions but one have in the range of (−0.05 s:+0.05 s), which corresponded to a within m from the hypocenter of EV-M. Noteworthy, only one event, belonging also to SET-CL, showed a larger corresponding to about 1.1 Kkm from EV-M, suggesting that this event was originating from a different fault domain than the rest of the events of SET-REP.
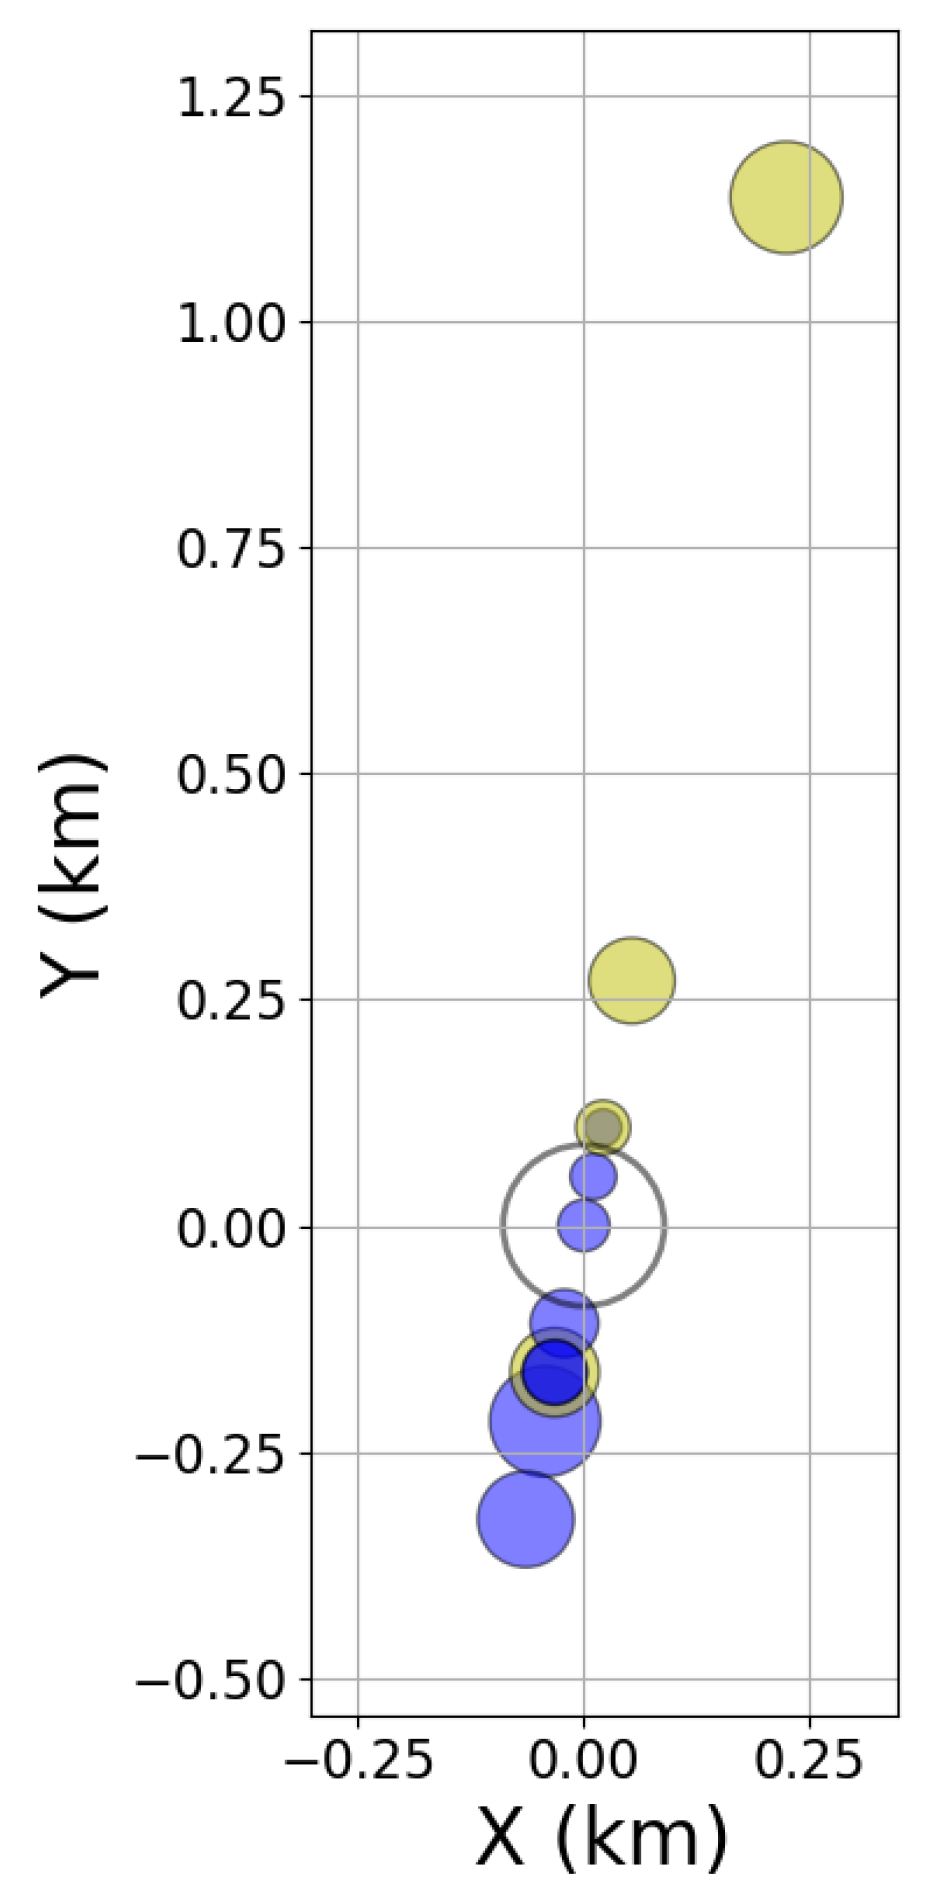
In Figure 4, the relative positions of the events of SET-REP with respect to EV-M are shown. The markers have a radius equal to the asperity size estimated above. Yellow dots also mark events in SET-CL. The empty circle shows the position and the fault size of EV-M. The epicenters of the events of SET-REP were fictitiously located on the map along the line connecting the reference station and the epicenter of EV-M. All events of SET-REP except one (that belongs to SET-CL) were apparently generated on a common fault domain of ∼500 m with partial overlap of the slipping areas. This result suggests that the volume identified in Palo et al. [18] generating clusters of near-repeaters could be further segmented into smaller sub-domains.
In Figure 5, the co-seismic slip integrated over time (cumulative slip) is shown as a function of time. Here, the slip was computed assuming the same stress drop of 4 MPa for all the equal events. Please note that in the latter plot, the event of SET-REP (and SET-CL) with a large was removed to not mix up the contributions from clearly disjointed slipping patches. The yellow dots mark the events belonging to SET-CL, too; the marker size scales with the magnitude. A quite irregular occurrence of repeaters over time can be noted; in fact, the events of SET-REP occurred mostly as doublets or swarm/sequence, as in the case of the group of events in 2016. The cumulative slip for the average stress drop value was about 35 mm, and groups of repeaters occurred every 1.2–1.8 years. Given the variability in stress drop of the events of SET-CL mentioned above, the cumulative slip was also computed using the boundary values of stress drop of 0.7 MPa and 7.3 MPa. The slip corresponding to these solutions integrated over time is shown with gray lines in Figure 5. The cumulative slip for these boundary solutions was equal to about 10 mm and 50 mm, respectively, for the lower and upper stress drop bound. Remarkably, the cumulative slip computed using the mean stress drop value decreased to about 21 mm (ranging 6–33 mm including the stress drop uncertainty) if the aftershocks of the 2016 sequence were discarded assuming they were triggered by local stress re-distribution after the mainshock.
4. Discussion
The spatio-temporal evolution of repeating earthquakes occurring over a segment of the Irpinia fault network in southern Italy was analyzed. The results highlighted that the repeaters occurred over a fault patch of size in the order of 500 m that cumulatively slipped about 30 mm over 14 years. This estimate was obtained after properly populating an initial set of 20 near-repeating earthquakes (SET-CL) defined in Palo et al. [18] that nucleated in a volume with a size of ∼1 km (Figure 1). In that sense, this analysis was a sort of “zoom in” a volume of the Irpinia fault system that repetitively slips and could therefore provide unique insights on the very local frictional properties that would be instead nearly undetectable by other geodetic measurement systems currently monitoring the area.
The region under study presents a complex structure, inherited by the different phases of rifting, drifting and shortening that deformed the Corsica–Sardinia and Adriatic–Apulian forelands during the Meso-Cenozoic era [20,50,51,52]. During Quaternary, the Southern Apennine thrust belt was dissected by NW-SE-oriented normal faults that accommodated an extensional tectonic phase, which is still ongoing [53]. The tectonic of the Irpinia region is currently characterized by active, extensional faults arranged in subparallel structures, mainly disseminated over the Apennines axial sector, with trends mainly ranging from WNW-ESE to NW-SE [19,20,21].
The seismic active rock volume where microseismicity has its origin consists of the Apulian Platform carbonates and their basement [26,36,37]. It was hypothesized that the background microseismicity in this region is partly controlled by fluids of different origins (e.g., [29,31,34,35]). Recent studies that have developed 3D velocity images and rock physical modeling of the Irpinia faults system [29,34,36,37,54] suggested that the carbonates associated to the Marzano segment at depths where the 1980 Irpinia earthquake enucleated have a porosity around 4–5%, and that crustal fluids have a composition consisting in brine-CO2 and/or CH4-CO2.
The nearby fault sector (i.e., Cervialto) where events of SET-CL nucleated (i.e., these events were located at the southern margin of the Cervialto fault near the Marzano segment) spatially matched an approximately 20 km long and 15 km wide low-Vp/Vs anomaly between 6 km and 10 km that was interpreted as a pressurized CO2-rich rock volume within the Apulian platform carbonates [29]. This velocity anomaly appeared to be well correlated with high heat flow (100–215 mWm) observed along the Mount Forcuso antiform and by a large natural emission of low-temperature CO rich gases from non-volcanic environment known as “Mefite d’Ansanto” [55].
The strong relationship between seismicity and high-pressure deep CO2-dominated fluids along a large part of the Apennines has been documented by several authors [31,36,50,56] and believed to be also responsible for the nucleation of large earthquakes (e.g., the 1997 Colfiorito and the 2009 L’Aquila seismic sequences; see [57,58]). In this framework, [35] showed that fluids in karst aquifers follow high multi-annual recharge and intense seasonal rainfall that can lead to shallow poroelastic strain capable of modulating deeper microseismicity and potentially induce large earthquakes.
Events of SET-CL nucleated at depths of about 11–12 km [18], within the basement of the Apulian platform [34], where most of the microseismicity in Irpinia is currently generated and where tomographic studies have inferred a highly fractured rock with significant fluid accumulation, as explained above. In particular, an active role of fluids in promoting or triggering the microseismicity has been proposed by pore pressure increase on the fault interface induced in turn by diffusion of gasses like CO and CH-CO that saturate the fault network and can change the mechanical properties of the medium reducing the interface coupling [59,60]. In Amoroso et al. [34,37] it was proposed moreover that the dense network of faults at depth characterizing the Irpinia fault system can act as a path for fluid migration triggering earthquakes by pore pressure diffusion. In detail, it was postulated that fluids are flushed along the fault zones during the coseismic slip, promoting the creation of pathways for fluid migration through fractures within the cemented fault core, while during interseismic periods, these faults continue to act as conduits for along-fault flow due to the high permeability of the intensely fractured rock volume [34]. Spatio-temporal changes in seismic source properties and ground motion intensity in the investigated area that might be related to crustal fluids migration were observed in Picozzi et al. [3,28].
In this framework, it can be hypothesized that the events of SET-REP were fluid induced, as well. The evidence that repeaters occurred preferentially in swarms or doublets was indeed consistent with this source mechanism, as the occurrence of a repeater promotes fluid migration and thus can locally favor the nucleation of multiple events. A similar mechanism has been also advocated in Stabile et al. [39], who modeled the source of a sequence in Irpinia to be due to the internal mechanical readjustments from fluid migration along fractured fault zones. Moreover, it has been proposed already by different authors that an increase in pore pressure and/or fluid movements belong to the physical conditions that trigger repeated failures away from rapidly slipping plate boundary faults (e.g., [61,62]). This is, for example, the reason why repeaters have been detected also in volcanic and geothermal areas (e.g., [63,64]), or in inland tectonic faults [10], where the loading rate is usually low.
As shown in Palo et al. [18], the Cervialto segment hosted the vast majority of sequences and near-repeaters of the whole investigated area, including SET-CL. The authors have shown, moreover, that such fault segment presented the highest level of correlation with the annual poroelastic deformation of the shallower karst aquifers. This evidence allows the hypothesis of the fact that the events of SET-REP nucleated on fault patches at a critical stage that could be activated also in response to external impulses. In line with this hypothesis, ref. [28] analyzed the source parameters of the microseismicity in Irpinia and observed that the co-seismic stress drop and the energy required for the earthquake rupture were anti-correlated with the geodetic displacement over about one decade; moreover, in the same period, the authors found a very clear positive correlation between fault size (and co-seismic slip) and geodetic displacement. On the other hand, the same authors highlighted also that the correlation between co-seismic stress drop and geodetic displacement became progressively positive after 2017; similarly, they found that the correlation between fault size and geodetic displacement was totally lost after this year. The authors interpreted this behavior as produced by a change in the fault coupling of the Cervialto segment, which in turn could be an effect of a mechanical variation of the rock matrix, for example by the closure of cracks and flaws [27]. In this scheme, the evidence that no repeaters were identified after 2017 may be related to a change in the medium properties and in particular to fluid–rock coupling at depth. In other words, the absence of repeaters after 2017 is the very local effect of a large-scale medium change: the tectonic loading (combined with stress perturbation from the karst aquifer oscillations [35]) acting on the same fault patch (previously prone to slip repetitively) no longer triggered the slip because of a modification in local frictional properties.
We found that groups of repeaters occurred every 1.2–1.8 years, suggesting that the main triggering factor was a nearly constant loading, which can be straightforwardly identified with the tectonic loading that modulated fluid circulation. We found, moreover, a cumulative slip of about 35 mm over the analyzed time interval, corresponding to about 3.4 mm per year, which became about 2.0 mm per year assuming that the sequence of 2016 was triggered by a local stress re-distribution and thus discarding the aftershocks. From geodetic analysis, a yearly mean tectonic slip in the Irpinia region has been estimated to be about 3 mm [65,66]. Hence, under our hypothesis of a stress drop in the order of 4 MPa for all repeaters and keeping in mind the limited resolution of our approach in estimating the coseismic slip, the two values suggest a local fault coupling close to one. On the other hand, discarding the aftershocks of 2016, the coupling decreases to about 0.6. Moreover, considering the strong stress drop variability found in the original SET-CL, the yearly coseismic slip ranged in the interval of 1–4.8 mm, which became 0.7–3.2 mm discarding the aftershocks of 2016 sequence, implying local couplings as low as, respectively, about 0.3 and 0.2 (considering the lower edges of the two intervals). This is compatible with a common source model of repeaters that is a patch of small strong interacting asperities surrounded by a much weaker creeping fault [67]. Moreover, it is worth noting that the repeaters were located at the transition between two fault segments (Marzano and Cervialto) separated by the Sele plain. Interestingly, as observed during the 1980, Ms 6.9 Irpinia earthquake, the Sele plain could act as a discontinuity in the rupture propagation and aftershock production [22,68]; it would be thus arguable that the region at the boundary of the Cervialto fault segment and Sele plain—that is, where the repeaters nucleated—can creep or aseismically slips. Moreover, the apparent variations in the medium properties after 2017 indicated that the capability of the asperities to generate repeaters (and/or to creep) can change over time, suggesting a potentially highly nonlinear and time-dependent mechanism of interaction between asperities at very small scale. However, the resolution of the observations of these events (together with the magnitude of the tectonic loading in Irpinia) makes it hard to further constrain this aspect currently.
5. Conclusions
A catalog of repeating earthquakes occurring in Irpinia (Southern Italy) between 2012 and 2021 was generated starting from a set of near-repeaters published in Palo et al. [18] located on the segment of Cervialto of the 1980 earthquake fault and scanning the continuous seismic data at one reference station of the Irpinia Seismic Network (ISNet). A total of 11 repeaters were found with local magnitudes between 0.4 and 1.7 (corresponding to moment magnitudes in the range of 1.3–2.2); they nucleated in a volume of size ∼500 m and occurred irregularly every 1.2–1.8 years. Using a constant mean stress drop common to all repeaters, a cumulative co-seismic slip of about 35 mm was found, corresponding to a yearly slip of 3.4 mm, which is very close to the slip estimated by geodetic measurements in the area; this suggested, therefore, a local coupling close to one, although considering the uncertainty on the co-seismic slip estimates, a coupling lower than one could not be excluded. Noteworthy, no repeaters were detected after 2017; this evidence was imputed to a change in the medium property, i.e., to a modification of the local frictional response. Similarly to most of the seismicity in Irpinia, a relevant role of fluids like CO or CH in promoting or triggering the repeaters was postulated.
This work identified a target area worth investigating via ad hoc small-scale instrument deployment for its potential consequences on the seismotectonic modeling of the region. Moreover, it highlighted the importance of a dense seismic network to monitor the Irpinia fault system for a more sensitive earthquake detection and better source modelling and location. In fact, the results showed clearly that the study of such a class of low-magnitude events that repetitively nucleate on a small asperity needs a denser seismic network possibly integrated with high-sensitivity instruments allowing observations of different nature (such as DAS or strainmeters). It also indicated, once again, the importance of microseismicity to enlighten the kinematics of the faults allowing the highlight of small-scale asperities. This is especially crucial for tectonic regions with low loading rates like Southern Apennines that are nevertheless capable of generating destructive large earthquakes. This pilot study opened the way to explore the possibility to constrain small-scale slip histories on the Irpinia fault by low-magnitude repeating earthquakes. In that sense, it suggested that this approach can be extended to other clusters of near-repeaters to potentially identify other small-scale fault domains whose existence is suggested by the different fault sizes between the source volumes of the original set of near-repeaters used as a template and the inferred catalog of repeaters, as well as to other areas of Southern Apennines. This task can be especially challenging because, as we showed in this work, the rate of this kind of phenomena may be very low, and therefore the support of proper experimental setup is crucial. Nevertheless, as the current research developments in the study of the preparatory phases of the large earthquakes show, such an effort should be considered definitely necessary for the understanding of the fault segmentation, the knowledge of the local stress status and finally for seismic risk assessment.
Author Contributions
Conceptualization, M.P. (Mauro Palo) and M.P. (Matteo Picozzi); methodology, M.P. (Mauro Palo) and M.P. (Matteo Picozzi); software, M.P. (Mauro Palo), F.S.d.U. and M.P. (Matteo Picozzi); formal analysis, M.P. (Mauro Palo) and F.S.d.U.; resources, M.P. (Matteo Picozzi) and G.F.; writing—original draft preparation, M.P. (Mauro Palo), F.S.d.U. and M.P. (Matteo Picozzi); writing—review and editing, M.P. (Mauro Palo), F.S.d.U., M.P. (Matteo Picozzi) and G.F. All authors have read and agreed to the published version of the manuscript.
Funding
This research received no external funding.
Institutional Review Board Statement
Not applicable.
Informed Consent Statement
Not applicable.
Data Availability Statement
Seismic data of ISNet used in this study are freely downloadable at the website http://isnet-bulletin.fisica.unina.it/cgi-bin/isnet-events/isnet.cgi. Data of the traces found by the template matching (locally stored—accessed on 22 December 2023) can be made available on request by contacting the corresponding author.
Acknowledgments
We are grateful to the editor and three anonymous reviewers for their comments, which contributed to improve the manuscript. Data products and service provision of ISNet are part of the European Plate Observing System (EPOS) research infrastructure (www.epos-eu.org).
Conflicts of Interest
The authors declare no conflicts of interest.
References
- Chiaraluce, L.; Festa, G.; Bernard, P.; Caracausi, A.; Carluccio, I.; Clinton, J.F.; Di Stefano, R.; Elia, L.; Evangelidis, C.; Ergintav, S.; et al. The Near Fault Observatory community in Europe: A new resource for faulting and hazard studies. Ann. Geophys. 2022, 65, DM316. [Google Scholar] [CrossRef]
- Festa, G.; Adinolfi, G.M.; Caruso, A.; Colombelli, S.; De Landro, G.; Elia, L.; Emolo, A.; Picozzi, M.; Scala, A.; Carotenuto, F.; et al. Insights into mechanical properties of the 1980 irpinia fault system from the analysis of a seismic sequence. Geosciences 2021, 11, 28. [Google Scholar] [CrossRef]
- Picozzi, M.; Cotton, F.; Bindi, D.; Emolo, A.; Maria Adinolfi, G.; Spallarossa, D.; Zollo, A. Spatiotemporal Evolution of Ground-Motion Intensity at the Irpinia Near-Fault Observatory, Southern Italy. Bull. Seismol. Soc. Am. 2022, 112, 243–261. [Google Scholar] [CrossRef]
- Uchida, N.; Bürgmann, R. Repeating Earthquakes. Annu. Rev. Earth Planet. Sci. 2019, 47, 305–332. [Google Scholar] [CrossRef]
- Nadeau, R.M.; Foxall, W.; McEvilly, T.V. Clustering and Periodic Recurrence of Microearthquakes on the San Andreas Fault at Parkfield, California. Science 1995, 267, 503–507. [Google Scholar] [CrossRef] [PubMed]
- Vidale, J.; ElIsworth, W.; Cole, A.; Marone, C. Variations in rupture process with recurrence interval in a repeated small earthquake. Nature 1994, 368, 624–626. [Google Scholar] [CrossRef]
- Uchida, N.; Matsuzawa, T.; Ellsworth, W.L.; Imanishi, K.; Shimamura, K.; Hasegawa, A. Source parameters of microearthquakes on an interplate asperity off Kamaishi, NE Japan over two earthquake cycles. Geophys. J. Int. 2012, 189, 999–1014. [Google Scholar] [CrossRef]
- Bufe, C.G.; Harsh, P.W.; Burford, R.O. Steady-state seismic slip—A precise recurrence model. Geophys. Res. Lett. 1977, 4, 91–94. [Google Scholar] [CrossRef]
- Lengliné, O.; Lamourette, L.; Vivin, L.; Cuenot, N.; Schmittbuhl, J. Fluid-induced earthquakes with variable stress drop. J. Geophys. Res. Solid Earth 2014, 119, 8900–8913. [Google Scholar] [CrossRef]
- Schaff, D.P.; Richards, P.G. Repeating seismic events in China. Science 2004, 303, 1176–1178. [Google Scholar] [CrossRef]
- Waldhauser, F.; Schaff, D.P. Large-scale relocation of two decades of Northern California seismicity using cross-correlation and double-difference methods. J. Geophys. Res. Solid Earth 2008, 113, B08311. [Google Scholar] [CrossRef]
- Chaussard, E.; Bürgmann, R.; Fattahi, H.; Johnson, C.; Nadeau, R.; Taira, T.; Johanson, I. Interseismic coupling and refined earthquake potential on the Hayward-Calaveras fault zone. J. Geophys. Res. Solid Earth 2015, 120, 8570–8590. [Google Scholar] [CrossRef]
- Uchida, N.; Hasegawa, A.; Matsuzawa, T.; Igarashi, T. Pre-and post-seismic slow slip on the plate boundary off Sanriku, NE Japan associated with three interplate earthquakes as estimated from small repeating earthquake data. Tectonophysics 2004, 385, 1–15. [Google Scholar] [CrossRef]
- Valoroso, L.; Chiaraluce, L.; Di Stefano, R.; Monachesi, G. Mixed-Mode Slip Behavior of the Altotiberina Low-Angle Normal Fault System (Northern Apennines, Italy) through High-Resolution Earthquake Locations and Repeating Events. J. Geophys. Res. Solid Earth 2017, 122, 10220–10240. [Google Scholar] [CrossRef]
- Borghi, A.; Aoudia, A.; Javed, F.; Barzaghi, R. Precursory slow-slip loaded the 2009 L’Aquila earthquake sequence. Geophys. J. Int. 2016, 205, 776–784. [Google Scholar] [CrossRef]
- Vuan, A.; Sugan, M.; Amati, G.; Kato, A. Improving the detection of low-magnitude seismicity preceding the Mw 6.3 L’Aquila earthquake: Development of a scalable code based on the cross correlation of template earthquakes. Bull. Seismol. Soc. Am. 2018, 108, 471–480. [Google Scholar] [CrossRef]
- Sugan, M.; Vuan, A.; Kato, A.; Massa, M.; Amati, G. Seismic Evidence of an Early Afterslip during the 2012 Sequence in Emilia (Italy). Geophys. Res. Lett. 2019, 46, 625–635. [Google Scholar] [CrossRef]
- Palo, M.; Picozzi, M.; Landro, G.D.; Zollo, A. Tectonophysics Microseismicity clustering and mechanic properties reveal fault segmentation in southern Italy. Tectonophysics 2023, 856, 229849. [Google Scholar] [CrossRef]
- Adinolfi, G.M.; Cesca, S.; Picozzi, M.; Heimann, S.; Zollo, A. Detection of weak seismic sequences based on arrival time coherence and empiric network detectability: An application at a near fault observatory. Geophys. J. Int. 2019, 218, 2054–2065. [Google Scholar] [CrossRef]
- Matano, F.; Di Nocera, S.; Criniti, S.; Critelli, S. Geology of the Epicentral Area of the November 23, 1980 Earthquake (Irpinia, Italy): New Stratigraphical, Structural and Petrological Constrains. Geosciences 2020, 10, 247. [Google Scholar] [CrossRef]
- Bello, S.; de Nardis, R.; Scarpa, R.; Brozzetti, F.; Cirillo, D.; Ferrarini, F.; Di Lieto, B.; Arrowsmith, R.J.; Lavecchia, G. Fault pattern and seismotectonic style of the Campania–Lucania 1980 earthquake (Mw 6.9, Southern Italy): New multidisciplinary constraints. Front. Earth Sci. 2021, 8, 608063. [Google Scholar] [CrossRef]
- Bernard, P.; Zollo, A. The Irpinia (Italy) 1980 earthquake: Detailed analysis of a complex normal faulting. J. Geophys. Res. Solid Earth 1989, 94, 1631–1647. [Google Scholar] [CrossRef]
- Gizzi, F.T.; Potenza, M.R. The Scientific Landscape of November 23rd, 1980 Irpinia-Basilicata Earthquake: Taking Stock of (Almost) 40 Years of Studies. Geosciences 2020, 10, 482. [Google Scholar] [CrossRef]
- Wyss, M.; Rosset, P. Near-Real-Time Loss Estimates for Future Italian Earthquakes Based on the M6.9 Irpinia Example. Geosciences 2020, 10, 165. [Google Scholar] [CrossRef]
- Iannaccone, G.; Zollo, A.; Elia, L.; Convertito, V.; Satriano, C.; Martino, C.; Festa, G.; Lancieri, M.; Bobbio, A.; Stabile, T.A.; et al. A prototype system for earthquake early-warning and alert management in southern Italy. Bull. Earthq. Eng. 2010, 8, 1105–1129. [Google Scholar] [CrossRef]
- De Landro, G.; Amoroso, O.; Alfredo Stabile, T.; Matrullo, E.; Lomax, A.; Zollo, A. High-precision differential earthquake location in 3-D models: Evidence for a rheological barrier controlling the microseismicity at the Irpinia fault zone in southern Apennines. Geophys. J. Int. 2015, 203, 1821–1831. [Google Scholar] [CrossRef]
- De Landro, G.; Amoroso, O.; Russo, G.; D’Agostino, N.; Esposito, R.; Emolo, A.; Zollo, A. Decade-long monitoring of seismic velocity changes at the Irpinia fault system (southern Italy) reveals pore pressure pulsations. Sci. Rep. 2022, 12, 1247. [Google Scholar] [CrossRef] [PubMed]
- Picozzi, M.; Bindi, D.; Festa, G.; Cotton, F.; Scala, A.; D’Agostino, N. Spatiotemporal evolution of microseismicity seismic source properties at the Irpinia Near-Fault Observatory, Southern Italy. Bull. Seismol. Soc. Am. 2022, 112, 226–242. [Google Scholar] [CrossRef]
- Improta, L.; De Gori, P.; Chiarabba, C. New insights into crustal structure, Cenozoic magmatism, CO2 degassing, and seismogenesis in the southern Apennines and Irpinia region from local earthquake tomography. J. Geophys. Res. Solid Earth 2014, 119, 8283–8311. [Google Scholar] [CrossRef]
- Caracausi, A.; Buttitta, D.; Picozzi, M.; Paternoster, M.; Stabile, T.A. Earthquakes control the impulsive nature of crustal helium degassing to the atmosphere. Commun. Earth Environ. 2022, 3, 224. [Google Scholar] [CrossRef]
- Chiodini, G.; Cardellini, C.; Amato, A.; Boschi, E.; Caliro, S.; Frondini, F.; Ventura, G. Carbon dioxide Earth degassing and seismogenesis in central and southern Italy. Geophys. Res. Lett. 2004, 31, L07615. [Google Scholar] [CrossRef]
- Cusano, P.; Palo, M.; West, M. Long-period seismicity at Shishaldin volcano (Alaska) in 2003–2004: Indications of an upward migration of the source before a minor eruption. J. Volcanol. Geotherm. Res. 2015, 291, 14–24. [Google Scholar] [CrossRef]
- Beroza, G.C.; Ide, S. Slow earthquakes and nonvolcanic tremor. Annu. Rev. Earth Planet. Sci. 2011, 39, 271–296. [Google Scholar] [CrossRef]
- Amoroso, O.; Ascione, A.; Mazzoli, S.; Virieux, J.; Zollo, A. Seismic imaging of a fluid storage in the actively extending Apennine mountain belt, southern Italy. Geophys. Res. Lett. 2014, 41, 3802–3809. [Google Scholar] [CrossRef]
- D’Agostino, N.; Silverii, F.; Amoroso, O.; Convertito, V.; Fiorillo, F.; Ventafridda, G.; Zollo, A. Crustal Deformation and Seismicity Modulated by Groundwater Recharge of Karst Aquifers. Geophys. Res. Lett. 2018, 45, 12253–12262. [Google Scholar] [CrossRef]
- Ascione, A.; Nardò, S.; Mazzoli, S. The MS 6.9, 1980 Irpinia Earthquake from the basement to the surface: A review of tectonic geomorphology and geophysical constraints, and new data on postseismic deformation. Geosciences 2020, 10, 493. [Google Scholar] [CrossRef]
- Amoroso, O.; Russo, G.; De Landro, G.; Zollo, A.; Garambois, S.; Mazzoli, S.; Parente, M.; Virieux, J. From velocity and attenuation tomography to rock physical modeling: Inferences on fluid-driven earthquake processes at the Irpinia fault system in southern Italy. Geophys. Res. Lett. 2017, 44, 6752–6760. [Google Scholar] [CrossRef]
- Omori, F. On the After-Shocks of Earthquakes. Ph.D. Thesis, The University of Tokyo, Tokyo, Japan, 1895. [Google Scholar]
- Stabile, T.A.; Satriano, C.; Orefice, A.; Festa, G.; Zollo, A. Anatomy of a microearthquake sequence on an active normal fault. Sci. Rep. 2012, 2, 410. [Google Scholar] [CrossRef]
- Scotto di Uccio, F.; Scala, A.; Festa, G.; Picozzi, M.; Beroza, G.C. Comparing and integrating artificial intelligence and similarity search detection techniques: Application to seismic sequences in Southern Italy. Geophys. J. Int. 2023, 233, 861–874. [Google Scholar] [CrossRef]
- Chamberlain, C.J.; Hopp, C.J.; Boese, C.M.; Warren-Smith, E.; Chambers, D.; Chu, S.X.; Michailos, K.; Townend, J. EQcorrscan: Repeating and near-repeating earthquake detection and analysis in Python. Seismol. Res. Lett. 2018, 89, 173–181. [Google Scholar] [CrossRef]
- Vuan, A.; Sugan, M.; Chiaraluce, L.; Di Stefano, R. Loading Rate Variations Along a Midcrustal Shear Zone Preceding the Mw6.0 Earthquake of 24 August 2016 in Central Italy. Geophys. Res. Lett. 2017, 44, 12170–12180. [Google Scholar] [CrossRef]
- Zollo, A.; Orefice, A.; Convertito, V. Source parameter scaling and radiation efficiency of microearthquakes along the Irpinia fault zone in southern Apennines, Italy. J. Geophys. Res. Solid Earth 2014, 119, 3256–3275. [Google Scholar] [CrossRef]
- Dreger, D.; Nadeau, R.M.; Chung, A. Repeating earthquake finite source models: Strong asperities revealed on the San Andreas Fault. Geophys. Res. Lett. 2007, 34, L23302. [Google Scholar] [CrossRef]
- Malagnini, L.; Munafò, I. On the relationship between ML and MW in a broad range: An example from the apennines, italy. Bull. Seismol. Soc. Am. 2018, 108, 1018–1024. [Google Scholar] [CrossRef]
- Bormann, P.; Di Giacomo, D. The moment magnitude Mw and the energy magnitude Me: Common roots and differences. J. Seismol. 2011, 15, 411–427. [Google Scholar] [CrossRef]
- Eshelby, J.D. The determination of the elastic field of an ellipsoidal inclusion, and related problems. Proc. R. Soc. Lond. Ser. A Math. Phys. Sci. 1957, 241, 376–396. [Google Scholar]
- Lay, T.; Wallace, T.C. Modern Global Seismology; Elsevier: Amsterdam, The Netherlands, 1995. [Google Scholar]
- Matrullo, E.; De Matteis, R.; Satriano, C.; Amoroso, O.; Zollo, A. An improved 1-D seismic velocity model for seismological studies in the Campania–Lucania region (Southern Italy). Geophys. J. Int. 2013, 195, 460–473. [Google Scholar] [CrossRef]
- Ghisetti, F.; Vezzani, L. Normal faulting, extension and uplift in the outer thrust belt of the central Apennines (Italy): Role of the Caramanico fault. Basin Res. 2002, 14, 225–236. [Google Scholar] [CrossRef]
- Galli, P. Roman to Middle Age Earthquakes Sourced by the 1980 Irpinia Fault: Historical, Archaeoseismological, and Paleoseismological Hints. Geosciences 2020, 10, 286. [Google Scholar] [CrossRef]
- Lombardi, G. Irpinia earthquake and history: A nexus as a problem. Geosciences 2021, 11, 50. [Google Scholar] [CrossRef]
- Doglioni, C. Geological remarks on the relationships between extension and convergent geodynamic settings. Tectonophysics 1995, 252, 253–267. [Google Scholar] [CrossRef]
- Vassallo, M.; Festa, G.; Bobbio, A.; Serra, M. Low shear velocity in a normal fault system imaged by ambient noise cross correlation: The case of the Irpinia fault zone, Southern Italy. J. Geophys. Res. Solid Earth 2016, 121, 4290–4305. [Google Scholar] [CrossRef]
- Chiodini, G.; Granieri, D.; Avino, R.; Caliro, S.; Costa, A.; Minopoli, C.; Vilardo, G. Non-volcanic CO2 Earth degassing: Case of Mefite d’Ansanto (southern Apennines), Italy. Geophys. Res. Lett. 2010, 37, L11303. [Google Scholar] [CrossRef]
- Chiarabba, C.; Chiodini, G. Continental delamination and mantle dynamics drive topography, extension and fluid discharge in the Apennines. Geology 2013, 41, 715–718. [Google Scholar] [CrossRef]
- Miller, S.A.; Collettini, C.; Chiaraluce, L.; Cocco, M.; Barchi, M.; Kaus, B.J. Aftershocks driven by a high-pressure CO2 source at depth. Nature 2004, 427, 724–727. [Google Scholar] [CrossRef]
- Pio Lucente, F.; De Gori, P.; Margheriti, L.; Piccinini, D.; Di Bona, M.; Chiarabba, C.; Piana Agostinetti, N. Temporal variation of seismic velocity and anisotropy before the 2009 MW 6.3 L’Aquila earthquake, Italy. Geology 2010, 38, 1015–1018. [Google Scholar] [CrossRef]
- Lachenbruch, A.H. Frictional heating, fluid pressure, and the resistance to fault motion. J. Geophys. Res. Solid Earth 1980, 85, 6097–6112. [Google Scholar] [CrossRef]
- Palo, M.; Tilmann, F.; Schurr, B. Applicability and Bias of V P / V S Estimates by P and S Differential Arrival Times of Spatially Clustered Earthquakes. Bull. Seismol. Soc. Am. 2016, 106, 1055–1063. [Google Scholar] [CrossRef]
- Bisrat, S.; DeShon, H.R.; Rowe, C. Microseismic swarm activity in the New Madrid seismic zone. Bull. Seismol. Soc. Am. 2012, 102, 1167–1178. [Google Scholar] [CrossRef]
- Thelen, W.; Malone, S.; West, M. Multiplets: Their behavior and utility at dacitic and andesitic volcanic centers. J. Geophys. Res. Solid Earth 2011, 116, B08210. [Google Scholar] [CrossRef]
- Ketner, D.; Power, J. Characterization of seismic events during the 2009 eruption of Redoubt Volcano, Alaska. J. Volcanol. Geotherm. Res. 2013, 259, 45–62. [Google Scholar] [CrossRef]
- Hotovec-Ellis, A.; Vidale, J.; Gomberg, J.; Thelen, W.; Moran, S.C. Changes in seismic velocity during the first 14 months of the 2004–2008 eruption of Mount St. Helens, Washington. J. Geophys. Res. Solid Earth 2015, 120, 6226–6240. [Google Scholar] [CrossRef]
- D’Agostino, N. Complete seismic release of tectonic strain and earthquake recurrence in the Apennines (Italy). Geophys. Res. Lett. 2014, 41, 1155–1162. [Google Scholar] [CrossRef]
- Galli, P.; Peronace, E. New paleoseismic data from the Irpinia Fault. A different seismogenic perspective for southern Apennines (Italy). Earth-Sci. Rev. 2014, 136, 175–201. [Google Scholar] [CrossRef]
- Johnson, L.R.; Nadeau, R.M. Asperity model of an earthquake: Static problem. Bull. Seismol. Soc. Am. 2002, 92, 672–686. [Google Scholar] [CrossRef]
- Pantosti, D.; Valensise, G. Faulting mechanism and complexity of the November 23, 1980, Campania-Lucania earthquake, inferred from surface observations. J. Geophys. Res. Solid Earth 1990, 95, 15319–15341. [Google Scholar] [CrossRef]
Figure 1.
Event locations of Cluster 14 of Palo et al. [18] (blue dots) represented with the Irpinia background seismicity (gray dots) and the projection of the Irpinia fault segments involved in the 1980, Ms 6.9 earthquake (black dotted parallelograms—CRV: Cervialto; MRZ: Marzano; Conza; SGM: San Gregorio). ISNet stations are marked as black triangles, while reference station SNR3 is marked in red. Black lines display the projection on the surface of the main active faults of the area.

Figure 2.
Waveforms of SET-REP (vertical component). EV-M is plotted in the first line in red. Events with time marked in red are also those belonging to SET-CL. The vertical dashed lines show the edges of the time windows used to enclose the P and S phases for the CC calculation. On the left, the CC values between events of SET-REP and EV-M for the P and S phases are displayed. As explained in the main text, the displayed CC value for the S phases is computed on one of the horizontal components. The theoretical S wave arrival is predicted at about 3 s from the P onset.

Figure 3.
Differential times between EV-M and all events of SET-REP and corresponding distance between hypocentres. The marker size scales with the moment magnitude. Yellow symbols highlight the events of SET-REP belonging to SET-CL (see Table 1).
Figure 3.
Differential times between EV-M and all events of SET-REP and corresponding distance between hypocentres. The marker size scales with the moment magnitude. Yellow symbols highlight the events of SET-REP belonging to SET-CL (see Table 1).

Figure 4.
Differential source position and fault size of the events of SET-REP. The size of the dots equals the estimated fault size. Events belonging to SET-CL are highlighted in yellow (see Table 1). The empty circle marks the epicenter and the fault size of EV-M. The epicenters were fictitiously aligned along the line connecting the epicenter of EV-M to the reference station. All events but one nucleated on a patch of ∼500 m with partial overlap of the slipping areas. One event (belonging to SET-CL) nucleated instead more than 1 km apart from EV-M.

Figure 5.
Cumulative slip of the events of SET-REP using the mean stress drop of 4 MPa. Yellow markers highlight earthquakes of SET-CL (see Table 1). The marker size scales with the moment magnitude. Gray lines display the cumulative slips obtained with stress drops of 0.7 MPa and 7.3 MPa.
Figure 5.
Cumulative slip of the events of SET-REP using the mean stress drop of 4 MPa. Yellow markers highlight earthquakes of SET-CL (see Table 1). The marker size scales with the moment magnitude. Gray lines display the cumulative slips obtained with stress drops of 0.7 MPa and 7.3 MPa.


Table 1.
Occurrence time and source parameters of the earthquakes composing SET-REP. “D. from EV-M” is the distance from the master event. SET-CL is 1 if the event belongs to the original SET-CL of Palo et al. [18]. Events marked with a star (*) were also included in the ISNet catalog, but were assigned to a different co-located cluster in the original paper (Cluster 13 in Palo et al. [18]).
| Time | Fault Size (m) | D. from EV-M (m) | Slip (mm) | SET-CL | ||
|---|---|---|---|---|---|---|
| 02.10.2013 05:55:04.959 | 0.620 | 1.553 | 28.594 | 0 | 2.312 | 0 |
| 16.03.2013 02:10:27.959 | 1.625 | 2.223 | 61.829 | 1158 | 4.998 | 1 |
| 18.09.2014 01:23:59.162 | 0.470 | 1.453 | 25.491 | 55 | 2.061 | 0 |
| 16.10.2014 16:41:11.299 | 1.278 | 1.992 | 47.384 | 275 | 3.831 | 1 |
| *16.05.2016 02:21:21.476 | 1.610 | 2.213 | 61.155 | −220 | 4.944 | 0 |
| 16.05.2016 02:23:27.376 | 1.323 | 2.021 | 49.032 | −165 | 3.964 | 1 |
| 16.05.2016 07:03:17.217 | 0.978 | 1.792 | 37.652 | −110 | 3.044 | 0 |
| 16.05.2016 08:15:26.757 | 0.885 | 1.730 | 35.057 | −165 | 2.834 | 0 |
| *16.05.2016 20:49:51.020 | 0.919 | 1.752 | 35.979 | −165 | 2.909 | 0 |
| 20.06.2016 18:27:10.663 | 0.184 | 1.263 | 20.465 | 110 | 1.654 | 0 |
| 07.06.2017 17:44:10.523 | 1.427 | 2.092 | 53.161 | −330 | 4.298 | 0 |
| 30.06.2017 23:33:51.279 | 0.686 | 1.598 | 30.100 | 110 | 2.433 | 1 |
Disclaimer/Publisher’s Note: The statements, opinions and data contained in all publications are solely those of the individual author(s) and contributor(s) and not of MDPI and/or the editor(s). MDPI and/or the editor(s) disclaim responsibility for any injury to people or property resulting from any ideas, methods, instructions or products referred to in the content. |
© 2023 by the authors. Licensee MDPI, Basel, Switzerland. This article is an open access article distributed under the terms and conditions of the Creative Commons Attribution (CC BY) license (https://creativecommons.org/licenses/by/4.0/).
Share and Cite
MDPI and ACS Style
Palo, M.; Scotto di Uccio, F.; Picozzi, M.; Festa, G. An Enhanced Catalog of Repeating Earthquakes on the 1980 Irpinia Fault System, Southern Italy. Geosciences 2024, 14, 8. https://doi.org/10.3390/geosciences14010008
AMA Style
Palo M, Scotto di Uccio F, Picozzi M, Festa G. An Enhanced Catalog of Repeating Earthquakes on the 1980 Irpinia Fault System, Southern Italy. Geosciences. 2024; 14(1):8. https://doi.org/10.3390/geosciences14010008
Chicago/Turabian StylePalo, Mauro, Francesco Scotto di Uccio, Matteo Picozzi, and Gaetano Festa. 2024. "An Enhanced Catalog of Repeating Earthquakes on the 1980 Irpinia Fault System, Southern Italy" Geosciences 14, no. 1: 8. https://doi.org/10.3390/geosciences14010008
Note that from the first issue of 2016, this journal uses article numbers instead of page numbers. See further details here.