Review

The Mundeck Salt Unit: A Review of Aptian Depositional Context and Hydrocarbon Potential in the Kribi-Campo Sub-Basin (South Cameroon Atlantic Basin)

by
Mike-Franck Mienlam Essi
1,*,
Eun Young Lee
2,*,
Mbida Yem
3,
Jean Marcel Abate Essi
4 and
Joseph Quentin Yene Atangana
3
1
Department of Geoscience and Environment, Faculty of Science, University of Ebolowa, Ebolowa 118, Cameroon
2
Department of Geology, University of Vienna, 1090 Vienna, Austria
3
Department of Earth Sciences, Faculty of Science, University of Yaounde I, Yaounde 812, Cameroon
4
Spatial Imagery Research Center, Institute of Geological and Mining Research, Yaounde 4110, Cameroon
*
Authors to whom correspondence should be addressed.
Geosciences 2024, 14(10), 267; https://doi.org/10.3390/geosciences14100267
Submission received: 27 August 2024 / Revised: 4 October 2024 / Accepted: 9 October 2024 / Published: 11 October 2024
(This article belongs to the Section Sedimentology, Stratigraphy and Palaeontology)

Abstract

:
The Kribi-Campo sub-basin, located in the Gulf of Guinea, constitutes the southeastern segment of the Cameroon Atlantic Margin. Drilling in the Aptian salt unit revealed a sparse hydrocarbon presence, contrasting with modest finds in its counterparts like the Ezanga Salt in Gabon and the Rio Muni Salt in Equatorial Guinea. This discrepancy prompted a reassessment of the depositional context and hydrocarbon potential of the Mundeck salt unit. By integrating 2D seismic reflection and borehole data analysis, this study established the structural and stratigraphic framework of the area, emphasizing the salt unit’s significance. Borehole data indicate a localized salt unit offshore Kribi, with seismic reflection data revealing distinct forms of diapir and pillow. This salt unit displays a substantial lateral extent with thicknesses ranging from 4000 m to 6000 m. The depositional context is linked to the following two major geological events: a significant sea-level drop due to margin uplift during the Aptian and thermodynamic processes driven by transfer faults related to mid-oceanic ridge formation. These events were crucial in forming and evolving the Mundeck Salt. Regarding hydrocarbon prospects, this study identifies the unit as being associated with potential petroleum plays, supported by direct hydrocarbon indicators and fault-related structures. The findings suggest that untapped hydrocarbon resources may still exist, underscoring the need for further exploration and analysis.

1. Introduction

The increasing interest of oil industries and academia communities in deep offshore exploration has led to an intensification of hydrocarbon exploration in several underexplored basins of the Southwest Africa Margin (SWAM) [1,2,3,4]. In this context, previous works [5,6,7,8,9,10,11,12,13] conducted in the SWAM have highlighted numerous salt units of the Aptian age with thicknesses up to 800 m, extending from Angola to Cameroon, characterized by pre- and post-salt petroleum plays. The South Cameroon Atlantic Basin (SCAB), in the Gulf of Guinea off the coast of Cameroon, is situated in this productive region. The SCAB encompasses the Douala and Kribi-Campo sub-basins and is bounded to the north by the Rio Del Rey Basin, delineated by the Cameroon Volcanic Line (CVL) (Figure 1). Despite its potential, the SCAB remains relatively underexplored compared to other regions in the Gulf of Guinea, marking it a frontier area for oil and gas exploration. Recent attention from the oil industry and academic research has focused on understanding its depositional context, geological history, and hydrocarbon potential, aiming to unlock new resources and contribute to the energy supply. This strategic positioning underscores the potential for significant hydrocarbon reserves in the SCAB, driving further exploration and research efforts in the area.
The research conducted in [9] in the SCAB has highlighted its relatively underexplored status, with the hydrocarbon discoveries being modest compared to the Rio Del Rey Basin. This disparity underscores the need for a strategic re-orientation of exploration approaches in the SCAB to better assess its hydrocarbon potential. Previous works have investigated various geoscientific and hydrocarbon-related aspects of the region [6,7,8,9,10,11,12,13,14,15,16,17,18,19,20,21,22,23,24]. Within the SCAB, the KCSB’s salt unit stands out as a particularly intriguing area of interest [9,10,11,14,22]. Despite initial drilling indicating a sparse hydrocarbon presence, this salt unit remains a promising target for exploration, as salt units often serve as effective seals or traps for hydrocarbons, preserving reservoirs beneath them [25,26,27,28,29,30,31,32,33,34,35,36]. Therefore, gaining insights into the depositional history and structural characteristics of the KCSB’s salt unit is essential. Understanding the geological processes and structural complexities associated with salt units is crucial for optimizing exploration strategies and potentially uncovering significant hydrocarbon reserves [25,26,27,28,29,30,31,32,33,34,35,36]. This knowledge could potentially reveal overlooked hydrocarbon accumulations that were missed during earlier drilling campaigns. Our focus in this paper is on the offshore domain of the KCSB and, specifically, examining its Aptian salt unit.
The literature review reveals several ongoing controversies, particularly regarding the (1) distribution, (2) depositional context, and (3) hydrocarbon potential of this target unit;
(1)
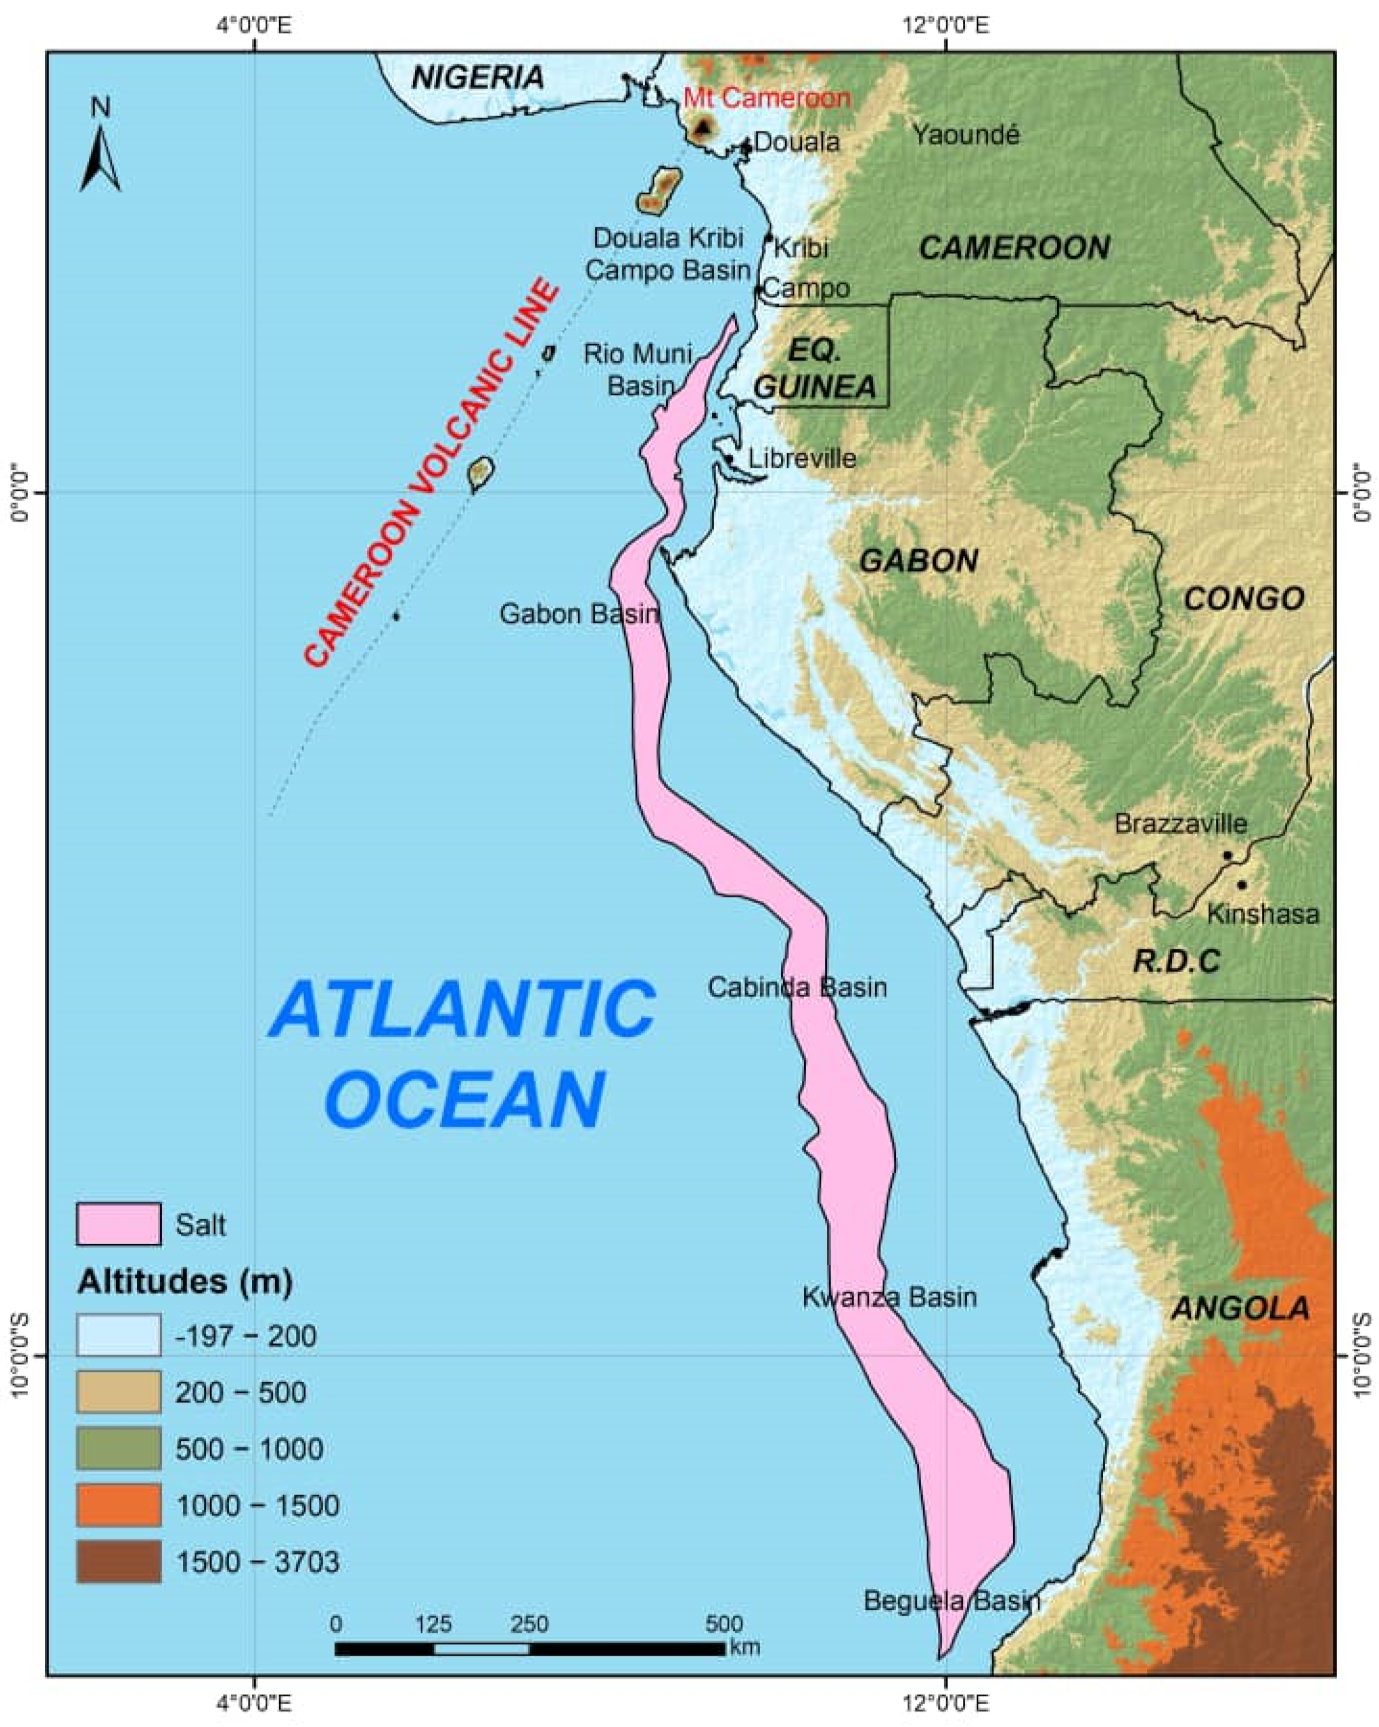
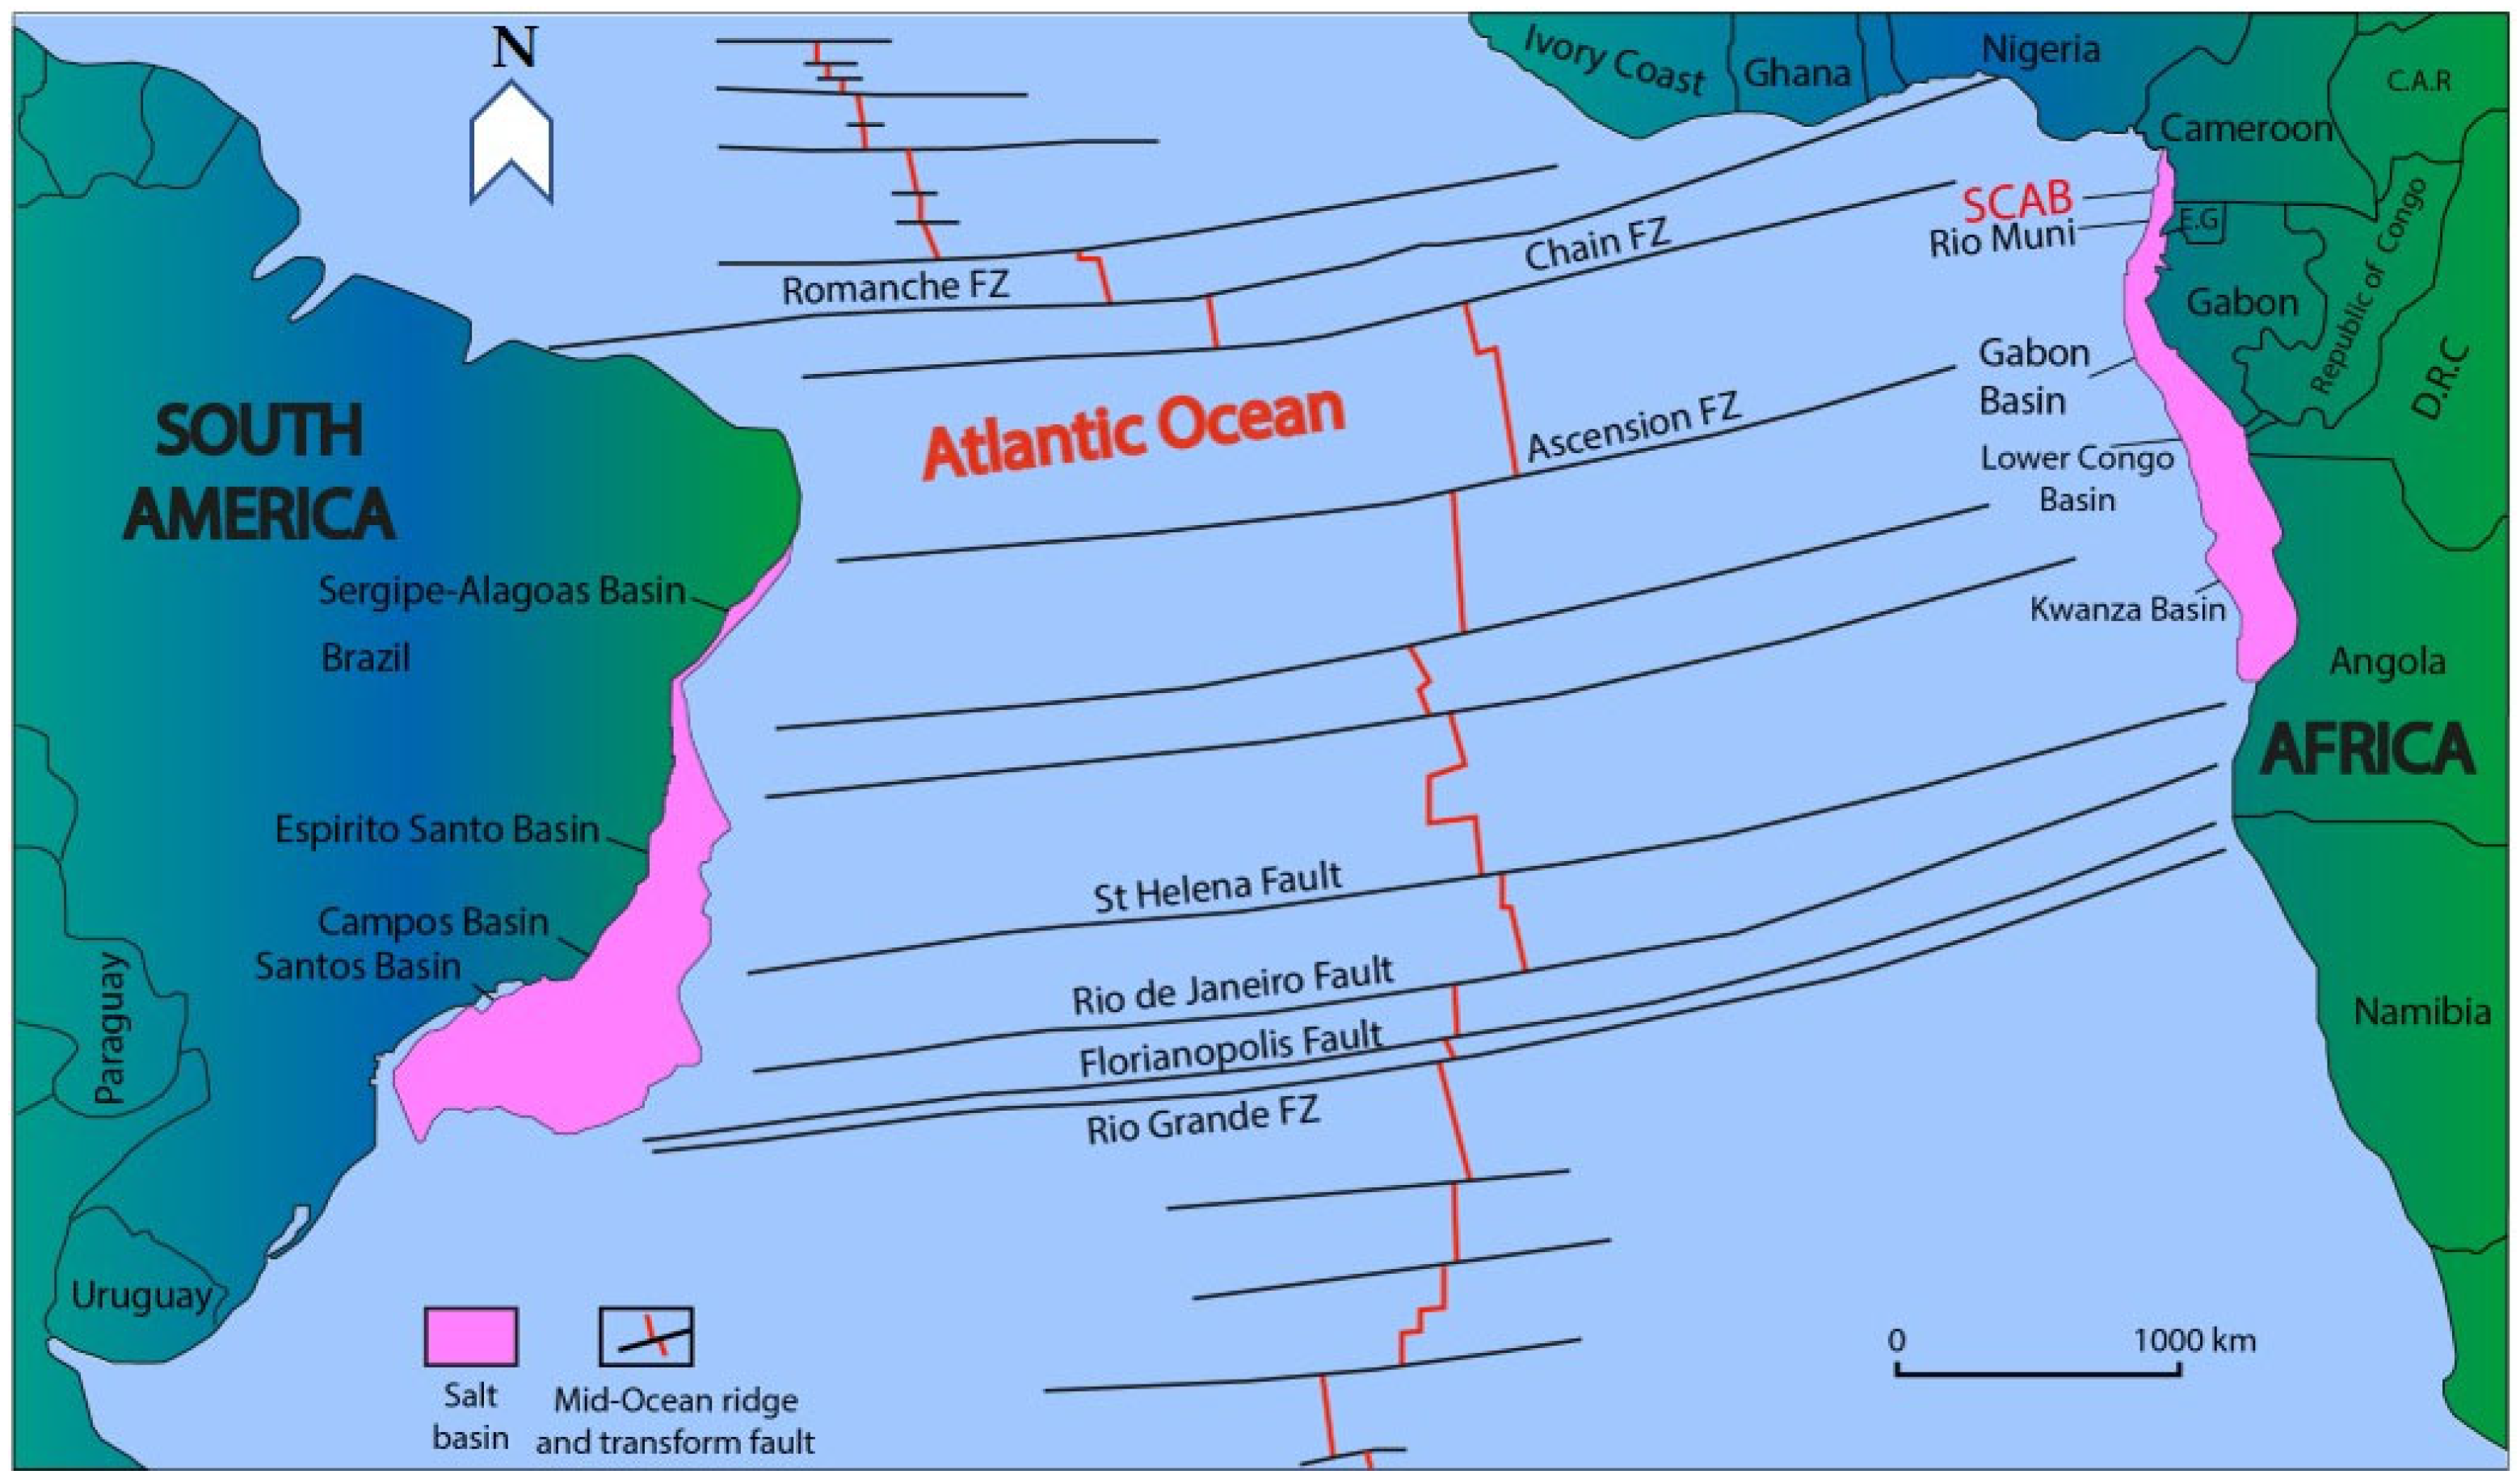
The distribution of the salt unit remains a topic of debate. Some authors [37,38,39] argue that salt deposits do not exist in the study area for several reasons. Firstly, they claim that along the SWAM, salt deposits do not extend beyond 1° N latitude. Secondly, they attributed the folds observed in the KCSB offshore area to the reactivation of transfer faults rather than the influence of underlying salt tectonics. This perspective is further supported in [40], which, in delineating the SWAM borders, restricts salt distribution to the region between the Angola and Rio Muni Margins (Figure 2), thereby suggesting the absence of this salt unit in the Cameroon Margin. Conversely, there are geoscientific studies and exploration campaigns [6,9,10,41,42,43], which have recognized the presence of salt deposits in the KCSB. However, debate continues regarding the extent of these deposits. Two main hypotheses exist; one suggests that the salt deposits are localized [19], while the other proposes a broader distribution along the SCAB offshore domain [6,9,14,41]. This ongoing debate highlights the need for further research to clarify the distribution and extent of the salt unit.
(2)
Regarding the depositional context, there is a notable division among researchers. One group [19,42,44,45] suggests that salt deposition occurred during the syn-rift phase, proposing that the salt is lacustrine in origin. The second group [14,41], on the other hand, argues that this event took place during the transitional or post-rift stages, indicating a marine type of salt. This divergence in viewpoints underscores the complexity of the basin’s geological history, making it challenging to pinpoint the precise timing and environmental conditions of salt formation in the KCSB.
(3)
The hydrocarbon potential of the KCSB warrants a thorough reassessment. The results obtained from ExxonMobil’s drilling campaign in offshore Kribi revealed a lack of petroleum associated with the identified salt diapir. The finding contrasts to recent studies of similar salt units [12], such as the Ezanga Salt in Gabon and the Rio Muni Salt in Equatorial Guinea, which have demonstrated promising hydrocarbon potential. Notably, the base of the salt diaper was not reached during the ExxonMobil campaign, leaving the possibility of untapped resources at deeper levels.
Given these observations, the salt unit in the KCSB is a crucial element for understanding the sedimentary evolution of the KCSB, the timing and extent of marine incursion across the SCAB, and the hydrocarbon potential. This work seeks to achieve these objectives by re-examining the geological processes responsible for the salt unit’s deposition, investigating its spatial distribution, and assessing its hydrocarbon potential. To accomplish this, we employ a combination of borehole and 2D seismic reflection analyses, aiming to provide a comprehensive understanding of the salt unit’s significance within the broader geological context. Additionally, by unlocking the sub-basin’s potential and contributing to the broader understanding of the SCAB’s hydrocarbon resources, this study will provide valuable insights that can guide future exploration efforts not only within the SCAB but also in similar geological settings worldwide.

2. Geological Setting

The KCSB is characterized as a rift-type margin, formed by the opening of the southern part of the Gulf of Guinea [43]. This region is significantly influenced by the extensional forces of the mid-oceanic ridge (MOR). The geological evolution of this region was predominantly shaped by the interplay of E–W extension forces, which have resulted in the development of broadly N–S-trending structures [19]. Offshore, with approximately 25 km wide, the KCSB features a complex arrangement of fault-bounded blocks, consisting of horsts and grabens [45]. The northern end of the offshore KCSB is marked by the submarine Yassoukou High associated to NE–SW- and ENE–WSW-trending structures, which extend into the Atlantic. Its western and eastern borders are delineated by the Atlantic Ocean and the Precambrian basement, respectively [24]. The Precambrian basement is upfaulted by N–S- and NE–SW-trending faults. To the south, the offshore KCSB is bounded by the Kribi-Campo High, adjacent to the Rio Muni Basin [19]. This structural configuration is indicative of the tectonic activity and extensional regime that have played a critical role in the basin’s formation and evolution.

2.1. Overview of SWAM Salt Basins

The southwest African Salt Basin encompasses at least two significant salt basins, as follows: the Rio Muni Basin and the main Gabon–Congo–Angola Salt Basin. This section provides a comprehensive overview of the salt units found within (1) Cameroon-Rio Muni Basins, (2) Gabon Basin, (3) Cabinda, Lower Congo basins, and (4) Kwanza, Benguela, and Moçamedes basins.
(1)
The coastal basins of Cameroon, specifically the Douala and Kribi-Campo sub-basins, along with the Rio Muni Basin in Equatorial Guinea, are regarded as the African counterparts of the Sergipe-Alagoas Basin in northeastern Brazil. Comparing these basins in Africa and Brazil highlights their geological similarities and differences. Some works [43,46] have shown that the salt units found in these regions (Kribi salt and Rio Muni salt) formed during the syn-rift phase. With a thickness up to 800 m, these salt units are interbedded with lacustrine shales, representing the second term of the syn-rift sequence [3]. This observation suggests that the salts in the KCSB and Rio-Muni Basin are of lacustrine origin. Lacustrine salts typically form in restricted, evaporitic settings where periodic changes in water chemistry and climate conditions lead to the precipitation of salts [19,43,45].
(2)
In Gabon, the saliferous sedimentation is represented in the onshore parts of the Interior, North, and South Gabon sub-basins by the Ezanga Formation. The Ezanga Salt is predominantly composed of halite, and occurred during Aptian time (post-rift stage) [3,43]. Typically, the deposition of halite indicates periods of restricted marine environments characterized by high evaporation rates. Estimating the true thickness of this salt is challenging because of the extensive salt deformation, however it is known that its thickness reaches approximately 1000 m in the offshore part of the Gabon Basin [3].
(3)
In the Cabinda and Lower Congo basins, evaporites known as the Loeme Salt were deposited during the late Aptian, primarily consisting of halite and minor anhydrite. These deposits exhibit varying thicknesses ranging from 800 m to 1000 m [3]. This extensive evaporitic stage ended with the deposition of approximately 50 m of dolomites [43]. These observations indicate that the Loeme Salt of marine origin [3] was deposited during the post-rift stage, like the Ezanga Salt in Gabon.
(4)
In the Kwanza, Benguela and Moçamedes basins, the salt formations exhibit similarities to the Loeme Salt observed in the Lower Congo. Its deposition occurred in this area during the Aptian–Albian period, as a substantial evaporitic sequence reaching a thickness of approximately 600 m [3,43]. Unlike other regions, the salt deposits in this area consist of halite, anhydrite, and dolomite [3,43]. Similar to the Loeme Salt, the salt deposits in this domain were formed during the post-rift stage, suggesting that they are also of marine origin [3].

2.2. Stratigraphic Descriptions

The offshore deepwater domain of the KCSB is covered by sedimentary deposits up to 5 km thick [6,9,10]. The stratigraphic evolution of this sedimentary pile involves nine key formations from the bottom to top (Figure 3). These formations and their corresponding time periods are the Lower Mundeck (Berriasian to middle Aptian), Upper Mundeck (late Albian), Logbadjeck (Turonian to early Campanian), Logbaba (middle Campanian to Maastrichtian), N’kapa (late Danian to Lutetian), Souellaba (Oligocene to middle Miocene), Kribi (middle Miocene), and Wouri and Matanda (Pliocene to recent). Each of these formations was deposited in specific environments that reflect the dynamic geological history of the basin. This work will place special emphasis on the pre-Cenomanian formations, namely, the Lower and Upper Mundecks, which are crucial for understanding the early geological development and hydrocarbon potential of the KCSB.
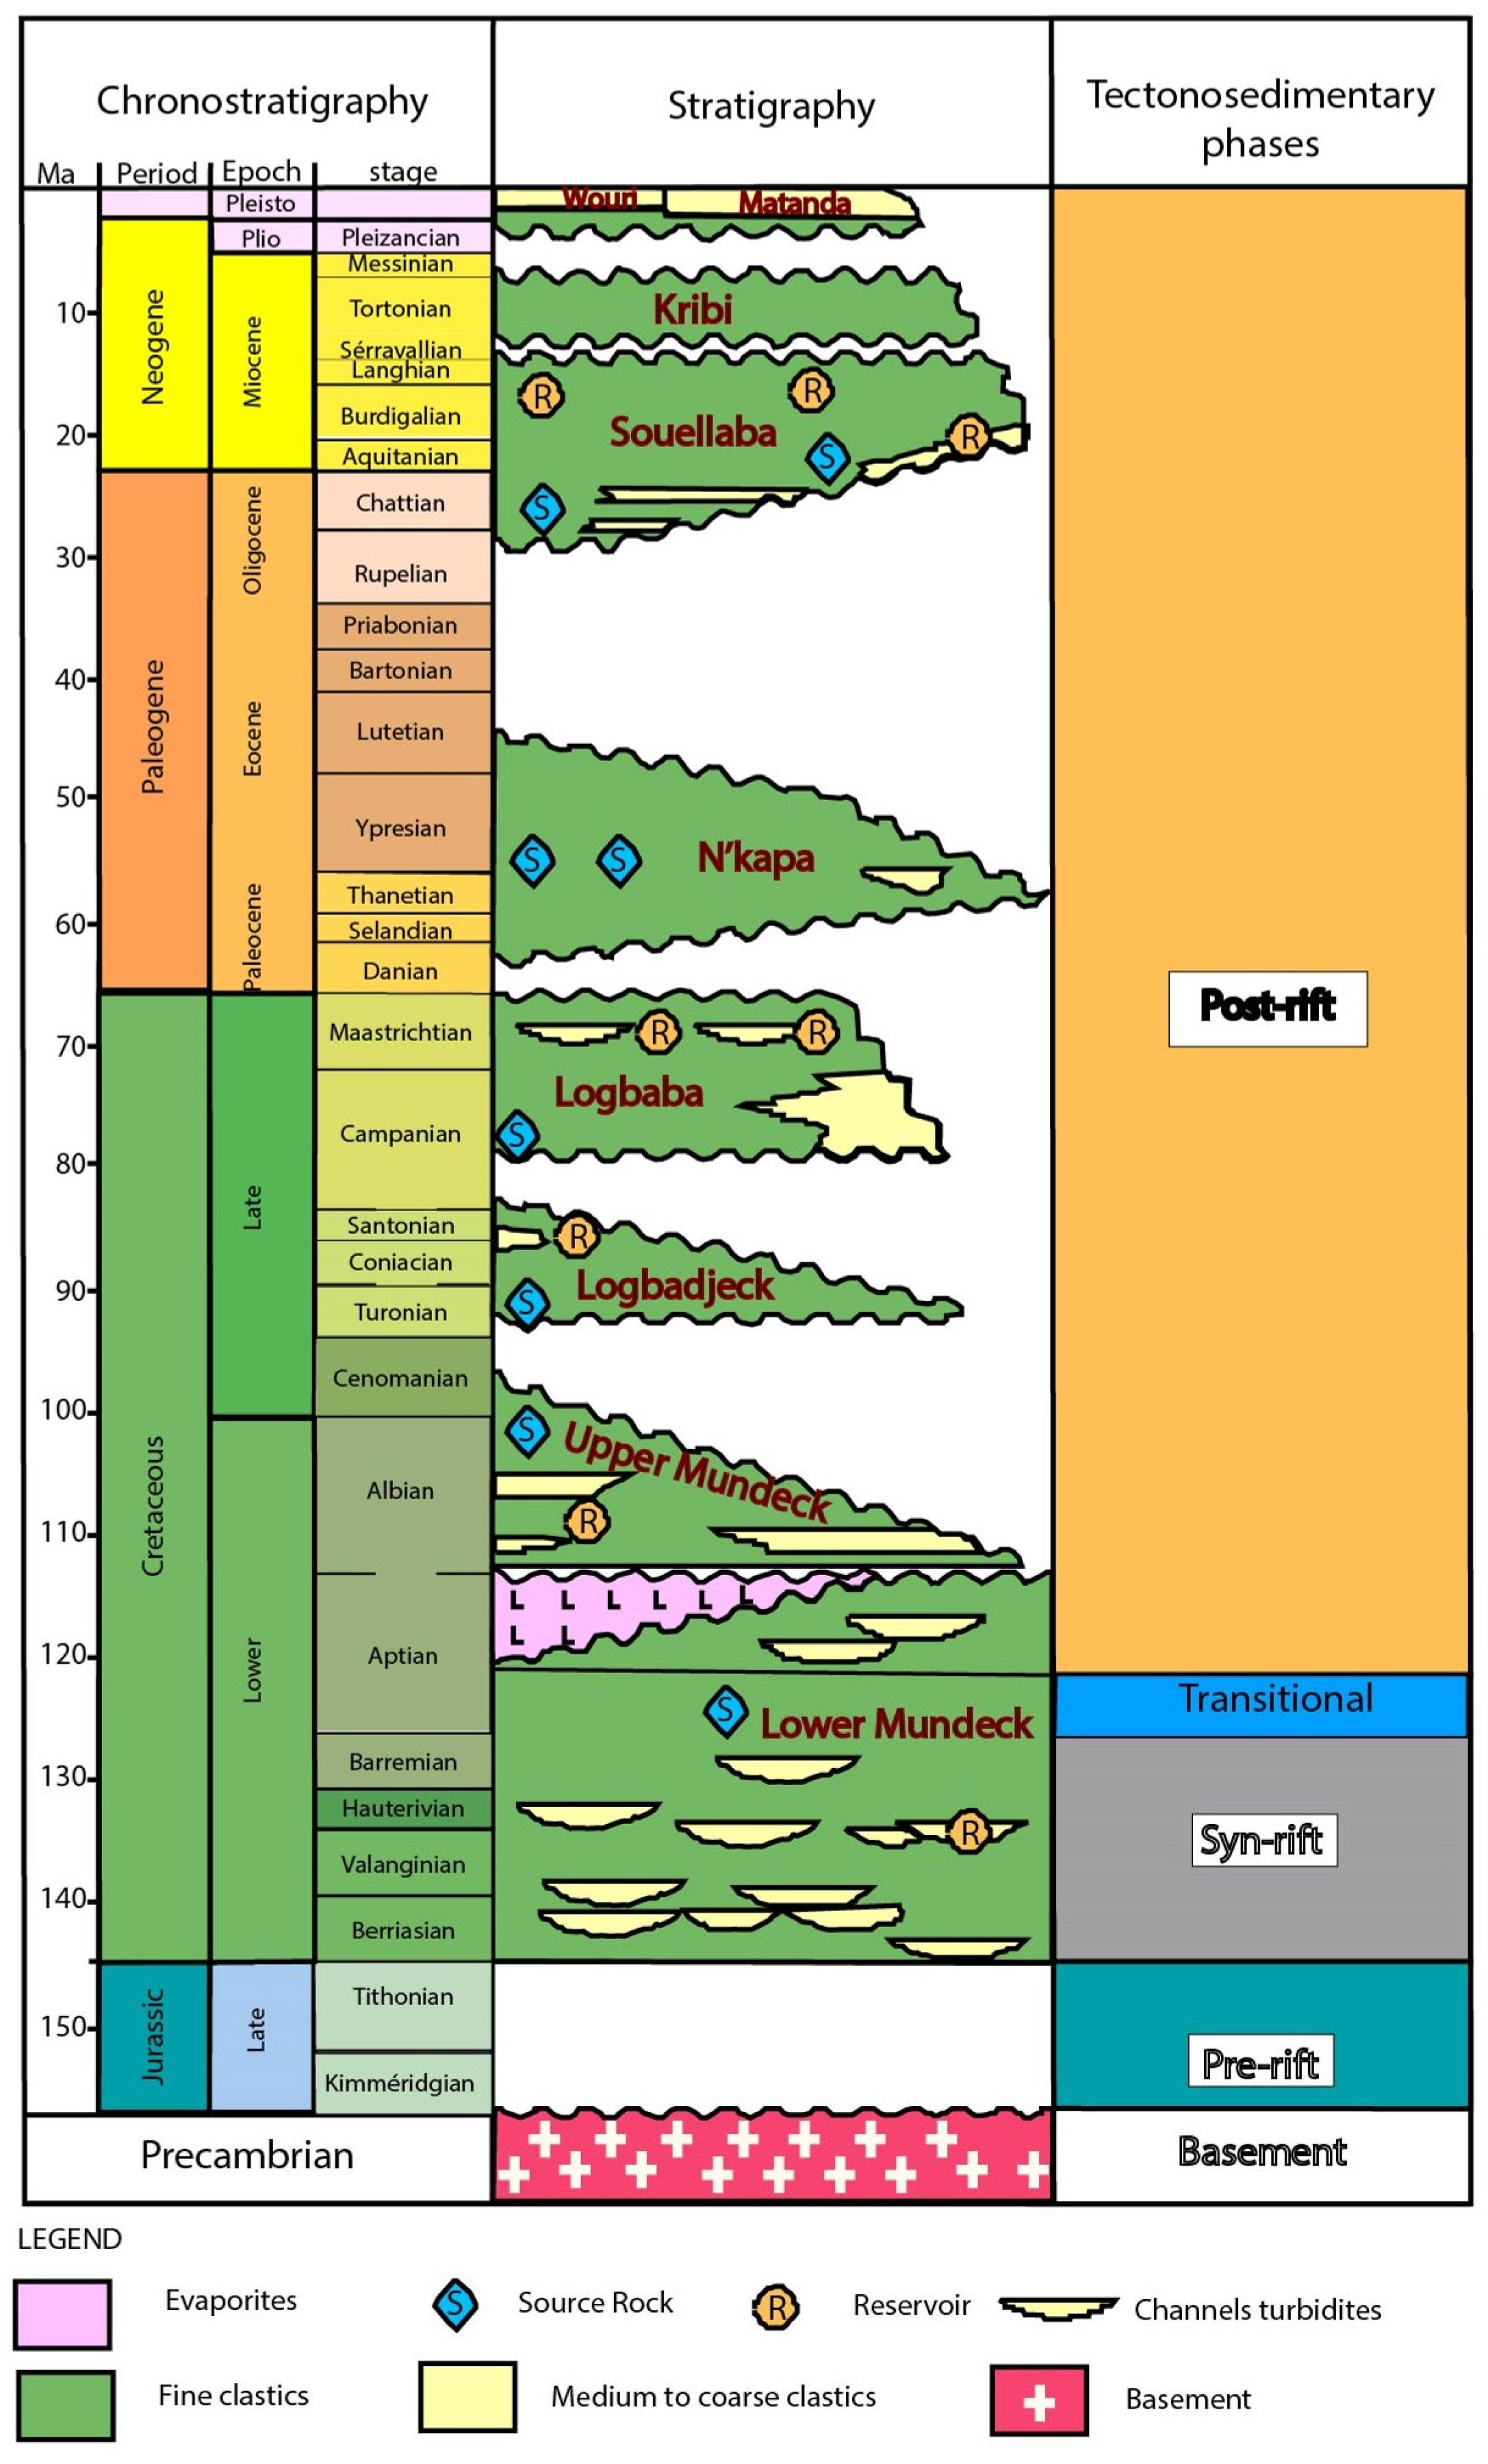
  • The Lower Mundeck Formation
Onshore, its lithological composition includes a diverse range of materials, such as sandstones, coarse sands often conglomeratic, marls rich in organic matter, thin beds of limestone, and dark-gray shaly clays [19,21,24,44]. Its basal part is predominantly composed of fluvial and alluvial deposits, indicative of a terrestrial environment, while the upper part transitions into marine sediments, such as clays, organic-rich bedded clays, and carbonate pasts. This transition marks the late Aptian to early Albian sequence. Offshore drilling data reveal a lithological profile, comprising primarily sandstones, shales, siltstones, and evaporites [6,9,10,22]. This formation is indicated at the eastern margin of the KCSB, including the Campo High [19]. However, its presence in the central and offshore parts has been inferred but not directly penetrated.
  • The Upper Mundeck Formation
This formation, initially described in [46], is distinguished by transgressive multicolored sandstone and clay deposits, exhibiting a predominant character of continental margin deposition. These facies exhibit a notable thickening trend toward the west, reaching depths of at least 600 m within the basin. Subsequent studies in [47] have dated the Upper Mundeck Formation to the late Albian period, highlighting its composition of mixed marine and terrestrial deposits. This formation is widely distributed across both the continental shelf and deepwater of the KCSB. Additionally, outcrops of the Upper Mundeck Formation have been identified onshore [24], providing its stratigraphic continuity in the study area.

2.3. Depositional Environments

The paleogeographic evolution of the pre-Cenomanian period in the SWAM, including the study area, begins with an arid climatic regime extending from the pre-Cretaceous to the Berriasian [19]. This period of aridity coincided with regional subsidence driven by extensional forces acting between Africa and South America, resulting in the deposition of the Lower Mundeck Formation [24]. These geological processes established the stage for subsequent seafloor spreading during the Aptian [5,16,48,49]. A hypothesis, supported by global eustatic curves [50,51], suggests a transgressive phase in the early Aptian, followed by a regressive phase in the middle to late Aptian. During this transition, evaporite deposition was marked, demonstrating that salt deposition in the study area occurred within a marine environment influenced by significant tectonic events. These also impacted on the dolomitization of syn-rift deposits [10,52].

2.4. Geodynamic Evolution

The geodynamic evolution of the KCSB (Figure 3 and Figure 4) encompasses the following four distinct phases: (1) pre-rift, (2) syn-rift, (3) rift-drift, and (4) post-rift [9,10]. From the bottom upwards, these phases are outlined as follows:
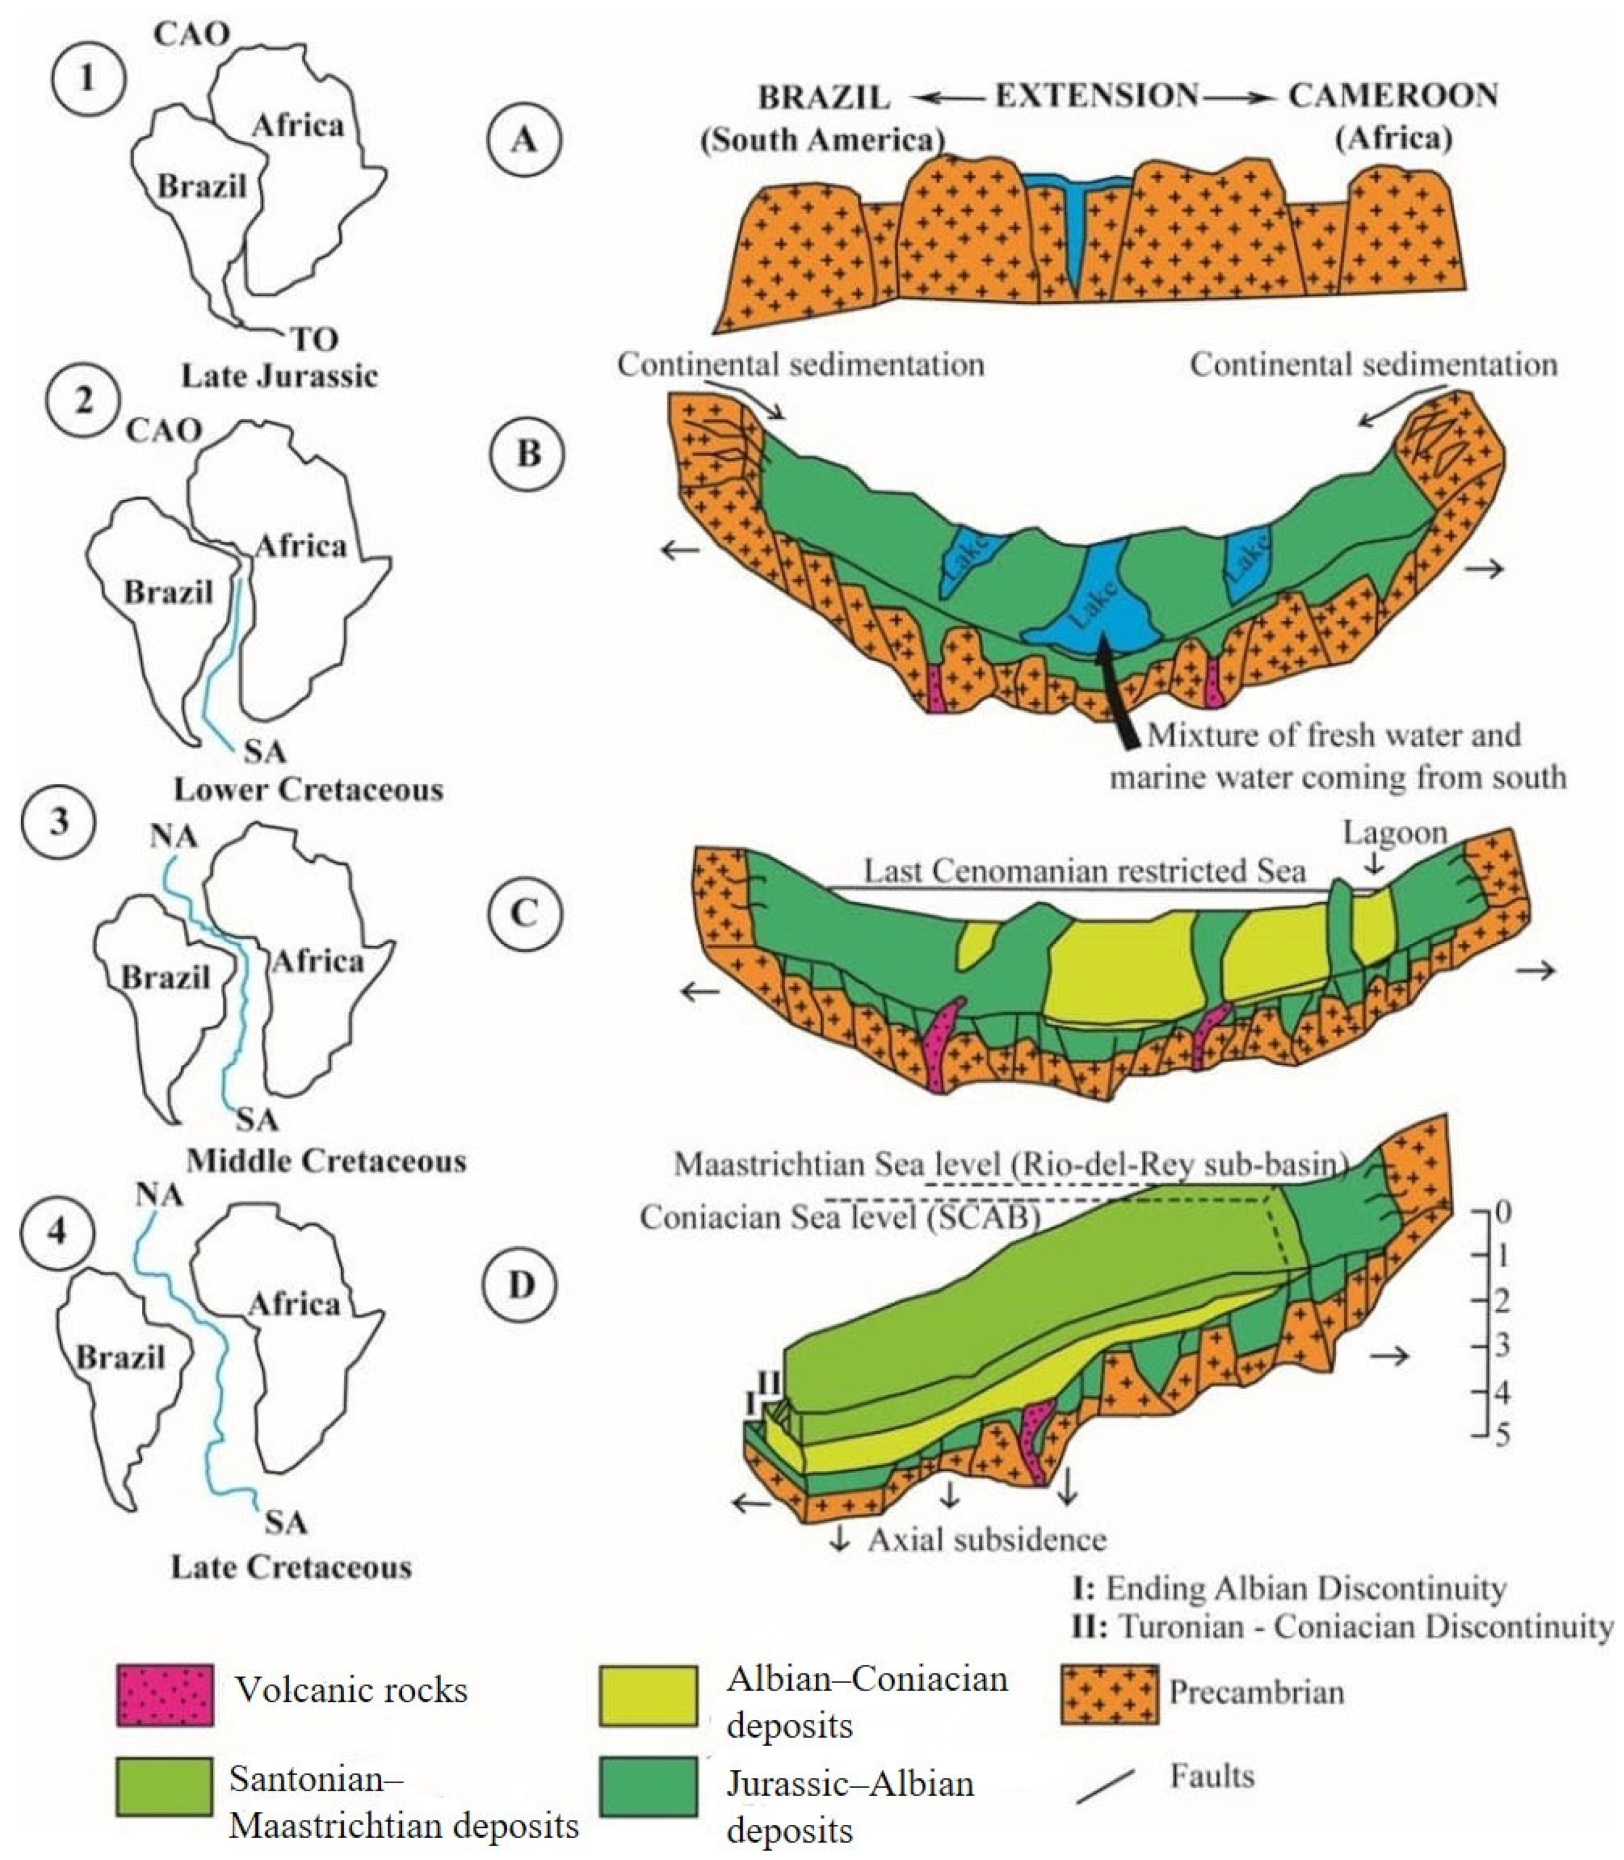
  • Pre-rift phase (Late Jurassic; Figure 4A): The pre-rift phase is marked by the development of the Afro-Brazilian depression during the Late Jurassic, following the implementation of regional subsidence [19]. The pre-rift mega-sequence consists of continental deposits, including alluvial, fluvial, and lacustrine sediments. However, these deposits have not yet been identified in outcrop within the study area. According to some works [16,41], the pre-rift section, dated to the Late Jurassic [10,12], consists of Precambrian-sourced arkosic sandstones and conglomerates. [3] noted that this section is only observed in the deeper offshore parts of the study area, corroborated by other studies focusing on the offshore part [6,9,10]. These deeper offshore observations highlight the complexity and significant depth of the pre-rift deposits, which have remained largely buried and unexplored in onshore sections.
  • Syn-rift phase (Berriasian to early Aptian; Figure 4B): [54] suggests that the history of the South Atlantic Basin during the syn-rift phase is marked by the separation of Africa and South America, which initiated the opening of the South Atlantic Ocean. This tectonic event led to multiple phases of subsidence, resulting in the development of elongated and faulted basins [19]. The primary characteristic of this period is the extensional tectonics that established a structural framework dominated by a submeridian cutting in horsts and grabens. Superimposed on these structures are N60° E faults, which serve as are early indicators of the Atlantic transform faults [38]. This fracturing pattern, controlled by listric faults and associated roll-overs [55], suggests that these features may have been inherited from the underlying Precambrian basement structures. This phase is particularly significant for the deposition of the Lower Mundeck Formation [41], which rests unconformably on the Precambrian basement. In this phase, lacustrine environments developed in low-lying basins where rivers or streams supplied freshwater while simultaneously allowing for the intrusion of seawater during periods of high sea level or tectonic activity.
  • Rift-drift phase (early to middle Aptian): The rift-drift phase, spanning the early to middle Aptian, is marked by significant geological activity, including the deposition of salt and the establishment of a series of faults that segmented the rift structure [39]. During this period, the deposition of evaporates, primarily consisting of salt, occurred extensively along the SWAM including the KCSB. This saliferous sedimentation is a key feature of the rift-drift phase, indicative of the unique depositional environments. The formation of salt layers was facilitated by restricted marine conditions, leading to the evaporation of seawater and the subsequent precipitation of evaporite minerals. In the KCSB, the presence of these salt deposits has been reported by borehole data analysis [16,41], which is defined as the Mundeck salt unit in this study.
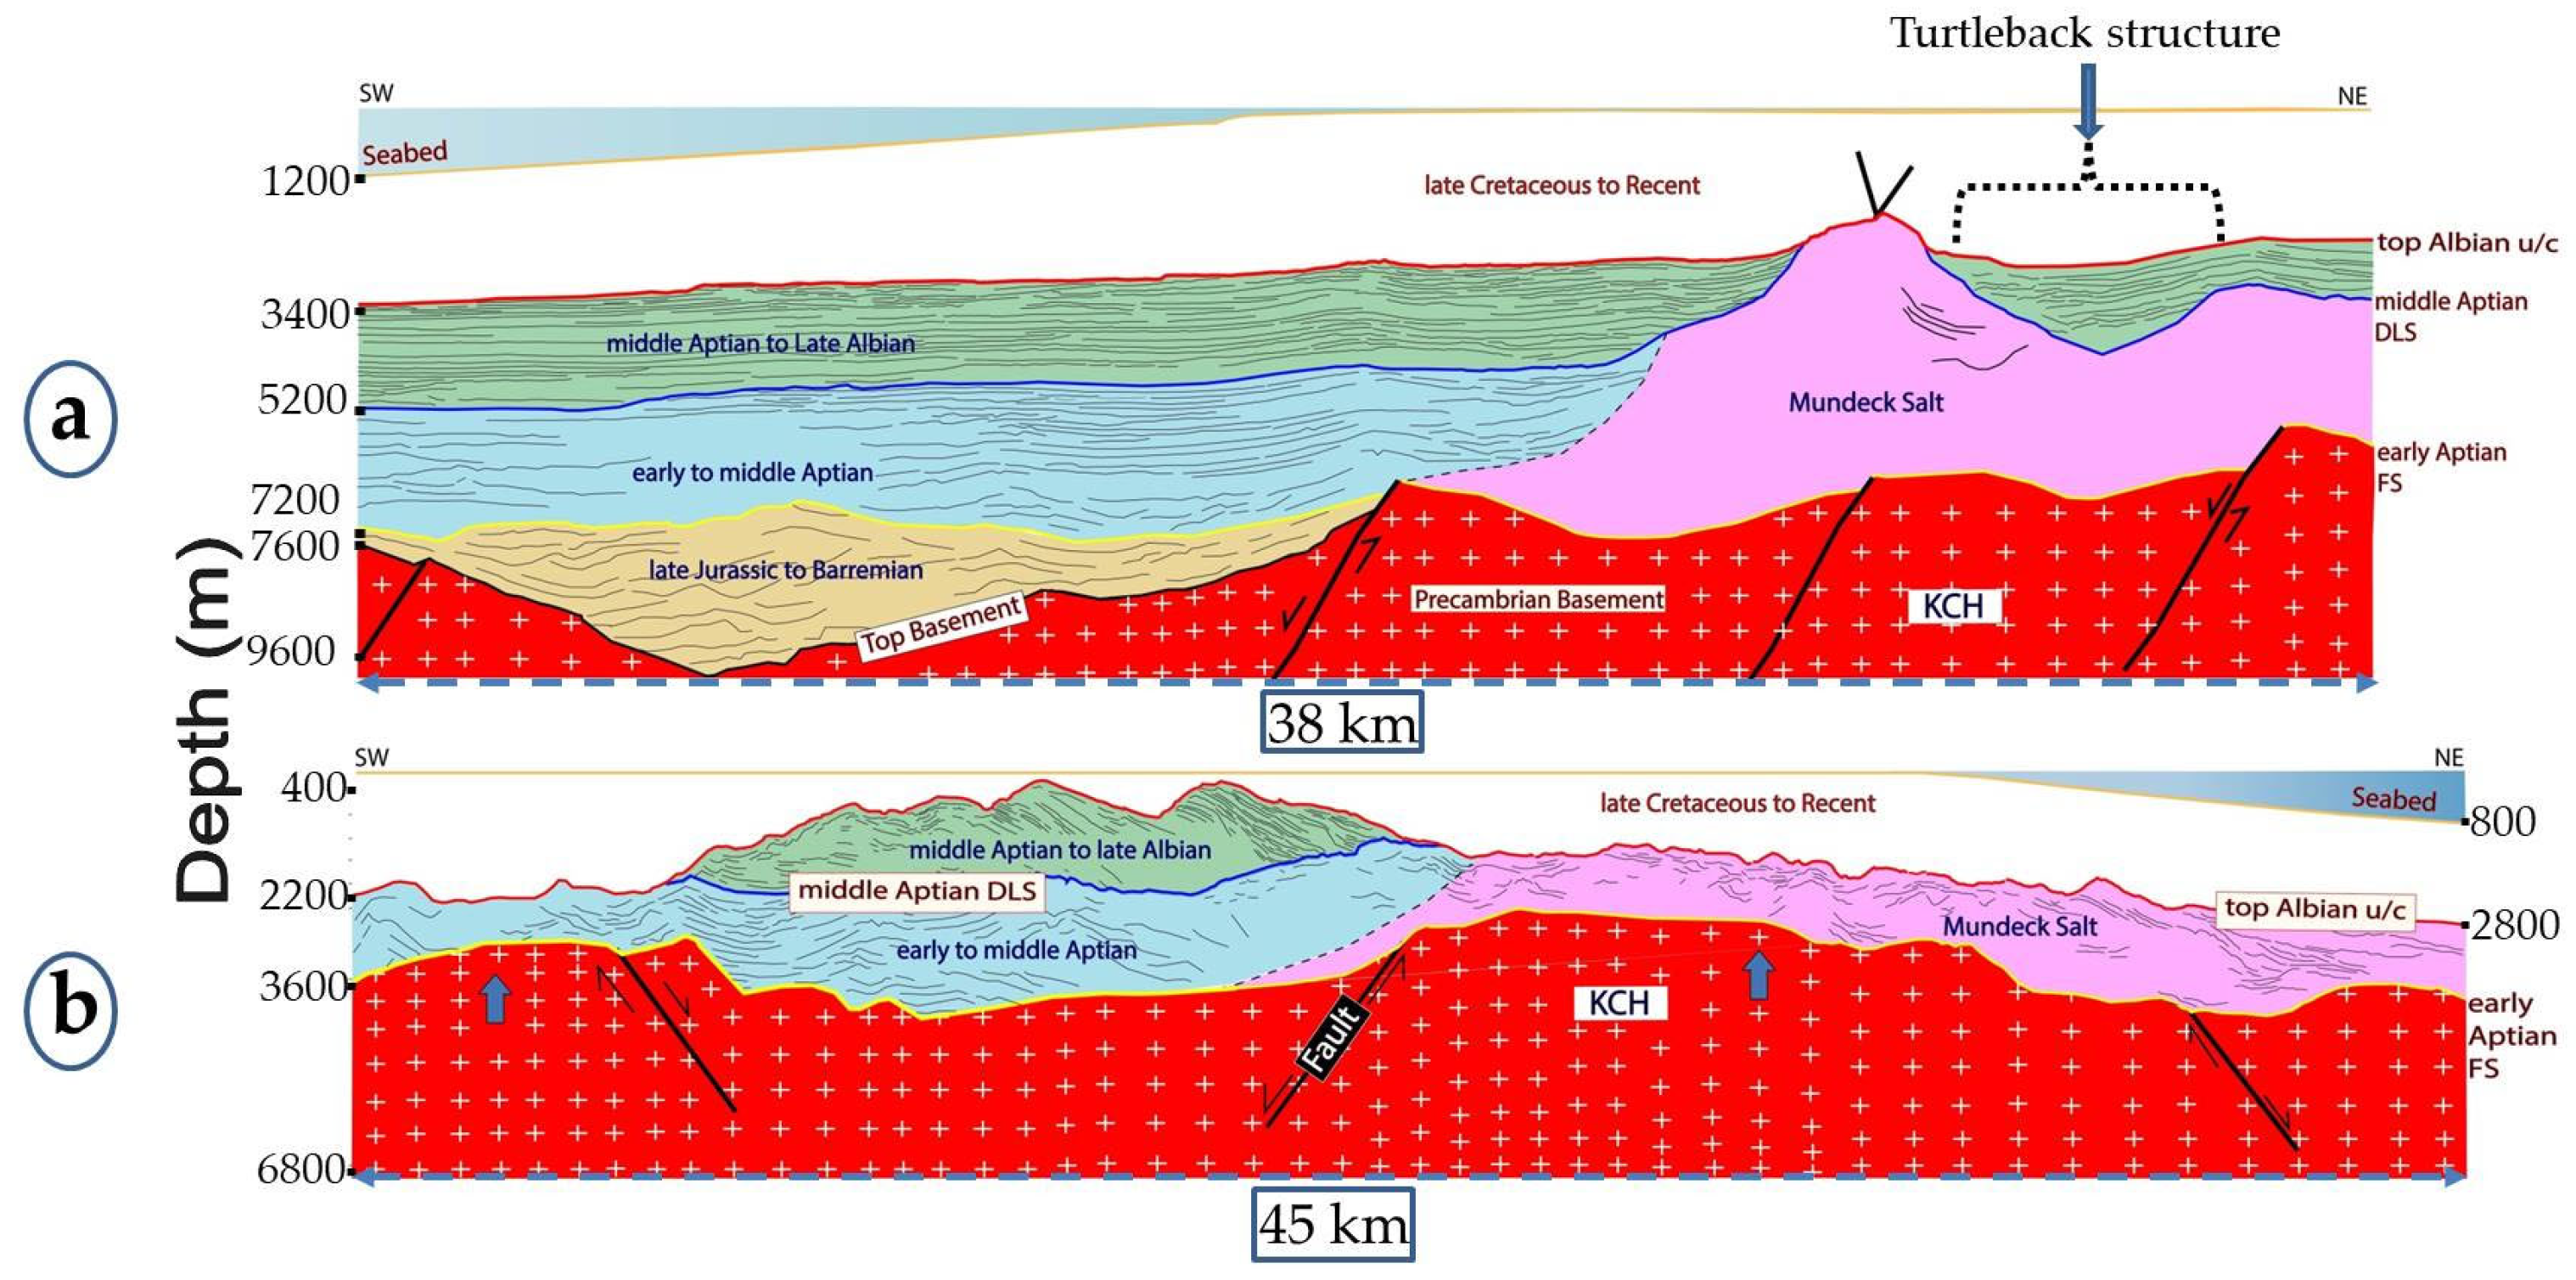
  • Post-rift phase (middle Aptian to recent; Figure 4C,D): The post-rift phase, extending from the middle Aptian to the present, is characterized by the development of structures, likely related to the movement and deformation of salt and gravitational instability along the margin. It led to the reversal of roll-over structures and the formation of complex subsurface features. This period is marked by three stages; the initial drift (Albian–Coniacian) is characterized by the uplift of the margin, inducing a rotation of the tilted blocks and the Senonian angular unconformity. The second drift (Santonian–Eocene) is marked by the inversion of the roll-over structures and the folding of the platform. The final drift (Eocene–Pleistocene) is linked to the last gravity slides induced by the Cenozoic uplift.

3. Data and Methodology

3.1. Data

The data used in this study were provided by the National Hydrocarbon Corporation of Cameroon (NHC), selected for their depth and reliability. This dataset includes five boreholes (B1–B5) and two 2D seismic sections (SS1 and SS2) (Figure 5), covering a total of 2888 km2 in the KCSB offshore domain. The five borehole data available for this paper provide well logs, sourced from MOBIL’s drilling campaign carried out between 1960 and 1982. They are located on the KCSB continental shelf and reach depths ranging from 1 to 4 km below the seabed. Their stratigraphic interval extends from the Aptian to the recent. They span an aerial extent of 6600 km2 on the margin. Detailed characteristics of each borehole are presented in Table 1.
The offshore seismic sections, covering approximately 602 km2, span both the continental shelf and deepwater zones of the KCSB. These sections were obtained during the Cameroon Span campaign in 2005 by ION Global Exploration Technology. The acquisition parameters of the seismic data are shown in Table 2. The processing from raw data to depth-migration profiles has been documented in several studies [6,10]. This allows for the imaging of geological features down to a depth of 6 km, providing a robust basis for detailed seismic profile interpretation. Utilizing American polarity standards, the main parameters for each seismic section are summarized in Table 3.

3.2. Methodology

3.2.1. Borehole Data Analysis

Based on previous works [10], this stage was performed through a systematic four-step process to ensure thorough analysis and accurate interpretation, as follows: (1) delineation of Top Aptian or Top Albian–Aptian deposits in each borehole, (2) lithological description of these deposits, (3) correlation of lithology with depositional environments, and (4) tracking the Top Salt.

3.2.2. Seismic Data Analysis

This step was instrumental to accurately tracking the distribution of the Top Salt within the study area. It enabled us to understand the external morphology of the salt unit and identify potential Direct Hydrocarbon Indicators (DHIs) or structural styles associated with the salt deposits.
The analysis and interpretation of 2D seismic data were conducted using the techniques and terminologies of standard seismic stratigraphy with related-salt studies [52,56,57,58,59,60,61,62,63], as well as insights from previous works in salt basins around the SWAM [25,26,27,28,29,30,31,36]. The methodology for this paper can be summarized as follows: well-to-seismic calibration, identification of seismic boundaries, delineation and characterization of seismic salt facies, tracking DHIs within or around identified salt bodies, and delineation of salt structures and traps for hydrocarbon potential evaluation.
The well-to-seismic tie process involved marking the Top Salt on seismic sections, tracing its distribution in sectors not investigated by borehole, and evaluating the thickness of the identified salt unit. This is achieved by correlating borehole data with seismic data to ensure a consistency of the geological and geophysical interpretations. The Top Salt was recognized by identifying the distinctive seismic characteristics of this stratigraphical surface, which included specific amplitude and continuity patterns indicative of the salt layer. The standard seismic stratigraphy techniques [52,56,57,58] and theoretical studies focusing on salt delineation [59,60,61,62,63] guided to analyze the available data. To better appreciate the salt deposition period in the study area, this step involved identifying seismic sequence boundaries within the Aptian–Albian period. The sequence boundaries were delineated by recognizing reflection terminations. For the main seismic reflection terminations identified in the KCSB deepwater domain, the terminologies were reviewed by studies in [10]. Particularly, for the salt identification in the 2D seismic data, the presence of “toplap terminations” associated with salt dome flanks (Figure 6) was critical in determining the occurrence and distribution of salt deposits. This step involves examining the internal and external shapes of salt facies on the seismic data, focusing on internal parameters of reflections (amplitude, continuity, and frequency) and external characteristics (configuration). Once the salt unit is delineated, the next step is to mark the Top Salt surface on seismic profile and track its distribution across the profiles. The structural analysis associated with these target bodies will primarily draw on the studies in [36] on the South Atlantic Margin. These studies outline the main salt structures encountered in the SWAM and their association with hydrocarbon traps (Figure 6). Furthermore, for enhancing our knowledge on the hydrocarbon potential associated with the salt, the DHIs such as bright spot, dim spot, and flat spot were tracked within or around the identified salt units. This tracking was conducted using the terminologies and methodologies outlined in various studies (e.g., [64,65,66,67,68,69]). The main parameters for the delineation DHIs in 2D seismic sections are summarized in Table 4.

4. Results

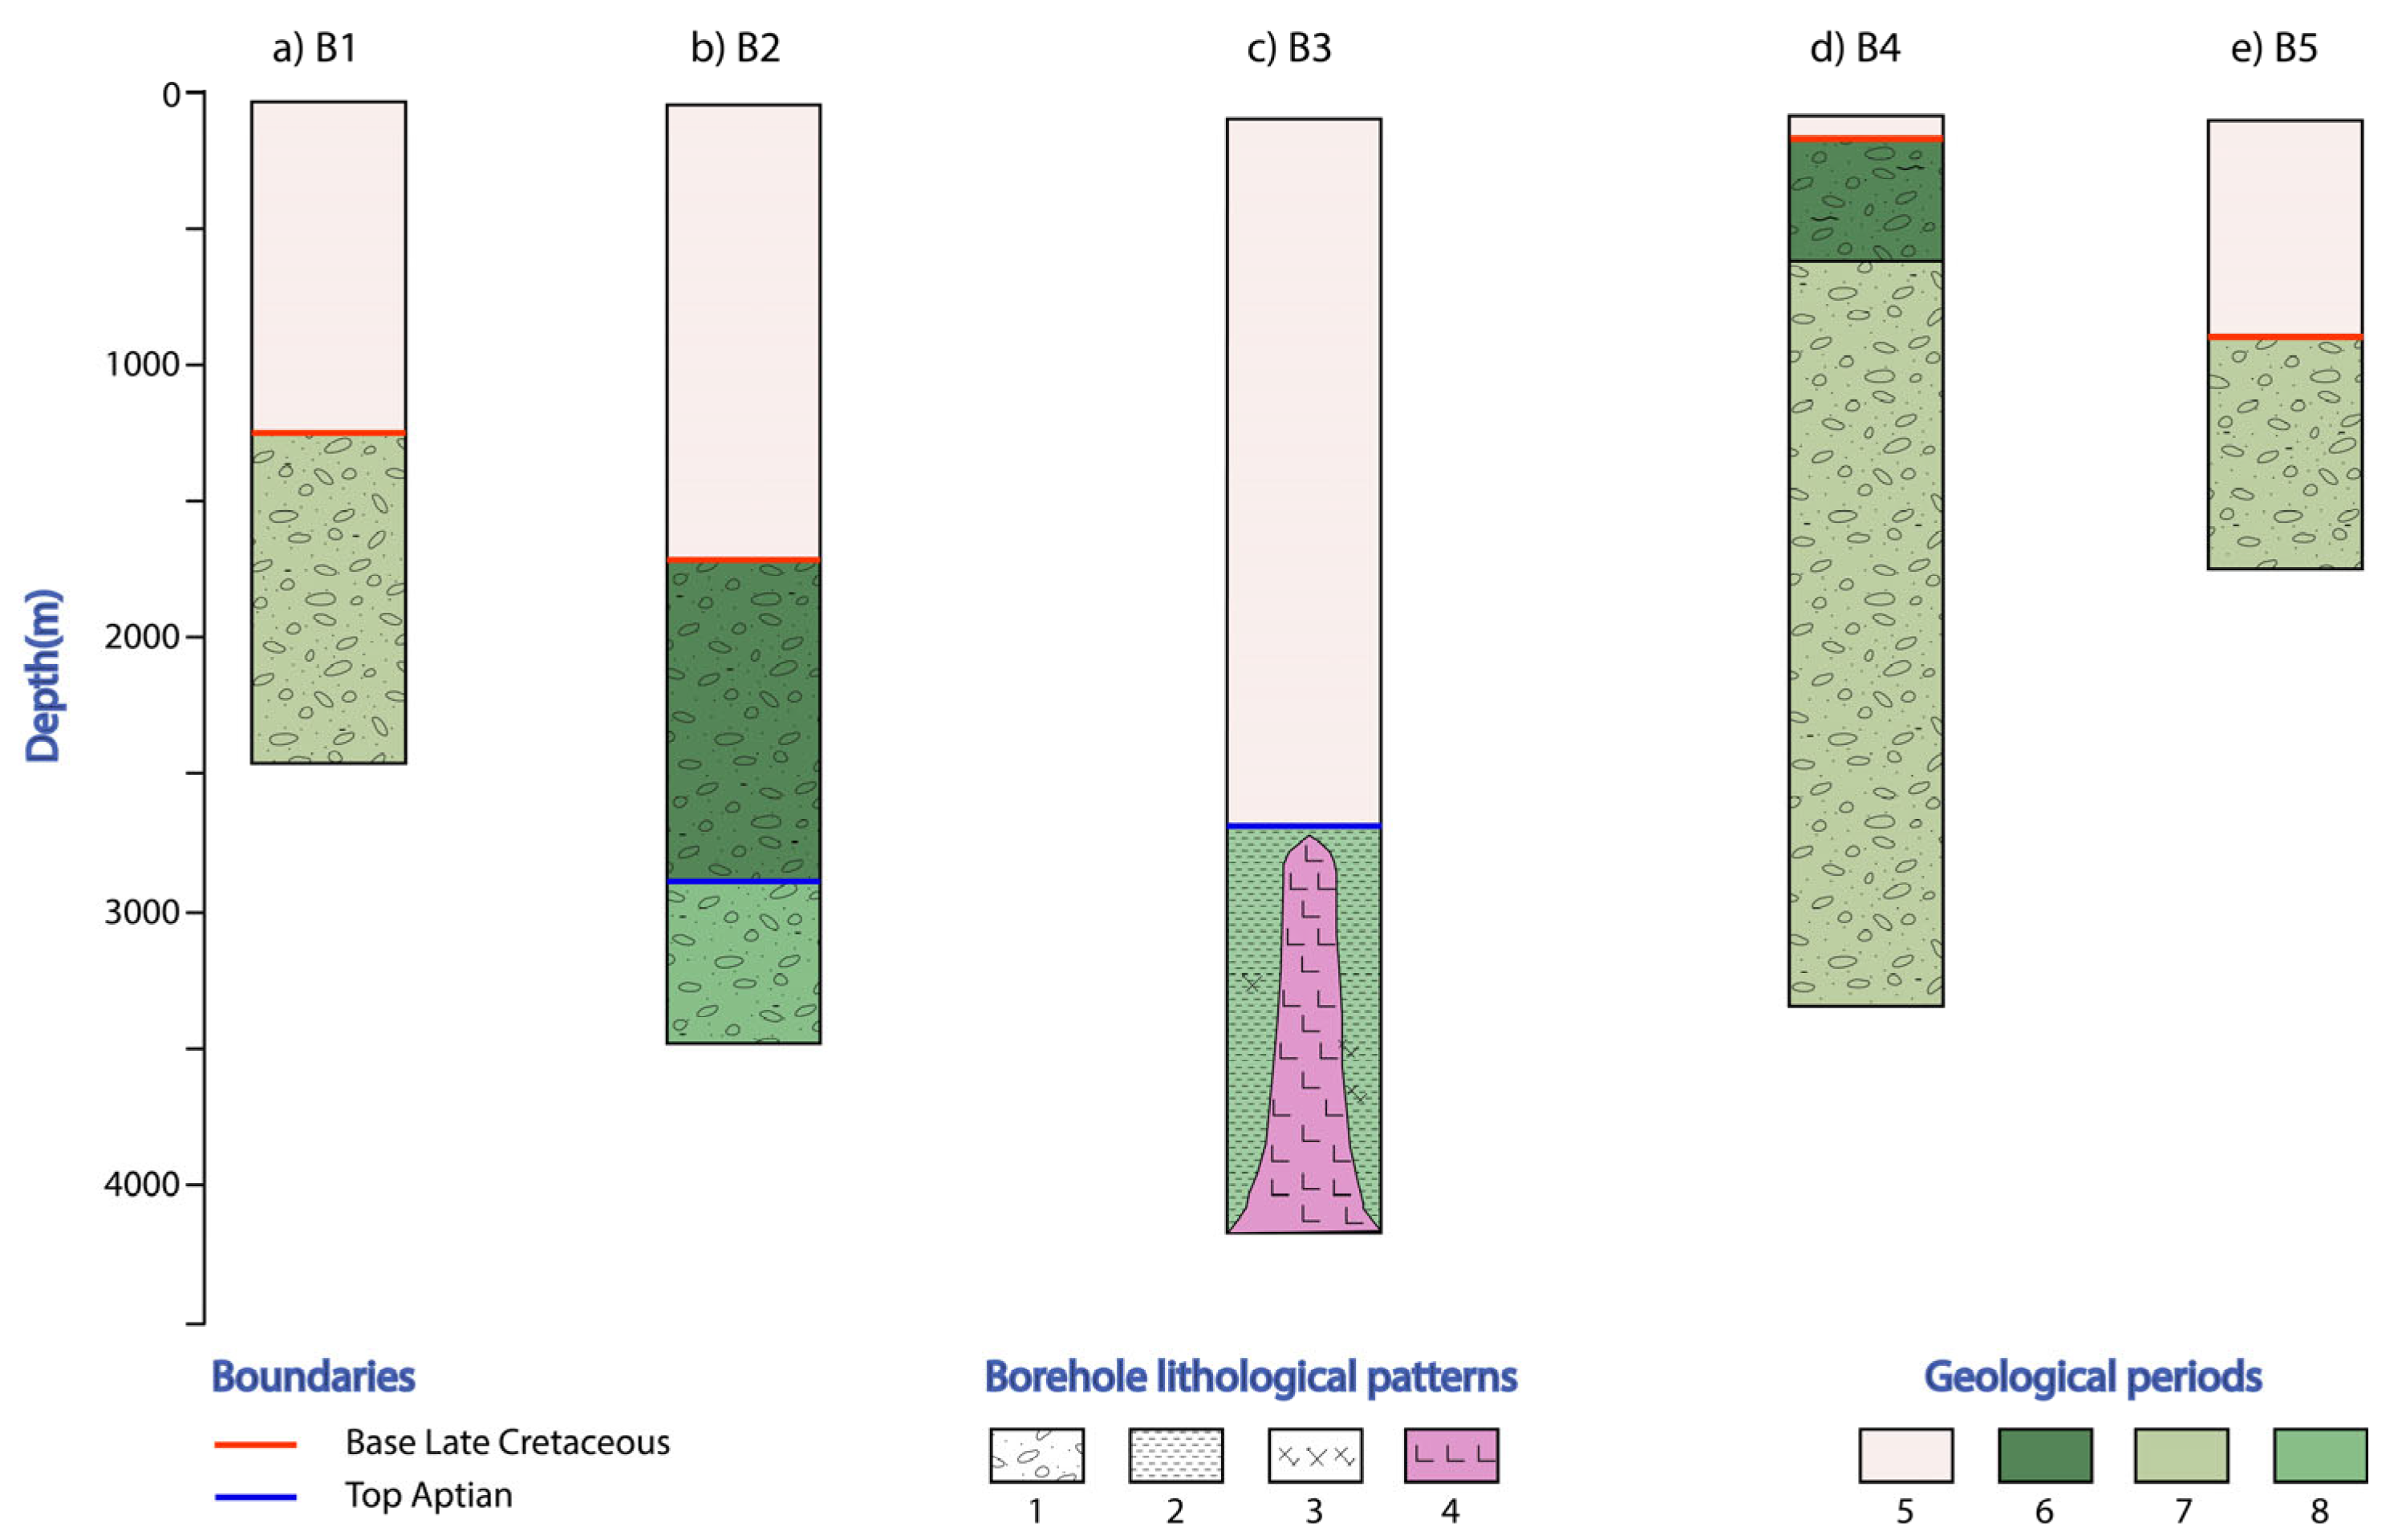
4.1. Lithological Description and Interpretation

This study focuses on providing a detailed lithologic characterization of the Aptian to Albian strata within the KCSB, using comprehensive data obtained from boreholes B1 through B5 (Figure 7). The analysis includes a thorough examination of rock types, sedimentary structures, and depositional environments. These findings are integrated with seismic interpretations, facilitating the construction of a detailed stratigraphic framework. This framework highlights the variability, distribution, and spatial relationships of the Aptian to Albian strata and associated salt deposits in the region.
Boreholes B1 and B2 are located on the Campo Shelf in the northeastern part of the KCSB offshore domain (Figure 6). At borehole B1, the Aptian–Albian strata extend from depths of 1250 m to 2464 m, with a thickness of 1214 m (Figure 7a). The boundary between these stages is not clearly defined. The observed lithological facies include various sandstones, siltstones, and dark-grey to black shales. Borehole B2 contains the Aptian–Albian deposits, with a well-defined stage boundary at a depth of 2885 m (Figure 7b). The Albian strata are found between 1709 m and 2885 m, with a thickness of 1176 m, and the Aptian deposits are thicker than 590 m. The lithological facies in borehole B2 are similar to those observed in borehole B1, with the exception that black shales are less common in borehole B2. The sedimentological characteristics at boreholes B1 and B2 indicate a mix of terrestrial and marine environments, suggesting deposition in a deltaic zone. Regarding salt deposits, no evidence was observed in either borehole. The absence of salt suggests that these strata were not affected by the geological processes responsible for salt genesis in this sector of the KCSB offshore domain.
In borehole B3 on the Kribi shelf, the Albian deposits are notably absent (Figure 7c). Instead, the late Cretaceous to recent sediments directly overlie the Aptian strata. The Aptian sediments are predominantly characterized by a substantial salt unit, interspersed with thin streaks of dark shales and traces of anhydrite. The Top Salt horizon, which marks the boundary with the Late Cretaceous, is situated at a depth of 2714 m. This salt unit exhibits a significant thickness of 1501 m, with the base not reached by the drilling operation, indicating that the actual thickness could be even greater. Borehole B3 stands out as the only borehole within the study area that shows the presence of salt deposits, highlighting the borehole’s importance in understanding the region’s geological evolution. This finding offers crucial insights into the salt tectonics and depositional history of the KCSB offshore domain.
Boreholes B4 and B5 are located in the Campo High regional structure of the southwest KCSB (Figure 6). Both boreholes contain the Aptian–Albian deposits, with an indistinct boundary between these two stages. In borehole B4, the deposits span a substantial thickness of 2681 m, ranging from 620 m to 3301 m in depth (Figure 7d). In borehole B5, the deposits have a thickness of 847 m, extending from 903 m to 1750 m (Figure 7e). It is likely that these deposits extend further, as their bases were not fully recovered during drilling. The lithological facies observed in both boreholes B4 and B5 are like those found in boreholes B1 and B2, consisting of various sandstones, siltstones, and dark-grey to black shales. This suggests a mix of terrestrial and marine sediments, indicative of a deltaic environment. The sedimentological characteristics point toward a dynamic depositional environment during the period, influenced by both fluvial and marine processes. Regarding salt distribution, no evidence of salt deposits was found in boreholes B4 and B5. This absence suggests that the salt accumulation during the Aptian period did not affect the sediments in this sector of the study area.
The presence of the salt unit exclusively in borehole B3, located in the Kribi continental shelf domain, contrasts to the absence of salt evidence around the Campo shelf (boreholes B1 and B2) and on the Campo High regional structures (boreholes B4 and B5). This distribution suggests that salt accumulation during the Aptian period was confined to specific areas of the basin, highlighting the localized nature of salt deposition within the KCSB offshore domain and underscoring the complexity of the region’s geological history. The B3 drilling report of the ExxonMobil Company, highlighted diapir structure, indicating active salt movement and deformation. This characteristic is indicative of halokinesis, where salt structures such as diapirs form due to the plasticity and buoyancy of the salt under differential loading and tectonic stresses. The considerable thickness and the diapiric shape of the salt unit reflect the intricate of geological processes that have shaped the region, emphasizing the dynamic nature of salt tectonics in the Kribi continental shelf.

4.2. Seismic Interpretation

The calibration of seismic section SS1 with borehole B3 permitted marking of the Top Salt horizon on the seismic sections (Figure 8). The borehole was specifically chosen for this calibration because it provides a clear indication of the top boundary of the saliferous unit in the Kribi offshore domain. According to data from the borehole B3, the Top Salt surface is located at a depth of 2715 m on the eastside portion of seismic line SS1. The Top Salt surface is characterized by distinct seismic features, including erosional truncations at the top and onlap terminations along the flanks, particularly toward the east (Figure 8). These seismic features were instrumental in identifying the Top Salt in areas not directly sampled by boreholes. Additionally, the internal parameters, such as the chaotic configuration and wavy reflections, were key indicators for identifying the salt unit throughout the study area. This approach allowed for a comprehensive understanding of the salt distribution and its geological context within the KCSB offshore domain.

4.2.1. Seismic Horizons

According to data from the borehole B3, the Top Salt surface is located at a depth of 2,715 m on the eastside portion.
The seismic analysis of sections SS1 and SS2 highlights four key seismic horizons (G, H, I, and J) in the Late Jurassic to Early Cretaceous strata, which delimit this sedimentary cover. These horizons will be described sequentially from the basal layers up to the pre-Cenomanian summit on each seismic profile.
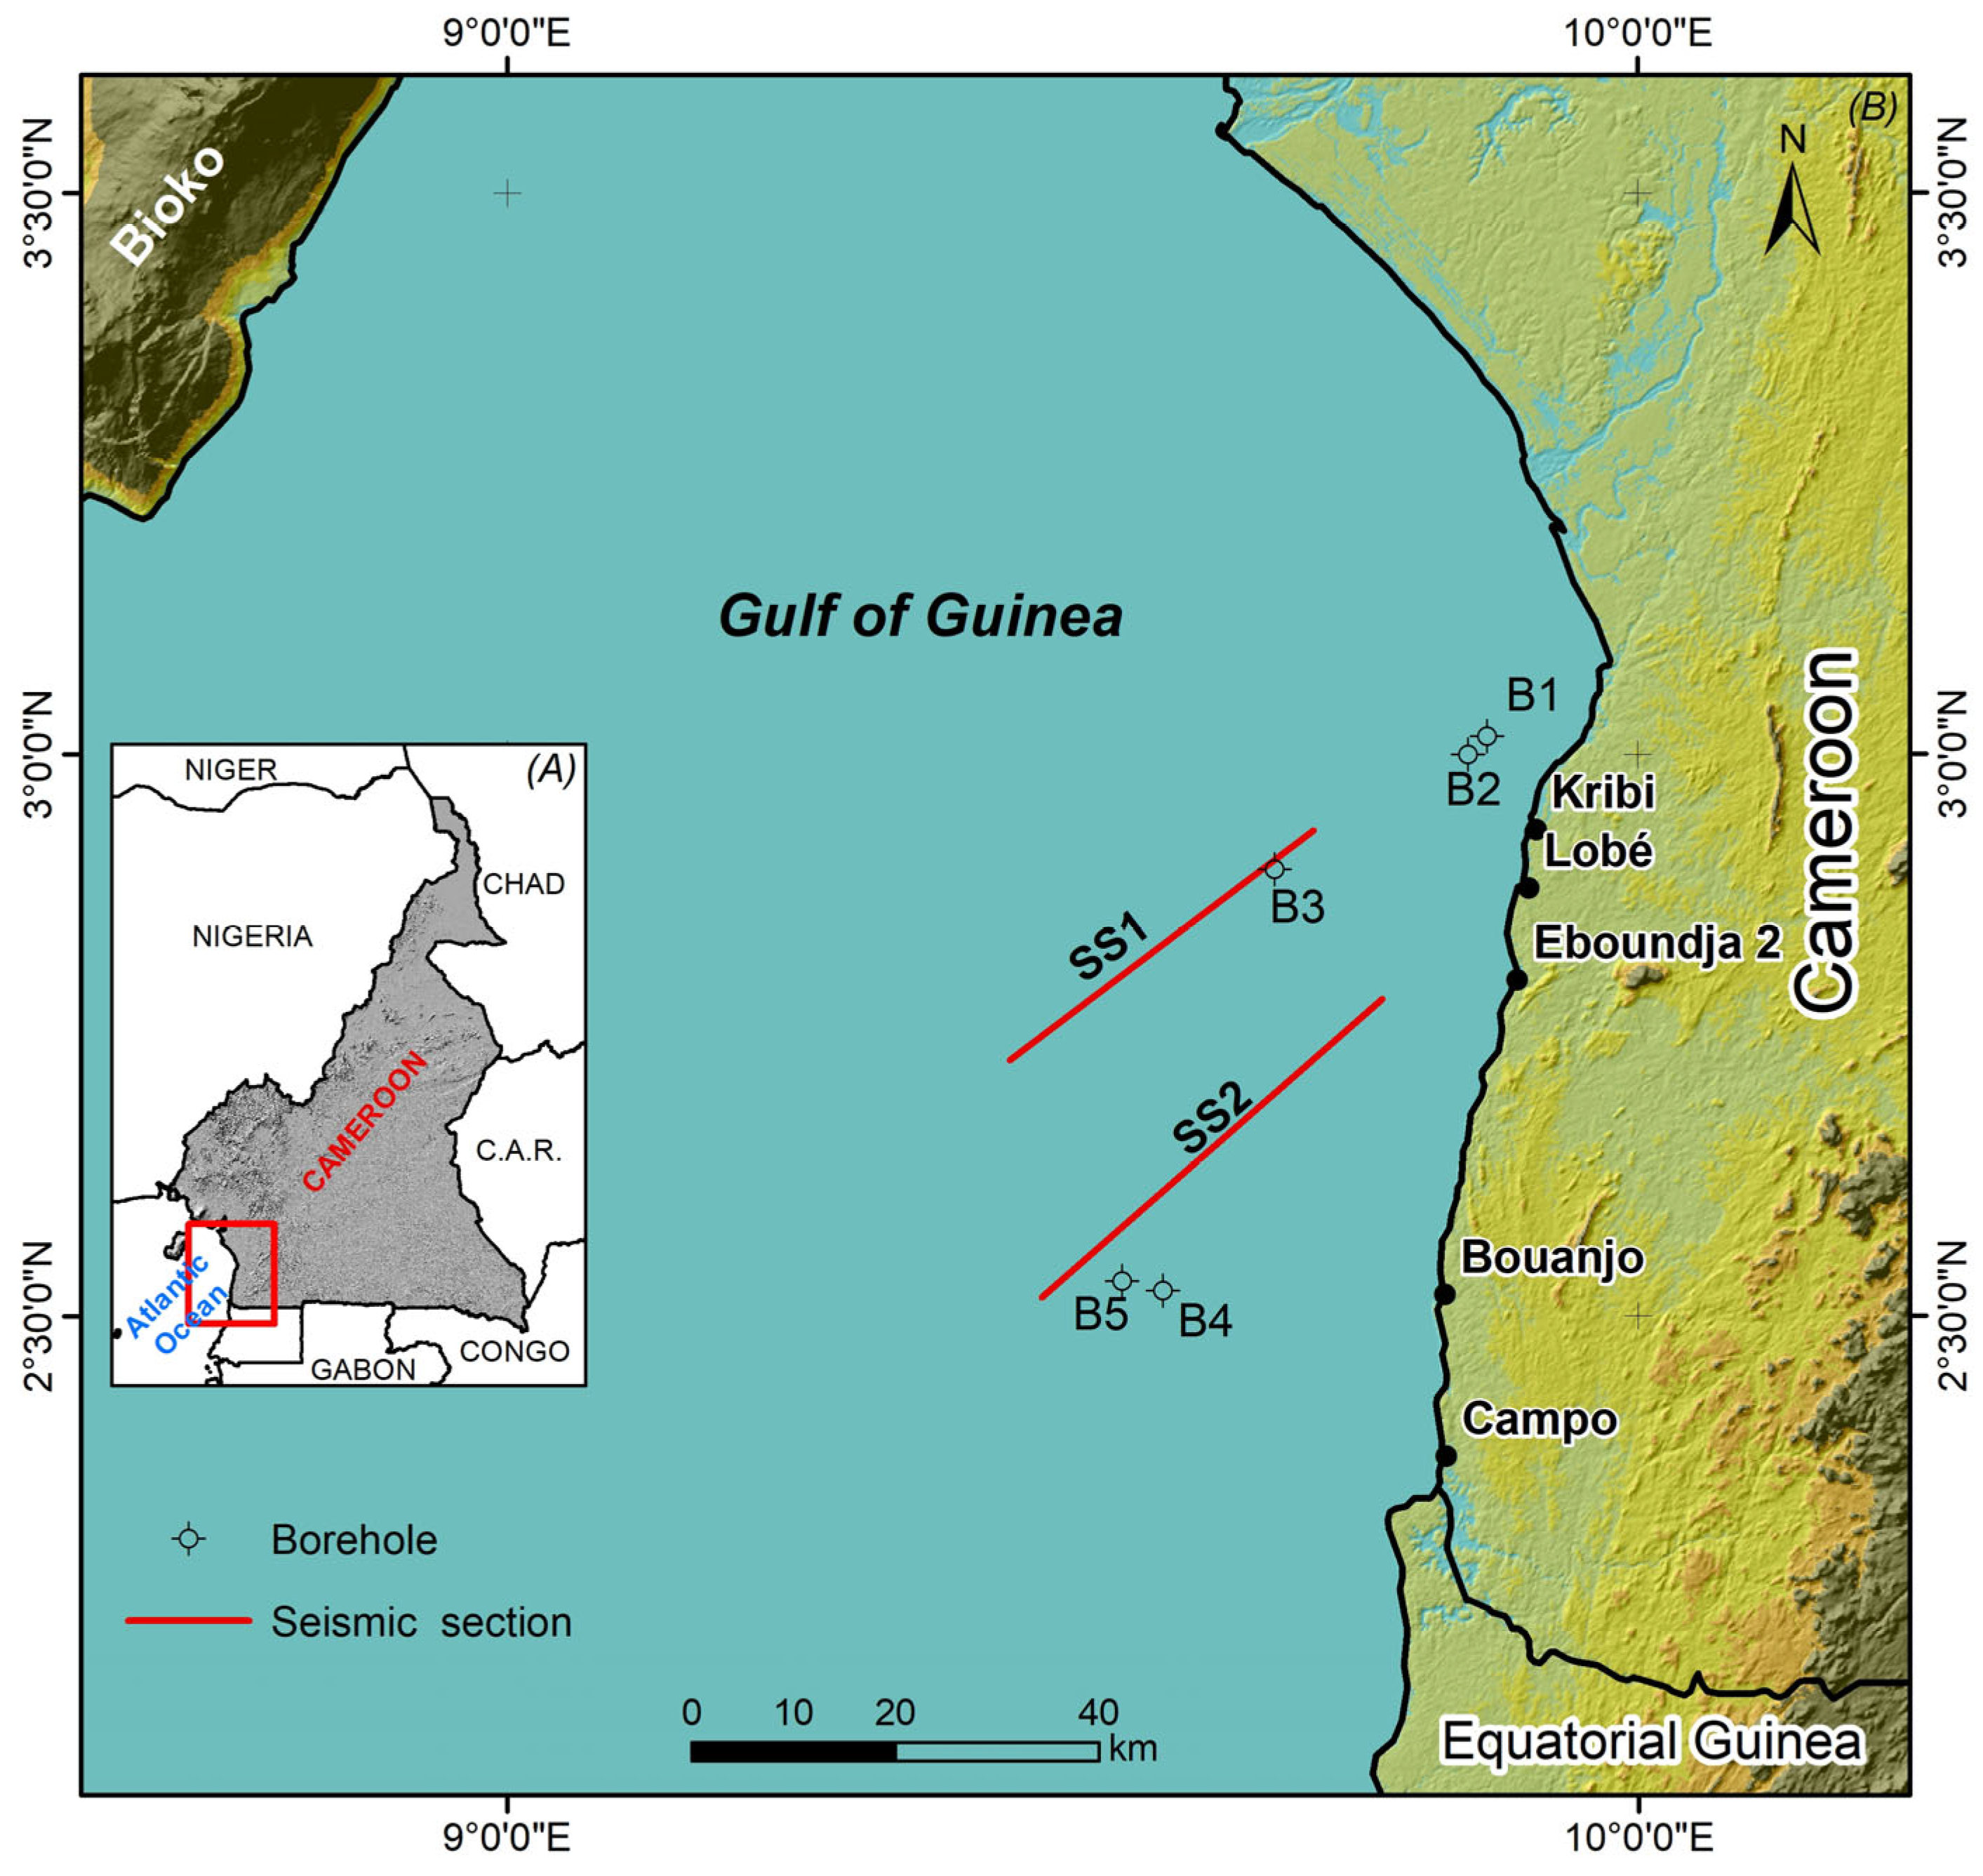
  • Seismic horizon G is defined by “onlap terminations” at its top as observed on the SS1 profile (Figure 8b). This reflector marks the contact between reflections with a particular character and chaotic reflections arranged in a disordered manner, indicating an unconformity based on fundamental principles listed in methodology section (Figure 8c). The regional geology review suggests that this reflector corresponds to the contact between the Late Jurassic to Barremian strata and the Precambrian basement within the study area (Figure 8). Near the Kribi Margin, its depth varies from 5800 to 7600 m, dipping westward (Figure 8b). This reflector shows three signatures laterally from west to east, which are flats, descending ramp, and ascending ramp (Figure 8b).
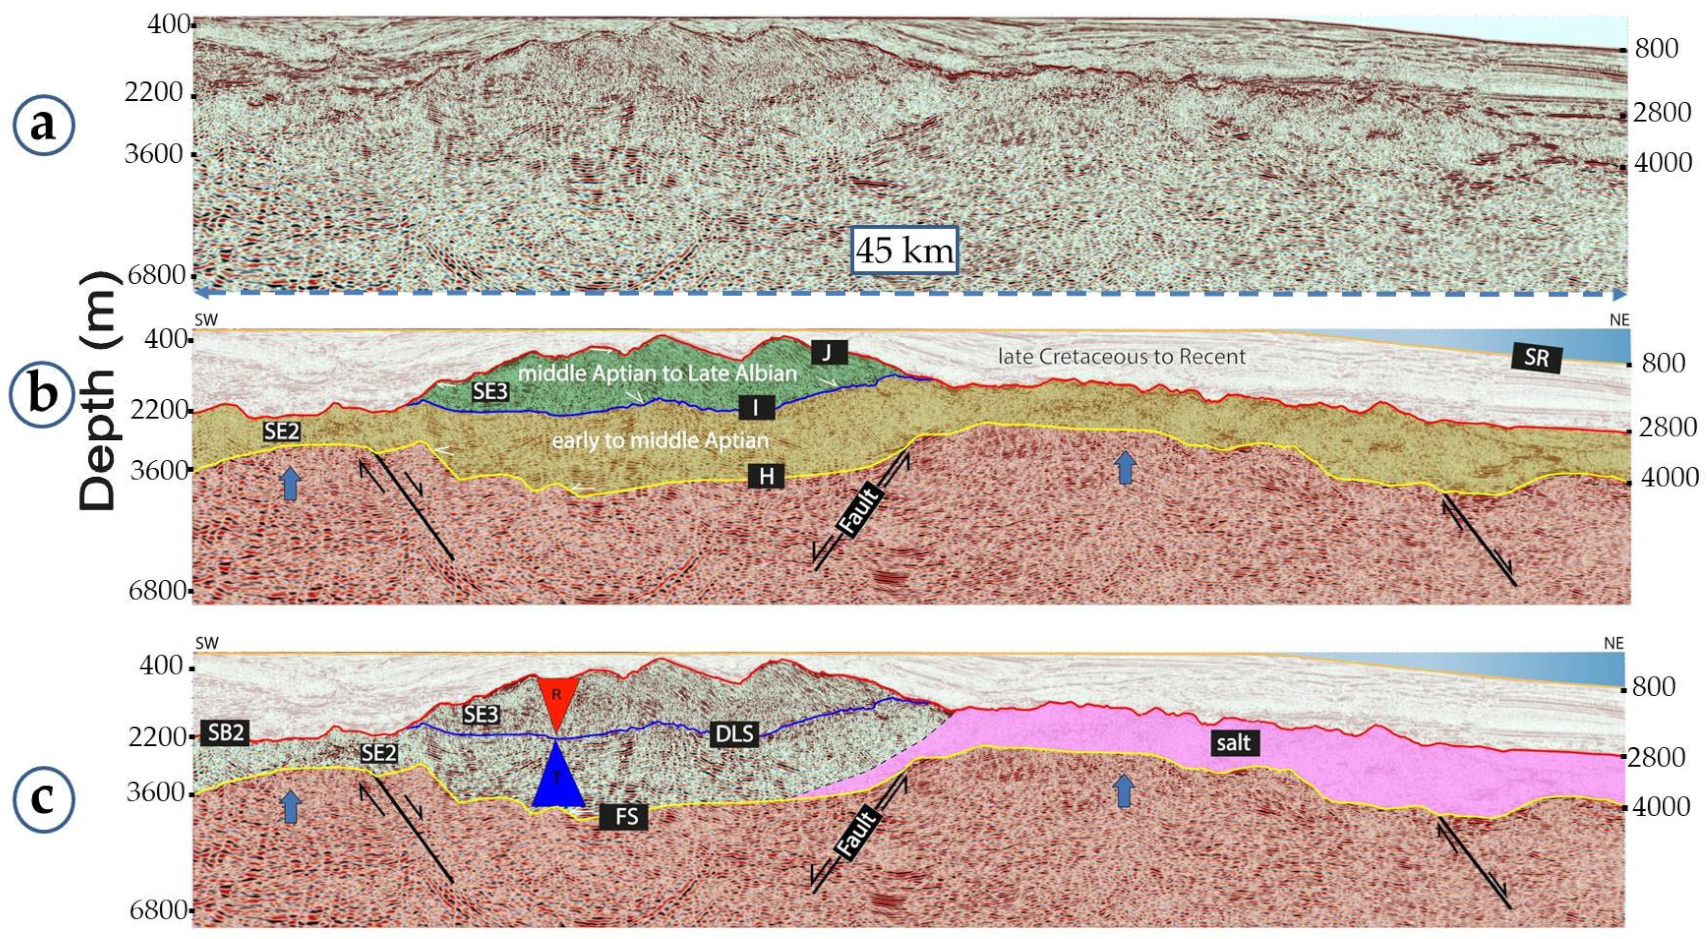
  • Seismic horizon H is defined by “onlap terminations” at its top and “toplap terminations” at its base across both seismic profiles (Figure 8b and Figure 9b). Based in established principles, this reflector corresponds to a flooding surface (FS), marking the transition between lowstand system tracts (continental deposits) and transgressive system tracts (marine deposits) in the study area (Figure 8c and Figure 9c). Based on a regional geology review, Horizon H corresponds to an early Aptian FS in the study area (Figure 8c and Figure 9c). It overlies the top Precambrian basement (reflector G) on the eastern side of SS1 and SS2 profiles, indicating the influence of a transgressive phase. Near the Kribi Margin (SS1 Profile), its depth varies from 5800 to 7200 m with a westward dip (Figure 8b). Near the Campo Margin (SS2 Profile), its depth ranges from 4000 to 3600 m, dipping eastward (Figure 9b). Like Horizon G, H-reflector shows consistent lateral signatures across both SS1 and SS2 profiles (Figure 8b and Figure 9b).
  • Seismic horizon I is defined by “downlap terminations” at its top on both SS1 and SS2 profiles (Figure 8b and Figure 9b). The stratal terminations associated to this surface indicate a “downlap surface (DLS)”, marking the transition between transgressive system tracts and highstand system tracts, within the study area (Figure 8c and Figure 9c). Based on the regional geology, this reflector corresponds to the middle Aptian DLS. Toward the eastern section of each analyzed seismic profile, this surface exhibits significant curvature (Figure 8b and Figure 9b). Near the Kribi Margin (SS1 Profile), its depth varies from 2000 to 5000 m from east to west (Figure 8b). Near the Campo Margin (SS2 Profile), its depth ranges from 2700 to 2200 m in the same direction (Figure 9b). Like the horizon G, on both the SS1 and SS2 profiles, this reflector shows three lateral signatures from west to east, as follows: flats, descending ramp, and ascending ramp (Figure 8b and Figure 9b).
  • Seismic horizon J, marked by “erosional truncation terminations” at its base, on both the SS1 and SS2 profiles (Figure 8b and Figure 9b), signifies an unconformity (Figure 8c and Figure 9c). This reflector, which corresponds to the pre-Cenomanian summit, represents the contact between the Lower and Upper Cretaceous deposits (Figure 8b and Figure 9b). Near the Kribi Margin (SS1 Profile), its depth varies from 2200 to 3400 m from east to west (Figure 8b). Near the Campo Margin (SS2 Profile), in contrast, its depth ranges from 1000 to 2200 m westward, with a notable decrease to 400 m at the center of the profile (Figure 9b). Both the SS1 and SS2 profiles display this reflector’s laterally variations, including descending and ascending ramps (Figure 8b and Figure 9b).

4.2.2. Seismic Sequences

The reflectors delineate three major seismic sequences (SE1, SE2, and SE3), which correlate with the sequences identified in NW-trending profiles studied in [10] in the same area. To better understand the salt deposition context using NE-trending sections, it is essential to describe these sequences from the base to the Top Albian unconformity, marking the summit of the Early Cretaceous. This detailed analysis provides valuable insights into the stratigraphic framework and depositional environments. Like the seismic boundaries described, their stratigraphic characteristics and natures of these sequences have also been highlighted in accordance with established principles of the seismic stratigraphy and regional geology.
  • Seismic Sequence SE1
This sedimentary package is defined at the base by the horizon G and at the top by the horizon H (Figure 8b and Figure 9b). Seismic sequence SE1 shows a progradational to aggradational fill pattern and is observed within the depocenter area, featuring discontinuous reflections that pinch out against the Precambrian basement toward the east (Figure 8b). SE1 is only visible on the SS1 profile within the depocenter zone in the west, reaching a thickness of more than 1 km (Figure 8b). The internal configuration of SE1 consists of parallel to subparallel reflections, characterized by high amplitude (Figure 8b). The reflection frequencies vary from low to moderate. SE1 represents the pre-salt sedimentation from the Late Jurassic to Barremian (Figure 8b) and consists of pre-rift deposits underlying the syn-rift sediments [10,12].
  • Seismic Sequence SE2
This sedimentary package, overlying the previous sequence, is bounded at the base by horizon H and at the top by horizon I. Seismic sequence SE2 is observed in deep marine settings and extends onto the Precambrian basement uplift in the eastern portion of each analyzed line (Figure 8b and Figure 9b). SE2 thickens toward Kribi, because its thickness varies from the north (SS1 profile: 2800 m) to the south (SS2 profile: between 1000 m and 2000 m). Within this sequence, two distinct facies are observed. The first facies features retrogradational fill pattern characterized by parallel reflections (Figure 8b and Figure 9b), with variable amplitude, continuity, and frequency. The second facies displays chaotic characteristics with wavy internal reflections of moderate amplitudes and variable frequency, represented in this study by a pink layer (Figure 8c and Figure 9c). This latter constitutes the primary target of this paper. According to previous works documented in the study area [9,10,12], the SE2 sequence dated to the Aptian (Figure 8c and Figure 9c) and contains the salt unit represented by the second facies described above. The salt unit is predominantly observed in the eastern portion of the profiles, directly overlying the basement unit (Figure 8c and Figure 9c). Its external configuration exhibits two predominant shapes—diapir and pillow. In the profile SS1, along its variable thickness, it can extend up to approximately 4 km toward the coastline. Similarly, in the profile SS2, seismic characteristics mirror those observed in the northeastern part of the parallel line SS1, with the salt unit appearing beneath the continental shelf domain and reaching up to 2 km toward the east. The considerable thickness of the salt suggests that the basin likely experienced high subsidence rates during its deposition in Aptian time. Both diapir and pillow shapes of salt units are observed, consistent with SS1 and SS2 seismic sections. The seismic analysis reveals that this salt was deposited in the transgressive phase, situated between the FS and DLS (Figure 8c and Figure 9c). It suggests that the deposition occurred within a marine environment. Additionally, the KCSB salt unit is associated to NW–SE-trending faults, in both SS1 and SS2 profiles (Figure 8b and Figure 9b), which are associated with the uplift of the eastern structure.
  • Seismic Sequence SE3
This sequence is bounded at the base by horizon I and at the top by horizon J (Figure 8b and Figure 9b). It is observed in both the deep marine domain and above the eastern structure in each section. Horizon J caps SE3 with erosional truncation above the eastern structure (Figure 9b) and exhibits concordant terminations in the deep marine domain (Figure 8b). SE3 shows aggrading–prograding patterns with an oblique configuration onto the eastern structure (Figure 9b). The thickness of SE3 varies from north (SS1 profile) to south (SS2 profile), exceeding 1500 m in the study area. This sequence represents the post-salt sedimentation in the study area. [9,10,12] dated this package to the middle Aptian to late Albian. This sedimentation is eroded at the top of the salt unit in the north (SS1 profile), indicating a gravitational gliding over the salt detachment surface (Figure 8c and Figure 9c). Also, the turtleback structures observed in the eastern portion of SS1, between SB2 and DLS, reveal the influence of underlying salt tectonics in the study area (Figure 8c). Similar structures are also observed in the eastern portion of SS2 profile, situated between the Late Cretaceous to recent deposits and underlying salt (Figure 9c).

5. Discussion

5.1. Salt Distribution

The analysis of seismic and borehole data in this work reveals the presence of salt units within the continental shelf of the KCSB. These salt units are detectable in both the Kribi offshore and Campo offshore regions, as evidenced by their occurrence in SS1 (near Kribi) and SS2 (near Campo) profiles. Particularly, regarding salt delineation in 2D seismic reflections, the results of this work indicate that the Mundeck salt unit is characterized by chaotic facies and wavy internal reflections. This finding is consistent with the recognition of salt in 2D seismic reflection data, as demonstrated in foundational seismic stratigraphy research and salt-related studies [25,26,27,28,29,30,31,55,56,57,58,59,60,61,62,63]. This consistency reinforces the reliability of the seismic data and the interpretations derived from it. Furthermore, some studies, conducted along the offshore Gabon Margin in the SWAM [26,27], have reported the presence of asymmetric turtleback structures in the post-salt sedimentation. These structures are of interest as they provide insight into the mechanisms of salt tectonics. According to these authors, such structures might form because of salt tectonics, arising between two diapirs that have undergone prolonged rising for a long time and subsequent sagging due to extension. Evidence presented in [26] has shown Albian salt tectonics, manifesting as onlapping stratal terminations on the salt. This finding shows that the salt was actively migrating upwards during this period. The upward movement of salt can influence the deposition of overlying sediments, creating complex stratigraphic relationships. These results closely align with the findings of this work. The turtleback structures, observed from the north (SS1 profile) to the south (SS2 profile), further underscore the presence and wide extent of salt deposits in the KCSB offshore domain (Figure 10). Overall, the findings of this study not only confirm the presence of salt units but also enhance our understanding of the complex interplay between salt tectonics and sedimentation processes within the KCSB.
This observation is contrary to the absence of salt in the Cameroon Margin as reported by previous studies [38,39,40,41] and to the confinement of salt deposits in the Kribi marine area [19,21,22]. This study indicates that salt deposits extend into the Campo shelf and demonstrate a wide distribution toward the Douala sub-basin (northern extension). This distribution agrees with the results of previous research efforts in [9,42]. Additionally, recent studies, conducted in the KCSB offshore domain [6,10], have highlighted salt unit within NW-trending profiles. Then, the presence of salt deposits in both NW- and NE-trending profiles within the same study area reveals the existence of an N–S-trending saliferous basin, which places parallel to the SCAM borders (Figure 11). Finally, this work uncovered the following two distinct morphologies of salt structures: diapir and pillow (Figure 10). These shapes are prevalent in the KCSB offshore domain, highlighting the complexity and variability of salt structures in the region. This diversity not only enriches our understanding of the geological framework but also has implications for hydrocarbon exploration and resource management in the area.

5.2. Depositional Context

The base of the salt unit exhibits distinct signs of faulting, as clearly illustrated in Figure 10. These faults play a crucial role in the distribution and formation of salt deposits, particularly in selected areas above the Kribi-Campo High. The analysis of the geological characteristics of the identified sequences reveals distinct environmental settings that SE1 indicates a continental environment, SE2 points toward a marine environment, and SE3 suggests a deltaic environment. These results imply that the Mundeck Salt was deposited within a marine setting, as evidenced by its position between the FS at the base and the DLS at the top. The FS represents the initial transgression of sea waters onto the continental shelf, while the DLS marks the maximum extent of marine inundation during deposition [56]. Furthermore, the presence of marine-related sedimentary features within this sequence corroborates the marine origin of the Mundeck salt deposits, emphasizing their formation within a marine depositional environment. This observation aligns with the findings in [26] (p. 32) in offshore Gabon Margin. These authors show the Ezanga salt unit, which is the homologous of the Mundeck Salt, within the transitional stage, corresponding to the transgression marine phase in this study.
The base of the salt unit exhibits distinct signs of faulting, as clearly illustrated in Figure 10. This finding also agrees with the results in [26] in the offshore Gabon Margin. Furthermore, in this study, these faults play a crucial role in the distribution and formation of salt deposits, particularly in selected areas above the Kribi-Campo High structure, located at the southern end of the KCSB offshore. The presence of salt in these areas highlights specific geological conditions conducive to its accumulation. The marine nature of the Mundeck Salt suggests that its genesis was implemented by processes involving gas delivery, likely stemming from the activity of the MOR [70] (Figure 12). The migration of gases and fluids is likely facilitated through the underlying faults, segmenting the Precambrian basement (Figure 10), which might contribute to the dynamics of salt tectonics (e.g., [71,72,73,74,75]).
The Mundeck salt deposits show the following two distinct characteristics: diapir and pillow structures. The presence of marine sediments, particularly shales found within the salt deposits of borehole B3, indicates that a marine incursion occurred prior to their deposition in the study area. The evidence is consistent with the findings in [10], which demonstrated that the onset of marine incursion took place during the Aptian period. In addition, [77] suggested that the final separation between the West African and Brazilian cratons occurred during the Albian, coinciding with the onset of oceanic crust formation off the coast of Cameroon during the Aptian stage. Furthermore, according to [3], the oldest post-rift rocks in the Douala-Kribi-Campo basins are dated to the middle Aptian, providing further context to the geological timeline. These geological insights collectively underscore the significant role of tectonic and marine processes in shaping the salt framework within the KCSB, highlighting the dynamic interplay of continental drift, marine transgression, and sediment deposition during the Aptian to Albian periods. This complex history not only informs our understanding of the salt deposits but also emphasizes the broader geological evolution of the region, illustrating how these processes have influenced both the formation of salt structures and the overall sedimentary architecture of the KCSB offshore domain.
In this study, the depositional context is arranged as the salt deposits were formed during the rift-drift period, following a significant marine incursion. In comparison with [24], the depositional context of the salt units is associated with a notable sea-level fall induced by margin uplift, likely occurring during the Aptian. This finding is further supported in [12], which also identified salt units in the study area during the late Aptian. Furthermore, the structural style associated to the Mundeck Salt indicates additional geological events alongside the sea-level fall. The faults observed at the base of salt could be linked to transfer faults, related to the MOR. The movement along these Atlantic faults likely facilitated pathways for the upward transportation of high-temperature gases and fluids from deep offshore regions, which could play a role in the dynamics of salt tectonics. Ultimately, the marine nature of the salt deposits is intrinsically associated to the sea-level fluctuations as well as thermodynamic processes originating from the MOR in the south Atlantic. These processes are indicative of a complex interplay between tectonic activity and sedimentation, which not only contributed to the formation of the salt deposits but also shaped their distribution and structures.

5.3. Hydrocarbon Implications

The KSCB offshore has been the subject of extensive researches in the oil and gas sector. This study highlights the shapes of salt units identified in the study area, which have significant implications for hydrocarbon exploration. Specifically, the diapir structures in the region can serve as effective traps for oil and gas, which is a critical aspect of petroleum system [6]. Some seismic characteristics identified within the salt units are likely reflecting DHIs. These observations correspond to those in [6], which identified similar hydrocarbon indicators in the offshore Kribi-Campo sub-basin. The DHIs tracking within the salt units are obvious in the SS1 profile and a large portion of the SS2 profile toward the east. Seismic bright spots, indicative of lateral changes in lithology, are notably prevalent within the salt deposits and are characterized by strong-amplitude reflections (Figure 8b and Figure 9b). These could be due to a gas-saturated sandstone reservoir trapped into the Mundeck Salt. The findings of this work are similar to the results in [69] in offshore Cyprus and Lebanon, showing such seismic signatures. Seismic Dim Spots have been also identified in the basal part of the salt dome on the SS1 profile (Figure 8b). Unlike bright spots, these DHIs show weak amplitudes, which could be correlated to the presence of hydrocarbons that diminish the contrast in acoustic impedance between the reservoir and the overlying rock. This hypothesis is supported by various studies related to DHIs (e.g., [64,65,66,67,68,69,70]). These findings highlight that the context of the salt structures identified by this study demonstrates a promising area for hydrocarbon exploration.
The diapir structure identified on the SS1 profile could also reveal promising targets in the upper stratigraphy (Late Cretaceous to recent). The structural style associated to the top salt diapir in the SS1 profile is like some salt structures documented by the studies in [36], as shown in Figure 10. These structures include traps formed by rollover anticline, diapirism on both flanks, fault sealing, and unconformity. According to [36], these traps are particularly representative of the post-salt sedimentation through the SWAM, suggesting that similar mechanisms could be at play in the study area. This correlation highlights the potential for effective hydrocarbon traps in the KCSB offshore, enhancing its prospectivity for oil and gas exploration.

6. Conclusions

This study, which analyzed seismic and borehole data acquired from offshore Cameroon, confirmed the presence of the Aptian Mundeck Salt in the KCSB offshore domain. The findings provide new insights into the depositional context, distribution, and hydrocarbon potential associated with the Mundeck salt deposits in the Cameroon Span. The salt unit might be distributed along with a N–S-trending saliferous basin, parallel to the SCAM axis. Two distinct morphologies of the salt structures are characterized as diaper and pillow. The presence of Aptian marine sedimentation within the salt unit implies a marine incursion prior to its deposition, indicating that the salt deposits formed within a marine environment. This finding suggests that the deposition of the salt unit is associated with a sea-level drop, likely related to margin uplift. In addition, because of the highly deformed basement directly underlying the identified salt units, the sea-level drop is also linked to a thermodynamic event, potentially originating from the MOR activities. The process appears similar along the southwestern Atlantic margin. Moreover, the Mundeck salt unit is shown to have significant potential for forming both stratigraphic and structural hydrocarbon traps, enhancing the region’s prospects for hydrocarbon exploration. The identification of these salt-related features suggests that the Mundeck salt deposits play a critical role in the basin evolution of KCSB, as well as the petroleum system of the area, offering promising targets for future exploration efforts.
We propose the following key research insights:
  • The Mudeck salt unit (Aptian) exists in the KCSB offshore domain and is homologous with the Rio Muni salt in Equatorial Guinea and Ezanga Salt in Gabon;
  • The Mudeck salt unit is characterized by two shapes—diapir and pillow;
  • The KCSB salt unit is distributed along N–S-trending structures;
  • The Cameroon salt unit results from a sea-level drop associated with thermodynamic events, likely originating from MOR activities.
  • Similar to its homologues, the KCSB’s salt demonstrates significant potential to serve as an effective seal and to form both stratigraphic and structural hydrocarbon traps.

Author Contributions

Conceptualization, M.-F.M.E. and E.Y.L.; methodology, M.-F.M.E. and. M.Y.; software, M.-F.M.E. and J.M.A.E.; validation, E.Y.L., M.Y. and J.Q.Y.A.; formal analysis, M.-F.M.E.; resources, M.Y.; writing—original draft preparation, M.-F.M.E.; writing—review and editing, M.-F.M.E. and E.Y.L.; supervision, E.Y.L., M.Y. and J.Q.Y.A.; project administration, M.Y. and J.Q.Y.A. All authors have read and agreed to the published version of the manuscript.

Funding

This research did not receive any specific grant from funding agencies in the public, commercial, or not-for-profit sectors.

Institutional Review Board Statement

Not applicable.

Informed Consent Statement

Not applicable.

Data Availability Statement

Not applicable.

Acknowledgments

The authors are thankful to the National Hydrocarbon Corporation of Cameroon (NHC) for providing data, as well as the Department of Geoscience and Environment of the Faculty of Science of the University of Ebolowa. The authors are also grateful to the potential anonymous reviewers who agreed to deeply revise this work.

Conflicts of Interest

The authors declare no conflicts of interest.

References

  1. Knight, R.; Westwood, J. Long-term prospects very bright for deep waters off West Africa. Oil Gas J. 1999, 97, 33–38. [Google Scholar]
  2. Cameron, N.R.; White, K. Exploration Opportunities in Offshore Deepwater Africa. In Proceedings of the IBC ‘Oil and Gas Developments in West Africa’, London, UK, 25–26 October 1999; p. 28. [Google Scholar]
  3. Brownfield, M.E.; Charpentier, R. Geology and Total Petroleum Systems of the West-Central Coastal Province (7203), West Africa; 2207-B; USGS: Reston, VA, USA, 2006; p. 52.
  4. Beglinger, S.E.; Doust, H.; Cloetingh, S. Relating petroleum system and play development to basin evolution: West African South Atlantic basins. Mar. Pet. Geol. 2012, 30, 1–25. [Google Scholar] [CrossRef]
  5. Coward, M.P.; Purdy, E.G.; Ries, A.C.; Smith, D.G. The Distribution of petroleum reserves in basins of the South Atlantic margins. In The Oil and Gas Habitats of the South Atlantic; Cameron, N.R., Bate, R.H., Clure, V.S., Eds.; Special Pub; GSL: London, UK, 1999; Volume 153, pp. 101–131. [Google Scholar]
  6. Mbida, Y. Caractérisation par Imagerie Géophysique de la Couverture Sédimentaire des Bassins Offshores Profonds du Nord de la Cyrénaïque et de Douala/Kribi-Campo: Éléments de Géologie Pétrolière. Ph.D. Thesis, University of Yaounde I, Ngoa ekellé, Cameroon, 2012. [Google Scholar]
  7. Brownfield, M.E. Assessment of Undiscovered Oil and Gas Resources of the West-Central Coastal Province, West Africa; USGS: Reston, VA, USA, 2016; p. 41.
  8. Lawrence, S.R.; Beach, A.; Jackson, O.; Jackson, A. Deformation of oceanic crust in the eastern Gulf of Guinea: Role in the evolution of the Cameroon Volcanic Line and influence on the petroleum endowment of the Douala-Rio Muni Basin. In Petroleum Geoscience of the West Africa Margin; Sabato Ceraldi, T., Hodgkinson, R.A., Backe, G., Eds.; GSL: London, UK, 2016; p. 438. [Google Scholar] [CrossRef]
  9. Loule, J.P.; Jifon, F.; Angoua-Biouele, S.E.; Nguema, P.; Spofforth, D.; Carruthers, D.; Watkins, C.; Johnston, J. An opportunity to re-evaluate the petroleum potential of the Douala/Kribi-Campo Basin, Cameroon. Spec. Top. Pet. Geol. 2018, 36, 61–70. [Google Scholar] [CrossRef]
  10. Mienlam Essi, M.-F.; Yene Atangana, J.Q.; Abate Essi, J.M.; Mbida, Y.; Angoua Biouele, S.E.; Nguema, P.; Tsimi Ntsengue, C. Stratigraphical nature of the Top Albian surface, from seismic and wells data analyses, in the south Sanaga area (Cameroon Atlantic margin): Palaeogeographical significance and petroleum implications. Mar. Pet. Geol. 2021, 129, 105073. [Google Scholar] [CrossRef]
  11. Iboum Kissaakaa, J.B.; Ngum Tchioben Fonyuy, C.; Fowe Kwetche, P.G.; Ngo Elogan Ntem, J.; Binyet Njebakala, J.; Makosso Tchapi, R.Y.; Mvondo Owono, F.; Ntamak-Nida, M.-J. Tectono-stratigraphic architecture, depositional systems and salt tectonics to strike-slip faulting in Kribi-Campo-Cameroon Atlantic Margin with an unsupervised machine learning approach (West African Margin). Mar. Pet. Geol. 2023, 59, 106667. [Google Scholar] [CrossRef]
  12. Robertson, C.G.G. Petroleum Geological Evaluation: Niger Delta to the Congo Fan, Report No. AM086. Unpublished Report. 2015.
  13. Nemcôk, M.; Ryba, S.R.; Sinha, S.T.; Hermeston, S.A.; Ledvenyiova, L. Transform margins: Development, controls and petroleum systems—An introduction. Geol. Soc. Lond. Spec. Publ. 2016, 431, 1–38. [Google Scholar] [CrossRef]
  14. Essi, M.-F.M.; Atangana, J.Q.Y.; Mbida, Y.; Biouele, S.E.A.; Lee, E.Y. Salt Units of the Kribi-Campo Sub-Basin Revisited, Using Offshore 2D Seismic and Boreholes Data: Depositional Context and Petroleum Implications. Proceedings 2023, 87, 2. [Google Scholar] [CrossRef]
  15. Le, A.; Huuse, M.; Redfern, J.; Irving, D. Seismic Characterization of a Bottom Simulating Reflector (BSR) and Plumbing System of the Cameroon Margin, West Africa. Mar. Pet. Geol. 2015, 68, 629–647. [Google Scholar] [CrossRef]
  16. Pauken, R. Sanaga Sud Field, offshore Cameroon, West Africa. In Giant Oil and Gas Field of the Decade 1978–1988; Halbouty, M., Ed.; AAPG: Tulsa, OK, USA, 1992; Volume Memoir 54, pp. 217–230. [Google Scholar] [CrossRef]
  17. Ntem, J.N.E.; Ntamak-Nida, M.J.; Bisso, D.; Owono, F.M.; Ngos, S., III.; Bilong, P.; Nouck, P.N. Depocenters Repartition and Sequence Stratigraphy of the Northern Part of the Kribi-Campo Sub-Basin (Cameroon). Eur. J. Sci. Res 2018, 149, 258–278. [Google Scholar]
  18. Secke Bekonga Gouott, B.; Mbida, Y.; Yene Atangana, J.Q.; Nkoa Nkoa, E.P.; Angoua Biouele, S.E.; Niyazi, Y.; Eruteya, O. Seismic geomorphology of a Late Cretaceous submarine channel system on the continental slope of Kribi/Campo sub-basin, offshore Cameroon. Mar. Pet. Geol. 2022; in press. [Google Scholar] [CrossRef]
  19. SPT/Simon Petroleum and Technology. Petroleum Geology and Hydrocarbon Potential of Douala Basin, Cameroon; Unpublished Non-Exclusive Report; SPT/Simon Petroleum and Technology: Yaounde, Cameroon, 1995; p. 50. [Google Scholar]
  20. Bray, R.; Lawrence, S.; Angoua Biouele, S.E. New Perspectives—New Plays in the Douala Basin of Cameroon, Republic of Cameroon; Unpublished Internal Report; NHC: Yaounde, Cameroon, 2003; p. 30.
  21. ECL/Exploration Consultants Limited. Douala/Kribi-Campo Basin-Structure, Source Rock and Hydrocarbons Study.Doc; Unpublished Internal Report NHC; ECL/Exploration Consultants Limited: Yaounde, Cameroon, 2003; p. 200. [Google Scholar]
  22. Fusion Oil & Gas NL. Wells Summary Sheets of Douala-Kribi-Campo Basin; Unpublished Internal Report NHC; Fusion Oil & Gas NL: Yaounde, Cameroon, 2003; p. 39. [Google Scholar]
  23. Nguimbous-Kouoh, J.J.; Tchutchoua, J.; Ngos, S., III.; Ndougsa Mbarga, T.; Manguelle-Dicoum, E. Hydrocarbon Potential of Two Coastal Basins (Cameroon). Int. J. Geosci. 2018, 92, 131–147. [Google Scholar] [CrossRef]
  24. Ntamak-Nida, M.J.; Bourquin, S.; Makong, J.C.; Baudin, F.; Mpesse, J.E.; Itjokonguem, C.; Schnyder, J.; Komguem, P.B.; Abolo, G.M. Sedimentology and sequence stratigraphy from outcrops of the Kribi-Campo sub-basin: Lower Mundeck Formation (Lower Cretaceous, southern Cameroon). J. Afr. Earth Sci. 2010, 18, 1–18. [Google Scholar] [CrossRef]
  25. Gill, J.; Cameron, D. 3D reviews an old play: An Aptian subsalt discovery, Etame field, offshore Gabon, West Africa. Lead. Edge 2002, 21, 1147–1151. [Google Scholar] [CrossRef]
  26. Dupre, S.; Bertotti, G.; Cloeting, S. Tectonic history along the South Gabon Basin: Anomalous early post-rift subsidence. Mar. Pet. Geol. 2007, 24, 151–172. [Google Scholar] [CrossRef]
  27. Makhubele, M.M.H. The Role of Salt Tectonics in the Hydrocarbon Potential of the Post-Salt Deposits (Albian to Recent), Offshore Gabon. Master’s Thesis, University of the Western Cape, Cape Town, South Africa, 1 April 2014. [Google Scholar]
  28. Versfelt, J.W. South Atlantic Margin Rift Basin Asymmetry and Implications for Pre-Salt Exploration; Search and Discovery Article #30112. In Proceedings of the AAPG International Conference and Exhibition, Rio de Janeiro, Brazil, 15–18 November 2010; p. 34. [Google Scholar]
  29. Jameson, M.; Wells, S.; Greenhalgh, J.; Borsato, R. Prospectivity and seismic expressions of pre- and post-salt plays along the conjugate margins of Brazil, Angola and Gabon. In Proceedings of the 12th International Congress of the Brazilian Geophysical Society, Rio de Janeiro, Brazil, 15–18 August 2011; p. 6. [Google Scholar]
  30. Moore, V.M.; Blanchard, R.H. Raft-Related Structures of the Albian Madiela Formation, Offshore South Gabon; Search and Discovery Article #51373. In Proceedings of the AAPG 2017 Annual Convention and Exhibition, Houston, TX, USA, 2–5 April 2017; p. 5. Available online: https://www.searchanddiscovery.com/documents/2017/51373moore/ndx_moore.pdf?_gl=1*16e1fh5*_ga*NjI3NTUwNTkyLjE3Mjg2NDk3MzQ.*_ga_EPE1MLW8XJ*MTcyODY0OTczNC4xLjEuMTcyODY0OTc0Ni4wLjAuMA.. (accessed on 25 August 2024).
  31. Robertson, C.G.G. Exploring the Last Frontier: A New Seismic Survey and Integrated Study Reveals Potential in the Ultra-Deep Offshore Petroleum Systems (Offshore South Gabon); Robertson Multiclient; Report; AAPG: Tulsa, OK, USA, 2019; p. 2. [Google Scholar]
  32. Correia Filho, O.J.; Buarque, B.V.; Anaonio Barbosa, J.; Silva Ramos, G.M.; Cruz Oliveira, J.T.; Magalhães, J.R.; Alves Da Silva, H.; Alencar, M.L.; Lima De Araujo, A.; Alicione, C. The Salt Layer as Important Key to the Pernambuco Plateau Petroleum System, Northeast Brazil; Search and Discovery Article #30613. In Proceedings of the AAPG Annual Convention and Exhibition, San Antonio, TX, USA, 19–22 May 2019; p. 4. [Google Scholar] [CrossRef]
  33. Cornelius, S. Comparison of the Characteristics of Cretaceous Salt Deposition in Brazil with the Jurassic Salt Deposition in the Gulf of Mexico; Search and Discovery Article #11374. In Proceedings of the 2023 GeoGulf, Houston, TX, USA, 23–25 April 2023; p. 17. [Google Scholar] [CrossRef]
  34. Cedeño, A.; Rojo, L.A.; Cardozo, N.; Centeno, L.; Escalona, A. The Impact of Salt Tectonics on the Thermal Evolution and the Petroleum System of Confined Rift Basins: Insights from Basin Modeling of the Nordkapp Basin, Norwegian Barents Sea. Geosciences 2019, 9, 316. [Google Scholar] [CrossRef]
  35. Grunnaleite, I.; Mosbron, A. On the Significance of Salt Modelling—Example from Modelling of Salt Tectonics, Temperature and Maturity Around Salt Structures in Southern North Sea. Geosciences 2019, 9, 363. [Google Scholar] [CrossRef]
  36. Zuodong, L.; Jianghai, L. Control of salt structures on hydrocarbons in the passive continental margin of West Africa. Pet. Explor. Develop. 2011, 38, 196–202. [Google Scholar]
  37. Pautot, G.; Renard, V.; Daniel, J.; Dupont, J. Morphology, limits, origin and age of salt layer along south Atlantic African margin. Am. Assoc. Pet. Bull. 1973, 57, 1658–1671. [Google Scholar]
  38. Aloïsi, J.C.; Benkhélil, J.; Giresse, P.; Ngueutchoua, G. Etude sismique haute résolution du précontinent sud-camerounais: Analyses faciologique et structurale. Comptes Rendus Acad. Sci. 1995, T.321, 145–152. [Google Scholar]
  39. Benkhélil, J.; Giresse, P.; Poumot, C.; Ngueutchoua, G. Lithostratigraphic, geophysical and morpho-tectonic studies of the south Cameroon shelf. Mar. Pet. Geol. 2002, 19, 499–517. [Google Scholar] [CrossRef]
  40. Moulin, M.; Aslanian, D.; Unternehr, P. A new starting point for the south Atlantic and Equatorial Atlantic Ocean. Earth Sci. Rev. 2010, 98, 1–37. [Google Scholar] [CrossRef]
  41. Nguene, F.R.; Tamfu, S.F.; Loule, J.P.; Ngassa, C. Paleoenvironments of the Douala and Kribi/Campo sub basins, in Cameroon, West Africa. In Géologie Africaine. 1er Colloque de Stratigraphie et de Paléogéographie des Bassins Sédimentaires Ouest-Africains. 2ème Colloque Africain de Micropaléontologie, Libreville, Gabon, 6–8 May 1991; Curnelle, R., Ed.; Bulletin du Centres de Recherche, Exploration–Production; Elf Aquitaine: Courbevoie, France, 1992; Volume 13, pp. 129–139. [Google Scholar]
  42. Davison, I. Geology and tectonics of the South Atlantic Brazilian salt basin. Geol. Soc. Lond. Spec. Publ. 2007, 272, 345–359. [Google Scholar] [CrossRef]
  43. Helm, C. Quantification des Flux Sédimentaires Anciens à L’échelle d’un Continent: Le cas de l’Afrique au Méso-Cénozoïque. Ph.D. Thesis, University of Rennes 1, Rennes, France, 21 December 2009. [Google Scholar]
  44. Abolo, G.M. Evaluation du Potentiel en Hydrocarbures dans les Séries Crétacées de la Région de Kribi-Campo; Unpublished Internal Report; NHC: Yaounde, Cameroon, 1996; p. 22.
  45. Lawrence, S.R.; Munday, S.; Bray, R. Regional geology and geophysics of the eastern Gulf of Guinea (Niger Delta to Rio Muni). Lead. Edge 2002, 21, 1112–1117. [Google Scholar] [CrossRef]
  46. Belmonte, Y.C. Stratigraphie du bassin sédimentaire du Cameroun. In Proceeding of the 2nd West African Micropaleontologist Colloquium, Ibadan, Nigeria, 3–7 January 1966; pp. 7–24. [Google Scholar]
  47. Batupe, M. Les aspects de l’évolution stratigraphique du bassin de Douala, Cameroun. Abstract. In Géologie Africaine; Elf Aquitaine: Courbevoie, France, 1996. [Google Scholar]
  48. Nürnberg, D.; Müller, R.D. The tectonic evolution of the South Atlantic from Late Jurassic to present. Tectonophysics 1991, 191, 27–53. [Google Scholar] [CrossRef]
  49. Pletsch, T.; Erbacher, J.; Holbourn, A.E.L.; Kuhnt, W.; Moullade, M.; Oboh-Ikuenobede Söding, E.; Wagner, T. Cretaceous separation of Africa and South America: West African margin (ODP Leg 159). J. S. Am. Earth Sci. 2001, 14, 147–174. [Google Scholar] [CrossRef]
  50. Haq, B.U. Cretaceous Eustasy revisited. Glob. Planet. Change 2014, 113, 44–58. [Google Scholar] [CrossRef]
  51. Haq, B.U. Jurassic Sea-Level Variations: A Reappraisal. Geol. Soc. Am. 2014, 28, 15. [Google Scholar] [CrossRef]
  52. Mitchum, R.M.; Vail, P.R.; Sangree, J.B. Seismic stratigraphy and global changes of sea-level, Part 6: Stratigraphic interpretation of seismic reflection patterns in depositional sequences. In Seismic Stratigraphy—Applications to Hydrocarbon Exploration; Payton, C.E., Ed.; AAPG: Tulsa, OK, USA, 1977; Volume Memoir 26, pp. 117–133. [Google Scholar]
  53. Tchouatcha, S.M.; Kouske, A.P.; Galal, F.W.; Mahmoud, M.S.; Sobdjou Kemteu, C.; Ngatchu, L.D.; Takou, J.P.; Preat, A.; Noubissie, C.G.; Miyemeck Ngonlep, V.T.; et al. The Cretaceous of the Cameroon Atlantic Basin (Central Africa): Sediment provenance, correlation, paleoenvironment and paleogeographic evolution of the Eastern Proto-Atlantic margin (Central Gondwana). Environ. Earth Sci. 2023, 82, 52. [Google Scholar] [CrossRef]
  54. Regnoult, J.M. Synthèse Géologique du Cameroun; Publ. Dir. Mines et Géo: Yaounde, Cameroun, 1986; p. 119. [Google Scholar]
  55. Njike Ngaha, P.R. Contribution à L’étude Géologique, Stratigraphique et Structurale de la Bordure du Bassin Atlantique du Cameroun, 3rd Cycle. Ph.D. Thesis, University of Yaounde I, Soa, Cameroon, 1984. [Google Scholar]
  56. Mitchum, R.M., Jr.; Vail, P.R. Seismic Stratigraphic Interpretation Procedure; AAPG: Tulsa, OK, USA, 1977; Volume Memoir 26, pp. 135–143. [Google Scholar]
  57. Mitchum, R.M., Jr.; Vail, P.R.; Thompson, S. Seismic stratigraphy and global changes of sea-level, part 2: The depositional sequence as a basic unit for stratigraphic analysis. In Seismic Stratigraphy—Applications to Hydrocarbon Exploration; Payton, C.E., Ed.; American Association of Petroleum Geologists: Tulsa, OK, USA, 1977; Volume Memoir 26, pp. 53–62. [Google Scholar]
  58. Neal, J.; Abreu, V. Sequences stratigraphy hierarchy and the accommodation succession method. Geology 2009, 37, 779–782. [Google Scholar] [CrossRef]
  59. Bernitsas, N.; Sun, J.; Sicking, C. Prism waves—An explanation for curved seismic horizons below the edge of salt bodies: 59th Mtg. Eur. Asso. Geosci. Eng. 1997, 5. [Google Scholar]
  60. Lafond, C.; Jones, I.F.; Bridson, M.; Houllevigue, H.; Kerdraon, Y.; Peliganga, J. Imaging deep water salt bodies in West Africa. Lead. Edge 2003, 22, 893–896. [Google Scholar] [CrossRef]
  61. Jones, I.F.; Davison, I. Seismic imaging in and around salt bodies. Special section: Salt basin model building, imaging, and interpretation. Interpret. Soc. Explor. Geophys. Am. Assoc. Pet. Geol. 2014, 2, SL1–SL20. [Google Scholar] [CrossRef]
  62. Jackson, M.P.A.; Hudec, M.R. Salt Tectonics Principles and Practices; Cambridge University Press: New York, NY, USA, 2017; p. 17. [Google Scholar]
  63. Hudec, M.R.; Jackson, M.P.A. Terra infirma: Understanding salt tectonics. Earth Sci. Rev. 2007, 82, 1–24. [Google Scholar] [CrossRef]
  64. Khairul, U.; Randy, C.; Woro, S.; Herlan, S. Direct Hydrocarbon Indicator for Thin Layer Reservoir after Resolution Enhancement. In Proceedings of the HAGI-IAGI Joint Convention Medan, Online, 28–31 October 2013. [Google Scholar]
  65. Mohammad, A.; Najeh, A.; Mustafa, M.A. The Seismic Image of the Direct Hydrocarbon Indicators in Offshore Syria. Iraqi. J. Sci. 2020, 61, 112–126. [Google Scholar] [CrossRef]
  66. Guo, Z.-Q.; Zhang, T.; Liu, C. Direct hydrocarbon identification in shale oil reservoirs using fluid dispersion attribute based on an extended frequency-dependent seismic inversion scheme. Pet. Sci. 2022, 20, 1532–1545. [Google Scholar] [CrossRef]
  67. Muhammad, I.H. Seismic Characterization of Fluid Leakage in Marine Sediments. Ph.D. Thesis, University of Cardiff, Cardiff, UK, 2015. [Google Scholar]
  68. Semb, H. Possible seismic hydrocarbon indicators in offshore Cyprus and Lebanon. Geo. Arab 2009, 14, 49–66. [Google Scholar] [CrossRef]
  69. Brown, A.R. Dim spots: Opportunity for future hydrocarbon discoveries? Lead. Edge 2012, 31, 682–683. [Google Scholar] [CrossRef]
  70. Liu, S.; Yang, X.; Qiu, N.; Yang, S.; Li, X. Geothermal effects of salt structures on marine sedimentary basins and implications for hydrocarbon thermal evolution. China. Sci. Bull. 2017, 62, 1631–1644. [Google Scholar] [CrossRef]
  71. Eppelbaum, L.V.; Kutasov, I.M.; Pilchin, A.N. Applied Geothermics; Springer: Berlin/Heidelberg, Germany, 2014; p. 751. [Google Scholar] [CrossRef]
  72. Hovland, M.; Rueslåtten, H.; Johnsen, H.K. Hydrothermal salt–but how much? Reply to Christopher Talbot. Mar. Pet. Geol. 2008, 25, 203–204. [Google Scholar] [CrossRef]
  73. Hovland, M.; Rueslåtten, H.; Johnsen, H.K. Large salt accumulations as a consequence of hydrothermal processes associated with ‘Wilson cycles’: A review, Part 1: Towards a new understanding. Mar. Pet. Geol. 2017, 92, 987–1009. [Google Scholar] [CrossRef]
  74. Hovland, M.; Rueslåtten, H.; Johnsen, H.K. Red Sea salt formations—A result of hydrothermal processes, the Red Sea. In The Red Sea; Rasul, N.M.A., Stewart, I.C.F., Eds.; Springer Earth System Sciences: Berlin/Heidelberg, Germany, 2015; pp. 187–203. [Google Scholar]
  75. McLennan, S.M.; Taylor, S.R.; Hemming, S.R. Composition, differentiation, and evolution of continental crust: Constraints from sedimentary rocks and heat flow. In Evolution and Differentiation of the Continental Crust; Brown, M., Rushmer, T., Eds.; Cambridge University Press: Cambridge, UK, 2006; pp. 92–134. [Google Scholar]
  76. Yu, Y.; Tao, C.; Shi, S.; Yin, J.; Wu, C.; Liu, J. Physical modeling of salt structures in the middle south Atlantic marginal basins and their controlling factors. Pet. Explor. Dev. 2021, 48, 136–145. [Google Scholar] [CrossRef]
  77. Meyers, J.B.; Rosendhal, B.R.; Groschel-Becker, H.; Austin, J.J.A.; Rona. Deep penetrating MCS imaging of the rift-to-drift transition, offshore Douala and North Gabon Basins, West Africa. Mar. Pet. Geol. 1996, 13, 791–835. [Google Scholar] [CrossRef]
Figure 1. Map of the study area showing the Gulf of Guinea and the Cameroon Atlantic Margin (CAM) in western Africa (revised from [14]). The CAM is segmented into the Northern Cameroon Atlantic Basin (NCAB; Rio Del Rey Basin) and the Southern Cameroon Atlantic Basin (SCAB; Douala and Kribi-Campo sub-basins) [15], with respect to the mainland of Cameroon and Africa (inset). The Cameroon Volcanic Line (grey dashed line) indicates the boundary between the Northern and Southern CABs.
Geosciences 14 00267 g001
Figure 2. Extent of the South Atlantic Salt Unit (pink range) across the Southwest African Margin from the Benguela Basin (Angola) to the Rio-Muni Basin (Equatorial Guinea) [43].
Geosciences 14 00267 g002
Figure 3. Stratigraphic framework of the study area showing major formations, unconformities, and tectono-sedimentary phases (modified from [12]).
Geosciences 14 00267 g003
Figure 4. Geodynamic and general paleogeographic evolution of the Cameroon Atlantic Basin from the Late Jurassic to Cretaceous (revised from [53]). (14) Paleogeographic evolution between Brazil and Africa; (AD): Tectonostratigraphic evolution of the Cameroon Atlantic Basin. CAO—Central Atlantic Ocean, TO—Tethys Ocean, SA—South Atlantic, NA—North Atlantic.
Geosciences 14 00267 g004
Figure 5. Location of the (A) SCAB in the Atlantic Ocean and (B) boreholes and seismic sections in the southeastern segment of the Cameroon Atlantic Margin.
Geosciences 14 00267 g005
Figure 6. Salt structures and traps [36]: (a) dome trap formed by salt pillow; (b) turtle structure trap; (c) dome trap formed by trusting; (d) rollover anticline; (e) trap formed by diapirism on two flanks; (f,g) trap formed by fault sealing; (h) lithological trap or lithological–structural trap; (i) unconformity trap; (j) lithological trap formed by diapir collapse.
Geosciences 14 00267 g006
Figure 7. Lithostratigraphic profiles of boreholes (a) B1, (b) B2, (c) B3, (d) B4, and (e) B5, focusing on the Aptian to Albian strata (see Figure 5 for location). (1) Sandstone interbedded siltstones, (2) dark shales, (3) anhydrite traces, (4) salt, (5) Late Cretaceous to recent, (6) Albian, (7) Aptian–Albian, (8) Aptian.
Geosciences 14 00267 g007
Figure 8. Seismic interpretation of 38 km long NE–SW section SS1: (a) seismic profile of SS1; (b) major seismic sequences (SE) with boundaries and horizons (G, H, I, and J) (SR: seafloor reflector, SE1: Late Jurassic to Barremian, SE2: early to middle Aptian, SE3: middle Aptian to late Albian); (c) indication of salt distribution (pink-shaded area) based on seismic characteristics (R: regression, T: transgression, DLS: downlap surface, FS: flooding surface, SB: sequence boundary). Blue arrows indicate basement uplift.
Geosciences 14 00267 g008
Figure 9. Seismic interpretation of 45-km long NE–SW section SS2: (a) seismic profile of SS2; (b) major seismic sequences (SE) with boundaries and horizons (H, I, and J) (SR: seafloor reflector; SE1: Late Jurassic to Barremian; SE2: early to middle Aptian; SE3: middle Aptian to late Albian); (c) indication of salt distribution (pink-shaded area) based on seismic characteristics (R: regression; T: transgression; DLS: downlap surface; FS: flooding surface; SB: sequence boundary). Blue arrows indicate basement uplift.
Geosciences 14 00267 g009
Figure 10. Compiled stratigraphic and structural setting with salt distribution in the study area: (a) SS1 profile and (b) SS2 profile. KCH: Kribi-Campo High. Blue arrows indicate basement uplift.
Geosciences 14 00267 g010
Figure 11. A fence diagram showing the spatial distribution of salt units (pink layer) on NW- and NE-trending seismic profiles in the Kribi-Campo sub-basin, based on an integrated seismic borehole interpretation (revised from [14]). From the bottom upwards, black surface indicates the top Precambrian basement; yellow surface indicates the Early Aptian flooding surface covering the Precambrian basement; blue surface indicates the top salt horizon of Aptian age; red surface indicates the Top Albian unconformity. The ① light brown, ② blue, and ③ green layers represent the LST (SE1), TST (SE2), and HST (SE3), respectively.
Geosciences 14 00267 g011
Figure 12. Regional geological map of the middle Atlantic Ocean, showing the salt basin spanning from Angola to Cameroon and on the Brazilian margin (revised from [76]). The MOR and associated transform fault lines are outlined. SCAB: South Cameroon Atlantic Basin; E.G.: Equatorial Guinea; C.A.R: Central Africa Republic; D.R.C: Democratic Republic of Congo.
Geosciences 14 00267 g012
Table 1. Borehole information.
BoreholeTotal Depth
(m)
Stratigraphic Interval
B12464Aptian to Pleistocene
B23475Aptian to Pleistocene
B34215Aptian to Recent
B43301Aptian to Pleistocene
B51750Aptian to Pleistocene
Table 2. Parameters of Cameroon Span seismic acquisition.
CharacteristicValue
Seismic type2D
Streamer length10,175 m
Source volume7524 in3
Record length18 s
Sample rate2 ms
Fold102
Number of channels408
Group interval25
Shooting interval50
streamer depth9.5 m
Gun depth 8.5 m
Far offset10,315 m
Near offset140 m
Table 3. Parameters of seismic lines.
Seismic SectionPosition on the MarginDirectionTotal Length
(km)
Total Depth
(km)
SS1Continental shelf to deep basinNE–SW4319.6
SS2Continental shelf to deep basinNE–SW286.8
Table 4. Parameters of DHIs delineation in 2D seismic reflection data.
DHIs Type
Tracked
Seismic CharactersPetroleum Significance
Bright spotStrong-amplitude reflection caused by large changes in acoustic impedanceGas-saturated sandstone reservoir underlying a shale interval
Flat spotWith dipping reflections, it stands out because of its flat attitudeWell-defined gas/oil or gas/
water contacts
Dim spotWeak-amplitude reflection that reduces the contrast in acoustic impedanceAssociated with the occurrence of oil or gas
Disclaimer/Publisher’s Note: The statements, opinions and data contained in all publications are solely those of the individual author(s) and contributor(s) and not of MDPI and/or the editor(s). MDPI and/or the editor(s) disclaim responsibility for any injury to people or property resulting from any ideas, methods, instructions or products referred to in the content.

