Article

Determining the Boundaries of Overlying Strata Collapse Above Mined-Out Panels of Zhomart Mine Using Seismic Data

1
Department of Geophysics and Seismology, Satbayev University, 22 Satbayev Str., Almaty 050013, Kazakhstan
2
Kazakhmys Corporation, 12 Abay Str., Karaganda 100012, Kazakhstan
*
Author to whom correspondence should be addressed.
Geosciences 2024, 14(11), 310; https://doi.org/10.3390/geosciences14110310
Submission received: 17 September 2024 / Revised: 4 November 2024 / Accepted: 10 November 2024 / Published: 15 November 2024
(This article belongs to the Section Geophysics)

Abstract

:
The present article is devoted to the issue of studying the patterns of displacement of superincumbent rock over panels of a mine obtained using advanced seismic technologies, allowing for the study of the boundaries of caving zones in the depths of rock mass. A seismic exploration has been performed in local areas of Zhomart mine responsible for the development of Zhaman-Aybat cuprous sandstone deposits in Central Kazakhstan at the stage of repeated mining with pulling of previously non-mined ore pillars and superincumbent rock caving. A 2D field seismic exploration has been accomplished, totaling to 8000-line m of seismic lines using seismic shot point. The survey depth varied from 455 m to 625 m. The state-of-the-art technologies of kinematic and dynamic analysis of wavefield have been widely used during data processing and interpretation targeted at identifying anomalies associated with the structural heterogeneity of the pays and rock mass, engaging modern algorithms and mathematical apparatuses of specialized geodata processing systems. The above effort resulted in new data regarding the location and morphology of the reflectors, characterizing geological heterogeneity of the section, zones of smooth rock displacement, and displacement of strata with significant disturbance of the rocks overlying mined-out productive pay. The potential of the application of modern 2D seismic exploration to studying an underworked zone with altered physical and mechanical properties located over an ore deposit has been assessed. The novelty and practical significance of the research lies in the determination of the boundaries of zones of displacement and superincumbent rock caving over the panels obtained using state-of-the-art technologies of seismic exploration. The deliverables may be used to improve the process of recognizing specific types of technogenic heterogeneities in the rock mass, impacting the efficiency and safety of subsurface ore mining, both for localization and mining monitoring.

1. Introduction

The mining process influences in-situ field stress, which leads to mining-induced discontinuous subsidence. The Zhaman-Aybat underground project (Zhomart mine) stipulates two stages of ore mining: Stage I—chamber’s mining using the room-and-pillar method; Stage II—extraction (re-mining) of ore pillars with collapse of overlying strata and surface subsidence.
For the underground mining areas, the delineation of technogenic and natural displacement zones is a crucial routine, especially for deep geological horizons [1,2].
One of the ways to assess the state of mined-out massifs in complex mining and geological conditions of deep level ore mining with significant mined-out spaces is geophysical research methods [3,4,5,6,7,8]. Surface high-resolution seismology occupies a particular place among other methods [9,10,11,12] and is widely used in the petroleum and gas industry. Modern methods of seismic data acquisition, processing, and interpretation are quite effective in addressing the geomechanical challenges of solid mineral deposits [13,14,15].
The advantage of seismic exploration is in the identification of deep heterogeneities (structures and zones) developing in the underworked rock mass during underground ore mining; the assessment of the current geomechanical state of the rock mass; and the identification of zones of caving, movements with discontinuity, and smooth displacements [16,17,18]. Reflection seismic research is able to detect local heterogeneities in the geological section at large and small depths, and it was addressed to delineate existing seismic reflectors, faults, and structural bodies. The mentioned issue and solutions are crucial for deep underground mining [19,20,21].

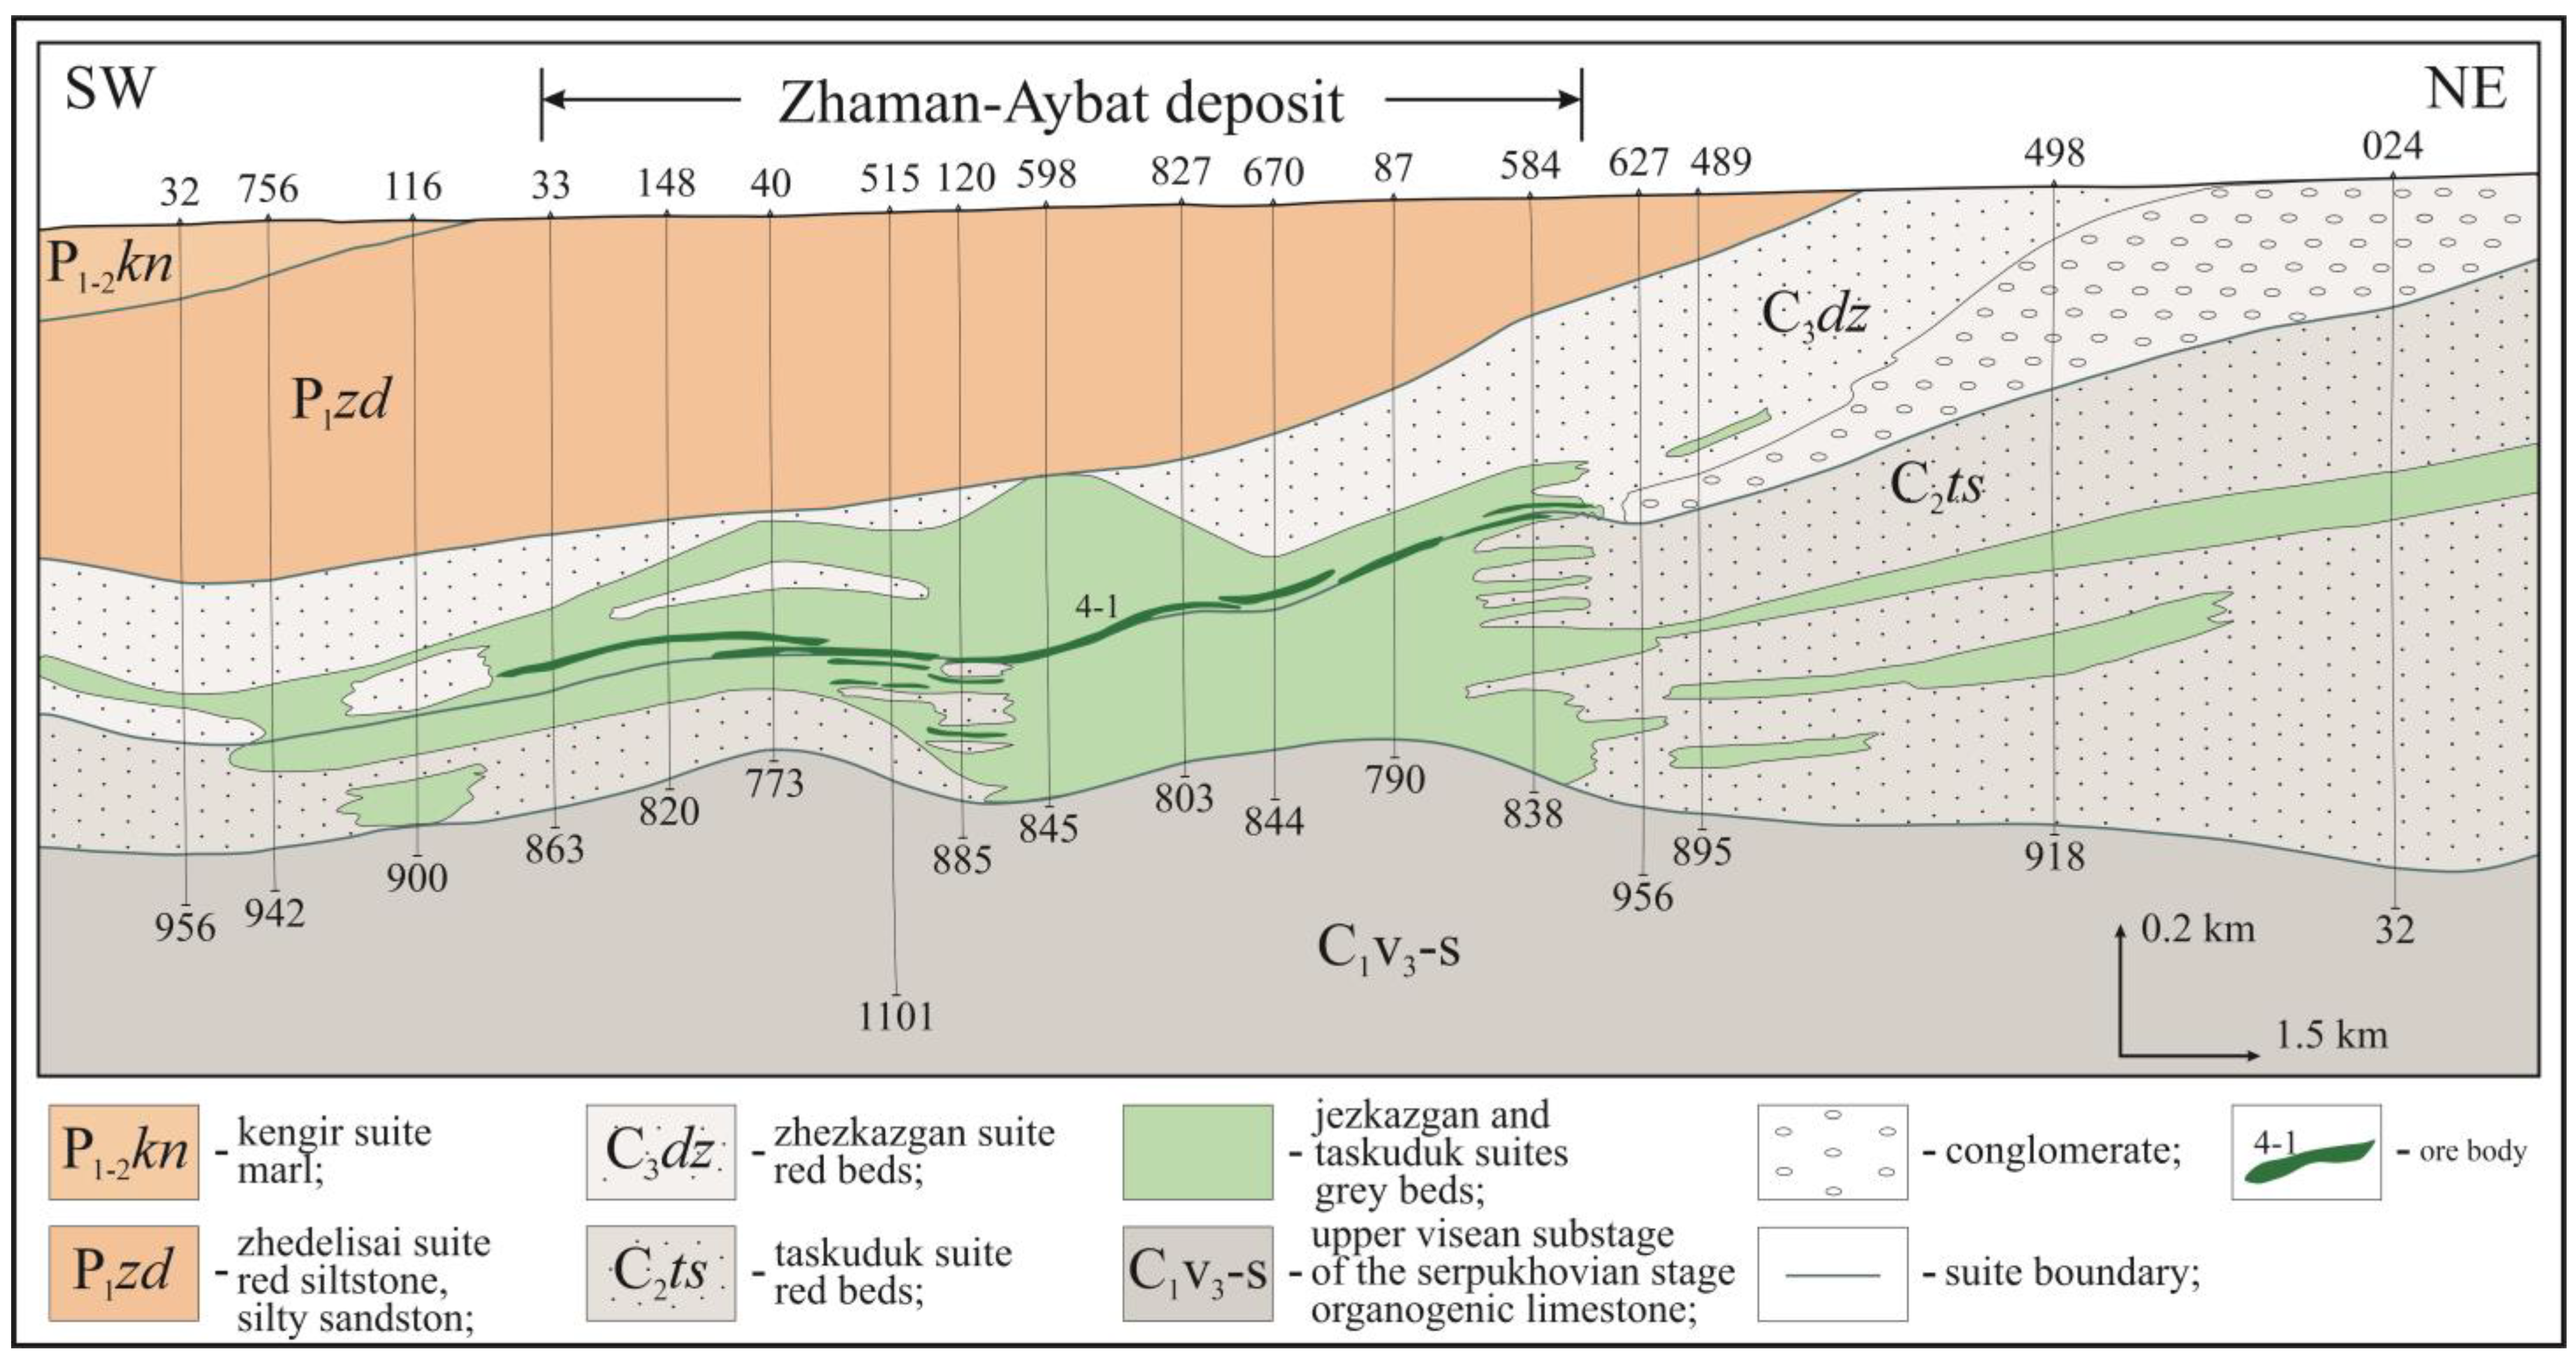
2. Geological Conditions

An experimental seismic exploration to determine the geometry of zones of movements with discontinuity in underworked rock mass was carried out at the sites of re-mining with caving of Zhaman-Aybat copper sandstone deposits (Figure 1). The deposit is confined to an apical part of the Zhaman-Aybat east–west trending horstanticline. The mineralization is located within a large lens of grey-colored rocks of the Zhezkazgan ore-bearing Carboniferous series (Zhezkazgan and Taskuduk suites) and is represented by sheet-like bodies. The ore-hoisting deposits of Zhezkazgan ore-bearing Carboniferous series are overlapped by rocks of the Kengir Formation of Lower Permian age, represented by calcareous-marly rocks with small poor impregnations of chalcopyrite and pyrite. These sedimentary sequences make up a linear, latitudinal-oriented Zhaman-Aybat anticline with flat (5°–25°) bedding of the southern flank and steeper (30°–45°) bedding of the northern flank. Rock inclination angles reach 60°–80° in flexural bends. The ore field is 18 km long in total and 4 km wide. The productive formations’ thickness within the deposit varies from 140 m to 360 m (an average is 220 m) [22,23,24,25,26,27]. Gently dipping deposits of copper sandstones with a thickness of 2–12 m occur at depths of 500–800 m in sedimentary rocks with a high level of tectonic stress [28,29].
The fracturing of rock mass is controlled by the confinement of the deposit to deep faults of sublatitudinal and submeridional strikes. The directions of tectonic faults accessed by development and production workings are consistent with them. More than 341 thousand cracks were recorded during the geomechanical logging of cores from vertical exploration boreholes, out of which 80% were stratification planes and layering. Inclined and steeply dipping cracks account for approximately 10% of each. According to a linear survey of the fracturing of the rock mass in underground mine workings, there were two sets of steeply falling cracks with dips of 70° ÷ 90° recorded in addition to a dominant system of shallow cracks of layering and stratification. The most common are the cracks of a sublatitudinal NS trend. The majority of open tectonic faults have similar trend. This coincides with the trend of the Azat flexure and Kazybek deep fault. Steeply falling cracks of a submeridional trend are much less common.
The rock mass of the ore-bearing strata is characterized by a thin-slabby structure with frequent layering of gray-colored sandstones (stronger, stable, and persistently wet) and siltstones (less strong and less stable mudstones, subject to wetting during flooding).

3. The Technology of Mining and Rock Pressure Manifestations Observed in Practice

The Zhaman-Aybat deposit is mined by Zhomart mine (Kazakhmys Corporation).
The project stipulates two stages of underground ore mining: Stage I (starting year 2006)—mining chambered reserves using the room-and-pillar system, dividing the deposit into mining units (panels) using belt barrier pillars (BP), and supporting mined-out area in the panels using columnar interchamber pillars (IP); Stage II (from 2014)—extraction (re-mining) of ore pillars (IP + BP) on the retreat with collapse of the overlying strata and surface subsidence. The status of mining operations is shown in Figure 2.
The mining conditions at Zhomart mine are four times harder than those at the well-known copper sandstone deposit of Zhezkazgan due to the greater depth (2 times) and lower rock strength (2 times). Therefore, mining is quite often (4 times more often than in Zhezkazgan) complicated by roof falls in the development workings and chambers [30]. The main reasons are listed below:
  • A high horizontal tectonic stress level, which leads to Eulerian instability of the roof of drifts and chambers in the form of longitudinal bending followed by fracture of thin-slab rocks;
  • Opening up of tectonic fault zones by the underground workings, through which groundwater flows into the mine from the overlying aquifer while gray-colored siltstones and mudstones sharply lose strength and stability when flooded.
In 2017, after four years of re-mining, the geomechanical situation at the mine became seriously aggravated. The magnitude and rate of subsidence of the ground surface have increased sharply (Figure 3 and Figure 4).
The seismic activity of the rock mass has increased up to six-point Richter scale man-made earthquakes registered by all Republican seismic recording stations (Figure 5).
The numerous rock failures and roof falls in caved stopes have been recorded in the mined-out panels. There was local disintegration of pillars in permanent transport and conveyor roadways [31,32]. The deterioration of the geomechanical situation had been caused by the following [33,34]:
  • A large number of local areas with extraction of interchamber pillars (IPs) with small spans of collapse, and areas between them being overloaded by the bearing pressure;
  • Hanging of the rock mass in an unmined barrier and interchamber pillars (BP + IP), creating bearing pressure on them and the surrounding rock mass [35]:
In May 2018, referencing the experience of the Zhezkazgan deposit development and having analyzed all available data, the geomechanical service concluded on preparing for major caving in the central part of the mine field, accompanied by intense human-made earthquakes and air blasts in the mine. That has justified suspension of all mining activities within the potential caving zone and construction of walls to protect from air blasts. However no large-scale caving occurred. Ground movement has rapidly decelerated. The predicted time of caving was no longer calculated and preparation for caving has been suspended. The previously issued caving forecasts became irrelevant and were cancelled. However, the risk of caving remained, since the cavities supported by plastically collapsing pillars still exist.
The forecast error was in the use of an incorrect model of failure of the Zhomart interchamber pillars (IPs)—as in Zhezkazgan. The model of brittle fracture of the high, thin (slender) IPs in Zhezkazgan turned out to be unacceptable for the low, wide (squat) IPs of Zhomart. It appeared that changing the shape of the IPs also changes the nature of their destruction. The low, wide IPs of Zhomart have a plastic nature of failure. The brittle fracture of the slender IPs in Zhezkazgan means that the IPs quickly lose their bearing capacity once destroyed, i.e., they cease to support the overlying strata and so the superincumbent rock collapses. The plastic nature of the post-peak deformation of the squat IPs in Zhomart means that they preserve their bearing capacity after failure. Such roof fenders, once caved, deformed, and pressed into the roof/soil rocks, continue to support superincumbent rock, allowing that rock to settle but preventing its caving.
The forecast of geomechanical services contains an assessment of seismic energy (E) of upcoming earthquakes with energy class magnitude values of K = lgE = 9.4 (2.5 billion J). The forecast was confirmed: a seismic event with an energy class of K = 9.8 (6.3 billion J) occurred at the mine on 9 March 2019. The seismic regime of the rock mass has changed after the mentioned event: the rate of seismic energy release has slowed.
Prior to the strongest seismic event dated 9 March 2019, throughout the year, the mentioned collapsing rock mass had been releasing seismic energy with an average rate of dE/dt = 617 kJ/day and the surface subsidence during this period was very high—4 ÷ 5 mm/month. After 9 March 2019, the average (for 2.5 years) rate of energy release from the rock mass decreased by 3.8 times to 164 kJ/day. The rate of surface subsidence has declined sharply to 1 ÷ 1.5 mm/month.
These facts indicate a deceleration of the rock mass caving, which is most likely caused by the stoppage of mining operations in the central part of the mine. Once activities are resumed in order to complete mining of ore reserves in the pillars, the seismic activity of the rock mass, the displacement of the rock strata, and crustal movements will remain [36,37,38,39].
The crucial factor for further successful mining completion of the Zhaman-Aybat deposit is the study of the boundaries of displacement zones of the superincumbent rock above the mined-out panels of Zhomart mine, the prediction of disturbances to the ore rock mass, predictions of the roof within the boundaries of the frames of the ore bodies, the identification of the fall of rocks overlying the mined-out production pay and mined-out panels of the mine, the delineation of the updip zone of deflection of roof rocks, and the determination of the degree of alteration in the physical and mechanical parameters of the undermined rocks.

4. Materials and Methods

Deliverables. The addition of new areas of Zhaman-Aybat field is characterized by deeper mining and consequently more complicated mining and geology. So, in order to assess the technical conditions of the mined-out area and clarify the parameters of the applicable mining system at great depths (450–650 m.), a field seismic exploration has been accomplished at the local area of Zhomart mine. The key objective of the exploration effort: additional study of the geological structure of the i-44 determination from the surface of possible boundaries of zones of displacement and falls of superincumbent rock over the panels obtained for Zhomart 1, which arose as a result of underground mining of ore horizons [40,41].
In the year 2022, a group of specialists from KazNITU named after K.I. Satpayev (Satbayev University)—authors of the present article, carried out the experimental detailed 2D seismic exploration at the local site of Zhomart mine. Previously, the area of Zhomart mine had not been surveyed by detailed CDP-2D seismic exploration. The 8000 linear meters of Zhomart mine’s seismic lines cross over mined-out areas, where presumably an intense alteration in the technogenic conditions of the rock mass was observed at a depth of 400 m or more [42,43]. The following reflection seismic acquisition parameters were used: 480 active channels, split spread, a receiver point interval of 4 m, a shot point interval of 20 m, 964 m maximum offset, and an explosive source (a single borehole) with a charge depth of 7.7–13.5 m.
All necessary requirements for high-resolution seismic exploration methods have been met during field activities. The quality of the geodetic survey has been assessed based on five seismic lines passing over the mined-out area of the mine. The lines were finally approved on-site, taking into account all human-made interferences. The lines were designed, and the SPS files have been prepared, describing the observation system and XYZ coordinates of shot points and receiving points. The necessary experimental effort and field seismic surveys have been carried out using an advanced SCOUT registration system. There were 480 groups of geophones used to ensure the required survey parameters and performance. The upper part of the section (UPS) has been studied using an uphole velocity survey (UVS) [44,45].
The processing of CDP-2D field seismic data was performed at the SeisSpace − 5000.0.3.1 (Landmark) data processing complex. The sequence of CDP was determined based on the seismic geological conditions of the area, type of processing, and its ultimate objective and included the following:
  • Preliminary and standard kinematic processing;
  • Detailed kinematic and dynamic interpretations.
The huge volumes of seismic information have been processed using a specialized processing graph with mandatory preservation of the true ratio of wave field amplitudes. The analysis of the field data has proven that the agreed-upon parameters for 2D CDP and seismic line design ensured outstanding quality of the seismic sections in complicated seismological conditions, including the presence of strong multiple reflections in subsurface workings. The applied processing procedure, aiming to address noise attenuation (high- and low-frequency filtering), higher resolution (deconvolution), and refining of structural images (time migration), has been quite well tested and effectively applied [46,47]. The high-quality time and depth sections were outlined using seismic lines, thus providing an unbiased summary on the structural heterogeneity and current state of the geomechanical conditions of the rock mass (Figure 6). Those sections are used to highlight and trace reflections associated with the main geological and technogenic heterogeneities in productive pays.
The seismic data interpretation process included the following:
  • Input of the benchmark data and addition to a unified coordinate system;
  • Development of a seismic line and borehole grid;
  • Reflection correlation; correlation of well logging data;
  • Combination of drilling and seismic exploration data; time depth conversions;
  • Calculation of seismic attributes; seismic inversion;
  • Development of correlation patterns.
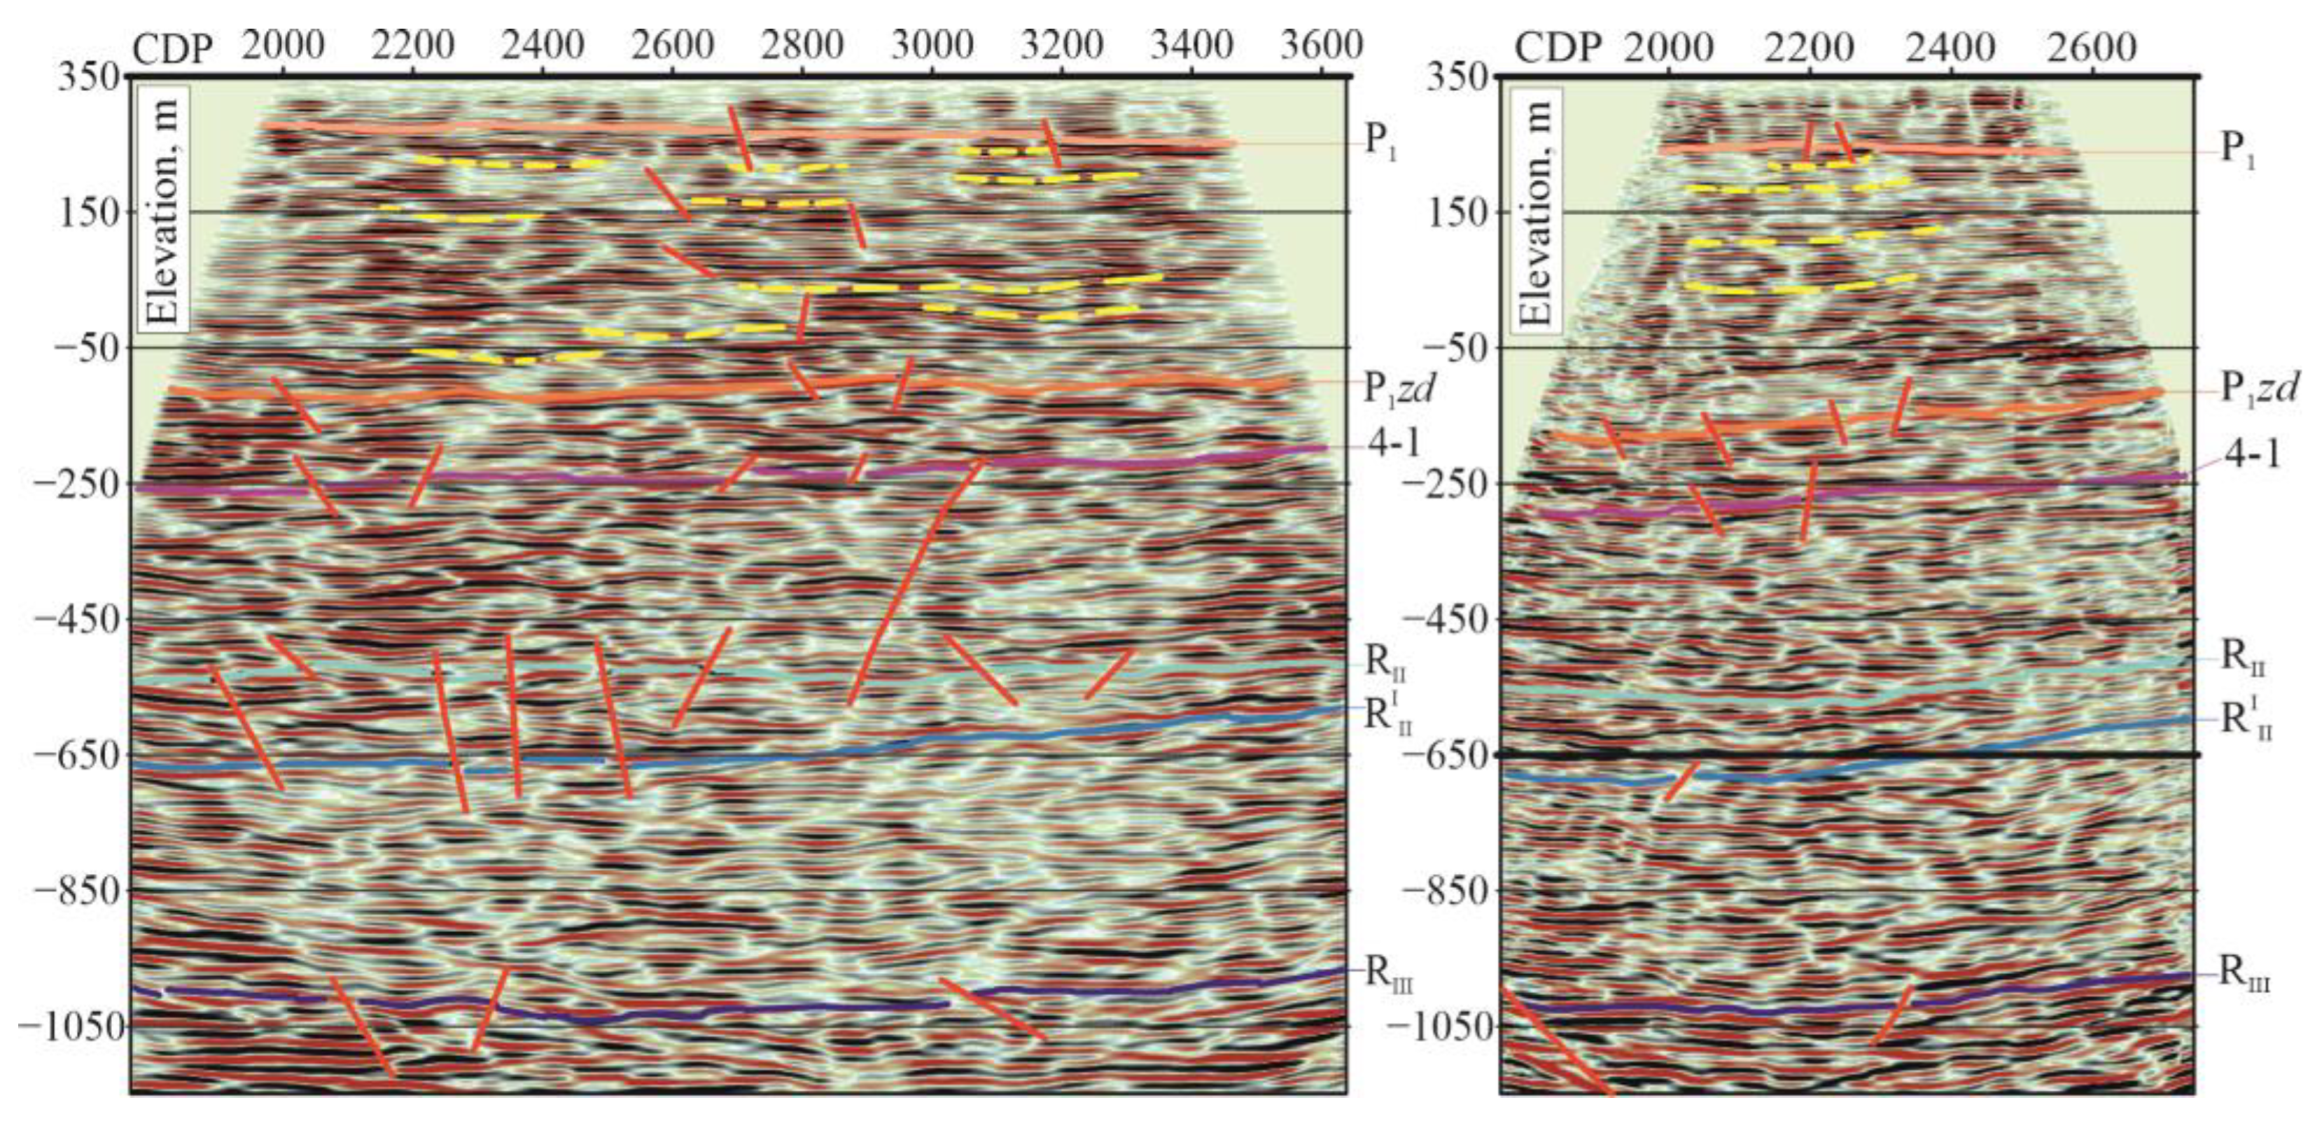
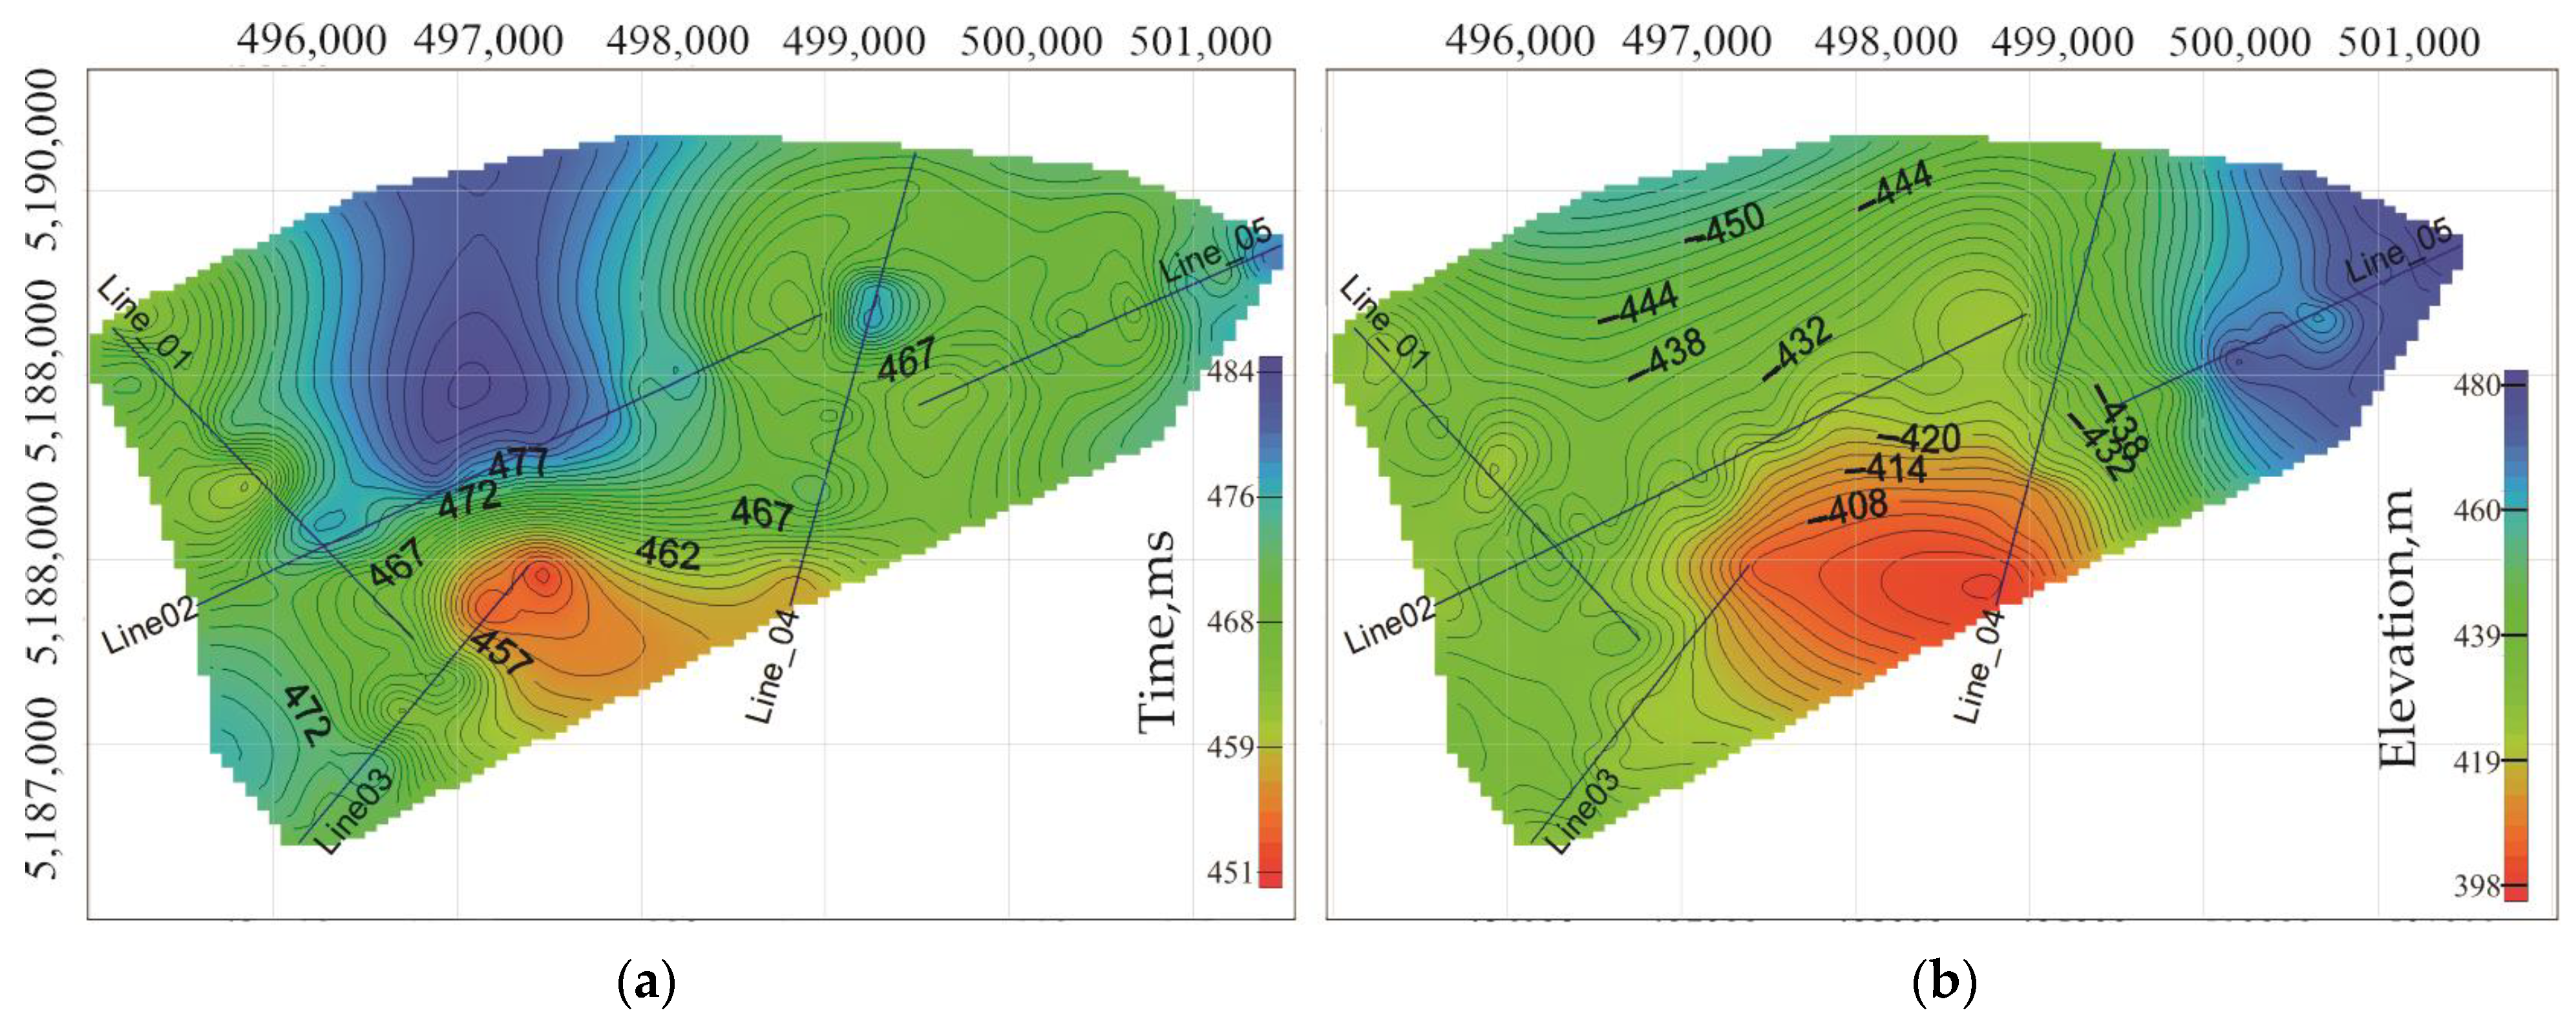
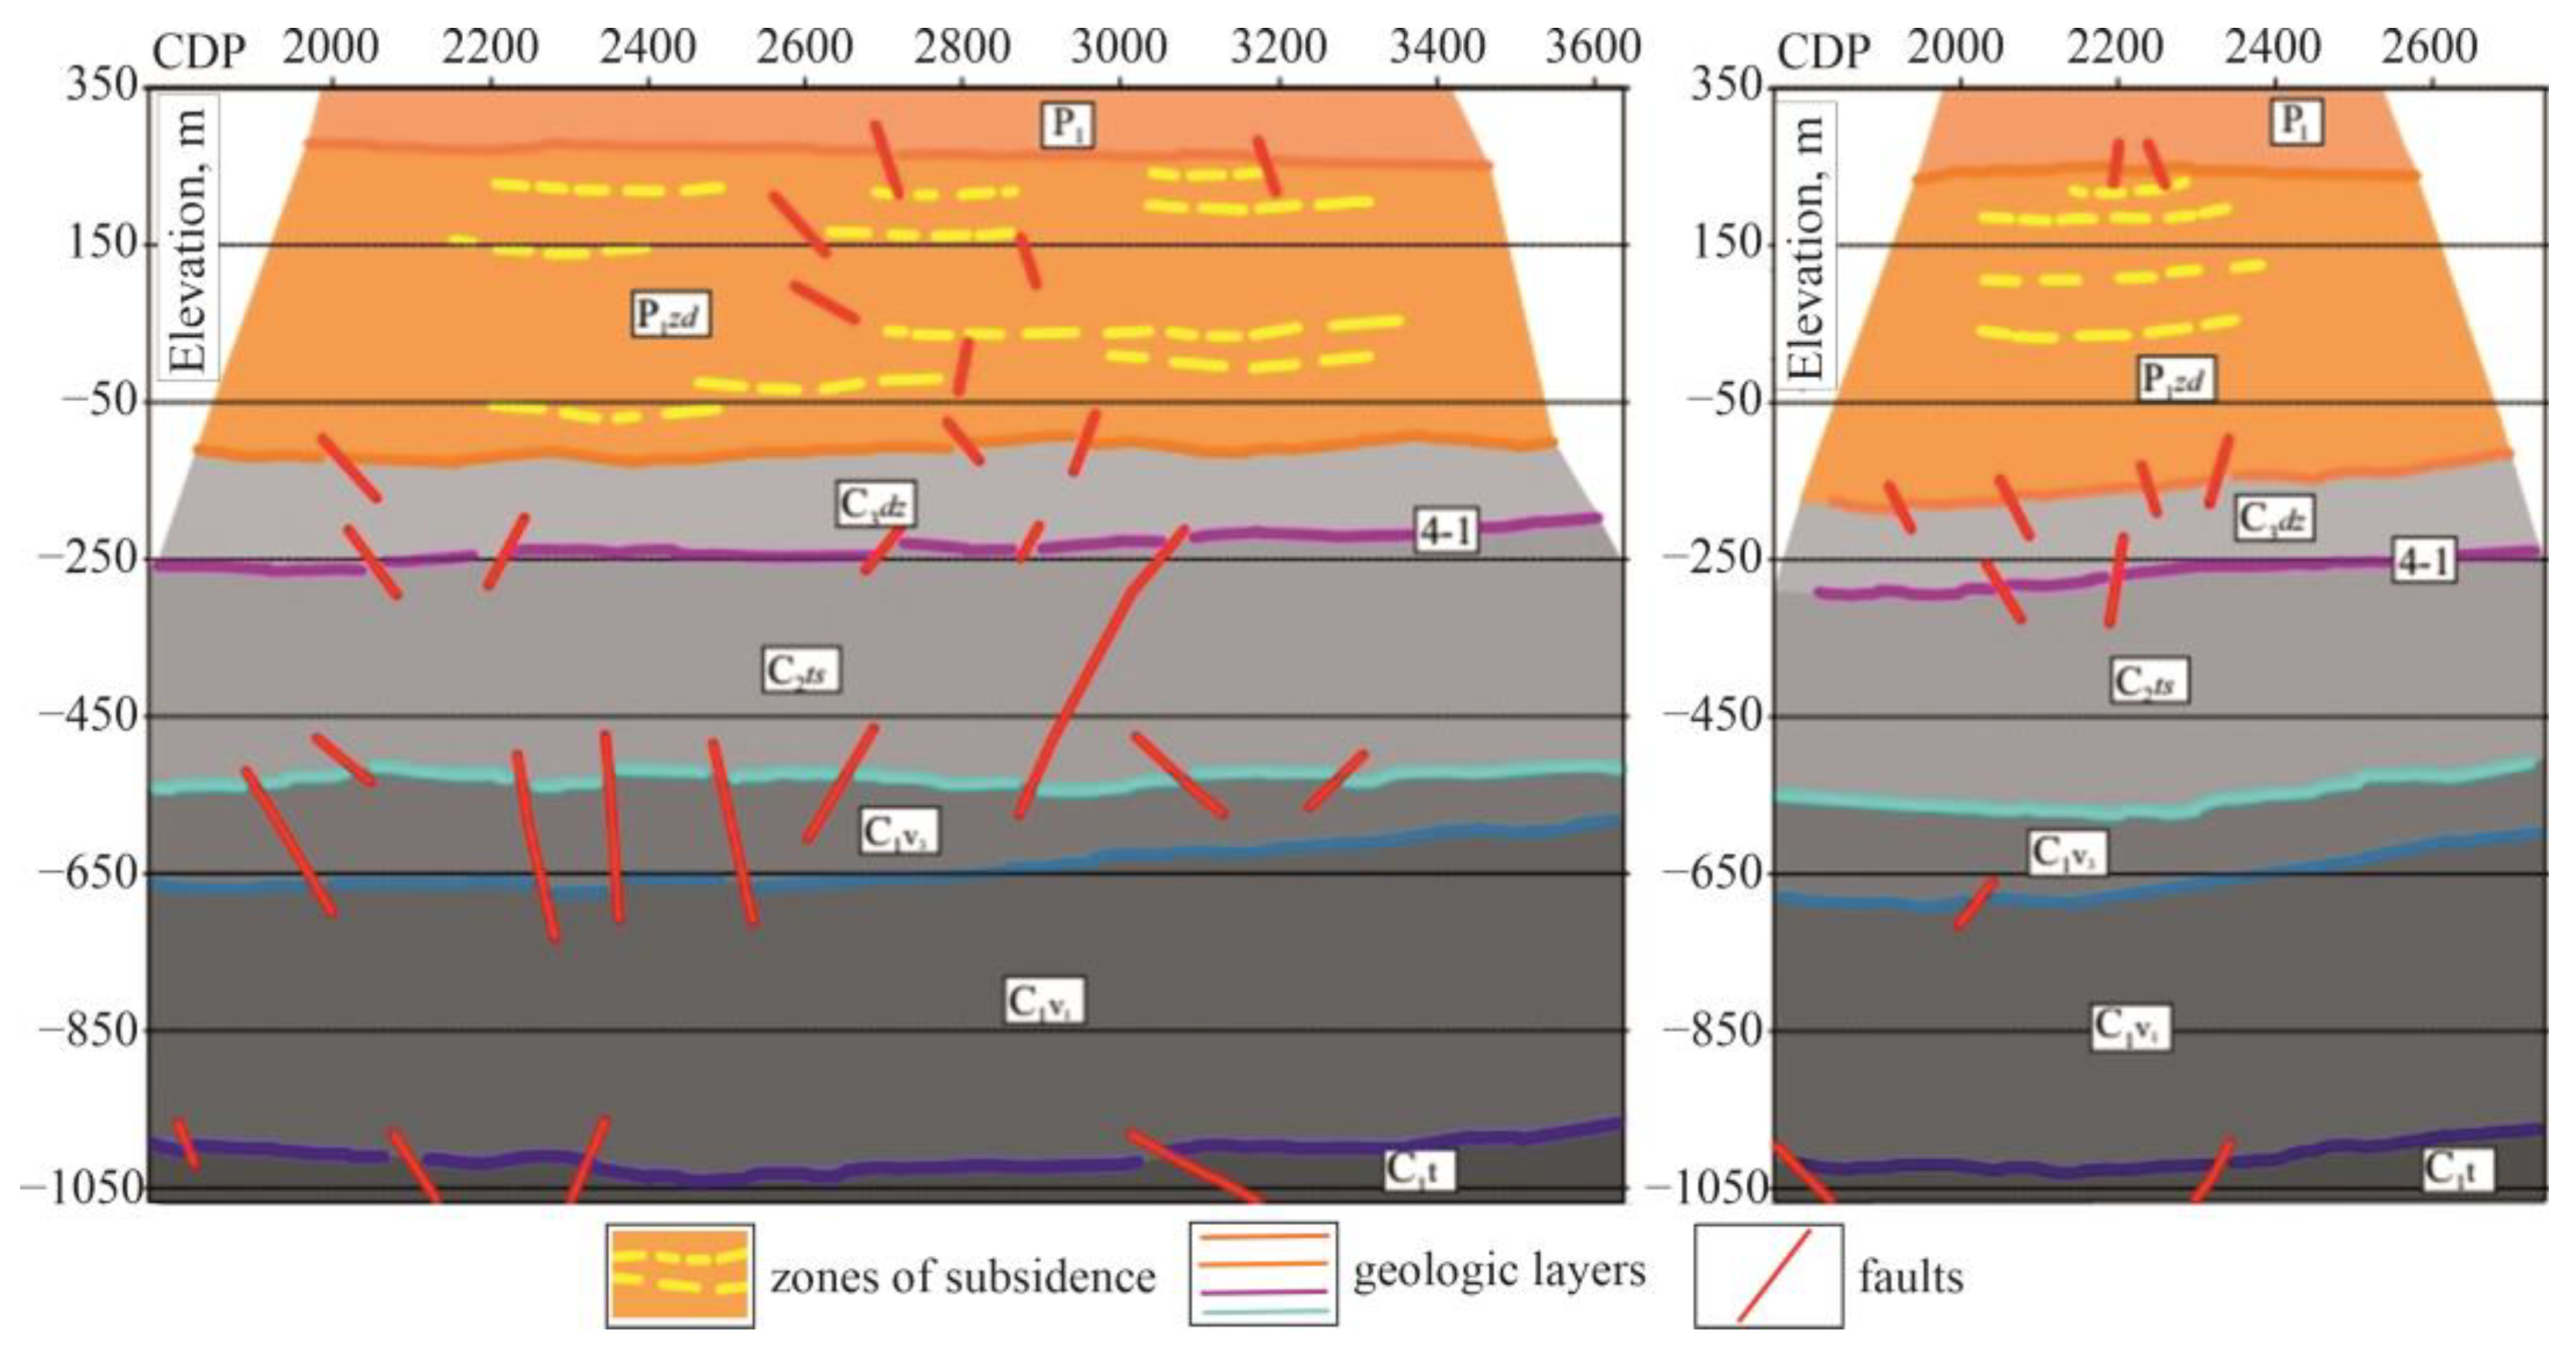
The use of modern registration equipment and digital systems for processing and interpretation allowed for anomalies associated with both geological heterogeneity of ore-hoist sequences and ore objects (lithofacies, stratigraphic, structural-tectonic, etc.) and zones of secondary changes in the properties of rock mass, including ore deposits affected by mining and mechanical operations due to ore deposit mining, to be identified [48].
The interpretation of processed seismic data included a structural analysis and a dynamic interpretation and commenced with a seismic geological correlation of the time and stack section with a preliminary split of the time sections into separate sections (blocks) according to the wave pattern specifics prior to phase correlations. The interpretation has been accomplished as follows: general kinematic interpretation; delineation of targeted intervals, structural interpretation of targeted horizons; interval seismogeological analysis; and interpretation of seismogeological sequences within thin-sheet models environment.
The dynamic interpretation was carried out using an attribute analysis (regression analysis, the method of main components, neural networks, and Bayesian lithoclassification) in order to identify detailed inhomogeneities associated with a disturbance of the rock mass accumulated in the process of deposit mining [49].
The next stage included an integrated analysis of the seismic exploration and well data. Combined interpretation of the seismic and well data based on statistical methods of the identification of dependencies of seismic attributes from the petrophysical and geomechanical properties of the targeted objects allowed for the anomalies associated with the structural features of geological sequences and rock masses to be identified [50,51].
The analysis of seismic data to assess the detailed structural-lithological heterogeneity of the section was carried out along seismic lines 02 and 03. Seismic lines 01, 04, and 05 were surveyed with low-fold seismic data and represented a series of the reflection method 1–2 seismic data fold (see Figure 2) and were analyzed to clarify the overall geological heterogeneity within the study area.

5. Results

A detailed analysis of the newly derived seismic data has been performed in order to
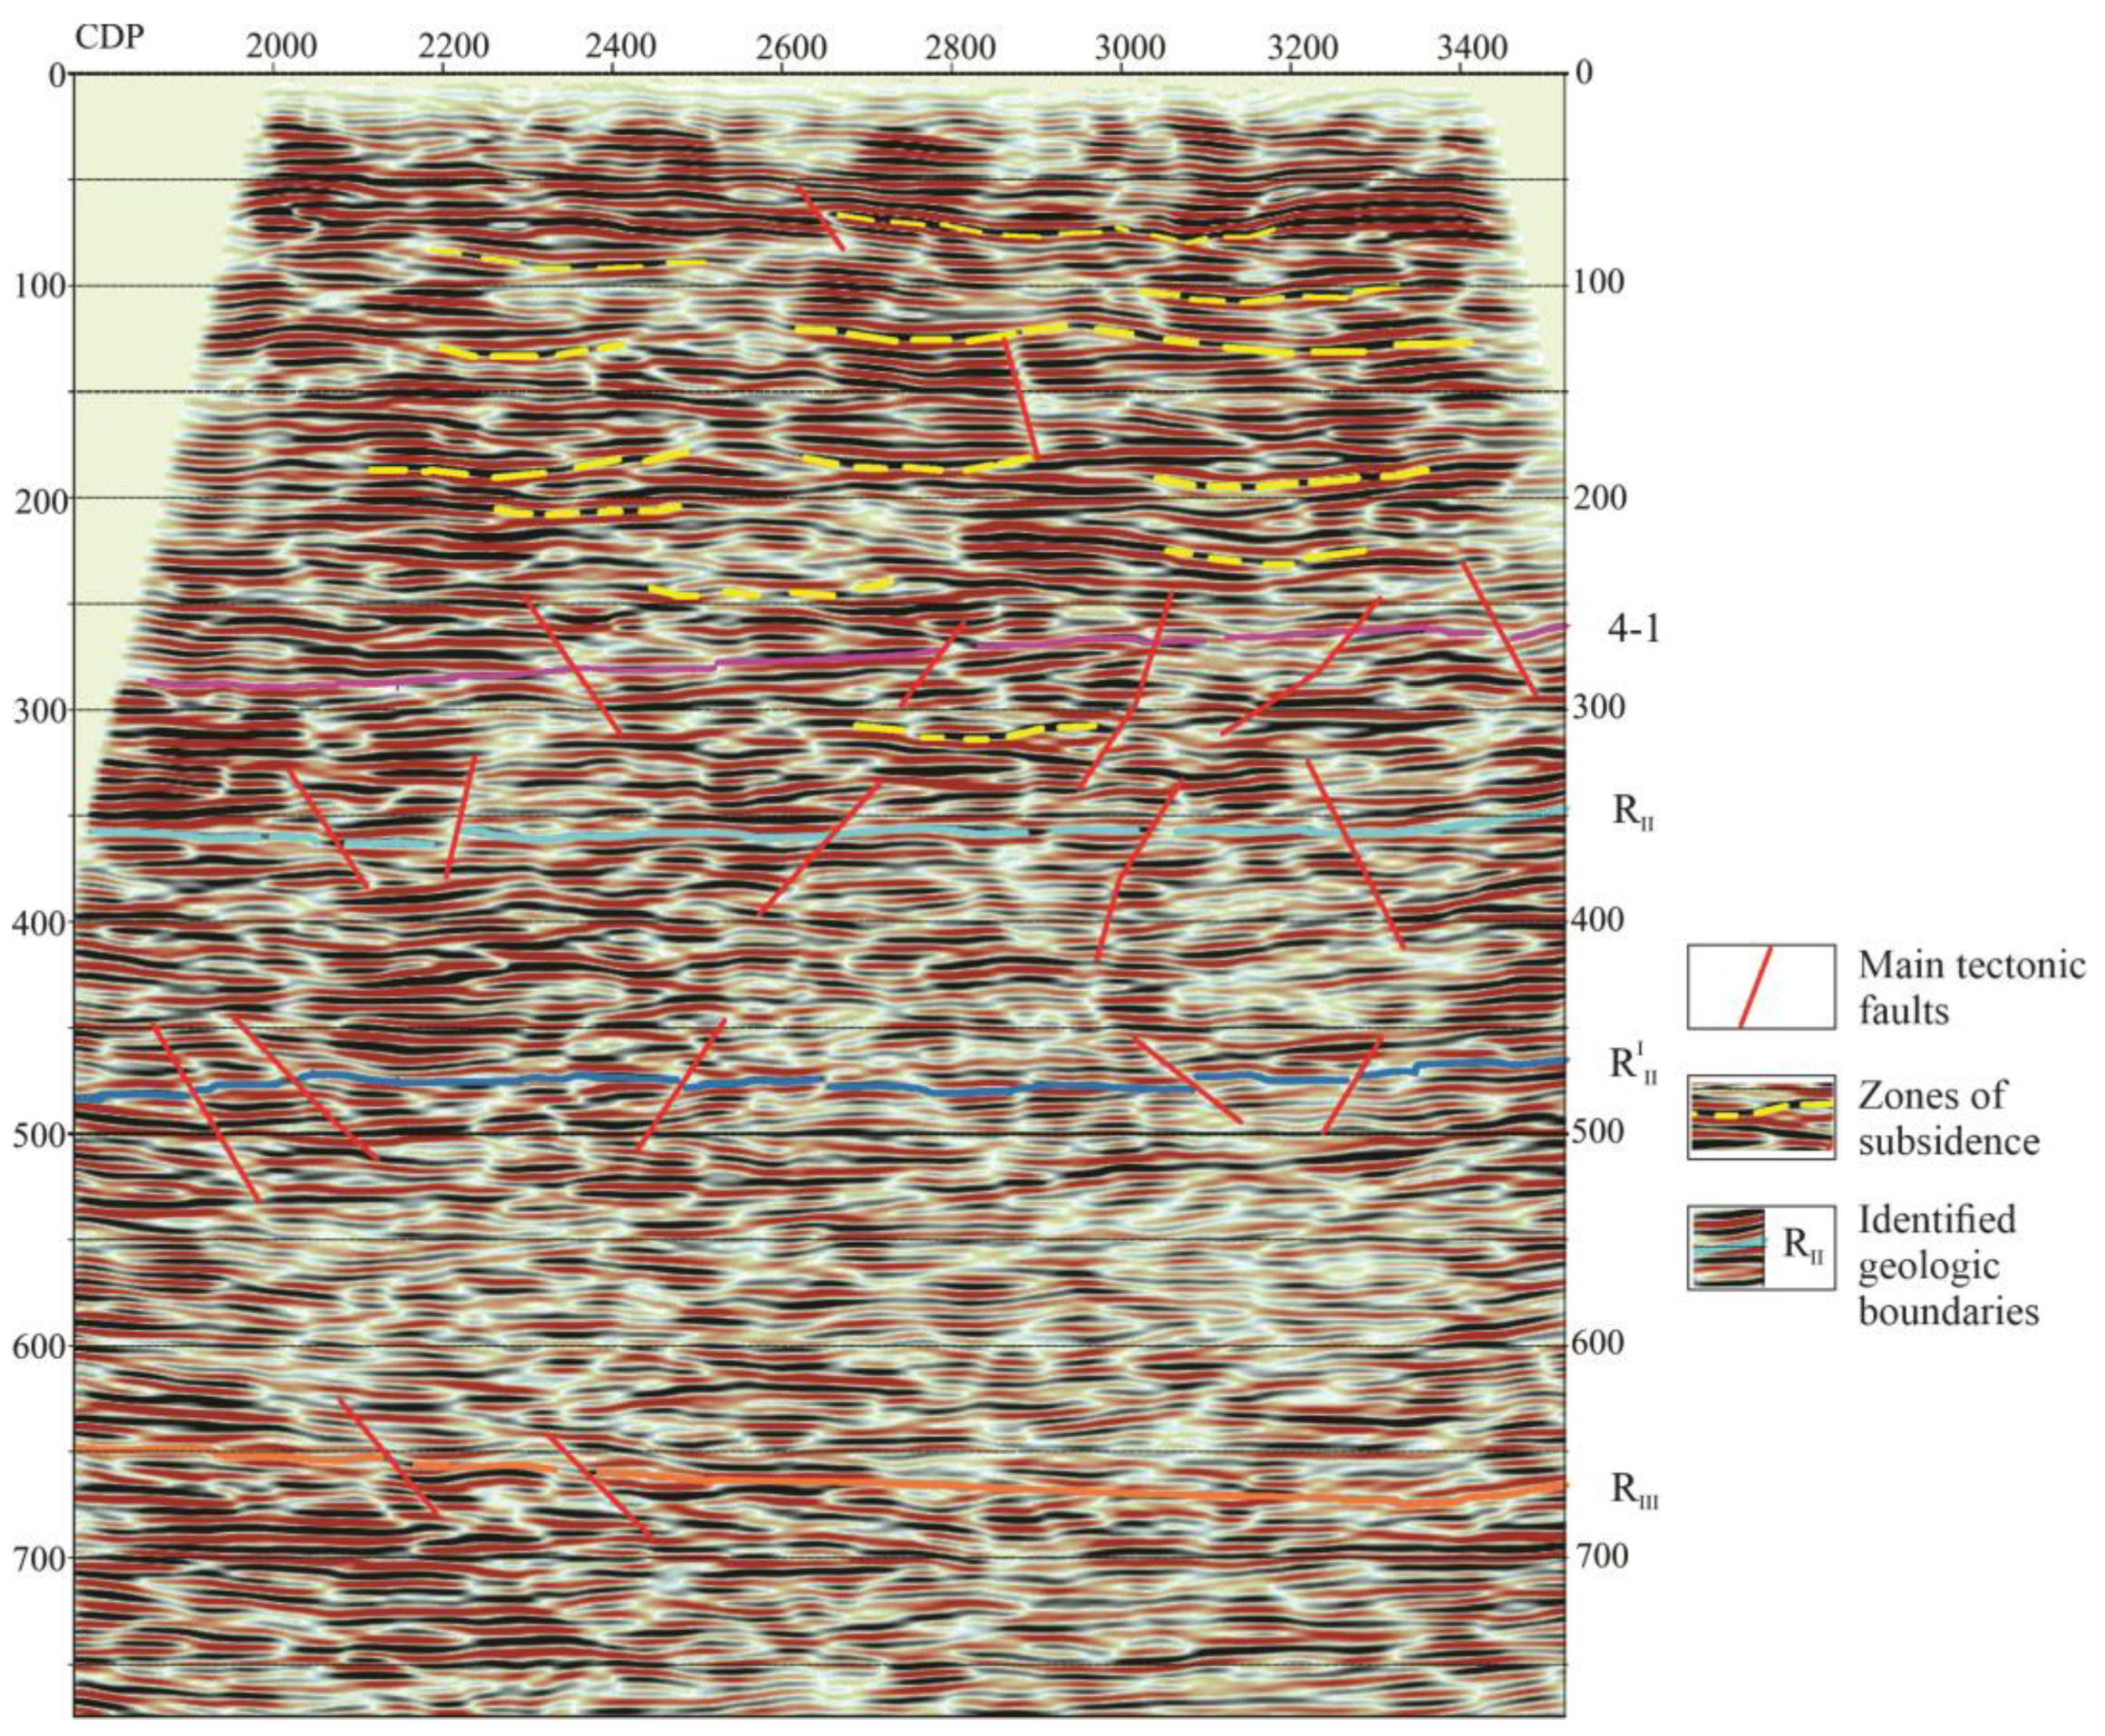
  • Identify structural-lithological heterogeneities in the intrawell space and undeveloped zones of ore arrays along the seismic profiles to depths more than 1000 m;
  • Identify abnormal zones to assess the current geomechanical conditions of the rock mass over the mined-out areas of Zhomart mine and the associated processes of displacement, subsidence, and destruction of the rock mass.
The study of the geological structure of the section was carried out based on the selected marker horizons consistently observed in seismic wave fields (Figure 7).
In the geological section, they correspond to two large, sharply different seismic formation sequences: Permian and Carboniferous. The difference in wave pattern within each sequence is due to the diversity and complexity of the geological processes that occurred at each stage of geological development [52].
In order to recalculate the travel time of the elastic waves to the depth-converted scale, we used the velocity characteristics obtained after comprehensive petrophysical analysis of the rocks taken from the geological horizons and rock mass, which make up a section of Zhomart mine. The velocities are calculated based on the results of the statistical processing of measured velocities and densities of rock and core samples according to vertical seismic profiling (VSP) data and a velocity model derived after seismic data processing, including pre-stack depth migration.
The VSP was carried out by the specialists of “Zhezkazgangeology” JSC (Smirnova N.N and others, year 1986) at 12 boreholes during prospecting and geological and geophysical studies in the area of the Zhaman-Aybat structure. The analysis of the wave field using seismic lines was carried out considering the VSP data from the boreholes located within ore field, in the zones of tectonic trend in the eastern cutoff part of the structure, with a significant increase in the thickness of the Carboniferous deposits and production pays. The recalculation of the travel time of the elastic waves to the depth-converted scale using the VSP data was carried out at boreholes 216, 219, and 225 located along seismic line 02. It was established that the calculated velocities derived from the newly acquired detailed seismic data properly correlate with the VSP data (Table 1, Figure 8).
The velocity model has been estimated using a reflection seismic velocity analysis (250 m interval) along the lines and presented in the form of an averaged velocity curve over the depth of the target horizons (Table 2, Figure 8).
In general, a comprehensive petrophysical analysis of velocity characteristics has proven that the change in interval velocities is well differentiated along the cross-section and less differentiated over the area, thus reflecting local heterogeneities associated with the lithological layers of production pay, replacement of the carbonate cement with siliceous-carbonate and essentially siliceous cement, rock porosity, and the impact of tectonic movements. A significant increase in formation velocities was established (from 4300–4400 m/s to 4750–4900 m/s) with the appearance of gray sandstones in the cross-section. No ore deposits appeared directly in the velocity characteristics and in the spectra of passing waves. However, the ore-bearing zone is more heterogeneous compared to the hoisting environment. The faults and their accompanying zones of crushing and voids, the material composition and thickness of the overlaying ore part of the section, the porosity of productive gray sandstones, fracturing of the rocks, and the changes in the facies significantly influence velocity characteristics.
The depth sections and structural maps were outlined based on recomputed velocity marks, where the roof of production pay and the boundaries of the geological sequences have been delineated (Figure 9 and Figure 10).
The seismic sections clearly distinguish three structural levels characterized by specifics of the parameters of wave fields (Figure 6 and Figure 10).
The upper level is at 0–400 m, where the extensive changes in frequency and phase characteristics of the wave field are observed. The tarnish in the pattern of this pay indicates differentiation of elastic properties of the rocks related to lithological or mechanical variability, as well as an alteration in the rock properties due to watercut of the horizon. The average target level is at 400–800 m. Based on the processing results, the target structural level is clearly distinguished in the seismic wave field and displays a clear layered structure associated with the developed part of the geological section. The upper part of the mid structural level (depths 400–600 m) and associated ore deposit 4-1 demonstrate lateral seismic facies and structural heterogeneity of the parameters (lithological heterogeneity of sequences in relation to the upper and lower horizons, changes in physical and mechanical properties of the rocks, watercut, occurrence of fracturing, etc.), impacting the alteration in geomechanical properties and creating instability of the overlying roof and potentially causing rock mass falls.
A series of previously unidentified tectonic faults is clearly identified in all sections based on the results of the in-depth analysis of the seismic wave field and mentioned faults crossing all three identified seismic structural levels. The faults identified in the wave field have a submeridional trend due to the location of the lines in the sublatitudinal direction.
The calculations of dynamic coherence attributes responsible for tectonic disturbances and spectral decomposition, highlighting the structural levels and individual tectonic blocks of the registered seismic wave field along lines 2 and 3, confirm the location of the fault fields, zones of mechanically altered rocks, and fracturing in the upper and mid structural levels. The black strokes in the coherence section indicate the zone of tectonic (mechanical) deformations determining the current structural and tectonic conditions of the area being studied. The attributes of the spectral decomposition based on the frequency ranges of the registered reflections allowed for the structure of the observed seismic field to be differentiated and the three structural levels identified per the characteristic pattern of the wave field to be clearly confirmed (Figure 11).
The studies established that the dynamic intensity of the seismic reflections directly depends both on the lithological composition of the geological sequences and rock mass making cross-section and their stress state associated with technogenic structural heterogeneity in the overlying and underlying sediments of the ore deposit.
In order to identify the technogenic heterogeneities in the structural field of the area being studied at Zhomart mine, the mining/surveying data were used: profile line “1”, located in the eastern part of seismic line 02, 130 m south of and almost parallel to line “2”, crossing seismic line 02 within the panels 42 and 43 (see Figure 2).
Referring to reliably established data outlined on mining survey seismic lines indicating the condition of rock masses and ore deposits, based on the wave field pattern along seismic line 02, located close to longitudinally parallel survey line “1”, and the morphology of the ore deposit, and using analogy methods, the morphology of ore deposit 4-1 in inaccessible areas of the interchamber space has been clarified. The absolute elevations and roof heights of deposit 4-1 obtained as a result of drilling and mining operations have been used as benchmark data. Seismic line 03 is located remotely from existing initial lines (mining survey sections), and the correlation of seismic horizons and identification of associated target zones were carried out similar to line 02.
The analysis of the obtained seismic data demonstrated that separate structural elements associated with the changes in the mining-mechanical properties of the rock mass are reliably traced in the seismic wave field. According to the seismic data, the zones of subsidence of the overlying sediments above the panels obtained for Zhomart mine are consistently identified on lines 02 and 03.
In the area of panels 41, 40, 30, and 1 over ore body 4-1, an anomalous zone of deep subsidence and hanging of overlying rock mass is distinguished (Figure 12).
The most intense zones of technogenic structural heterogeneity are distinguished in the western part of the Zhomart site, which is the second stage of mining development. The maximum disturbance of the rock mass is observed both in the area and intensity of the subsidence of strata over the mined-out space (Figure 13).
Figure 14 shows a rock mass fall identified on survey profile “1”. It corresponds to a similar-shaped wave field anomaly on the time section below ore deposit 4-1 [53]. Velocity modeling using VSP results allowed us to establish that this zone is known for the anomalous velocity of the propagation of elastic vibrations associated with the presence of a step in the rock mass between panels 41 and 42. A reverse inclination angle of the layers is observed at the overlying horizons between panels 41 and 40, which is confirmed by the surveying data from line “1”.

6. Discussion

High-quality time and depth sections have been obtained as the result of a detailed field seismic CDP 2D exploration within the boundaries of Zhomart mine using modern techniques for seismic acquisition and processing of a reflection wave field. The reflections associated with key horizons in the sedimentary sequence and structural heterogeneities of both geological and technogenic nature have been identified and traced on the abovementioned time and depth sections. In general, those new results provide a detailed understanding of the deep structure (up to 1 km) of the studied area, highlighting possible structural, tectonic, and lithological targets in the designated Permian-Carboniferous sequence. To observe the subsequent structural changes in the studied area, time-lapse reflection seismic monitoring is recommended for future research.
Additional information about geological heterogeneities in the inter-well space and unmined zones of the rock mass at a depth of 400–800 m has been obtained. The dynamic interpretation allowed us to trace numerous zones of tectonic disturbances and to identify structural levels lithologically identified by nature of the wave field.
This was the first time that the zones of subsidence and rock mass falls over a mined-out space have been studied based on the results of a wave field analysis. The identified poor zones and associated favorable conditions for superincumbent rock roof fall predicted based on seismic performance depend on the facies variability of the overlying sediments and intense manifestation of natural and human-made structural heterogeneities in the target horizons, entailing a change in geomechanical properties.
The resulting data allowed us to establish certain crucial features of the geological structure and structural heterogeneity of the study area, substantiate the conditions for technogenic processes in rock mass, and outline the path forward for future effort. The new data provide information about the current structural features of the deep composition of Zhomart mine, confirming the capabilities of high-resolution seismic exploration in solving both geological and mining-technological challenges.

7. Conclusions

The experimental in-line seismic observations proved that seismic exploration is fairly efficient in addressing the challenges in the complicated mining and geological conditions of Zhomart mine.
However, the seismic activities performed on a rather wide pattern and limited by the funds for high-fold seismic data exploration did not allow us to obtain an areal and, especially, volumetric understanding of the current mining and geological conditions of Zhomart mine. Based on the abovementioned points, we recommend studying the deep heterogeneities of Zhomart mine using the method of high-resolution volumetric seismic exploration CDP-3D with obligatory use of an observation system providing full folds at the target intervals needed to determine the tectonic plan and identify the zones of faults (amplitude shifts), poor zones of fracturing and clastic rocks (decrease in the velocities of propagation of elastic waves), and zones of increased stress in rock mass (increase in density, compressibility, and velocity of propagation of seismic waves).
The reliability of seismic exploration will increase significantly once logging is widely used in the process of interpretation, including VSP (SL) and acoustic logging (AL), including shear waves in order to apply seismic inversion algorithms.
The recommendations for further study using the CDP-3D method allow us to look forward for multiple increases in data on deep, hard-to-obtain and inter-well intervals of geological sequences and rock mass extracted by the drilling and blasting method using a panel-and-pillar mining system.

Author Contributions

Conceptualization, S.I. and A.M.; methodology, D.T., A.S. and K.T.; software, D.T., K.T. and A.S.; validation, K.T., D.T. and A.S.; formal analysis, S.I. and A.M.; investigation, A.S.; resources, A.S. and D.T.; data curation, S.I.; writing—original draft preparation, S.I., A.M. and K.T.; writing—review and editing, D.T., A.S. and K.T.; visualization, D.T. and A.S.; supervision, S.I. and A.M.; project administration, S.I.; funding acquisition, S.I. All authors have read and agreed to the published version of the manuscript.

Funding

This research was funded by the Science Committee of the Ministry of Science and Higher Education of the Republic of Kazakhstan (grant No. AP19680360—Modelling of stress and strain state of rock masses during development of ore deposits on the basis of complex geomechanical and geophysical studies).

Data Availability Statement

The data are contained within the article.

Conflicts of Interest

The authors declare no conflicts of interest. The funders had no role in the design of the study; in the collection, analyses, or interpretation of data; in the writing of the manuscript; or in the decision to publish the results.

References

  1. Barry, H.G.; Brown, E.T. Rock Mechanics: For Underground Mining; Springer: Dordrecht, The Netherlands, 2004. [Google Scholar]
  2. Makarov, A.B. Practical Geomechanics. A Manual for Mining Engineers; Gornaya Kniga: Moscow, Russia, 2006. [Google Scholar]
  3. Dmitrak, Y.V.; Logacheva, V.M.; Podkolzin, A.A. Geophysical prediction of disturbance and watercut of rock mass. Min. Inf. Anal. Bull. 2006, 11, 35–36. [Google Scholar]
  4. Istekova, S.A. Modern methods of analysis and interpretation of geophysical data. Proc. Natl. Acad. Sci. Repub. Kazakhstan Geol. Ser. 2006, 4, 1–13. [Google Scholar]
  5. Kharisov, T.F.; Melnik, V.V.; Kharisova, O.D.; Zamyatin, A.L. Geophysical studies of rock masses in underground mine conditions. Min. Inf. Anal. Bull. 2020, 3, 255–263. [Google Scholar] [CrossRef]
  6. Shevchenko, M.D. Study of changes in rock mass in the area of influence of underground mine workings. Probl. Subsoil Use 2021, 4, 1–6. [Google Scholar]
  7. Golik, V.I.; Burdzieva, O.G.; Dzeranov, B.V. Geophysical monitoring of development of stressed-strained ore-bearing mass. Geol. Geophys. South Russ. 2021, 11, 63–70. [Google Scholar]
  8. Shevchenko, M.D.; Melnik, V.V.; Zamyatin, A.L. Geophysical research at the construction and operation sites of underground mines. Probl. Subsoil Use 2023, 1, 105–112. [Google Scholar]
  9. Sheriff, R.E.; Geldart, L.P. Exploration Seismology; Cambridge University Press: Cambridge, UK, 1995. [Google Scholar]
  10. Herwanger, J.; Koutsabeloulis, N. Seismic Geomechanics (How to Build and Calibrate Geomechanical Moduls Using 3D and 4D Seismic Data); European Association of Geoscientists & Engineers: Utrecht, The Netherlands, 2014; ISBN 978-90-73834-10-1. [Google Scholar]
  11. Karaev, N.A.; Rabinovich, G.Y. Ore Seismic Exploration; Geoinformmark: Moscow, Russia, 2000; 366p. [Google Scholar]
  12. Evans, B.J. A Handbook for Seismic Data Acquisition in Exploration; Society of Exploration Geophysicists: Tulsa, OK, USA, 1997. [Google Scholar]
  13. van Buren, R.; Turner, G.; Hird, G. Modern Seismic Is Illuminating the Depths; The Southern African Institute of Mining and Metallurgy: Johannesburg, South Africa, 2019. [Google Scholar]
  14. Togizov, K.; Issayeva, L.; Muratkhanov, D.; Kurmangazhina, M.; Swęd, M.; Duczmal-Czernikiewicz, A. Rare earth elements in the Shok-Karagay ore fields (Syrymbet ore district, Northern Kazakhstan) and visualisation of the deposits using the Geography Information System. Minerals 2023, 13, 1458. [Google Scholar] [CrossRef]
  15. Karaev, N.A. Establishment and Methods of Development of Seismic Exploration of Unconventional Models of Upper Crust and Capabilities of Modern Seismoacoustic Technologies in Wide-Exploration Provinces; Seismic Technologies: Chennai, India, 2017. [Google Scholar]
  16. Malehmir, A.; Durrheim, R.; Bellefleur, G.; Urosevic, M.; Juhlin, C.; White, D.J.; Milkereit, B.; Campbell, G. Seismic methods in mineral exploration and mine planning: A general overview of past and present case histories and a look into the future. Geophysics 2012, 77, WC173–WC190. [Google Scholar] [CrossRef]
  17. Melnik, V.V. Application of spectral seismic profiling method to assess geomechanical conditions of rock mass around mine workings. Min. Inf. Anal. Bull. 2005, 10, 69–74. [Google Scholar]
  18. Pisetsky, V.B.; Lapin, S.E.; Zudilin, A.E.; Patrushev, Y.V.; Schneider, I.V. Methodology and results of industrial use of MIKON-GEO seismic monitoring system to control rock mass conditions in the process of underground mining of ore and coal deposits. Min. Inf. Anal. Bull. 2016, 2, 58–64. [Google Scholar]
  19. Zhukov, A.A.; Prigara, A.M.; Tsarev, R.I.; Shustkina, I.Y. Method of mine seismic exploration to study the features of geological structure of VKMS. Min. Inf. Anal. Bull. 2019, 4, 121–136. [Google Scholar] [CrossRef]
  20. Malehmir, A.; Markovic, M.; Marsden, P.; Gil, A.; Buske, S.; Sito, L.; Luth, S. Sparse 3D reflection seismic survey for deep-targeting iron oxide deposits and their host rocks. Ludvika Mines Swed. Solid Earth 2021, 12, 483–502. [Google Scholar] [CrossRef]
  21. An, E.A.; Istekova, S.A.; Kasymkanova, K.M.; Dzhangulova, G.K. Use of 3D seismic exploration for ore deposits modeling in complicated mining geological environment of Kazakhstan. Vestnik RAEN 2021, 1, 15–23. [Google Scholar]
  22. Zhezkazgan Field. Kazakhstan National Encyclopedia; Kazak encyclopedias: Almaty, Kazakhstan, 2005; Volume II, ISBN 9965-9746-3-2. [Google Scholar]
  23. Uzhkenov, B.S.; Alzhanova, B.G.; Petrovskiy, V.B.; Fishman, I.L.; Yugin, V.V. Innovative technical schemes for prospecting activities for the deposits of copper of Zhezkazgan type. Kazakhstan 2011, 3, 74–78. [Google Scholar]
  24. Satpayeva, M.K. Mineralogy of ore deposits of Zhaman-Aybat deposit. News NAS RK Geol. Ser. 2006, 5, 29–41. [Google Scholar]
  25. Istekova, S.; Aidarbekov, Z.; Togizov, K.; Saurykov, Z.; Sirazhev, A.; Tolybayeva, D.; Temirkhanova, R. Lithophysical characteristics of productive strata of cupriferous sandstone within Zhezkazgan Ore District in the central Kazakhstan. Min. Miner. Depos. 2024, 18, 9–17. [Google Scholar] [CrossRef]
  26. Aidarbekov, Z.K.; Istekova, S.A.; Glass, H. Complex of geophysical research for studying geological structure of Zhezkazgan ore region in Kazakhstan. In Proceedings of the 17th Conference and Exhibition Engineering and Mining Geophysics, Gelendzhik, Russia, 26–30 April 2021; pp. 1–9. [Google Scholar]
  27. Pysmennyi, S.; Fedko, M.; Chukharev, S.; Rysbekov, K.; Kyelgyenbai, K.; Anastasov, D. Technology for mining of complex-structured bodies of stable and unstable ores. IOP Conf. Ser. Earth Environ. Sci. 2022, 970, 012–040. [Google Scholar] [CrossRef]
  28. Zharaspaev, M.A. Experience of Panel-and-Pillar Mining System Application at Zhaman-Aybat Field (Republic of Kazakhstan) Center of Scientific Cooperation “Interactive Plus”; Interactive Science: Englewood, CO, USA, 2017. [Google Scholar]
  29. Zharaspaev, M.A. Results of Pilot Work on Re-Development at Zhaman-Aybat Field (Republic of Kazakhstan); Interactive Science: Englewood, CO, USA, 2017; pp. 127–132. [Google Scholar]
  30. Bekbergenov, D.; Jangulova, G.; Kassymkanova, K.K.; Bektur, B. Mine technical system with repeated geotechnology within new frames of sustainable development of underground mining of caved deposits of Zhezkazgan field. Geod. Cartogr. 2020, 46, 182–187. [Google Scholar] [CrossRef]
  31. Makarov, A.B.; Mosyakin, D.V.; Karpikov, A.A. Assessment of natural stress state of rock mass at Zhaman-Aybat mine. Min. J. 2005, 9–10. [Google Scholar]
  32. Makarov, A.B.; Selivanov, D.A. Tectonophysical analysis of natural stress field at Zhomart mine. In Development of Mineral Resource Deposits and Underground Construction in Challenging Hydrogeological Conditions; Publishing House Belgorod National Research University BelSU: Belgorod, Russia, 2019; pp. 233–244. [Google Scholar]
  33. Makarov, A.B.; Mosyakin, D.V.; Tolysbaev, A.K. Movement of rocks during repeated development of flat ore deposits. In Proceedings of the VIII International Conference “Innovative Directions in Design of Mining Enterprises. Geomechanical Support for Design and Support of Mining Operations”—St. Petersburg Mining University, Saint Petersburg, Russia, 15–17 January 2017; pp. 63–70. [Google Scholar]
  34. Asanov, V.N.; Toksarov, N.A.; Samodelkina, N.L.; Bel’tiukov, A.A.; Udartsev, V.A. Evaluation of stressed-deformed state of virgin rock at Zhaman-Aybat deposit. Bull. PNIPU Geol. Oil Gas Min. 2014, 12, 56–66. [Google Scholar]
  35. Makarov, A.B.; Selivanov, D.A. An Integrated Approach to Geomechanical Substantiation of Design of Mine Workings Based on Structural-Geological and Tectonophysical Analyzes of Zhaman-Aybat Deposit (Zhomart Mine); Modern Tectonophysics. Methods and Results. Materials of the Sixth Youth Tectonophysical School-Seminar: Moscow, Russia, 2019; pp. 222–229. [Google Scholar]
  36. Shiri, Y.; Shiri, A. Discrete fracture network (DFN) model-ling of fractured reservoir based on geomechanical restoration, a case study in the South of Iran. Rudarsko-Geološko-Naftni Zbornik 2021, 36, 151–162. [Google Scholar] [CrossRef]
  37. Makarov, A.; Mosyakin, D. Rock mechanics of pillars extraction EUROCK 2018: Geomechanics and Geodynamics of Rock Masses. In Proceedings of the 2018 European Rock Mechanics Symposium, Saint Petersburg, Russia, 22–26 May 2018; CRC Press: London, UK, 2018; Volume 1, p. 1046. [Google Scholar]
  38. Fedorov, E.; Kassymkanova, K.K.; Jangulova, G.; Miletenko, N. The influence of extensive caving zones on the state and behavior of the surface as a result of underground mining works. E3S Web Conf. 2020, 192, 03009. [Google Scholar] [CrossRef]
  39. Makarov, A.B. Reverse calculation of the strength of an ore mass based on destruction of inter-chamber pillars. In Geotechnology-2013: Problems and Ways of Innovative Development of Mining Industry, Proceedings of the VI International Scientific and Practical Conference, Almaty, Kazakhstan, 17 May 2013; IAAR Publications: Kazakhstan, Astana, 2013; Volume 64, pp. 189–194. [Google Scholar]
  40. Klyuev, R.V.; Bosikov, I.I.; Mayer, A.V.; Gavrina, O.A. Comprehensive analysis of use of effective technologies to improve sustainable development of natural and technical system. Sustain. Dev. Mt. Territ. 2020, 2, 283–290. [Google Scholar] [CrossRef]
  41. Golik, V.I.; Burdzieva, O.G.; Dzeranov, B.V. Control of rock mass geomechanics by optimizing development technology. Geol. Geophys. South Russ. 2020, 1, 127–137. [Google Scholar]
  42. Istekova, S.A.; An, E.A. On the use of high-resolution 3D seismic exploration in ore deposits of Kazakhstan. In Proceedings of the Annual International Scientific and Practical Conference “Satpayev Readings”, Almaty, Kazakhstan, 10–11 April 2019; Volume 1, pp. 54–62. [Google Scholar]
  43. Sirazhev, A.N.; Istekova, S.A.; Temirkhanova, R.G. Application of 3D seismic for justification and characterization of geological and geophysical conditions in mining geology. Eng. Min. Geophys. 2021, 2021, 1–10. [Google Scholar]
  44. Istekova, S.A.; Sirazhev, A.N.; Temirkhanova, R.G. Geological and geophysical conditions for the use of 3D seismic prospecting in solving problems of ore geology. In Proceedings of the Engineering and Mining Geophysics 2021, Gelendzhik, Russia, 26–30 April 2021; Volume 2021, pp. 13–21. [Google Scholar]
  45. Sirazhev, A.; Istekova, S. Geological and geophysical conditions for application of 3D seismic in mineral exploration. In Proceedings of the NSG2021 2nd Conference on Geophysics for Infrastructure Planning, Monitoring and BIM, Bordeaux, France, 29 August–2 September 2021; Volume 1, pp. 1–5. [Google Scholar]
  46. Kasymkanova, K.M.; Istekova, S.A.; An, E.A. A Method for Identifying of Ore Objects Based on 3D Seismic Exploration; Author Certificate No. 109832; National Institute of Intellectual Propert: Astana, Kazakhstan, 2020. [Google Scholar]
  47. Kassymkanova, K.K.; Istekova, S.; Rysbekov, K.; Amralinova, B.; Kyrgizbayeva, G.; Soltabayeva, S.; Dossetova, G. Improving a geophysical method to determine the boundaries of ore-bearing rocks considering certain tectonic disturbances. Min. Miner. Depos. 2023, 17, 17–27. [Google Scholar] [CrossRef]
  48. Niyaz, A.T.; Togizov, K.S.; Istekova, S.A. Seismic data dynamic interpretation in the study of the lateral variability of petroleum bearing terrigenous reservoirs. News Natl. Acad. Sci. Repub. Kazakhstan Ser. Geol. Tech. Sci. 2023, 6, 145–156. [Google Scholar] [CrossRef]
  49. Olierook, H.K.; Scalzo, R.; Kohn, D.; Chandra, R.; Farahbakhsh, E.; Clark, C.; Müller, R.D. Bayesian geological and geophysical data fusion for the construction and uncertainty quantification of 3D geological models. Geosci. Front. 2021, 12, 479–493. [Google Scholar] [CrossRef]
  50. Hilterman, F.J. Seismic Amplitude Interpretation; Society of Exploration Geophysicists and European Association of Geoscientists and Engineers: Utrecht, The Netherlands, 2001; ISBN 1-56080-109-3. [Google Scholar]
  51. Yilmaz, Ö. Seismic Data Analysis. Processing, Inversion, and Interpretation of Seismic Data; Society of Exploration Geophysicist: Houston, TX, USA, 2001. [Google Scholar]
  52. Iverskaya, A.P.; Magretova, L.I. Report on Further Geological Studies of Area at Scale 1:200000 Sheets M-42-XXXII-XXXIII in Year 2008–2010; Center GeolSeismic: Almaty, Kazakhstan, 2010. [Google Scholar]
  53. Makarov, A.B. Assessment of the Natural Stress State of Massif at Zhaman-Aybat Mine; Makarov, A.B., Mosyakin, D.V., Karpikov, A.A., Eds.; Mining Journal: London, UK, 2005; pp. 9–10. [Google Scholar]
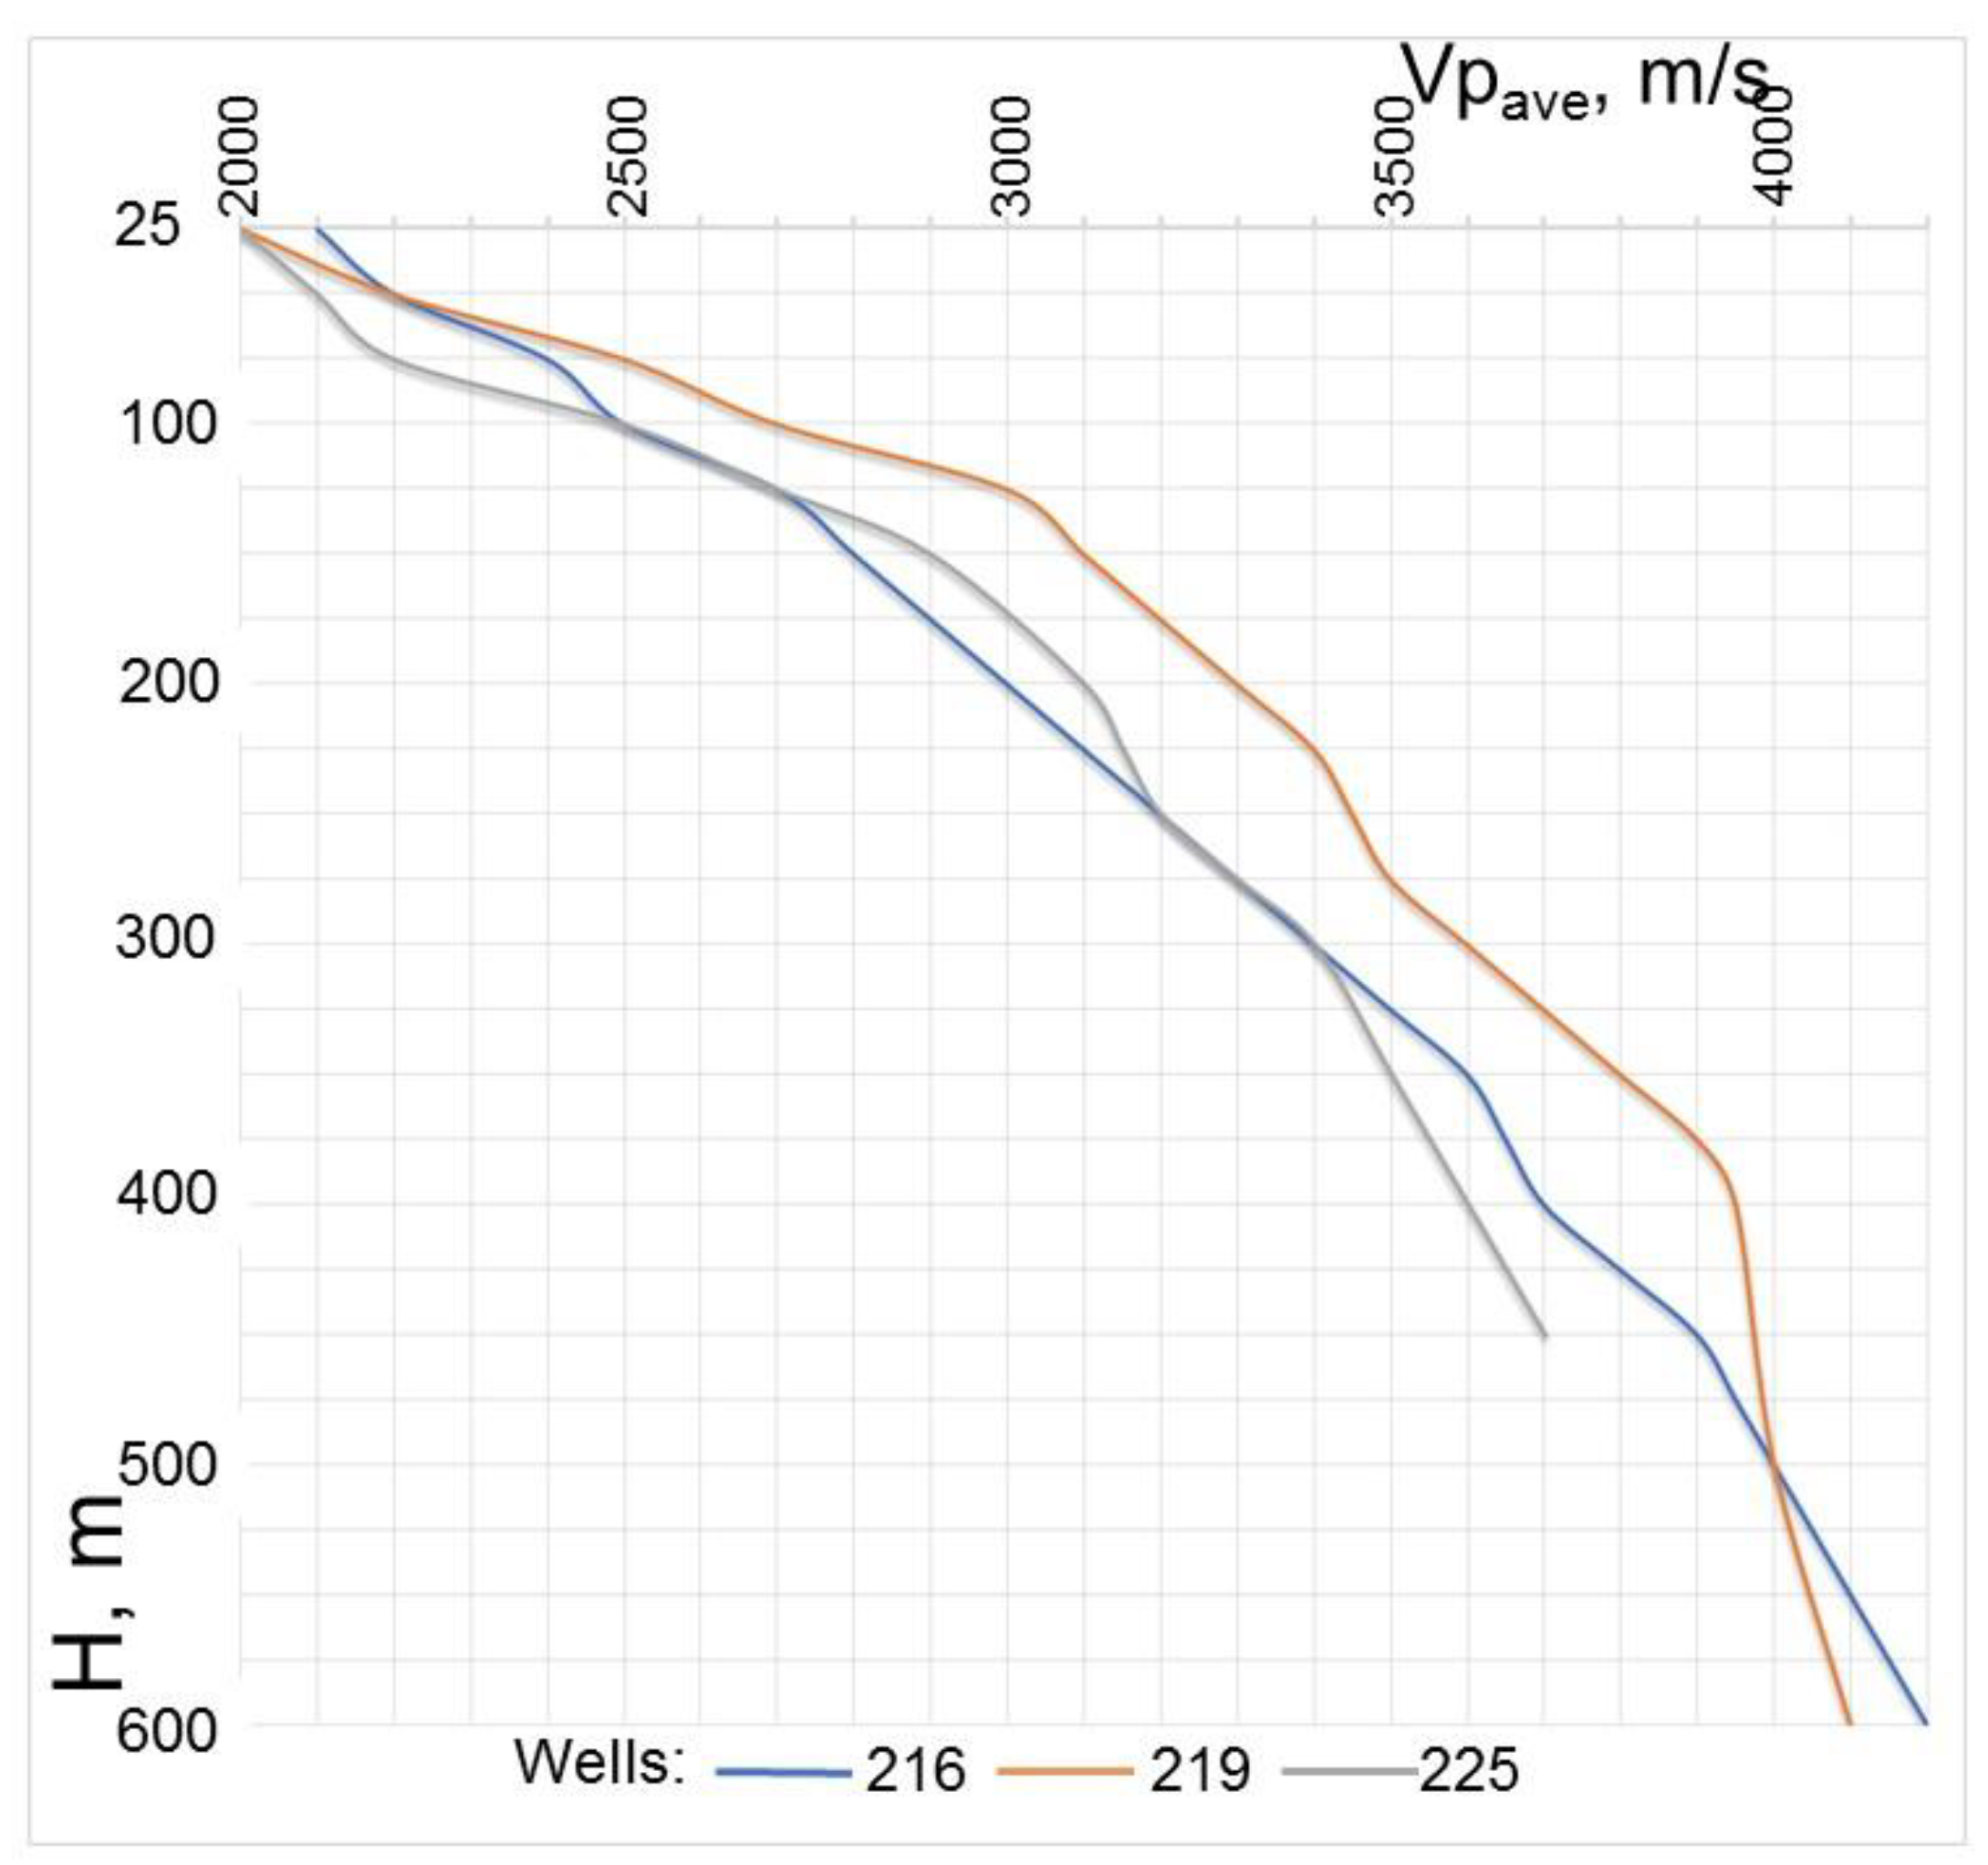
Figure 1. Geological section of the Zhaman-Aybat deposit.
Geosciences 14 00310 g001
Figure 2. The state of mining operations at Zhomart mine. The areas of re-mining are highlighted in yellow.
Geosciences 14 00310 g002
Figure 3. Ground surface subsidence along profile line 1.
Geosciences 14 00310 g003
Figure 4. Timewise subsidence above the panels 39 ÷ 43. Start time: 1—re-mining of ore pillars with collapse of overlying strata; 2—escalation of the geomechanical status of the mine; 3—forecast of rock caving and mining activity stoppage.
Geosciences 14 00310 g004
Figure 5. Benioff Graph for seismic energy (E) relief from the rock mass. Stars—human-made earthquakes and their energy class (K = lgE). Start time: 2—escalation of the geomechanical status of the mine; 3—forecast of collapse and mining activity stoppage.
Geosciences 14 00310 g005
Figure 6. Time cross-section—line 02 (vertical scale—two-way travel time, ms).
Geosciences 14 00310 g006
Figure 7. Picking of horizons and main faults along line 02 (left) and line 03 (right). The legend is the same as for Figure 6.
Geosciences 14 00310 g007
Figure 8. VSP P-wave average velocity from wells 216, 219, and 225 (velocity versus depth).
Geosciences 14 00310 g008
Figure 9. Isochrone map (a) and structural map (b) of horizon RII (base of Taskuduk Formation sediments).
Geosciences 14 00310 g009
Figure 10. Geoseismic section: lines 02 (left) and 03 (right).
Geosciences 14 00310 g010
Figure 11. Seismic attribute interpretation of line 2 (time domain). Deep sections: (a) coherence; (b) spectral decomposition.
Geosciences 14 00310 g011
Figure 12. Part of seismic line 02 showing zones of hanging of the overlying rock mass in the area of panels 41-40-30-1 (the highlighted yellow dash-dotted line); maximum deflection is monitored in the area of panels 50–51.
Geosciences 14 00310 g012
Figure 13. Part of line 02. Interpretation results. Distinguished hanging zone of the superincumbent rock over the mined-out space.
Geosciences 14 00310 g013
Figure 14. Profile fragment 02. Interpretation results. Step between panels 41 and 40.
Geosciences 14 00310 g014
Table 1. The reservoir velocities of production pays at the Zhaman-Aybat structure according to VSP.
Suite/Well NumberVelocity, m/s
15816418721621922503015025024
P1zd----19002600---1250
P1zd-1520-245028503500----
P1zd31503350315038003850415025004100--2860
C3dz4400445043004800495043504330520028604170
4800
C2ts44004450-45004350-5000-4000-
4700-
C1vs--------5000
Table 2. The average calculated P-wave velocity of seismic waves of geological sequences in the area has been analyzed.
Two Way Travel Time, msVelocity, m/sComputed Depth Based on Seismic Exploration, m
1003000150
2003500350
3004300645
40052001040
50057001425
Disclaimer/Publisher’s Note: The statements, opinions and data contained in all publications are solely those of the individual author(s) and contributor(s) and not of MDPI and/or the editor(s). MDPI and/or the editor(s) disclaim responsibility for any injury to people or property resulting from any ideas, methods, instructions or products referred to in the content.

