Article

Antipodal Seismic Observation and Sensitivity Kernel for the Liquid Region on the Earth’s Inner Core

by
Seiji Tsuboi
1,* and
Rhett Butler
2
1
Japan Agency for Marine-Earth Science and Technology, Yokosuka-shi 237-0061, Kanagawa, Japan
2
Hawaii Institute of Geophysics and Planetology, University of Hawaii at Manoa, Honolulu, HI 96822, USA
*
Author to whom correspondence should be addressed.
Geosciences 2024, 14(12), 333; https://doi.org/10.3390/geosciences14120333
Submission received: 10 September 2024 / Revised: 9 November 2024 / Accepted: 4 December 2024 / Published: 6 December 2024
(This article belongs to the Special Issue Seismology of the Dynamic Deep Earth)

Abstract

:
It is considered that a part of the inner core surface where iron in the fluid outer core is precipitated may have melted and formed a mushy region, but its position is not well understood seismologically. We recently analyzed seismic waveforms observed at the antipodal station of the seismic source and showed that there are precursors to the PKIIKP phase reflected beneath the inner core boundary. It has been found that this precursory wave can be modeled as a reflection under the liquid/solid interface at a depth of 100 km below the inner core boundary. Here, we use these precursor waves observed at the antipodal station (>179°). The sensitivity kernel of the amplitude of these precursor waves for the shear wave velocity structure on the inner core surface was calculated by the adjoint method, using theoretical seismic waveforms. Our results might be used to locate regions of the inner core surface where the shear wave velocity may be close to zero.

1. Introduction

The origin and structure of the Earth’s inner core has been studied extensively [1,2,3,4,5,6]. Seismology has provided effective data to pursue this study. When the seismic waves are recorded at the antipodal point of an earthquake (Δ ≃ 180°), these seismic waves, such as PKIIKP, are focused near the antipodal point where the seismic energy is amplified. The wave fields of PKIIKP that are amplified at the antipodal point cover the inner core boundary in an annular region around the circumference between the epicenter and the antipodal point. Various studies have been conducted on the Earth’s inner core structure using these characteristic properties [7,8,9,10,11,12,13,14,15] at the antipode of earthquakes. Since antipodal PKIIKP wave is not a ray but rather comprises a ray sheet sampling the whole path, it should be necessary to use full waveform theory to model the waveform at the antipodal observation. We showed in Butler and Tsuboi (2010) [11] that there are earthquake doublets in the Tonga Islands, antipodal to TAM, Tamanrasset, Algeria—one in 1992 and the other 2001—that show consistent arrivals of the PKIIKP phase in both seismograms. We modeled these antipodal seismograms by using the spectral-element method (SEM) [16,17,18,19], which is a high-degree version of the finite-element method that is accurate for linear hyperbolic problems such as wave propagation. We showed that we may include the full complexity of the 3D Earth in our simulations; i.e., a three-dimensional (3D) wave speed and density structure, a 3D crustal model, and ellipticity and could model antipodal PKIIKP phase because SEM is based on the full waveform theory. We discussed that the observed PKIIKP phase may be explained by the low P-wave velocity layer at the base of the outer core by using the synthetic seismograms calculated by SEM. We also discussed the existence of an S-wave discontinuity just below the inner core boundary by using the SEM synthetics in Butler and Tsuboi (2021) [7]. One of the advantages in using SEM to discuss the inner core structure is that the spectral-element method is implemented with the adjoint simulations to generate finite-frequency sensitivity kernels, which can be used to perform tomographic inversions for 3D Earth structure.
Here, we use our recent antipodal observations for PKIIKP and its precursors to compute the finite-frequency sensitivity kernels for a shear wave velocity structure on the inner core by using the spectral-element method. We discuss the spatial distribution of the sensitivity kernel to locate the possible fluid region at the surface of the inner core.

2. Antipodal Seismic Observation

Butler and Tsuboi (2021) [7] showed that the precursors of PKIIKP waves observed at the antipodal stations can be modeled as reflected below a liquid/solid interface at a depth of 100 km below the inner core boundary. We show in Supplementary Figure S1 phase-weighted stacking [20] for the arrivals between the PKIKP and PKIIKP phases shown in Butler and Tsuboi (2021) [7], which demonstrates that the precursors are clearly picked out of the noise. The liquid/solid interface we proposed is highly reflective and sensitive to shear wave velocity contrasts. Butler and Tsuboi (2021) [7] also showed that the earlier precursory waves observed by TAM and PTGA may be modeled as a clear discontinuity near the depth of about 250 km below the inner core surface. Assuming that the energy between PKIIKP and PKIKP propagates deeper and faster through the inner core than PKIIKP, the precursor wave may be called PKI100-IKP, reflecting its uncertain origin in the inner core. Butler and Tsuboi (2021) [7] proposed that the PKI100-IKP boundary needs to consider the three-dimensional structure at the top of the inner core in order to match the orthogonal paths of the TAM and ENH data at the same time.
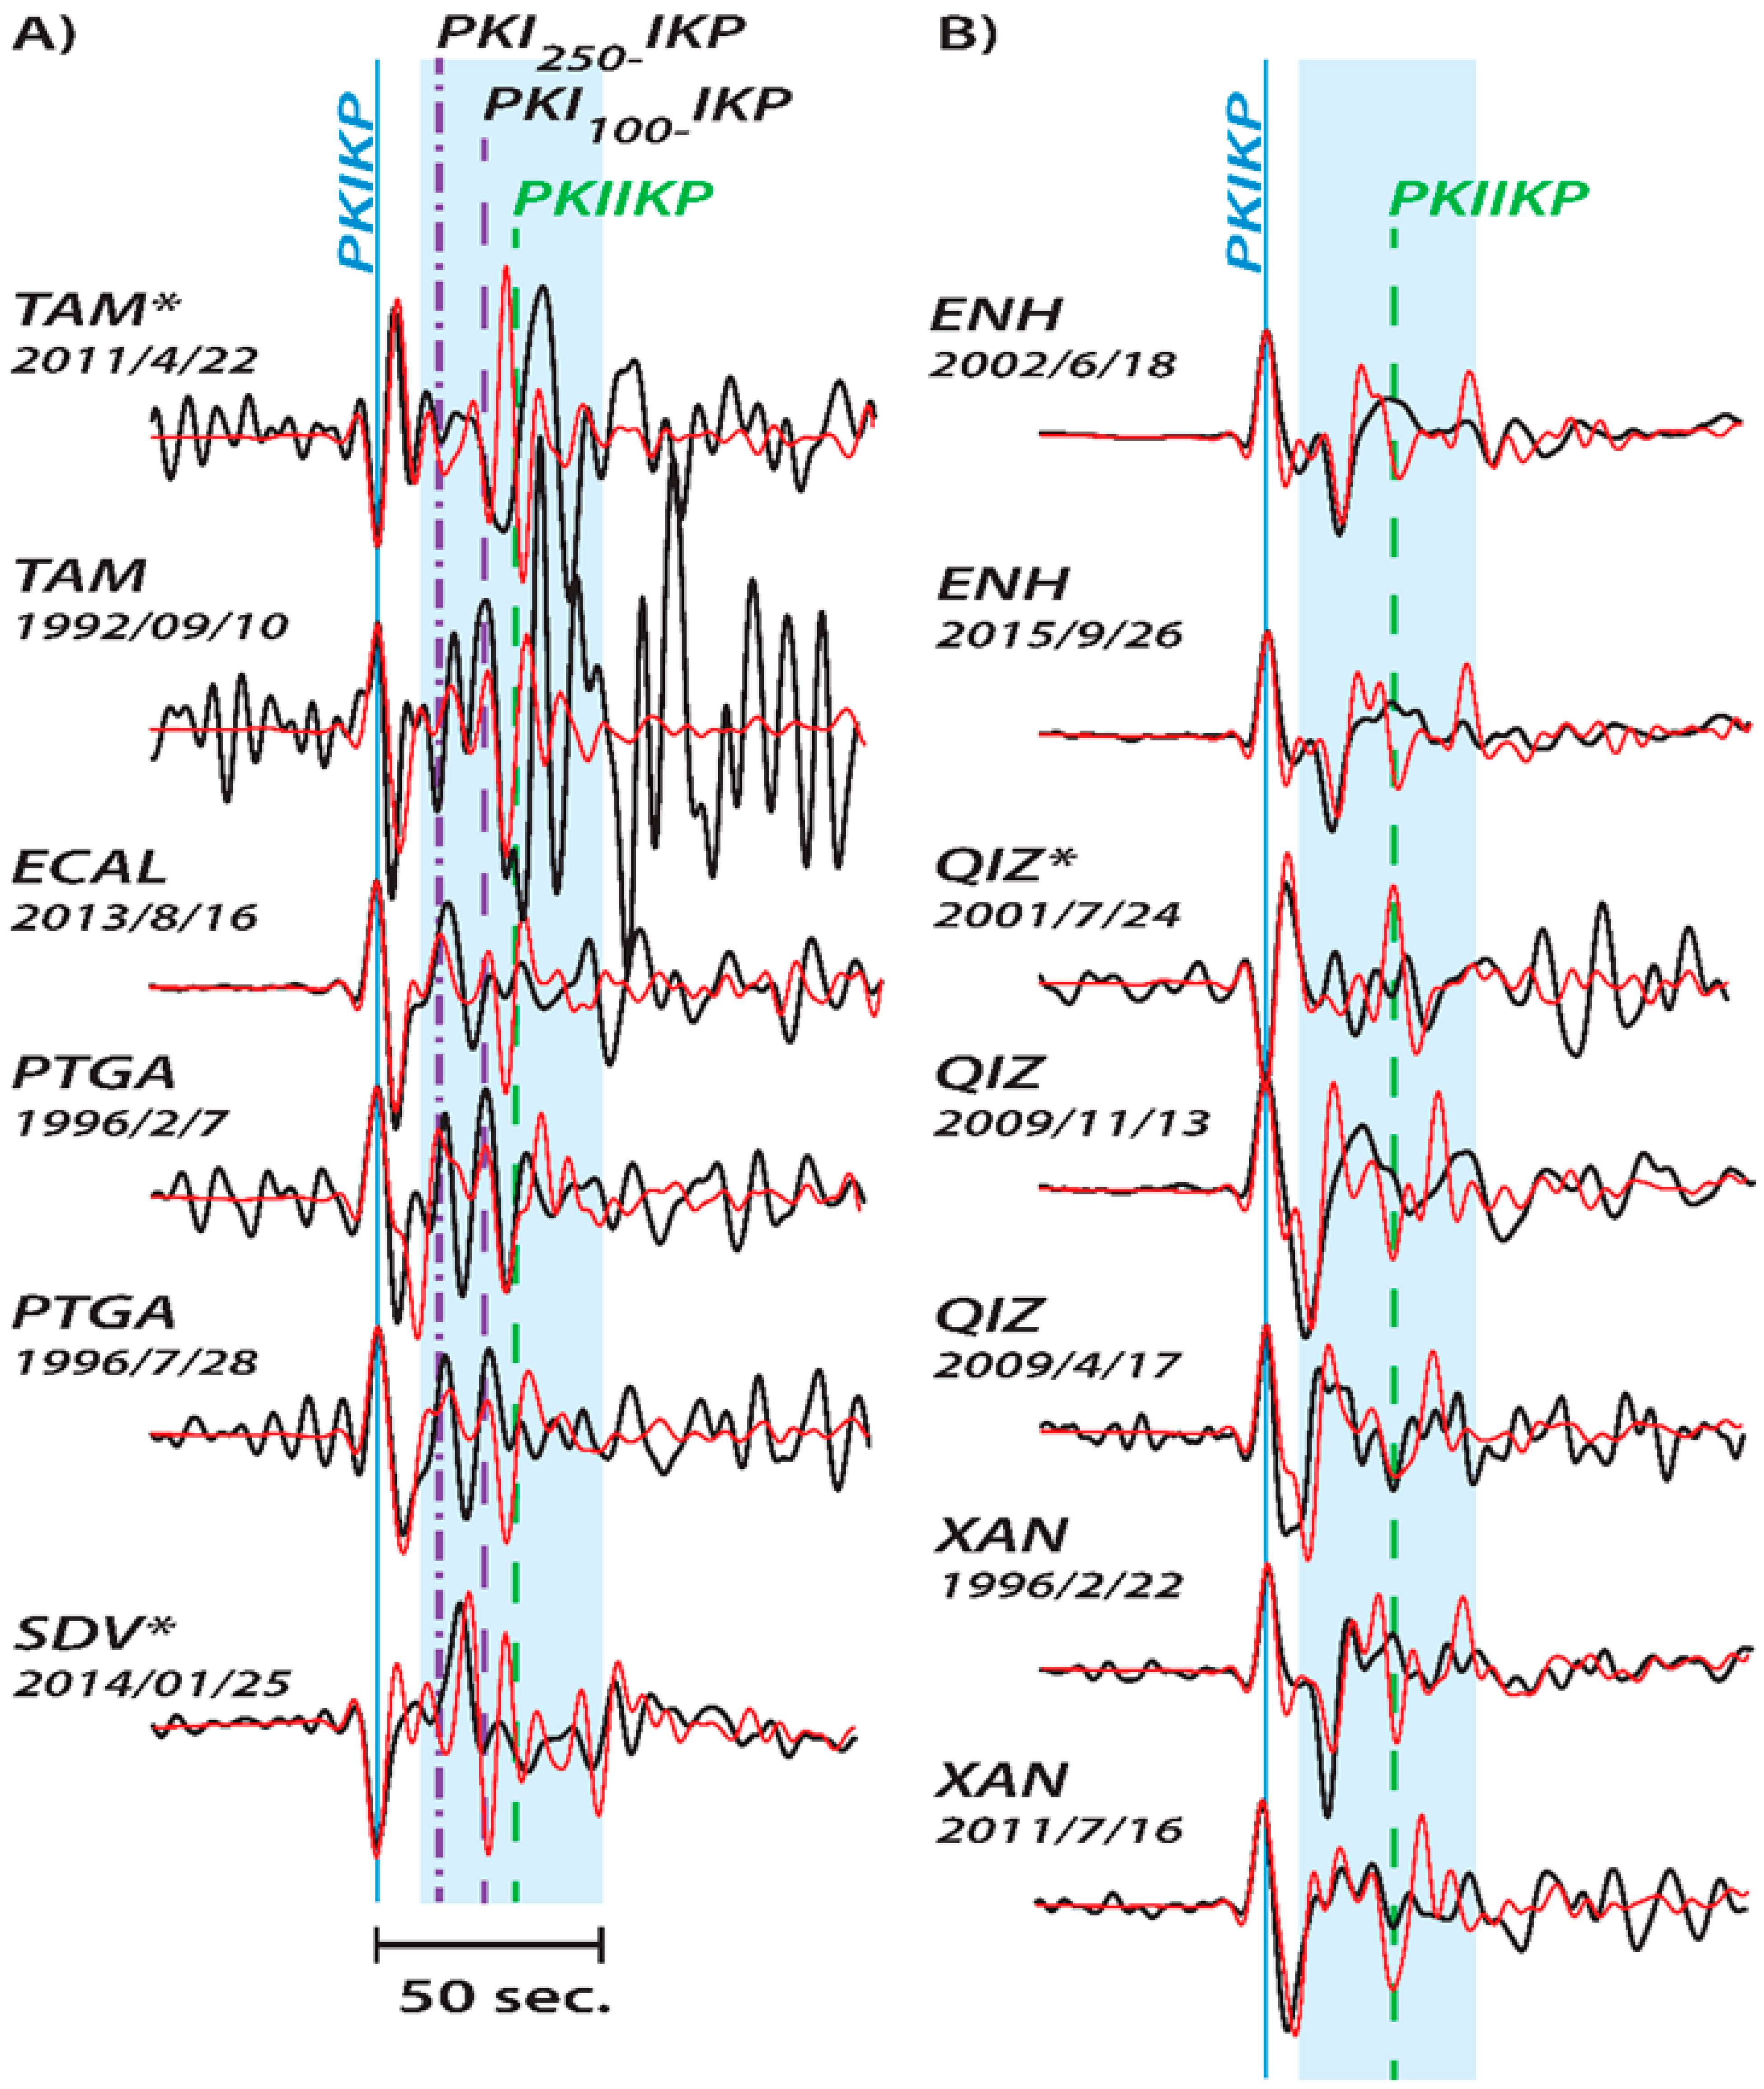
To investigate the three-dimensional structure of the proposed PKI100-IKP boundary at the top of the inner core, we use data from earthquake-receiver pairs studied in Butler and Tsuboi (2021) [7]—Tonga to a station in Algeria (TAM), Sulawesi to Amazon (PTGA), northern Chile to Hainan Island (QIZ), and central Chile to mainland China (ENH and XAN). In addition to these earthquake-receiver pairs, we also examined Spanish data (ECAL) from an earthquake in New Zealand and Venezuelan data (SDV) from an earthquake in Java. Figure 1 shows each epicenter and the antipodal observation point, and Table S1 shows the hypocenter and source-mechanism information of the earthquake used. Figure 2A,B show each of the broadband seismic waveform data used in the present study and synthetic seismograms computed by the spectral-element method. The model includes a 3D mantle model (s362wmani) [21], PREM [22] outer core, and PREM inner core. Both data and synthetic seismograms are identically bandpass-filtered between 50 and 8 s by using a 2-pole elliptical filter with a stopband attenuation of 100 dB.
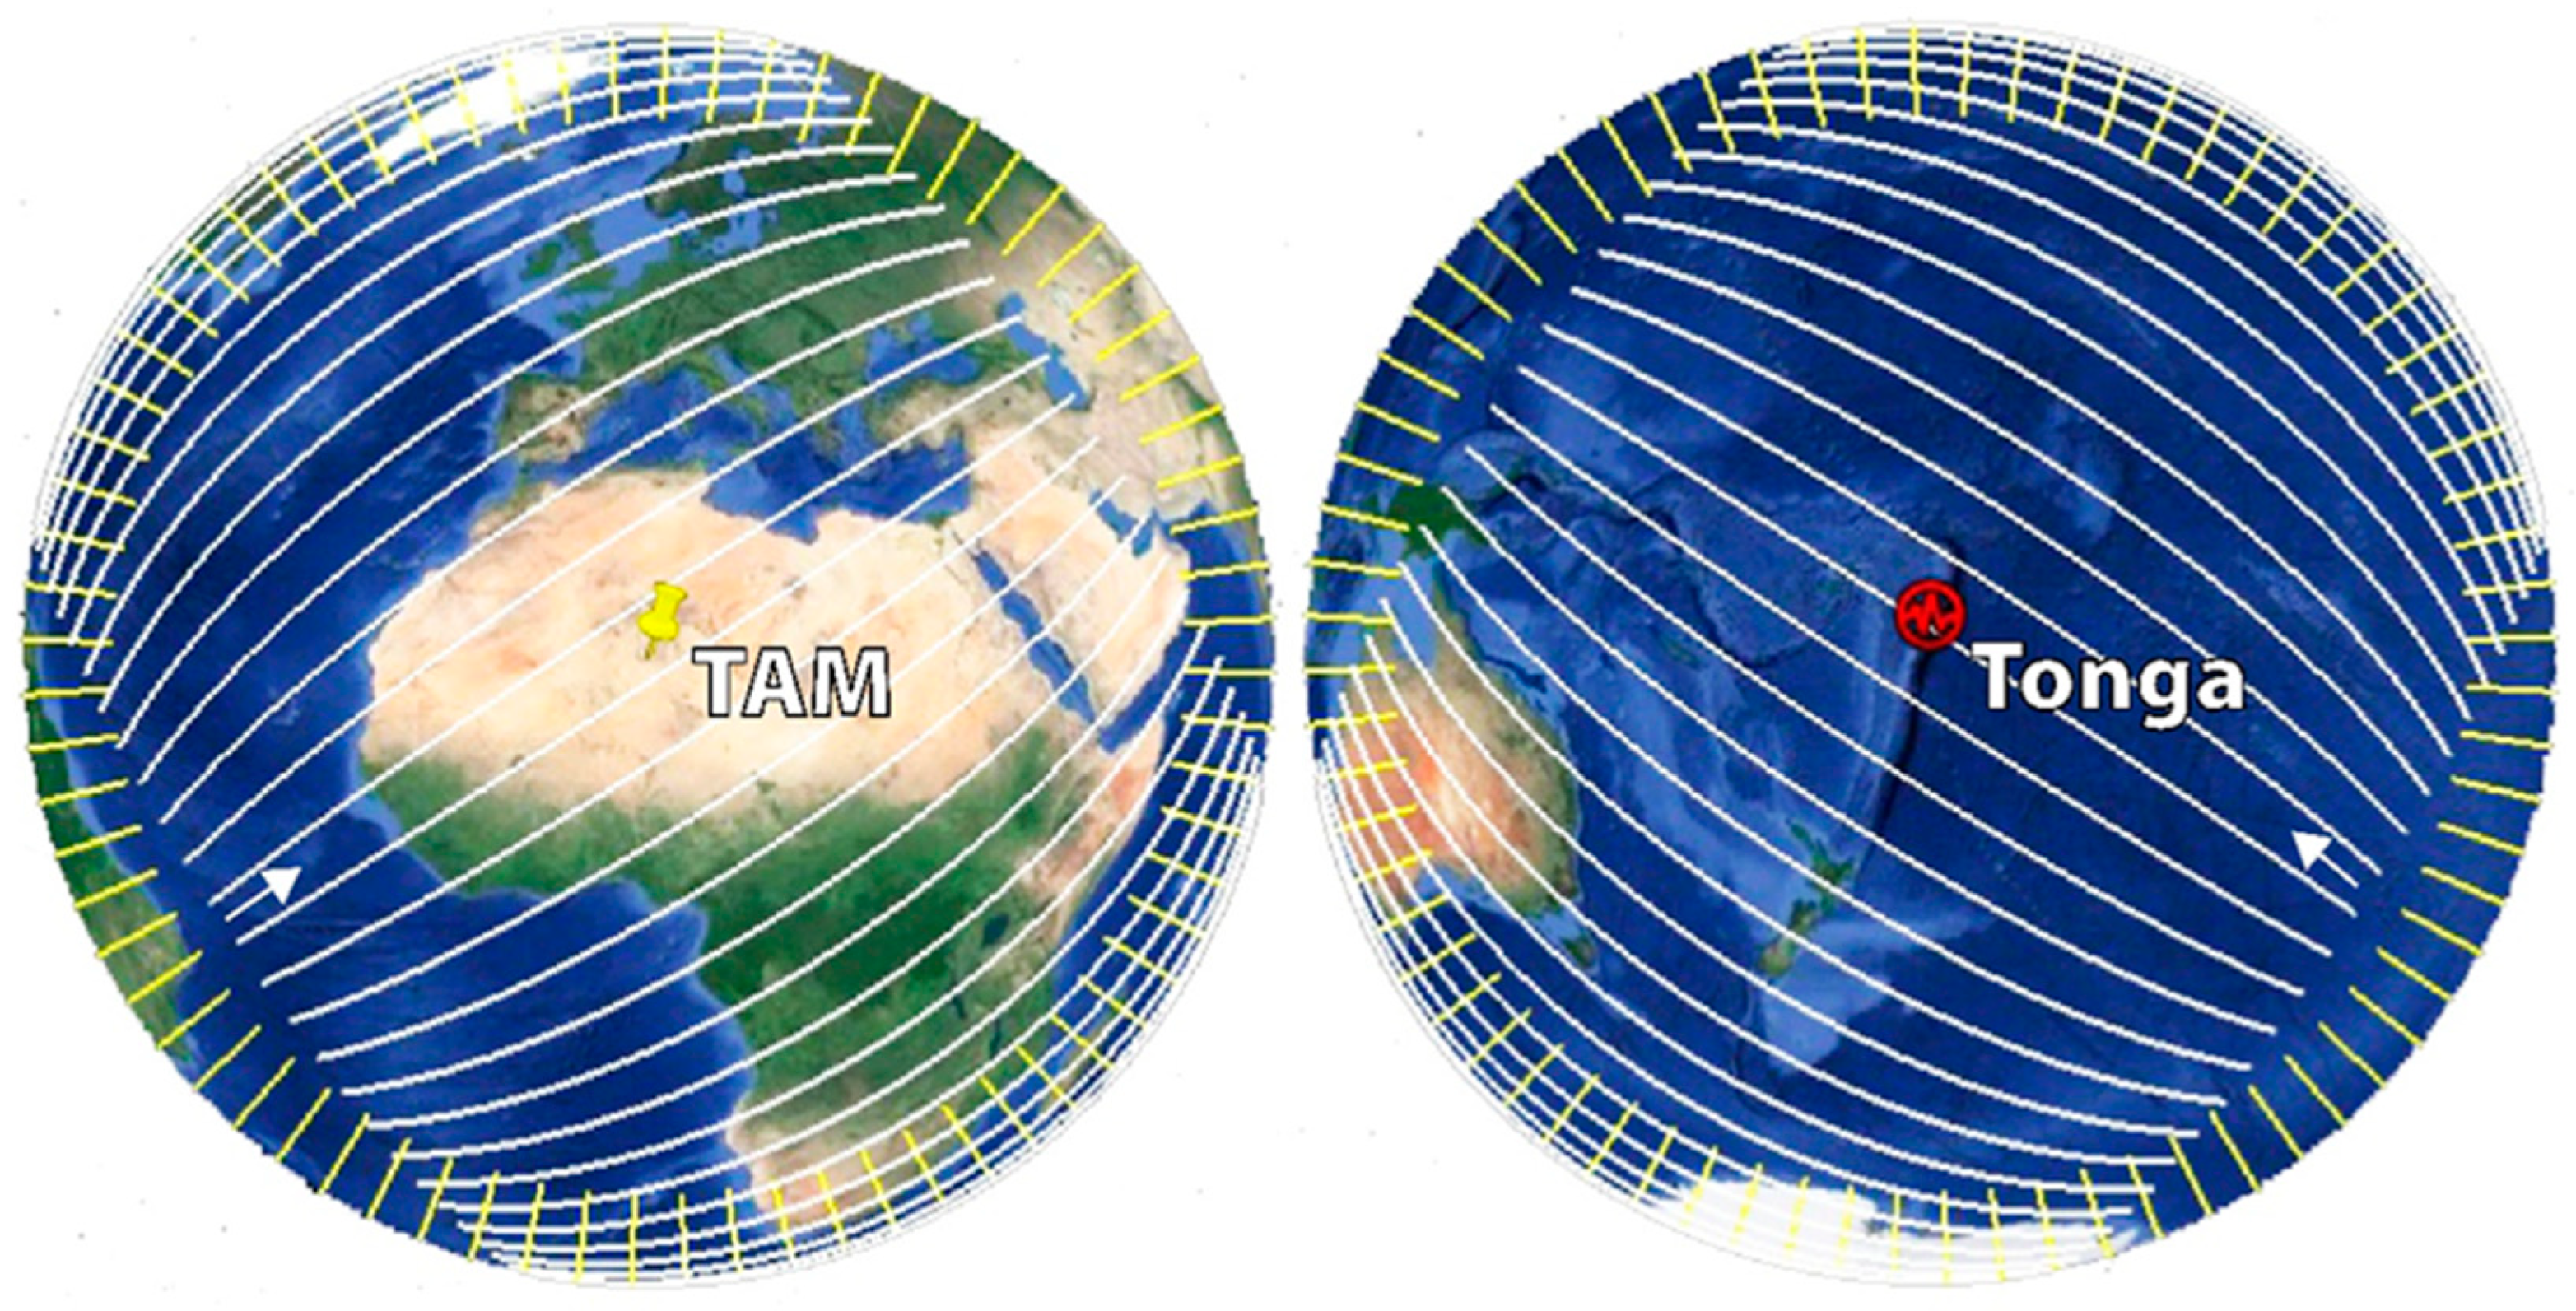
Figure 2A,B show that the waveform data from TAM and PTGA show significant arrivals between PKIKP and PKIIKP, about 7 and 17 s before PKIIKP. In contrast to TAM and PTGA data, for Chinese stations (QIZ, ENH, and XAN), no arrival of this waveform is seen. While the arrival between PKIKP and PKIIKP is significant in these bandpass-filtered seismograms, it may be necessary to check in the frequency domain if there is sufficient signal strength corresponding to these arrivals in our frequency passband. We show in the Supplementary Figure S2 that there exists enough strength signal for the observed seismograms. Figure 2A indicates approximate boundaries between observation points, with large seismic arrivals (TAM, PTGA, and ECAL) between PKIKP and PKIIKP, and Figure 2B shows small ones (XAN, ENH, and QIZ). These results show two groups: TAM, PTGA, and ECAL with a clear PKIIKP precursor and QIZ, ENH, XAN with no visible precursor. We show in Figure 3 and Supplementary Figures S3 and S4 the maps of PKIIKP and PKI100-IKP antipodal coverage of the upper inner core. These figures demonstrate that the Tonga–TAM diameter is orthogonal to the Chile–ENH diameter, and hence, the propagation surfaces are also orthogonal where the surfaces overlap, which may imply regional differences at the surface of the inner core. These lateral heterogeneities may generate observed differences in the PKIIKP phase. We try to locate these heterogeneities by using the sensitivity kernels computed by the adjoint method.

3. Sensitivity Kernels by Adjoint Method

In this study, we calculated the sensitivity kernel of shear wave velocity for the amplitude of PKIIKP and its precursor phases to be used in the waveform inversion using a liquid/solid boundary of S-wave velocity 100 km below the surface of the inner core as an initial model, and we tried to identify the position of the fluid region on the surface of the inner core. Although the number of earthquakes used is not large, the raypaths of the PKIIKP phase cover an annular surface within the upper inner core. Each of the earthquake-receiver pairs used in this study covers a ray-surface encompassing nearly 60% of the inner core surface, and the orthogonal, antipodal propagation surfaces—in total—encompass the whole of the top of the inner core [11].
To calculate the sensitivity kernels, we used the spectral-element method [16,17,18,19], as in our previous studies [11,14,15]. The model used for Earth’s internal structure incorporates a 3D tomography model (s362wmani) [21] for the Earth’s mantle, a crustal model CRUST2.0 [23], and ellipticity. Topography at the surface of the Earth, rotation, and the effect of the ocean were not included. By incorporating the 3D mantle and crust, the energy scattered from the structure above the core (e.g., the upper mantle, D′′, and the boundary between the core and mantle) was included in the SEM simulation. We calculated the sensitivity kernel of the inner core shear wave structure for the amplitude of precursor waves. In order to do so, we included a spherically symmetric shear wave structure, Vs = 0.5 km/s, from the inner core surface to a depth of 100 km, and it follows a PREM model below the depth 100 km. We did not modify the P-wave structure from the PREM model. The spectral element method program, specfem3d_globe, was used, and the number of elements at the surface along the two sides of block, NEX_XI, was set to 640. We used 9600 cores of the Earth simulator to calculate the theoretical seismic waveform, which is accurate to the shortest period of about 7 s.
The calculation of the finite-frequency sensitivity kernel of the inner core shear wave velocity structure was performed by the adjoint method [24,25,26,27,28,29,30]. The finite-frequency sensitivity kernel calculation was performed in two steps. First, for the earthquakes shown in Table S1, the hypocenter of the global CMT mechanism [31] was used to calculate the theoretical seismic waveform for the seismic station at the antipodal point corresponding to each earthquake. At this time, the global wave fields at the end of the time step in which the theoretical seismic waveform was calculated were saved in the disk. We applied the same bandpass filter with a period of 8 s and 50 s to both theoretical seismograms and observed seismograms. From the calculated seismic waveforms and observed waveforms, we set the time window of the arrival of PKIIKP waves and PKI100-IKP waves and cut out these waveforms (approximately the blue interval in Figure 2). We calculated the adjoint source for the amplitude of the seismic waveform from the difference between the observed waveform and the theoretical waveform. Since the accuracy of the theoretical seismic waveform used here was about 6.8 s, it is not possible to identify the PKIIKP wave and the PKI100-IKP wave independently, so when cutting out the waveform, we set the window to include both of these phases. Then, using the adjoint source obtained in this way, the theoretical seismic waveform that propagates backward from the observation station to the seismic source was calculated by reversing the time. We calculated the finite-frequency kernel of the shear wave velocity in the inner core for the amplitude of the PKIIKP and PKI100-IKP waves for the path combining the propagation of the seismic waves from the source to the observation station used from the theoretical seismic waveform calculated beforehand. Tromp et al. (2005) [24] claimed that the sensitivity of the event kernel becomes high at regions near the source and receiver. To accommodate this characteristic, we normalized the event kernel by the value at deeper structures, such as the top of the inner core, keeping the sensitivity for the target region at the inner core.
A cross-sectional view of the sensitivity kernel of the shear wave velocity structure of the amplitude with respect to the PKI100-IKP wave is shown in Figure 4A. Figure 4B shows both the theoretical seismic waveform and the observed waveform for the 16 August 2013 earthquake in New Zealand observed at the ECAL station in Spain. The adjoint source of the amplitude for the PKIIKP and PKI100-IKP waves is shown in Figure 4C. Figure 4A confirms that the kernels are sensitive along the raypaths of PKIIKP phases. Since we focus on the shear wave velocity structure along the surface of the inner core, and we already included 3D mantle structure in our computation, we assume that the amplitudes of the PKIIKP and PKI100-IKP waves are sensitive to the shear wave velocity structure of the incident point and exit point of the inner core surface as these waves pass through the inner core. The adjoint kernel calculated for such an earthquake and its antipodal observation point is called an event kernel. For each of the twelve seismic source-receiver pairs used here, the event kernel for the shear wave velocity structure in the inner core was calculated. By adding the event kernels calculated in this way, the gradient of the misfit function to improve the initial model was calculated.

4. Location of Fluid Region at the Surface of the Inner Core

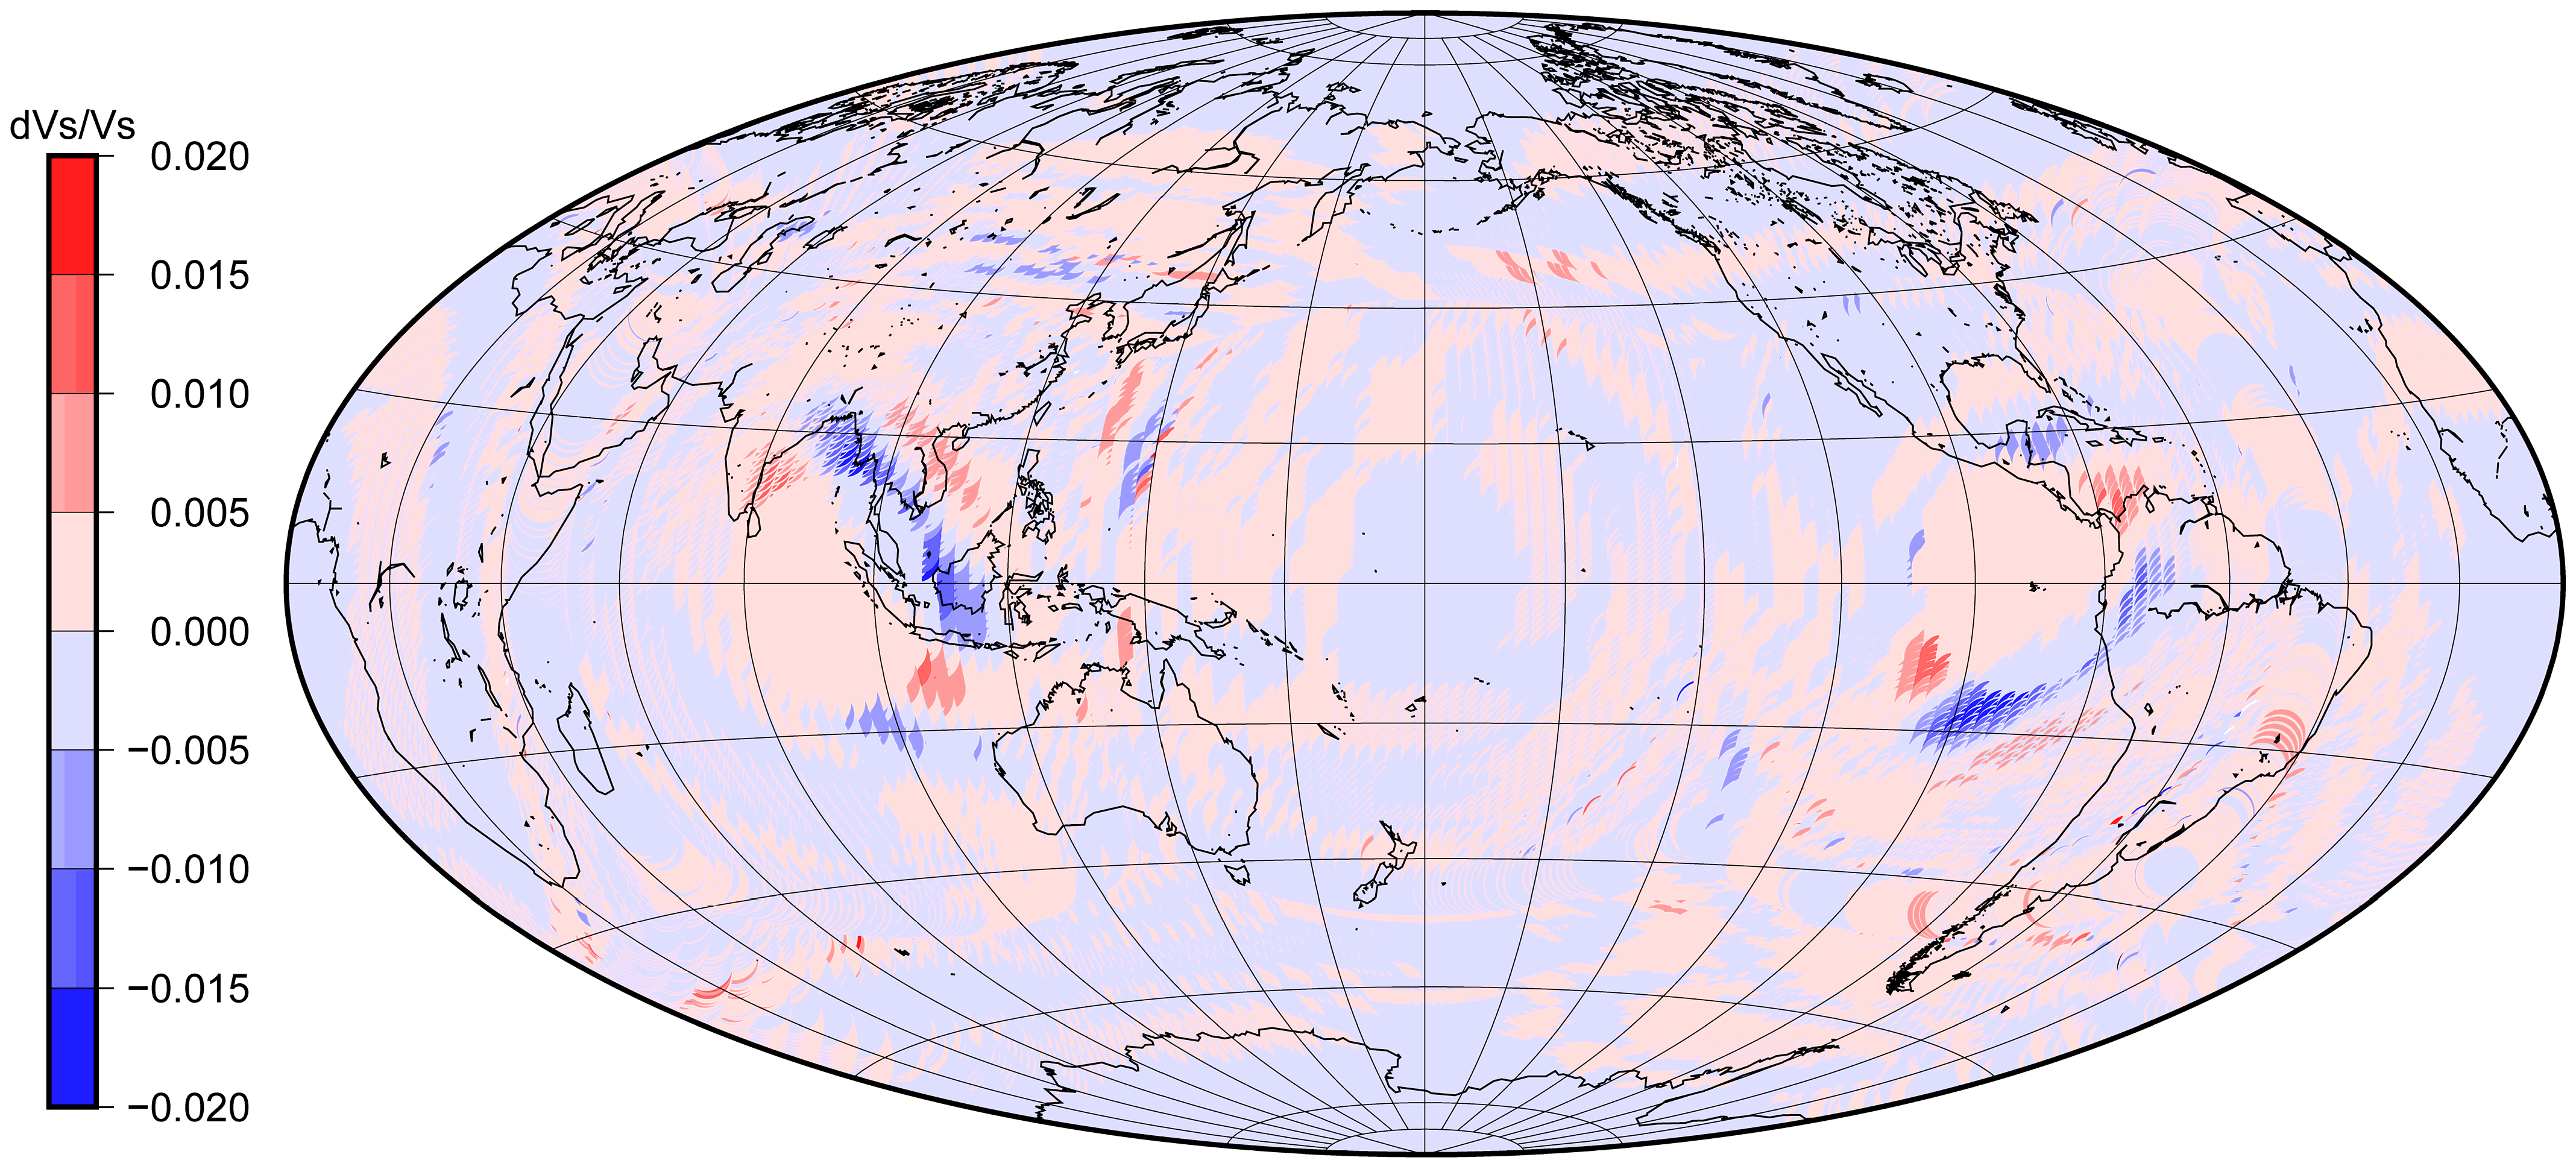
Using the gradient of the misfit function, we can find the change δm that updates the model. Here, assuming that the initial model is updated with a step length of 10%, the amount of modification of the model for the shear wave structure of the inner core was calculated. Figure 5 shows the amount of modification of the shear wave velocity structure in the upper 150 km of the inner core. The figure shows that the vicinities of South America and Indonesia need to be modified to slow down the shear wave velocity structure near the inner core surface by up to 1% from the initial model. Since the shear wave velocity of the initial model is 0.5 km/s, these locations can be considered as regions of fluid where the shear wave velocity is close to zero. In addition, it was shown that, surrounding these regions construed as fluid, there are alterations increasing the shear wave velocity, which may be construed as a region closer to a solid. In full waveform inversion using the sensitivity kernel, once the updates to the initial model were obtained, the inner core shear wave structure was calculated by modifying the model. Then, we calculated the sensitivity kernel again, repeating this process until the difference between the observed waveform and the theoretical waveform was minimized. By iterating this process repeatedly, the 3D variation of the shear wave velocity structure of the inner core was obtained. However, the amount of modification to the inner core shear wave velocity structure was small in this case, and the initial model used the assumption that the inner core surface was almost fluid. Therefore, here, we did not repeat the procedure, but we discuss the location of the fluid region at the surface of the inner core surface layer estimated from this modification.
Previous studies have shown little evidence of P-wave discontinuities near depths of 100 km in the inner core [32,33,34,35]. Cormier and Attanayake (2013) [36] found a 1% Vp discontinuity under 140 km of the inner core boundary centered under the Atlantic Ocean but not elsewhere. Complexities such as 3D structure and anisotropy have been clearly expressed in previous P-wave studies [37,38,39], but the details of the inner core S-wave structure remain unelucidated. It is interesting to note that the equatorial heterogeneities in our model (Figure 5) derived from the shear wave kernel are located proximally to anisotropic regions of inner core growth and translation inferred by Frost et al. (2021) [40]. Butler and Tsuboi (2021) [7] showed that the precursors of the PKIIKP waves observed at the antipodal point can be successfully modeled as reflected below the liquid/solid interface at a depth of 100 km below the inner core boundary. It is suggested that the newly proposed PKI100-IKP boundary is not the same everywhere at the surface of the inner core because the precursors of the PKIIKP wave do not appear for the Chinese stations. Therefore, in order to match both TAM and ENH at the same time, it is necessary to consider a heterogenous shear wave velocity structure at the top of the inner core, and it is suggested that the fluid region at the top of the inner core should be localized. The two regions where there are possibilities of fluid, as shown in Figure 5, coincide with the positions of the broad upwelling localized on the inner core surface shown by Gubbins et al. (2011) [5] in the Earth’s dynamo simulation. Their geodynamo simulation is assumed to be related to the seismic velocity anomalies at the core–mantle boundary, which are supposed to be linked to the mantle convection. It also should be noted that the heterogenous shear wave structure, such as large low-velocity provinces (LLVPs), at the base of the mantle may affect the computation of the sensitivity kernels. We used a 3D mantle model to calculate our synthetic seismograms, but there is a possibility that they are not fully modeled in the 3D mantle model. How to evaluate the effect of the heterogeneous structure at the base of the mantle may be our future task for study.

5. Results and Discussion

Although it is not clear if the mantle heterogeneity can span the fluid core [41,42], the laboratory experiments [43,44] may suggest a flow pattern in the outer core that may relate to mantle heterogeneity, and it is intriguing that the completely independent analysis of the seismic waves reflected from the inner core surface, which we proposed in the present paper, yields results suggesting the same regions. Because the flow pattern at the inner core surface derived by the geodynamo simulation is linked to the core mantle boundary through outer core fluid motion, our results may be consistent with the inner core locked to the mantle through the geodynamo fluid motion in the outer core. One of the suggested fluid regions—near the confluence of reflective surfaces for TAM, PTGA, and ECAL in Figure S4—at the surface of the inner core also corresponds to the geomagnetic anomaly observed at the surface of the Earth, i.e., the South Atlantic anomaly (Finlay et al., 2020) [45], which was thought to be linked to the anomaly at the core–mantle boundary. If the geomagnetic anomaly is also linked to the seismic velocity anomaly at the surface of the inner core, it also may provide evidence that the inner core is locked to the mantle. The geodynamo simulation shows that there are relatively large areas of negative (melting) and low-positive heat flux on the ICB and relatively small areas of strong-positive heat flux (freezing). Therefore, the dynamo simulation suggests that the possible fluid region suggested by our study corresponds to a solidified part, which is inconsistent with our results. This may require a different interpretation of the Earth’s dynamo mechanism.
In this study, we did not repeat the iteration to obtain 3D shear velocity structure in the inner core because the number of seismic observation combinations used was small, and the amount of modification of the initial model by full waveform inversion was small. The resolution of fluid regions of the inner core surface suggested in this study may depend on the distribution of seismic sources. Then, we need to repeat the iteration by increasing the number and distribution of source-receiver pairs in the future. It is desirable to estimate the shear wave velocity structure of the inner core surface layer three-dimensionally by repeating the waveform inversion using the finite-frequency sensitivity kernels.

Supplementary Materials

The following supporting information can be downloaded at https://www.mdpi.com/article/10.3390/geosciences14120333/s1.

Author Contributions

S.T., methodology, investigation, software, and writing—review and editing; R.B., conceptualization, methodology, data curation, visualization, and writing. All authors have read and agreed to the published version of the manuscript.

Funding

This work is partially supported by Japan Society for the Promotion of Science (JSPS) KAKENHI Grant Number JP21K03710.

Data Availability Statement

Data were obtained from GEOSCOPE and the IRIS Data Management System. We used the computer program (SPECFEM3D) for spectral-element method. Centroid moment tensor solutions (GCMT) were used for synthetic models. All data were downloaded from the IRIS Data Management System and ORFEUS. Earthquake parametric data were downloaded from the USGS earthquake catalog and tabulated in the Supplementary Information file. Earthquake source mechanisms were downloaded from the Global Centroid Moment Tensor database. The datasets used and/or analyzed during the current study are available from the corresponding author on reasonable request.

Acknowledgments

We thank Daniel Peter for his assistance in computing sensitivity kernels by adjoint method. All the computations are performed using the Earth Simulator at the Earth Simulator Center of JAMSTEC. We thank GEOSCOPE, USGS and NSF, NCDSN China, and the Spanish Digital Seismic Network for the operation and maintenance of the seismic stations used in this study. SOEST contribution number 11881 and HIGP contribution number 2501.

Conflicts of Interest

The authors declare that the research was conducted in the absence of any commercial or financial relationships that could be constructed as a potential conflicts of interest.

References

  1. Biggin, A.J.; Piispa, E.J.; Pesonen, L.J.; Holme, R.; Paterson, G.A.; Veikkolainen, T.; Tauxe, L. Palaeomagnetic field intensity variations suggest Mesoproterozoic inner-core nucleation. Nature 2015, 526, 245–248. [Google Scholar] [CrossRef] [PubMed]
  2. Fearn, D.R.; Loper, D.E.; Roberts, P.H. Structure of the Earth’s inner core. Nature 1981, 292, 232–233. [Google Scholar] [CrossRef]
  3. Huguet, L.; Alboussière, T.; Bergman, M.I.; Deguen, R.; Labrosse, S.; Lesœur, G. Structure of a mushy layer under hypergravity with implications for Earth’s inner core. Geophys. J. Int. 2016, 204, 1729–1755. [Google Scholar] [CrossRef]
  4. Shih, S.A.; Chao, B.F. Inner core and its libration under gravitational equilibrium: Implications to lower-mantle density anomaly. J. Geophys. Res. Solid. Earth 2021, 126, e2020JB020541. [Google Scholar] [CrossRef]
  5. Gubbins, D.; Sreenivasan, B.; Mound, J.; Rost, S. Melting of the Earth’s inner core. Nature 2011, 473, 361–363. [Google Scholar] [CrossRef]
  6. Alboussière, T.; Deguen, R.; Melzani, M. Melting-induced stratification above the Earth’s inner core due to convective translation. Nature 2010, 466, 744–747. [Google Scholar] [CrossRef]
  7. Butler, R.; Tsuboi, S. Antipodal seismic reflections upon shear wave velocity structures within Earth’s inner core. Phys. Earth Planet. Inter. 2021, 321, 106802. [Google Scholar] [CrossRef]
  8. Rial, J.A.; Cormier, V.F. Seismic waves at the epicenter’s antipode. J. Geophys. Res. Solid. Earth 1980, 85, 2661–2668. [Google Scholar] [CrossRef]
  9. Butler, R. Amplitudes at the antipode. Bull. Seism. Soc. Am. 1986, 76, 1355–1365. [Google Scholar] [CrossRef]
  10. Niu, F.; Chen, Q.-F. Seismic evidence for distinct anisotropy in the innermost inner core. Nat. Geosci. 2008, 1, 692–696. [Google Scholar] [CrossRef]
  11. Butler, R.; Tsuboi, S. Antipodal seismic observations of temporal and global variation at Earth’s inner-outer core boundary. Geophys. Res. Lett. 2010, 37, L11301. [Google Scholar] [CrossRef]
  12. Cormier, V.F. Detection of inner core solidification from observations of antipodal PKIIKP. Geophys. Res. Lett. 2015, 42, 7459–7466. [Google Scholar] [CrossRef]
  13. Attanayake, J.; Thomas, C.; Cormier, V.F.; Miller, M.S.; Koper, K.D. Irregular transition layer beneath the Earth’s inner core boundary from observations of antipodal PKIKP and PKIIKP waves. Geochem. Geophys. Geosystems 2018, 19, 3607–3622. [Google Scholar] [CrossRef]
  14. Tsuboi, S.; Butler, R. Inner core differential rotation inferred from antipodal seismic observations. Phys. Earth Planet. Inter. 2020, 301, 106451. [Google Scholar] [CrossRef]
  15. Butler, R.; Tsuboi, S. Antipodal observations of global differential times of diffracted P and PKPAB within the D″ layer above Earth’s core–mantle boundary. Geophys. J. Int. 2020, 222, 327–337. [Google Scholar] [CrossRef]
  16. Komatitsch, D.; Vilotte, J.-P. The spectral element method: An efficient tool to simulate the seismic response of 2D and 3D geological structures. Bull. Seism. Soc. Am. 1998, 88, 368–392. [Google Scholar] [CrossRef]
  17. Komatitsch, D.; Ritsema, J.; Tromp, J. The spectral-element method, Beowulf computing, and global seismology. Science 2002, 298, 1737–1742. [Google Scholar] [CrossRef]
  18. Tsuboi, S.; Komatitsch, D.; Ji, C.; Tromp, J. Broadband modeling of the 2002 Denali fault earthquake on the Earth Simulator. Phys. Earth Planet. Inter. 2003, 139, 305–313. [Google Scholar] [CrossRef]
  19. Komatitsch, D.; Tsuboi, S.; Tromp, J. The spectral-element in seismology. In Seismic Earth: Array Analysis of Broadband Seismograms; Levander, A., Nolet, G., Eds.; AGU Geophysical Monograph 157; AGU: Washington, DC, USA, 2005; pp. 205–227. [Google Scholar]
  20. Schimmel, M.; Paulssen, H. Noise reduction and detection of weak, coherent signals through phase-weighted stacks. Geophys. J. Int. 1997, 130, 497–505. [Google Scholar] [CrossRef]
  21. Kustowski, B.; Ekström, G.; Dziewoński, A.M. Anisotropic shear-wave velocity structure of the Earth’s mantle: A global model. J. Geophys. Res. Solid. Earth 2008, 113, B06306. [Google Scholar] [CrossRef]
  22. Dziewonski, A.M.; Anderson, D.L. Preliminary reference Earth model. Phys. Earth Planet. Inter. 1981, 25, 297–356. [Google Scholar] [CrossRef]
  23. Bassin, C.; Laske, G.; Masters, G. The current limits of resolution for surface wave tomography in North America. Eos Trans. AGU 2000, 81, F897. [Google Scholar]
  24. Tromp, J.; Tape, C.; Liu, Q. Seismic tomography, adjoint methods, time reversal and banana-doughnut kernels. Geophys. J. Int. 2004, 160, 195–216. [Google Scholar] [CrossRef]
  25. Tromp, J.; Komatitsch, D.; Liu, Q. Spectral-element and adjoint methods in seismology. Commun. Comput. Phys. 2008, 3, 1–32. [Google Scholar]
  26. Liu, Q.; Tromp, J. Finite-frequency kernels based on adjoint methods. Bull. Seism. Soc. Am. 2006, 96, 2383–2397. [Google Scholar] [CrossRef]
  27. Liu, Q.; Tromp, J. Finite-frequency sensitivity kernels for global seismic wave propagation based upon adjoint methods. Geophys. J. Int. 2008, 174, 265–286. [Google Scholar] [CrossRef]
  28. Tape, C.; Liu, Q.; Tromp, J. Finite-frequency tomography using adjoint methods-Methodology and examples using membrane surface waves. Geophys. J. Int. 2007, 168, 1105–1129. [Google Scholar] [CrossRef]
  29. Tape, C.; Liu, Q.; Maggi, A.; Tromp, J. Adjoint tomography of the southern California crust. Science 2009, 325, 988–992. [Google Scholar] [CrossRef] [PubMed]
  30. Peter, D.; Komatitsch, D.; Luo, Y.; Martin, R.; Le Goff, N.; Casarotti, E.; Le Loher, P.; Magnoni, F.; Liu, Q.; Blitz, C.; et al. Forward and adjoint simulations of seismic wave propagation on fully unstructured hexahedral meshes. Geophys. J. Int. 2011, 186, 721–739. [Google Scholar] [CrossRef]
  31. Ekström, G.; Nettles, M.; Dziewoński, A. The global CMT project 2004–2010: Centroid-moment tensors for 13,017 earthquakes. Phys. Earth Planet. Inter. 2012, 200, 1–9. [Google Scholar] [CrossRef]
  32. Stroujkova, A.; Cormier, V.F. Regional variations in the uppermost 100 km of the Earth’s inner core. J. Geophys. Res. 2004, 109, B10307. [Google Scholar] [CrossRef]
  33. Leyton, F.; Koper, K.D.; Zhu, L.; Dombrovskaya, M. On the lack of seismic discontinuities within the inner core. Geophys. J. Int. 2005, 162, 779–786. [Google Scholar] [CrossRef]
  34. Yu, W.C.; Wen, L. Seismic velocity and attenuation structures in the top 400 km of the Earth’s inner core along equatorial paths. J. Geophys. Res. Solid. Earth 2006, 111, B07308. [Google Scholar] [CrossRef]
  35. Cormier, V.F.; Attanayake, J.; He, K. Inner core freezing and melting: Constraints from seismic body waves. Phys. Earth Planet. Inter. 2011, 188, 163–172. [Google Scholar] [CrossRef]
  36. Cormier, V.F.; Attanayake, J. Earth’s solid inner core: Seismic implications of freezing and melting. J. Earth Sci. 2013, 24, 683–698. [Google Scholar] [CrossRef]
  37. Tanaka, S.; Hamaguchi, H. Degree one heterogeneity and hemispherical variation of anisotropy in the inner core from PKP(BC)–PKP(DF) times. J. Geophys. Res. 1997, 102, 2925–2938. [Google Scholar] [CrossRef]
  38. Ishii, M.; Dziewoński, A.M. The innermost inner core of the earth: Evidence for a change in anisotropic behavior at the radius of about 300 km. Proc. Natl. Acad. Sci. USA 2002, 99, 14026–14030. [Google Scholar] [CrossRef]
  39. Waszek, L.; Deuss, A. Distinct layering in the hemispherical seismic velocity structure of Earth’s upper inner core. J. Geophys. Res. Solid. Earth 2011, 116, B12313. [Google Scholar] [CrossRef]
  40. Frost, D.A.; Lasbleis, M.; Chandler, B.; Romanowicz, B. Dynamic history of the inner core constrained by seismic anisotropy. Nat. Geosci. 2021, 14, 531–535. [Google Scholar] [CrossRef]
  41. Davies, C.J.; Mound, J.E. Mantle-induced temperature anomalies do not reach the inner core boundary. Geophys. J. Int. 2019, 219, S21–S32. [Google Scholar] [CrossRef]
  42. Sahoo, S.; Sreenivasan, B. Response of Earth’s magnetic field to large lower mantle heterogeneity. Earth Planet. Sci. Lett. 2020, 549, 116507. [Google Scholar] [CrossRef]
  43. Sumita, I.; Olson, P. A laboratory model for convection in Earth’s core driven by a thermally heterogeneous mantle. Science 1999, 286, 1547–1549. [Google Scholar] [CrossRef] [PubMed]
  44. Sumita, I.; Olson, P. Rotating thermal convection experiments in a hemispherical shell with heterogeneous boundary heat flux: Implications for the Earth’s core. J. Geophys. Res. 2002, 107, 2169. [Google Scholar] [CrossRef]
  45. Finlay, C.C.; Kloss, C.; Olsen, N.; Hammer, M.D.; Tøffner-Clausen, L.; Grayver, A.; Kuvshinov, A. The CHAOS-7 geomagnetic field model and observed changes in the South Atlantic Anomaly. Earth Planets Space 2020, 72, 156. [Google Scholar] [CrossRef]
Figure 1. The map displays the locations of seismic stations (blue circles) and corresponding antipodal earthquakes (red stars, see Table S1).
Geosciences 14 00333 g001
Figure 2. Observed antipodal data (>179°) are shown (black) for thirteen earthquake-receiver pairs, which are used to derive the sensitivity kernel for the shear wave velocity structure on the inner core surface. For each earthquake-receiver pair, the red traces plot the SEM synthetic waveform. Arrival times of inner core phases are determined by the phase-weighted stacks in Figure S1. All traces are aligned on PKIKP (blue line), and amplitudes are normalized to PKIKP. Note that three events (TAM*, QIZ*, and SDV*) are normal earthquakes. In the analysis, both data and SEM are identically bandpass-filtered between 50 and 8 s. The timing of the inner core phases, PKIIKP (dashed green line), and interior reflected phases PKI100-IKP and PKI250-IKP (both in dashed violet) are indicated. For events in the left column (A), the inner core arrivals PKI100-IKP and PKI250-IKP are observed as located by the stacking procedure (Figure S1), whereas in the right column (B), these arrivals are poorly or not expressed at all. The light-blue shading approximates the time interval used to calculate the adjoint source. We note that the 1992/9/10 TAM event is one of three nearly identical events discussed in Butler and Tsuboi (2010) [11] and Tsuboi and Butler (2020) [15].
Geosciences 14 00333 g002
Figure 3. Map of PKIIKP and PKI100-IKP antipodal coverage of the upper inner core (>99%) for TAM and ENH, projected upwards to the Earth’s surface. The phases propagate as ray surfaces in the inner core, enveloping the region between entry to and exit from the inner core. To display the surface, we subdivided it into “stripes” at 5° azimuthal intervals—the Tonga–TAM path is yellow, and the Chile–ENH path is white. The earthquake sources are indicated by the red symbols, whereas the push-pins show the location of TAM, colored yellow. For this pair of paths, the Tonga–TAM diameter is orthogonal to the Chile–ENH diameter, and hence, the propagation surfaces are also orthogonal where the surfaces overlap. Figure S3 shows four additional perspectives of the antipodal paths for TAM and ENH. These surfaces mark where the propagation travel times of the waves are most sensitive to the compressional velocity.
Geosciences 14 00333 g003
Figure 4. (A) A cross-sectional view of the event sensitivity kernel of the shear wave velocity structure of the amplitude with respect to the PKIIKP and PKI100-IKP wave is shown. The vertical axis is parallel to the rotation axis with the top representing north. The location of the New Zealand earthquake is in the lower right and the station ECAL in the upper left. The sensitivity kernel shows that the amplitude of the PKIIKP and PKI100-IKP wave is sensitive to the shear wave velocity structure along the raypath of PKIIKP wave (Figure 1), which samples down to around 250 km depth below the top of the inner core. (B) The theoretical seismic waveform (red) and the observed waveform (black) for the 16 August 2013 earthquake in New Zealand were observed at the ECAL station in Spain. (C) The adjoint source is shown for the PKIIKP and PKI100-IKP waves. These traces were ground displacement- and bandpass-filtered between periods 8 and 50 s.
Geosciences 14 00333 g004
Figure 5. Map of percentage of shear velocity modification to be made to the initial model. This corresponds to the modification to the model from a depth of 100 km from the surface of the inner core. The red (faster) region corresponds to freezing/solid areas, and the blue corresponds to (slower) melting/liquid areas.
Geosciences 14 00333 g005
Disclaimer/Publisher’s Note: The statements, opinions and data contained in all publications are solely those of the individual author(s) and contributor(s) and not of MDPI and/or the editor(s). MDPI and/or the editor(s) disclaim responsibility for any injury to people or property resulting from any ideas, methods, instructions or products referred to in the content.