
Back Analysis of Rainfall-Induced Landslide in Cimanggung District of Sumedang Regency in West Java Using Deterministic and Probabilistic Analyses

 , , , ,
Abstract
1. Introduction
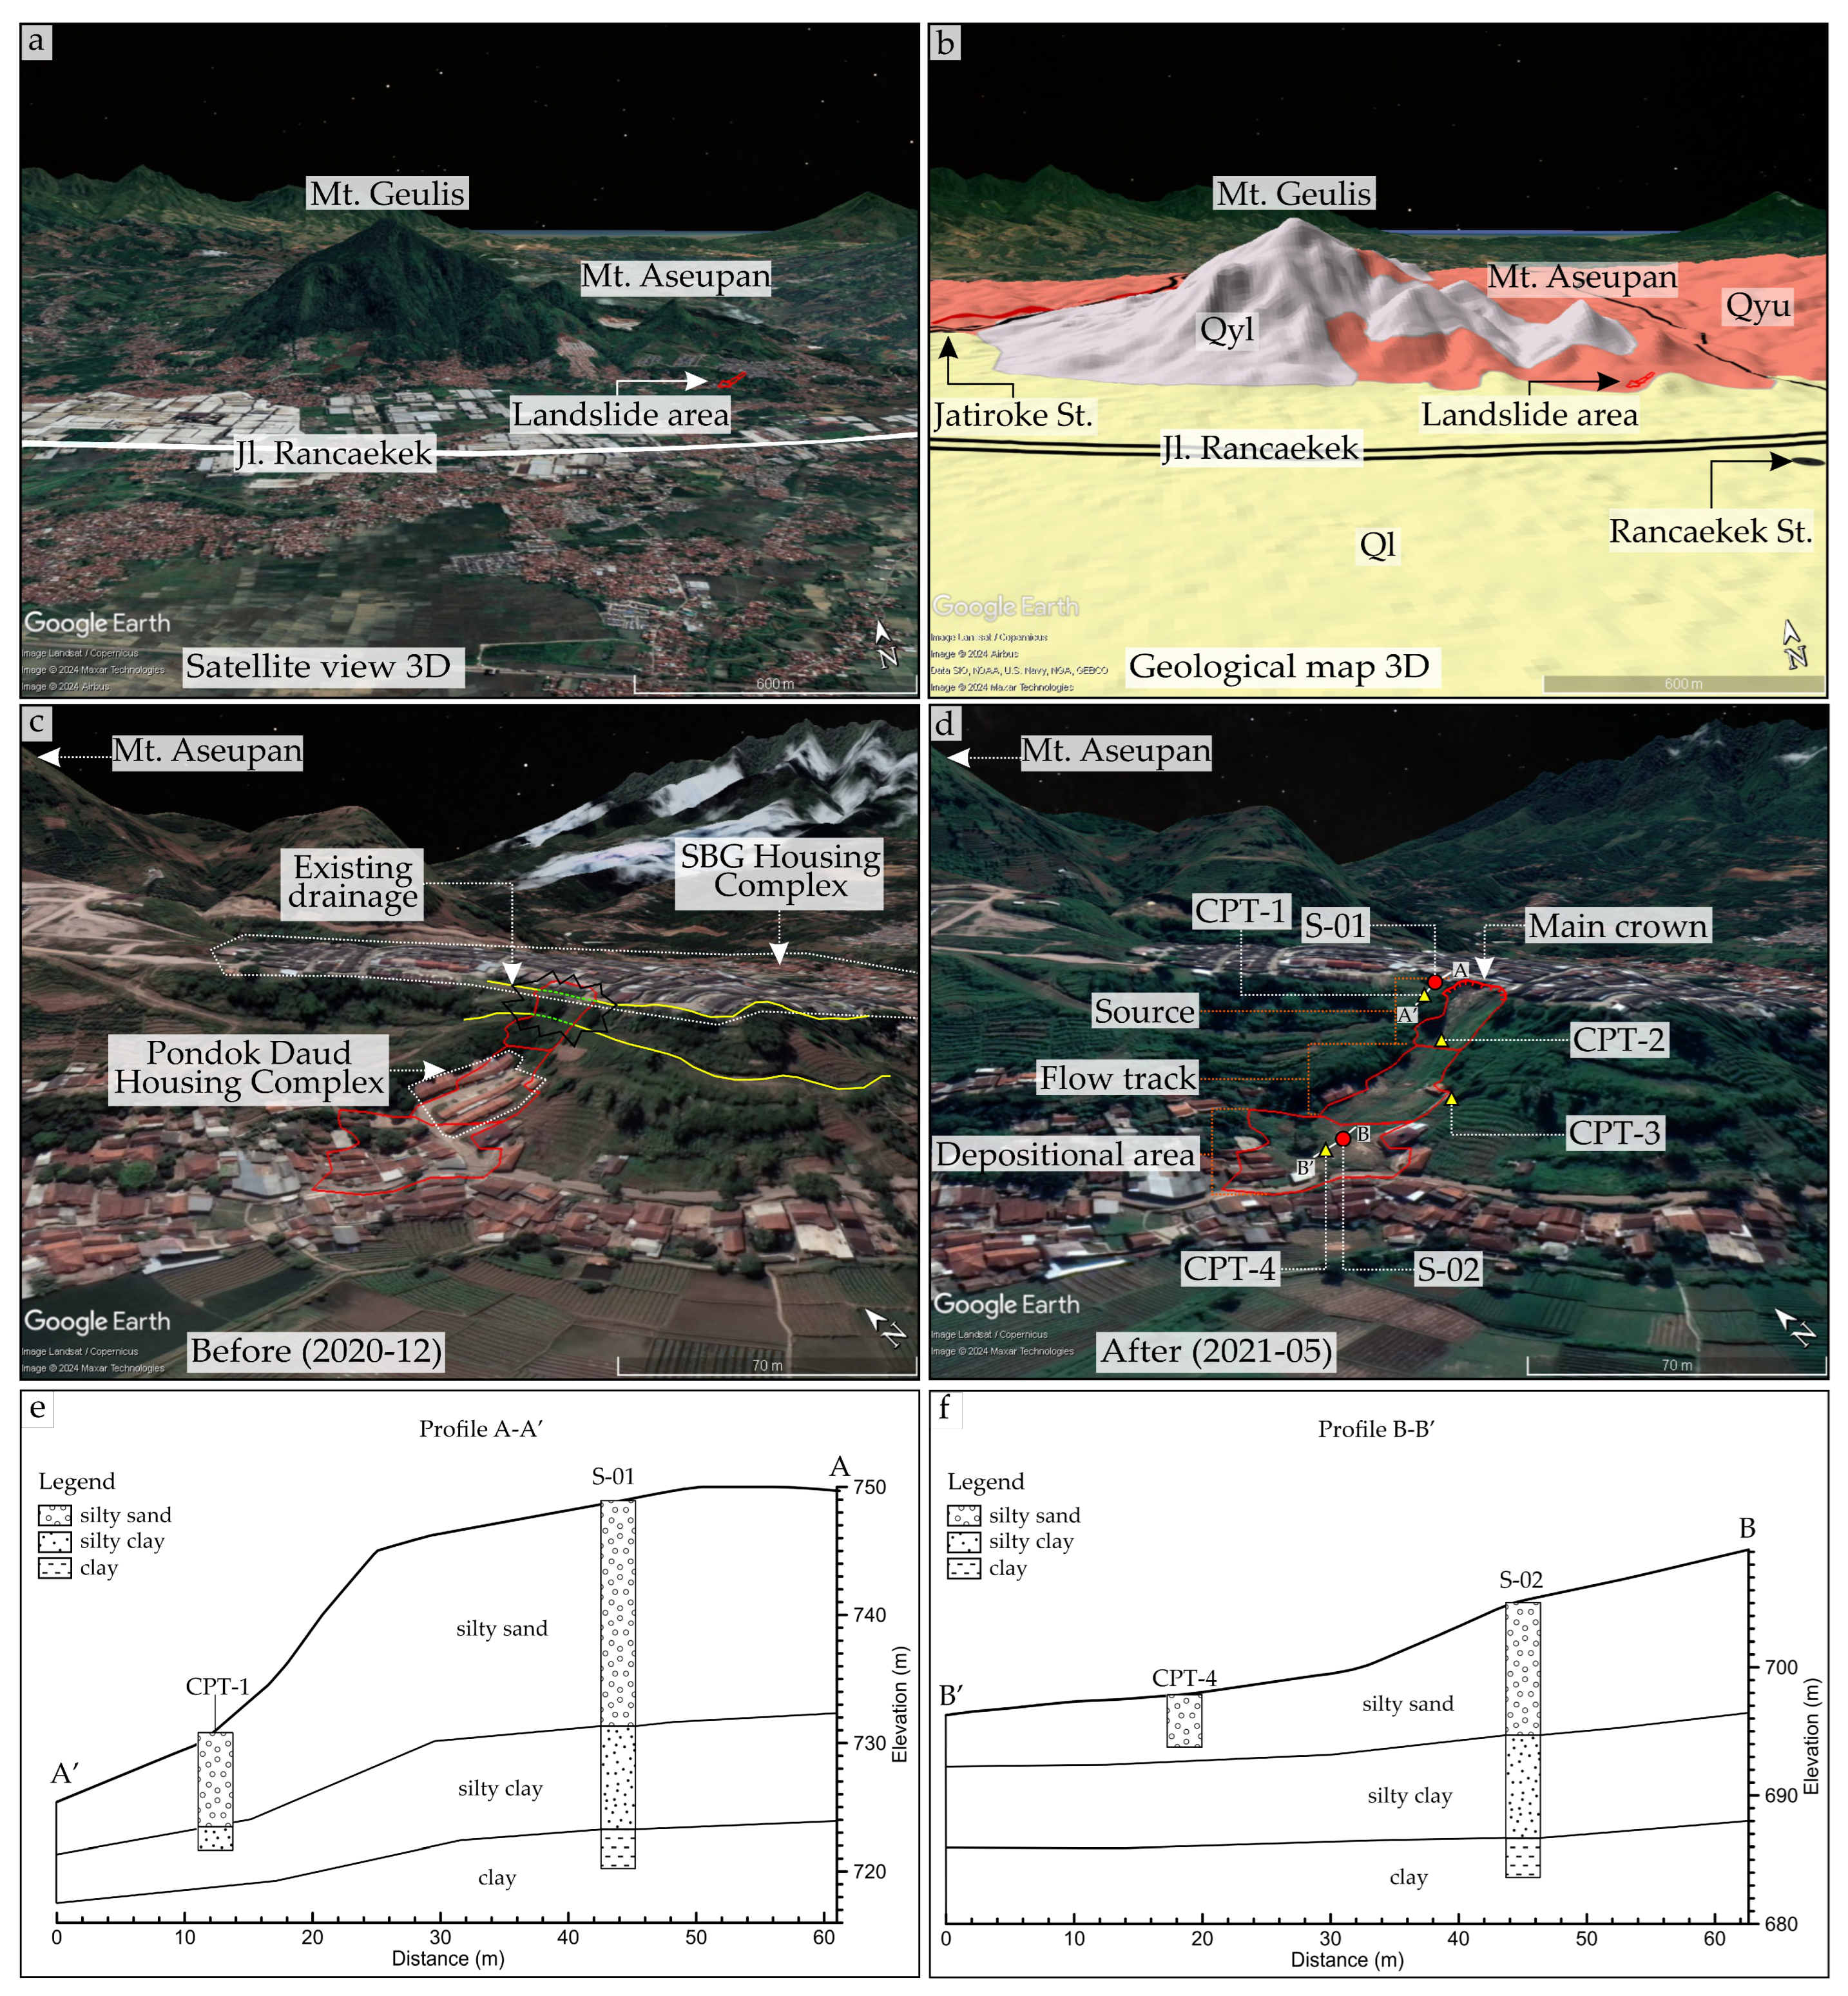
2. Site Description
2.1. Geological Condition
2.2. Rainfall Events
2.3. Landslide in Cimanggung District
3. Methods
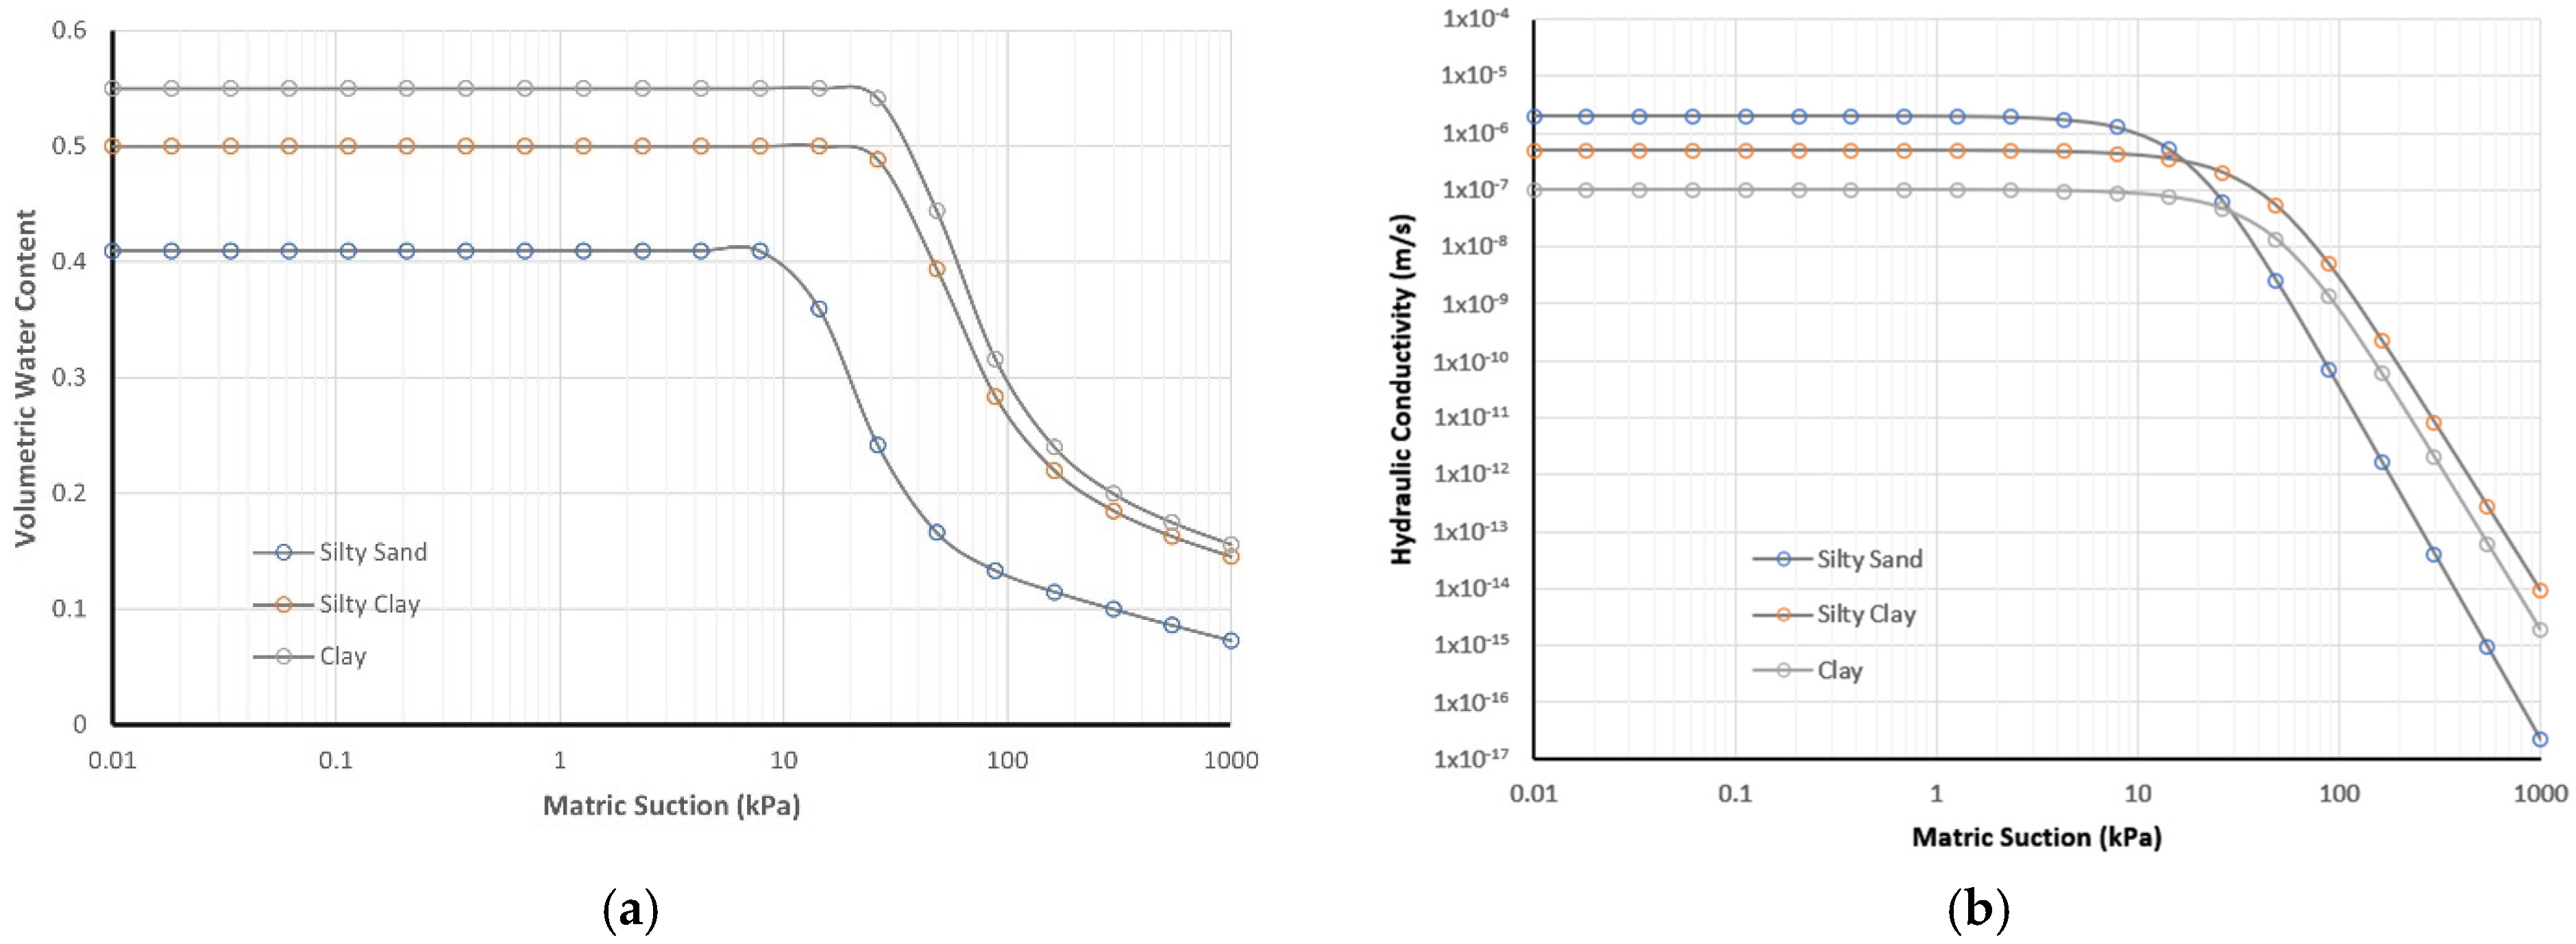
3.1. Slope Profile and Geotechnical Characteristics
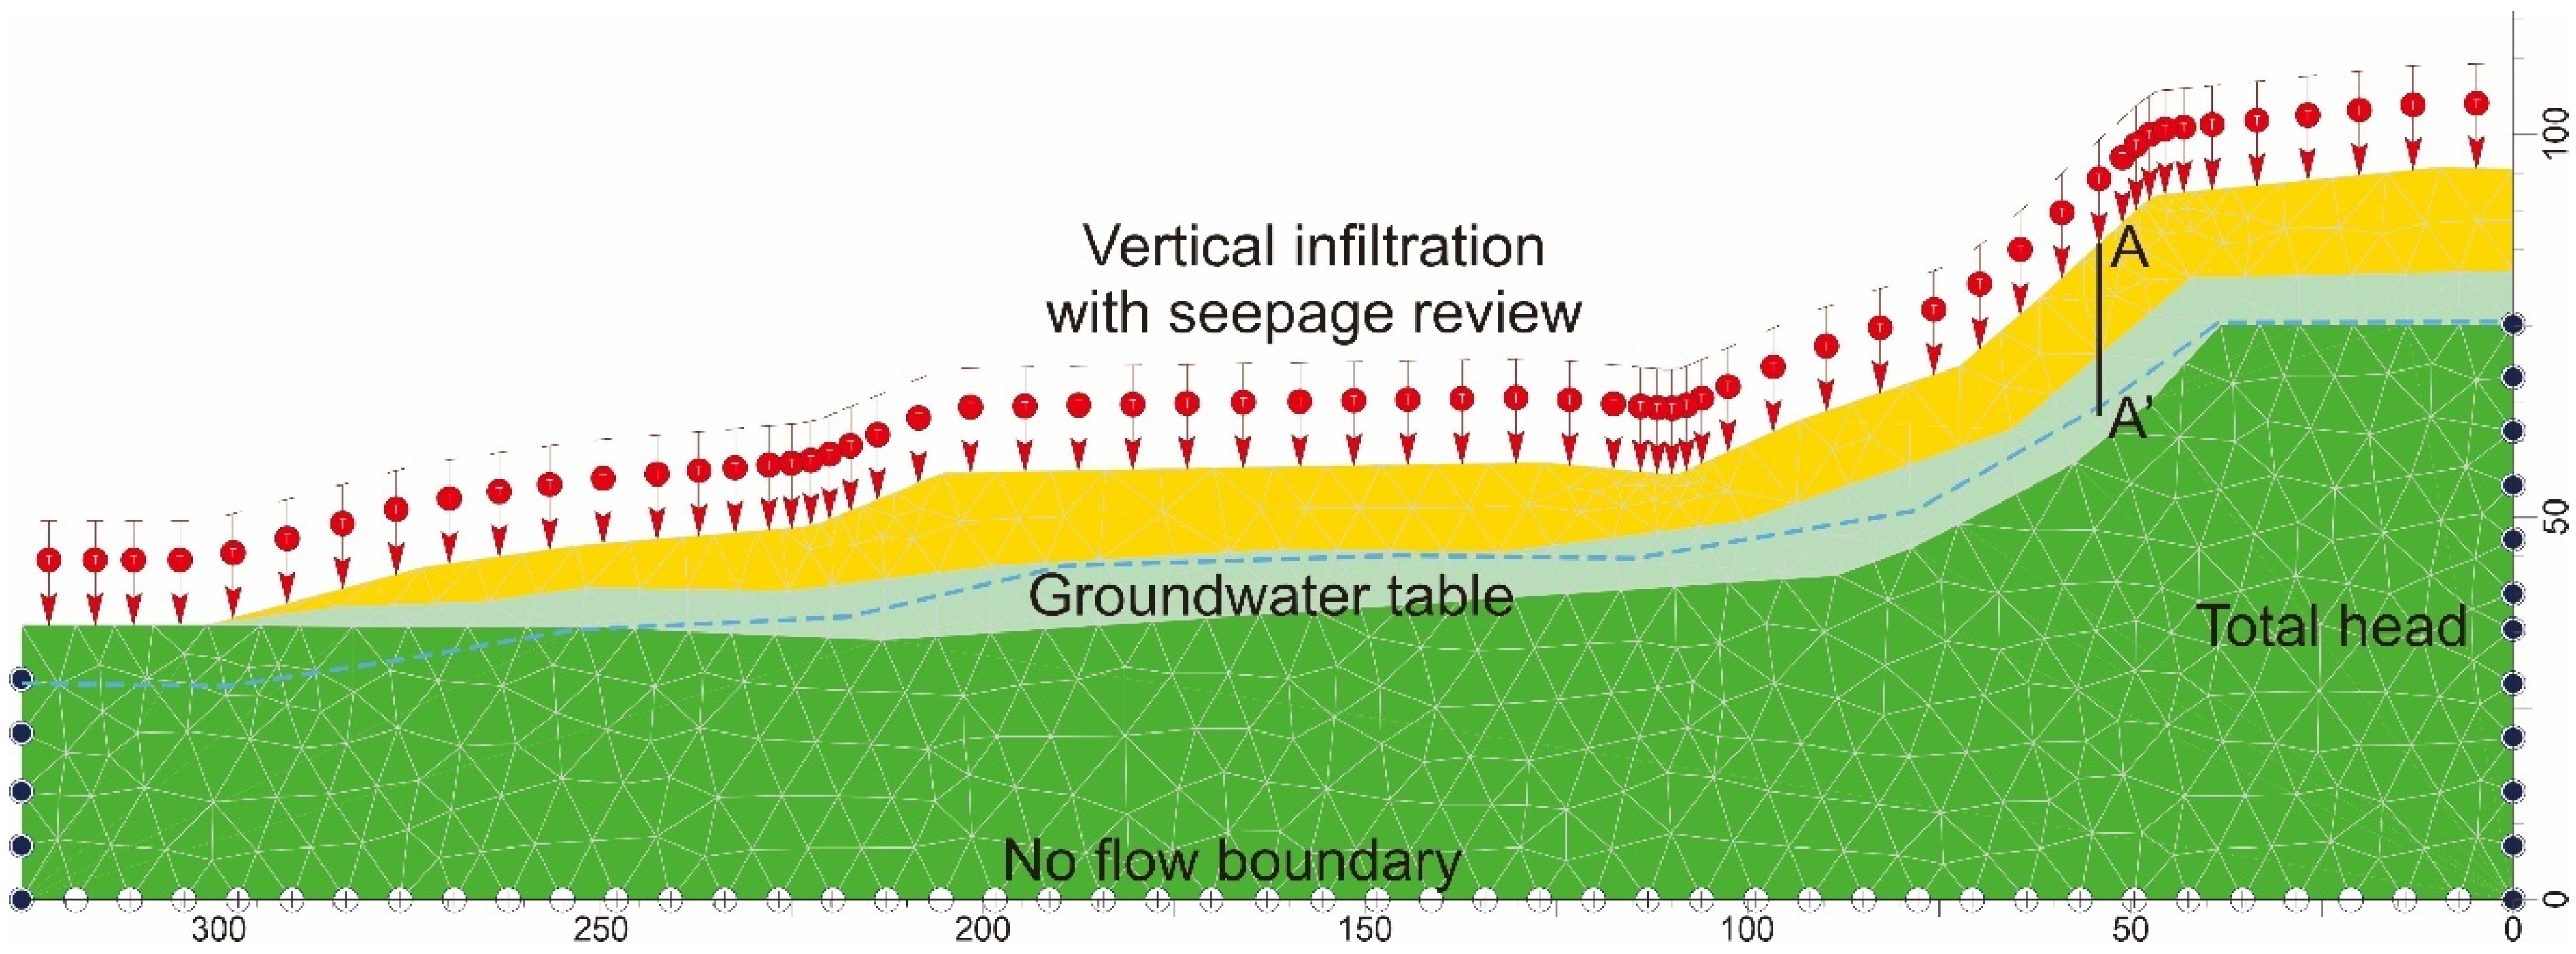
3.2. Coupled Seepage-Slope Analysis and Limit Equilibrium
3.3. Monte Carlo Probabilistic Slope Analysis
4. Results and Discussion
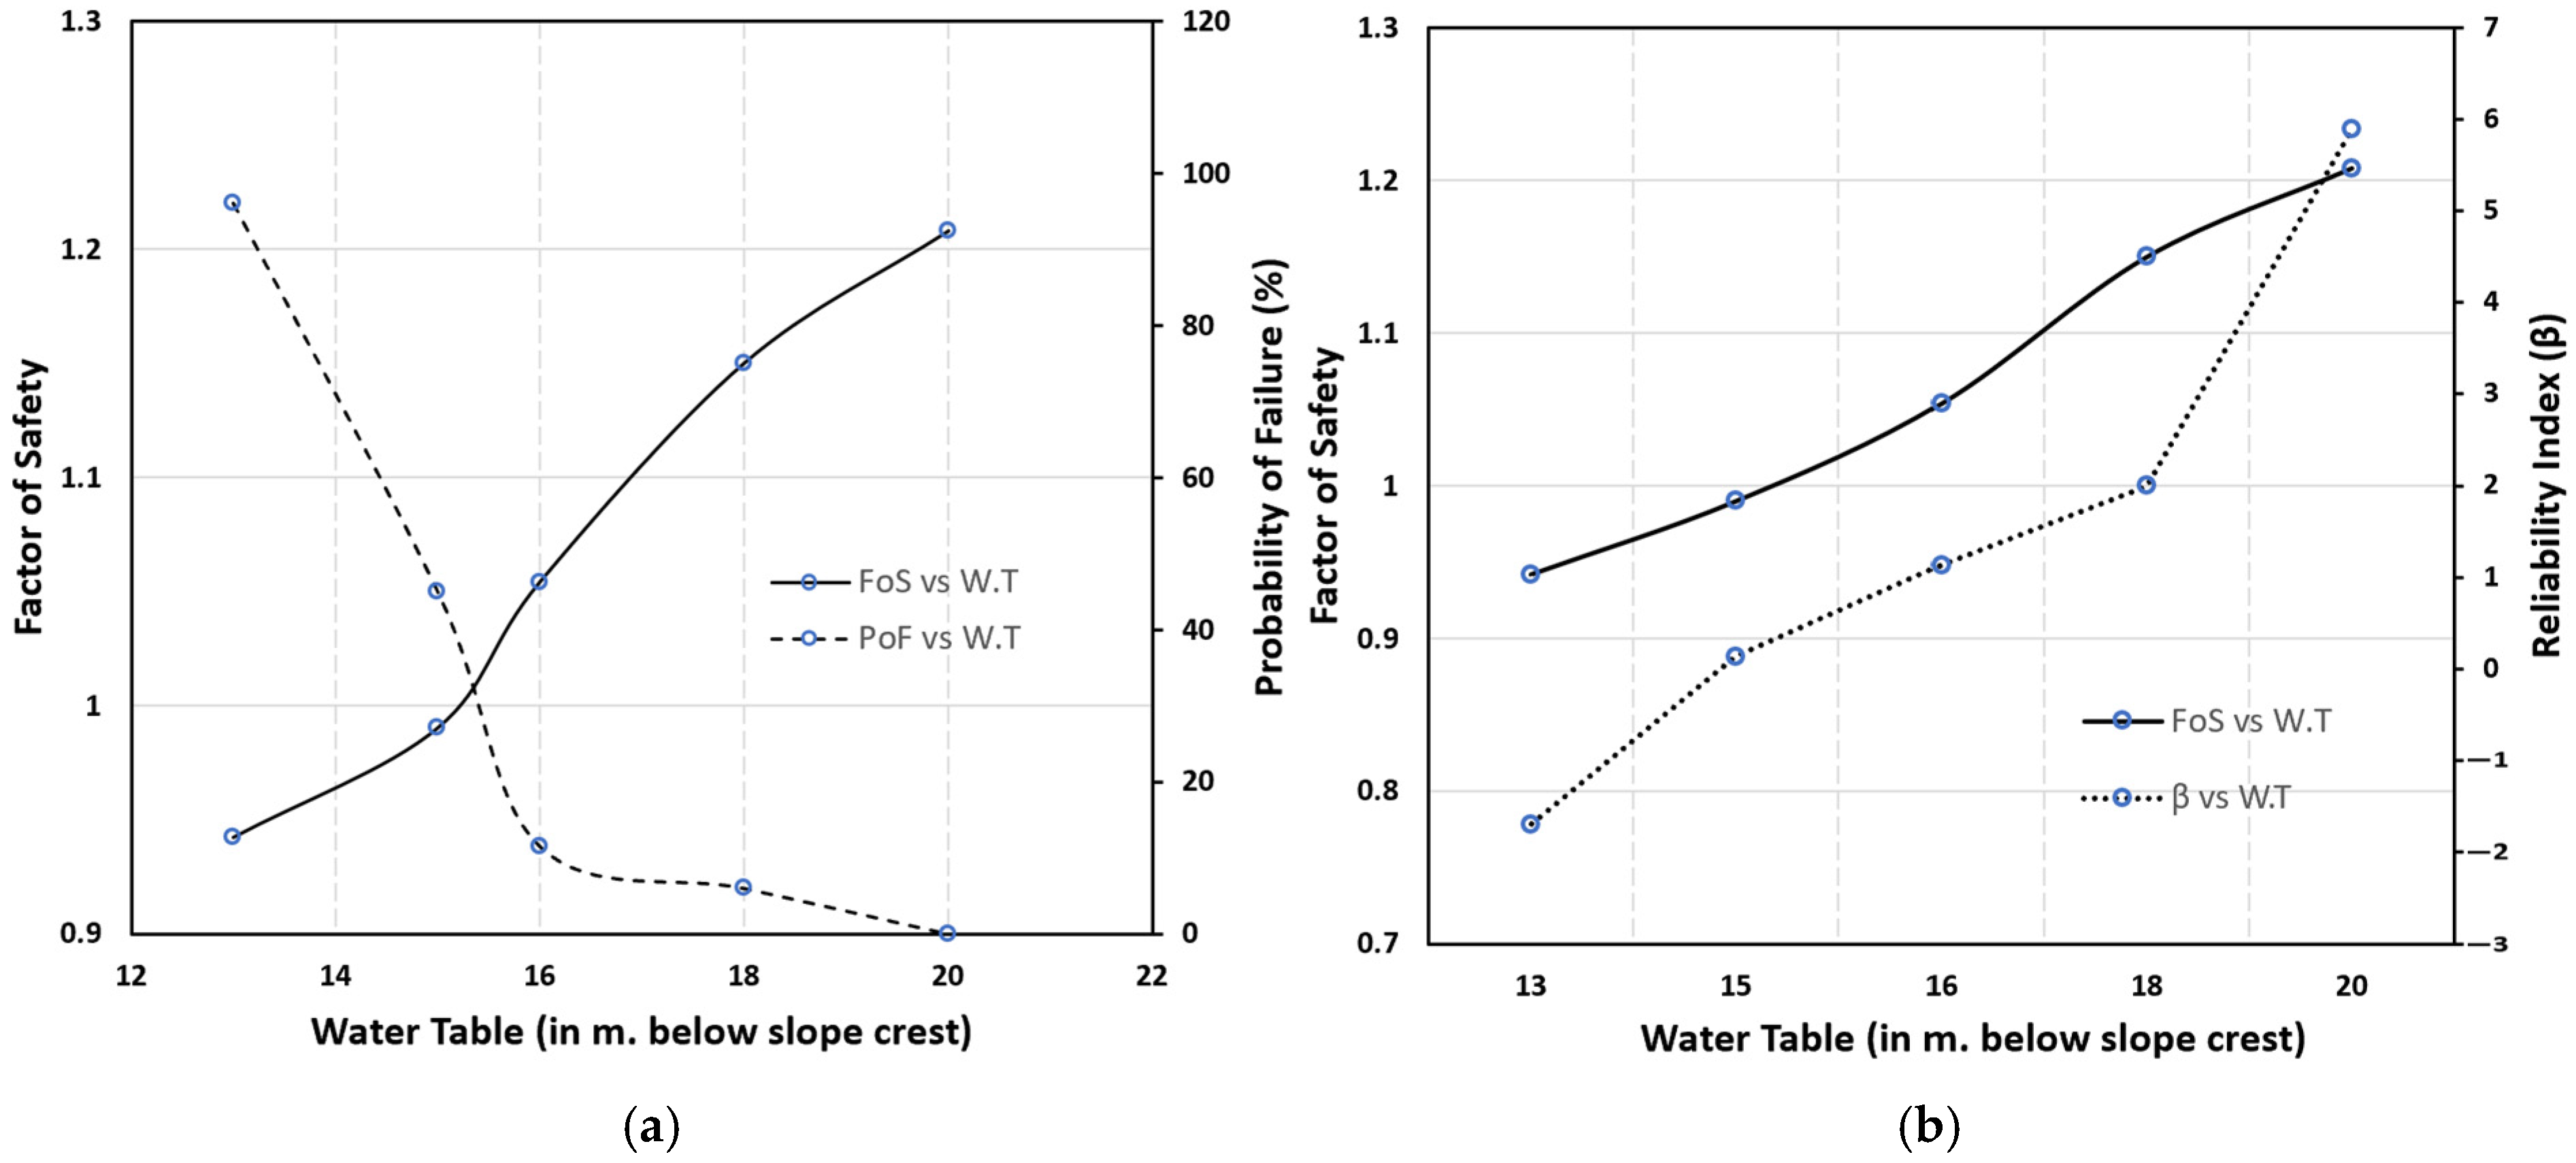
4.1. Factor of Safety over Increasing Water Table
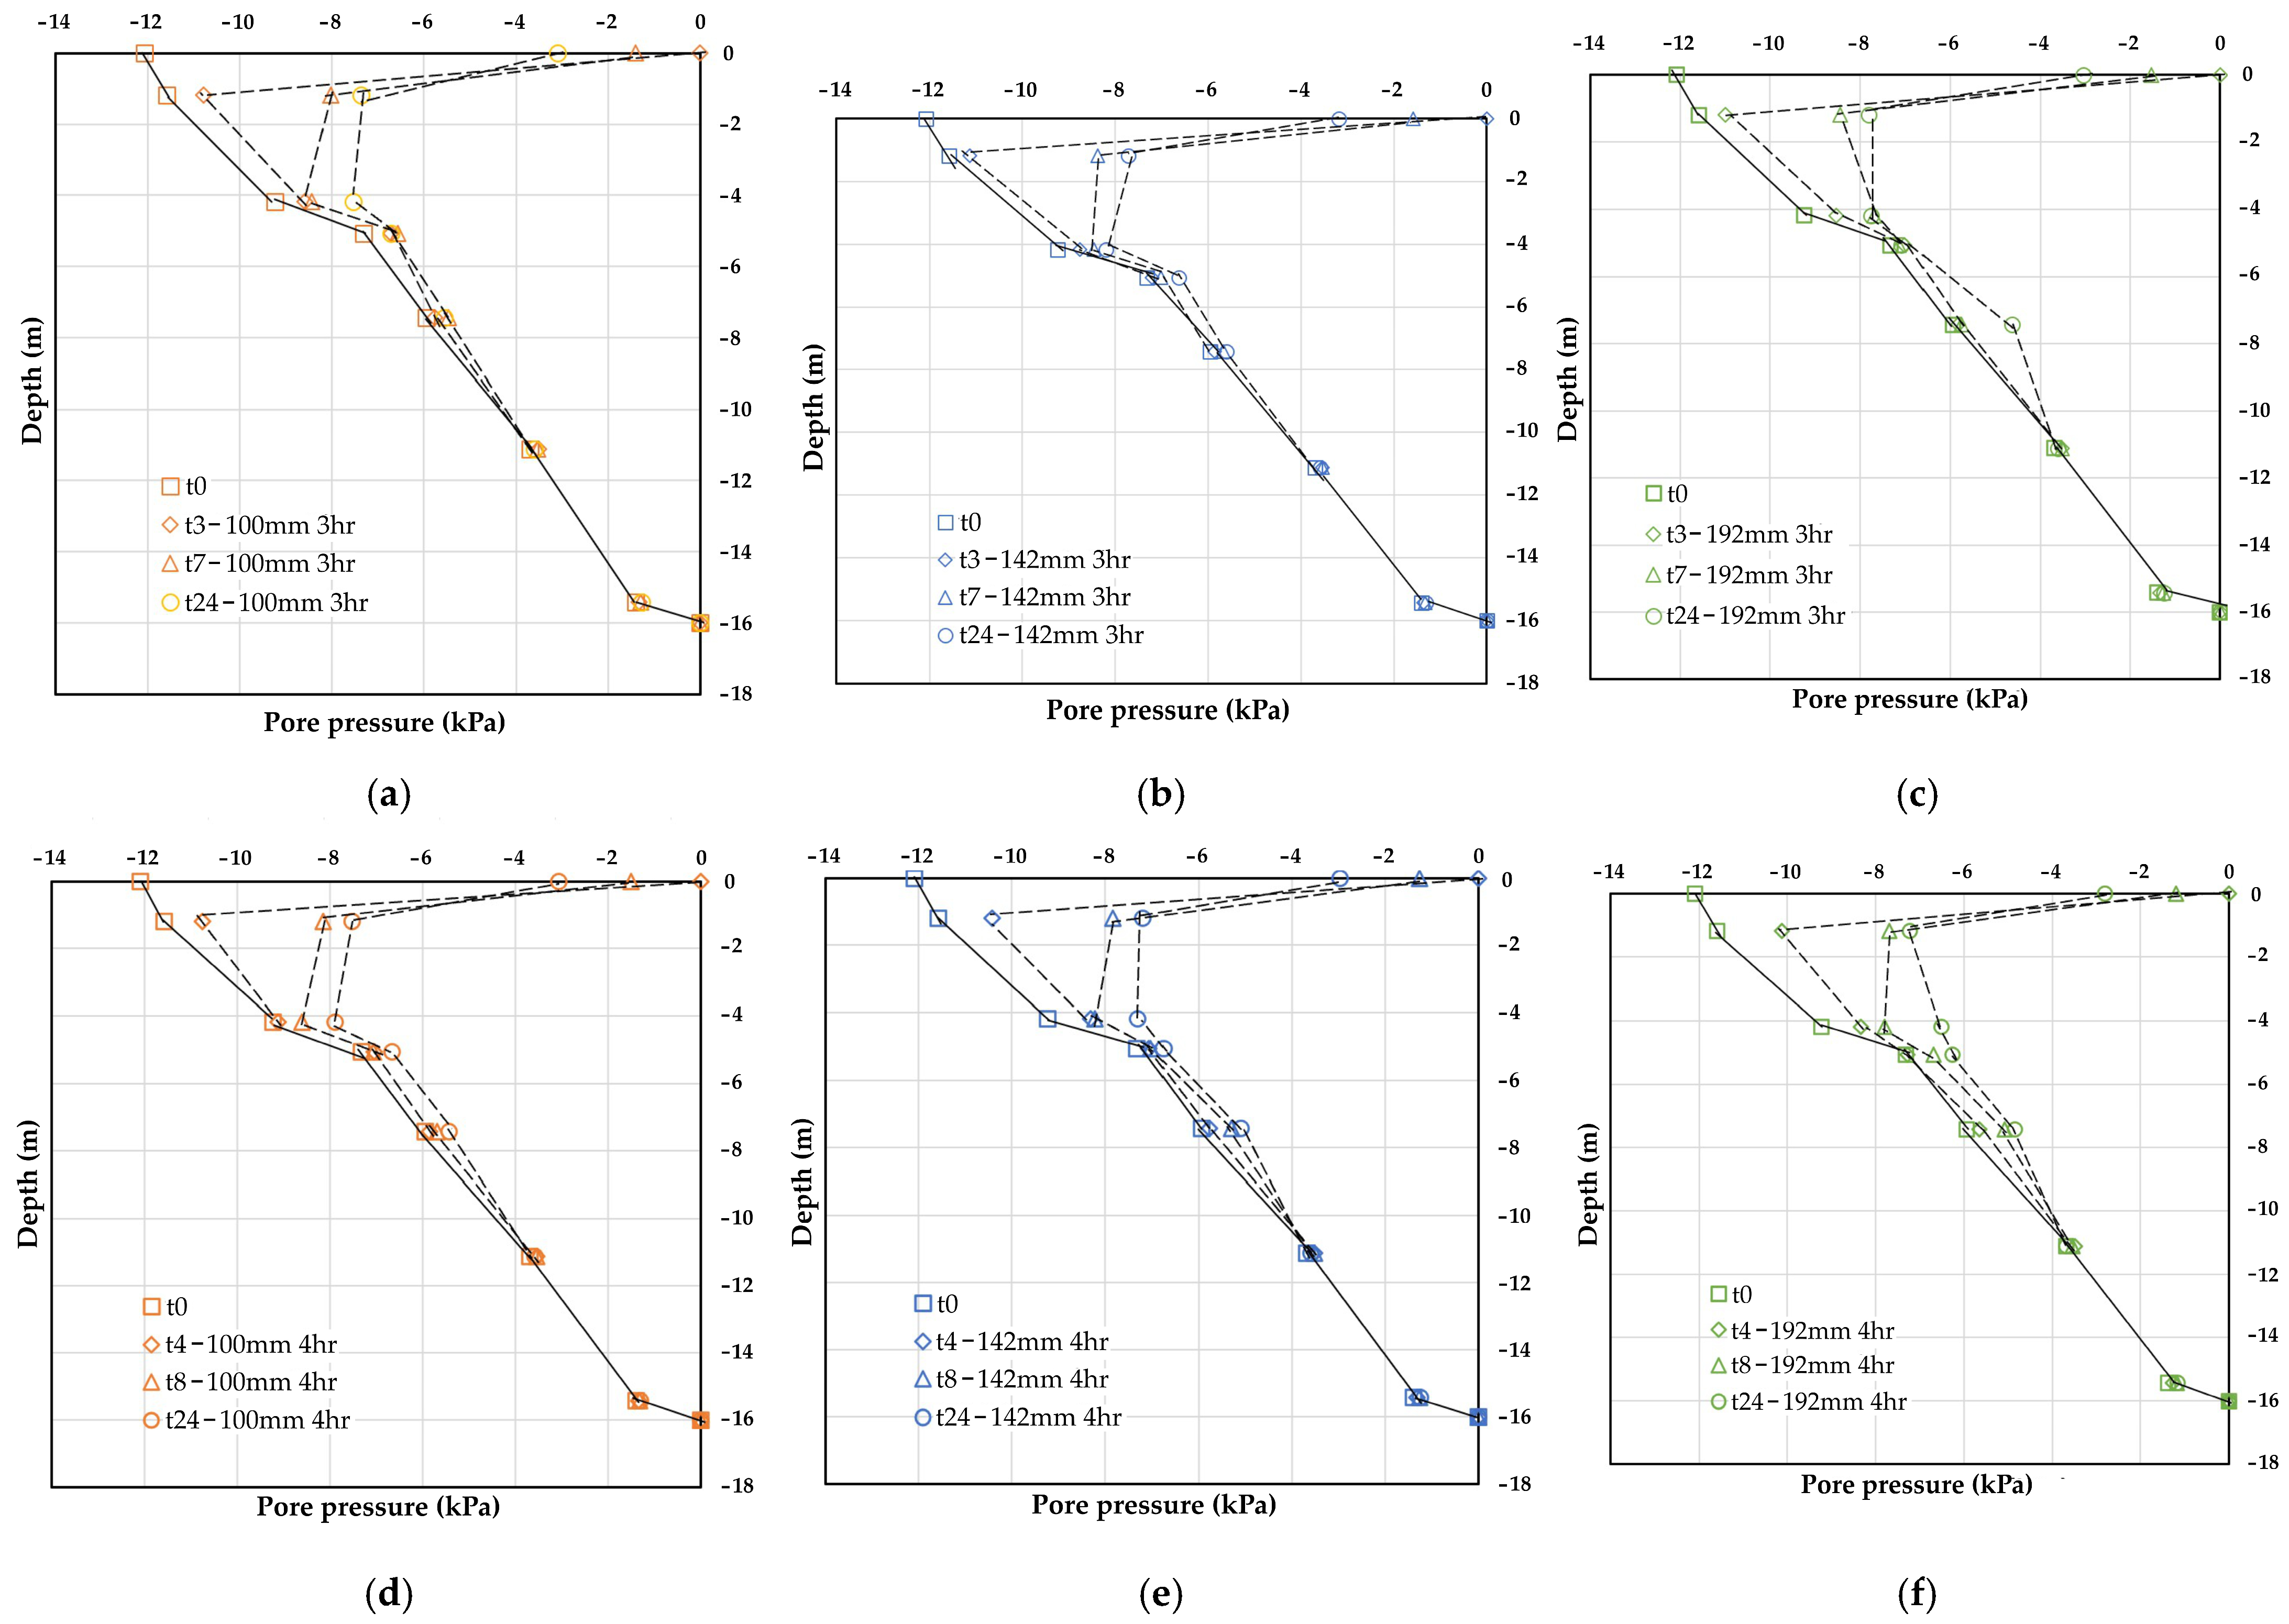
4.2. Influence of Rainfall Events on Transient Pore Pressure
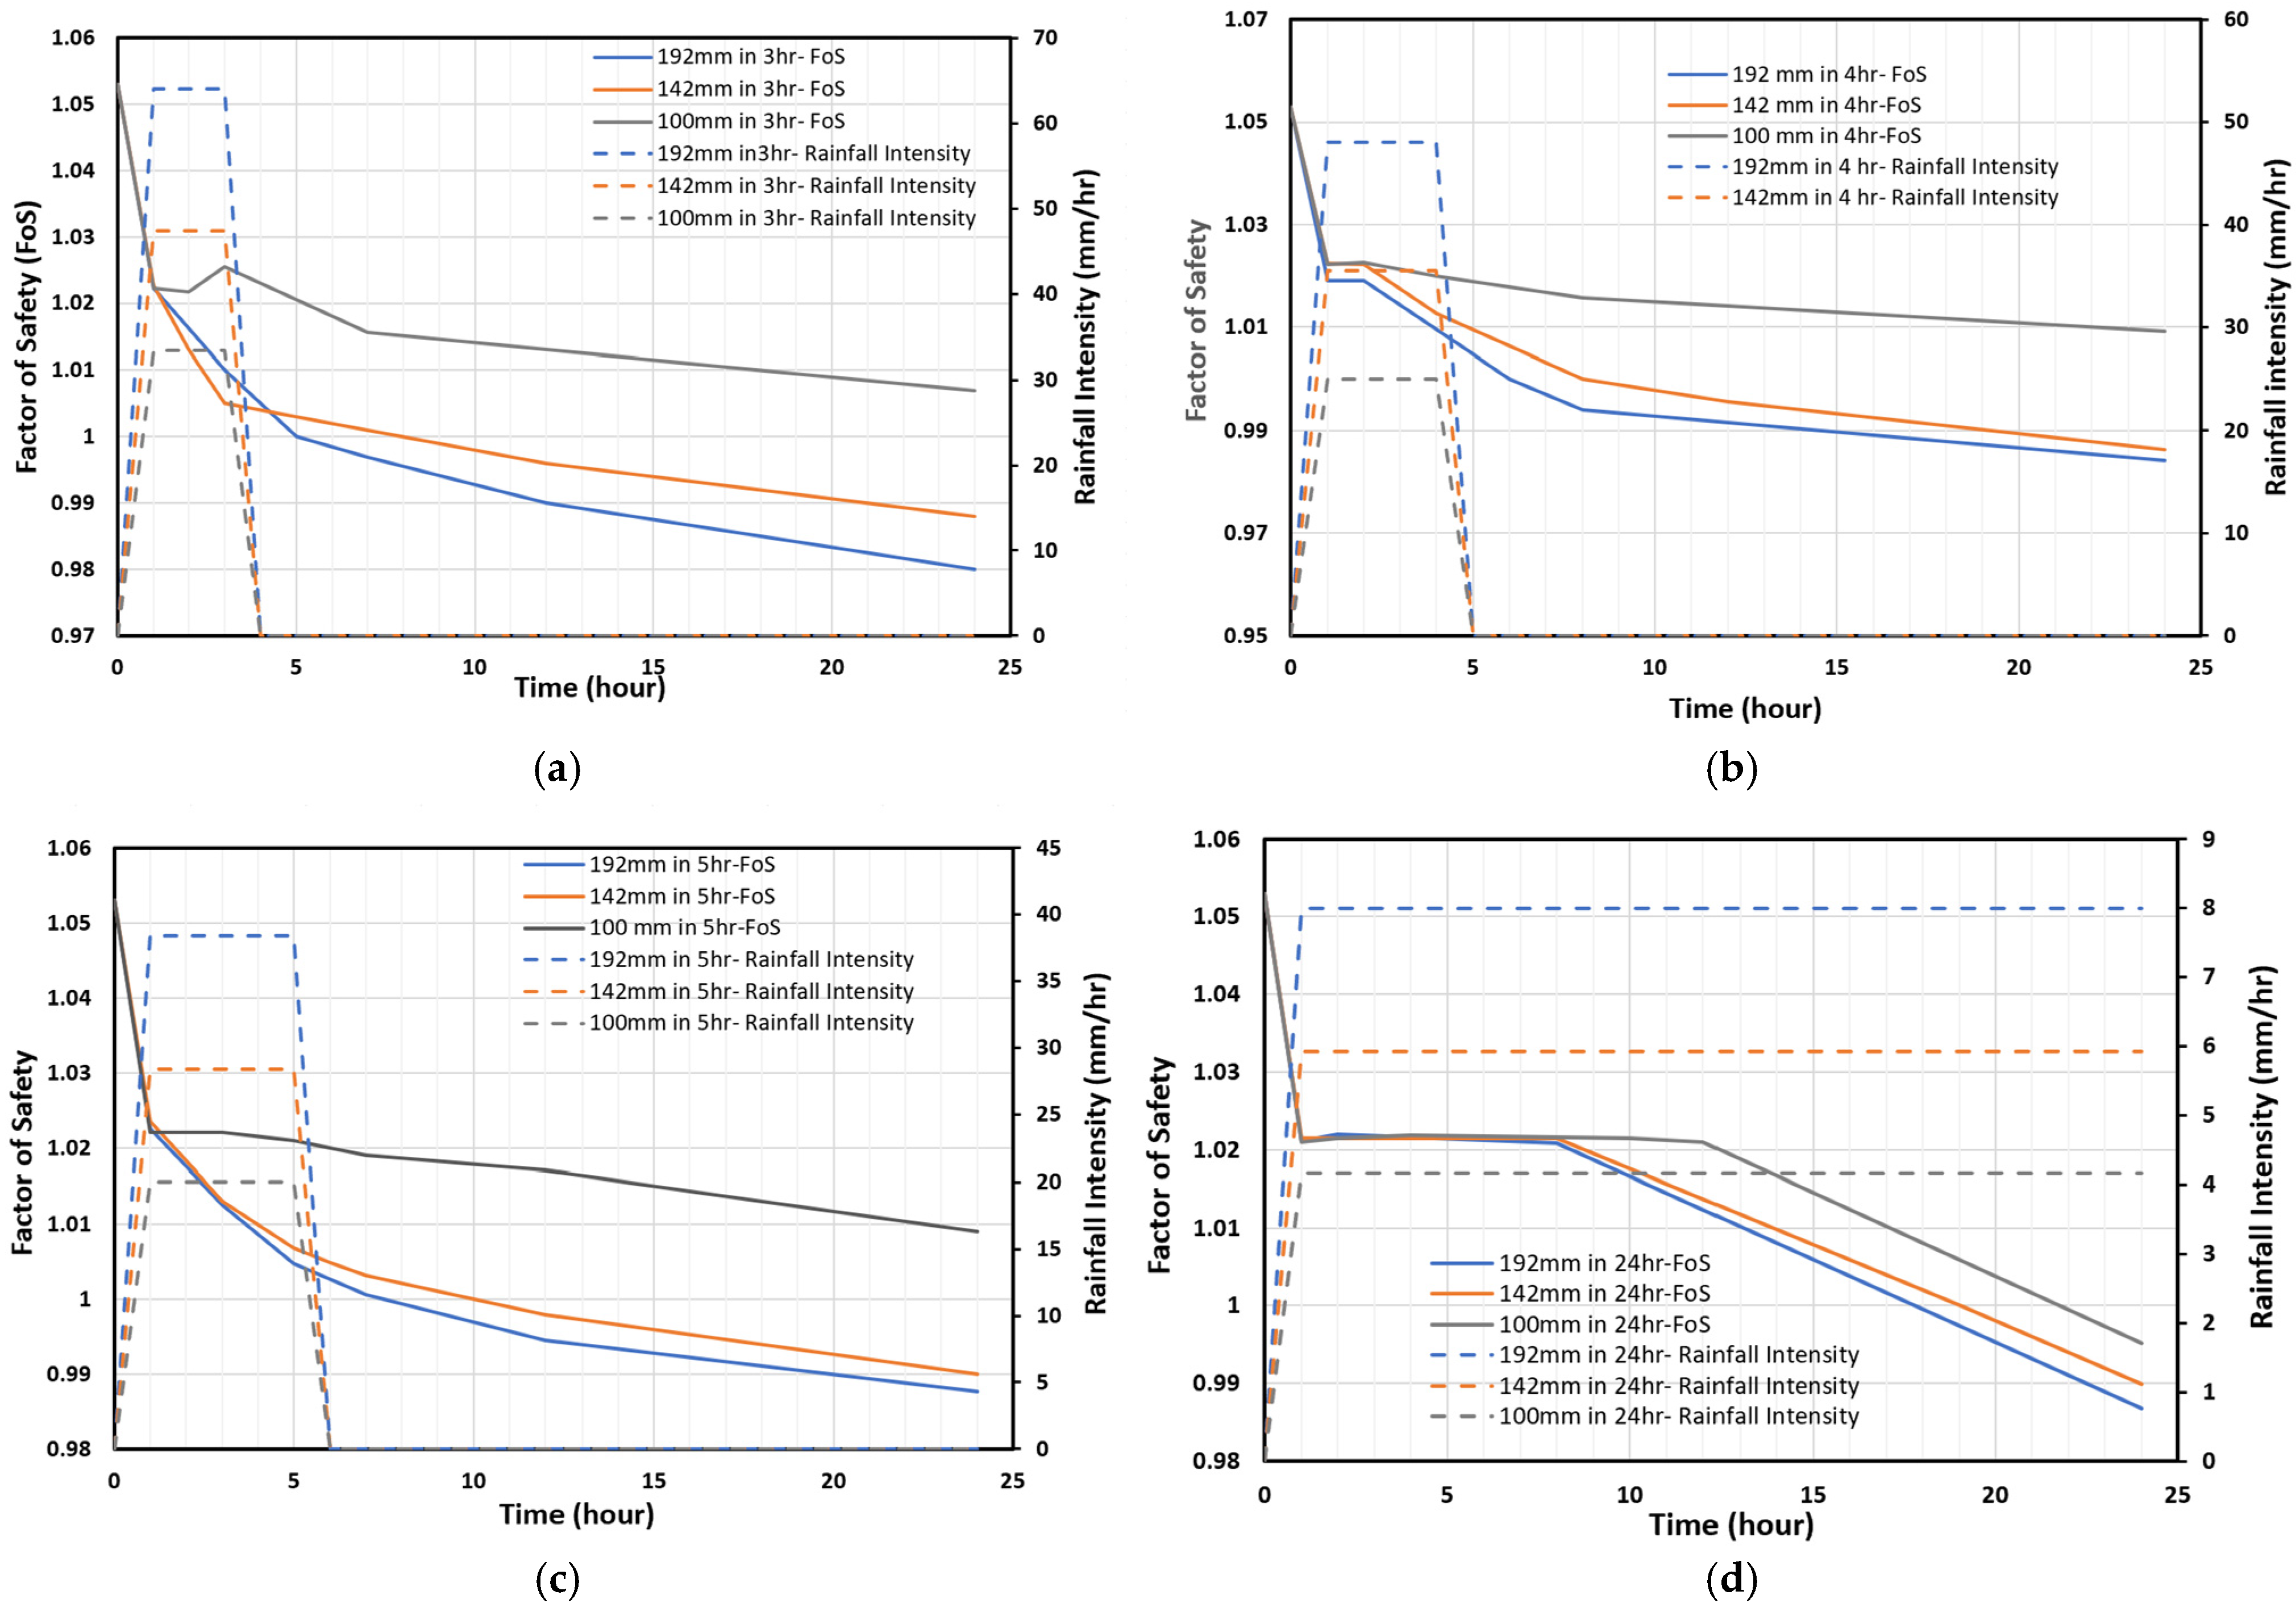
4.3. Evolution of Safety Factor During Rainfall Infiltration
4.4. Analysis of Slope Performance Under Rainfall Infiltration
5. Conclusions
Author Contributions
Funding
Data Availability Statement
Conflicts of Interest
References
- Amarasinghe, M.P.; Kulathilaka, S.A.S.; Robert, D.J.; Zhou, A.; Jayathissa, H.A.G. Risk Assessment and Management of Rainfall-Induced Landslides in Tropical Regions: A Review. Nat. Hazards 2024, 120, 2179–2231. [Google Scholar] [CrossRef]
- Liu, S.; Du, J.; Yin, K.; Zhou, C.; Huang, C.; Jiang, J.; Yu, J. Regional Early Warning Model for Rainfall Induced Landslide Based on Slope Unit in Chongqing, China. Eng. Geol. 2024, 333, 107464. [Google Scholar] [CrossRef]
- Petley, D.N. On the Impact of Climate Change and Population Growth on the Occurrence of Fatal Landslides in South, East and SE Asia. Q. J. Eng. Geol. Hydrogeol. 2010, 43, 487–496. [Google Scholar] [CrossRef]
- Hadmoko, D.S.; Lavigne, F.; Sartohadi, J.; Gomez, C.; Daryono, D. Spatio-Temporal Distribution of Landslides in Java and the Triggering Factors. Forum Geogr. 2017, 31, 1–15. [Google Scholar] [CrossRef]
- Muntohar, A.S.; Ikhsan, J.; Liao, H.J.; Jotisankasa, A.; Jetten, V.G. Rainfall Infiltration-Induced Slope Instability of the Unsaturated Volcanic Residual Soils During Wet Seasons in Indonesia. Indones. J. Geosci. 2022, 9, 71–85. [Google Scholar] [CrossRef]
- Wesley, L. Behaviour and Geotechnical Properties of Residual Soils and Allophane Clays. Obras Y Proy. 2009, 6, 5–10. [Google Scholar]
- Tohari, A.; Sarah, D. Assessment of The Stability of Steep Volcanic Residual Soil Slope Under Rainfall Infiltration. Media Tek. Sipil 2006, 6, 95–102. [Google Scholar]
- Natalia, L.; Yang, J. New Insights into the Catastrophic Slope Failures at Sau Mau Ping: The Role of Antecedent Rainfall Pattern. Landslides 2024, 21, 1501–1514. [Google Scholar] [CrossRef]
- Quintero, D.C.R.; Damiano, E.; Olivares, L.; Greco, R. Mechanical and Hydraulic Properties of Unsaturated Layered Pyroclastic Ashes in Landslide-Prone Areas of Campania (Italy). Bull. Eng. Geol. Environ. 2024, 83, 291. [Google Scholar] [CrossRef]
- Wijaya, I.P.K.; Straka, W.; Mergili, M.; Ottner, F.; Wriessnig, K.; Arndt, R.; Andreatta, P.; Arifianti, Y.; Zangerl, C. Geological Characterization and Failure Analysis of a Catastrophic Landslide in Volcaniclastic Soils: The Banjarnegara–Jemblung Landslide (Indonesia). Q. J. Eng. Geol. Hydrogeol. 2023, 56, 2021–2157. [Google Scholar] [CrossRef]
- Fiorillo, F.; Esposito, L.; Grelle, G.; Revellino, P.; Guadagno, F.M. Further Hydrological Analyses on Landslide Initiation in the Sarno Area (Italy). Ital. J. Geosci. 2013, 132, 341–349. [Google Scholar] [CrossRef]
- Muntohar, A.S.; Ikhsan, J.; Soebowo, E. Mechanism of Rainfall Triggering Landslides in Kulonprogo, Indonesia. In Proceedings of the Geo Congress, San Diego, CA, USA, 3–7 March 2013; p. 9. [Google Scholar]
- Tohari, A.; Sugianti, K.; Hattori, K. Monitoring and Modelling of Rainfall-Induced Landslide in Volcanic Soil Slope. In Landslide Science and Practice; Margottini, C., Canuti, P., Sassa, K., Eds.; Springer: Berlin/Heidelberg, Germany, 2013; Volume 2, p. 8. ISBN 978-3-642-31444-5. [Google Scholar]
- Prasetyaningtiyas, G.A.; Mase, L.Z.; Rifa’i, A.; Fathani, T.F.; Listyawan, A.B.; Azhom, M.N. The Influence of Rainfall Variation on Slope Stability: Case Study of Wanayasa Street Slope, Banjarnegara, Indonesia. Transp. Infrastruct. Geotechnol. 2024, 11, 2406–2424. [Google Scholar] [CrossRef]
- Costa, K.R.C.B.D.; Dantas, A.P.D.N.; Cavalcante, A.L.B.; Assis, A.P.D. Probabilistic Approach to Transient Unsaturated Slope Stability Associated with Precipitation Event. Sustainanability 2023, 13, 15260. [Google Scholar] [CrossRef]
- Zhang, W.; Ran, B.; Gu, X.; Sun, G.; Zou, Y. Probabilistic Stability Analysis of a Layered Slope Considering Multi-Factors in Spatially Variable Soils. Nat. Hazards 2024, 120, 11209–11238. [Google Scholar] [CrossRef]
- Pan, M.; Jiang, S.-H.; Liu, X.; Song, G.-Q.; Huang, J. Sequential Probabilistic Back Analyses of Spatially Varying Soil Parameters and Slope Reliability Prediction under Rainfall. Eng. Geol. 2024, 328, 107372. [Google Scholar] [CrossRef]
- Soundararajan, B.; Vadivel, S.; Sembulichampalayam Sennimalai, C. Investigation of Rainfall-Induced Landslide on Unsaturated Lateritic Residual Soil Slope in Nilgiris, Western Ghats, India Using Deterministic and Reliability Analysis. Bull. Eng. Geol. Environ. 2024, 83, 221. [Google Scholar] [CrossRef]
- PVMBG Portal MBG—Peta Zona Kerentanan Gerakan Tanah. Available online: https://vsi.esdm.go.id/portalmbg/ (accessed on 2 February 2024).
- Santosa, I.; Sulaksana, N.; Yuningsing, E.T.; Zakaria, Z. The Sliding Surface Determination of A Deep-Seated Landslide on Cisumdawu Highway, West Java, Based on The Electrical Resistivity Tomography. Indones. J. Geosci. 2024, 11, 189–199. [Google Scholar] [CrossRef]
- Sugianti, K.; Mulyadi, D.; Sarah, D. Klasifikasi Tingkat Kerentanan Gerakan Tanah Daerah Sumedang Selatan Menggunakan Metode Storie. J. RISET Geol. Dan Pertamb. 2014, 24, 91. [Google Scholar] [CrossRef]
- Fitriana, H.L.; Ismanto, R.D.; Tulus, J.S.; Julzarika, A.; Nugroho, J.T.; Manalu, J. Comparison of Statistical and Machine-Learning Model for Analyzing Landslide Susceptibility in Sumedang Area, Indonesia. Geomat. Environ. Eng. 2024, 18, 24. [Google Scholar] [CrossRef]
- Wang, C.H.; Fang, L.; Chang, D.T.T.; Huang, F.C. Back-Analysis of a Rainfall-Induced Landslide Case History Using Deterministic and Random Limit Equilibrium Methods. Eng. Geol. 2023, 317, 107055. [Google Scholar] [CrossRef]
- Bentivenga, M.; Gizzi, F.T.; Palladino, G.; Piccarreta, M.; Potenza, M.R.; Perrone, A.; Bellanova, J.; Calamita, G.; Piscitelli, S. Multisource and Multilevel Investigations on a Historical Landslide: The 1907 Servigliano Earth Flow in Montemurro (Basilicata, Southern Italy). Land 2022, 11, 408. [Google Scholar] [CrossRef]
- Magrì, S.; Solimano, M.; Delogu, F.; Del Giudice, T.; Quagliati, M.; Cicoria, M.; Silvestro, F. Modelling Rainfall-Induced Landslides at a Regional Scale, a Machine Learning Based Approach. Landslides 2024, 21, 573–582. [Google Scholar] [CrossRef]
- Kang, J.; Wan, B.; Gao, Z.; Zhou, S.; Chen, H.; Shen, H. Research on Machine Learning Forecasting and Early Warning Model for Rainfall-Induced Landslides in Yunnan Province. Sci. Rep. 2024, 14, 14049. [Google Scholar] [CrossRef] [PubMed]
- Sajwan, A.; Ramana, G.V. Integrating Geoinformatics and Numerical Modelling for Landslide Back-Analysis and Forecasting: A Proactive Mitigation Study of the Shiv Bawri Landslide. Landslides 2024, 21, 2481–2499. [Google Scholar] [CrossRef]
- Cui, H.; Ji, J.; Hürlimann, M.; Medina, V. Probabilistic and Physically-Based Modelling of Rainfall-Induced Landslide Susceptibility Using Integrated GIS-FORM Algorithm. Landslides 2024, 21, 1461–1481. [Google Scholar] [CrossRef]
- Silitonga, P.H. Peta Geologi Bandung; Scribd, Inc.: San Francisco, CA, USA, 1973. [Google Scholar]
- Marjiyono, M.; Soehaimi, A.; Karnawan, K. Identifikasi Sesar Aktif Daerah Cekungan Bandung Dengan Citra Landsat Dan Kegempaan. J. Geol. Dan Sumberd. Miner. 2008, 18, 81–88. [Google Scholar]
- Rendra, P.P.R.; Sukiyah, E.; Hadian, M.S.D.; Daliman, S.B.; Sulaksana, N. Quantitative Assessment of Relative Tectonic Activity in the Eastern Bandung Basin, Indonesia. Geol. Ecol. Landsc. 2024, 1–17. [Google Scholar] [CrossRef]
- Martireni, A.P.; Hermawan, K.; Saputra, O.F.; Tohari, A.; Soebowo, E. Landslide Analysis in Bojongkondang, Cihanjuang, Cimanggung, Sumedang Regency, West Java. AIP Conf. Proc. 2023, 2734, 120007. [Google Scholar] [CrossRef]
- BMKG Probabilistik Curah Hujan 20 Mm (Tiap 24 Jam). Available online: https://www.bmkg.go.id/cuaca/probabilistik-curah-hujan.bmkg#:~:text=0.5%20%E2%80%93%2020%20mm%2Fhari%20(,(merah)%20%3A%20Hujan%20sangat%20lebat (accessed on 1 March 2024).
- Hidayat, R.; Sutanto, S.J.; Hidayah, A.; Ridwan, B.; Mulyana, A. Development of a Landslide Early Warning System in Indonesia. Geosciences 2019, 9, 451. [Google Scholar] [CrossRef]
- U-Inspire. SITUATION REPORT 2# Respon Bencana Longsor Kec Cimanggung; Tribun Jabar: Bandung, Indonesia, 2021. [Google Scholar]
- Tribun Jabar. Imbas Longsor Di Cimanggung Sumedang, WC Masjid Berpindah Ke Dasar Jurang. Bandung, Indonesia. Available online: https://cirebon.tribunnews.com/2022/12/18/imbas-longsor-di-cimanggung-sumedang-wc-masjid-berpindah-ke-dasar-jurang (accessed on 10 March 2024).
- Google Earth Pro. Version 7.3.6. Post-Landslide Condition in Cimanggung (May 2021) Captured via Google Earth Pro, © Maxar Technologies. Available online: https://www.google.com/earth/ (accessed on 1 July 2024).
- Adiguna, G.A.; Wijaya, M.; Rahardjo, P.P.; Sugianto, A.; Satyanaga, A.; Hamdany, A.H. Practical Approach for Assessing Wetting-Induced Slope Failure. Appl. Sci. 2023, 13, 1811. [Google Scholar] [CrossRef]
- Rocscience, Inc. Slide v.6.0 2D Limit Equilibrium Slope Stability Analysis Software. Toronto, Canada. Available online: www.rocscience.com (accessed on 1 March 2024).
- Fredlund, D.G.; Morgenstern, N.R.; Widger, R.A. Shear Strength of Unsaturated Soils. Can. Geotech. J. 1978, 15, 313–321. [Google Scholar] [CrossRef]
- Phoon, K. Towards Reliability-Based Design for Geotechnical Engineering; Special Lecture; Korean Geotechnical Society: Seoul, Republic of Korea, 2004. [Google Scholar]
- Chowdhury, R.; Flentje, P. Role of Slope Reliability Analysis in Landslide Risk Management. Bull. Eng. Geol. Environ. 2003, 62, 41–46. [Google Scholar] [CrossRef]
- US Army Corps of Engineers. Engineering and Design: Risk-Based Analysis in Geotechnical Engineering for Support of Planning Studies, Technical Letter No. 1110-2-556; US Army Corps of Engineers: Washington, DC, USA, 1999.
- Wesley, L. Stability of Slopes in Residual Soils. Obras Y Proy. 2011, 10, 47–61. [Google Scholar] [CrossRef]


| Properties | Silty Sand | Silty Clay | Clay |
|---|---|---|---|
| Specific gravity | 2.6 | 2.56 | 2.57 |
| Natural moisture content | 0.32 | 0.40 | 0.40 |
| Porosity | 0.41 | 0.50 | 0.55 |
| Unit weight | 16.8 | 17.5 | 18.0 |
| Percentage of sand (%) | 59.1 | 24.8 | 11.1 |
| Percentage of silt (%) | 26.8 | 49.1 | 31.5 |
| Percentage of clay (%) | 14.1 | 26.1 | 57.4 |
| Soil texture | Sandy loam | Silt loam | Clay |
| Hydraulic conductivity (m/s) | 2 × 10⁻⁶ | 5 × 10⁻⁷ | 1.0 × 10⁻⁷ |
| Average effective cohesion (kPa) | 11.0 | 23.0 | 27.0 |
| Average effective angle of friction (°) | 29.0 | 25.0 | 23.0 |
| Soil | Mean | Coefficient of Variation (%) | Distribution |
|---|---|---|---|
| Silty sand | |||
| Unit weight (kN/m3) | 17 | 2 | Normal |
| Cohesion (kPa) | 11 | 1.5 | Normal |
| Friction angle (°) | 29 | 1 | Normal |
| Silty clay | |||
| Unit weight (kN/m3) | 18 | 1.5 | Normal |
| Cohesion (kPa) | 23 | 3 | Normal |
| Friction angle (°) | 25 | 1 | Normal |
| Clay | |||
| Unit weight (kN/m3) | 20 | 2 | Normal |
| Cohesion (kPa) | 17 | 2.5 | Normal |
| Friction angle (°) | 29 | 1.5 | Normal |
| Geotechnical Performance Level | Probability of Failure (Pf)% | Reliability Index (β) |
|---|---|---|
| High | 0.00003 | 5 |
| Good | 0.003 | 4 |
| Above average | 0.01 | 3 |
| Below average | 0.06 | 2.5 |
| Poor | 2.3 | 2 |
| Unsatisfactory | 7 | 1.5 |
| Hazardous | 16 | 1 |
| Slope Type and Location | Potential Failure Mode | Potential Consequences | Minimum Reliability Index | Maximum Failure Probability |
|---|---|---|---|---|
| Wooded or forested slopes, moderate-to-steep inclination, colluvium or residual soil cover | Shallow sliding, limited movement, or just slope deformation without overall failure | No elements at risk, no potential for debris flow formation | 1 | 15% |
| Slopes of low-to-moderate inclination in which high pore water pressures can develop, forested or cleared sloping areas | Slow moving slides, shallow to deep-seated, relatively flat slip surfaces | No potential for catastrophic failure without warning signs, progressive action during successive rainstorms may induce complete failure over time, no elements at risk | 1.5 | 5% |
| Relatively steep slopes with high relief in forested or cleared areas, slopes near natural gullies, colluvium or residual soil cover | Shallow sliding with rapid movement and potential for large travel distances | Significant potential for debris flow formation during intense storms, considerable travel distance, elements at low-to-moderate risk of damage | 2 | 1% |
| Slopes in which high pore pressure can develop, near urbanised areas | Sliding with rapid movement, shallow-to-deep slip surfaces with relatively steep inclination | Elements at moderate-to-high risk of damage or destruction from landsliding | 2.5 | 0.5% |
| Slopes in which high pore pressures can develop, extremely close to properties in urbanized areas | Sliding with rapid movement, shallow-to-deep slip surfaces with relatively steep inclination | Elements at high to extremely high risk of destruction from landsliding | 3 | 0.1% |
| Rainfall Intensity | Time Step | Mean FoS | Pf | β | Rainfall Intensity | Time Step | Mean FoS | Pf | β |
|---|---|---|---|---|---|---|---|---|---|
| (h) | (%) | (h) | (%) | ||||||
| Initial Condition | 0 | 1.054 | 11.5 | 1.135 | Initial Condition | 0 | 1.054 | 11.5 | 1.135 |
| 100 mm in 3 h | 3 | 1.024 | 23.8 | 0.725 | 100 mm in 5 h | 3 | 1.022 | 24.9 | 0.676 |
| 7 | 1.014 | 33.4 | 0.428 | 7 | 1.018 | 29.2 | 0.537 | ||
| 12 | 1.012 | 36.0 | 0.350 | 12 | 1.016 | 31 | 0.473 | ||
| 24 | 1.006 | 42.6 | 0.166 | 24 | 1.008 | 39.9 | 0.223 | ||
| 142 mm in 3 h | 3 | 1.003 | 45.6 | 0.095 | 142 mm in 5 h | 3 | 1.012 | 36.1 | 0.348 |
| 7 | 1.000 | 48.6 | 0.013 | 7 | 1.003 | 46.1 | 0.081 | ||
| 12 | 0.994 | 55.7 | −0.169 | 12 | 0.996 | 52.8 | −0.106 | ||
| 24 | 0.986 | 64.8 | −0.405 | 24 | 0.959 | 61.9 | −0.345 | ||
| 192 mm in 3 h | 3 | 1.01 | 37.6 | 0.304 | 192 mm in 5 h | 3 | 1.013 | 34.3 | 0.401 |
| 7 | 0.997 | 52.6 | −0.101 | 7 | 1.002 | 46.6 | 0.067 | ||
| 12 | 0.983 | 57.6 | −0.216 | 12 | 0.995 | 54.0 | −0.138 | ||
| 24 | 0.98 | 64.3 | −0.399 | 24 | 0.988 | 63.1 | −0.371 | ||
| 100 mm in 4 h | 2 | 1.021 | 26.0 | 0.640 | 100 mm in 24 h | 2 | 1.02 | 26.6 | 0.604 |
| 8 | 1.014 | 33.5 | 0.430 | 8 | 1.02 | 26.4 | 0.612 | ||
| 12 | 1.013 | 34.8 | 0.382 | 12 | 1.019 | 27.1 | 0.590 | ||
| 24 | 1.008 | 40.0 | 0.229 | 24 | 0.988 | 61.8 | −0.344 | ||
| 142 mm in 4 h | 2 | 1.021 | 26.1 | 0.634 | 142 mm in 24 h | 2 | 1.023 | 24.5 | 0.693 |
| 8 | 0.999 | 50.0 | −0.042 | 8 | 1.023 | 24.1 | 0.71 | ||
| 12 | 0.994 | 56.1 | −0.174 | 12 | 1.017 | 34.5 | 0.75 | ||
| 24 | 0.985 | 65.8 | −0.447 | 24 | 0.985 | 65.8 | −0.433 | ||
| 192 mm in 4 h | 2 | 1.017 | 29.9 | 0.522 | 192 mm in 24 h | 2 | 1.021 | 26.3 | 0.622 |
| 8 | 0.997 | 52.6 | −0.098 | 8 | 1.099 | 27.4 | 0.59 | ||
| 12 | 0.982 | 57.0 | −0.120 | 12 | 1.013 | 37.0 | 0.51 | ||
| 24 | 0.983 | 67.6 | −0.511 | 24 | 0.985 | 65.9 | −0.422 |
Disclaimer/Publisher’s Note: The statements, opinions and data contained in all publications are solely those of the individual author(s) and contributor(s) and not of MDPI and/or the editor(s). MDPI and/or the editor(s) disclaim responsibility for any injury to people or property resulting from any ideas, methods, instructions or products referred to in the content. |
© 2024 by the authors. Licensee MDPI, Basel, Switzerland. This article is an open access article distributed under the terms and conditions of the Creative Commons Attribution (CC BY) license (https://creativecommons.org/licenses/by/4.0/).
Share and Cite
Sarah, D.; Zulfahmi, Z.; Putra, M.H.Z.; Madiutomo, N.; Gunawan, G.; Sumaryadi, S.; Ahmid, D.A. Back Analysis of Rainfall-Induced Landslide in Cimanggung District of Sumedang Regency in West Java Using Deterministic and Probabilistic Analyses. Geosciences 2024, 14, 347. https://doi.org/10.3390/geosciences14120347
Sarah D, Zulfahmi Z, Putra MHZ, Madiutomo N, Gunawan G, Sumaryadi S, Ahmid DA. Back Analysis of Rainfall-Induced Landslide in Cimanggung District of Sumedang Regency in West Java Using Deterministic and Probabilistic Analyses. Geosciences. 2024; 14(12):347. https://doi.org/10.3390/geosciences14120347
Chicago/Turabian StyleSarah, Dwi, Zulfahmi Zulfahmi, Moch Hilmi Zaenal Putra, Nendaryono Madiutomo, Gunawan Gunawan, Sumaryadi Sumaryadi, and Deden Agus Ahmid. 2024. "Back Analysis of Rainfall-Induced Landslide in Cimanggung District of Sumedang Regency in West Java Using Deterministic and Probabilistic Analyses" Geosciences 14, no. 12: 347. https://doi.org/10.3390/geosciences14120347
APA StyleSarah, D., Zulfahmi, Z., Putra, M. H. Z., Madiutomo, N., Gunawan, G., Sumaryadi, S., & Ahmid, D. A. (2024). Back Analysis of Rainfall-Induced Landslide in Cimanggung District of Sumedang Regency in West Java Using Deterministic and Probabilistic Analyses. Geosciences, 14(12), 347. https://doi.org/10.3390/geosciences14120347