Abstract
One of the most intriguing questions of modern volcanology is the inception of an eruption. Despite efforts to detect premonitory signals, numerous unpredicted eruptions have occurred recently. It has been suggested that these unpredicted eruptions might be explained by viscosity variations in elemental sulfur accumulated within the hydrothermal systems present in several volcanic settings under the influence of organics, hydrocarbons, hydrogen sulfide, halogens, and ammonia. Changes in impure sulfur viscosity are more complex than those in pure S, invoked decades ago to trigger eruptions by system sealing in volcanoes hosting a crater lake. Growing evidence suggests that sulfur accumulation is a common process, not restricted to crater lakes. Moreover, both types and amounts of gas species released at the surface, critical for volcano monitoring, would be altered, following chemical reactions involving impure S, invalidating signals used to issue alerts. Impure sulfur behavior may explain puzzling degassing and contrasting signals reported at volcanoes and restless calderas worldwide, with implications for hazard assessment and volcanic-risk-mitigation strategies.
1. Introduction
The discovery of sulfur accumulation beneath volcanic crater lakes more than a century ago at Yugama crater lake (Kusatzu Shirane, Japan) [1,2] has since attracted considerable research of this peculiar feature, which is considered to be unique to crater lake environments [3]. Although, this can be complicated by the observation that, at certain sites, the crater lake itself may transition in and out of existence, e.g., [4,5,6]. At Kusatzu-Shirane (Japan), historical eruptions occurred through three distinct eruptive centers after a 1.4 ka BP last magmatic eruption [7,8]. At Yugama crater, molten S was ejected during several phreatic eruptions since 1805 [7]. S eruptions have occurred in Poàs, Costa Rica [9], and in White Island, New Zealand (Figure 1), in 2013, characterized by explosive ejection of sulfur and mud [10]. At Ruapehu volcano (New Zealand), a “sulfur pool” below the acidic sulfate–chloride water of the crater lake is assumed to have formed between 20 and 50 years between significant magmatic eruptions, despite the occurrence of phreatic eruptions [5]. Different styles of sulfur activity have been reported at several volcanoes; traces of past molten S flows [11,12,13,14]) have been attributed to melting and remobilizing fumarolic deposits by changes in thermal gradients. At Lastarria (Chile, Figure 1), evolving since 260 ky, S flows have been reported since 1964 [14], and a molten S pool feeding molten S flows was observed in 2019 on the northern flank, at the site of fumarolic activity [15]. Numerous studies in the 1980–1990s reported “an excess-S” release, in which syn-eruptive degassing could not provide measured gas yields [16,17,18,19]. At Ruapehu, system sealing caused by the increase in pure S viscosity at T ≈ 160 °C was hypothesized to cause Crater Lake temperature cycling and to trigger unpredicted phreatic eruptions in 1998, 2006, and 2007 [20]. Recent unpredicted eruptions occurred in 2018 at Motoshirane, 2 km south of the Yugama crater (Kusatzu-Shirane, Japan [21] Figure 1), without casualties, and at White Island in 2019, killing 22 people and injuring 25 [22] (Figure 1). Both volcanoes host S layers [7,8,23] deposited within their hydrothermal systems. Understanding the causes underlying these eruptions is paramount for hazard assessment.
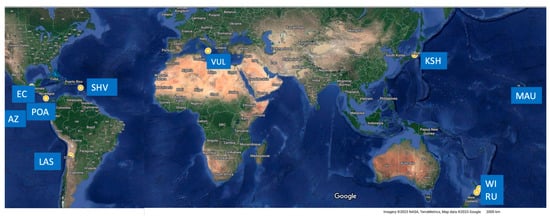
Figure 1.
Map from Google Earth showing the locations (yellow stars) of volcanoes cited in the text (also only as references) where the occurrence of sulfur flows, and/or sulfur eruptions, and/or the evidence of explosive expulsion (e.g., aggregates) has been observed or reported. Acronyms: KSH—Kushatzu Shirane (Japan); RU—Ruapehu (NZ); WI—White Island (NZ); VUL—Vulcano (Italy); POA—Poàs (Costa Rica); EC—El Chichòn (Mexico); LAS—Lastarria (Chile); MAU—Mauna Loa (Hawaii); AZ—Azufre (Galapagos).
Following previous experimental results, Scolamacchia and Cronin suggested in 2016 [24] that other variations in S viscosity, in the presence of impurities common in volcanic settings (H2S, hydrocarbons, organics, halogens), could help explain the causes of these unpredicted eruptions which have lacked precursory signals. Because crater lakes are typically the surface expression of hydrothermal systems, S accumulation is likely to occur below phreatic tables in several volcanic settings [25]. In addition, chemical reactions involving impure S and corresponding changes in viscosity with temperature and/or heating rates would be able to alter the type of emissions at the surface, with critical implications for volcano monitoring [25]. Hydrothermal systems have been the object of renewed interest in the last few years [26,27], acknowledging the importance of superficial processes in volcanic eruptions. The increasing amounts of data available in different volcanic settings, including experimental results on reactions responsible for native sulfur deposition [28], offer new clues to support our hypothesis that sulfur accumulation is common in several settings and represents a general process, as will be described in the following sections.
2. S Occurrence and Behavior
Sulfur is widely distributed in the crust and the mantle of Earth, with predominant phases thought to be H2S and SO2 in the gas phase and S2− and SO42− in the melt [29]. Geochemical monitoring through the sampling of passive soil/fumarole degassing at volcanoes, together with temperature (T), represents a key issue in detecting changes in emitted fluids, thought to increase the energetics of the volcano, causing eruptions [30]. S represents a major component among gas species released at the surface, together with C and N, which are all polyvalent. Gas analyses comprise contributions from CO2, CH4, CO, SO2, H2S, and—though often not reported in analyses—NH3 and N2 [31]. Critical for geochemical monitoring, SO2 and CO2 are high-temperature (HT) gases that are considered to be indicative of magmatic degassing; meanwhile, H2S, like CH4, indicates hydrothermal contribution [32]. Redox reactions control fumarolic emissions at the surface, and gas ratios sampled at fumaroles are sensitive to the redox state of the entire volcanic gas phase [33].
To interpret the emissions at higher T (>400 °C) volcanic gases, Giggenbach [33] first proposed the homogeneous gas reaction SO2 + 3H2 = H2S + 2H2O, ignoring the contribution of minor sulfur species. This reaction (as 3SO2 + 7H+ = H2S + 2S0 + 6H2O) has been considered to be one of the main reactions explaining native sulfur (S0) accumulation below crater lakes from high-temperature (>300 °C) gases [6], together with SO2 synproportionation SO2 + 3H2S = 3S0 + 2H2O (initially proposed by Mitzutani and Sugiura, [34]). S concentration and speciation affect the energetics of both reactions. SO2/H2S ratios increase with oxygen fugacity (fO2), decreasing pressure, and the mole fraction of H2O. Considering the consistent amounts of both SO2 and H2S required for SO2 synproportionation, a contemporaneous release by magma degassing was invoked [35]. High T or decreasing pressure would favor the formation of SO2 and H2 [36,37]. Also, H2S oxidation by O2 2H2S(g)+ O2(g) = 2H2O(g) + 2/s S (L/s) was inferred to deposit a rate of S0 of 1.15 × 10⁷ kg/y beneath the acid sulfate waters at Poàs volcano [38] (Figure 2).

Figure 2.
NE view of Poás lake in April 2012. Sulfur spherules and mud floated on the lake’s surface. Photo by R. Mora Amador.
In the presence of water, SO2 disproportionation 3SO2(g) + 2H2Og/L = 2H2SO4(aq) + 1/2S0 occurs [35] mostly, and this is considered responsible for the (until recently) uncommon occurrence of elemental S0, found at submarine calderas [39,40]. The paths of this reaction vary depending on temperature, pH, redox state, and total sulfur content [41]. At high T > 300 °C, 4SO2 + 4H2O = H2S + 3H2SO4 is preferred, producing H2S, while more S0 would be produced at lower T through 3SO2(aq) + 2H2O = S0 + 2H2SO4; both of these reactions have H2SO4 as reaction product. The relative amounts of water, or SO2, modify the amounts of reaction products [39,40]. The reactions of SO2 synproportionation, like those invoked at crater lakes, have been recently proposed at the Kelp submarine caldera (South Atlantic) to explain the formation of native S0 occurring in different forms at two eruptive centers located 80 m apart within the caldera. These are characterized by different temperatures, different H2-H2S concentrations, and variable δ34S values [42]. Recent experiments [28] indicate that, below 210 °C, both SO2 syn- and disproportionation are likely to occur; meanwhile, above T > 275 °C, SO2 synproportionation is the most energetically feasible reaction, even if SO2 disproportionation could not be excluded. At T 220 °C, a molar ratio H2S:SO2 = 2:1 generates the maximum thermodynamic drive for synproportionation in a period of one day [28].
3. Influence of Impurities on S Behavior and Volcanic Implications
The influence of organics, hydrocarbons, H2S, ammonia, and halogens on pure S viscosity has been investigated for industrial purposes since the 1940s [43,44,45]. Notably, pure S reaches a maximum viscosity of 93.2 Pa·s between 186 and 188 °C, but a sharp change in viscosity occurs around 160 °C, due to polymerization (Figure 3A). Viscosity variations that are critical for impure S were found in both temperatures and heating rates, as follows.
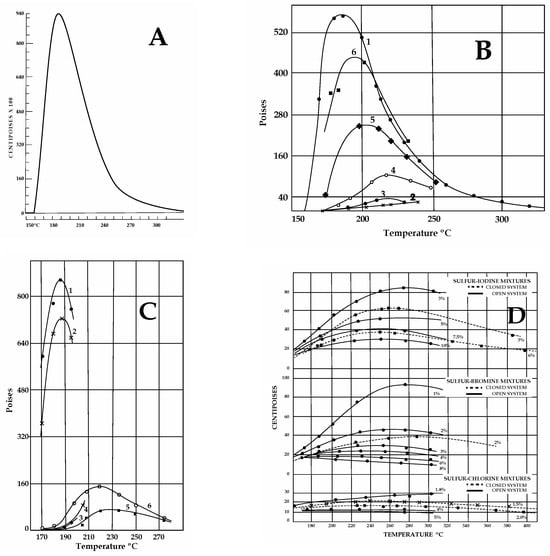
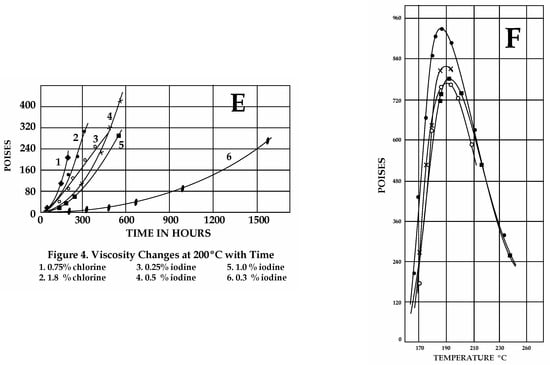
Figure 3.
Sulfur viscosities obtained from different experimental results in the 1940s (Scale: 1 cP = 0.001 Pa·s; 1 Poise = 0.1 Pa·s). (A) Pure S viscosity. Sharp magnitude increase at ≈160 °C. (B) Effect of organics. 1. S with >0.038 wt% organics, not previously heated at 180–200 °C. 2. Upon cooling after preheating (125–260 °C for 1 h 30′). Note the dramatic decrease in viscosity due to H2Sx formation. 3. With rising T after cooling (170 °C). 4. With rising T after cooling (160 °C for 14 h). 5–6. Viscosity with rising T after two cooling/heating cycles as in 4. (C) Effect of H2S. Line numbers: 1—untreated S; 2—after 100 h under H2S at 140 °C; 3–4—S with dissolved H2S after cooling and heating between 180 and 200 °C (H2Sxformation); 5–6—S+ H2S after cooling (170 °C) and reheating. (D) Effect of halogens at various concentrations with T in open or closed systems. Cl (2 wt%) lowers viscosity <0.015 Pa·s. Increasing concentrations (3-4-5 wt%) produce lower viscosities, independent of T (compare to A). For equal concentration values, in closed systems, viscosities are lower than in open systems. (E) Effects of halogens on S viscosity with time. Mixtures maintained at 190–200 °C over time (in hr), as indicated on the X axis. At 200 °C, chlorine is the most effective in lowering S viscosity, but it is highly volatile. Iodine is more persistent than chlorine; bromine is better at lowering viscosities than chlorine and iodine. (F) Effects induced on pure S viscosity by ammonia gas fluxed at T 140 °C. Curve 1: Untreated pure S. Curves 2, 3, and 4: Viscosity values for S treated with ammonia for 23–40 and 600 h, respectively. The drop in viscosity observed is not great and it can be attributed to H2Sx and H2S formation by reactions of ammonia gas with S. Maximum viscosity attained by pure S under a gas flux of ammonia at 190 °C is 60 Pa·s, indicating slow reactions for H2Sx formation. (A,D,E) Redrawn from Fanelli, R. (1946): “Modifying the Viscosity of Sulfur Industrial and Engineering Chemistry” 1946, 38, 39–43; (B,C,F) Redrawn from Bacon, R.F. Fanelli R. (1943) “The Viscosity of Sulfur” J. Am. Chem. Soc. 65, 639–648. The original reprinted figures from both publications are provided in the Supplementary Materials. See text for discussion.
- Organics/Hydrocarbons
The effects of organic matter (>0.01 wt%) or hydrocarbons were not evident until S samples were heated at a temperature that was high enough (180–210 °C Figure 3B) for trace amounts of hydrogen persulfides (H2Sx) to form [44]. However, modifications were more evident at a T of 260 °C [45]. Viscosity decreased (<4 Pa·s) during the first cooling cycle (170–230 °C), but this behavior disappeared after several heating–cooling cycles. Most organic material was destroyed after a few hours of boiling, separating as a black mass of CS2 [44]. Prolonged boiling of S with organics released H2S following H2Sx disruption. Strikingly, both CS2 and hydrogen persulfides were reported in S slicks floating at both Ruapehu and Yugama lakes [7]. Hydrocarbons modify the viscosity of pure S, but their effectiveness depends on the presence of H2S and hydrogen persulfides [45]. Different types of organic compounds and hydrocarbons (also bound with chlorine, fluorine, iodine, and bromine) and non-aromatic S-bearing species (i.e., CS2) have been reported in volcanic emissions from several volcanoes [46,47,48,49,50,51] and calderas [52,53,54] worldwide. Moreover, the inorganic production of hydrocarbons may also occur by reversible reduction in CO2 and oxidation of CH4 [55]. Low-molecular-weight aqueous hydrocarbons interact with H2O- and Fe-bearing mineral assemblages under controlled redox conditions [47]. The stability of hydrocarbons at elevated T-P reactions was experimentally found to be a function of time, temperature, and the presence of catalytically active aqueous S species.
- Hydrogen sulfide and persulfides
The effects of H2S on sulfur have been evaluated in open and closed conditions [44,45] (Figure 3C). As observed for organics, heating S samples with dissolved H2S between 180 and 210 °C lowered viscosities (<10 Pa·s), but prolonged heating at lower T (140 °C) under a flux of H2S. This was continuously replaced when lost by degassing (i.e., open conditions), and was able to shift the viscous behavior to lower values for pure S [44]. Moreover, a viscous stage was not attained when sulfur T was slowly raised (heating rate not provided [44]) from 125 to 190 °C under a H2S flux for one and a half hours (0.09 Pa·s, vs. 93.0 Pa·s at 183–188 °C for pure S). The lower viscosities were attributed to the formation of hydrogen persulfides (H2S-H2Sx) due to reactions between H2S and liquid S. Even if it is unstable during heating (e.g., H2S2 boils at 75 °C), H2Sx dissolves quickly in S at T~120 °C, but decomposition occurs only with increasing T (some of them decompose at 100 °C), liberating hydrogen sulfide [43]. Very low viscosities were obtained by bubbling H2S constantly through a S layer in an open system, but in a closed system, low viscosities could be maintained for an indefinite time [45]. When extrapolating these old results to volcanic settings, H2S released at the surface could be related to H2Sx decomposition (see Supplementary Materials Table S1). This component would not only alter the gaseous emissions at the surface (modifying the H2S/SO2 ratio) but also provide enough H2S to be available for further reactions (e.g., SO2 synproportionation) to occur, depositing native S. Alone, this mechanism would be able to form S layers during inter-eruptive periods across geological time. Moreover, considering the thermal stability of some H2Sx, decomposition could already occur at low T (~100 °C), liberating H2S. More critical for volcanic purposes, experiments indicate that the longer impure S is kept liquid at T above 180–200 °C, the higher viscosities are on cooling. This is because prolonged heating volatilizes H2Sx, decreasing their effect of lowering S viscosity. This behavior is critical for long-lasting composite volcanoes and calderas. Due to the low solubility of H2S in S, high H2S pressures are needed to cause very low viscosities at T from 160 to 360 °C [45]. Also, in recent experiments [28], conditions of 20–30 MPa (roughly 3 km as hydrostatic P) were used.
- Sulfur dioxide and sulfuric acid
In contrast to H2S, SO2 was not found to affect S viscosity [43,44]. Notably, SO2 is critical for monitoring purposes and participates in relevant reactions of S0 formation. Instead, H2SO4, a byproduct of SO2 disproportionation, was able to decrease S viscosity even in very small abundances (0.038–0.05 wt%) when T was raised over 1 h from 125 to 160 °C [45].
At volcanoes, H2SO4, whose formation depends on the amounts of water and SO2 reacting in the system, would, therefore, be able to decrease accumulated S viscosity even at low temperatures.
- Halogens
Halogens are also responsible for decreasing S viscosity. Fluorine and chlorine were most effective (low wt%) at maintaining a low sulfur viscosity for long periods in a closed system, followed by bromine and iodine (Figure 3D,E).
By occupying the terminal portions of polymers in S chains, halogens, like H2S, are persistent within mixtures. The persistency of halogens was observed when maintaining mixtures containing <1% of iodine, bromine, and chlorine at T of 190–200 °C. Between 157 and 300 °C in a closed system, S containing 2 wt% chlorine damped viscosities to 1 Pa·s [44]. Lower S viscosities could be maintained for indefinite periods under higher temperatures [45]. Even if chlorine was found to be the most effective in reducing viscosities, it was also found to be highly volatile (as SCl2) with respect to iodine and bromine [45]. Bromine was found to be the most persistent [44]. Recent experiments [28] indicate that SO2 synproportionation is sluggish in alkaline conditions, and native S only forms under acidic conditions (obtained by adding HCl to the experimental solution at T 220 °C). Chlorine was invoked to cause S0-depolymerization at T > 180 °C [44]. Halogens are ubiquitous in volcanic settings and can potentially disrupt the stratospheric level associated with S [56]. Maximum fluorine abundance occurs in felsic, continental magmatic rocks with highly evolved compositions [57]. The highest abundances of Cl have been found in intermediate–high-silica peralkaline magma inclusions in continental high-silica rhyolites; dacitic–rhyolitic melt inclusions contain somewhat higher values [58]. The occurrence of bromine in volcanic plumes, detected for the first time in 2003 [59], has been reported at various volcanoes, characterized by multiple degassing cycles (e.g., [35]); it has also been reported in association with chlorine [60,61].
- Ammonia
The effects of ammonia gas fluxed experimentally within pure S (in 23-40-600 h) were already evident at lower T (140 °C), also due to H2Sx formation [44] (Figure 3F). The longer the treatment, the greater the concentration of ammonia gas and the higher the viscosity that was achieved at higher T. Piochi et al. [62] reported the occurrence of NH4 as NH4-sulfates among components found at Pisciarelli—a bubbling mud pool near the Solfatara crater—within the Campi Flegrei caldera.
Recent Findings
Due to sulfur’s economic value as a raw material that is used in industrial production processes, several of its properties have been investigated since the 1940s, including the variations of elemental S viscosity under the influence of impurities. Past experiments [43,44,45] used capillary viscosimeters, graduated pipettes, and mercury thermometers to evaluate changes in viscosity at atmospheric pressure. Some of these outdated experiments were investigated using modern instruments (see [63,64,65] and the references therein), adding new evidence for the influence of hydrocarbons and hydrogen sulfide/persulfides in modifying sulfur viscosity. Most elemental sulfur is, in fact, recovered as a byproduct of crude oil and gas processing, following the modified Claus process [63]. This industrial liquid sulfur, condensed under small partial pressures of H2S, contains variable amounts of dissolved H2S, which needs to be removed before transportation, or the production of solid S products ([63] and references therein). The well-known anomalous increase in sulfur viscosity due to polymerization at T~160 °C, until a maximum is reached between 186 and 188 °C [43,44,45], represents a challenge for sulfur handling, transport, and storage [63,64,65]. An increasing H2S solubility in sulfur at T~120–220 °C (λ-transition [63]) was observed in outdated isobaric experiments [46]. The need to understand a sulfur flow behavior more precisely at temperatures around and above 160 °C led to studies aiming to obtain viscosity attenuation during heating–cooling processes; additionally, shear rates were sought within pipe flows and commercial S pumps, prompting new investigations [63,64]. Viscosity measurements were made at ranges 120 < T < 280 °C, on 200g of pure elemental S samples (99.992 wt%), containing measured hydrocarbons impurities of 50 ppm and H2S (0.4 ppm), using concentric cylinder rheometers. Wire platinum resistances were used for temperature measurements. Before measurements, toluene was used to remove viscosity standard remnants from the pressure cells [64,65].
Viscosity measurements, under variable shear rates, were made at 120 < T < 280 °C on several fresh molten sulfur charges (equilibrated for 2 h at 5 °C intervals at each T) on both heating and cooling runs [64,65]. The results indicated variable viscosities (32 Pa·s, 56 Pa·s, and 83 Pa·s) depending on the run considered until the fourth charge. These viscosities are lower than those (93.2 Pa·s) obtained at 186–188 °C in old experiments [42,43] during heating cycles. On cooling, maximum viscosity values were found to be smaller than those observed on heating; this was attributed to thermal hysteresis processes [64]. Different critical shear rates were observed at different Ts. Viscosities were coherent with those obtained in the 1940s [43,44]; this is the case only up to T of 210 °C [64,65].
FT-IR spectroscopic analyses on molten S, drained after analyses, evidenced higher amounts of total H2S (H2S + H2Sx) (tens–hundreds of ppm) with respect to those originally present in S samples, until the first four experimental charges had been completed [65]. H2S contents were attributed to the dehydrogenation of hydrocarbons, derived either from the hydrocarbon residues from standards used to calibrate the apparatus, or intrinsic hydrocarbon impurities within S. H2Sx amounts were attributed to the chemical dissolution of H2S [65]. S viscosities observed on cooling were even lower than those on heating experimental runs, when liquid S was heated at T > 210° C, and subsequently cooled. This non-time-dependent thermal hysteresis has been attributed to small amounts (50 ppm) of hydrocarbons reacting with sulfur [65]. For T > 160 °C, critical rates of shear thickening were observed, indicating that sulfur is not Newtonian across its entire liquid range [64].
4. Evidence of S Accumulation in the Absence of a Lake
S flows have been reported at several volcanoes where no crater lakes are present; among these is Vulcano, in Italy [66] (Figure 1), where the explosive Breccia di Commenda attests to an eruption of anomalously high amounts of S occurring ~1000–1200 CE [67].
At White Island, eruptions occurred over three weeks (from January to February 2013) through a variably dried mud pool within the crater, which includes native S [10]. At Poás, mud pools formed when the lake dried out before the occurrence of sulfur eruptions forming S cones [8]. Sulfur eruptions, contemporaneous to phreatic ones at short distances, produced S aggregates of mud and sulfur [68]. Similar aggregates were reported within pyroclastic density current (PDC) deposits of the 1982 eruption of El Chichón volcano, Mexico; this was interpreted to be formed by the explosive ejection of native sulfur accumulated within the hydrothermal system [69]. This eruption is well-known for the massive release of SO2 into the atmosphere, which raised the “excess –S problem” [16]. The eruption destroyed a central dome that was plugging the crater, which had formed after a significant Plinian eruption that occurred around 1320–1433 CE [70]. It has hosted a crater lake since the 1982 eruption. Intense fumarolic activity, hot springs, stalactites of native S, H2S emissions, and acid–sulfate alteration were concentrated around and on the flanks of the dome, plugging the crater before the 1982 eruption [71,72]. Within a year from the 1982 eruption, 3.8 × 10⁷ kg of native S was estimated to accumulate below the newly formed crater lake [73] (Figure 4). Extrapolating a deposition rate of 1.5 kg/s, Oppenheimer [74] estimated that a lapse of 100 years was necessary to accumulate the amount of S released within the stratospheric clouds of the 1982 eruption. Nevertheless, later studies [70] dated the eruption circa 550 years before 1982. This more extended quiescent period indicates the uncertainties in estimating the rate of S deposition within hydrothermal systems. The 1982 eruption means the possible accumulation of S layer(s) during inter-eruptive periods in the absence of a crater lake, as phreatic tables may act as lakes [25].

Figure 4.
View toward the northwestern sector of the crater of El Chichón volcano in 2009 from the viewpoint located at the end of the path to the crater (17°21′32.59′′ N 93°13′29.6′′ O).
5. Cyclic Degassing and Other Sources of Impurities
Gas measurements represent a critical surface observation in volcano monitoring, with other parameters, for triggering alert states for civil protection. Interpreting volcanic emissions at the surface has always been considered complex due to the nonlinear processes resulting from the interaction of multiple sources (magmatic, hydrothermal, and superficial) and the (often discontinuous) monitoring, which led to incomplete records of observations [30,75]. SO2 and CO2 are monitored for their magmatic genesis and relevance in unrest periods [32]. Long-term monitoring at several volcanoes worldwide, with or without crater lakes, reported periodic or cyclic gaseous emissions, mainly CO2 and SO2, lasting weeks–years [7,8,19,23,76,77,78,79,80]. When sampled, cyclic halogen emissions are also reported [81,82]. Like lake T cycling at crater lakes, periodic/cycling degassing could, therefore, also indicate the occurrence of sealing processes within S and/or gas species scrubbing by sulfur following chemical reactions, as attested by several examples (reviewed below).
At SHV (Soufrière Hills Volcano, Montserrat, Figure 1), the daily mean SO2 fluxes since the onset of continuous sampling (2002–2011) show a variable “periodicity” of weeks–months, which could not be conciliated with the closed-system degassing of a single magma batch. Long-term degassing trends appear to be independent of magma extrusion phases, and data indicating that more SO2 was degassed when the volcano was not erupting with respect to eruptive periods appear paradoxical [78]. At White Island, the records of 4 years of CO2, SO2, and H2S emission rates, starting in 2003, during lake growth, show cyclic emissions of CO2 and SO2 [23]. Native S deposition was inferred to have occurred during the first year of lake development. SO2 decrease was attributed to lake water scrubbing and Cl cycling due to tidal interferences [23]. At Yugama lake (Kusatzu–Shirane), periodic variations in Cl and SO4 contents within the lake waters were reported between 1996 and 2005 and explained by the growth of a sealing zone between the region of hot rocks surrounding degassing magma and a cool crust saturated with groundwater [8]. There was no increase in Yugama lake activity following a major distant earthquake in 2011 (Tohoku earthquake [8]). However, pH decreased in the lake waters of the Yugama crater, followed by earthquake swarms in 1989–1991 and in 2014, together with an increase in Cl within the waters [10,22]. Afterwards, yearly (eventually cyclic) increases in Cl (as Mg/Cl) within the crater lake waters were reported in 2018, 2019, and 2020. Despite the absence of magmatic intrusion at shallow depths, these changes were variously attributed to a “breach of the sealing zone” or a degassing through an “impermeable hot plastic rock” surrounding the crystallizing magma [21]. Instead, both pH decreases and Cl increases have been observed in the lake waters following seismic swarms; these could indicate the escape of chlorine already dissolved within a low-viscous S layer and not the input of fresh magmatic fluids in the system, as previously asserted in the literature [8]. No eruptions have occurred when a significant HCl input was evident in lake waters [21]. Strikingly, 70 to 83 wt% CS2 has been reported in S slicks from Yugama lake [7] and chromatograms have shown degassed hydrogen persulfides (H2Sx); these are considered to modify S viscosity by depolymerization [44]. These features attest to the separation of organic impurities from the low-viscosity sulfur layer(s) beneath the lake, which are subjected to prolonged heating, as observed in experiments.
5.1. Quiescent Periods: Effective—Undetected or Unreported?
The complexities in detecting unrest phases are evident even in volcanoes with long records of observation, considering the fact that most variations may remain unperceived, as described below.
- Vulcano (Aeolian Islands, Italy)
Periodicity in gaseous emissions, heat transfer, and seismic activity have also been evident at Vulcano (where activity started 5.5 ka ago). Alert levels were raised on 1 October 2021, following an increase in CO2-SO2 emissions, with very long period (VLP) seismic events, fumaroles’ T, and deformation signals starting in September 2021. However, recent retrospective analyses suggest the start of unrest originated between February and June 2021 [27]. “Low levels” of thermal activity [83] were reported in the two decades preceding the current (2021–present) phase of unrest [84]. Nevertheless, fluctuations in several geochemical/physical/geophysical parameters have been reported in the decades following the 1888–1890 eruption. Temperature variations at a main fumarolic field established in 1913 were reported in 1923–1924 and 1937 [85]. In March 1978, high-HCl and -SO2 fluxes were measured on the main fumarolic field, north of the La Fossa crater [86]; new fumaroles, roughly aligned NW-SE along a major transcurrent fault zone, opened at the end of 1978, which showed an increase in temperatures from 200 to 300 °C [87]. Increasing Br/Cl ratios within sublimates (salammoniac) and fumarolic gases occurred in 1977–1979, 1983–1984, and 1992–1993, and these were all attributed to the increasing inputs of magmatic gases; between 1983 and 1994, fumarolic T ranged from 689 to 695 °C [60]. A low-seismic-activity period within the crater was detected in 1967 and 1969, but the minimum detection limit was insufficient to detect possible weaker signals. Tape recordings from the stations at the La Fossa crater were available only in 1979 [87]. Here, swarm-type sequences at a depth of a few hundred meters increased in December 1979 and September 1980 [87]. Both low (2–5 Hz) frequencies (deep), and high (10 Hz) frequencies (from a few hundred meters–1 km depth) were recorded, with onsets showing upward movements. Between 1979 and 1980, the locations of seismic events varied in time and space, with a mean depth of 1 km [84], which is well above the depth that was recently suggested for a degassing magmatic source [81]. Similar double-type-seismic events were previously detected in 1968 by a single station on the crater rim, described as “gas explosions with a forerunning phenomenon” (Blot, 1971, in [87]). Oscillations in fumarolic temperatures reached a maximum T of 690 °C in 1992–1993, together with increasing VLP events; the same was found to increase again in 2004 and 2007, with an “impulsive onset” in 2007 [88]. During the recent 2021 unrest, both S-rich (CO2/SO2 < 10) and S-poor (CO2/SO2 > 10) areas occurred within the fumarolic fields [84]. The “unusually high” SO2 emissions in October–December 2021, accompanied by an uplift of ca. 3 cm, was attributed to the emplacement of ca. 3 × 10⁶ m3 of mafic magma at 4–5 km depth [84]. SO2 emissions decreased in January 2022, increasing again in May–June 2022, leading to an abrupt fluid venting in the Baia di Levante area, the site where colloidal S was reported in 1970 [89].
Both geochemical and geophysical evidence described above indicate that gases escaping through low-viscous S layer(s) accumulated within the hydrothermal system. The occurrence of S flows and colloidal S, described at Vulcano, suggest the accumulation of a S layer at depths of a few hundred meters–1 km, as attested to by seismic activity in the 1970s; these were similar to the depths (0.5–1 km) inferred for VLP events between 2004 and 2007 [86]. Geophysical evidence indicates processes occurring within the hydrothermal system, attesting to fluid escape and upward migration (seismic swarms). Also, variations in Br/Cl ratios within fumarolic emissions and salammoniac samples suggest a periodic escape of depolymerizing agents, similar to trends observed at other volcanoes hosting S layers. The variations in seismic loci in space and time, reported between 1979 and 1980, could be related to the uneven heating of an S layer and/or the presence of different S bodies, as attested to by S-rich and S-poor areas reported within the fumarolic field in 2021 by [84]. An optical and thermal infrared dataset from November 2018 depicts an altered area 10 times larger with respect to the main fumarolic field within the La Fossa crater [90]. The main thermal lineaments and gas emissions, oriented NW-SE, coincide with the major transcurrent lithospheric Tindari–Letoianni fault system. Systematic cluster changes in a NE-SW direction were also observed [90]. Both directions coincide with the main regional fault systems, but distinct spectral characteristics allow for the distinction of up to 13 subregions within the altered areas [90]. Spatial variability in gas composition (H2O, CO2, H2S HCl, HF, and HBr) and fumarole’s migration with time were attributed to differences in rock permeability [90]. All these variations may be attributed to a substance with wide variations in viscosity, such as impure sulfur. Recent multidisciplinary studies [91,92] on the causes of the 2021 unrest envisaged a “prolate-spheroidal” source at depths of 598 m below the La Fossa cone, which was similarly oriented NW-SE; this “inflated” and “deflated”, and was accompanied by degassing, seismicity, and ground deformation. This surficial body is likely to be native sulfur of low viscosity. Under the impure S hypothesis, higher SO2 emissions during the 2021 unrest phase could therefore only reflect the increasing escape of inert gas with respect to S accumulated at shallow depths following the decrease in S viscosity. The occurrence of cyclic emissions can be reasonably attributed to similar processes inferred for other volcanoes (Section 5). This interpretation differs from a “transient permeability increase, causing upward migration of hydrothermal fluids” [83] or the “pulses of degassing” from a deep magma body, invoked for the recent ongoing– unrest period at Vulcano [27,84]. The fluctuations of H2S/SO2 ratios observed during the last 45 years, could—in the opinion of the author—reasonably be attributed to a modulating action of S viscosity layers within the hydrothermal system. This hypothesis, which would explain several signals, is already partially accepted as a kind of “sealing” of the hydrothermal system; this was cited as a possible cause for the reduced SO2 flux in 2022 [84].
- Campi Flegrei caldera (Italy)
The periodic/cyclic gas release reported for volcanoes is accompanied by ground uplift of different entities within calderas, where fluid escape is prevented by the overlying (eventually altered) rocks above aquifer(s), acting as lakes at depth. An example is the mechanism of bradyseism at Campi Flegrei caldera (CFc). Within CFc, a minor phreatic eruption occurred in 1198 at Solfatara, where a tuff cone formed between 3.8 and 4.1 ka [93], at a site of hydrothermal activity that has been present since the times of Ancient Greece; this is a primary location of geophysical and geochemical anomalies to date [94]. The most recent eruption occurred in 1538 AD, preceded by decades of ground uplift, formed the Monte Nuovo tuff cone west of Pozzuoli [95]. Leveling measurements started in 1909. Most studies to date refer to an overall subsidence trend that started after the 1538 AD Mt Nuovo eruption and was interrupted by “minor” uplifts. Phases of uplift of different entities have been documented since the 19th century. Since recording with modern instruments, uplifts were reported in 1950–1951 (0.5 m, [96]), between mid-1969 and mid-1972 (“major” uplift, 1.8 m, at a rate of 5 mm/year), and between 1982 and 1984 (uplifting a 6 km area, with maximum uplifts at Pozzuoli harbor and Solfatara); these were accompanied by low seismic activity [97]. Major earthquakes occurred in May 1983 at Solfatara (Mw = 3.5) and in October 1983 at Pozzuoli (Mw = 4). The lack of data between 1977 and 1981 reflects the malfunctioning of tide gauges’ ability to record movement since 1970 [97].
The occurrence of S layer(s) beneath aquifer(s), located at various depths within CFc (0.5–1 km, 1.8–2 km, and 1.8–2 km [98]), is suggested by the following evidence: Geophysical features in the uppermost 3–4 km are controversial, according to data presented by different authors in the copious literature published since the 1980s. A solid-plastic interface at ~4 km [99] is inconsistent with magma presence [100,101,102,103]; this is in contrast with a sharp discontinuity at 7.5 km depth attributed to a CO2-rich trachybasaltic magma reservoir [103]. Seismicity concentrates between 2 and 3 km depth; the presence of “melt patches” attributed to “cracked material permeated by fluids” was reported at 2.5–3.5 km [104]. Elemental S and sulfides are reported in samples from the Solfatara crater [105] and in nuclei drilled in the 1980s at depths from 600 m to 2.6 km [106]. Variations in δ34S values for sulfides and native S have been considered to be complex [107], as reported at different eruptive centers within submarine calderas [42]. An increase in fumaroles’ S/C ratio, due primarily to H2S and CH4, was reported during the major unrest phase in 1982–1984 [94]. Dominant CH4 and N2 contents in gas emissions in the 1980s were attributed to the release of more fluids from the hydrothermal system, relative to magmatic output, but the changes in gas composition over the past 30 years have not demonstrated sufficient distinctive evidence to conclusively identify the contributor [106].
Ground uplifts, with constant periods of 5 years since 1984 [108], have been attributed either to mechanisms of fluid–rock interaction [109] or to repeated injections at depths of 1.5–3.0 km of isolated and small magma batches [105]. The time correspondence between maxima and minima in H2O/CO2, CH4/CO2, and H2S/CO2 gas ratios and ground deformation residuals at the Solfatara crater were considered to not be consistent with single magma batch degassing; therefore, they have been attributed to numerous small, magmatic reservoirs at different depths, whose contributions have declined over time [53]. A recent revision of the seismicity evidenced similarities between the LP swarms registered during minor and major uplifts (in 1980–1984, 1994, 2005, and 2014), and was attributed to fluid injection from depths of ~2.5 km and their transfer to ~0.75 km [110].
At Fangaia, a muddy lake with different degassing areas within the Solfatara crater, the integrated concentration maps of CO2 for different lake sectors in 2017 displayed different CO2/H2S ratios [111]. Low H2S values were interpreted as “efficient H2S scrubbing” through the aquifer beneath the crater ([107]; this is similar to what was invoked by Symmonds [112] for crater lakes. Instead, considering the profound interaction of H2S with S (see Section 2 and Supplementary Materials Table S1), scrubbing can be reasonably attributed to S layers at depths of 2–3 km, where no clear signature of a magmatic chamber exists [103]. Seismic swarms occurred at Solfatara on 28 May, 18 August, 2 September, and 7 September 2023, and were attributed to a pulsating degassing from a deep magma chamber (https://ingvvulcani.com/2023/09/09/lorigine-degli-sciami-sismici-ai-campi-flegrei-aggiornamento/ accessed on 10 December 2023). Notably, S eruptions at Poàs volcano were observed to occur at loci of former mud pools (see Section 4). Moreover, different manifestations (and/or eruptions) have been reported from different eruptive loci within the same structure, at several volcanoes with long eruptive histories, and at submarine calderas [29,39].
Seismic swarms, as described above, can be reasonably attributed to the degassing of “selected species” from sulfur layer(s) accumulated at shallow depths. Also, in this case, geochemical signals and ground deformation reveal periodicity and gas emissions that are inconsistent with the degassing occurring in a single magma chamber. Similar to what has been described at other volcanoes, the H2S increase reported in 1982–1984 [97] may instead attest to H2Sx decomposition. In fact, hydrogen persulfides, as previous experiments have indicated [43,44,45], can also form by reactions of S with hydrocarbons or ammonia (see Section 2, and Supplementary Materials Table S1), among the species reported in emissions at Solfatara. The differences in interpreting attenuation tomography results [104,113] under Solfatara, Pozzuoli, and Mt Nuovo (all areas are sites of previous eruptions) could be explained by sulfur viscosity variations spanning different orders of magnitude. A heterogeneous viscosity of S layer(s), caused by different S temperatures and/or the influence of impurities, may realistically resemble the “melt patch(es)” reported in indirect observations, as those described at depths of ~3–4 km in attenuation tomography [104].
A relationship between the occurrence of volcanic eruptions following high-magnitude earthquakes has been invoked in recent studies [114]. However, this relationship does not explain why significant unrest periods at CFc never culminated in eruptions. Only the last eruption of Monte Nuovo, in 1538, following only decades behind the catastrophic seismic sequence of 1456, was found to be characterized by the reactivation of several strike–slip faults (https://diss.ingv.it/diss330/dissmap.html accessed on 4 September 2023 [115]).
Instead, major unrest/uplift phases did follow major earthquakes in the area by years or decades (e.g., 1930, 1950, 1962, 1980, 1990–1991, and 2002). This occurrence suggests that seismic events were able to transfer critical geofluids; among these were H2S and CH4, which were able to modify the S viscosity of the bodies that accumulated beneath the aquifer(s), and which were variably heated by passive degassing from the deep magma chamber existing at a depth of 7.5 km beneath CFc [103]. In fact, the tectonic control of gaseous emissions is as important as magma ascent in providing certain gas types, which are essential for S viscosity variations. Major non-magmatic CO2, CH4, and H2S releases were reported in Italy [116]. Strike–slip faults, primarily controlled by deep crustal discontinuities, seem to be most critical in providing such fluids. H2S emissions have been reported after earthquakes, several km from the rupture loci; in the oldest accounts of CH4 emissions, mud volcanoes formation are reported—for example, in reports following the catastrophic 1456 seismic sequence started on December the 5th [116]. The 1456 seismic sequence preceded the 1538 Monte Nuovo eruption by decades. Besides the occurrence of mantle degassing in the crustal-stretched peri-Thyrrenian region, CO2 emissions also occur by carbonate–rock anatexis at shallow depths (2–3 km [116]). All this evidence indicates—in the author’s opinion—several non-magmatic paths of critical depolymerizing S gases moving toward the surface.
6. Discussion and Future Routes
In recent years, multiple lines of evidence have been found to be supportive of a perspective that was presented a few years ago [24]. Native S has occurred in different forms, at multiple volcano eruptive loci; it has recently been reported in submarine calderas, indicating that sulfur accumulation occurs in several volcanic settings by way of several reaction pathways.
Experiments have demonstrated that quick reactions and short time lapses are needed for S deposition [28]. Several components which cause changes in sulfur viscosity can likely be provided through structural discontinuities, as recent data have indicated [116], and not only by magmatic degassing.
Past experiments evidenced changes in viscosity for impure S occurring mostly at T < 400 °C [43,44,45]; 400 °C is the temperature below which Giggenbach [32] warned about the occurrence of complex reactions due to the presence of liquid-phase condensates, groundwater, and soluble gases partitioning. The assumption of equilibrium is only valid with increasing temperatures [32]. Recent experiments using SO2 and H2S (with the addition of halogens as HCl [28]) confirm the occurrence of different reactions occurring at T < 300 °C. Both heating rates and temperature intervals—crucial to maintaining low-S viscosities (i.e., avoiding system sealing by viscosity increase)—were poorly constrained in past experiments.
More recent experiments using concentric cylinder rheometers [64,65] have confirmed that hydrogen sulfide/persulfides and hydrocarbons, in quantities of a few tens of ppm, are able to modify sulfur T < 300 °C. Non-time-dependent thermal hysteresis was observed when liquid S was heated above 210 °C and subsequently cooled. This behavior was attributed to small amounts (50 ppm) of hydrocarbons reacting with sulfur [65]. A critical rate of shear thickening at T > 160 °C was found to indicate that sulfur does not have Newtonian properties over its entire liquid range [64].
Important implications for our current methods of volcanic monitoring can be drawn based on the evidence that has been presented in previous sections. Most research to date reports component ratios using H2S. The H2S/SO2 molar ratio is considered to be valuable for distinguishing the S fraction produced in the hydrothermal system (e.g., [84,111]). But chemical interactions within S (Section 3) indicate that this ratio can be misleading. In fact, H2S measured at the surface could also be derived by reactions following H2Sx disruption, which may occur at very low T (i.e., 100–120 °C see Supplementary Materials Table S1). Furthermore, total gas concentrations extrapolated to large areas (e.g., [111]) should be avoided, considering the fact that multiple degassing paths may occur through a single S layer depending on its viscosity conditions. Recent experiments [28] have shown that single reaction paths around 200 °C already favor the emissions of different reaction products, some of which (e.g., H2SO4-H2S, ammonia) are critical in maintaining a low-viscous behavior, after T ≈ 200 °C is exceeded. In closed systems, in the presence of H2Sx—or halogens, which are common in volcanic systems [117]—a low-viscous sulfur behavior can be maintained indefinitely, providing evidence for the long-lasting phenomena observed at calderas. Moreover, H2Sx are stabilized by the presence of S, H2S, and organic compounds (Section 4), providing long-lasting phenomena. To date, the onset of unrest periods at several volcanoes have occurred from significant increases in SO2 or CO2 emissions (considered HT magmatic gases), increases in fumarolic temperatures, and increases in seismic activity. These variations can be misleading in the presence of reactions occurring within impure S. At a low level of viscosity, all species not interacting chemically with S (CO2-SO2 if taken singularly) would be able to escape more easily at the surface compared to others (like H2S(x) or HCl [44,45]); these can remain deeply chemically bound to S, depending on the temperature and heating rates involved. Peaks in degassing of CO2 or SO2 could, therefore, only indicate the escape of gases which are not reacting chemically with S—when S viscosity is low enough. This condition may occur following particular heating rates and/or in cases where maximum T is achieved and/or the selective reactions occurring within the S volume(s) are involved. CO2 emissions are not necessarily a result of magmatic degassing, but they are possibly also produced by carbonate anatexis in areas characterized by high heat flows [116]. Inorganic production of hydrocarbons may follow [55]. Hydrocarbons have been proven to interact with sulfur [44,45], forming hydrogen persulfides, which may decompose, releasing H2S. Furthermore, SO2 emissions at the surface might interact (in a temperature-dependent manner) with available H2S, and not reflect the actual amount of degassed SO2. As demonstrated by experimental results at T > 200 °C [28], native S formation depends on several reactions occurring between H2S and SO2, but both elemental S formation and H2S/SO2 ratios could be modified by HT (>400 °C) SO2 interaction with calcic minerals within rocks [31].
In experiments, the reactions of H2S with pure S were found to be responsible not only for producing hydrogen persulfides but also for stabilizing them [44,45]. The decrease in S viscosities observed following reactions of S with hydrocarbons depends upon the presence of H2S. Accounting for these past results alongside new experimental evidence [64,65], the heterogeneous emissions at the surface reported in both space and time in several volcanic settings (e.g., [109]) can be reasonably attributed to a heterogeneous viscous state of S, depending on which component (e.g., hydrogen sulfide, organics, hydrocarbons, halogens, or ammonia) reacts or has reacted (in an unknown time–space frame) with accumulated native S at depth (Figure 5). Critically, after several cycles of heating and cooling, common in volcanic areas, the temperature at which a S viscosity increase occurs shifts to lower values (Section 3). Therefore, in volcanic settings, higher viscosities can be expected during cooling following long periods of heating. This behavior would lead to low or no gas emissions at the surface and eventually no seismic activity (i.e., no precursory signals); this contrasts with what is currently considered to be indicative of major unrest periods. In fact, according to industrial experiments taken as references, prolonged heating destroys viscosity-modifying substances (e.g., H2Sx or chlorine [44,45]), determining a S viscosity increase after a certain number of heating and cooling cycles, leading to system sealing. Under this hypothesis, the long record of uplifts and downward movements (e.g., bradyseism) would correspond to gas released from S bodies, within which they accumulate and—depending on their type—eventually chemically interact with sulfur, for an indetermined time. Unpredicted eruptions would, therefore, occur following critical (long-lived) periods of unrest, as observed in calderas (see Section 5.1, Figure 5). Earthquakes accompanied by major emissions of gas species like hydrocarbons, ammonia, and/or halogens, would therefore indicate the release of gases “stored” within sulfur and chemically interacting with it. Critical gas types—considered to be magmatic (e.g., halogens)—could be erroneously considered to be magmatic input(s) (see Section 5) instead of just “sulfur-depolymerizing agents” accumulated and interacting within S layer(s).
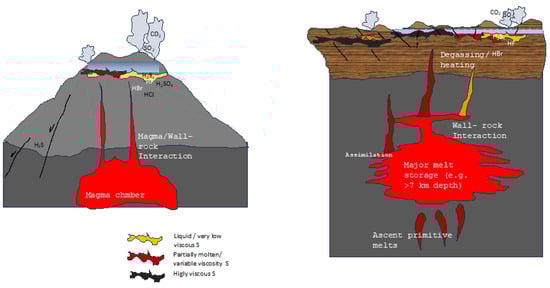
Figure 5.
Illustrations displaying the primary ideas stated in the text. S deposition in layers beneath phreatic tables may occur in the upper portions of the hydrothermal system(s), either at composite volcanoes (left) or at calderas (right), by several chemical reactions. The presence of impurities (halogens, H2S, hydrocarbons, ammonia), transferred to native S layers through magmatic degassing or faults, can cause the same layers to vary their viscosity differently; this depends on the maximum temperature achieved on heating and the heating rates. Surface manifestations (periodic degassing, uplifts, seismicity) vary depending on the viscous state of S below the phreatic tables. The schematic drawing does not report the possible accumulation of S along magmatic conduits, the occurrence of which is likely, as the main surface deformations in restless calderas point towards horizontally extended layers. Note that major degassing (and uplift) occurs only when S viscosity is low (yellow or red in the schematic drawings), not when the viscosity is high (dark gray) when an eruption, unheralded by precursory signals, eventually occurs (i.e., no seismicity, no degassing, no ground movement). Not to scale. See text for details and discussion.
Recent cases presented in this review demonstrate the complex issue of determining the inception of unrest phenomena in volcanic settings (Section 5.1). Early evidence of unrest has retrospectively occurred months before an alert was raised, based on slight variations in temperature, along with geochemical and geophysical parameters. Considering the multiple chemical reactions occurring within S described in this review, a coherent way of determining background values is difficult to conceive. This is exacerbated by the lack of continuous monitoring during most of a volcano’s history. Considering that accumulated S can be volatilized during large eruptions [75], scarce (e.g., sulfur aggregates [69]) or absent traces of S presence could be seen in the stratigraphic record, leading to an incomplete and misleading overview of the information. Extrapolating the spatial and temporal scale of accumulated S layers is a difficult task. Recent cases of unrest indicate the occurrence of multiple zones possessing contrasting temperatures, gas emissions, and isotopic values (e.g., [90,105]). Notably, variable signals in temperatures, gas types, pH, and δ34S values have been measured at small distances within volcanoes, and at multiple loci within calderas. Such variability has been interpreted as being a result of multiple degassing pathways and/or pulsating-magma-induced degassing. An alternative explanation might be that different gas species are released due to chemical reactions within accumulated S volumes that possess uneven S viscosities within hydrothermal systems.
Possible evidence of S layer accumulation within complex systems is difficult to track, and the temporal scale of S layer accumulation may take a long time in large-scale and complex edifices, causing variable gaseous emissions at the surface, contrasting isotopic data, and geophysical signals, as recently described in submarine and subaerial settings. In addition, the oxidation of accumulated S at the surface during eruptions [75] might leave no stratigraphic records. The tools that are considered to be fundamental in discriminating the contribution from different sources and processes, like isotopes [75,118], also provide puzzling results, particularly for S species, depending on the chemical reactions occurring within S and their reaction products. Multiple reaction paths could produce a large range in the isotopic composition of elemental S, H2S, or sulfate. This wide range could cause isotope signature overprinting of native sulfur and other involved S species, which has already been observed [42,118]. Changes in seismic signal patterns, interpreted as indicating gas pressurization or “seal breaching” following system sealing, have been recently published based on retrospective data analyses of well-monitored volcanoes [119,120,121,122]. Although promising, these studies must be validated in several other volcanic settings. Even when they are available, continuous-monitoring systems often only cover a short lapse of time with respect to geologic timescales, and this prevents a more complete overview of phenomena. Several signals can remain undetected due to the quality of instruments used for monitoring purposes over the past century, the only recent start of modern monitoring, or the malfunctioning of some of those that eventually prevent a complete historical record.
7. Conclusions
In conclusion, there is a need to rethink the hazard assessment protocol in relation to volcanoes based on important variations in impure S viscosity at variable temperatures. Efforts should be devoted to improving existing experimental settings or designing new ones that are useful for understanding the contributions of single gas components, and a combination of them, at different temperatures and pressures.
To date, the role of S impurities in system sealing processes has been neglected; therefore, increases in both seismic activity and certain gas types (notably SO2 and CO2) are expected as eruptive precursors at volcanoes. There is no modelling on how the presence of impure S impacts gas ratios and abundance at the surface.
Considering the long lifetimes of magmatic residences, the processes of magma mingling/mixing, the assimilation of country rocks hosting magma reservoirs—which are able to provide different sources of volatiles—the addition of critical species through lithospheric discontinuities during major earthquakes, and the very recent and discontinuous records of observations at most volcanoes, an accurate scaling of S accumulation phenomenon and eruption inception methods that are useful for civil protection purposes seem unrealistic at this time.
Multiple efforts should be devoted to refining our understanding of all possible reaction paths (their possible temporal scales and modifications during interactions) under the influence of different components. Further research steps to take should include the following:
(A) Scalable thermodynamic modelling of S reactions at the low pressures that are typical of hydrothermal systems, evaluating the influences of both single kinds of impurities and those caused by different reaction products on S viscosity. Modelling should consider different temperature intervals and heating rates lower than 400 °C for organics, hydrocarbons, hydrogen sulfides/persulfides, and ammonia. It should also account for higher temperatures to evaluate the influence of halogens on sulfur viscosity variations and the possible interactions among them.
(B) Sets of carefully planned experiments using modern instruments at pressures typical of hydrothermal systems should be undertaken. The experiments should aim to better constrain the heating rate variations and/or maximum T, which is responsible for the dramatic viscosity changes during heating and cooling cycles, as observed in past and recent experiments. Recent experimental results [64,65] have evidenced that even small amounts of impurities in residual hydrocarbons can determine measurable changes in viscosity. Trace amounts of hydrocarbons that are inherently present within S react at T > 210 °C, producing H2S, which in turn modifies viscosities upon cooling. Non-time-dependent thermal hysteresis at T 210 °C [65] should be further investigated while considering the variations that are observed at the same temperature in other recent experiments [28]. Investigations should consider further temperature intervals <400 °C for organics, hydrocarbons, hydrogen sulfides/persulfides, and ammonia. They should also consider higher temperature intervals for halogens, which are considered equally important as S viscosity modifiers [42,43,44]. FT-IR spectroscopy experiments and combustion carbon analyses—proven to be valuable tools in obtaining the total amount of H2S formed by reactions of sulfur with/hydrocarbons and hydrogen sulfides [64,65]. Further experiments should continue investigating the precise amounts of H2Sx formed by reactions of sulfur with other impurities (e.g., ammonia); they should also investigate the precise amounts of halogens that are present, as these are also critical for S depolymerization [43,44,45]. Of paramount importance would be trying to scale these processes to natural volcanic settings.
(C) Fieldwork should focus on trying to find evidence of the explosive ejection of sulfur in pyroclastic deposits, and to carefully analyzing the composition of solid materials floating on crater lake waters (e.g., S slicks); eventually, such investigations should take place within the phreatic table waters within volcanic areas.
A thorough examination of historical documents, which can then be integrated with present record analyses, is paramount in deciphering complex behaviors. Robust geochemical modelling should be combined with examining all existing records, both eruptive and non-eruptive. The sharing of critical data and common efforts among several research groups could help our collective research to achieve critical objectives in the future.
Supplementary Materials
The following supporting information can be downloaded at: https://www.mdpi.com/article/10.3390/geosciences14040097/s1, Table S1: Schematic effects of different components on sulfur viscosity at different temperatures, with respect to pure sulfur (maximum µ = 93.2 Pa·s at 186–188 °C) according to experimental industrial studies in the 1940s [43,44,45]. Data refer to components mixed/fluxed with(in) the pure substance. (*) refers to the maximum values measured Common products and interactions between components are shown. Supplementary Figure S1: Original from which Figure 3A–F, in the text, were redrawn. (A,D,E) Adapted and reprinted with permission from Fanelli, R., (1946): Modifying the viscosity of Sulfur Industrial and Engineering Chemistry 1946, 38, 39–43 (B,C,F) Adapted and reprinted from Bacon, R.F. Fanelli R. (1943) The viscosity of Sulfur J. Am. Chem. Soc. 65, 639–648. Copyrights (1943; 1946) American Chemical Society.
Funding
This research received no external funding. The publication costs of this work were partly covered by “ITERAS, Research Centre for Sustainability and Territorial Innovation” (Bari, Italy), using the resources of the 5 × 1000 fund, allocated by the Italian Ministry of University and Research.
Data Availability Statement
Research data used for this review have been either published in scientific journals, or shared using Creative Common CCY-BY Licenses.
Acknowledgments
Thank you to Male Noyola (BBCT-UNAM) for providing me with helpful information for years, even when not in an academic institution. Simon Hughes (TerraDat) and Adrienne Sewel are greatly thanked for their help with language editing. Adriano Lavopa is thanked for his assistance in graphics editing. My sisters, Francesca Scolamacchia and Maria Scolamacchia, are thanked for fruitful discussions and advice. Editorial handling by Gianluca Groppelli, and comments by reviewers, contributed to improving the quality of the manuscript.
Conflicts of Interest
The author declares no conflicts of interest.
References
- Kawasaki, H. Genesis of sulphur on the volcano Shirane. J. Geol. Soc Tokio 1903, 10, 425–428. [Google Scholar]
- Ohashi, R. On the peculiar sulphur sperules produced in a crater lake of the volcano Shirane, in the province of Kozuke, central Japan. J. Akita Min. Coll 1919, 1, 1–10. [Google Scholar]
- Delmelle, P.; Bernard, A. The Remarkable Chemistry of Sulfur in Hyper-Acid Crater Lakes: A Scientific Tribute to Bokuichiro Takano and Minoru Kusakabe. In Volcanic Lakes; Rouwet, D., Christenson, B., Tassi, F., Vandemeulebrouck, J., Eds.; Springer: Berlin/Heidelberg, Germany, 2015; pp. 239–259. [Google Scholar]
- Fournier, N.; Moreau, M.; Robertson, R. Disappearance of a crater lake: Implications for potential explosivity at Soufrière volcano, St Vincent, Lesser Antilles. Bull. Volcanol. 2011, 73, 543–555. [Google Scholar] [CrossRef]
- Christenson, B.W.; Reyes, A.G.; Young, R.; Moebis, A.; Sherburn, S.; Cole-Baker, J.; Britten, K. Cyclic processes and factors leading to phreatic eruption events: Insights from the September 25 2007 eruption through Ruapehu Crater Lake, New Zealand. J. Volcanol. Geotherm. Res. 2010, 191, 15–32. [Google Scholar] [CrossRef]
- Mora-Amador, R.; Rouwet, D.; Vargas, P.; Oppenheimer, C. The extraordinary sulfur volcanism of Poás from 1828 to 2018. In Poas Volcano. Active Volcanoes of the World; Tassi, F., Vaselli, O., Mora-Amador, R., Eds.; Springer: Cham, Switzerland, 2019. [Google Scholar] [CrossRef]
- Takano, B.; Saitoh, H.; Takano, E. Geochemical implications of subaqueous molten sulfur at Yugama crater lake, Kusatsu-Shirane volcano, Japan. Geochem. J. 1994, 28, 199–216. [Google Scholar] [CrossRef]
- Ohba, T.; Hirabashi, J.I.; Nogami, K. Temporal changes in the chemistry of lake water within Yugama Crater, Kusatsu-Shirane Volcano, Japan: Implications for the evolution of the magmatic hydrothermal system. J. Volcanol. Geotherm. Res. 2008, 178, 131–144. [Google Scholar] [CrossRef]
- Oppenheimer, C.; Stevenson, D. Liquid sulphur lakes at Poás volcano. Nature 1989, 342, 790–793. [Google Scholar] [CrossRef]
- Edwards, M.J.; Kennedy, B.M.; Jolly, A.D.; Scheu, B.; Jousset, P. Evolution of a small hydrothermal eruption episode through a mud pool of varying depth and rheology, White Island, NZ. Bull. Volcanol. 2017, 79, 16. [Google Scholar] [CrossRef]
- Skinner, B.J. A sulfur lava flow on Mauna Loa. Pac. Sci. 1970, 24, 144–145. [Google Scholar]
- Colony, W.E.; Nordlie, B.E. Liquid sulfur at Volcan Azufre, Galapagos Islands. Econ. Geol. 1973, 68, 371–380. [Google Scholar] [CrossRef]
- Greeley, R.; Theililig, E.; Christensen, P. The Mauna Loa sulfur flow as an analog to secondary sulfur flows (?) on Io. Icarus 1984, 60, 189–199. [Google Scholar] [CrossRef]
- Naranjo, J.A. Sulphur flows at Lastarria volcano in the North Chilean Andes. Nature 1985, 313, 778–780. [Google Scholar] [CrossRef]
- Inostroza, M.; Fernandez, B.; Aguilera, F.; Layana, S.; Walter, T.R.; Zimmer, M.; Rodríguez-Díaz, A.; Oelze, M. Physical and chemical characteristics of active sulfur flows observed at Lastarria volcano (northern Chile) in January 2019. Front. Earth Sci. 2023, 11, 1197363. [Google Scholar] [CrossRef]
- Luhr, J.F.; Carmichael, I.S.E.; Varekamp, J.C. The 1982 eruptions of El Chichón Volcano, Chiapas, Mexico: Mineralogy and petrology of the anhydrite bearing pumices. J. Volcanol. Geotherm. Res. 1984, 23, 69–108. [Google Scholar] [CrossRef]
- Francis, P.; Oppenheimer, C.; Stevenson, D. Endogenous growth of persistently active volcanoes. Nature 1993, 366, 554–557. [Google Scholar] [CrossRef]
- Wallace, P.; Gerlach, T.M. Magmatic vapor source for sulfur dioxide released during volcanic eruptions: Evidence from Mount Pinatubo. Science 1994, 265, 497–499. [Google Scholar] [CrossRef] [PubMed]
- Gerlach, T.M.; Westrich, H.R.; Symonds, R.B. Preeruption vapor in magma of the climactic Mount Pinatubo eruption: Source of the giant stratospheric sulfur dioxide cloud. In Fire and Mud, Eruptions and Lahars of Mount Pinatubo, Philippines; Newhall, C., Punongbayan, A.S., Eds.; USGS-PHYVOLC: Sioux Falls, SD, USA, 1996. [Google Scholar]
- Christenson, B.W.; Wood, C.P. Evolution of a vent-hosted hydrothermal system beneath Ruapehu Crater Lake, New Zealand. Bull. Volcanol. 1993, 55, 547–565. [Google Scholar] [CrossRef]
- Yaguchi, M.; Ohba, T.; Terada, A. Groundwater Interacting at Depth with Hot Plastic Magma Triggers Phreatic Eruptions at Yugama Crater Lake of Kusatsu-Shirane Volcano (Japan). Front. Earth Sci. 2022, 9, 741742. [Google Scholar] [CrossRef]
- Lewis, D. Science agency on trial following deadly White Island volcano eruption. Nature 2021, 598, 243–244. [Google Scholar] [CrossRef]
- Werner, C.; Hurst, T.; Scott, B.; Shernburn, S.; Christenson, B.W.; Britten, K.; Cole-Baker, J.; Mullan, B. Variability of passive gas emissions, seismicity, and deformation during crater lake growth at White Island Volcano, New Zealand 2002–2006. J. Geophys. Res. 2008, 113. [Google Scholar] [CrossRef]
- Scolamacchia, T.; Cronin, S.J. Idiosyncrasies of volcanic sulfur viscosity and the triggering of unheralded volcanic eruptions. Front. Earth Sci. 2016, 4, 24. [Google Scholar] [CrossRef]
- Scolamacchia, T. Impurity of Sulfur Layers and Magmatic Gas Scrubbing: Implications for Gas Monitoring. In Proceedings of the AGU Fall Meeting 2017, New Orleans, LA, USA, 11–15 December 2017; p. V33D-2658. Available online: https://www.authorea.com/doi/full/10.1002/essoar.b76b5f07a2ad5d2b.bbbc5c50caaa4b91.1 (accessed on 1 November 2023). (In Authorea).
- Montanaro, C.; Mick, E.; Salas-Navarro, J.; Caudron, C.; Cronin, S.J.; de Moor, J.M.; Scheu, B.; Stix, J.; Strehlow, K. Phreatic and Hydrothermal Eruptions: From Overlooked to Looking Over. Bull. Volcanol. 2022, 84, 64. [Google Scholar] [CrossRef]
- Paillot-Bonnetat, S.; Raffin, V.; Harris, A.; Diliberto, I.S.; Ganci, G.; Cappello, A.; Bouoire, G.; Grassa, F.; Gattuso, A.; Ramsey, M. Anatomy of thermal unrest at a hydrothermal system: Case study of the 2021–2022 crisis at Vulcano. Earth Planets Space 2023, 75, 159. [Google Scholar] [CrossRef]
- Kürzinger, V.; Hansen, C.T.; Strauss, H.; Wu, S.; Bach, W. Experimental evidence for the hydrothermal formation of native sulfur by synproportionation. Front Earth Sci. 2023, 11, 1132794. [Google Scholar] [CrossRef]
- Carroll, M.; Webster, J. Solubilities of sulfur, noble gases, nitrogen, chlorine, and fluorine in magmas. Rev. Mineral. Geochem. 1994, 30, 231–279. [Google Scholar]
- Potter, S.H.; Scott, B.J.; Jolly, G.E.; Neal, V.E.; Johnston, D.M. Introducing the Volcanic Unrest Index (VUI): A tool to quantify and communicate the intensity of volcanic unrest. Bull. Volcanol. 2015, 77, 77. [Google Scholar] [CrossRef]
- Henley, R.W.; Fischer, T.P. Sulfur sequestration and redox equilibria in volcanic gases. J. Volcanol. Geotherm. Res. 2021, 412, 107181. [Google Scholar] [CrossRef]
- Giggenbach, W.F. Chemical composition of volcanic gases. In Monitoring and Mitigation of Volcano Hazard; Scarpa, R., Tilling, R.I., Eds.; Springer: Berlin/Heidelberg, Germany, 1996; pp. 221–256. [Google Scholar] [CrossRef]
- Giggenbach, W.F. Redox processes governing the chemistry of fumarolic gas discharges from White Island, New Zealand. Appl. Geochem. 1987, 2, 143–161. [Google Scholar] [CrossRef]
- Mizutani, Y.; Sagiura, T. The Chemical Equilibrium of the 2H2S+SO2 =3S+2H2O 639 Reaction in Solfataras of the Nasudake Volcano. Bull. Chem. Soc. Jpn. 1966, 39, 2411–2414. [Google Scholar] [CrossRef]
- Oppenheimer, C.; Tsanev, V.I.; Braban, C.F.; Cox, R.A.; Adams, J.W.; Aiuppa, A.; Bobroski, N.; Delmelle, P.; Barclay, J.; McGonigle, A.J.S. BrO formation in volcanic plumes. Geochem. Cosmochim. Acta 2008, 70, 2935–2941. [Google Scholar] [CrossRef]
- Aiuppa, A.; Inguaggiato, S.; McGonigle, A.J.S.; O Dwyer, M.; Oppenheimer, C.; Padgett, M.J.; Rouwet, D.; Valenza, M. H2S fluxes from Mt. Etna, Stromboli, and Vulcano (Italy) and implication for the sulfur budget at volcanoes. Geochem. Cosmochim. Acta 2005, 69, 1861–1871. [Google Scholar] [CrossRef]
- Wallace, P.J.; Plank, T.; Edmonds, M.; Hauri, E.H. Volatiles in Magmas. In Encyclopedia of Volcanoes, 2nd ed.; Sigurdsson, H., Houghton, B.F., Eds.; Elsevier/Academic Press Amsterdam: Boston, MA, USA, 2015; pp. 163–183. [Google Scholar] [CrossRef]
- Rowe, G.L.; Shinji, O.A.; Takano, B.; Brantley, S.; Fernandez, L.; Barquero, J.F. Using Crater Lake chemistry to predict volcanic activity at Poás Volcano, Costa Rica. Bull. Volcanol. 1992, 54, 494–503. [Google Scholar] [CrossRef]
- Seewald, J.S.; Reeves, E.P.; Bach, W.; Saccocia, P.J.; Craddock, P.R.; Walsh, E.; Shanks, W.C.; Sylva, S.P.; Pichler, T.; Rosner, M. Geochemistry of hot-springs at the SuSu Knolls hydrothermal field, Eastern Manus Basin: Advanced argillic alteration and vent fluid acidity. Geochim. Cosmochim. Acta 2019, 255, 25–48. [Google Scholar] [CrossRef]
- Peters, C.; Strauss, H.; Haase, K.; Bach, W.; de Ronde, C.E.J.; Kleint, C.; Stucker, V.; Diehl, A. SO2 disproportionation impacting hydrothermal sulfur cycling: Insights from multiple sulfur isotopes for hydrothermal fluids from the Tonga-Kermadec intraoceanic arc and the NE Lau Basin. Chem Geol. 2021, 586, 120586. [Google Scholar] [CrossRef]
- Kusakabe, M.; Komoda, Y.; Takano, B.; Abiko, T. Sulfur isotopic effects in the disproportionation reaction of sulfur dioxide in hydrothermal fluids: Implications for the δ34S variations of dissolved bisolfate and elemental sulfur from active crater lakes. J. Volcanol. Geotherm. Res. 2000, 97, 287–307. [Google Scholar] [CrossRef]
- Kürzinger, V.; Diehl, A.; Pereira, S.I.; Strauss, H.; Bohrmann, G.; Bach, W. Sulfur formation associated with coexisting sulfide minerals in the Kemp Caldera hydrothermal system, Scotia Sea. Chem. Geol. 2022, 606, 120927. [Google Scholar] [CrossRef]
- Bacon, R.F.; Fanelli, R. Purification of Sulfur. Ind. Eng. Chem. 1942, 34, 1043–1048. [Google Scholar] [CrossRef]
- Bacon, R.F.; Fanelli, R. The viscosity of sulfur. J. Am. Chem. Soc. 1943, 65, 639–648. [Google Scholar] [CrossRef]
- Fanelli, R. Modyfing the viscosity of Sulfur. Ind. Eng. Chem. 1946, 38, 39–43. [Google Scholar] [CrossRef]
- Stoiber, R.E.; Williams, S.N.; Huebert, B. Annual contribution of sulfur dioxide to the atmosphere by volcanoes. J. Volcanol. Geotherm. Res. 1987, 33, 1–8. [Google Scholar] [CrossRef]
- Seewald, J.S. Evidence for metastable equilibrium between hydrocarbons under hydrothermal conditions. Nature 1994, 370, 285–287. [Google Scholar] [CrossRef]
- Jordan, A. Volcanic formation of halogenated organic compounds. In The handbook of Environmental Chemistry; Gribble, G.W., Ed.; Springer: New York, NY, USA, 2003; Volume 3, pp. 121–139. [Google Scholar] [CrossRef]
- Capaccioni, B.; Martini, M.; Mangani, F. Light hydrocarbons in hydrothermal and magmatic fumaroles: Hints of catalytic and thermal reactions. Bull. Volcanol. 1995, 56, 593–600. [Google Scholar] [CrossRef]
- Capaccioni, B.; Taran, Y.; Tassi, F.; Vaselli, O.; Mangani, G.; Macías, J.L. Source conditions and degradation processes of light hydrocarbons in volcanic gases: An Example from El Chichón volcano (Chiapas State, Mexico). Chem. Geo 2004, 206, 81–96. [Google Scholar] [CrossRef]
- Frische, M.; Garofalo, T.; Hansteen, T.H.; Borchers, R. Fluxes and origins of halogenated organic trace gases from Momotombo volcano (Nicaragua). Geochem. Geophys. Geosystems 2006, 7, 1–14. [Google Scholar] [CrossRef]
- Chiodini, G.; Caliro, S.; Cardellini, C.; Granieri, D.; Avino, R.; Baldini, A.; Donnini, M.; Minopoli, C. Long-term variations of the Campi Flegrei, Italy, volcanic system as revealed by the monitoring of hydrothermal activity. J. Geophys. Res. Solid Earth 2010, 115, B03205. [Google Scholar] [CrossRef]
- Moretti, R.; Arienzo, I.; Civetta, L.; Orsi, G.; Papale, P. Multiple magma degassing sources at an explosive volcano. Earth Planet. Sci. Lett. 2013, 367, 95–104. [Google Scholar] [CrossRef]
- Tassi, F.; Venturi, S.; Cabassi, J.; Capecchiacci, F.; Nisi, B.; Vaselli, O. Volcanic organic compounds (VOCs) in soil gases from Solfatara crater (Campi Flegrei, southern Italy): Geogenic source(s) vs. biogeochemical processes. Appl. Geochem. 2015, 56, 37–49. [Google Scholar] [CrossRef]
- Taran, Y.; Giggenbach, W.A. Geochemistry of light hydrocarbons in subduction-related volcanic and hydrothermal fluids. In Volcanic, Geothermal, and Ore-Forming Fluids: Rulers and Witnesses of Processes Within the Earth; Simmons, S.F., Graham, I., Eds.; Society of Economic Geologists, Inc.: Littleton, CO, USA, 2003; pp. 61–74. [Google Scholar]
- Self, S.; Blake, S.; Sharma, K.; Widdowson, M.; Sephton, S. Sulfur and Chlorine in Late Cretaceous Deccan Magmas and eruptive gas release. Science 2008, 319, 1654–1657. [Google Scholar] [CrossRef]
- Webster, J.D.; Duffield, W.A. Extreme halogen abundances in tin-rich magma of the Taylor Creek Rhyolite, New Mexico. Econ. Geol. 1994, 89, 840–850. [Google Scholar] [CrossRef]
- Lierenfeld, M.B.; Zajacz, Z.; Bachmann, O.; Ulmer, P. Sulfur diffusion in dacitic melt at various oxidation states: Implications for volcanic degassing. Geochim. Cosmochim. Acta 2018, 226, 50–68. [Google Scholar] [CrossRef]
- Bobrowski, N.; Honninger, G.; Galle, B.; Platt, U. Detection of bromine monoxide in a volcanic plume. Nature 2003, 42, 273–276. [Google Scholar] [CrossRef]
- Coradossi, N.; Garavelli, A.; Salamida, M.; Vurro, F. Evolution of Br/Cl ratios in fumarolic salammoniac from Vulcano (Aeolian Islands, Italy). Bull. Volcanol. 1996, 58, 310–316. [Google Scholar] [CrossRef]
- Kutterolf, S.; Hansteen, T.; Freundt, A.; Wehrmann, H.; Appel, K.; Krüger, K.; Pérez, W. Bromine and chlorine emissions from Plinian eruptions along the Central American Volcanic Arc: From source to atmosphere. Earth Planet. Sci. Lett. 2015, 429, 234–246. [Google Scholar] [CrossRef]
- Piochi, M.; Kilburn, C.R.J.; Di Vito, M.A.; Mormone, A.; Tramelli, A.; Troise, C.; De Natale, G. The volcanic and geothermally active Campi Flegrei caldera: An integrated multidisciplinary image of its buried structure. Int. J. Earth Sci. 2014, 103, 401–421. [Google Scholar] [CrossRef]
- Mariott, R.A.; Fitzpatrick, E.; Lesage, K.L. The solubility of H2S in liquid sulfur. Fluid Phase Equilibria 2008, 269, 69–72. [Google Scholar] [CrossRef]
- Sofekun, G. Rheometric Properties of Pure Liquid Elemental Sulfur. Master’s Thesis, University of Calgary, Calgary, AB, Canada, 2017. [Google Scholar] [CrossRef]
- Sofekun, G.O.; Evoy, E.; Lesage, N.C.; Mariott, R.A. The rheology of liquid elemental sulfur across the λ_transition. J. Rheol. 2018, 62, 469. [Google Scholar] [CrossRef]
- Harris, A.; Carniel, R.; Patrick, M.; Dehn, J. The sulfur flow fields of the Fossa di Vulcano. Bull. Volcanol. 2004, 66, 749–759. [Google Scholar] [CrossRef]
- Gurioli, L.; Zanella, E.; Gioncada, A.; Sbrana, A. The historic magmatic-hydrothermal eruption of the Breccia di Commenda, Vulcano, Italy. Bull. Volcanol. 2012, 74, 1235–1254. [Google Scholar] [CrossRef]
- Oppenheimer, C. Sulphur eruptions at Volcán Poás, Costa Rica. J. Volcanol. Geoth. Res. 1992, 49, 1–21. [Google Scholar] [CrossRef]
- Scolamacchia, T.; Dingwell, D.B. Sulfur as a binding agent of aggregates in explosive eruptions. Bull. Volcanol. 2014, 76, 871. [Google Scholar] [CrossRef]
- Macías, J.L.; Arce, J.L.; Mora, J.C.; Espíndola, J.M.; Saucedo, R.; Manetti, P. A 500-year-old Plinian eruption at El Chichón volcano, Chiapas, Mexico: Explosive volcanism linked to reheating of the magma reservoir. J. Geoph. Res. 2003, 108, 2569. [Google Scholar] [CrossRef]
- Scolamacchia, T.; Capra, L. El Chichón Volcano: Eruptive History. In Active Volcanoes of Chiapas: EL Chichón and Tacaná; Scolamacchia, T., Macías, J.L., Eds.; Springer: Berlin, Germany, 2015; pp. 45–76. [Google Scholar] [CrossRef]
- Peiffer, L.; Rouwet, D.; Taran, Y. Fluid geochemistry of El Chichòn volcano-hydrothermal system. In Active Volcanoes of Chiapas: EL Chichón and Tacaná; Scolamacchia, T., Macías, J.L., Eds.; Springer: Berlin, Germany, 2015; pp. 77–95. [Google Scholar] [CrossRef]
- Casadevall, T.J.; de la Cruz-Reyna, S.; Rose, W.I.; Bangley, S.; Finnegan, D.L.; Zoller, W.H. Crater lake and post-eruption hydrothermal activity, El Chichón Volcano, Mexico. J. Volcanol. Geot. Res. 1984, 23, 169–175. [Google Scholar] [CrossRef]
- Oppenheimer, C. On the role of hydrothermal systems in the transfer of volcanic sulfur to the atmosphere. Geoph. Res. Lett. 1996, 23, 2057–2060. [Google Scholar] [CrossRef]
- Oppenheimer, C.; Fischer, T.P.; Scaillet, B. Volcanic Degassing: Process and Impact. Treatise on Geochemistry, 4, 2nd ed.; Elsevier: Amsterdam, The Netherlands, 2014; pp. 111–179. [Google Scholar] [CrossRef]
- Edmonds, M.; Oppenheimer, C.; Pyle, D.M.; Herd, R.A.; Thompson, G. SO2 emissions from Soufrière Hills Volcano and their relationship to conduit permeability, hydrothermal interaction and degassing regime. J. Volcanol. Geotherm. Res. 2003, 124, 23–43. [Google Scholar] [CrossRef]
- Hautmann, S.; Gottsmann, J.; Sparks, R.S.; Costa, A.; Melnik, O.; Voight, B. Modelling ground deformation caused by oscillating overpressure in a dyke conduit at Soufrière Hills Volcano, Montserrat. Techtonophysics 2009, 471, 87–95. [Google Scholar] [CrossRef]
- Edmonds, M.; Aiuppa, A.; Humphreys, M.; Moretti, R.; Giudice, G.; Martin, R.S.; Herd, R.A.; Christopher, T. Excess volatiles supplied by mingling of mafic magma at an andesite arc volcano. Geochem. Geophys. Geosyst. 2010, 11. [Google Scholar] [CrossRef]
- Loughlin, S.C.; Luckett, R.; Ryan, G.; Christopher, T.; Hards, V.; De Angelis, S.; Jones, L.; Strutt, M. An overview of lava dome evolution, dome collapse and cyclicity at Soufrière Hills Volcano, Montserrat, 2005–2007. Geophys. Res. Lett. 2010, 37, L00E16. [Google Scholar] [CrossRef]
- Christopher, T.; Edmonds, M.; Taisne, B.; Odbert, H.; Costa, A.; Hards, V.; Wadge, G. Periodic sulphur dioxide degassing from the Soufrière Hills Volcano related to deep magma supply. Geol. Soc. Lond. Spec. Publ. 2014, 410, 123–141. [Google Scholar] [CrossRef]
- Ohno, M.; Utsugi, M.; Toshiya, M.; Itsuro, M.; Tsuneomi, K.; Yoshikazu, T. Temporal variation in the chemical composition (HCl/SO2) of volcanic gas associated with the volcanic activity of Aso Volcano, Japan. Earth Planet Space 2013, 65, e1–e4. [Google Scholar] [CrossRef]
- Warnach, S.; Bobrowski, N.; Hidalgo, S.; Arellano, S.; Sihler, H.; Dinger, F.; Lübcke, P.; Battaglia, J.; Steele, A.; Galle, B.; et al. Variation of the BrO/SO2 Molar Ratio in the Plume of Tungurahua Volcano Between 2007 and 2017 and Its Relationship to Volcanic Activity. Front Earth Sci. 2019, 7, 132. [Google Scholar] [CrossRef]
- Harris, A.; Alparone, S.; Bonforte, A.; Dehn, J.; Gambino, S.; Lodato, L.; Spampinato, L. Vent temperature trends at the Vulcano Fossa fumarole field: The role of permeability. Bull. Volcanol. 2012, 74, 1293–1311. [Google Scholar] [CrossRef]
- Aiuppa, A.; Bitetto, M.; Calabrese, S.; Delle Donne, D.; Lages, J.; La Monica, F.P.; Chiodini, G. Mafic magma feeds degassing unrest at Vulcano Island, Italy. Commun. Earth Environ. 2022, 3, 255. [Google Scholar] [CrossRef]
- De Astis, G.; D’Oronzo, D.; Di Vito, M. A review of the tectonic, volcanological and hazard history of Vulcano (Aeolian Islands, Italy). Terra Nova 2023, 35, 471–487. [Google Scholar] [CrossRef]
- Sabroux, J.C. Measurements of gas discharges at Vulcano (Italy). Bull. Volcanol. 1982, 45, 277–278. [Google Scholar] [CrossRef]
- Del Pezzo, E.; Martini, M. Seismic events under Vulcano, Aeolian Islands, Italy. Bull. Volcanol. 1981, 44, 521–525. [Google Scholar] [CrossRef]
- Alparone, S.; Cannata, A.; Gambino, S.; Gresta, S.; Miluzzo, V.; Montalto, P. Time-space variation of volcano-seismic events at La Fossa (Vulcano, Aeolian Islands, Italy): New insights into seismic sources in a hydrothermal system. Bull. Volcanol. 2010, 72, 803–816. [Google Scholar] [CrossRef]
- Schultz, O. Unterwasserbeobachtungen im sublitoralen Solfatarenfeld von Vulcano (Äeolische Inseln), Italien. Miner. Depos. 1970, 5, 315–319. [Google Scholar]
- Müller, D.; Bredemeyer, S.; Zorn, E.; De Paolo, E.; Walter, T.R. Surveying fumarole sites and hydrothermal alteration by unoccupied aircraft systems (UAS) at the La Fossa cone, Vulcano Island (Italy). J. Volcanol. Geotherm. Res. 2021, 413, 107208. [Google Scholar] [CrossRef]
- Di Traglia, F.; Bruno, V.; Casu, F.; Cocina, O.; De Luca, C.; Giudicepietro, F.; Macedonio, G.; Mattia, M.; Monterroso, F.; Privitera, E.; et al. Multi-temporal InSAR, GNSS and seismic measurements reveal the origin of the 2021 Vulcano Island (Italy) unrest. Geophys. Res. Lett. 2023, 50, e2023GL104952. [Google Scholar] [CrossRef]
- Federico, C.; Cocina, O.; Gambino, S.; Paonita, A.; Branca, S.; Coltelli, M.; Italiano, F.; Bruno, V.; Caltabiano, T.; Camarda, M.; et al. Inferences on the 2021 OngoingVolcanic Unrest at Vulcano Island (Italy) through a Comprehensive Multidisciplinary Surveillance Network. Remote Sens. 2023, 15, 1405. [Google Scholar] [CrossRef]
- Di Vito, M.A.; Isaia, R.; Orsi, G.; Southon, J.; de Vita, S.; D’Antonio, M.; Pappalardo, L.; Piochi, M. Volcanism and deformation since 12,000 years at Campi Flegrei caldera (Italy). J. Volcanol. Geotherm. Res. 1999, 91, 221–246. [Google Scholar] [CrossRef]
- Chiodini, G.; Vandemeulebrouck, J.; Caliro, S.; D’Auria, L.; De Martino, P.; Mangiacapra, A.; Petrillo, Z. Evidence of thermal-driven processes triggering the 2005-2014 unrest at Campi Flegrei caldera. Earth Planet. Sci. Lett. 2015, 414, 58–67. [Google Scholar] [CrossRef]
- de Vivo, B.; Belkin, H.E.; Barbieri, M.; Chelini, W.; Lattanzi, P.; Lima, A.; Tolomeo, L. The Campi Flegrei (Italy) geothermal system: A fluid inclusion study of the mofete and San Vito fields. J. Volcanol. Geotherm. Res. 1989, 36, 303–326. [Google Scholar] [CrossRef]
- Del Gaudio., C.; Aquino, I.; Ricciardi, G.P.; Ricco, C.; Scandone, R. Unrest episodes at Campi Flegrei: A reconstruction of vertical ground movements during 1905–2009. J. Volcanol. Geotherm. Res. 2010, 195, 48–56. [Google Scholar] [CrossRef]
- Barberi, F.; Corrado, G.; Innocenti, F.; Luongo, G. Phlegrean Fields 1982–1984: Brief Chronicle of a Volcano Emergency in a Densely Populated Area. J. Volcanol. Geotherm. Res. 1984, 47, 175–184. [Google Scholar]
- Guglielminetti, M. Mofete Geothermal Field. Geothermics 1986, 15, 781–790. [Google Scholar] [CrossRef]
- Ferrucci, F.; Hirn, A.; De Natale, G.; Virieux, J.; Mirabile, L. P-SV conversion at shallow boundary beneath Campi Flegrei caldera (Italy): Evidence for the magma chamber. J. Geophys. Res. Solid Earth 1992, 97, 15351–15359. [Google Scholar] [CrossRef]
- De Natale, G.; Troise, C.; Pingue, F. A mechanical fluid-dynamical modeling for ground movements at Campi Flegrei caldera. J. Geodyn. 2001, 32, 487–517. [Google Scholar] [CrossRef]
- De Natale, G.; Troise; Pingue, F.; Mastrolorenzo, G.; Pappalardo, L.; Battaglia, M.; Boschi, E. The Campi Flegrei caldera: Unrest mechanisms and hazards. In Mechanisms of Activity and Unrest at Large Calderas; Troise, C., De Natale, G., Kilburn, C.R.J., Eds.; Geol. Society of London: London, UK, 2006; pp. 25–45. [Google Scholar]
- Zollo, A.; Judenherc, S.; Auger, E.; D’Auria, L.; Virieux, J.; Capuano, P.; Chiarabba, C.; de Franco, R.; Makris, J.; Michelini, A.; et al. Evidence for the buried rim of Campi Flegrei caldera from 3-D active seismic imaging. Geophys. Res. Lett. 2003, 30, 2002. [Google Scholar] [CrossRef]
- Zollo, A.; Maercklin, N.; Vassallo, M.; Dello Iacono, D.; Virieux, J. Gasparini, P. Seismic reflections reveal a massive melt layer feeding Campi Flegrei caldera. Geophys. Res. Lett. 2008, 35. [Google Scholar] [CrossRef]
- De Siena, L.; Del Pezzo, E.; Bianco, F. Seismic attenuation imaging of Campi Flegrei: Evidence of gas reservoirs, hydrothermal basins, and feeding systems. J. Geophys. Res. 2010, 115. [Google Scholar] [CrossRef]
- Piochi, M.; Mormone, A.; Balassone, G.; Strauss, H.; Troise, C.; De Natale, G. Native sulfur, sulfates and sulfides from the active Campi Flegrei volcano (southern Italy): Genetic environments and degassing dynamics revealed by mineralogy and isotope geochemistry. J. Volcanol. Geotherm. Res. 2015, 304, 180–193. [Google Scholar] [CrossRef]
- Mormone, A.; Tranelli, A.; Di Vito, M.A.; Piochi, M.; Troise, C.; De Natale, G. Secondary hydrothermal minerals in buried rocks at the Campi Flegrei caldera, Italy: A possible tool to understand the rock-physics and to assess the state of the volcanic system. Period. Mineral. 2011, 80, 385–406. [Google Scholar] [CrossRef]
- Piochi, M.; Mormone, A.; Strauss, H.; Balassone, G. The acid-sulfate zone and the mineral alteration styles of the Roman Puteolis (Neapolitan area, Italy): Clues on fluid fracturing progression at the Campi Flegrei volcano. Solid Earth Discuss. 2019, 10, 1809–1831. [Google Scholar] [CrossRef]
- Gaeta, S.; De Natale, G.; Peluso, F.; Mastrolorenzo, G.; Castagnolo, D.; Troise, C.; Pingue, F.; Mita, G.; Rossano, S. Genesis and evolution of unrest episodes at Campi Flegrei caldera: The role of thermal fluid-dynamical processes in the geothermal system. J. Geophys. Res. 1998, 103, 20921–20933. [Google Scholar] [CrossRef]
- Chiodini, G. CO2/CH4 ratio in fumaroles a powerful tool to detect magma degassing episodes at quiescent volcanoes. Geophys. Res. Lett. 2008, 36. [Google Scholar] [CrossRef]
- D’Auria, L.; Giudicedipietro, F.; Aquino, I.; Borriello, G.; Del Gaudio, C.; Lo Bascio, D.; Martini, M.; Ricciardi, G.; Ricciolino, P.; Ricco, C. (Repeated fluid-transfer episodes as a mechanism for the recent dynamics of Campi Flegrei caldera (1989–2010). J. Geophys. Res. 2011, 116. [Google Scholar] [CrossRef]
- Rouwet, D.; Tamburello, G.; Ricci, T.; Sciarra, A.; Capecchiacci, F.; Caliro, S. CO2 and H2S degassing at Fangaia mud pool, Solfatara, Campi Flegrei (Italy): Origin and dynamics of the pool basin. Minerals 2020, 10, 1051. [Google Scholar] [CrossRef]
- Symonds, R.B.; Gerlach, T.M.; Reed, M.H. Magmatic gas scrubbing: Implications for volcano monitoring. J. Volcanol. Geotherm. Res. 2001, 108, 303–341. [Google Scholar] [CrossRef]
- de Lorenzo, S.; Zollo, A.; Mongelli, F. Source parameters and three-dimensional attenuation structure from the inversion of microearthquake pulse width data: Qp imaging and inferences on the thermal state of the Campi Flegrei caldera (southern Italy). J. Geophys. Res. 2001, 106, 16265–16286. [Google Scholar] [CrossRef]
- Gonzalez, G.; Fujita, E.; Shibazachi, B.; Hayashida, T.; Chiodini, G.; Lucchi, F.; Yokoama, I.; Nemeth, K.; Amador, R.M.; Moya, A.; et al. Increment in the volcanic unrest and number of eruptions after the 2012 large earthquakes sequence in Central America. Sci. Rep. 2021, 11, 22417. [Google Scholar] [CrossRef]
- Fracassi, U.; Valensise, G. Unveiling the sources of the catastrophic 1456 multiple earthquake: Hints to an unexplored tectonic mechanism in southern Italy. Bull. Seism Soc. Am. 2007, 97, 725–748. [Google Scholar] [CrossRef]
- Vannoli, P.; Martinelli, G.; Valensise, G. The seismotectonic significance of geofluids in Italy. Front. Earth Sci. 2021, 9, 579390. [Google Scholar] [CrossRef]
- Aiuppa, A.; Baker, D.R.; Webster, J.D. Halogens in volcanic systems. Chem. Geol. 2019, 263, 1–18. [Google Scholar] [CrossRef]
- Kleine, B.I.; Gunnarsson-Robin, J.; Kamunya, K.M.; Ono, S.; Stefánsson, A. Source control on sulfur abundance and isotope fractionation in hydrothermal fluids in the Olkaria geothermal field, Kenya. Chem. Geol. 2021, 582, 120446. [Google Scholar] [CrossRef]
- Caudron, C.; Girona, T.; Taisne, B.; Gunawan, H.; Kristianyo, K. Change in seismic attenuation as a long term precursor of gas-driven eruptions. Geology 2019, 47, 632–636. [Google Scholar] [CrossRef]
- Dempsey, D.; Cronin, S.; Mei, S.; Kempa-Liehr, A.W. Automatic precursor recognotion and real-time forecasting of sudden explosive volcanic eruptions at Whakaari New Zealand. Nat. Commun. 2020, 11, 3662. [Google Scholar] [CrossRef]
- Ardid, A.; Dempsey, D.; Caudron, C.; Cronin, S. Seismic precursors to the Whakaari 2019 phreatic eruption are transferable to other eruptions and volcanoes. Nat. Commun. 2022, 13, 2002. [Google Scholar] [CrossRef] [PubMed]
- Ardid, A.; Dempsey, D.; Caudron, C.; Cronin, S.; Miller, C.A.; Melchor, I.; Syahbana, D.; Kennedy, B. Using template matching to detect hidden fluid release episodes beneath crater lakes in Ruapehu, Copoahue and Kawah Ijen volcanoes. J. Geophys. Res. Solid Earth 2023, 128, e2023JB026729. [Google Scholar] [CrossRef]
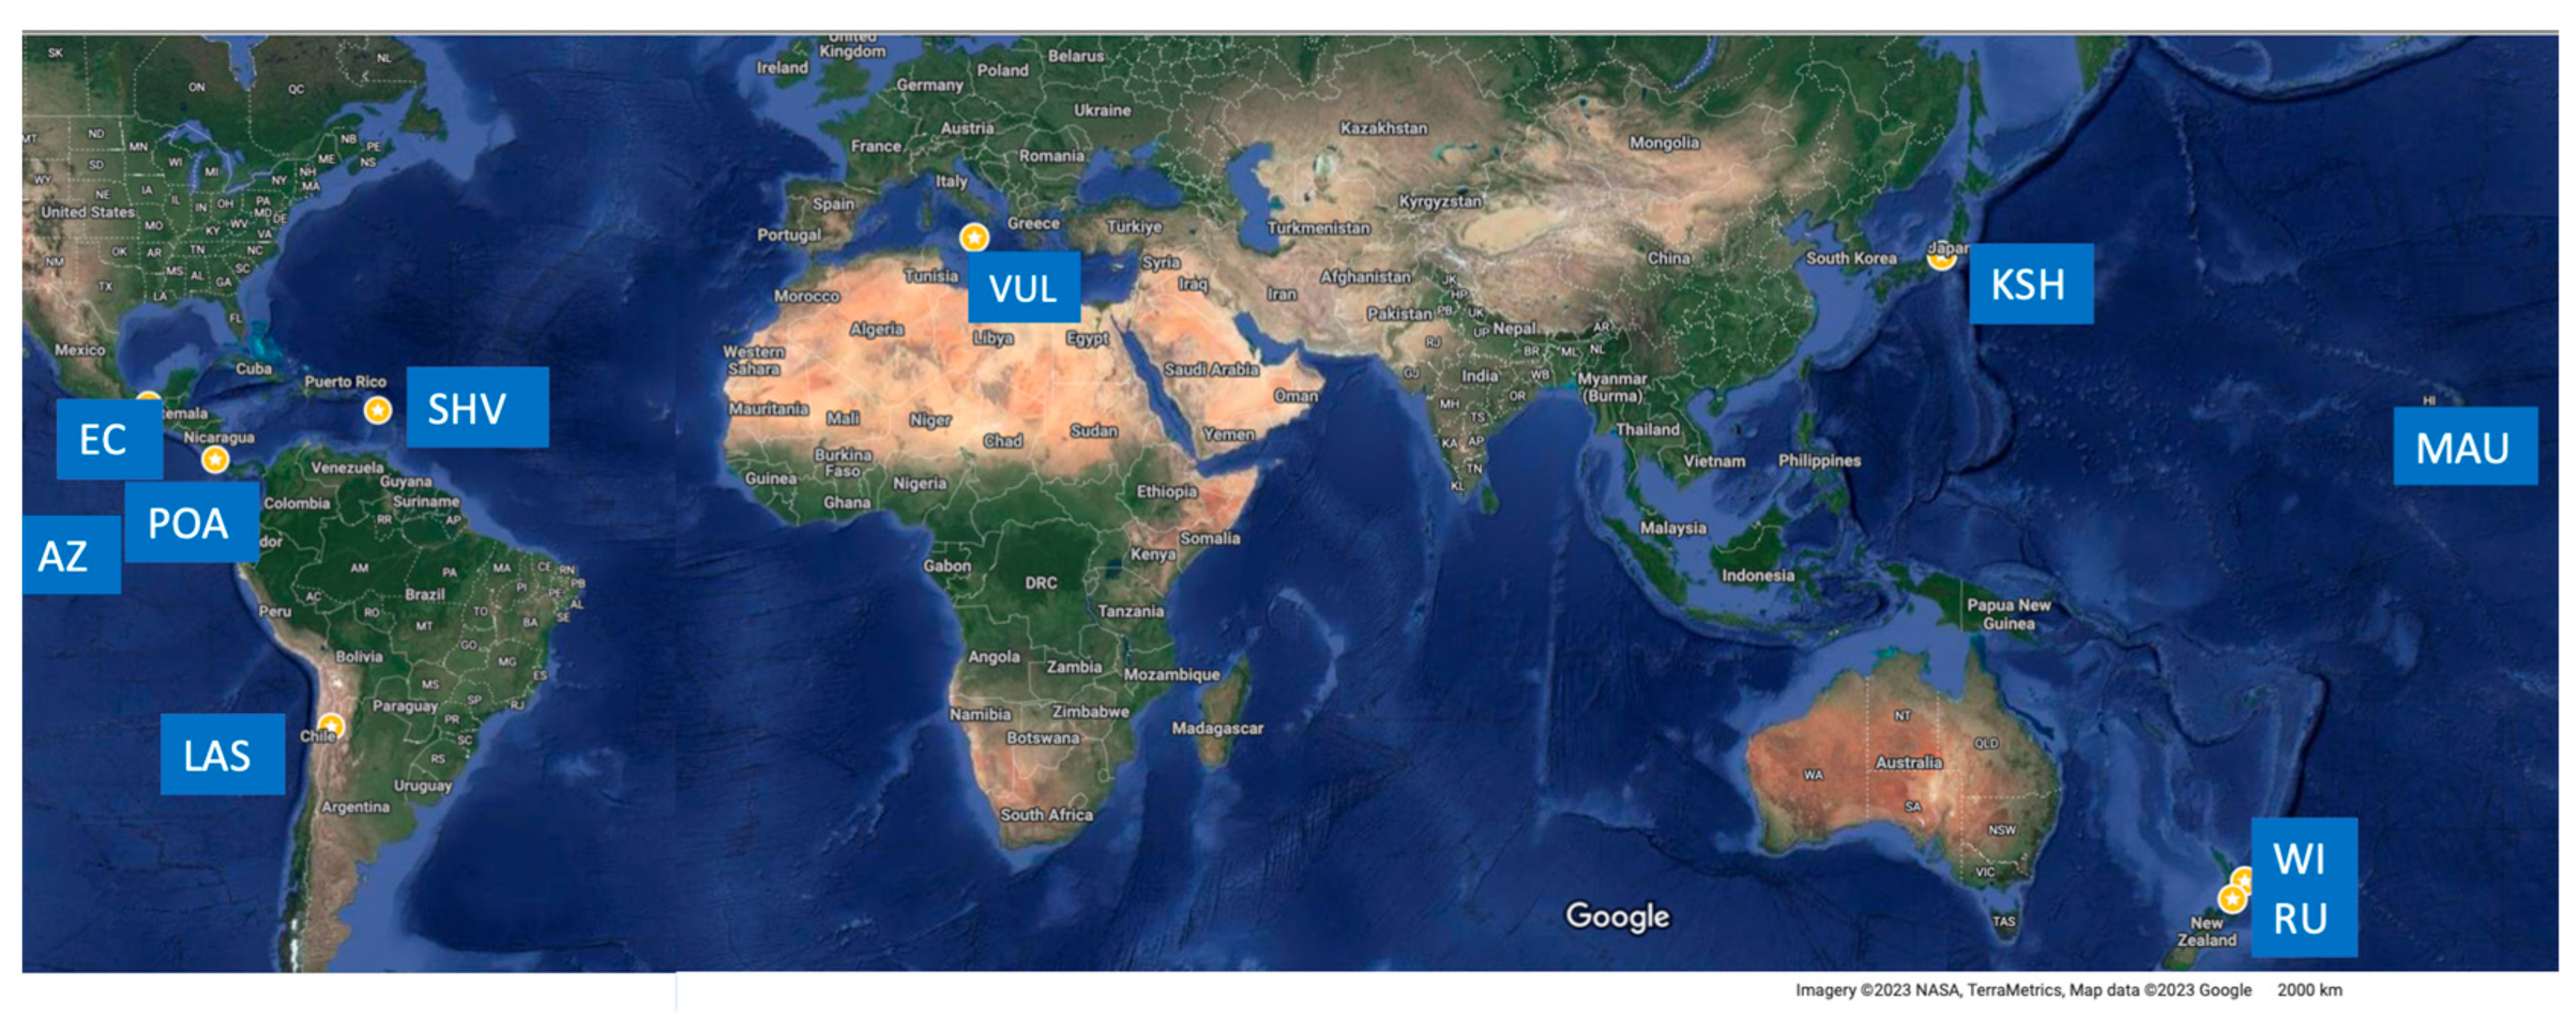
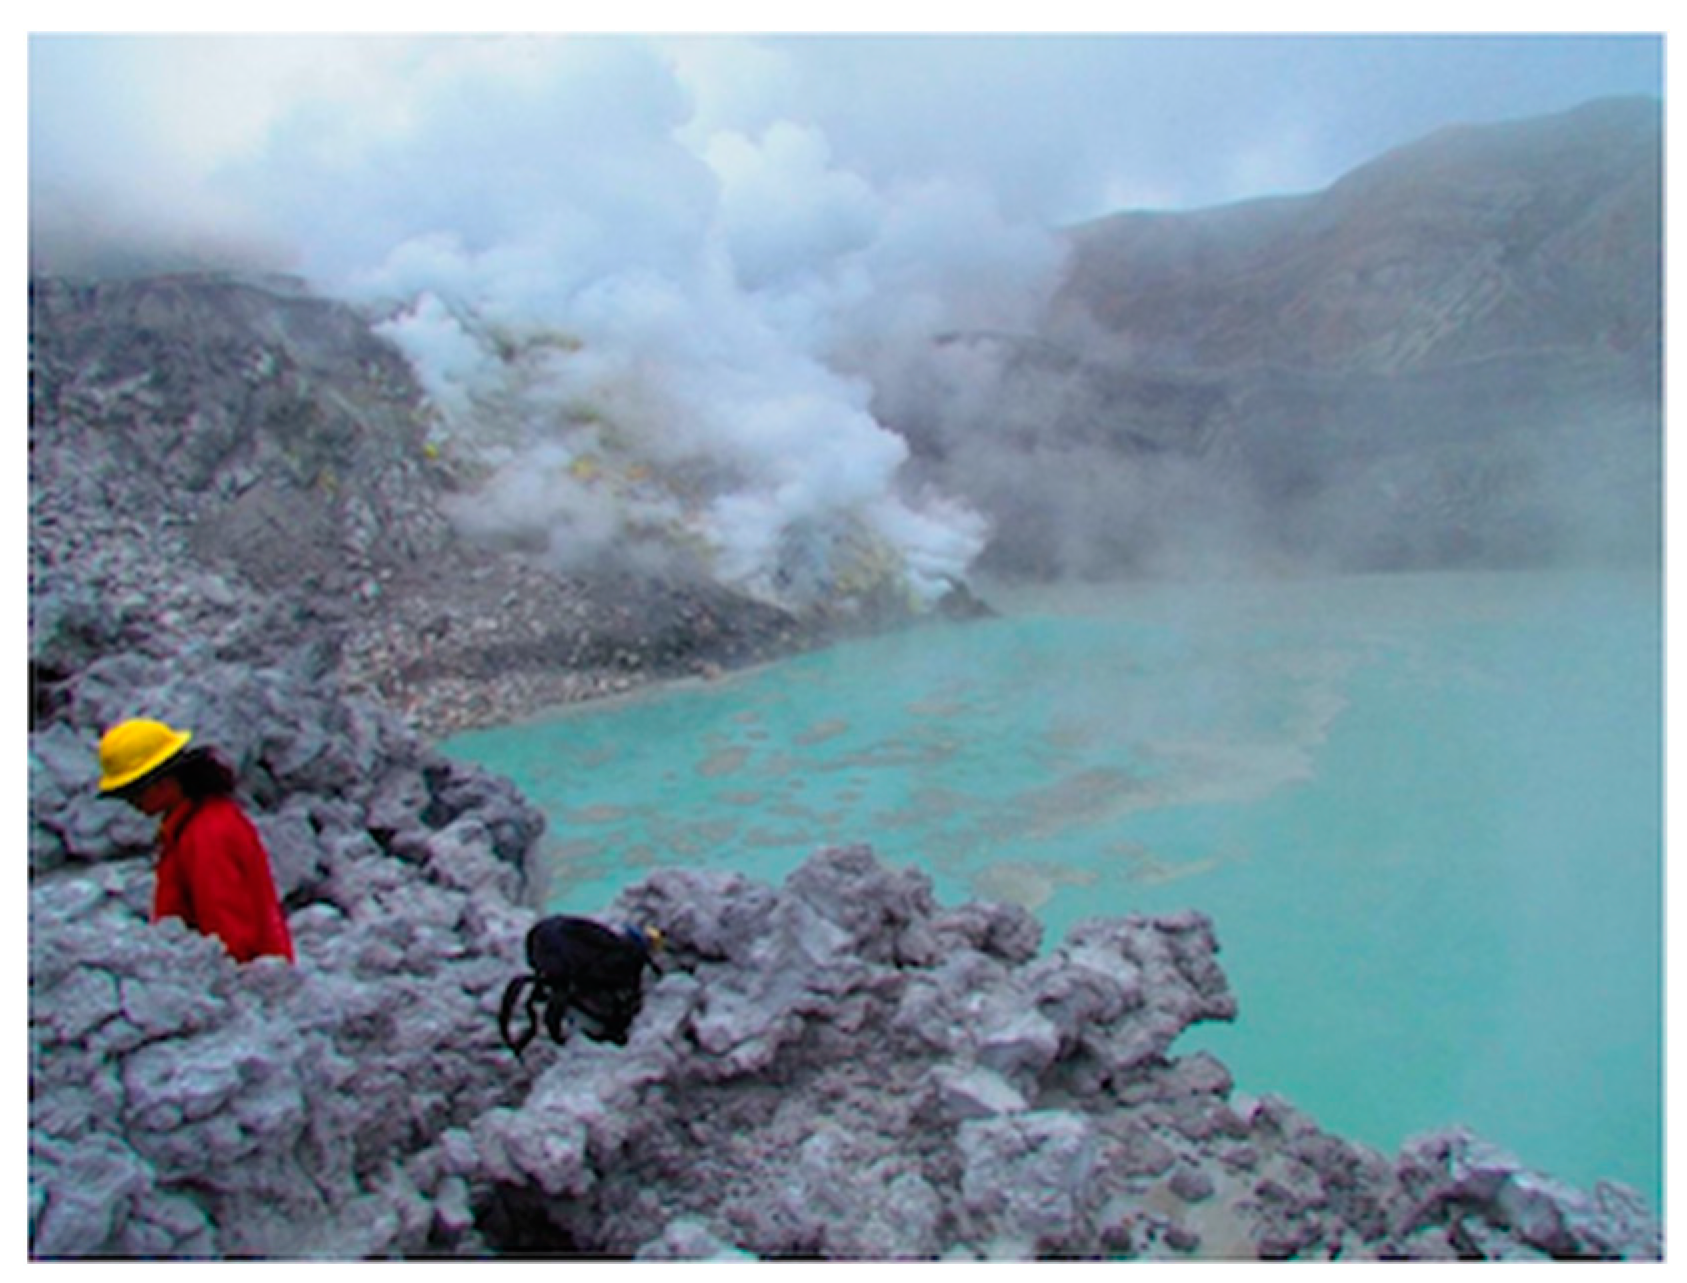
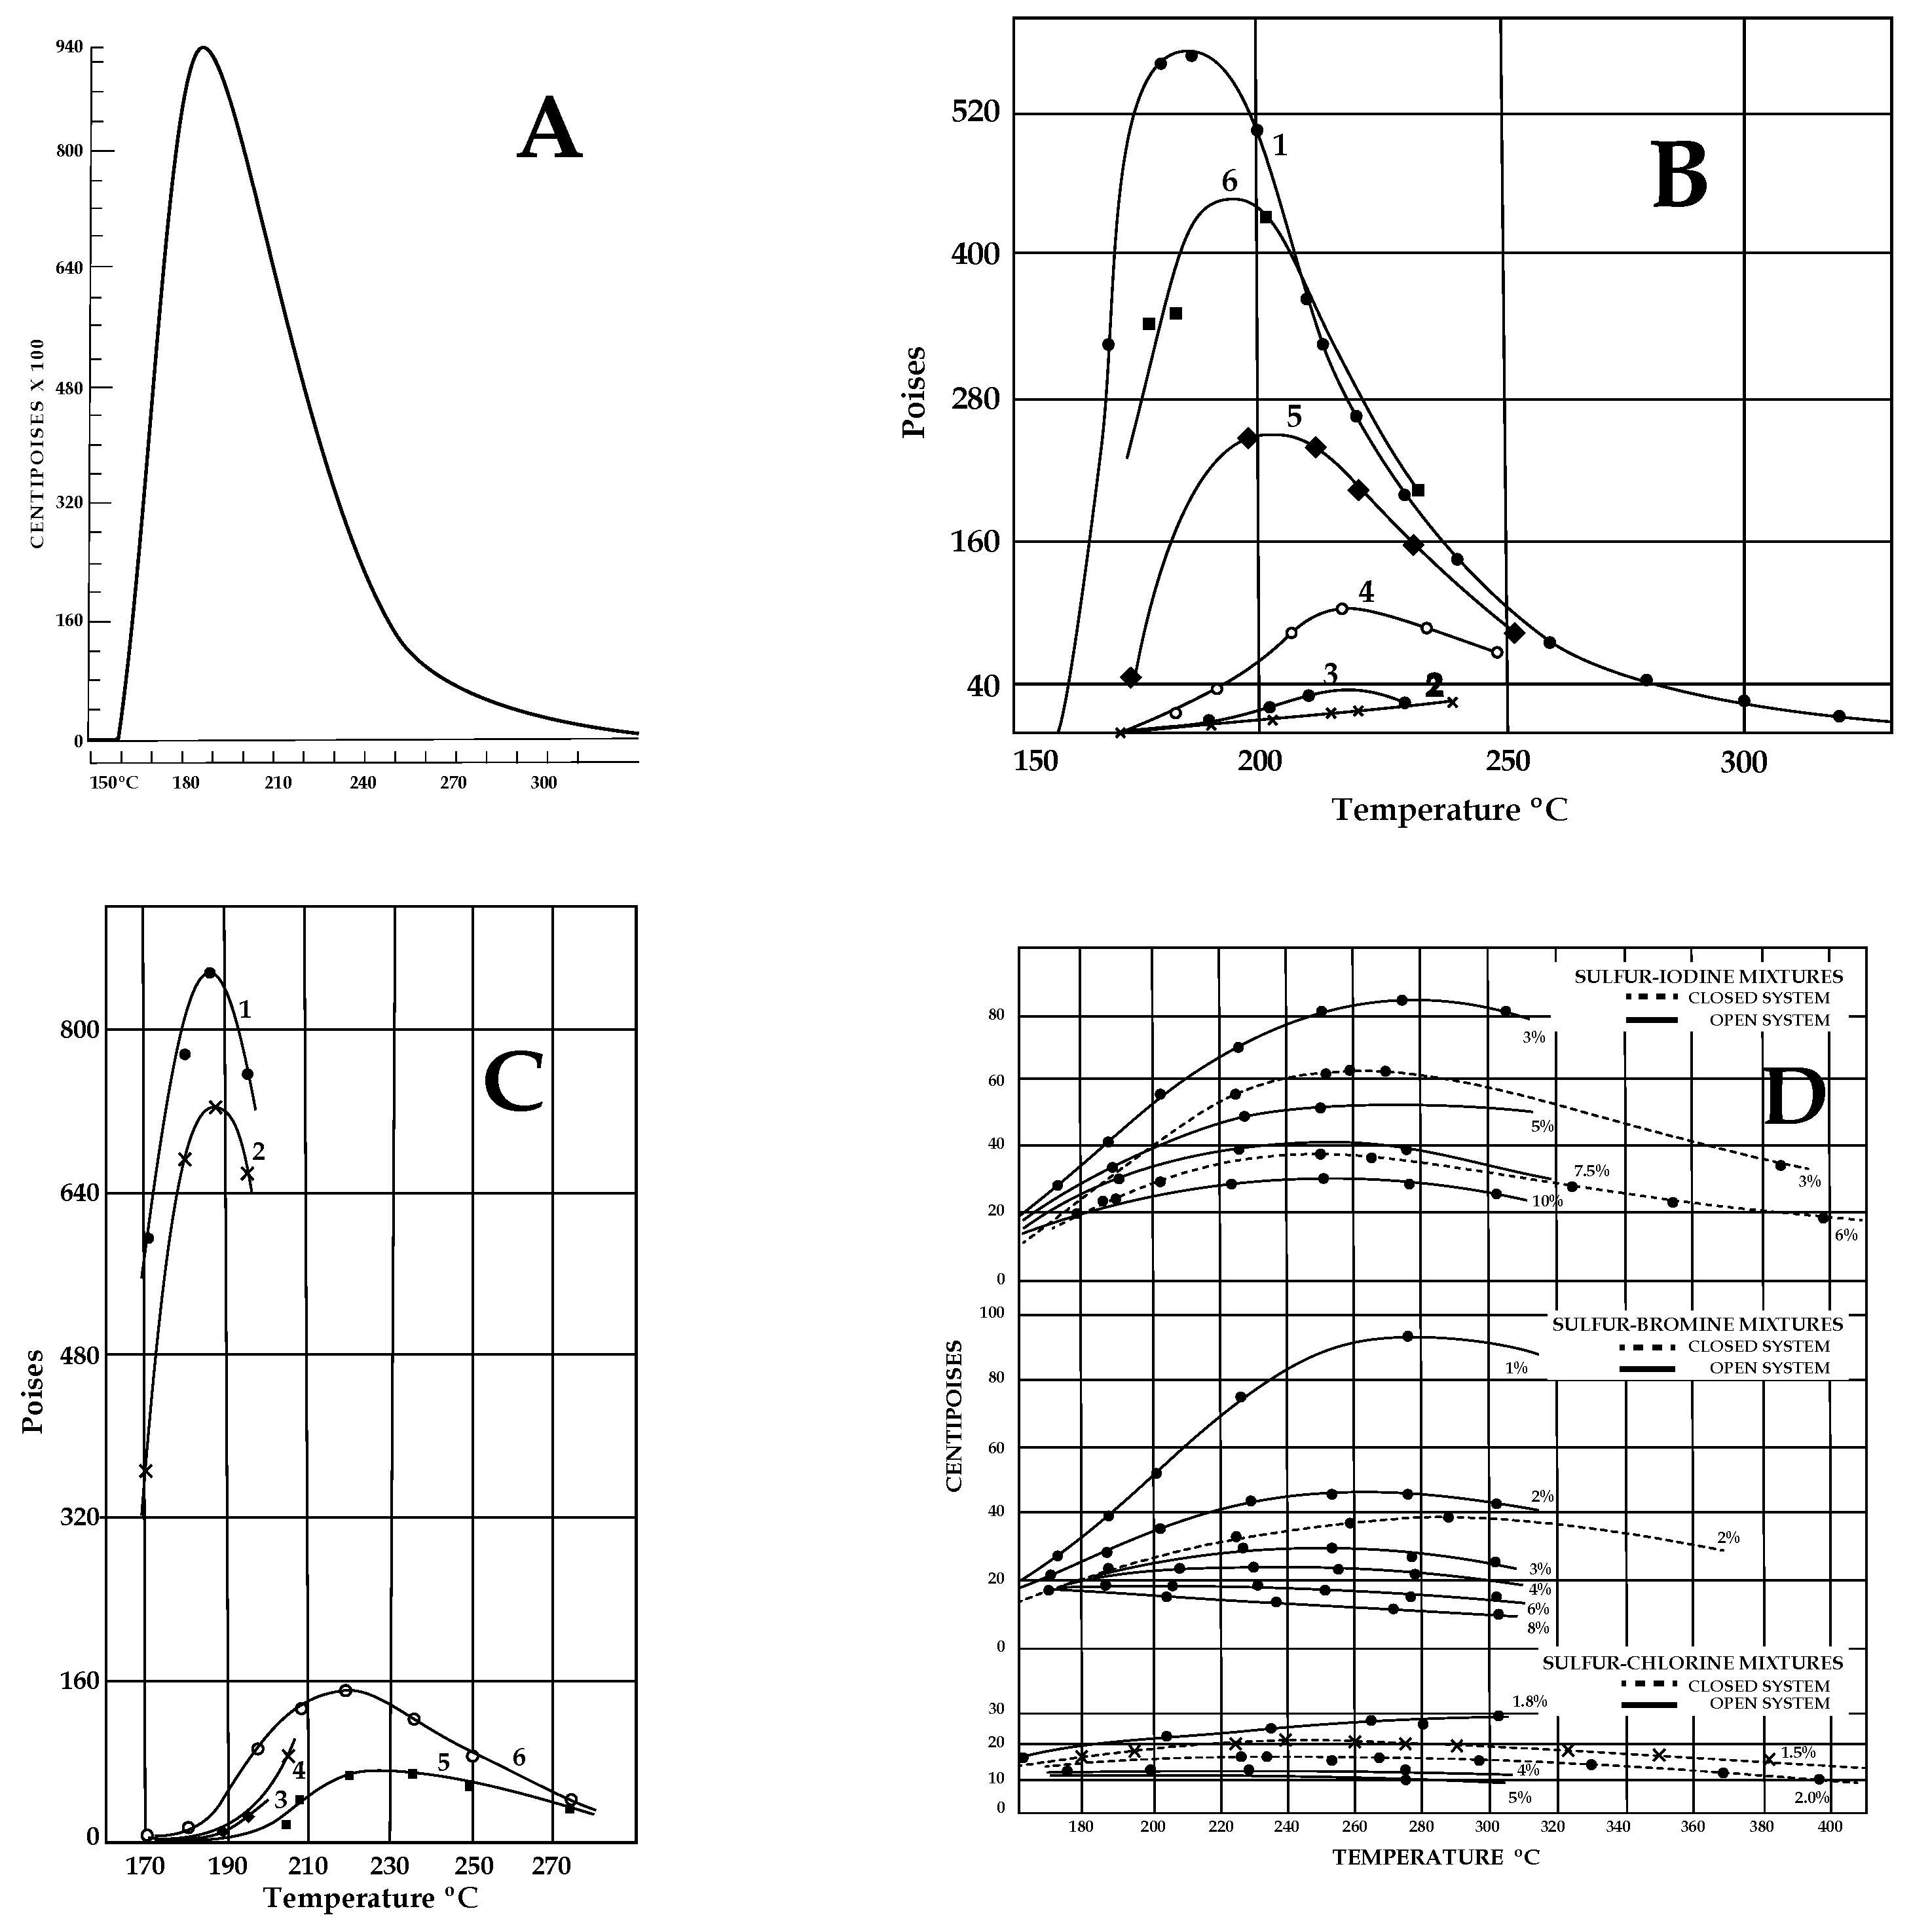
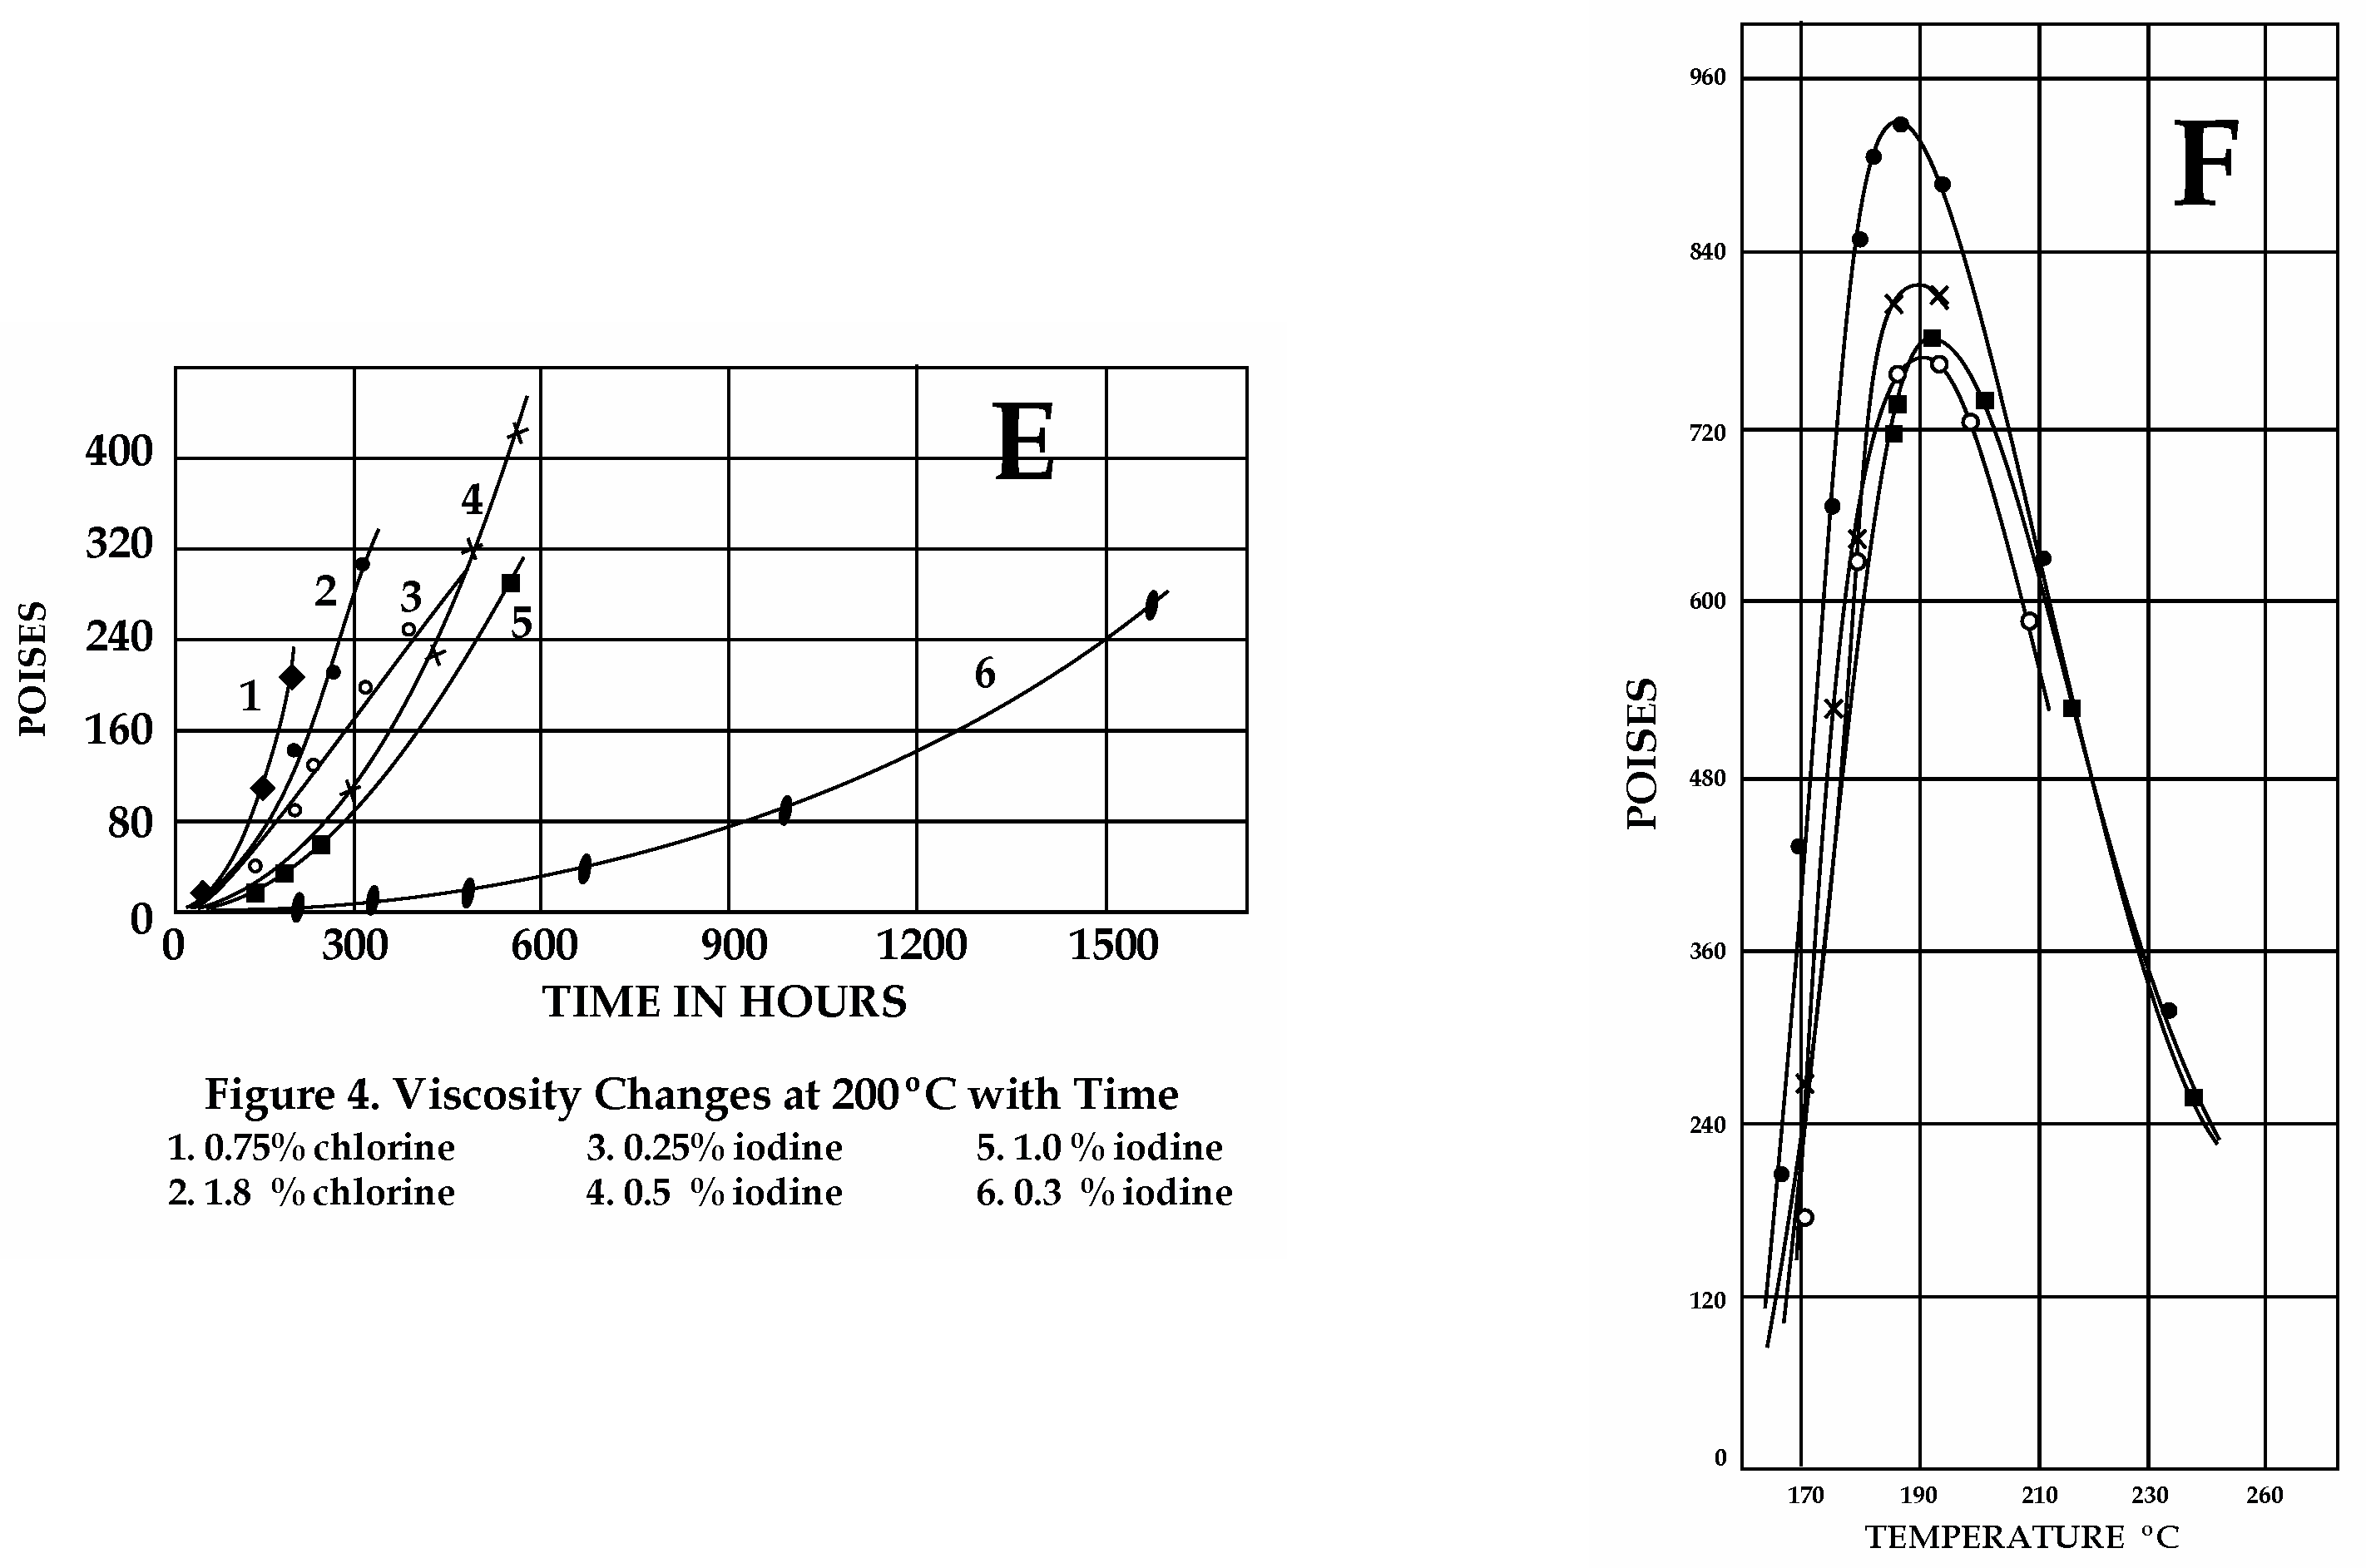
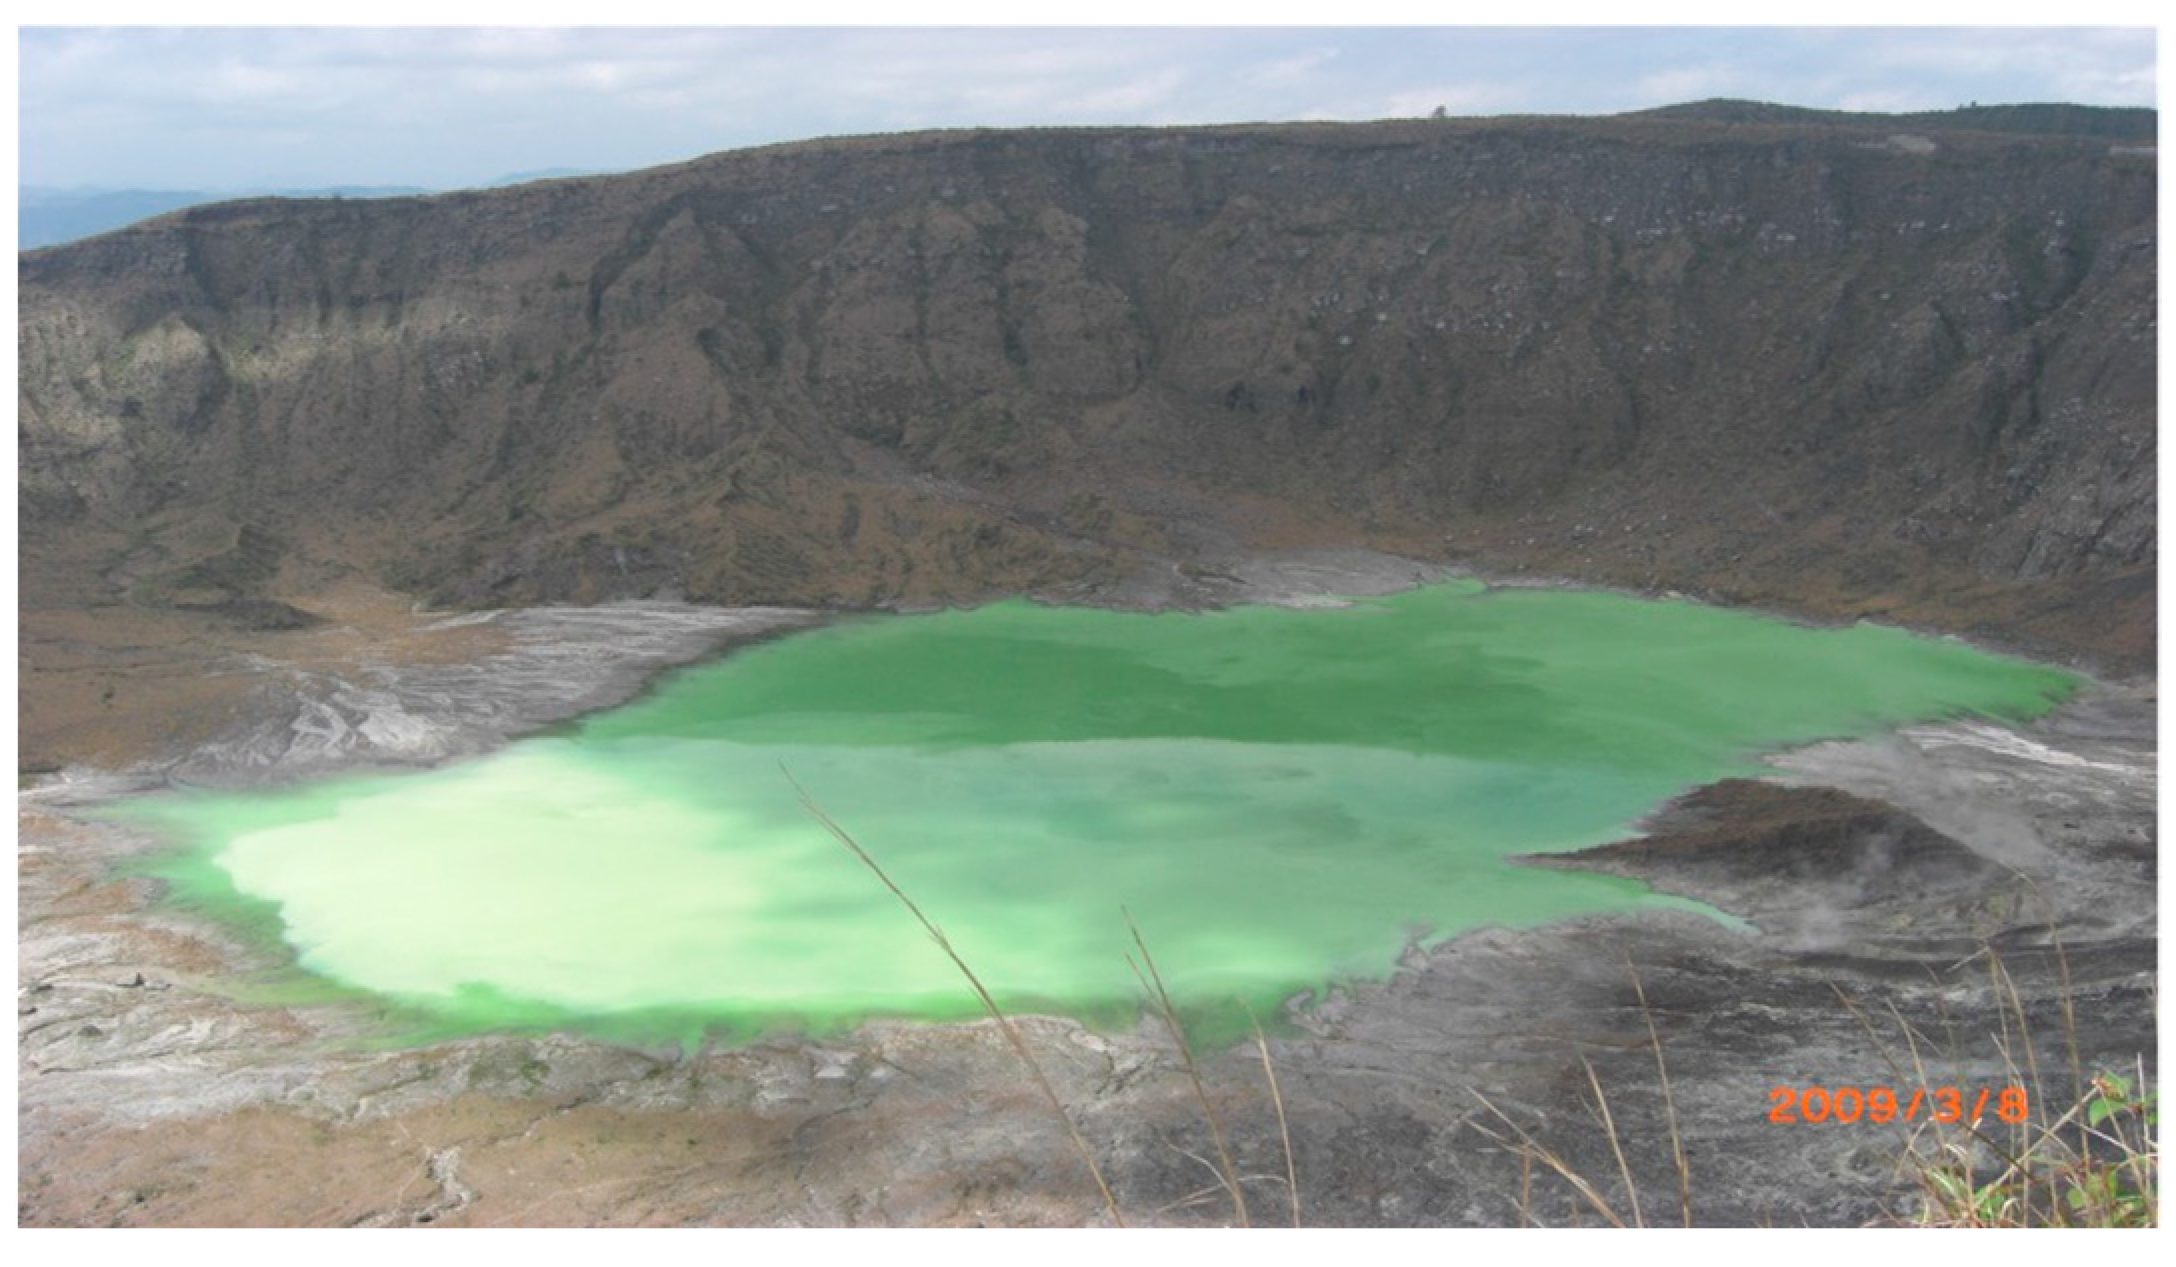
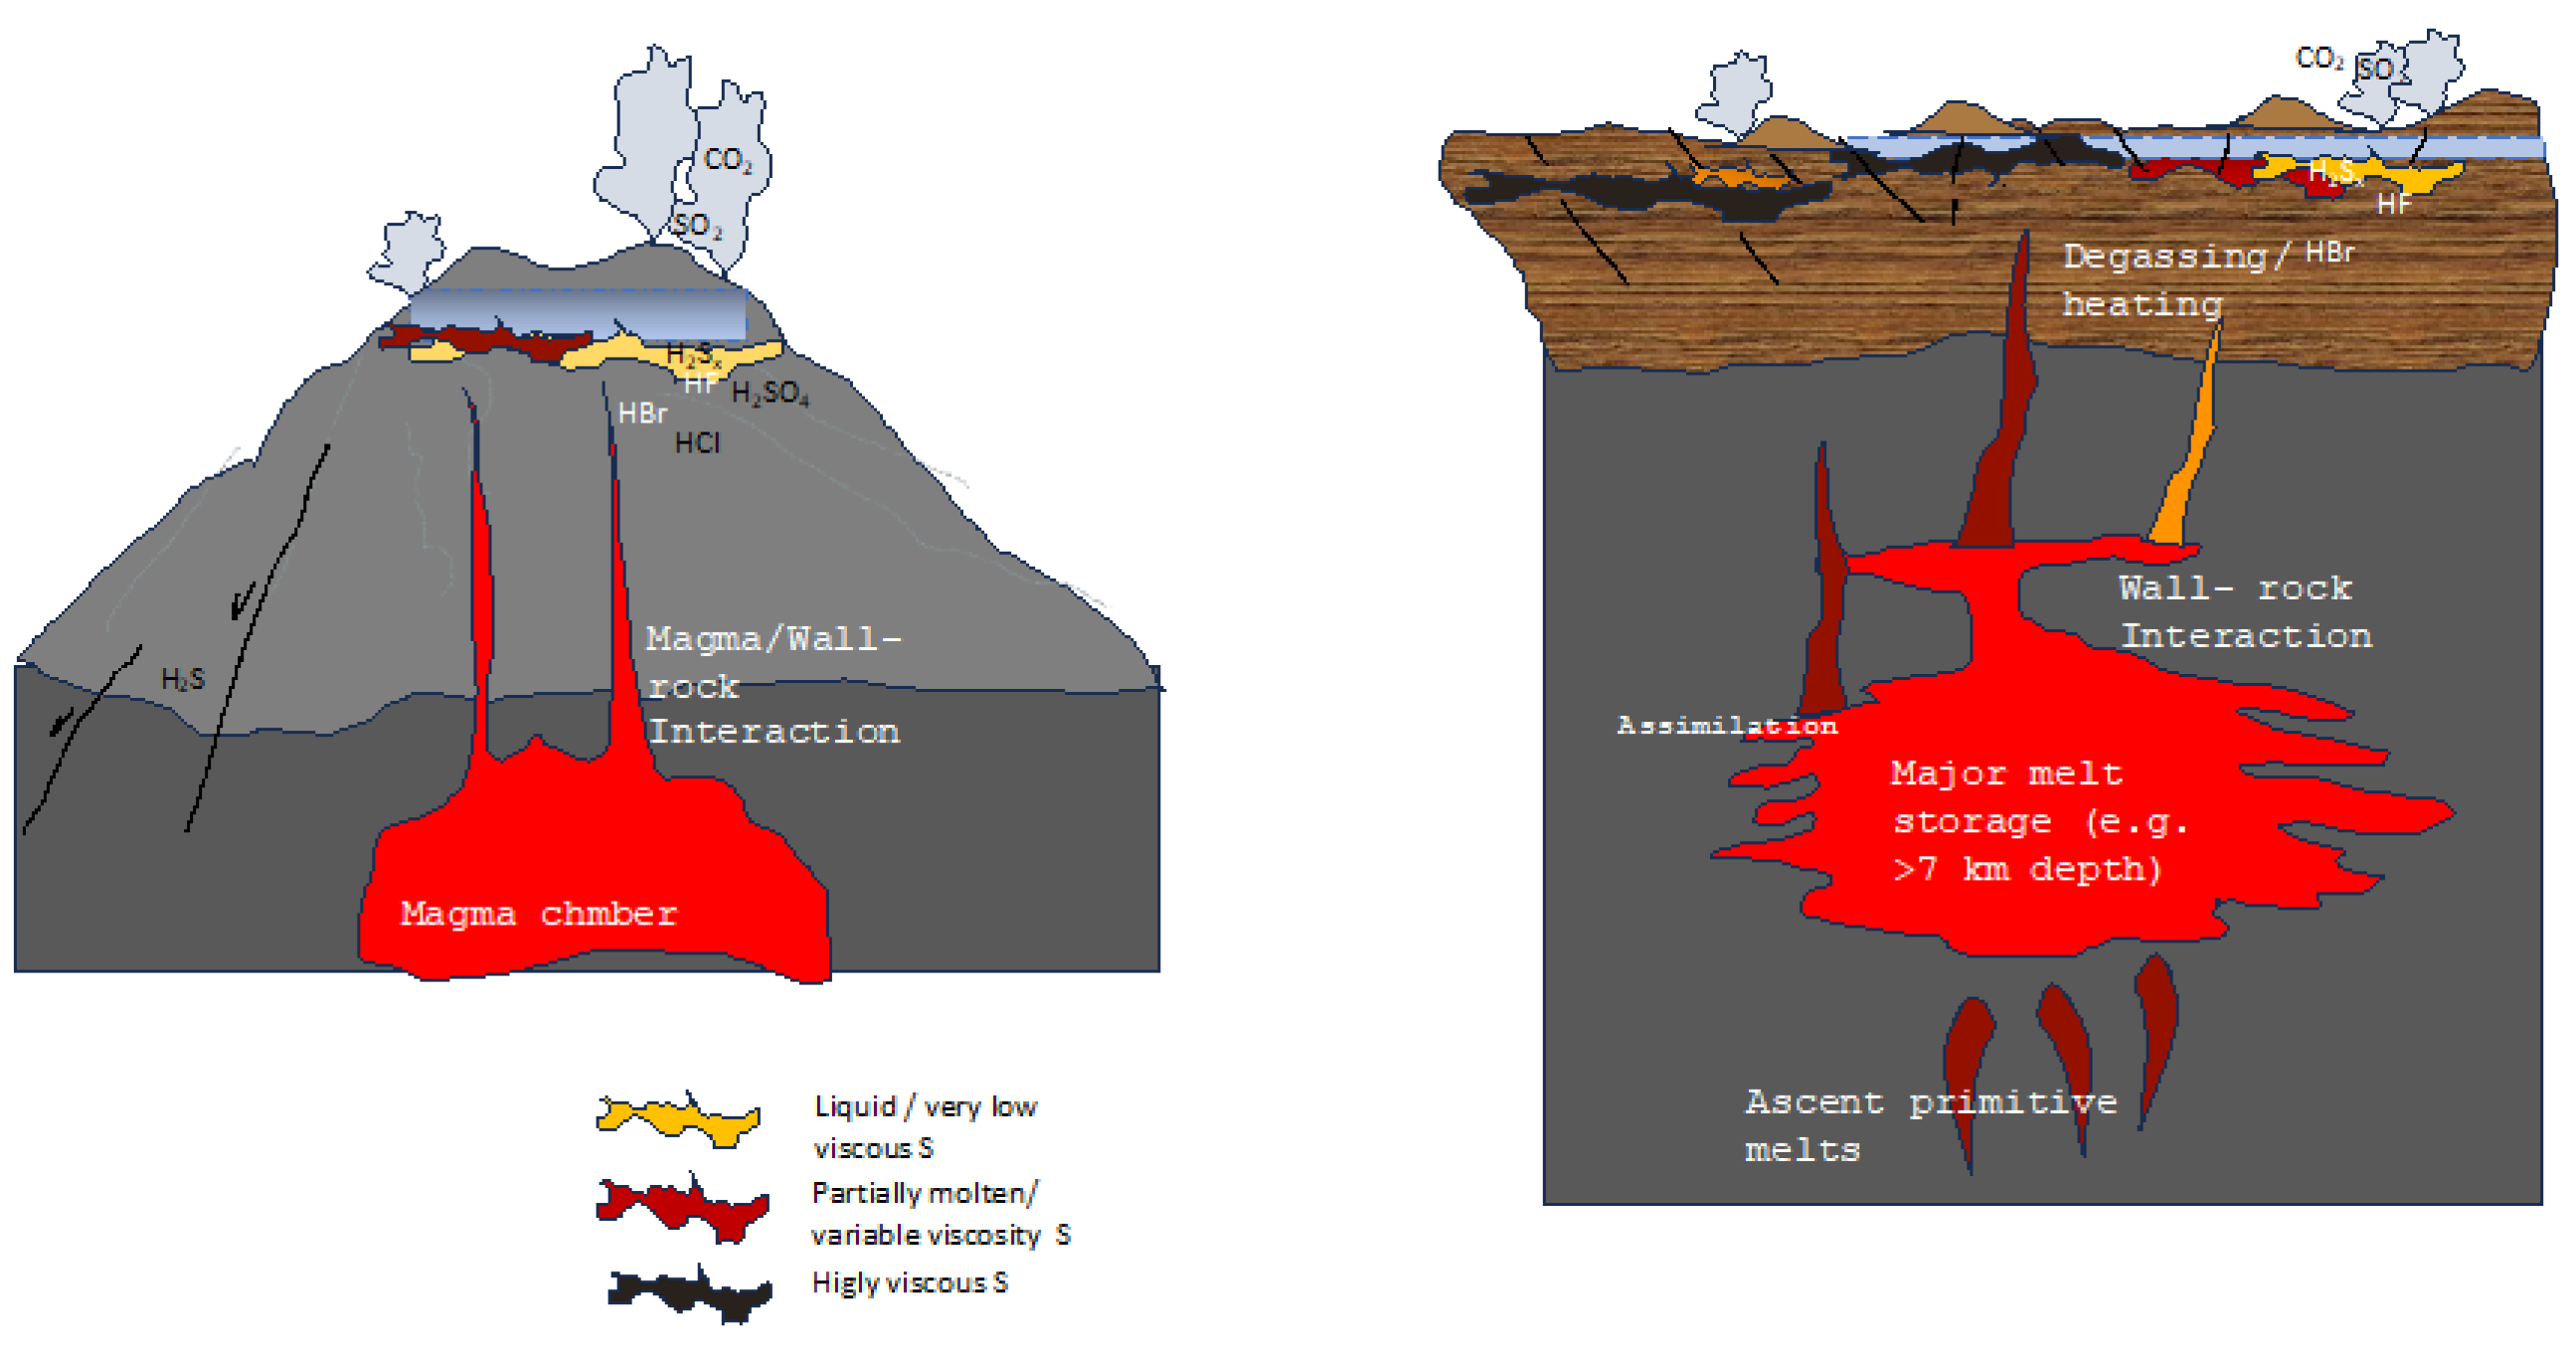
Disclaimer/Publisher’s Note: The statements, opinions and data contained in all publications are solely those of the individual author(s) and contributor(s) and not of MDPI and/or the editor(s). MDPI and/or the editor(s) disclaim responsibility for any injury to people or property resulting from any ideas, methods, instructions or products referred to in the content. |
© 2024 by the author. Licensee MDPI, Basel, Switzerland. This article is an open access article distributed under the terms and conditions of the Creative Commons Attribution (CC BY) license (https://creativecommons.org/licenses/by/4.0/).