Article

Correction Factors to Account for Seismic Directionality Effects: Case Study of the Costa Rican Strong Motion Database

by
Luis A. Pinzón
1,2,*,
Diego A. Hidalgo-Leiva
3 and
Luis G. Pujades
4
1
Scientific and Technological Research Center, Universidad Católica Santa María La Antigua (USMA), Panama City 0819, Panama
2
Sistema Nacional de Investigación (SNI), Secretaría Nacional de Ciencia, Tecnología e Innovación (SENACYT), Panama City 0824, Panama
3
Earthquake Engineering Laboratory, Universidad de Costa Rica, San Jose 3620-60, Costa Rica
4
Departament d’Enginyeria Civil y Ambiental, Universitat Politècnica de Catalunya Barcelona-Tech (UPC), 08034 Barcelona, Spain
*
Author to whom correspondence should be addressed.
Geosciences 2024, 14(5), 139; https://doi.org/10.3390/geosciences14050139
Submission received: 28 February 2024 / Revised: 2 May 2024 / Accepted: 16 May 2024 / Published: 18 May 2024
(This article belongs to the Special Issue New Trends in Earthquake Engineering and Seismotectonics)

Abstract

:
This article presents the findings of a study on the directionality effect observed in strong motion records. We set out to establish ratios between several seismic intensity measures that depend on sensor orientation (e.g., GMar, Larger) and others that are orientation-independent (e.g., RotDpp, GMRotDpp, and GMRotIpp), with the intention of proposing multiplicative correction factors. The analysis included an evaluation of the impact of site conditions, ground motion intensity, earthquake magnitude, and hypocentral distance on these ratios. Following a concise overview of the directionality effects and the associated intensity measures, the Costa Rican Strong Motion Database, comprising a total of 4199 horizontal accelerograms (two components), was employed to determine the correction factors. The analysis was carried out for 5% damped response spectra within the 0.01–5 s period range. The study focuses on orientation-independent intensity measures that are derived by combining the maximum values from the recorded motions. In the comprehensive analysis of the complete database, a trend was observed between these intensity measures and the magnitude of the earthquake along with the hypocentral distance. Specifically, records from earthquakes with greater magnitudes exhibited a lower maximum spectral response to the geometric mean of the response spectra of the as-recorded (ar) components ratio (RotD100/GMar), similar to records from earthquakes with larger hypocentral distances. Based on these findings, a proposal was put forth to estimate RotD100 values using GMar values. This ratio can prove useful in transforming data from previous seismic hazard studies, including those applied in many seismic codes, and in defining the maximum anticipated seismic intensity for design purposes in a more straightforward manner.

1. Introduction

Strong motion accelerometric stations usually record the ground motion using three perpendicular components: two horizontals (typically aligned with the north–south and east–west directions at free-field stations) and one vertical. A point of contention when dealing with acceleration data is how to combine these two orthogonal horizontal components. Typically, the geometric mean (GMar) of the maximum as-recorded values is employed, primarily because it leads to reduced variability in the equations that predict ground motion (referred to as ground motion predictive equations, GMPEs, or ground motion models, GMMs) [1]. Nevertheless, the orientation of the recording accelerometers seldom captures the highest levels of intensity, which tend to occur at an intermediate and unknown orientation. We refer to this phenomenon as the earthquake directionality effect.
The directionality effect is due to the way earthquake energy generates and propagates. To illustrate this, consider a scenario: imagine an explosive source emitting energy in a perfectly spherical pattern. Assume a medium that is both uniform and isotropic. Now, picture eight sensors placed equidistantly from the source (as shown in Figure 1), all facing north. Despite being at the same distance, these sensors do not record identical accelerograms in their horizontal plane. The sensors aligned with the radial direction and tangential to the circle centered at the explosion site would only capture the ground motion in the radial component while registering none in the tangential component (sensors A, B, C, and D). On the other hand, the sensors positioned at a 45° angle from the source (sensors E, F, G, and H) would record identical values in their two horizontal components, with only the signs varying. This observation highlights the challenge of defining an intensity measure (IM) based solely on the recorded components.
In this context, numerous studies have highlighted the significance of directionality effects in expected seismic actions [2,3,4,5], concluding that it is crucial to enhance predictive equations for strong ground motion in probabilistic seismic hazard analysis (PSHA) so that these effects are incorporated. Furthermore, other studies suggest alternative approaches for combining maximum IMs or peak values, such as those based on temporal combinations of the recorded time histories, that can contribute to obtaining more realistic estimates of expected seismic actions with greater physical relevance [6].
Another significant concern affecting directionality effects is how they can influence the anticipated damage in specific buildings situated at precise locations and with well-defined azimuths for their two primary geometric axes [7,8,9,10,11,12]. In this regard, previous studies conducted on directionality, for instance, by Vargas-Alzate et al. [13] and Pinzón et al. [14], are noteworthy. These studies analyzed ground motion records and identified the sensitivity of expected building damage based on spatial orientation. They observed that buildings with similar characteristics and located on the same site, experienced varying degrees of damage during earthquakes. This discrepancy was attributed to the influence of building orientation relative to highly polarized seismic actions.
To illustrate, revisit the scenario depicted in Figure 1, but replace the sensors with rectangular-shaped buildings located at the same distance and facing the same direction (refer to Figure 2). Assume these buildings have a strong axis with twice the stiffness of the weak axis. It is evident that the buildings positioned to the north and south of the epicenter (represented by black buildings) are more prone to damage compared to the rest because the earthquake’s component with the highest intensity targets the weak axis of the structure. Conversely, for buildings located to the east and west, the strongest seismic action aligns with the strong axis, resulting in a lower anticipated damage level.
In Figure 1, the impact of the directionality effect on the recorded seismic actions is shown, particularly in terms of accurately assessing expected seismic actions within the framework of GMMs. For existing GMMs, there are various approaches to account for directionality effects in intensity measures, depending on the specific characteristics of the employed model. One simple method is to incorporate multiplicative correction factors, which are ratios between the target intensity measure and the current one (e.g., RotD100/GMar [3]). By applying these correction factors, it becomes feasible to transition from a sensor orientation-dependent intensity measure to an orientation-independent measure in a straightforward manner.
The primary objective of this study is to examine and evaluate the directionality effects of the Costa Rican Strong Motion Database (CRSMD) [15]. However, note that Figure 1 and Figure 2 illustrate the directionality effect in the time domain focusing, in this case, on the peak acceleration, i.e., in the null period in the frequency domain. In this article, the directionality effect is analyzed in the frequency domain where the maximum intensity is not uniquely defined by a direction but depends on the period of the oscillator, as it will be shown below. Conventional intensity measures and orientation-independent measures were computed using the complete Strong Motion Database. Then, ratios between seismic intensity measures that rely on sensor orientation and those that are orientation-independent were established with the intention of proposing multiplicative correction factors. The analysis included an evaluation of the impact of site conditions, ground motion intensity, earthquake magnitude, and hypocentral distance on these ratios. As a result of the investigation, a model is proposed to determine the maximum direction (RotD100) based on the GMar, incorporating considerations of event magnitude and hypocentral distance. This model offers a comprehensive approach to estimating the RotD100 value, considering specific characteristics of the earthquake.

2. Directionality Effects on Ground Motions

In the field of engineering seismology and earthquake engineering, GMMs and design specifications have traditionally relied on the maximum or peak values derived from as-recorded strong motion data. The key concern here is the process of obtaining these two peak values, which originate from two orthogonal accelerograms, and, more importantly, how to effectively combine them.
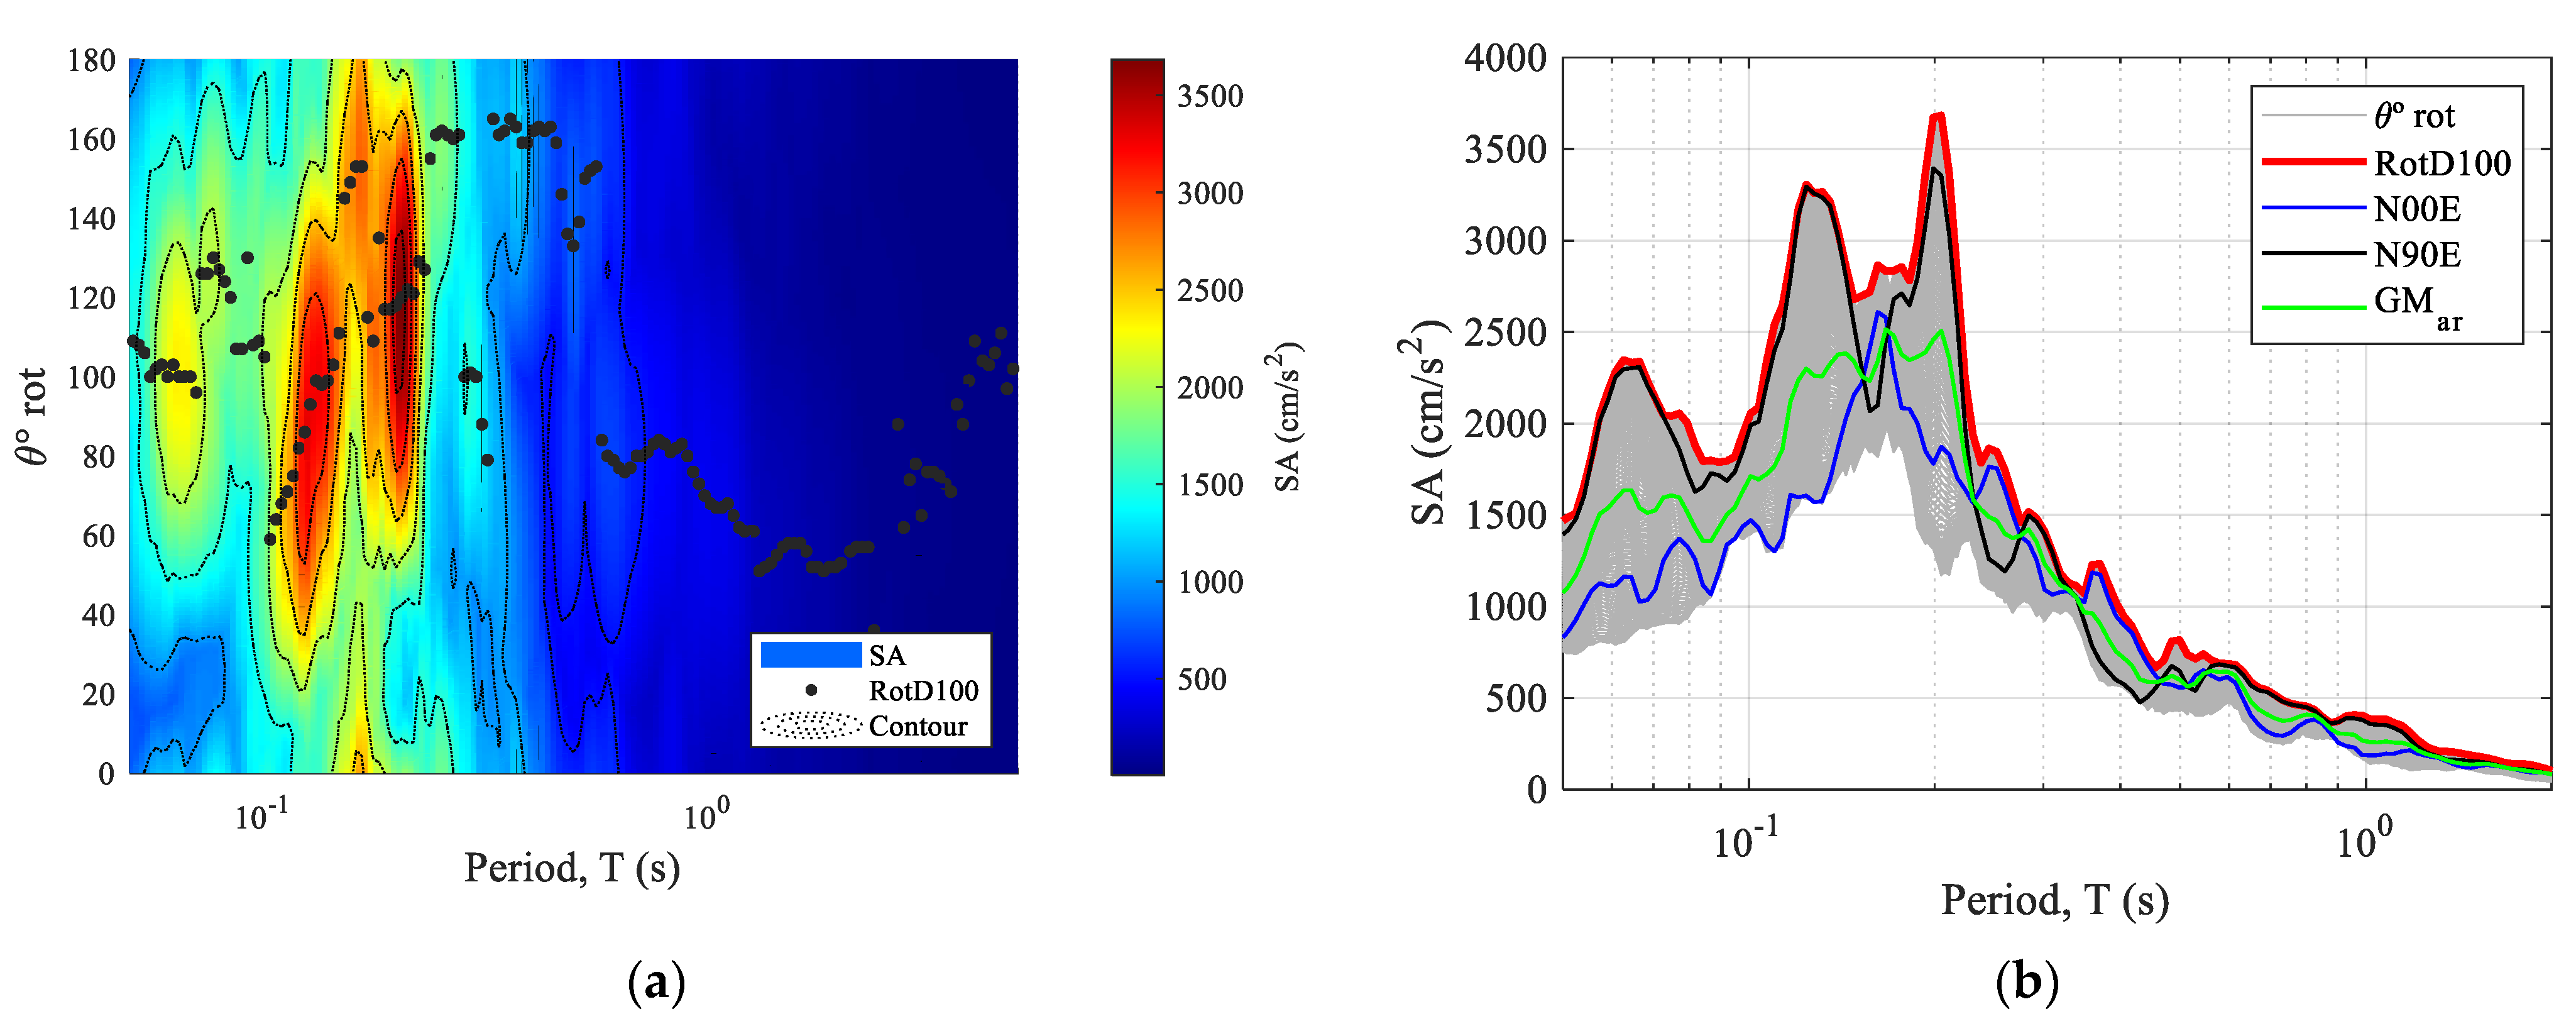
As we have seen above, it is evident that these peak values exhibit a strong dependency on the geographical orientation of the recording sensors. Therefore, it is advantageous to establish measures that are independent of rotation, that is, not depending on the sensor’s azimuths. It is widely recognized that as-recorded time histories are significantly influenced by the orientation of the sensors. This factor becomes especially critical when dealing with polarized strong motions. Figure 3 illustrates the spectral acceleration variation with respect to different angles, using data from the Mw 7.6 Nicoya earthquake of 5 September 2012, recorded at GNSR station. The findings indicate a significant fluctuation in acceleration values based on the rotation angle θ° rot, highlighting the impact of sensor orientation (directionality) on spectral response-related IMs. The figure also depicts the RotD100 IM, which represents the maximum acceleration value for each period. Notably, RotD100 varies across different angles for each period, indicating independence from sensor orientation but dependence on the oscillator period.

3. Comprehensive Analysis

To evaluate the influence of directionality effects on seismic actions and its implications for strong ground motion models, a comprehensive analysis is conducted using the CRSMD. The database consists of 4199 digital triaxial records sampled at a rate of 200 Hz, originating from 491 earthquakes. Figure 4a,b illustrates the epicenter locations of the earthquakes with their corresponding magnitudes and the accelerometric stations respectively, while Figure 4c displays the distribution of magnitudes and hypocentral distances. This particular database has been previously employed in a PSHA for Costa Rica [16] to classify the sites of the entire network based on the observed relationship between measured shear wave velocity (Vs30) and the fundamental period of vibration of 52 stations [17].
As can be seen in Figure 4b, recordings of large earthquakes (M > 6.5) are scarce; they are 8% of the overall database. Moreover, there are no recordings of large earthquakes at short distances (Hypo < 15 km). However, as this research is focused on modifying ground motion models developed using this specific dataset of accelerograms, it has been considered crucial to maintain the regional specificity of our analysis as it is specifically designed to address seismic characteristics and geotectonic dependencies unique to the Costa Rican region. Adequate segmentation of data according to hypocentral distances, magnitudes, and PGA will allow us to consider these region-specific characteristics of the data.
A MATLAB script developed by [6] was adapted to perform a comprehensive calculation with the two horizontal–orthogonal components of all the selected records. First, the 5% damped acceleration response spectra were obtained for all the as-recorded signals and for all the linear combinations considered with the rotation angle (θ) variation, in the range 1°–180° with increments of 1° according to the following equation:
a c c r o t t , θ = a c c 1 t , 0 × cos θ + a c c 2 ( t , 0 ) × s i n ( θ ) ,
where acc1(t, 0) and acc2(t, 0) are the as-recorded horizontal accelerograms and t refers to time.
Subsequently, various orientation-independent sensor IMs were estimated (see Table 1), including GMRotD50, GMRotI50, RotD50, RotD100, and LRotD50. Additionally, GMar and Larger were also assessed since these IMs are commonly employed in PSHA and GMMs. Given the comprehensive scope of this study, which entails intricate calculations of the responses of single-degree-of-freedom (SDOF) systems with 5% critical damping, the time required for computation becomes a significant factor. In this sense, the numerical technique presented by Nigam and Jennings [18] was adopted. Remarkably, this method produced results of equivalent precision while reducing the computational time by approximately ten times in comparison to the step-by-step numerical integration method employing Duhamel’s integral, as illustrated by Pinzón et al. in [6]. Figure 5 presents a comparison of RotD100 and GMar in terms of peak ground acceleration (PGA) and spectral acceleration (SA) for oscillators with periods of 0.2 s and 1.0 s, as derived from the comprehensive analysis of the CRSMD database.

4. Correction Factors

Following the comprehensive analysis, ratios between the selected IMs and the GMar are calculated. These ratios serve as correction factors that vary with the period and reflect the impact of directionality effects. They indicate how close or distant the IMs that consider directionality are with the reference IM. Since this study covers a diverse database of strong ground motions in Costa Rica, the obtained results will offer valuable insights for incorporating directionality effects into existing PSHA and GMMs developed in the country. This facilitates a straightforward and convenient consideration of directionality effects in such applications.
Two sets of ratios were calculated. As previously mentioned, the ratios were computed using GMar as the denominator. GMar was chosen because it is commonly used in PSHA and GMMs. The first set of ratios includes Larger/GMar, LRotD50/GMar, and RotD100/GMar, and the second set of ratios includes GMRotI50/GMar, GMRotD50/GMar, and RotD50/GMar. All these ratios are dependent on the period, in the range of 0.01–5 s. Mean values and standard deviations were computed for these five ratios. To calculate the mean values, the antilogarithm of the average of the natural logarithms of the ratios was used, representing the geometric mean of the ratios [4], derived from all the 4199 accelerations records for each intensity measure. Figure 6 depicts the ratios obtained from the analysis. The ratios GMRotD50/GMar and GMRotI50/GMar returned results close to 1.01 throughout the entire range of periods. The GMRotI50/GMar ratio is comparable with the GMRotD50/GMar but slightly higher. The RotD50/GMar ratio falls within the range of 1.015 to 1.038. The ratios Larger/GMar ranges between 1.14 and 1.19, and LRotD50/GMar between 1.16 and 1.21. As for RotD100, the ratio falls within the range of 1.23 to 1.29. Notably, all the obtained ratios demonstrate an agreement with the findings of similar studies conducted in other regions [1,2,3,6,14,21,22].
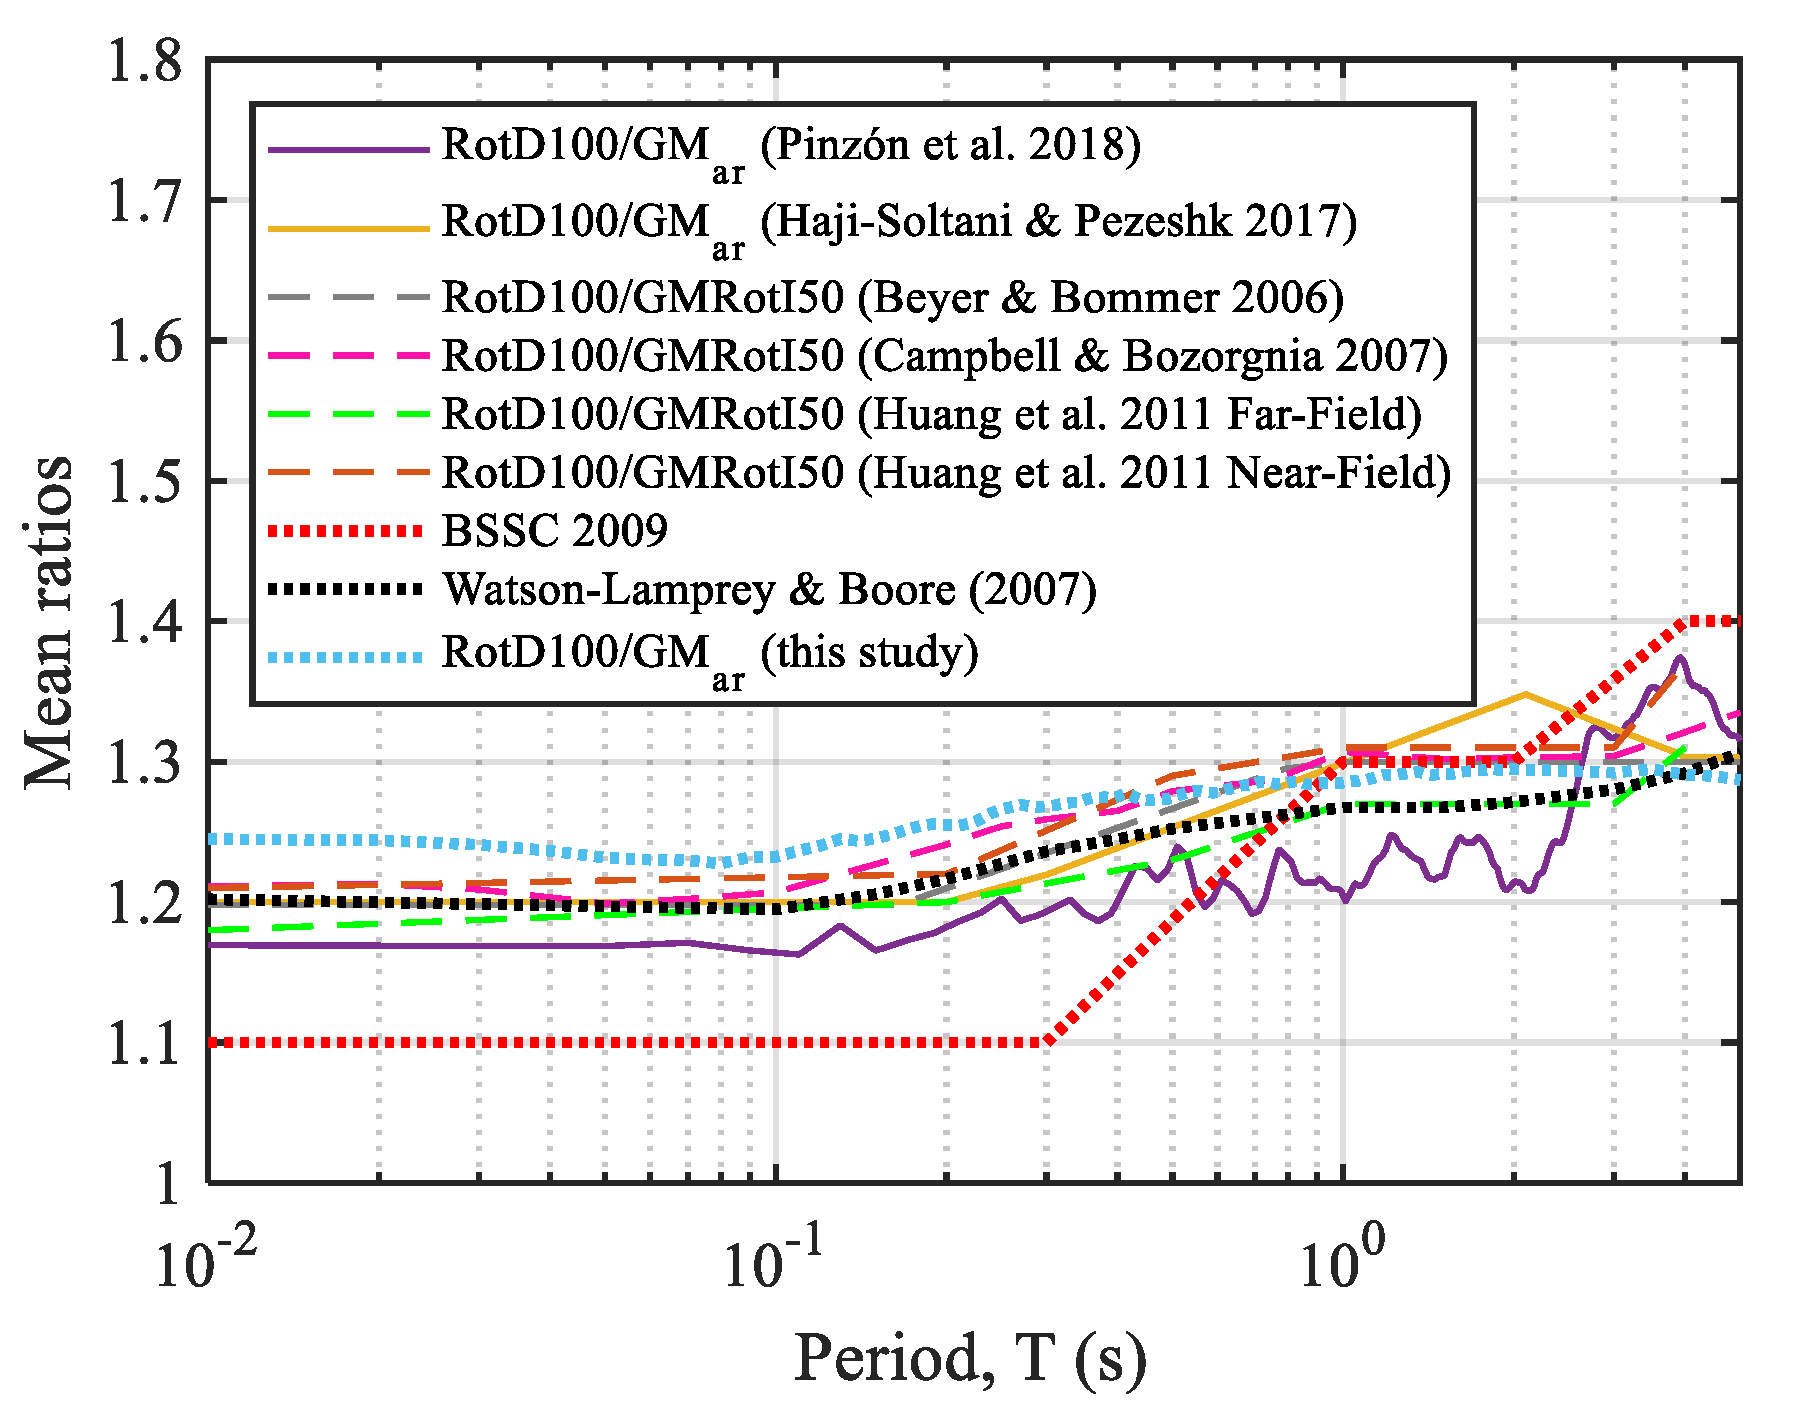
The results of the directionality effects are applied to improve the knowledge of PSHA, which does not consider the increased hazard due to this effect, and they have been performed in many countries with similar findings, although with some differences. Figure 7 presents a comparison between our findings and those of the referenced authors, showing a strong agreement between the results.

Maximum-Direction Ground Motion Correction Factor (RotD100/GMar)

Moving forward, our focus will be on RotD100, which represents the “maximum-direction” ground motion. This measure is commonly employed in regulations for structural design and assessment, serving as a representation of the highest anticipated spectral response across all possible θ (as shown in Figure 3). Establishing RotD100/GMar relationships is crucial to correct PSHA or GMM developed from GMar. In certain regulations, it is recommended to employ a factor of 1.1 for short-period and 1.3 for long-period [28] to consider the directionality effect. These factors were derived from seismic recordings of significant earthquakes, characterized by a Mw exceeding 6.5 and site-to-source distances within 15 km. Upon examining the outcomes depicted in Figure 7, it becomes evident that the RotD100/GMar factors obtained in this study are notably higher for lower periods compared to the aforementioned 1.1 (approximately 1.25 for T = 0.2 s). Higher values observed here may be attributed to having acceleration records from Costa Rica, encompassing a broader range of magnitudes and hypocentral distances. Consequently, this highlights the need to conduct region-specific analyses while considering the associated seismic parameters.
The propagation characteristics of seismic waves vary depending on their type and source distance. Body waves, such as P-waves and S-waves, exhibit distinct directional features that are influenced by the geological structures they encounter as they propagate through the Earth’s interior [29]. Conversely, surface waves, including Love and Rayleigh waves, interact more prominently with near-surface geological features, resulting in different directional responses [30]. Records obtained from seismic events with distant sources (far-field), let us say with a source distance of more than 100–150 km, predominantly capture the long-period segment of surface waves, which significantly impacts the long-period portion of the response spectrum [31].
Hence, we conducted an analysis of the RotD100/GMar factor, segmenting the data according to hypocentral distance (Hypo), Mw, and PGA. The results obtained are depicted in Figure 8. A clear influence of the Hypo is observed. It is clear that earthquakes in closer proximity exhibit higher correction factors. Comparing magnitudes reveals a consistent trend, where higher magnitudes correspond to lower correction factors. Lastly, the segmentation based on PGA indicates that greater values correspond to higher correction factors. Notably, this difference is less pronounced for shorter periods and gradually becomes more significant for longer periods.
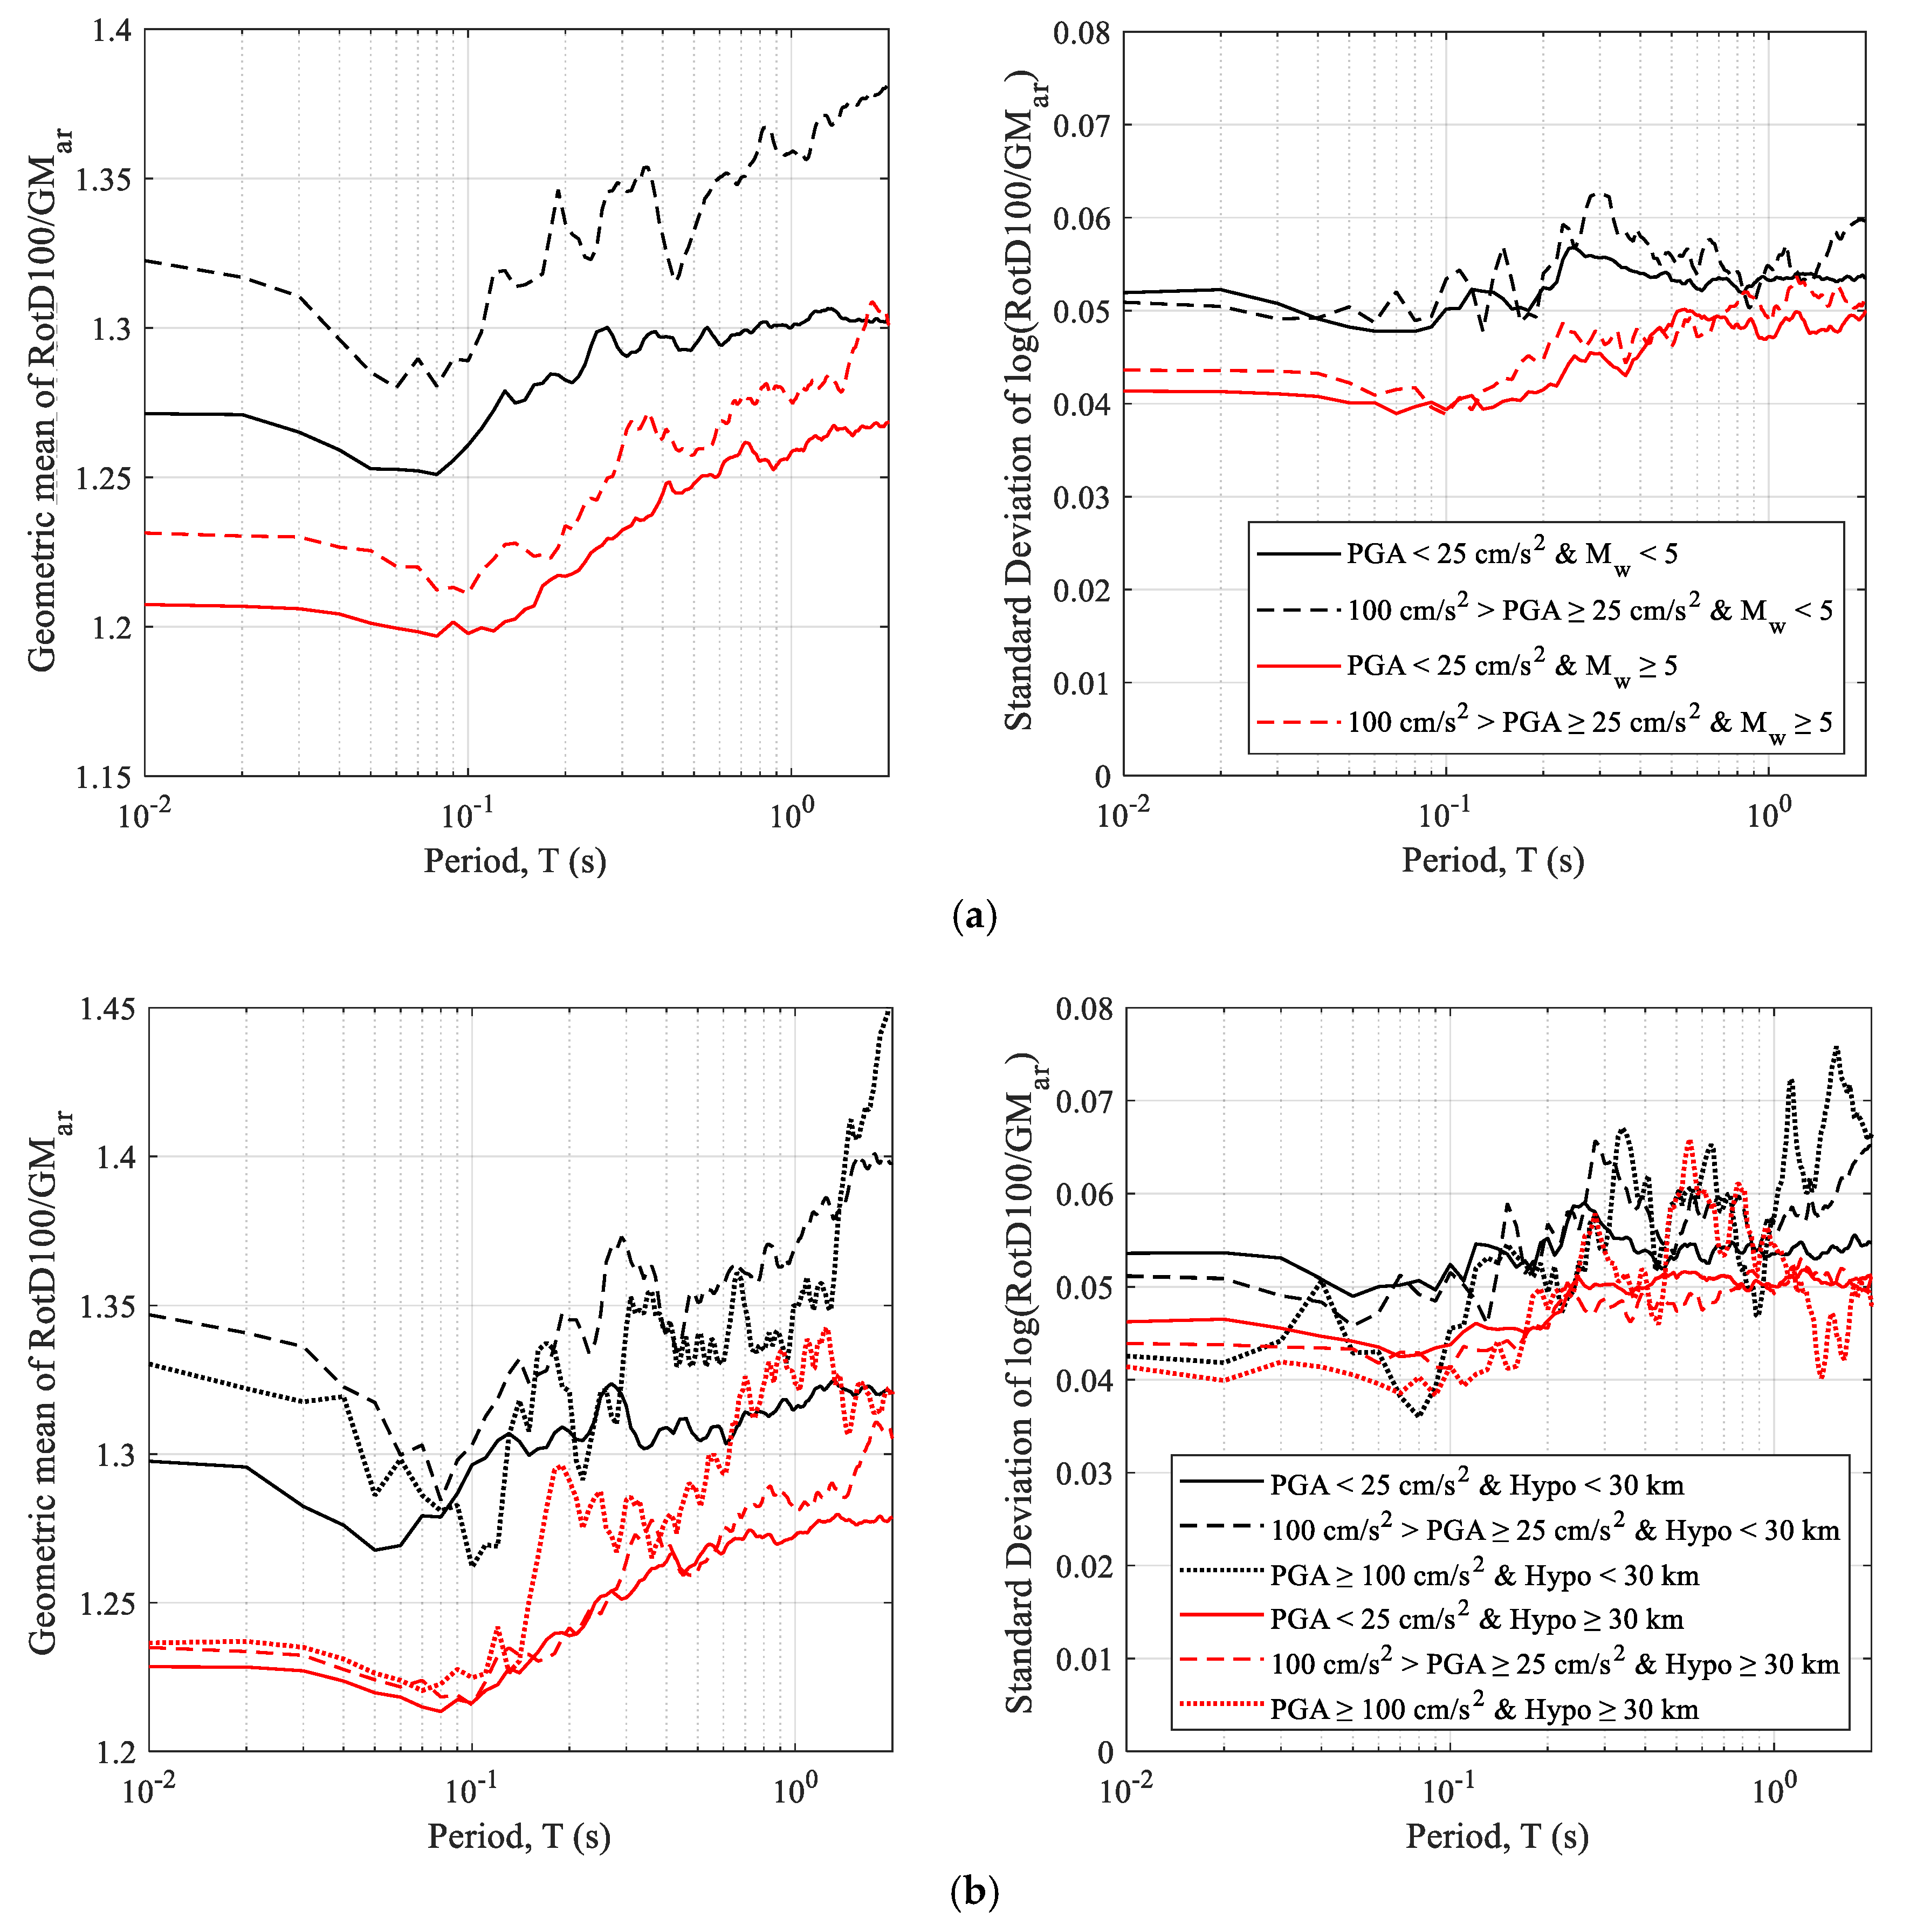
Figure 9 presents an evaluation of the correction factors considering the combination of PGA with Mw and Hypo. The analysis reveals a clear trend: the factors decrease with higher Mw values, while they tend to increase with larger PGA values. Both PGA and Mw exert influence on the correction factors. Additionally, when comparing the values obtained by combining PGA and Hypo, a significant impact of the hypocentral distance is found. However, in this case, for PGA, no specific trend is observed. Consequently, these findings indicate the importance of considering both Mw and Hypo when applying corrections. Since PGA is dependent on Mw and the distance to the source, it indirectly contributes to these relationships. As a result, the models suggested in this study will be categorized based on Mw and Hypo.
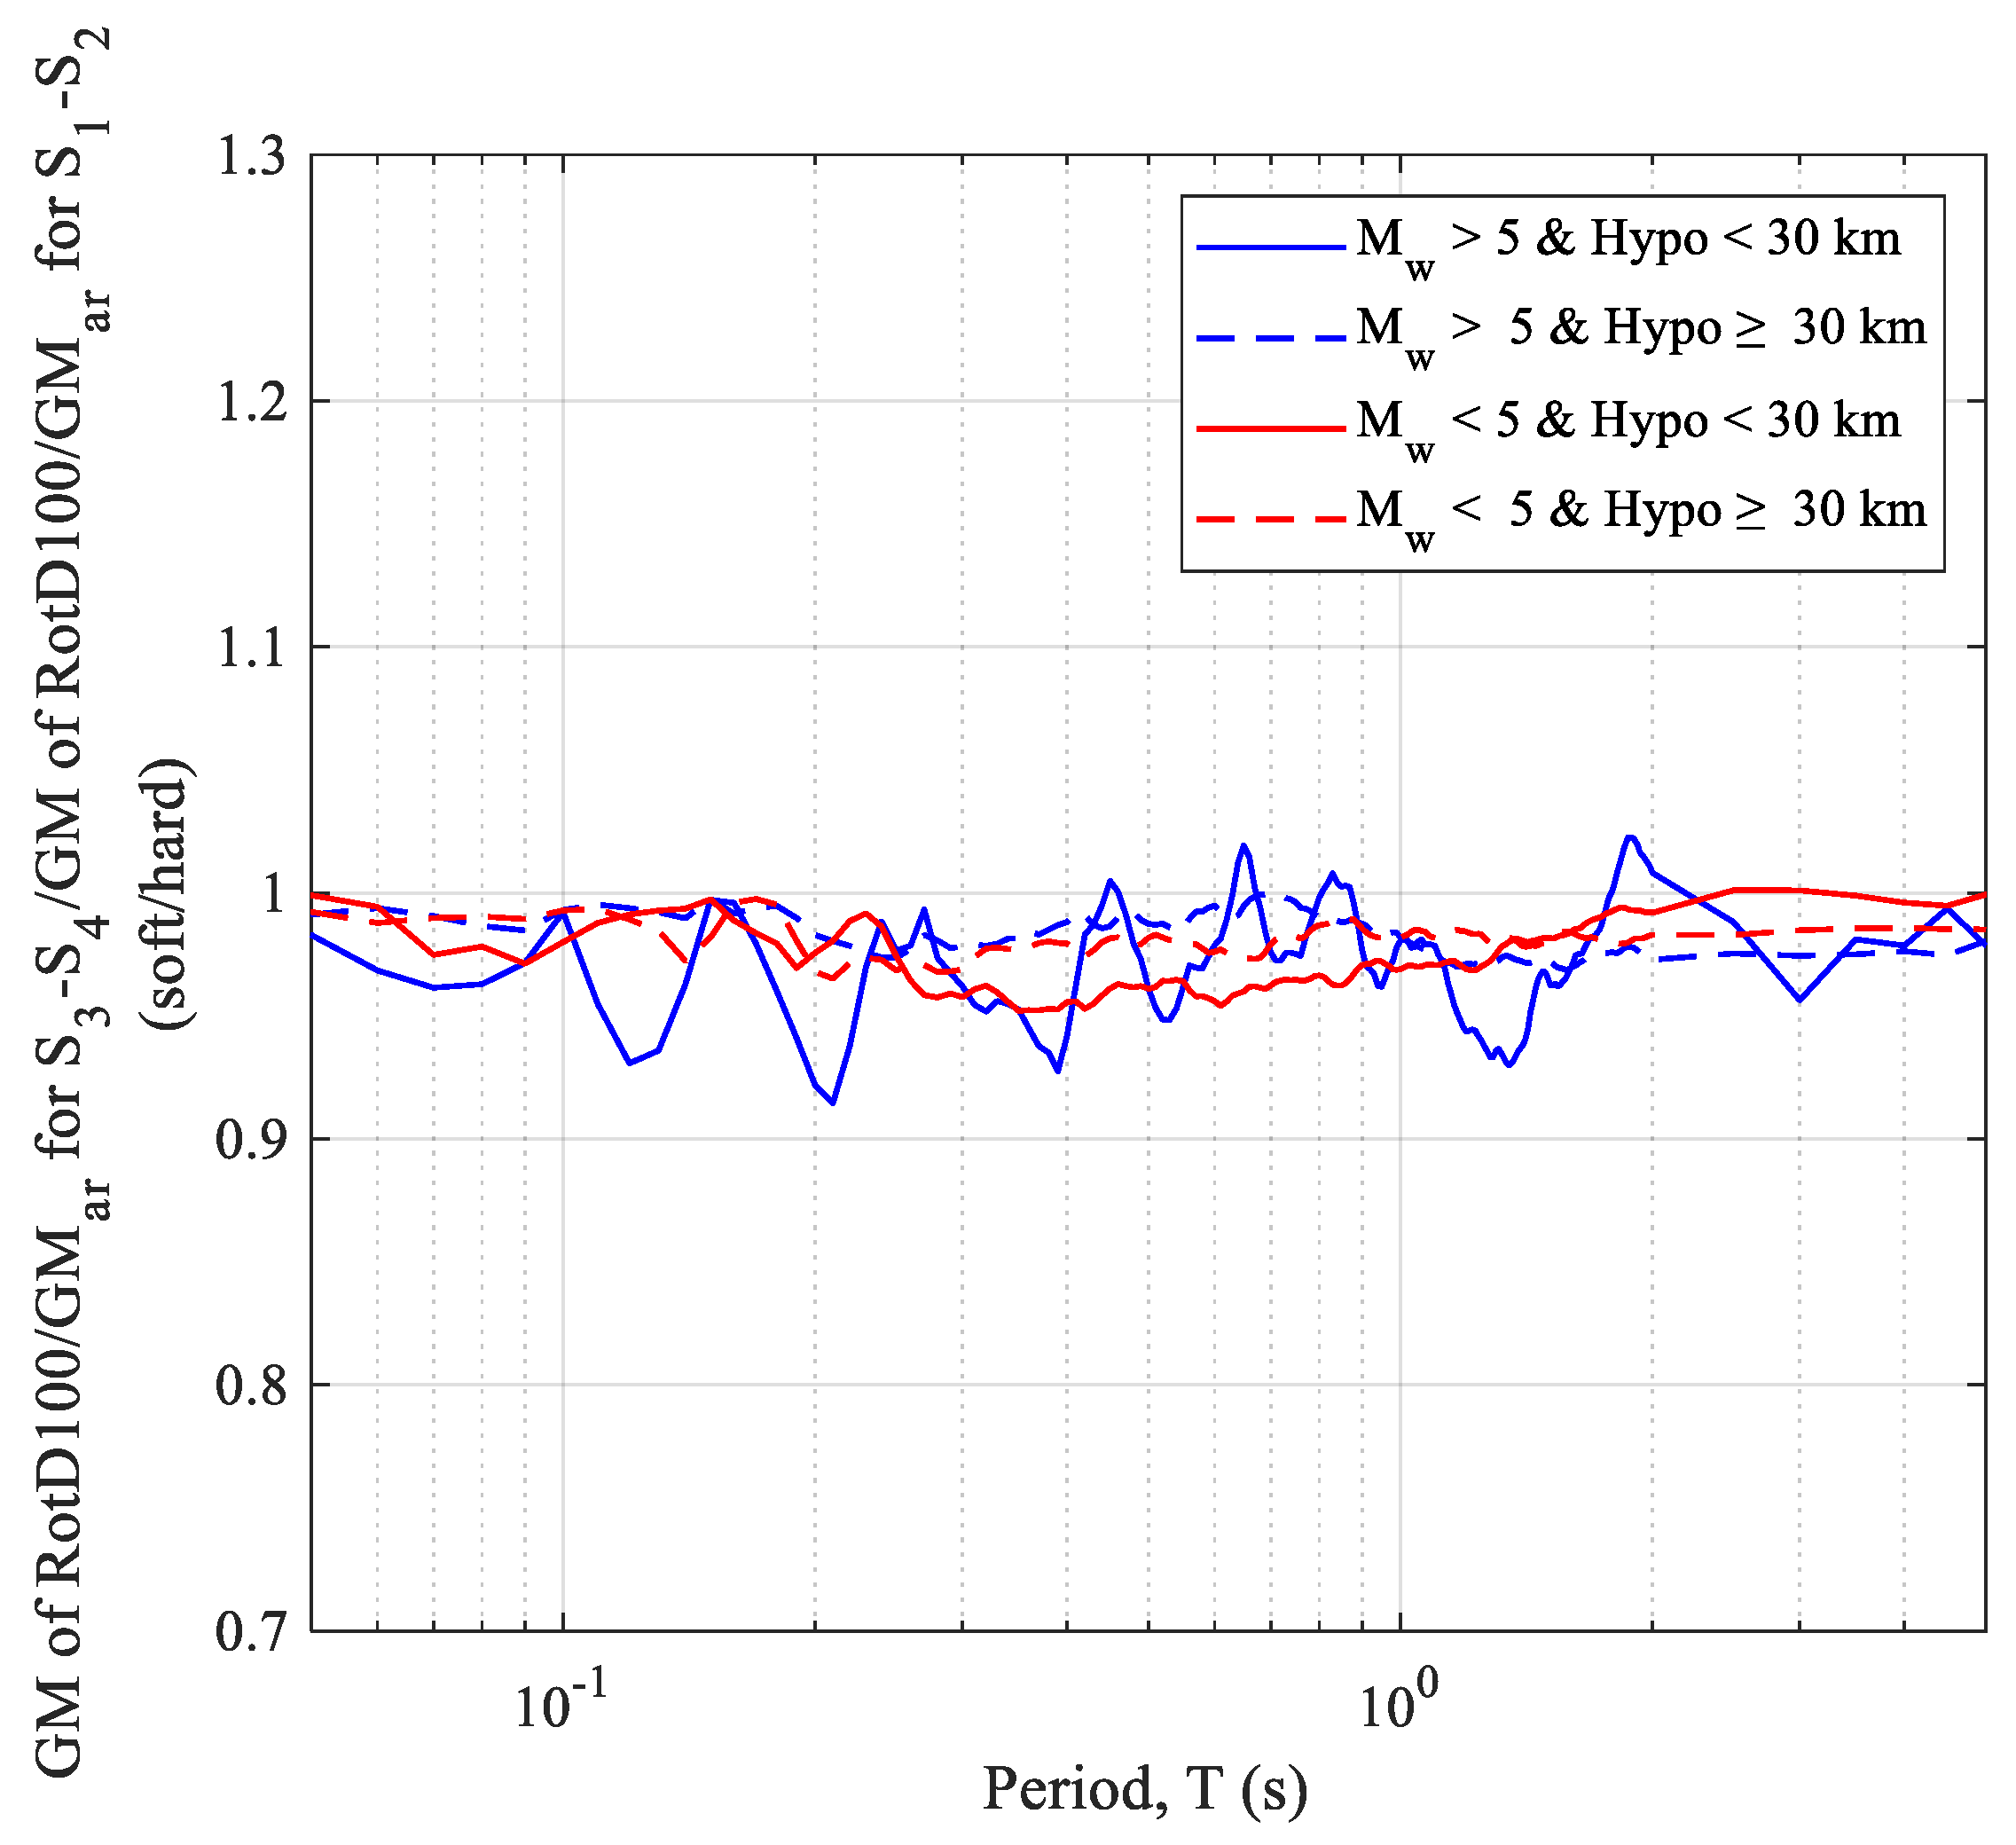
An additional interesting point, which was considered worth investigating, was whether site conditions impact the directionality effects, as observed through the RotD100/GMar factor. For this purpose, the data were divided into segments based on the site classification of seismic stations in Costa Rica [17]. The Costa Rican Seismic Code [32] site class nomenclature (S1-rock, S2-stiff, S3-soft, and S4-very soft soils) was used. The segmentation grouped hard soils (S1-S2) and soft soils (S3-S4). Both Mw and Hypo were also considered during the segmentation process. The resulting factors from this segmentation are shown in Figure 10. Once again, the influence of Mw and distance on these factors is apparent. These results indicate that the impact of magnitude is less conspicuous for nearby sites. However, when comparing soft (S3-S4) to hard soil (S1-S2) ratios (see Figure 11), no discernible variation related to the site conditions is found (ratios close to 1). Consequently, the soil effect is discarded as a contributor to the directionality effects.
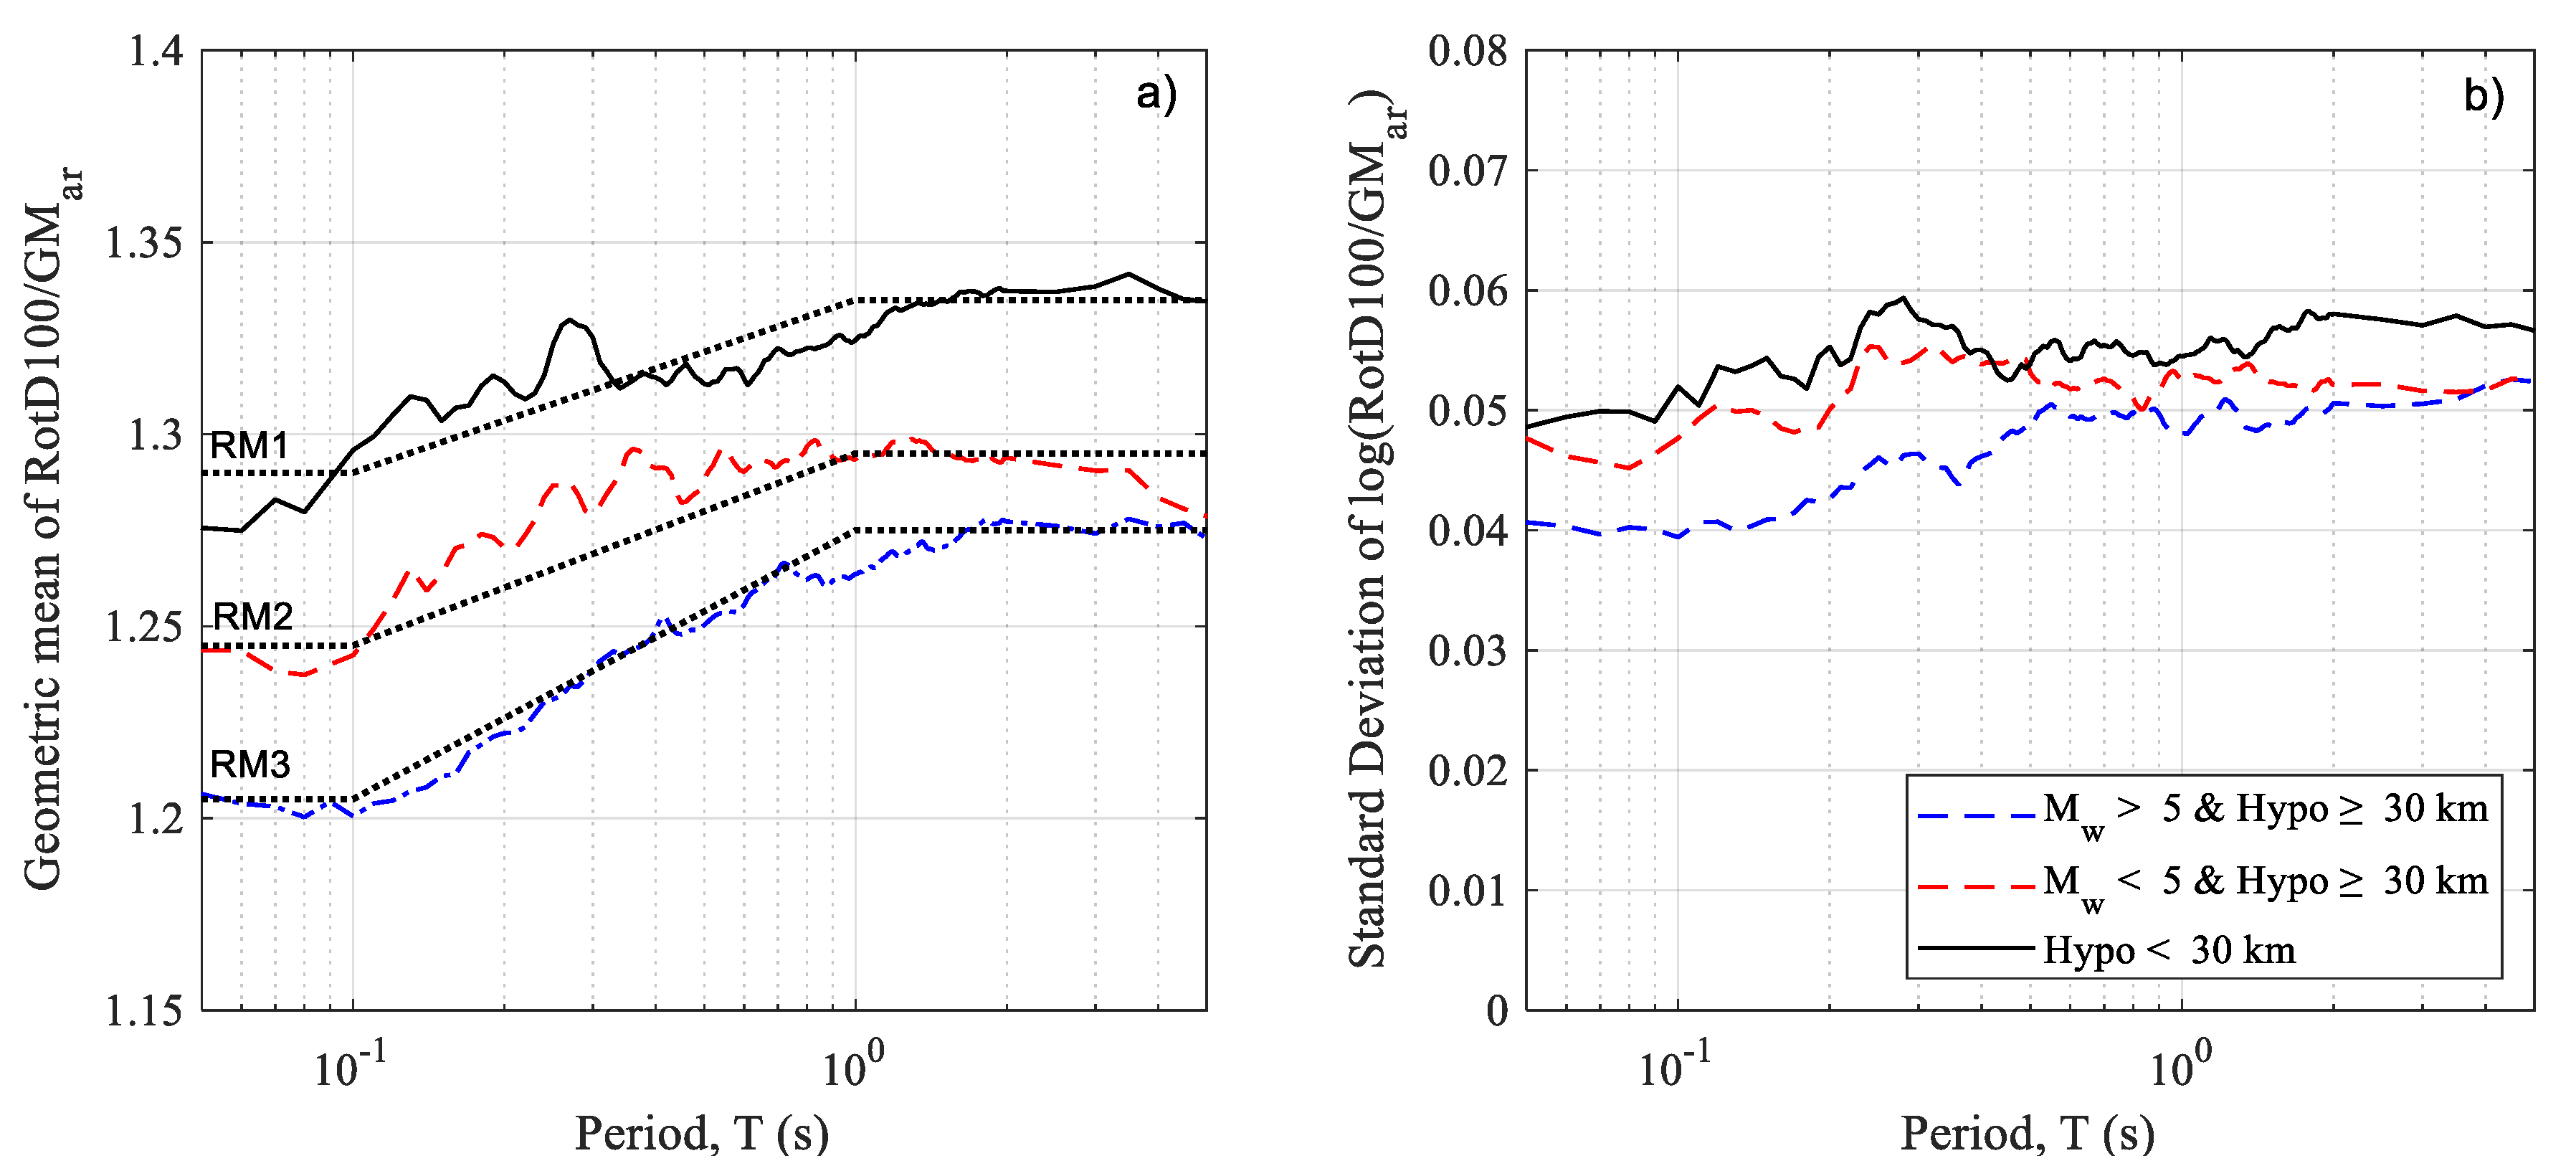
In this context, we present RotD100/GMar correction factors, which consider Mw and Hypo (Figure 12). These factors are categorized into three groups: (i) nearby events (Hypo < 30 km), (ii) distant events with high magnitudes (Mw > 5 and Hypo > 30 km), and (iii) distant events with low magnitudes (Mw < 5 and Hypo > 30 km). The nearby events, potentially influenced by directivity effects, exhibit the highest values, whereas distant events with high Mw display the lowest values. This proposal considers the overall impact of seismic parameters affecting the studied region. Therefore, it can be employed to update GMMs or PSHA developed in Costa Rica that were previously based on mean spectral response values as presumably used in the Costa Rican Seismic Code [32].
As illustrated in Figure 12, the ratios exhibit a consistent trend that has been harnessed to efficiently model the results, simplifying their conversion. This model is constructed by log-linear functions to fine-tune the derived ratios. The model is defined as follows:
R M 1 = 1.290 ,   for   T < 0.1 1.290 + 0.045 l n T n 0.1 l n 10 ,   for   0.1 T < 1.0 1.335 ,   for   1.0 T < 5.0
R M 2 = 1.245 ,   for   T < 0.1 1.245 + 0.050 l n T n 0.1 l n 10 ,   for   0.1 T < 1.0 1.295 ,   for   1.0 T < 5.0
R M 3 = 1.205 ,   for   T < 0.1 1.205 + 0.070 l n T n 0.1 l n 10 ,   for   0.1 T < 1.0 1.275 ,   for   1.0 T < 5.0
The model was employed to optimize the fitting of the obtained ratios. To facilitate comparison, Figure 12, showcases the models (RM1, RM2, and RM3), which align well with the ratios. These models can be effectively integrated into GMMs developed in Costa Rica.

5. Summary and Conclusions

This article presents the results of an assessment of the directionality effect observed in strong motion records. Directionality effects were examined by using an extensive and comprehensive database of strong ground motion with a wide spatial distribution. Given the extensive nature of the study, which involves extensive calculations of the responses of SDOF systems with 5% critical damping, computational time becomes a significant consideration. Various factors impact the computational time, including the computer hardware, software, and numerical algorithms employed in the analysis. For this research, the numerical approach proposed by Nigam and Jennings in 1969 was employed. Notably, this method yielded the same results while reducing computational time by approximately tenfold when compared to the step-by-step numerical integration method utilizing Duhamel’s integral, as demonstrated by Pinzón et al. [6].
Conventional intensity measures and sensor orientation-independent measures were computed using the complete strong motion database to establish ratios (correction factors) between seismic intensity measures that depend on sensor orientation and those that are orientation-independent. One theoretical benefit of orientation-independent IMs is their ability to remove the impact of sensor orientation on epistemic uncertainty.
The analysis included evaluating the segmentation by PGA, earthquake magnitude, and hypocentral distance on these ratios. The impact of soil site conditions on directionality effects has also been investigated. As a result of the investigation, a model is proposed to determine the maximum direction (RotD100) based on the GM, incorporating considerations of event magnitude and hypocentral distance. Nearby events, possibly influenced by directivity fault effects, exhibit the highest values, while distant events with high Mw display the lowest values. It is worth noting that, as there is no noticeable variation related to soil’s site conditions, they were not considered in the proposed model.
The proposed model offers a comprehensive approach to estimating RotD100 from GMar values, considering specific earthquake characteristics. This proposal considers the overall impact of seismic parameters (PGA, magnitude, and distance) affecting the studied region. Therefore, it can be used to update GMMs or PSHA developed in Costa Rica that were previously based on mean spectral response values of as-recorded strong motion.

Author Contributions

Conceptualization, methodology, software, validation, and formal analysis, L.A.P. and D.A.H.-L. Writing—original draft preparation, review, and editing, L.A.P., D.A.H.-L. and L.G.P. Supervision and project administration, L.A.P. Funding acquisition, L.A.P. and D.A.H.-L. All authors have read and agreed to the published version of the manuscript.

Funding

This study was supported by The National Secretariat of Science, Technology, and Innovation of the Republic of Panama (SENACYT) (grant number FIED 175–2022) and the University of Costa Rica through the project referenced as C2-002 and the National Emergency and Risk Prevention Law N°8488 of the Republic of Costa Rica.

Data Availability Statement

Certain data used are accessible to the public and additional details or outcomes are accessible upon inquiry. The exact values of the correction factors shown in Figure 12 are available upon request.

Acknowledgments

All authors would like to thank SENACYT, USMA, and SNI for their support.

Conflicts of Interest

The authors declare no conflicts of interest.

References

  1. Boore, D.M.; Watson-Lamprey, J.; Abrahamson, N.A. Orientation-Independent Measures of Ground Motion. Bull. Seismol. Soc. Am. 2006, 96, 1502–1511. [Google Scholar] [CrossRef]
  2. Bradley, B.A.; Baker, J.W. Ground Motion Directionality in the 2010–2011 Canterbury Earthquakes. Earthq. Eng. Struct. Dyn. 2015, 44, 371–384. [Google Scholar] [CrossRef]
  3. Boore, D.M. Orientation-Independent, Nongeometric-Mean Measures of Seismic Intensity from Two Horizontal Components of Motion. Bull. Seismol. Soc. Am. 2010, 100, 1830–1835. [Google Scholar] [CrossRef]
  4. Shahi, S.K.; Baker, J.W. NGA-West2 Models for Ground Motion Directionality. Earthq. Spectra 2014, 30, 1285–1300. [Google Scholar] [CrossRef]
  5. Beyer, K.; Bommer, J.J. Relationships between Median Values and between Aleatory Variabilities for Different Definitions of the Horizontal Component of Motion. Bull. Seismol. Soc. Am. 2006, 96, 1512–1522. [Google Scholar] [CrossRef]
  6. Pinzón, L.A.; Pujades, L.G.; Hidalgo-Leiva, D.A.; Díaz, S.A. Directionality Models from Ground Motions of Italy. Ing. Sismica 2018, 35, 43–63. [Google Scholar]
  7. Lagaros, N.D. The Impact of the Earthquake Incident Angle on the Seismic Loss Estimation. Eng. Struct. 2010, 32, 1577–1589. [Google Scholar] [CrossRef]
  8. Rigato, A.B.; Medina, R.A. Influence of Angle of Incidence on Seismic Demands for Inelastic Single-Storey Structures Subjected to Bi-Directional Ground Motions. Eng. Struct. 2007, 29, 2593–2601. [Google Scholar] [CrossRef]
  9. Torbol, M.; Shinozuka, M. The Directionality Effect in the Seismic Risk Assessment of Highway Networks. Struct. Infrastruct. Eng. 2014, 10, 175–188. [Google Scholar] [CrossRef]
  10. Soltanieh, S.; Memarpour, M.M.; Kilanehei, F. Performance Assessment of Bridge-Soil-Foundation System with Irregular Configuration Considering Ground Motion Directionality Effects. Soil Dyn. Earthq. Eng. 2019, 118, 19–34. [Google Scholar] [CrossRef]
  11. Athanatopoulou, A.M. Critical Orientation of Three Correlated Seismic Components. Eng. Struct. 2005, 27, 301–312. [Google Scholar] [CrossRef]
  12. Matsushima, S.; Kosaka, H.; Kawase, H. Directionally Dependent Horizontal-to-Vertical Spectral Ratios of Microtremors at Onahama, Fukushima, Japan. Earth Planets Space 2017, 69, 96. [Google Scholar] [CrossRef]
  13. Vargas-Alzate, Y.F.; Pujades, L.G.; Barbat, A.H.; Hurtado, J.E.; Diaz, S.A.; Hidalgo-Leiva, D.A. Probabilistic Seismic Damage Assessment of Reinforced Concrete Buildings Considering Direccionality Effects. Struct. Infrastruct. Eng. 2017, 16, 817–829. [Google Scholar]
  14. Pinzón, L.A.; Pujades, L.G.; Diaz, S.A.; Alva, R.E. Do Directionality Effects Influence Expected Damage? A Case Study of the 2017 Central Mexico Earthquake. Bull. Seismol. Soc. Am. 2018, 108, 2543–2555. [Google Scholar] [CrossRef]
  15. Moya-Fernández, A.; Pinzón, L.A.; Schmidt-Díaz, V.; Hidalgo-Leiva, D.A.; Pujades, L.G. A Strong-Motion Database of Costa Rica: 20 Yr of Digital Records. Seismol. Res. Lett. 2020, 91, 3407–3416. [Google Scholar] [CrossRef]
  16. Hidalgo-Leiva, D.A.; Linkimer, L.; Arroyo, I.G.; Arroyo-Solórzano, M.; Piedra, R.; Climent, A.; Schmidt Díaz, V.; Esquivel, L.C.; Alvarado, G.E.; Castillo, R.; et al. The 2022 Seismic Hazard Model for Costa Rica. Bull. Seismol. Soc. Am. 2023, 113, 23–40. [Google Scholar] [CrossRef]
  17. Pinzón, L.A.; Leiva, D.A.H.; Moya-Fernández, A.; Schmidt-Díaz, V.; Pujades, L.G. Seismic Site Classification of the Costa Rican Strong-Motion Network Based on VS30 Measurements and Site Fundamental Period. Earth Sci. Res. J. 2021, 25, 383–389. [Google Scholar] [CrossRef]
  18. Nigam, N.C.; Jennings, P.C. Calculation of Response Spectra From Strong-Motion Earthquake Records. Bull. Seismol. Soc. Am. 1969, 59, 909–922. [Google Scholar] [CrossRef]
  19. Boore, D.M.; Kishida, T. Relations Between Some Horizontal-Component Ground-Motion Intensity Measures Used In Practice. Bull. Seismol. Soc. Am. 2016, 107, 334–343. [Google Scholar] [CrossRef]
  20. Douglas, J. Earthquake Ground Motion Estimation Using Strong-Motion Records: A Review of Equations for the Estimation of Peak Ground Acceleration and Response Spectral Ordinates. Earth-Sci. Rev. 2003, 61, 43–104. [Google Scholar] [CrossRef]
  21. Poulos, A.; Miranda, E. Relations between MaxRotD50 and Some Horizontal Components of Ground-Motion Intensity Used in Practice. Bull. Seismol. Soc. Am. 2021, 111, 2167–2176. [Google Scholar] [CrossRef]
  22. Pinzón, L.A.; Pujades, L.G.; Medranda, I.; Alva, R.E. Case Study of a Heavily Damaged Building during the 2016 MW 7.8 Ecuador Earthquake: Directionality Effects in Seismic Actions and Damage Assessment. Geosciences 2021, 11, 74. [Google Scholar] [CrossRef]
  23. Haji-Soltani, A.; Pezeshk, S. Relationships among Various Definitions of Horizontal Spectral Accelerations in Central and Eastern North America. Bull. Seismol. Soc. Am. 2017, 108, 409–417. [Google Scholar] [CrossRef]
  24. Campbell, K.W.; Bozorgnia, Y. Campbell-Bozorgnia NGA Ground Motion Relations for the Geometric Mean Horizontal Component of Peak and Spectral Ground Motion Parameters; PEER Rep. 2007/02; Pacific Earthquake Engineering Research Center: Berkeley, CA, USA, 2007; Volume 238. [Google Scholar]
  25. Huang, Y.; Whittaker, A.S.; Luco, N. Establishing Maximum Spectral Demand for Performance-Based Earthquake Engineering: Collaborative Research with the University at Buffalo and the USGS; United States Geological Survey: Reston, VA, USA, 2011; Volume 80401. [Google Scholar]
  26. Building Seismic Safety Council. NEHRP Recommended Seismic Provisions for New Buildings Abd Other Structures; FEMA P-750; Federal Emergency Management Agency: Washington, DC, USA, 2009; Volume 388. [Google Scholar]
  27. Watson-Lamprey, J.A.; Boore, D.M. Beyond SaGMRotI: Conversion to SaArb, SaSN, and SaMaxRot. Bull. Seismol. Soc. Am. 2007, 97, 1511–1524. [Google Scholar] [CrossRef]
  28. Huang, Y.N.; Whittaker, A.S.; Luco, N. Maximum Spectral Demands in the Near-Fault Region. Earthq. Spectra 2008, 24, 319–341. [Google Scholar] [CrossRef]
  29. Aki, K.; Richards, P.G. Quantitative Seismology, 2nd ed.; University Science Books: Sausalito, CA, USA, 2002; ISBN 1891389637. [Google Scholar]
  30. Stein, S.; Wysession, M. An Introduction to Seismology, Earthquakes, and Earth Structure; Wiley: Hoboken, NJ, USA, 2009; ISBN 9781444311310. [Google Scholar]
  31. Boore, D.M. Simulation of Ground Motion Using the Stochastic Method. Pure Appl. Geophys. 2003, 160, 635–676. [Google Scholar] [CrossRef]
  32. CFIA Código Sísmico de Costa Rica 2010 (Revisión 2014); Editorial Tecnológica de Costa Rica: Cartago, Costa Rica, 2016; ISBN 9789977662343.
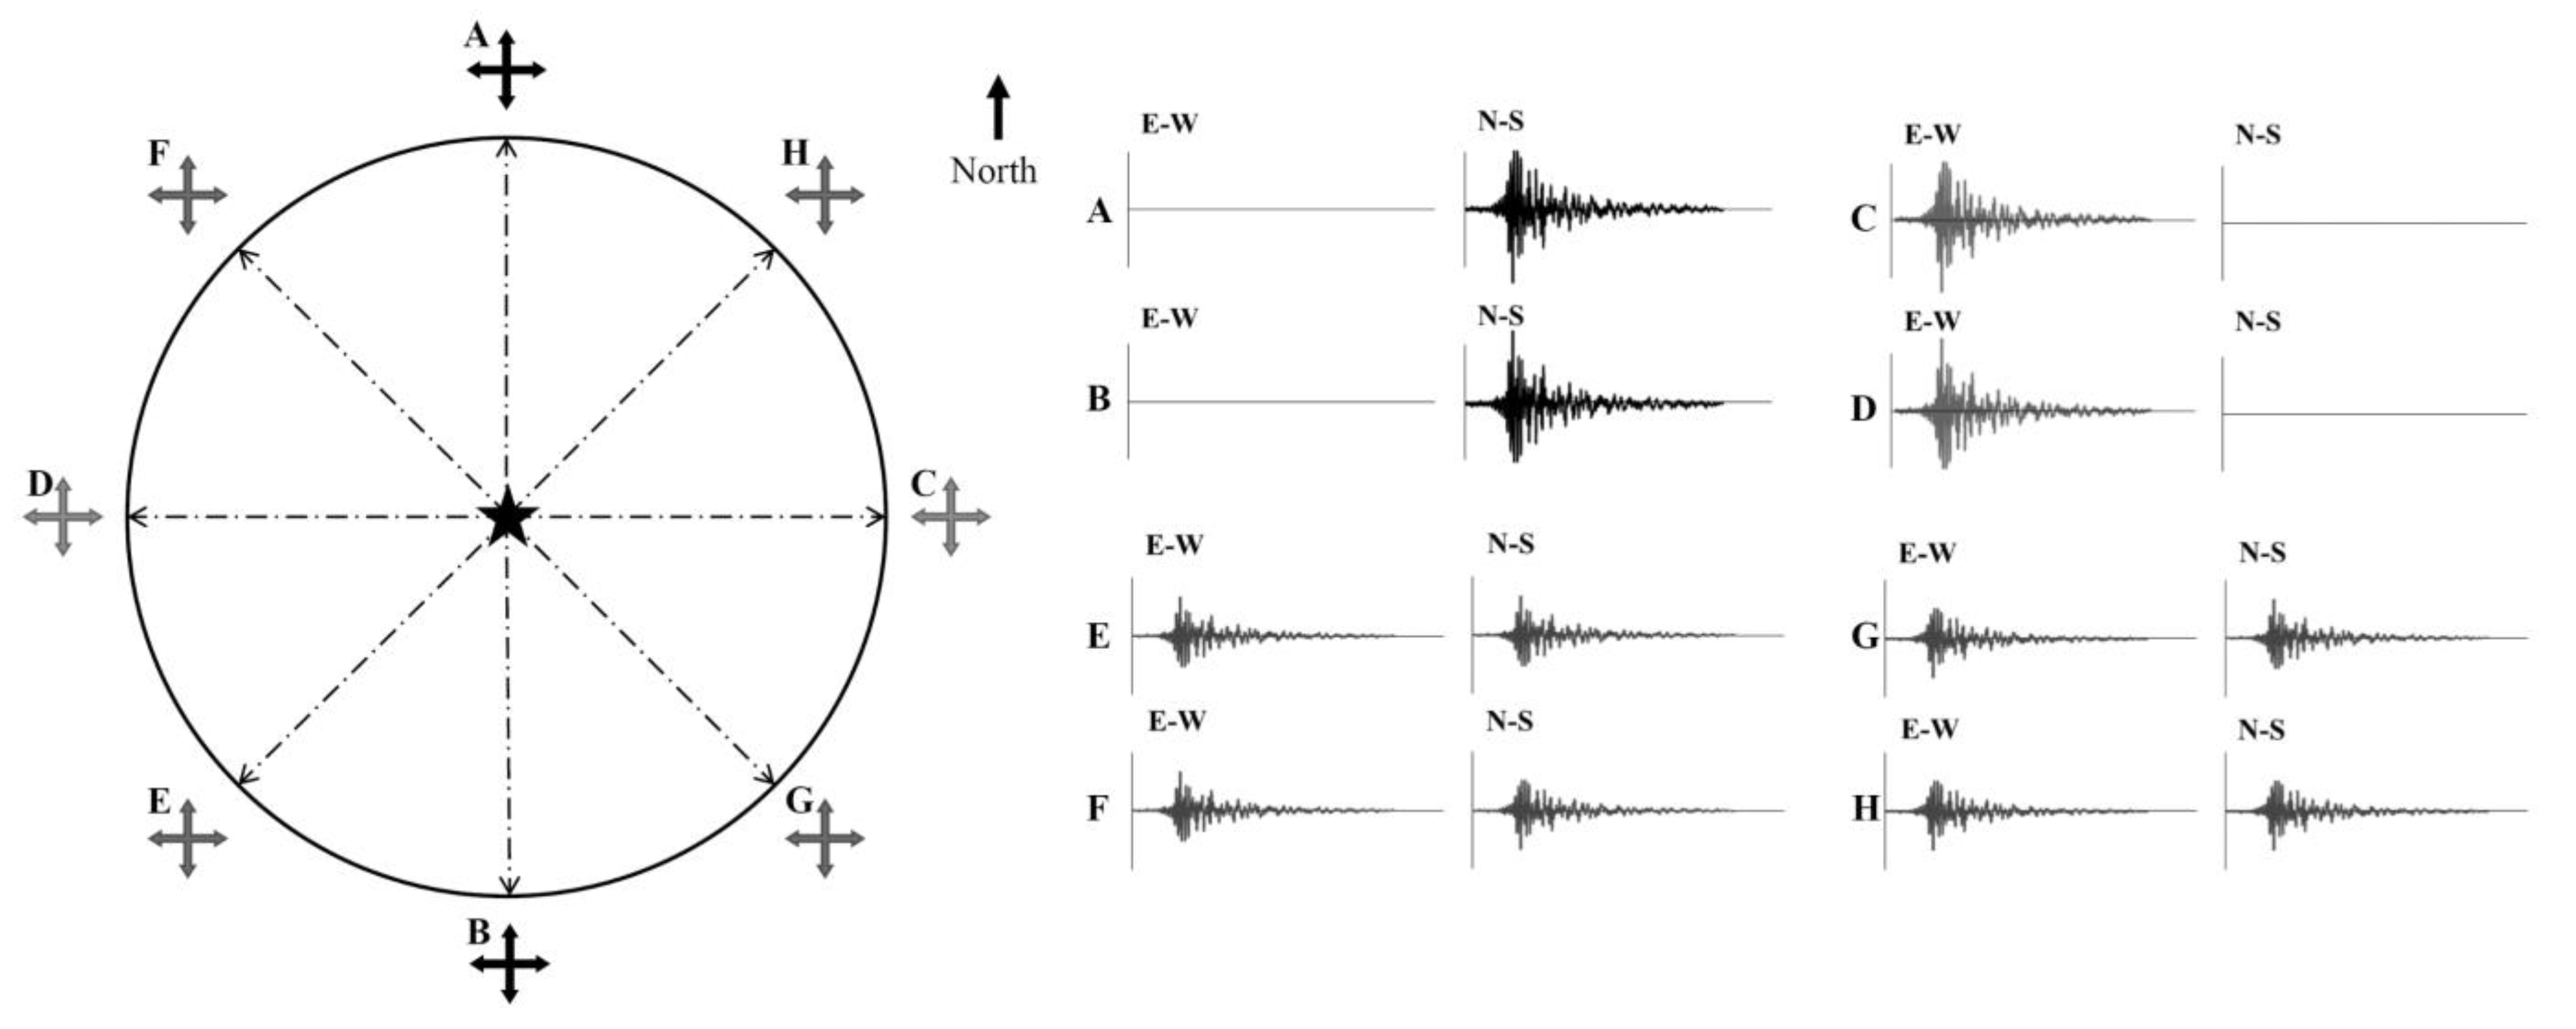
Figure 1. On the (left-hand) side, there is a scheme depicting an explosive source (represented by a star) emitting energy in a spherical pattern within a uniform and isotropic medium. Eight sensors are located at an equal distance from the source along the radial direction. On the (right-hand) side, the motion records of the two horizontal–orthogonal components for each sensor are displayed.
Geosciences 14 00139 g001
Figure 2. A scheme similar to Figure 1. Sensors are substituted by buildings facing the same direction and located at the same radial distance. Buildings have a strong axis (2k at E-W) and a weak axis (1k at N-S). The two buildings most likely to be damaged are marked with a circle. In these cases, the strongest action hits the weak axis of the building.
Geosciences 14 00139 g002
Figure 3. (a) Evolution of the spectral acceleration considering different θ from the 5 September 2012 Mw 7.6 Nicoya earthquake recorded at station GNSR. The graph displays the RotD100, highlighting that its occurrence at each period varies with θ. (b) Comparison of the 5% damped response spectra estimated with RotD100, geometric mean (GMar), horizontal acceleration components (N00E and N90E), and the rotated components (θ° rot).
Geosciences 14 00139 g003
Figure 4. (a) Epicenter location for earthquakes recorded between 1998 and 2021, (b) accelerometric stations, and (c) the magnitude vs. the hypocentral distance for the 4199 recorded events.
Geosciences 14 00139 g004
Figure 5. (ac) Comparison of RotD100 and GMar for the PGA (T = 0 s) and SA for oscillators with T = 0.2 s and T = 1.0 s obtained after the comprehensive analysis of the complete database.
Geosciences 14 00139 g005
Figure 6. Geometric mean of ratios: (a) RotD100/GMar, LRotD50/GMar, Larger/GMar; (b) RotD50/GMar, GMRotI50/GMar, and GMRotD50/GMar; and (c) standard deviations.
Geosciences 14 00139 g006
Figure 7. Geometric mean of the ratio RotD100/GMar found in this study and comparison with ratios obtained by others [5,14,23,24,25,26,27].
Geosciences 14 00139 g007
Figure 8. Geometric mean of RotD100/GMar and the standard deviation segmented by (a) hypocentral distance, (b) moment magnitude, and (c) peak ground acceleration.
Geosciences 14 00139 g008
Figure 9. Geometric mean of RotD100/GMar and the standard deviation segmented by (a) PGA and Mw, and (b) PGA and hypocentral distance.
Geosciences 14 00139 g009
Figure 10. Geometric mean of RotD100/GMar and the standard deviation segmented by (a) hard soils (S1-S2) and (b) soft soils (S3-S4).
Geosciences 14 00139 g010
Figure 11. Ratio between the geometric means of RotD100/GMar for soft (S3-S4) (Figure 9b) and hard (S1-S2) soils (Figure 9a).
Geosciences 14 00139 g011
Figure 12. (a) Geometric mean of RotD100/GMar and (b) the standard deviation divided by three groups: nearby events (Hypo < 30 km), distant events with high magnitudes (Mw > 5 and Hypo > 30 km), and distant events with low magnitudes (Mw < 5 and Hypo > 30 km).
Geosciences 14 00139 g012
Table 1. List of intensity measures based on spectral acceleration.
IMDefinition
GMarGeometric mean of the response spectra of the two as-recorded horizontal components [2,5,6,19].
LargerEnvelope of the response spectra of the two as-recorded horizontal components [2,6,19,20].
GMRotD5050th percentile of a set of geometric means of the response spectra of the two as-recorded horizontal components rotated onto all nonredundant azimuths (GMRot) [1,19].
GMRotI50GMRot response spectrum from the rotation angle best matching the GMRotD50 [1,19].
RotD5050th percentile of a set of response spectra of the two as-recorded horizontal components rotated onto all nonredundant azimuths [3,6].
RotD100100th percentile of a set of response spectra of the two as-recorded horizontal components rotated onto all nonredundant azimuths [3,6].
LRotD5050th percentile of a set of envelopes of the response spectra of the two as-recorded horizontal components rotated onto all nonredundant azimuths [6], also referred to as MaxRotD50 [21].
Disclaimer/Publisher’s Note: The statements, opinions and data contained in all publications are solely those of the individual author(s) and contributor(s) and not of MDPI and/or the editor(s). MDPI and/or the editor(s) disclaim responsibility for any injury to people or property resulting from any ideas, methods, instructions or products referred to in the content.