

Trend Analysis of Climatic Variables in the Cross River Basin, Nigeria

Abstract
:1. Introduction
2. Materials and Methods
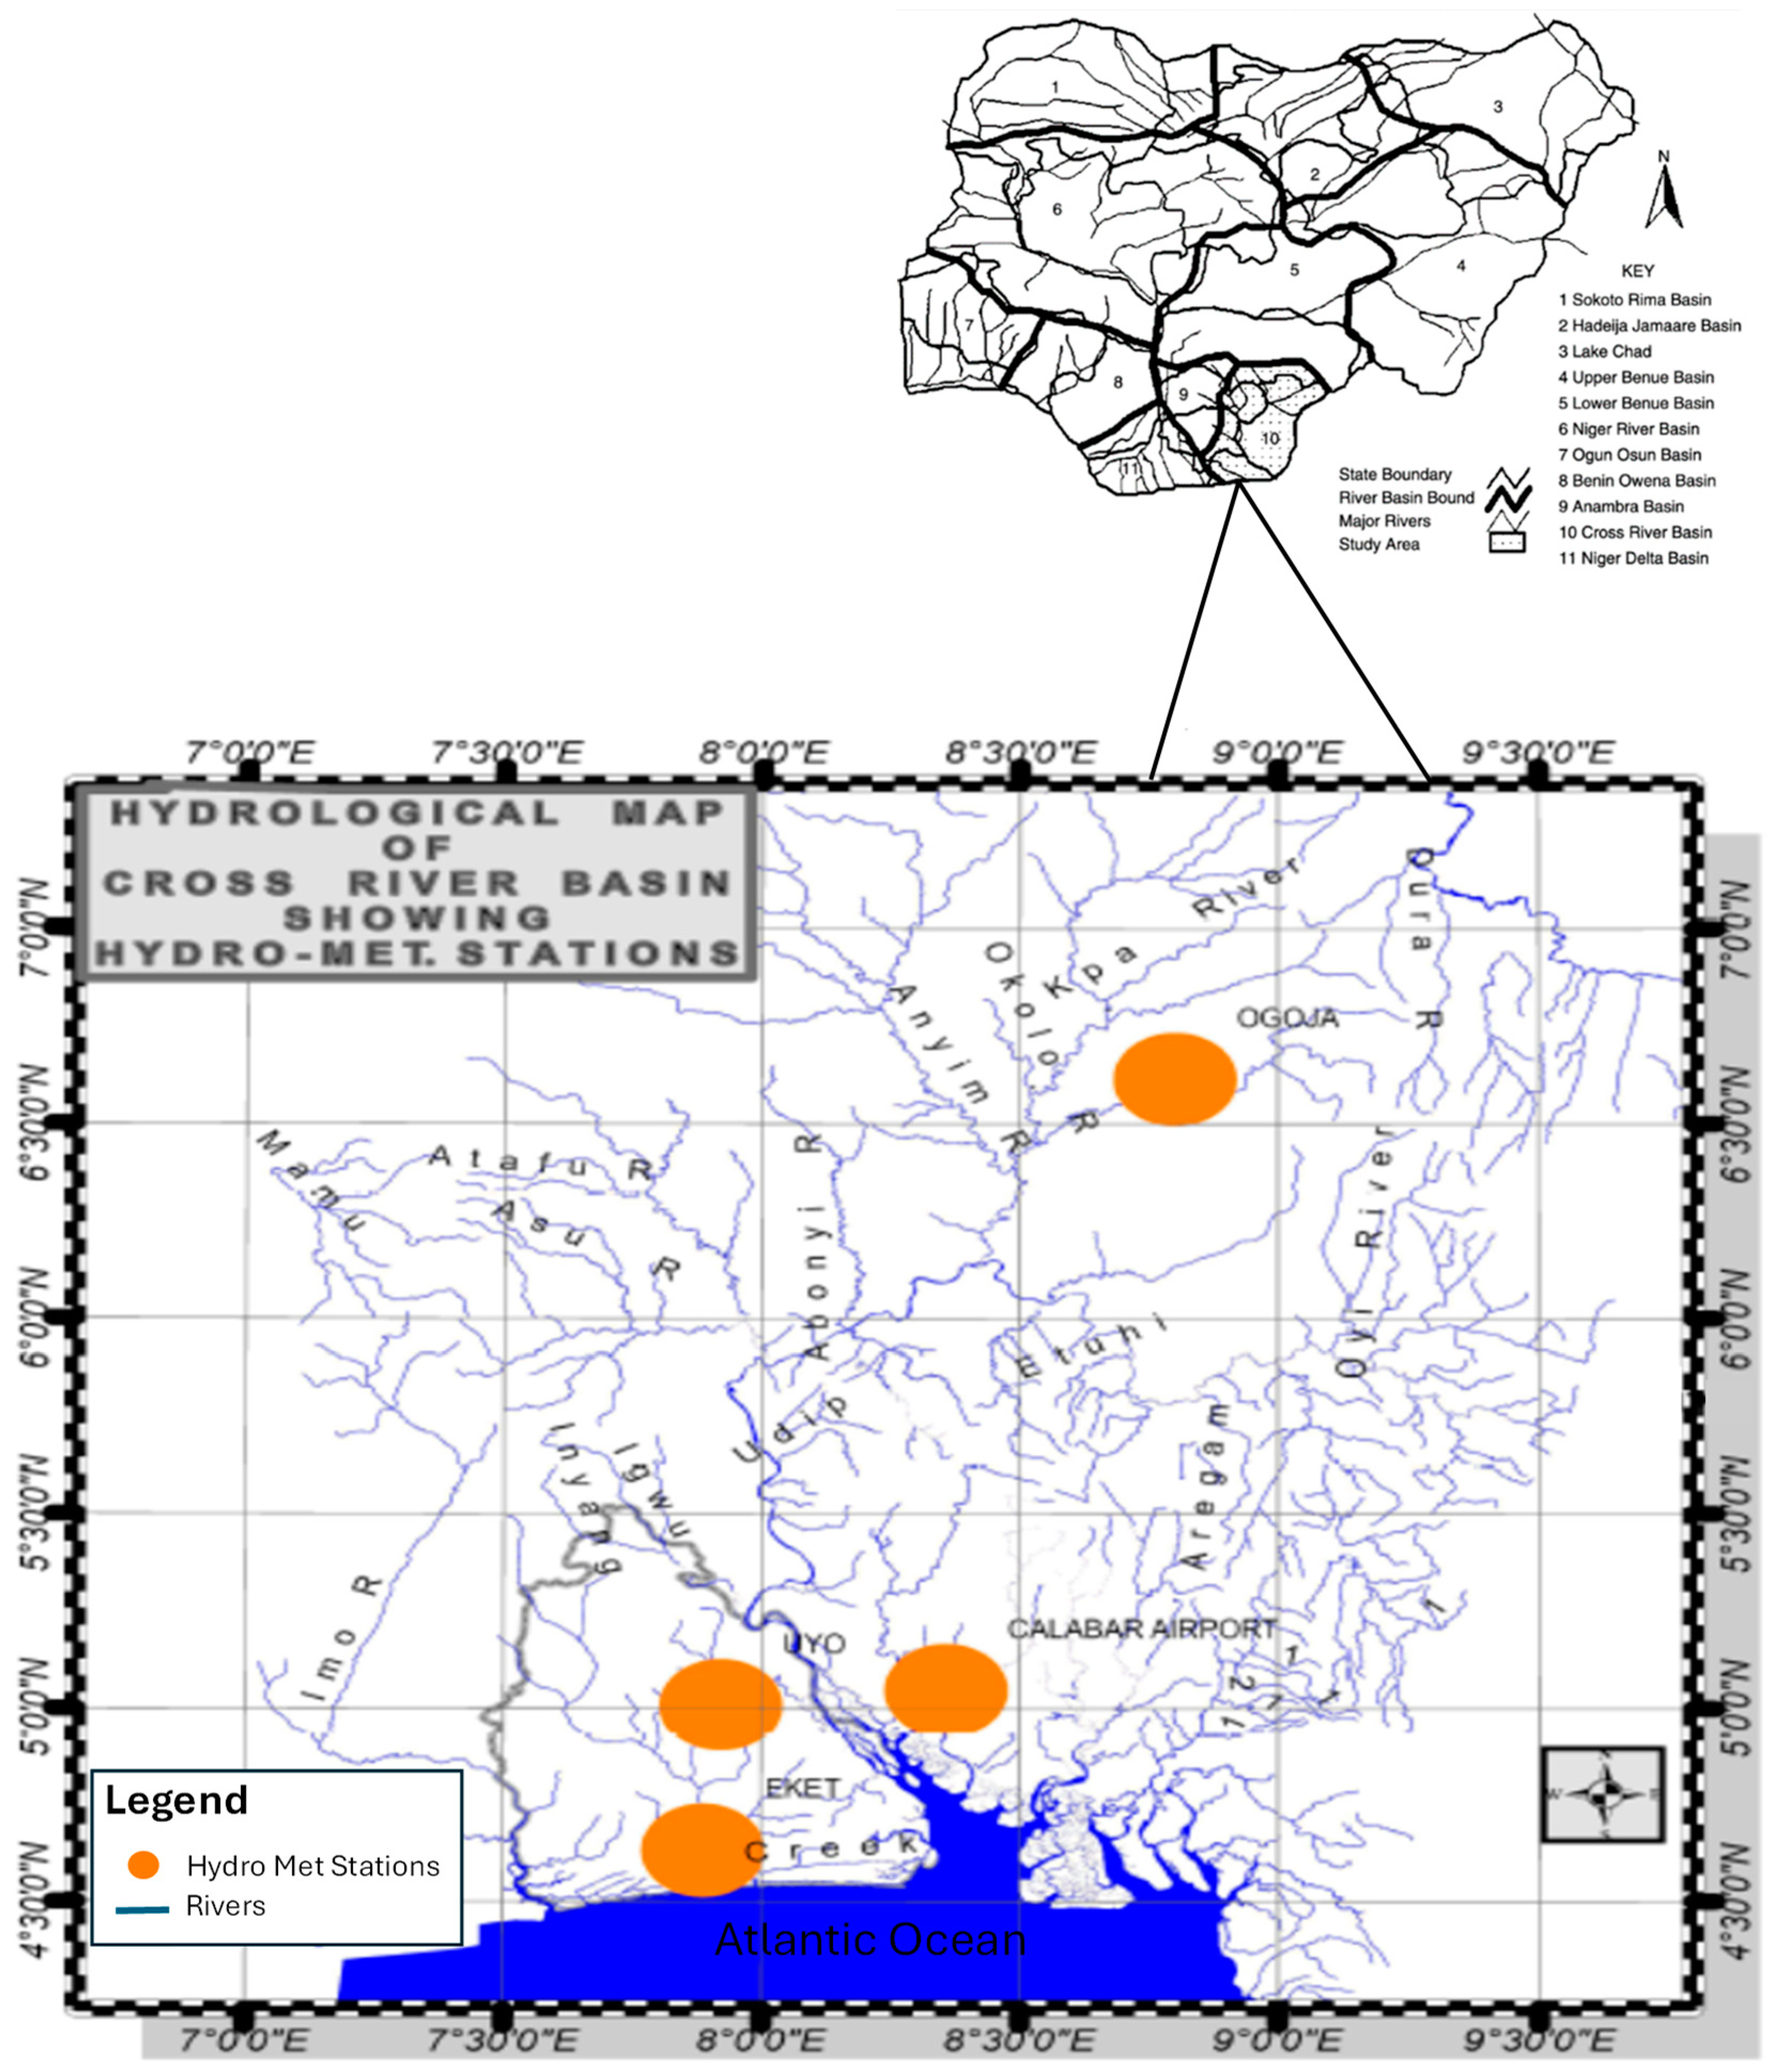
2.1. Description of Study Area and Data
2.2. Methods
2.2.1. Mann–Kendall Trend Detection
2.2.2. Illustrating the Mann–Kendall Analysis
2.2.3. Modified Mann–Kendall Trend Detection
3. Results and Discussion
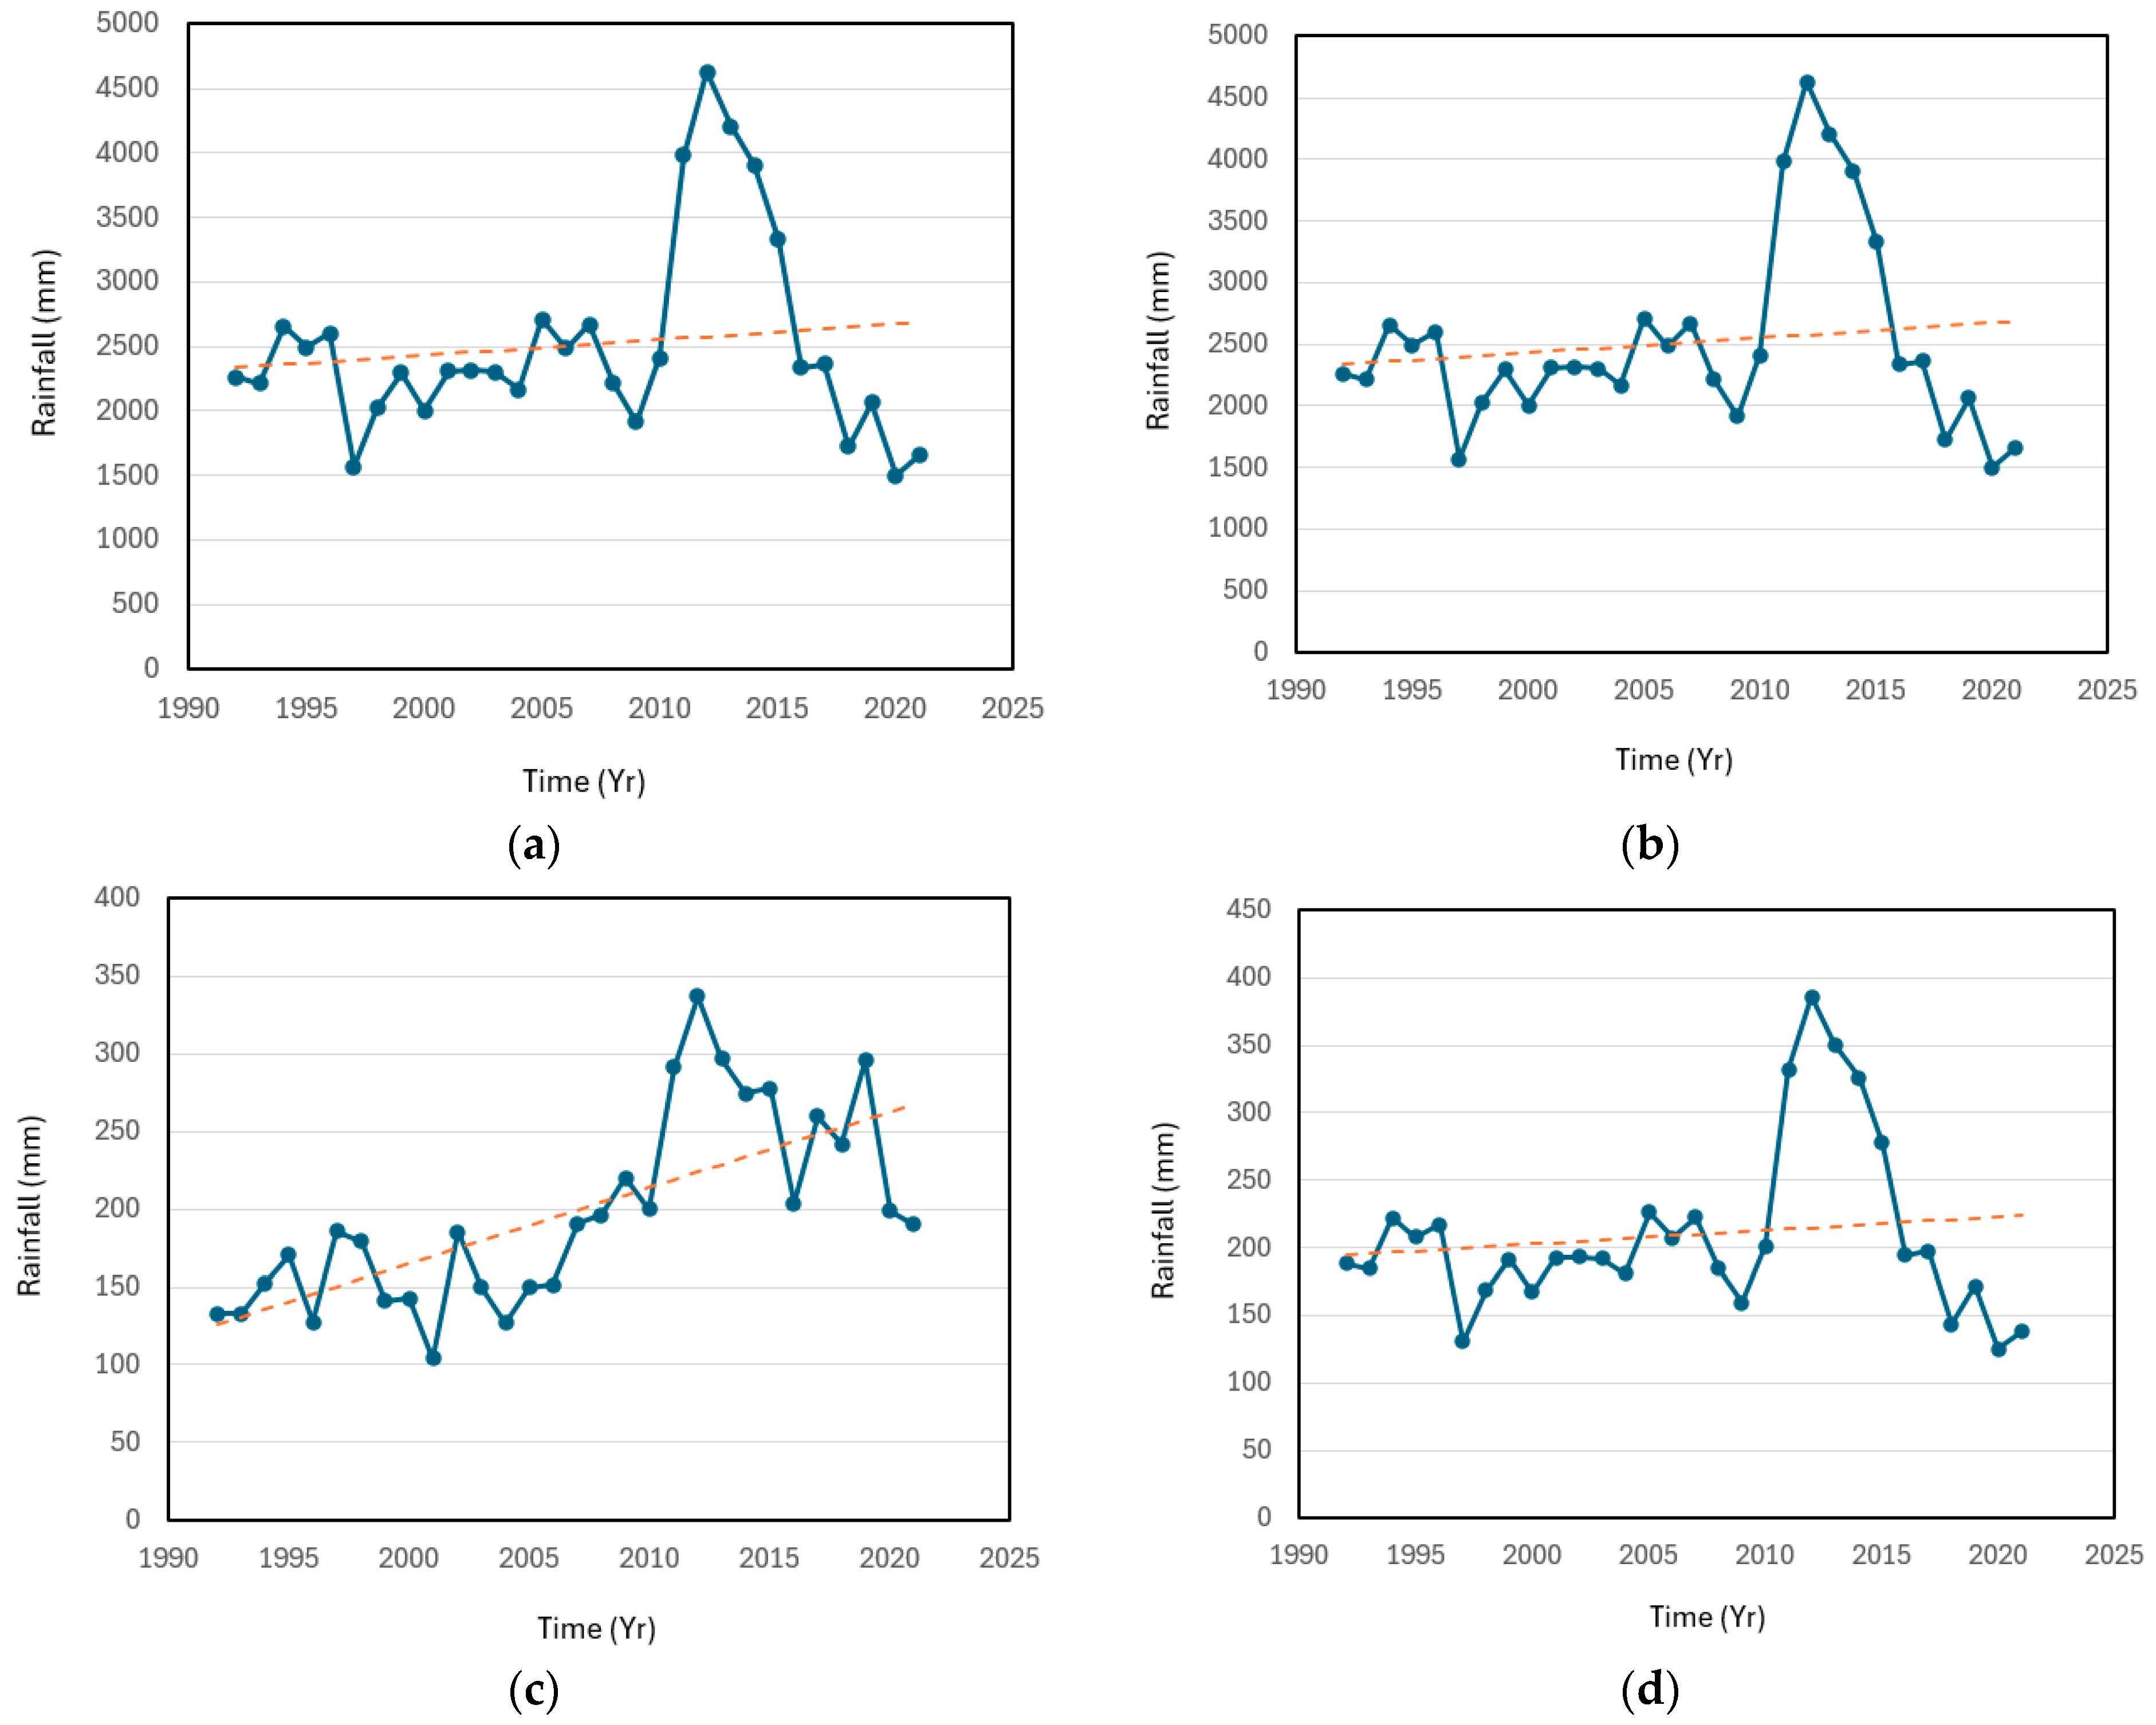
3.1. Analysis of Rainfall
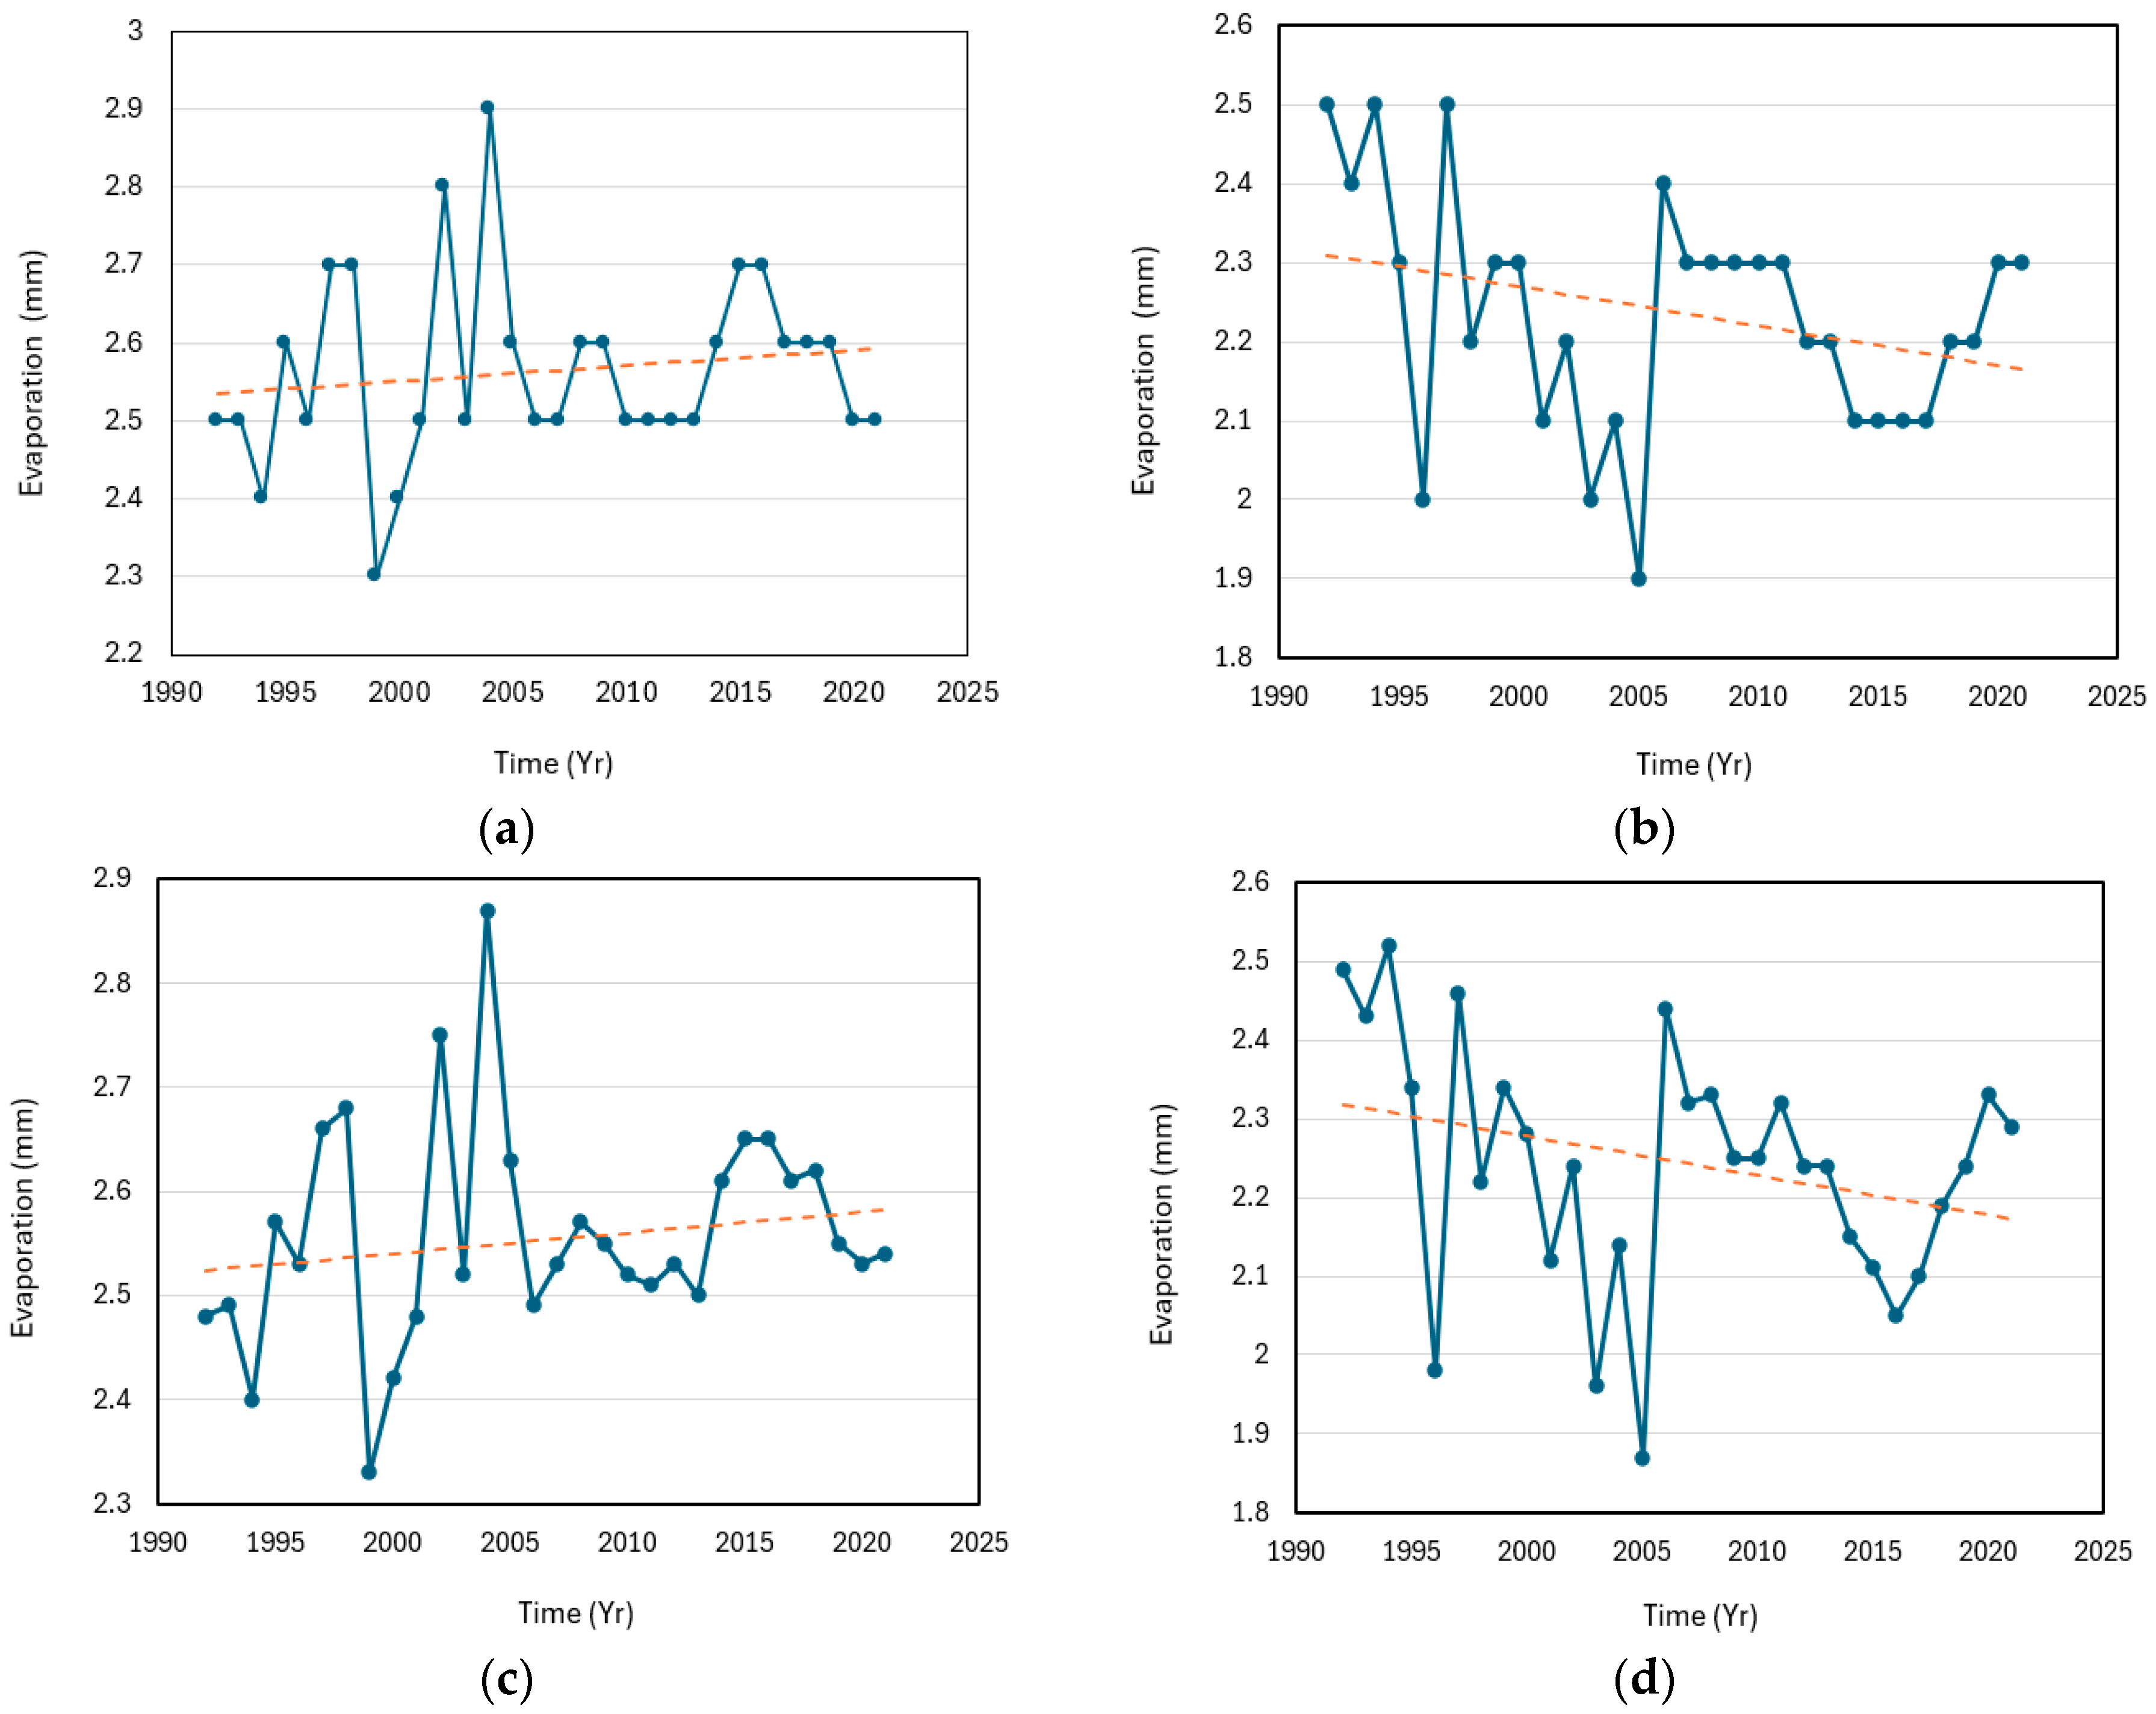
3.2. Analysis of Evaporation
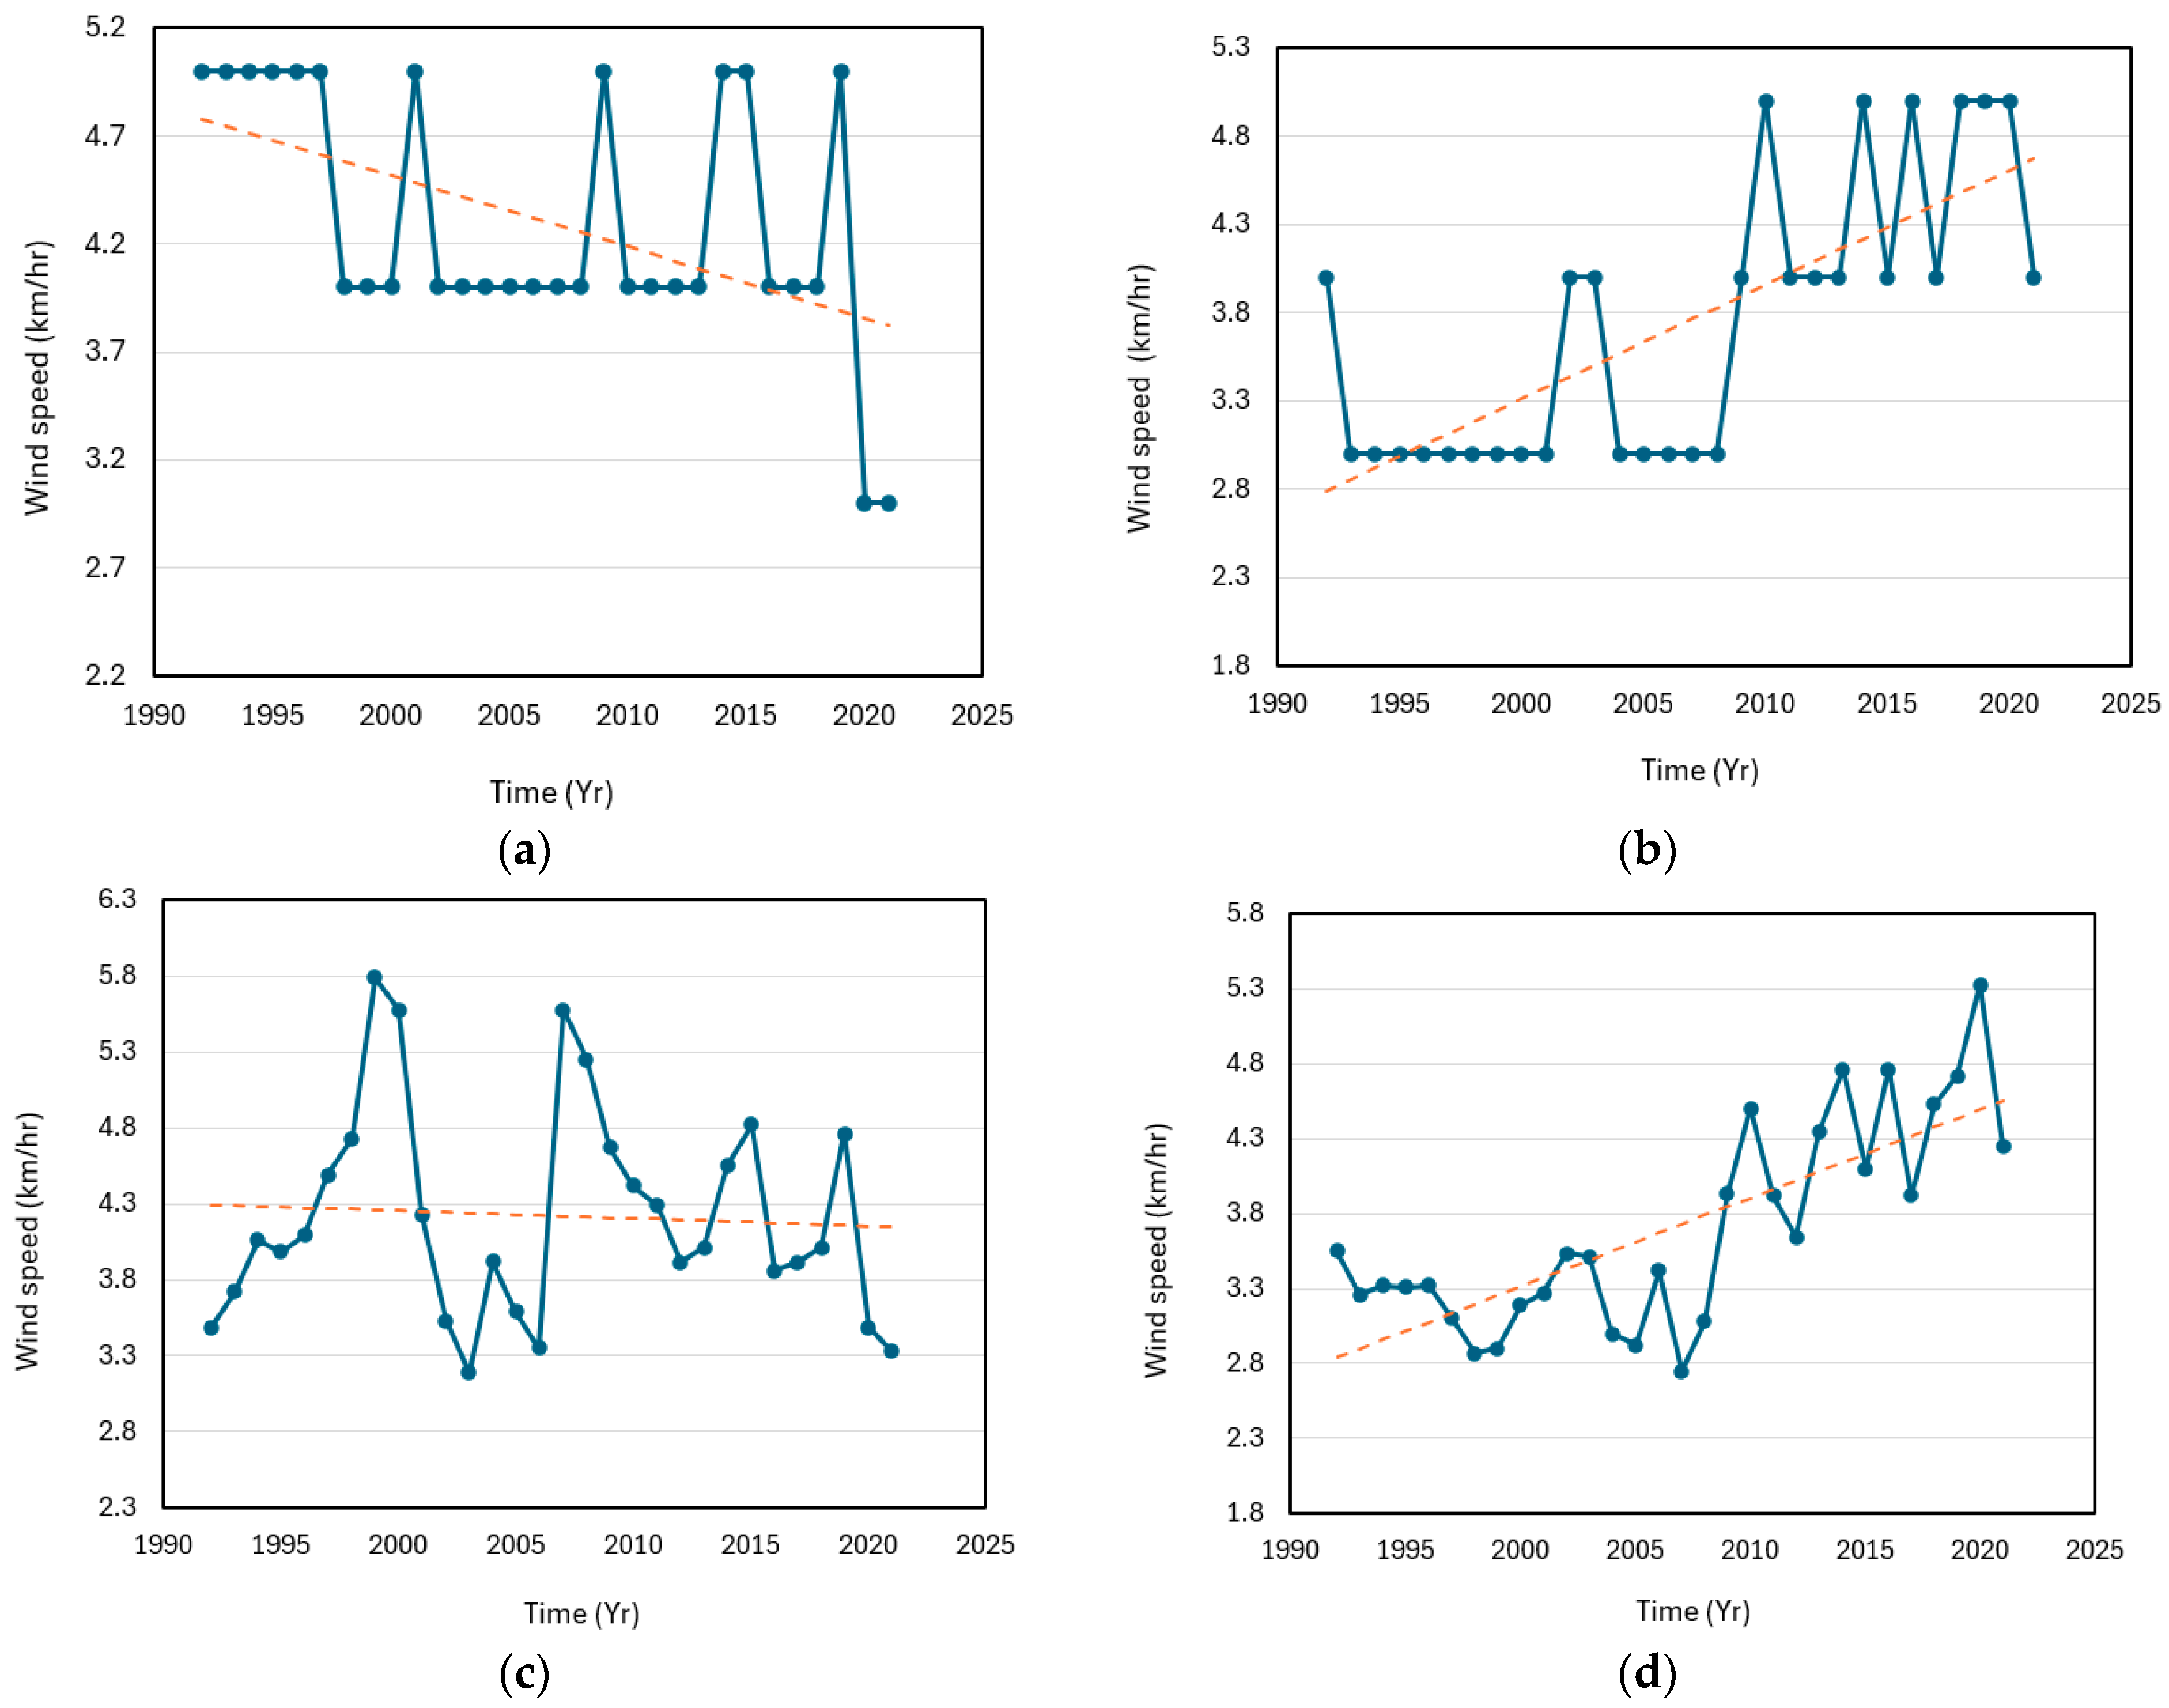
3.3. Analysis of Wind Speed
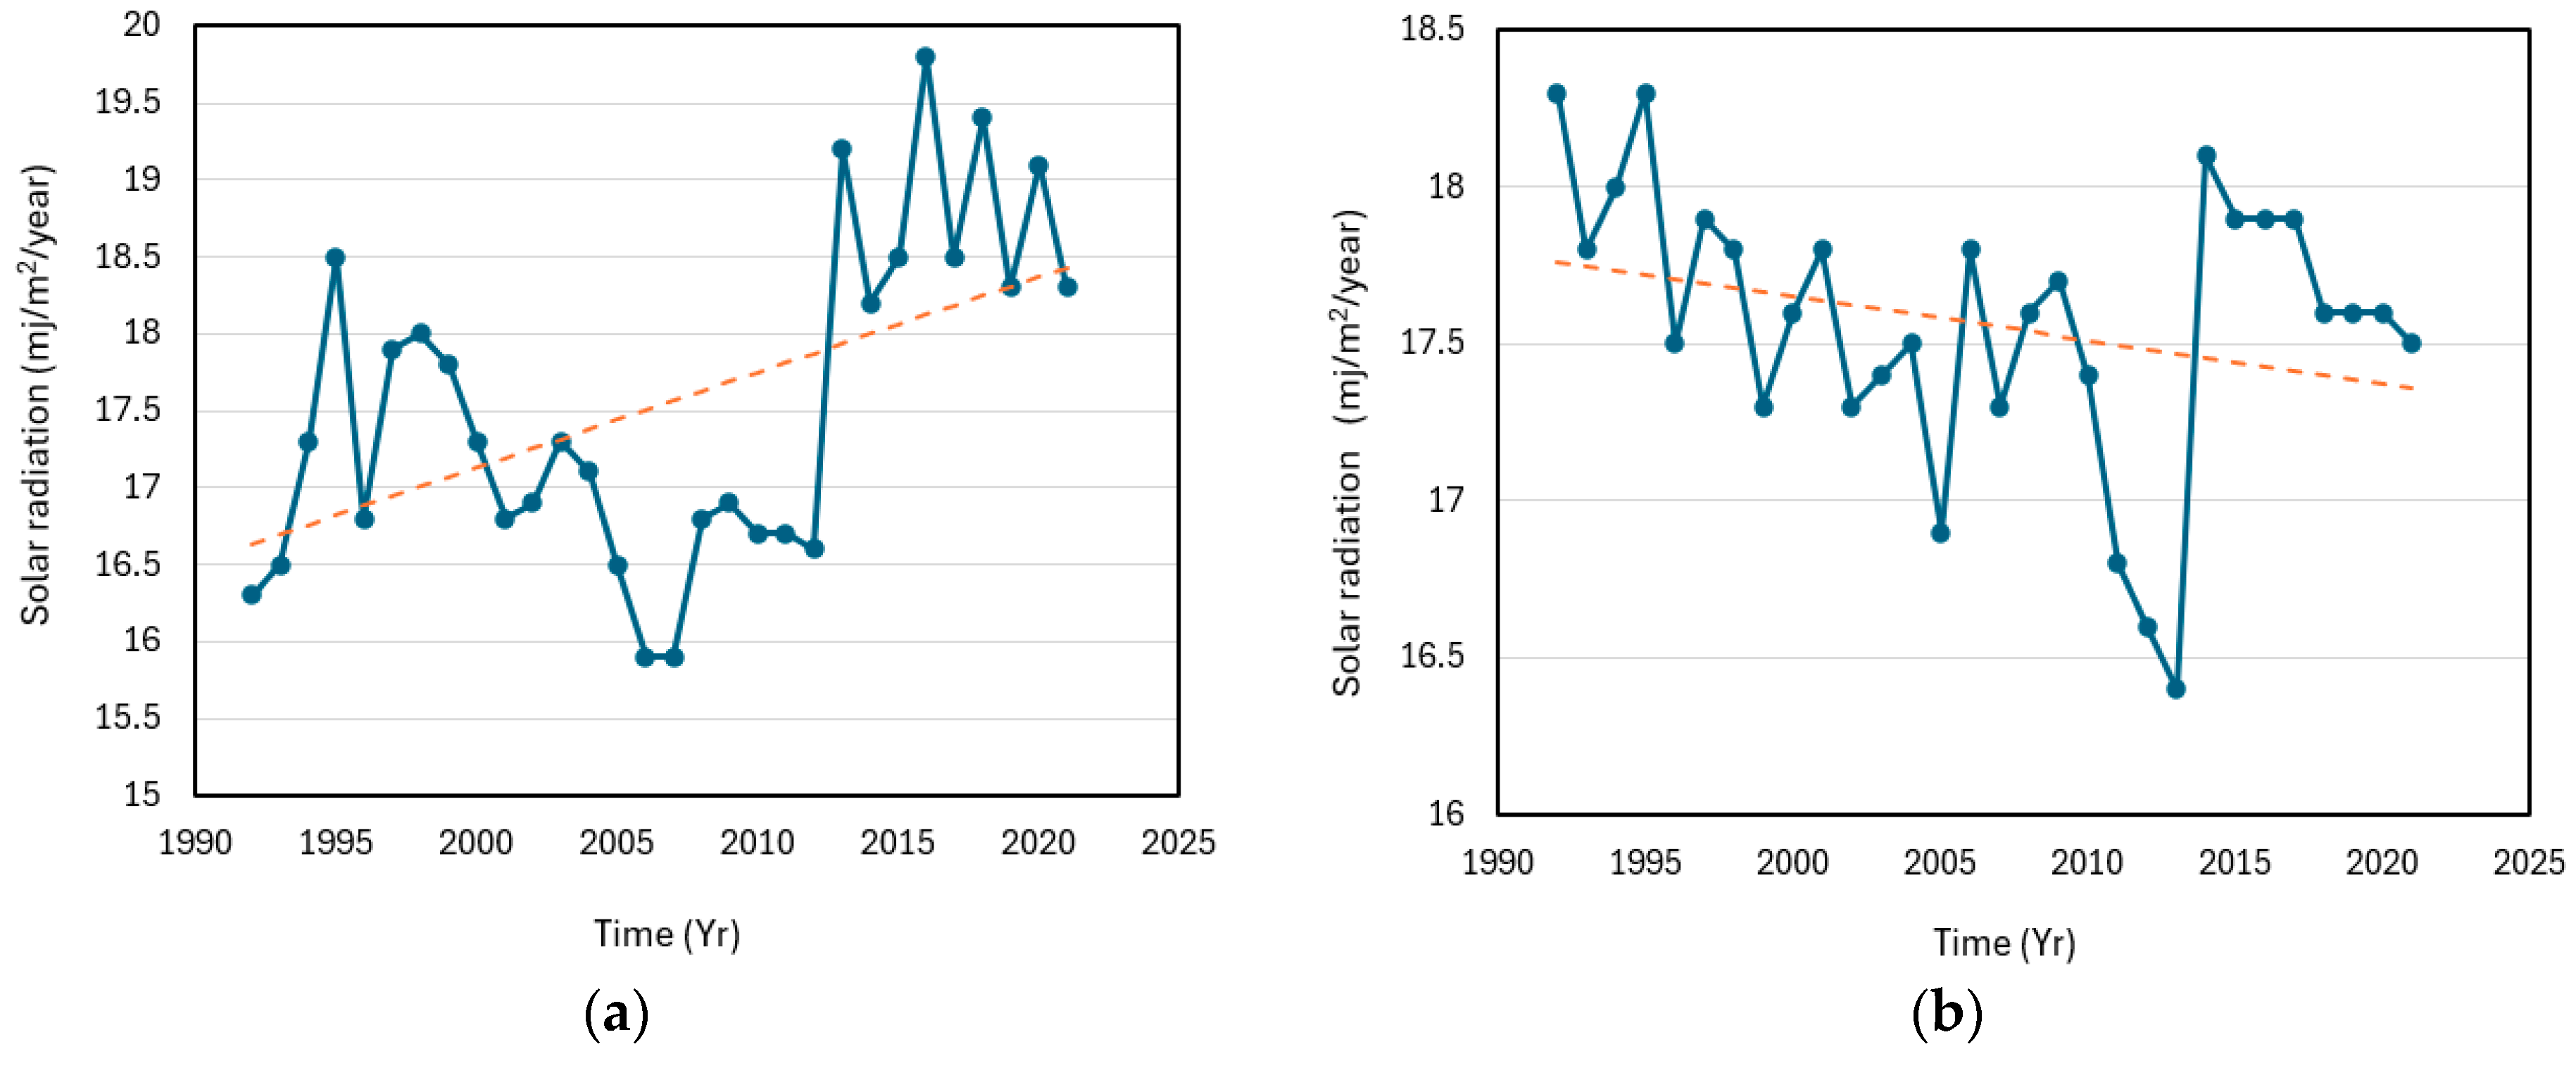
3.4. Analysis of Solar Radiation
3.5. Analysis of Sunshine Hours
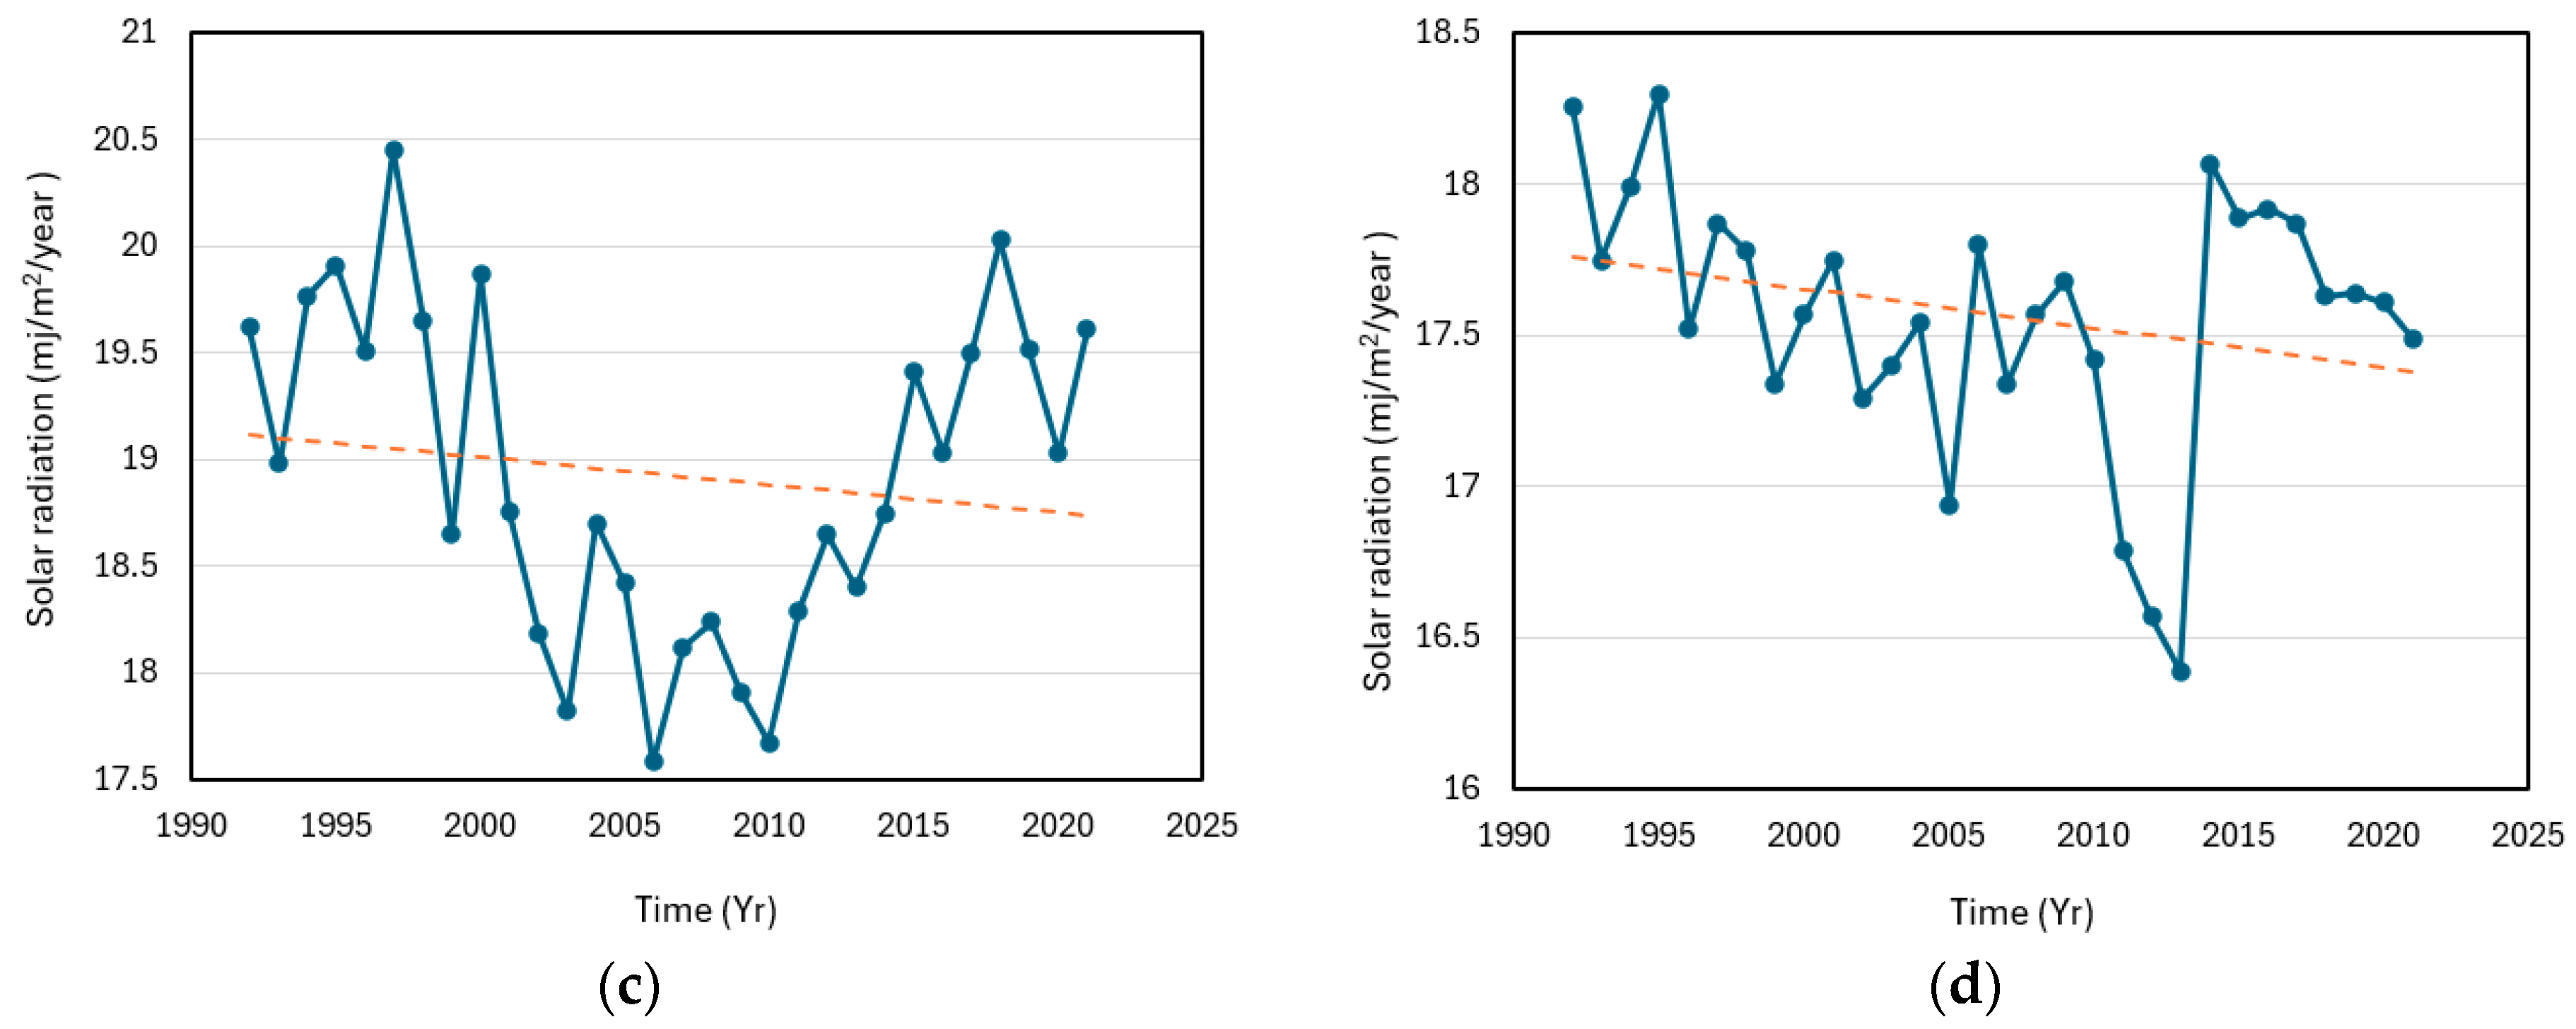
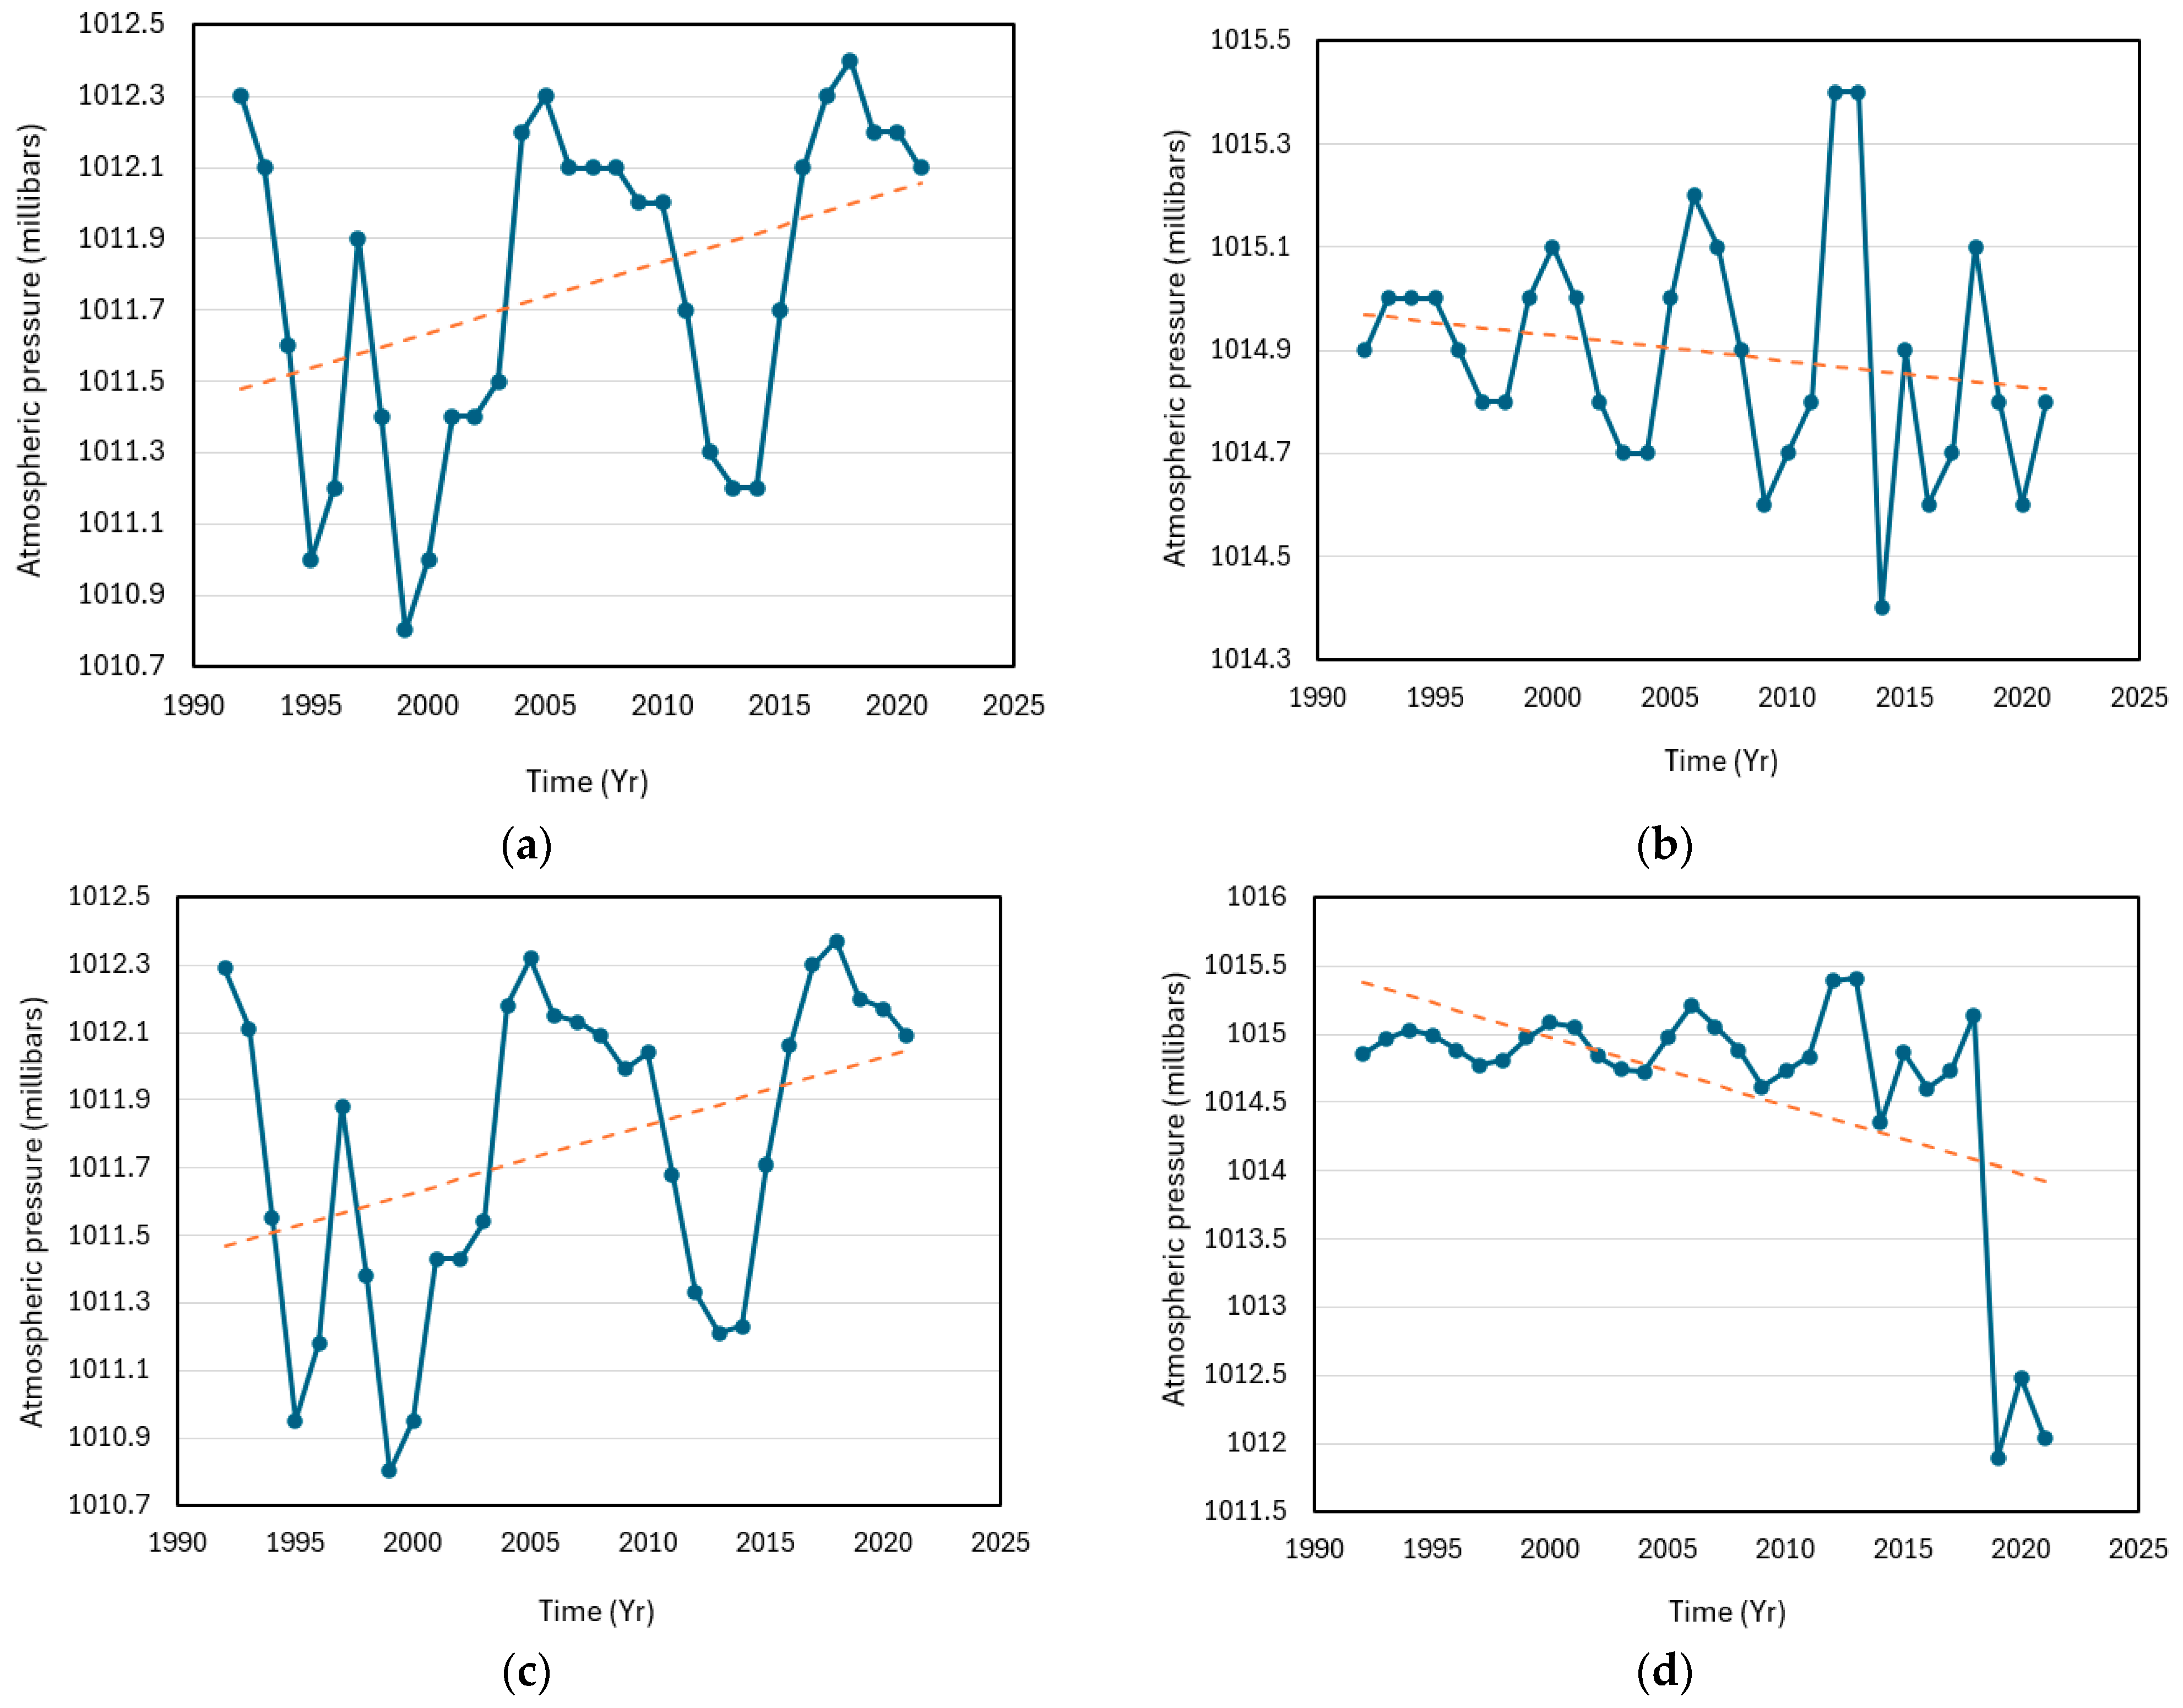
3.6. Analysis of Atmospheric Pressure
3.7. Analysis of Maximum Temperature
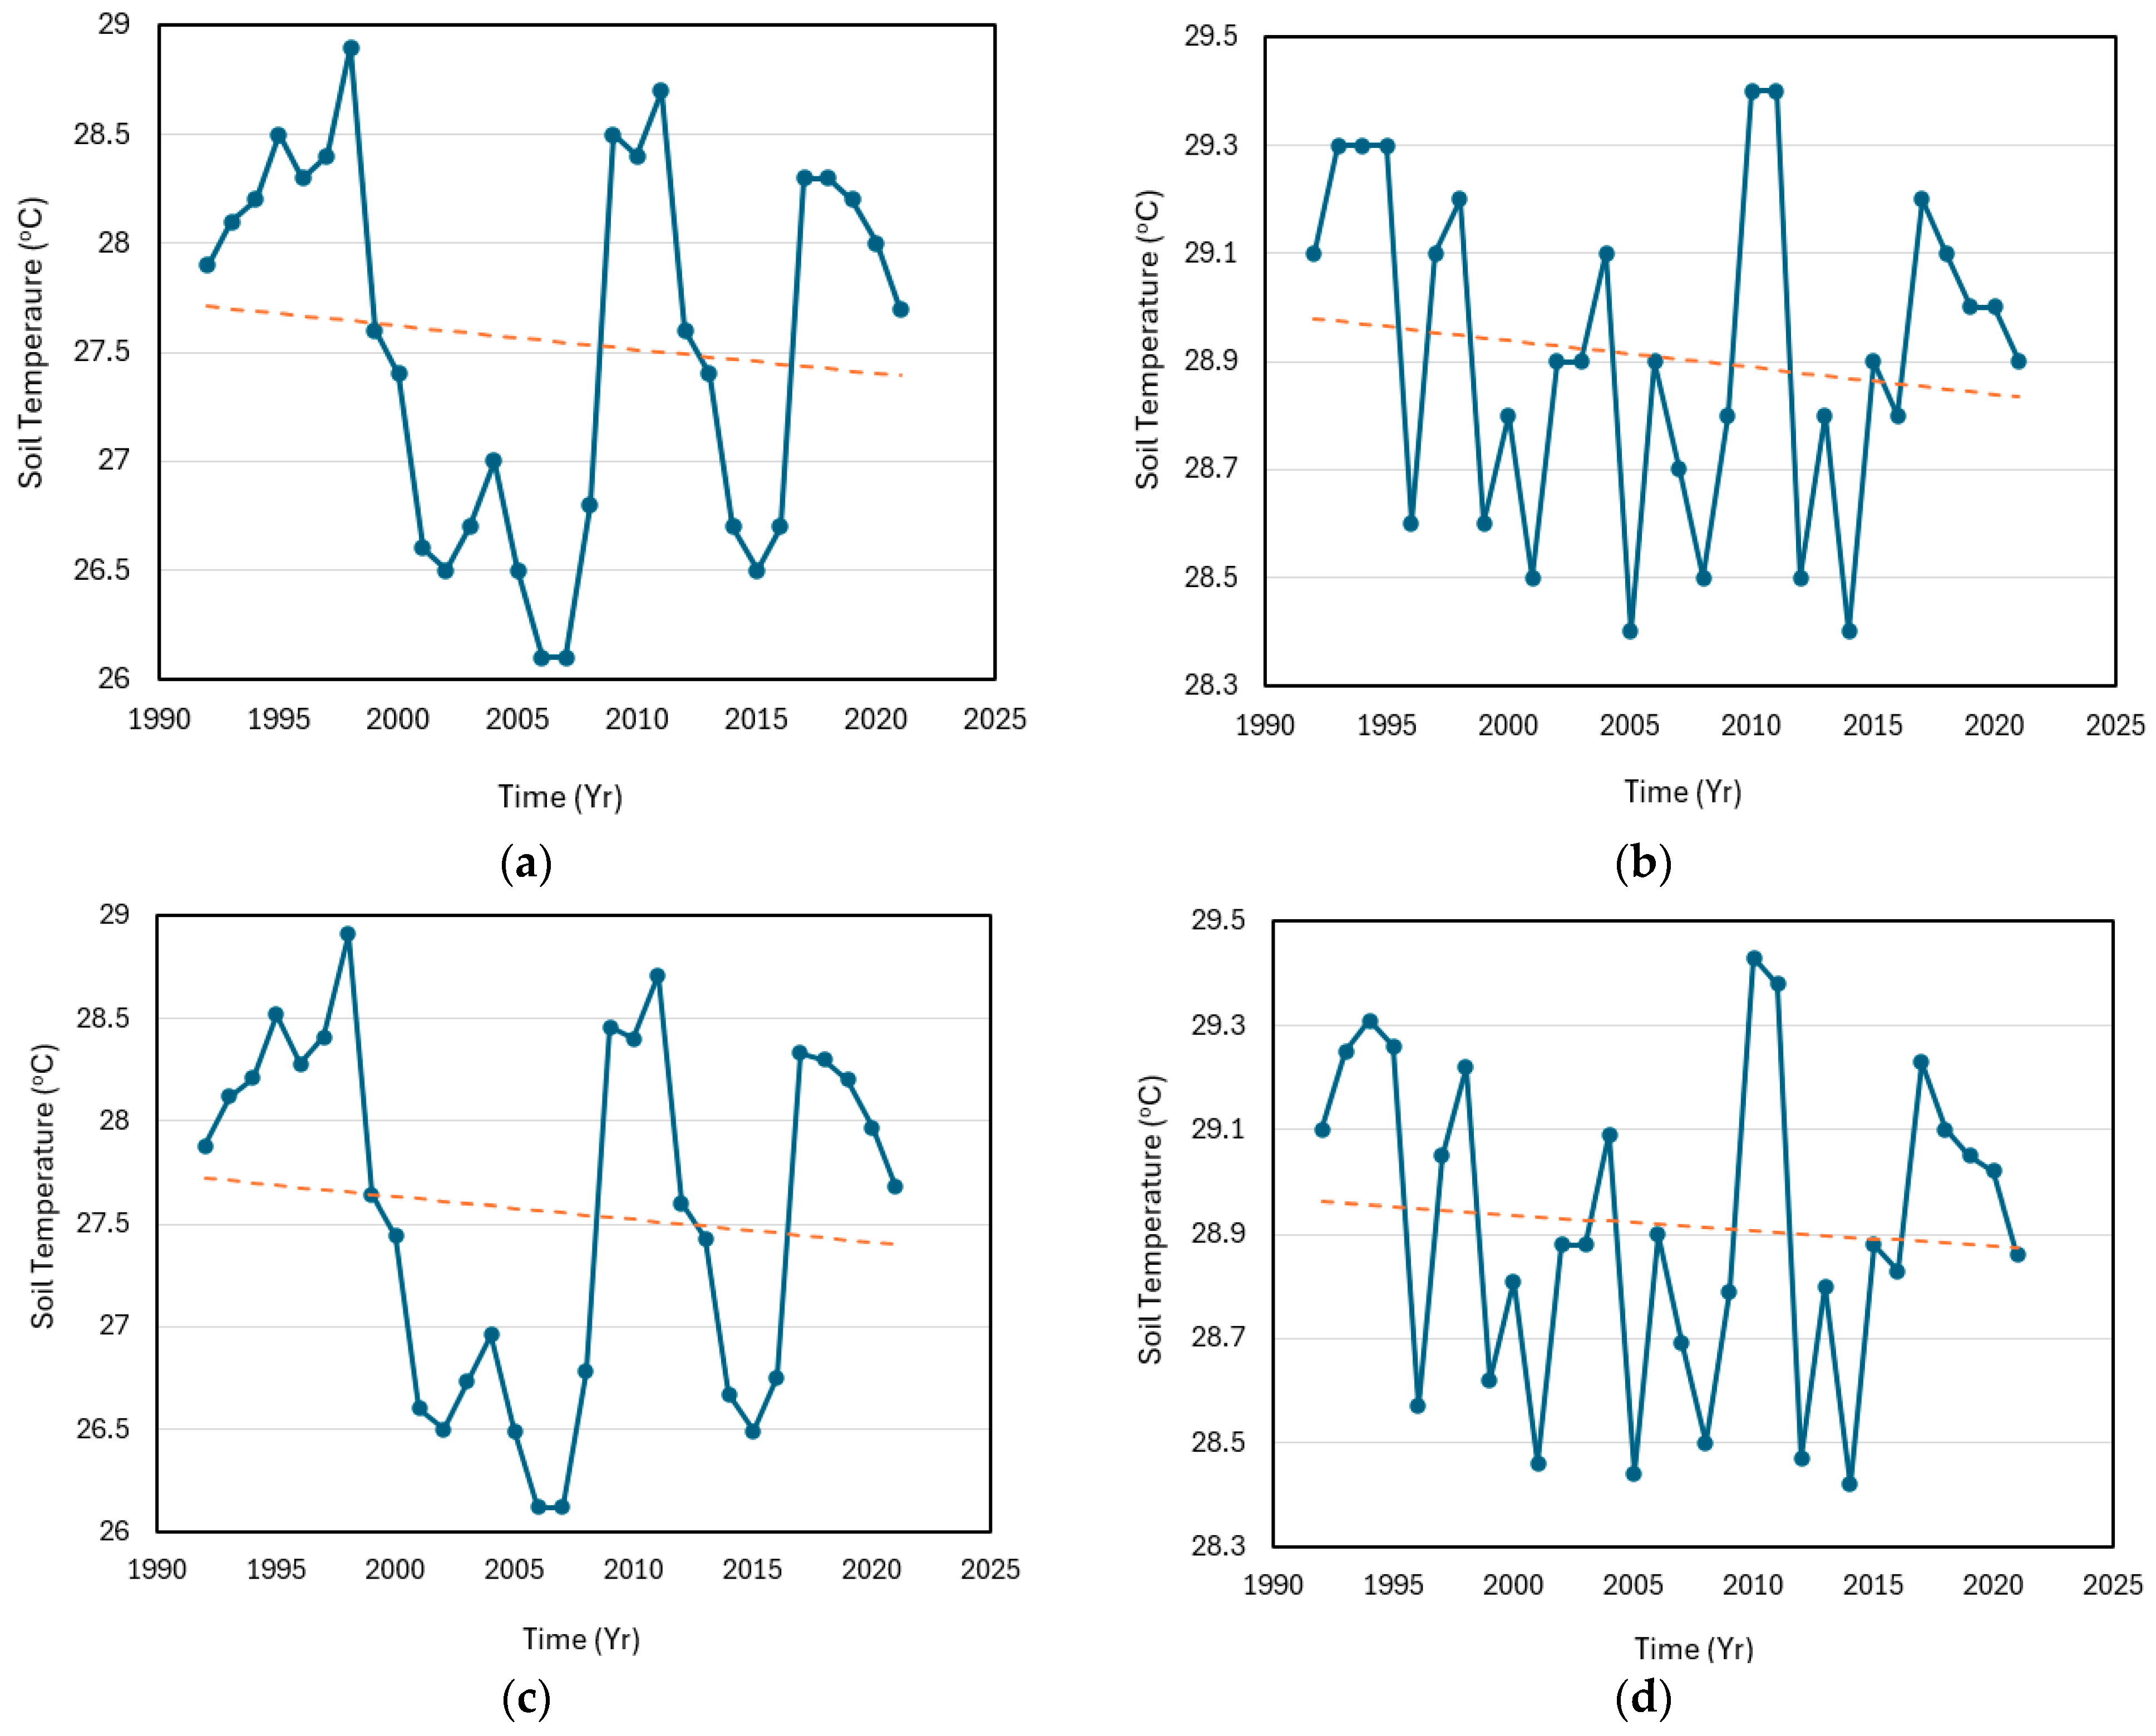
3.8. Analysis of Soil Temperature
3.9. Analysis of Cloud Cover
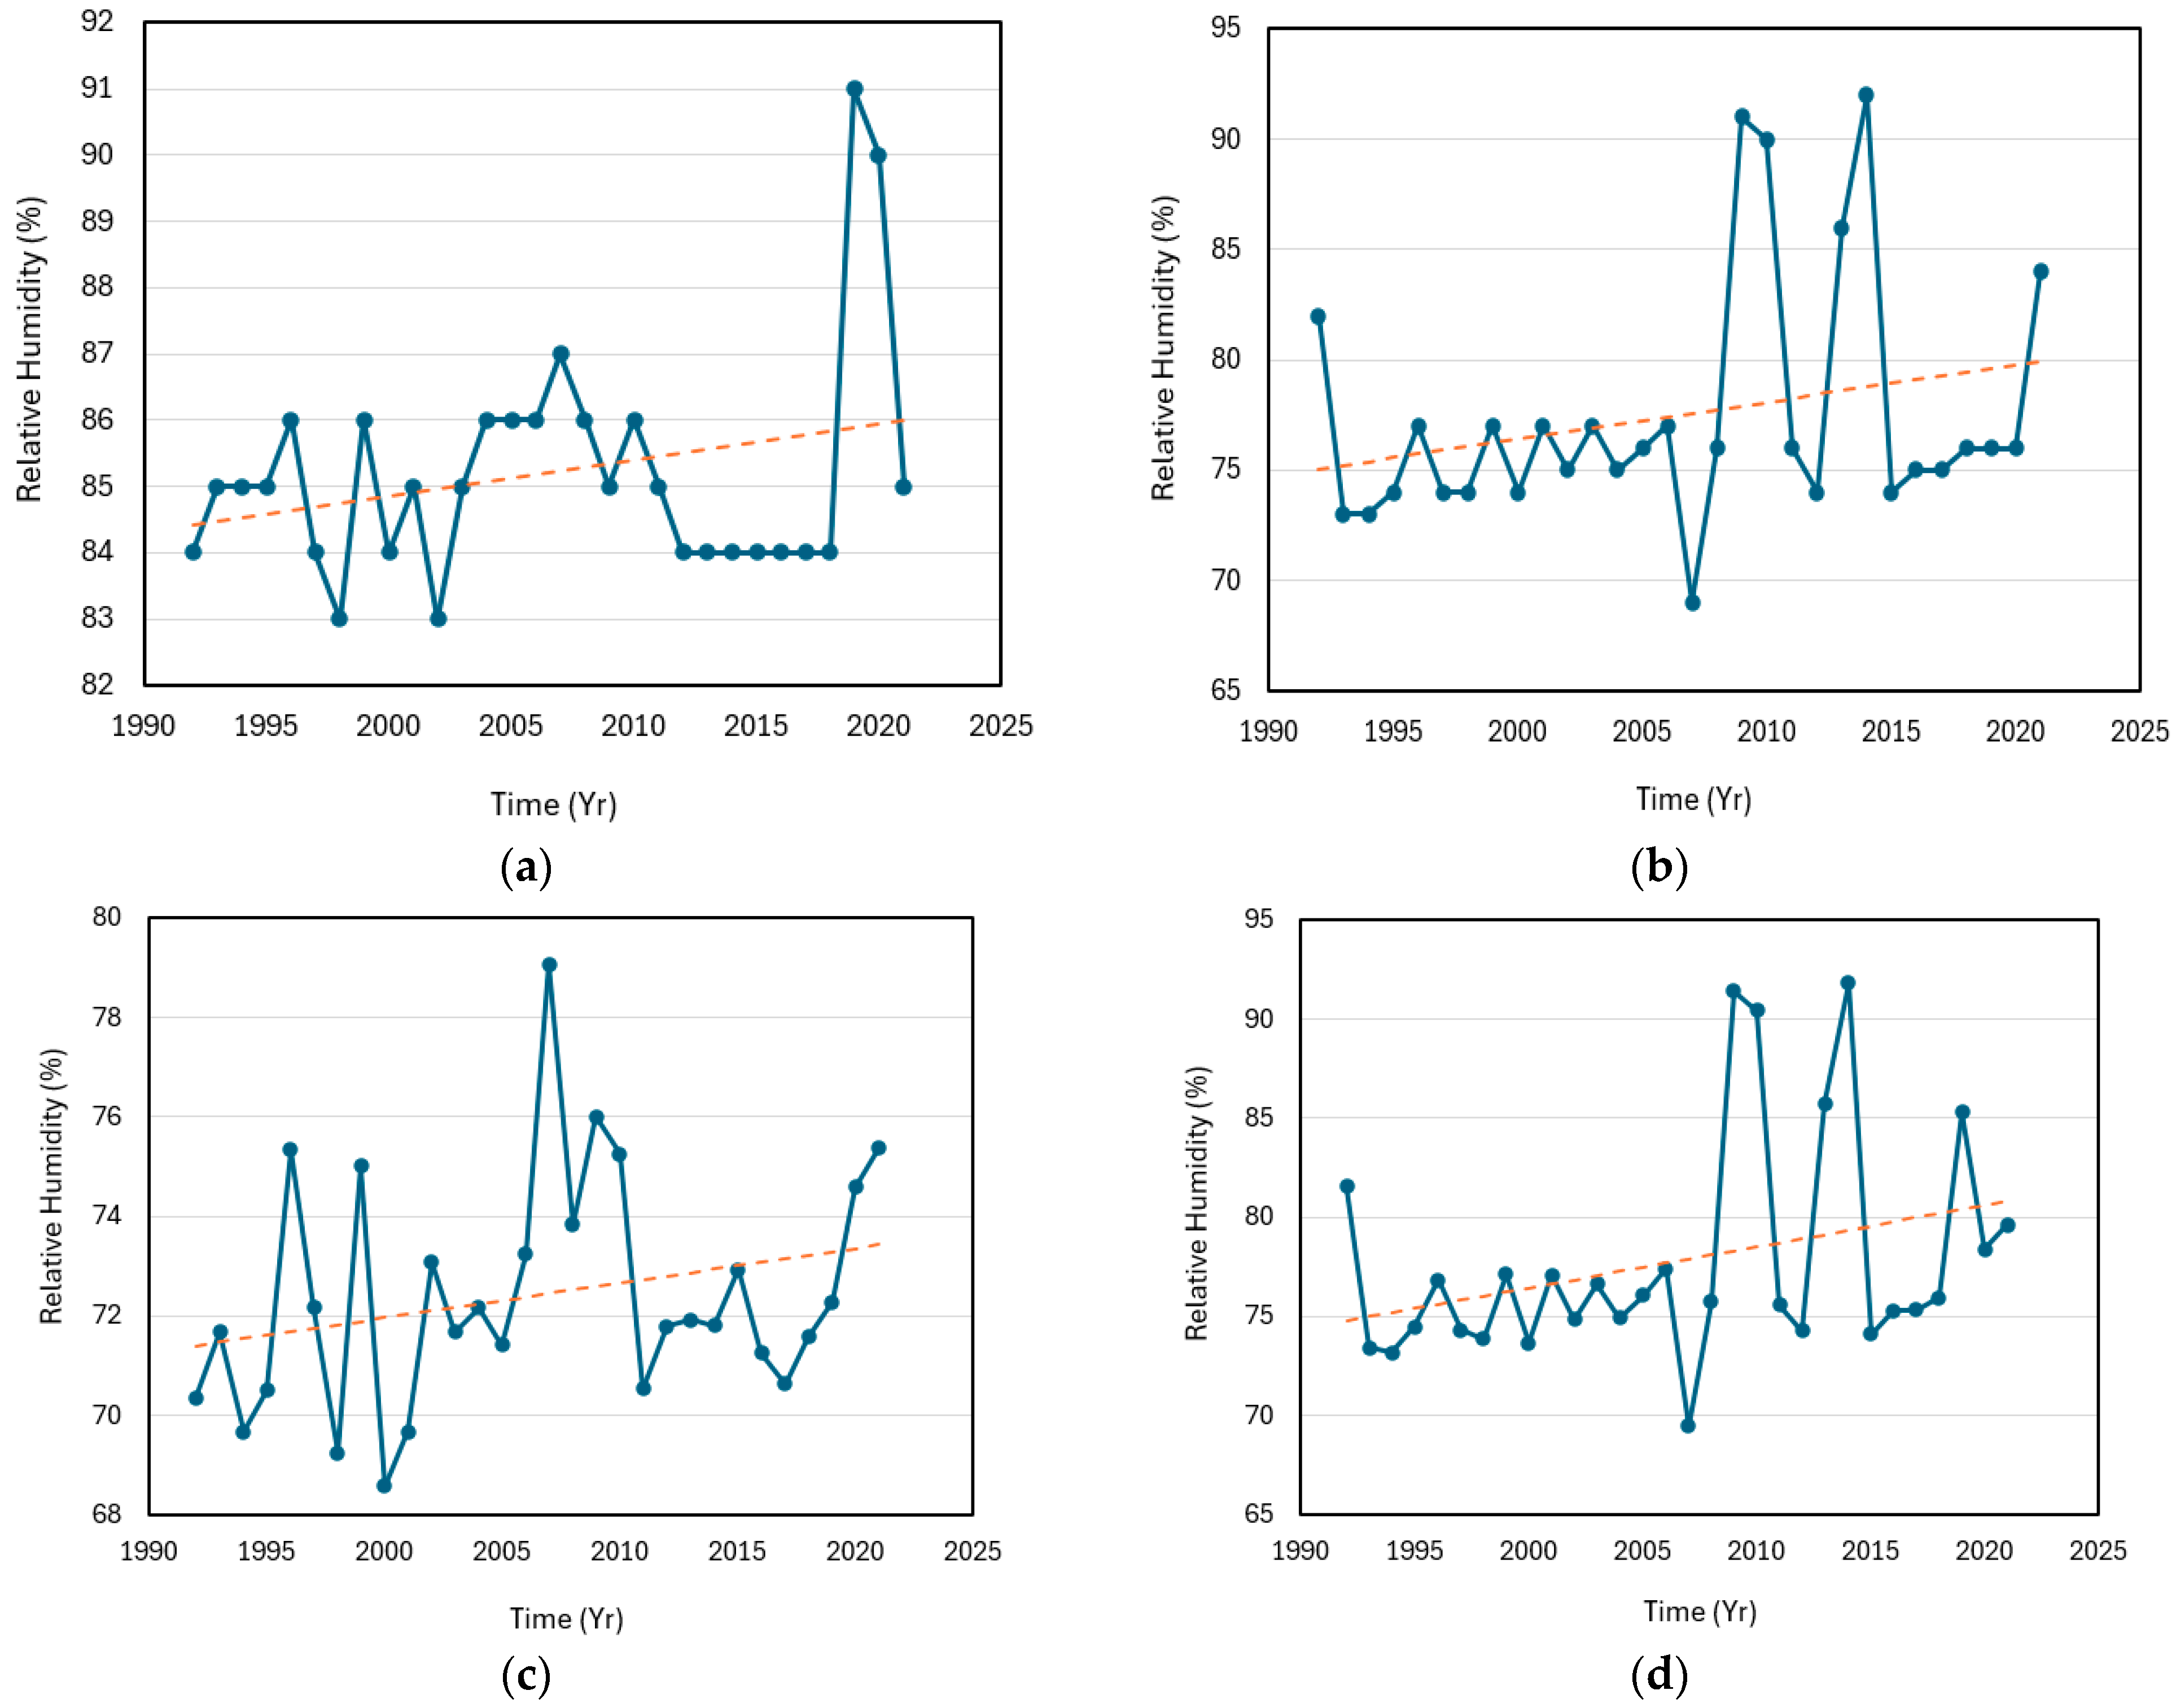
3.10. Analysis of Relative Humidity
3.11. The Influence of Autocorrelation
4. Further Analyses and Discussion
4.1. El Nino Southern Oscillation (ENSO) Analysis
- —El Nino–Southern Oscillation (ENSO) index;
- —Monthly sea level pressure in Tahiti;
- —Monthly sea level pressure in Darwin;
- —Mean monthly sea level pressure in Tahiti;
- —Mean monthly sea level pressure in Darwin;
- —Standard deviation of monthly sea level pressure in Tahiti;
- —Standard deviation of monthly sea level pressure in Darwin;
- —Standard deviation of standardized monthly sea level pressures;
- —Standardized monthly sea level pressure in Tahiti;
- —Standardized monthly sea level pressure in Darwin; and
- —Number of months.
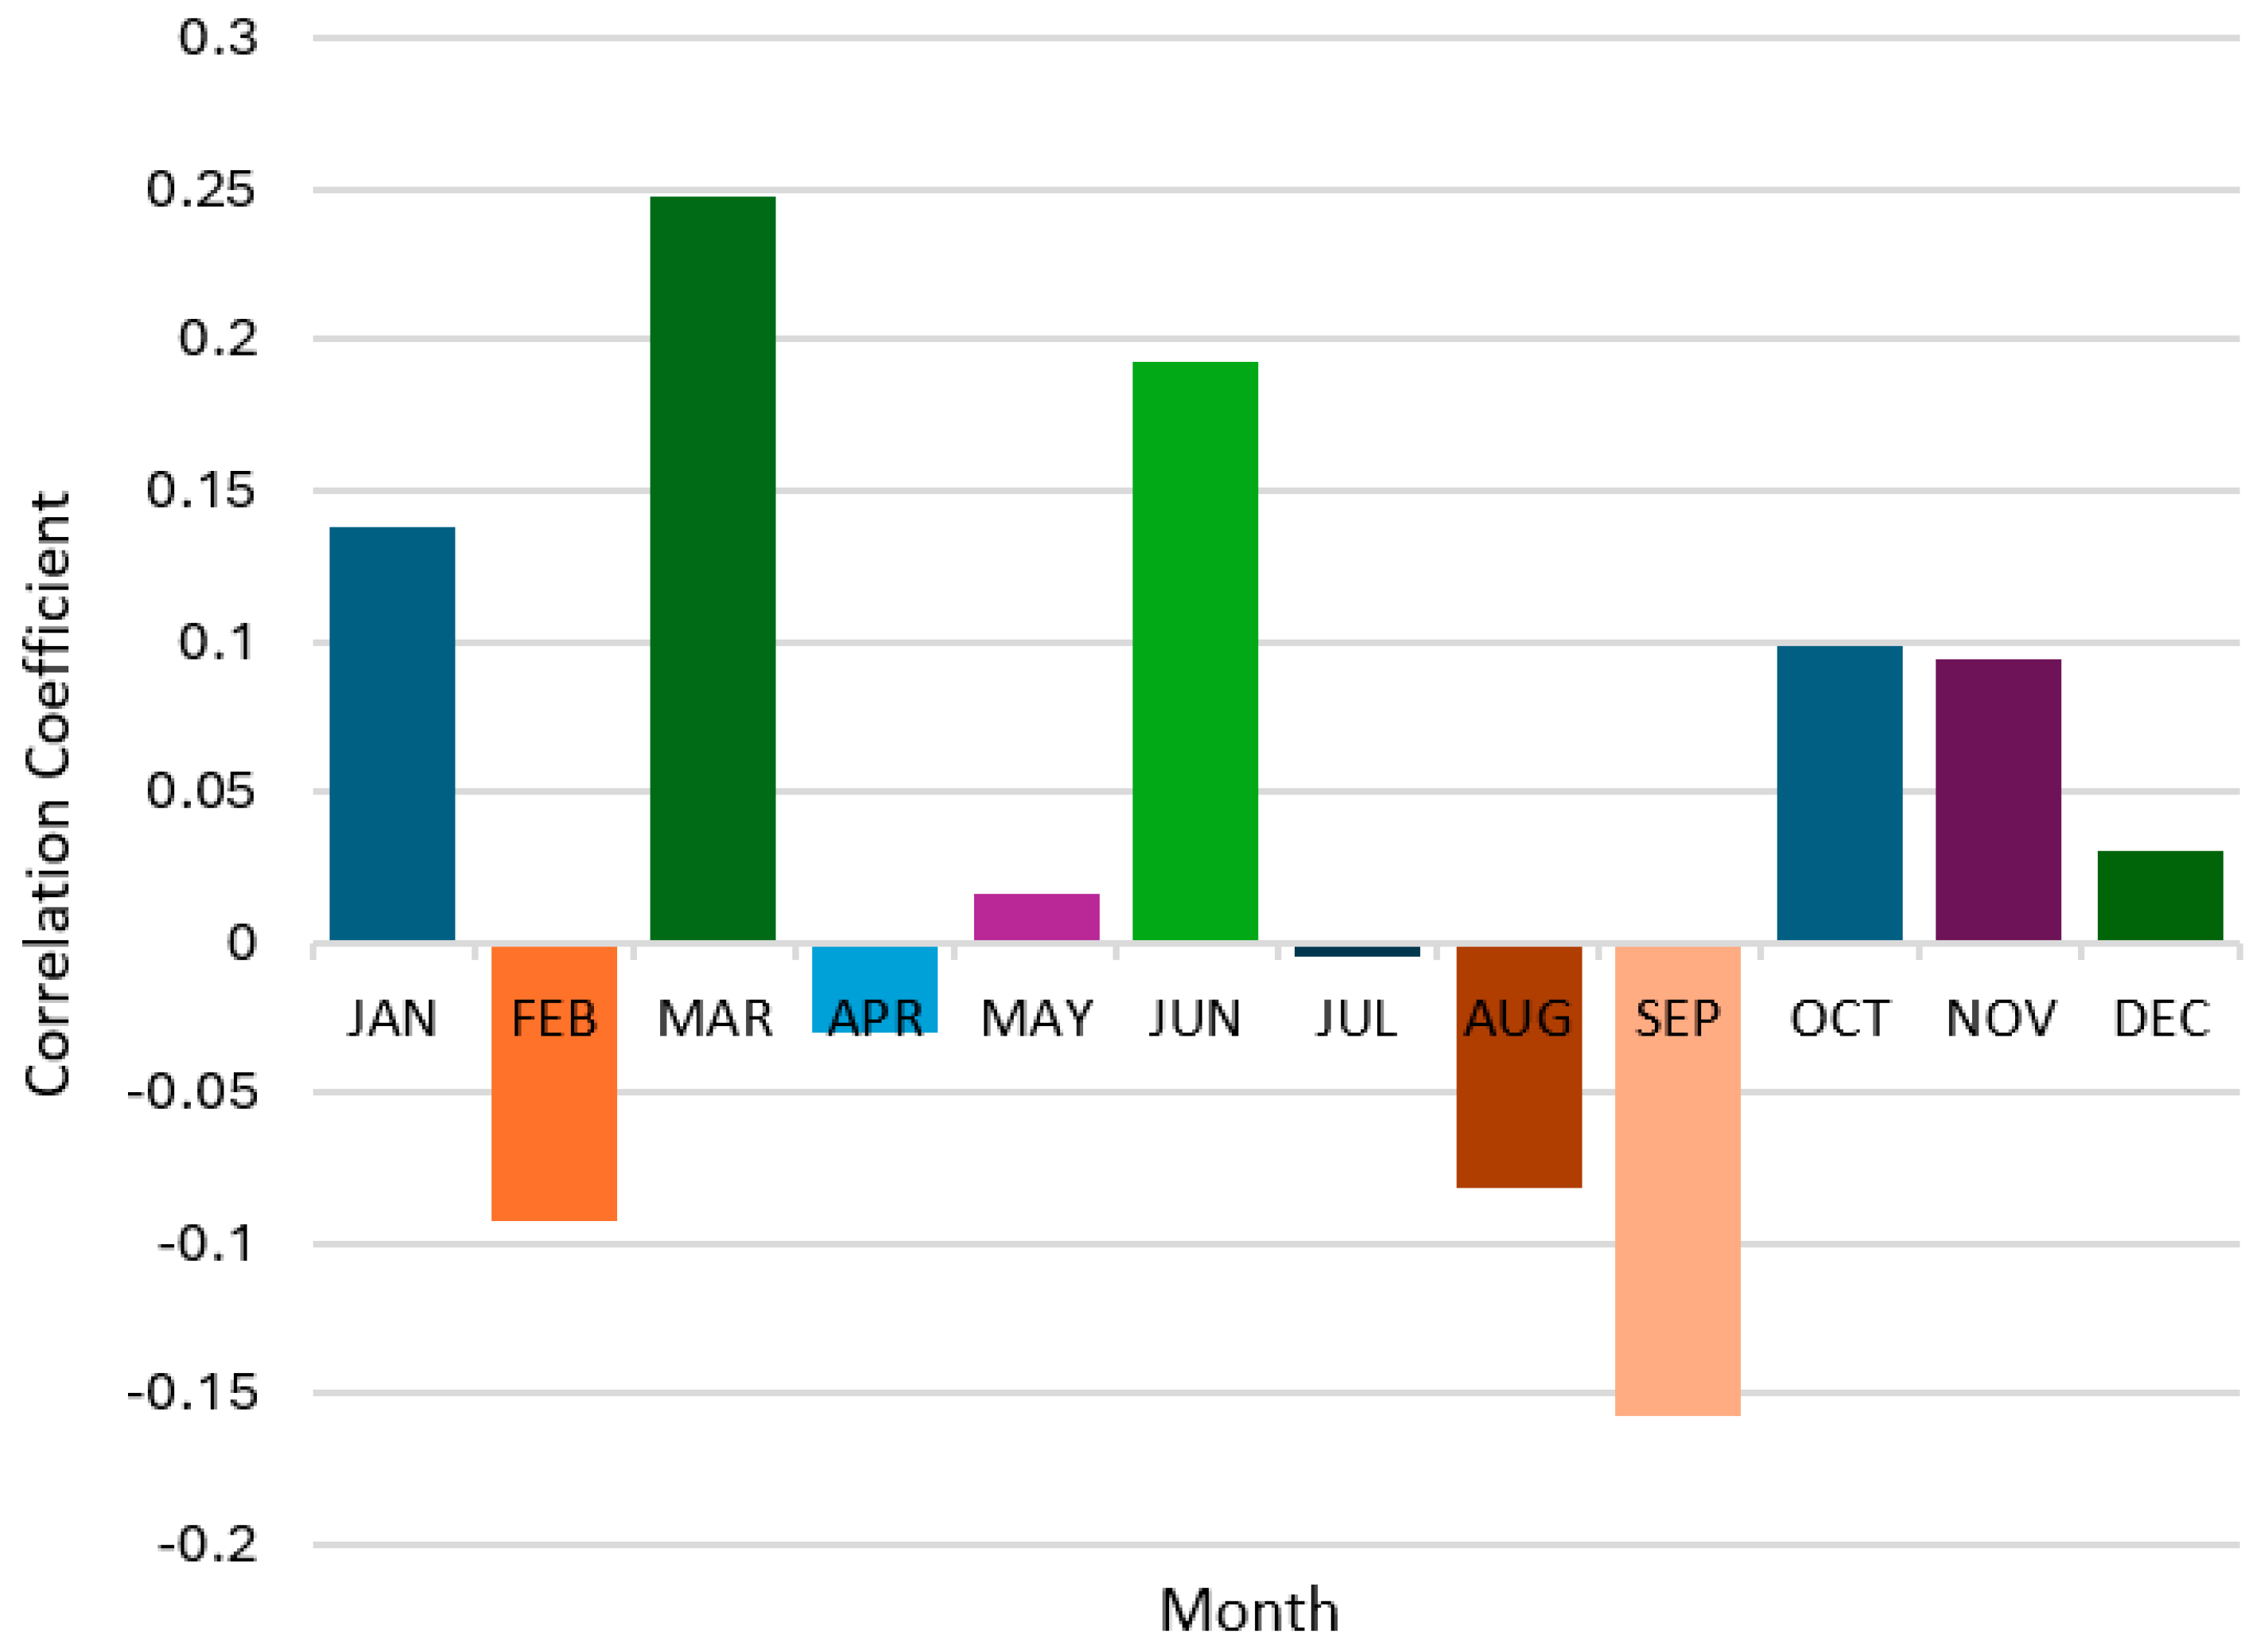
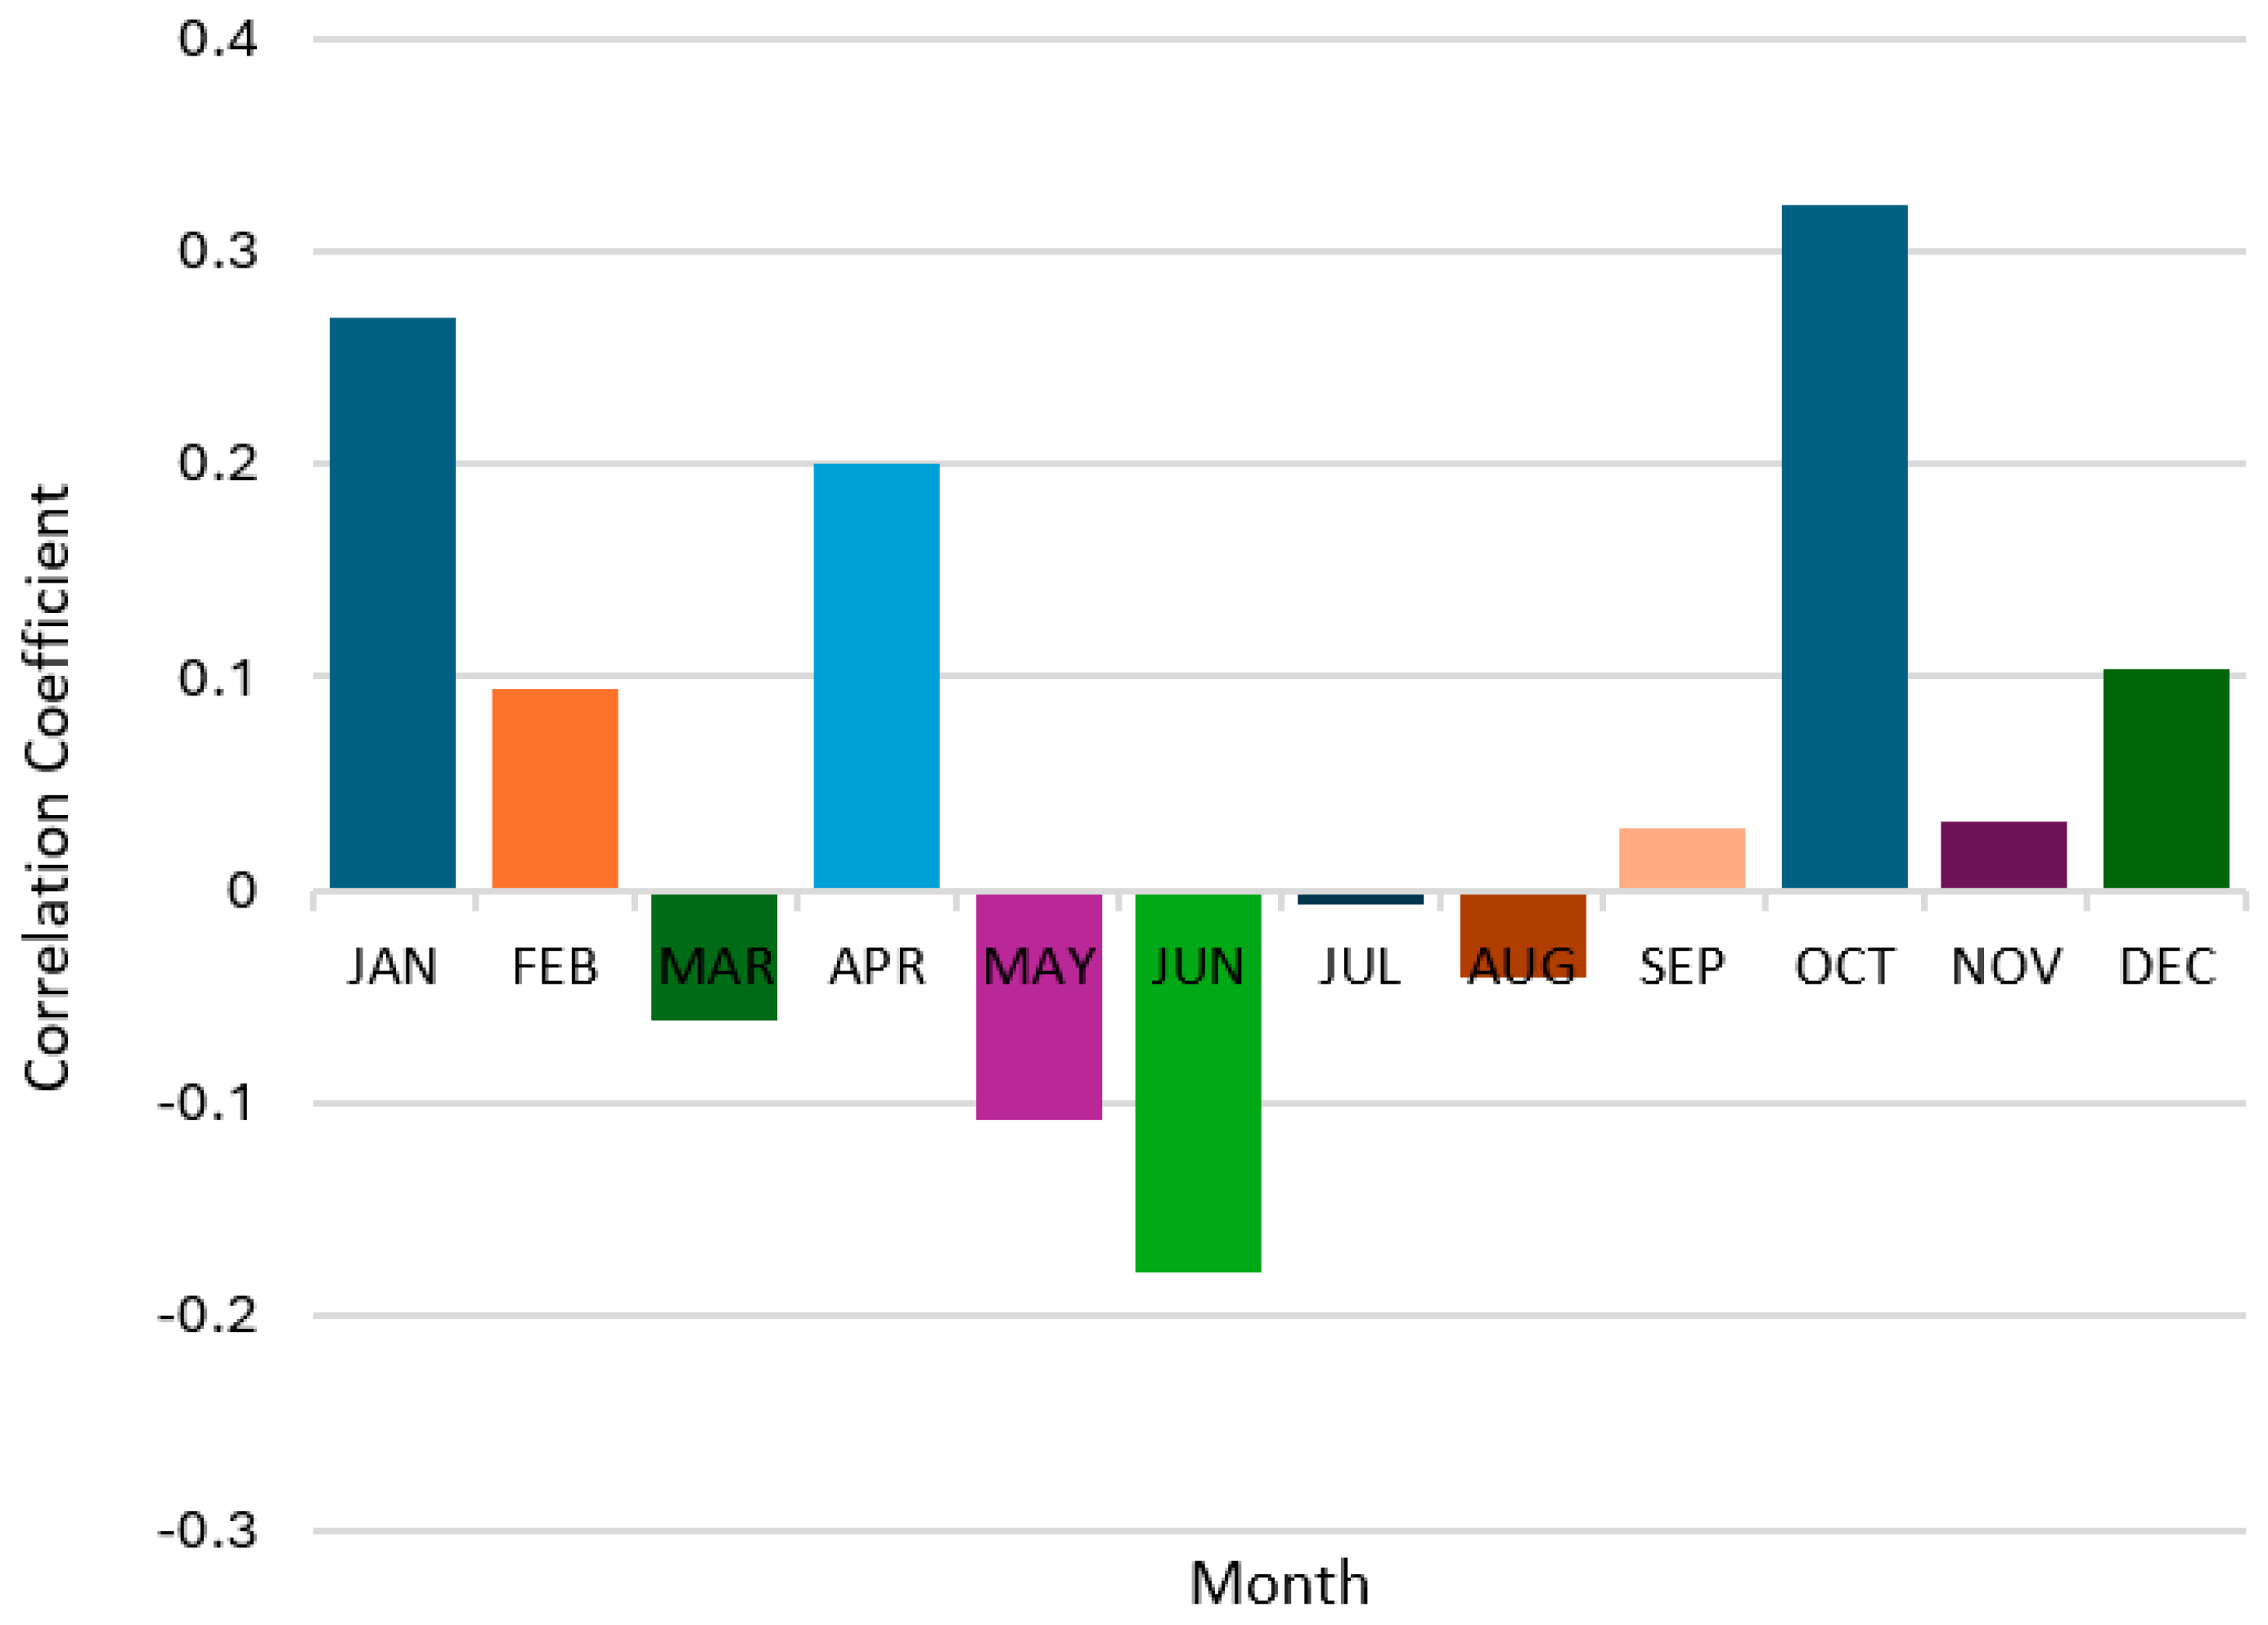
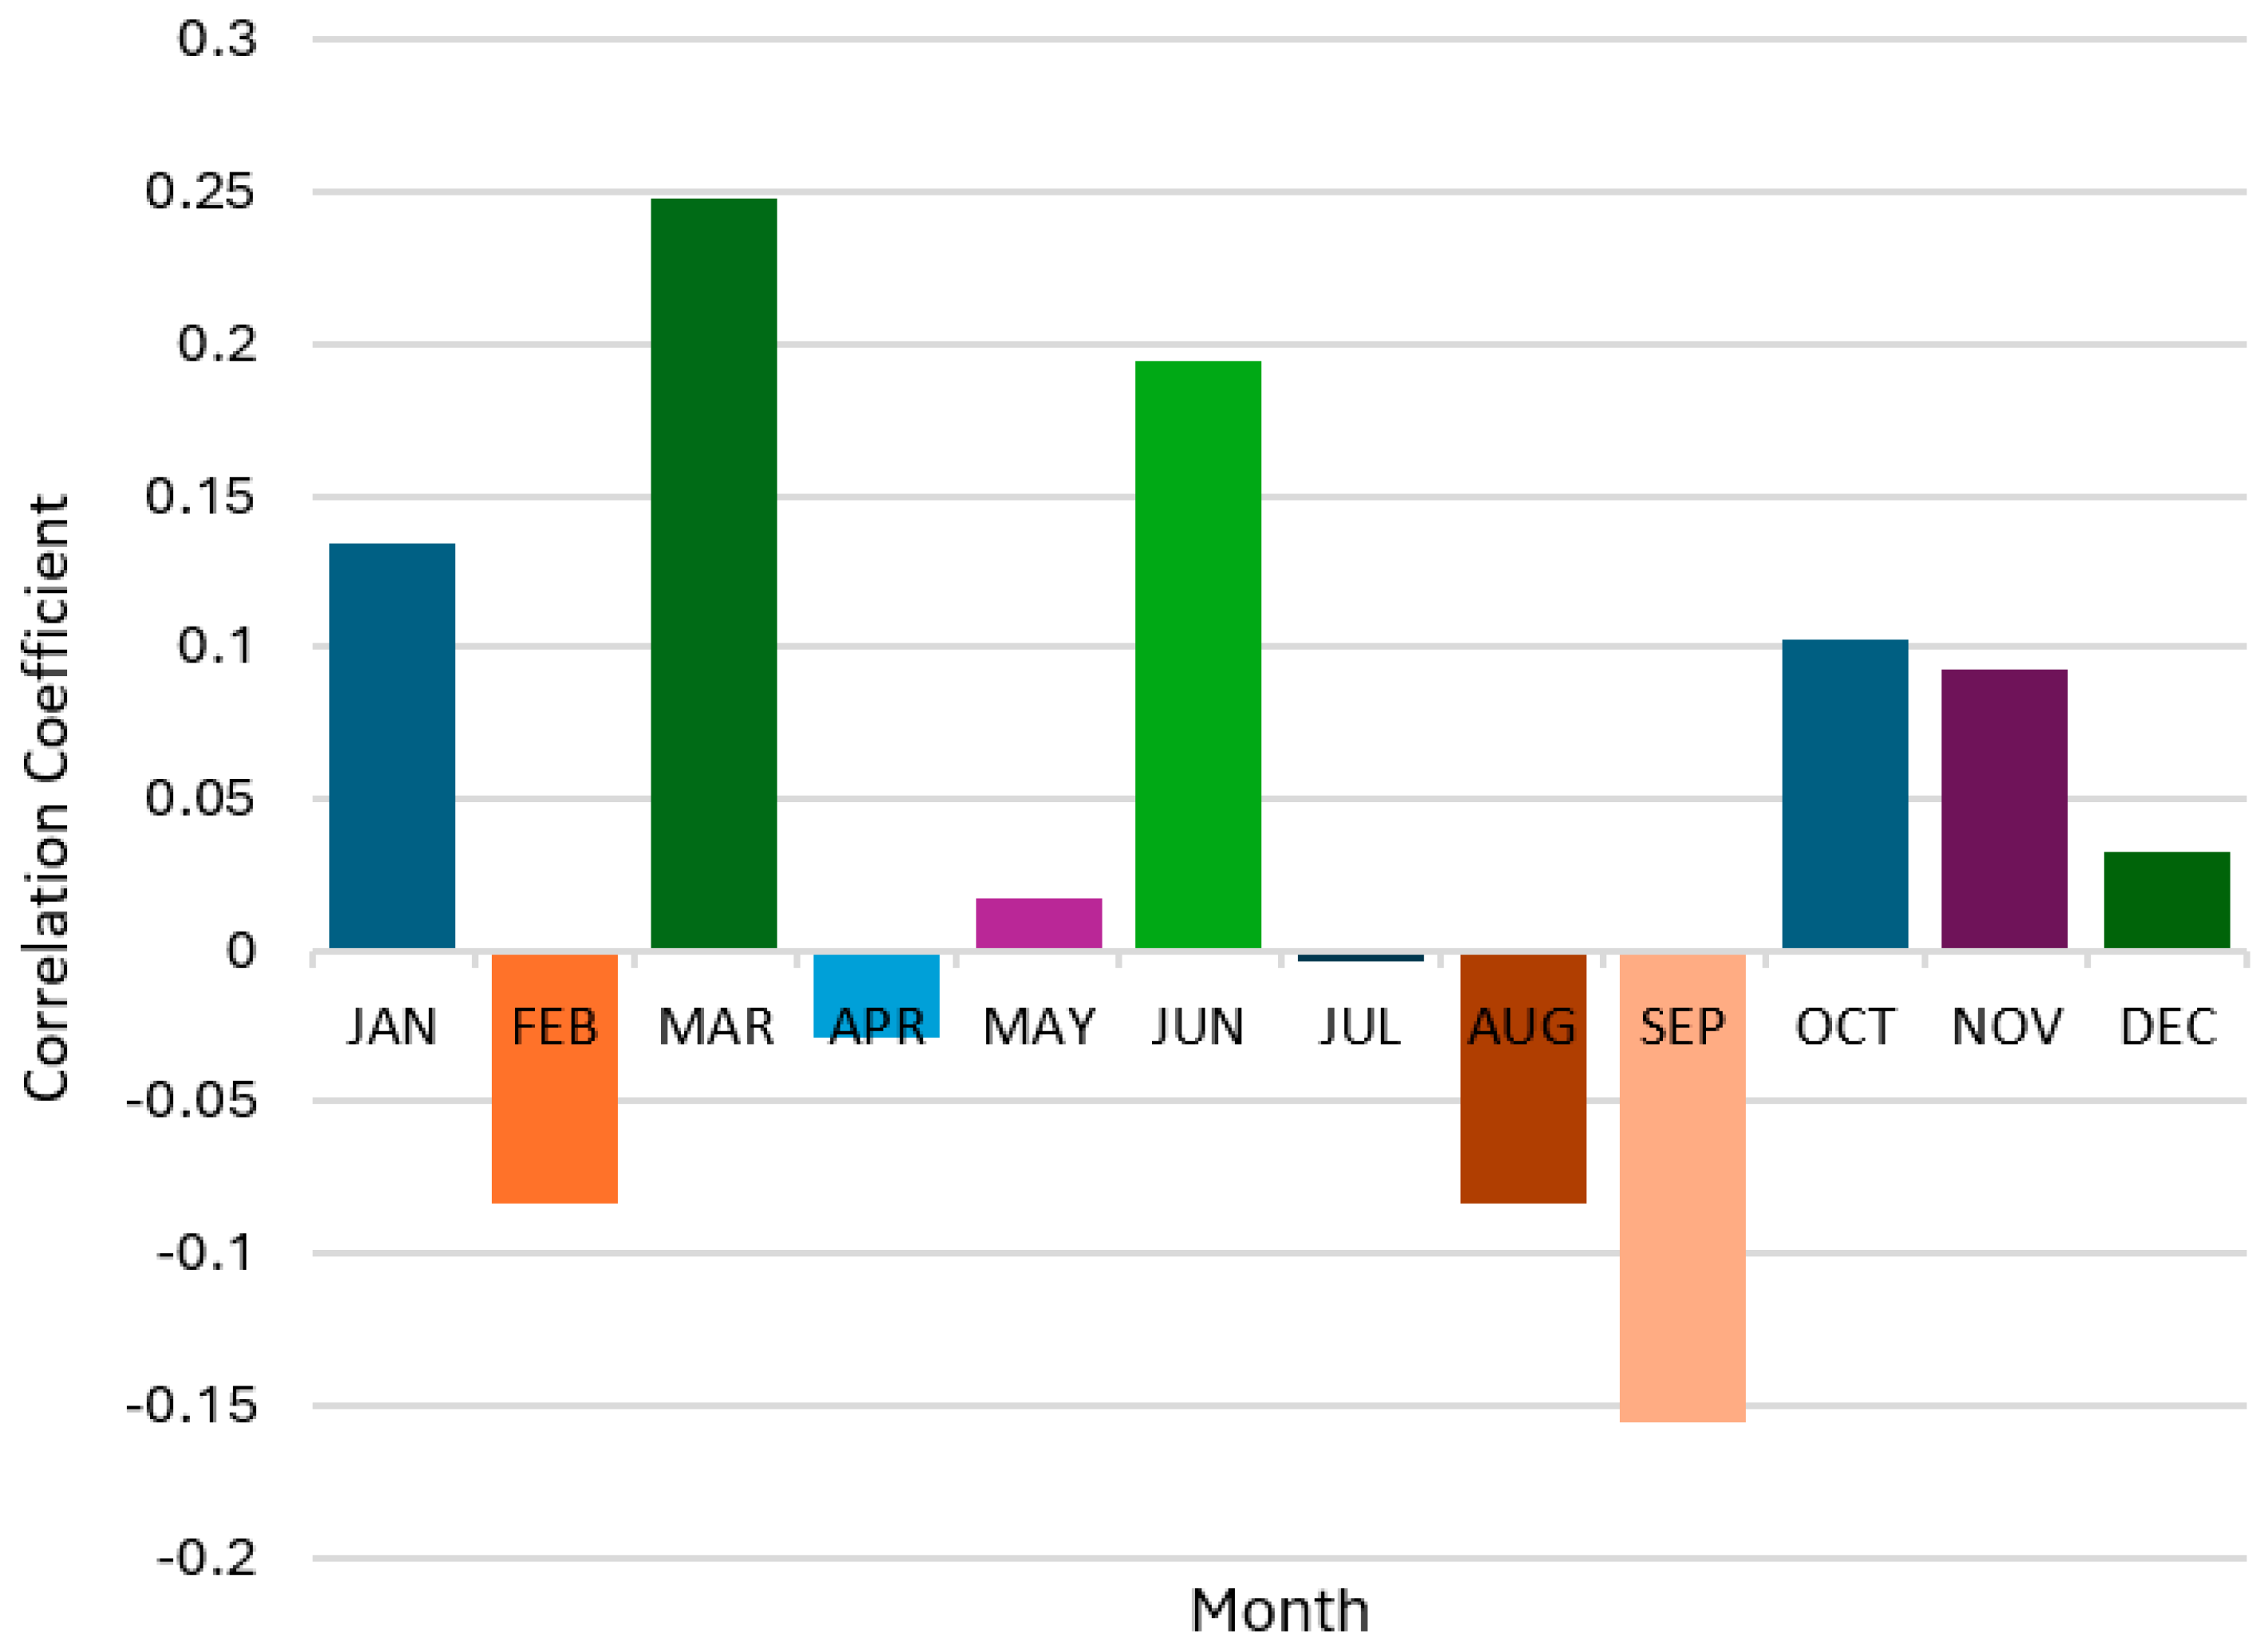
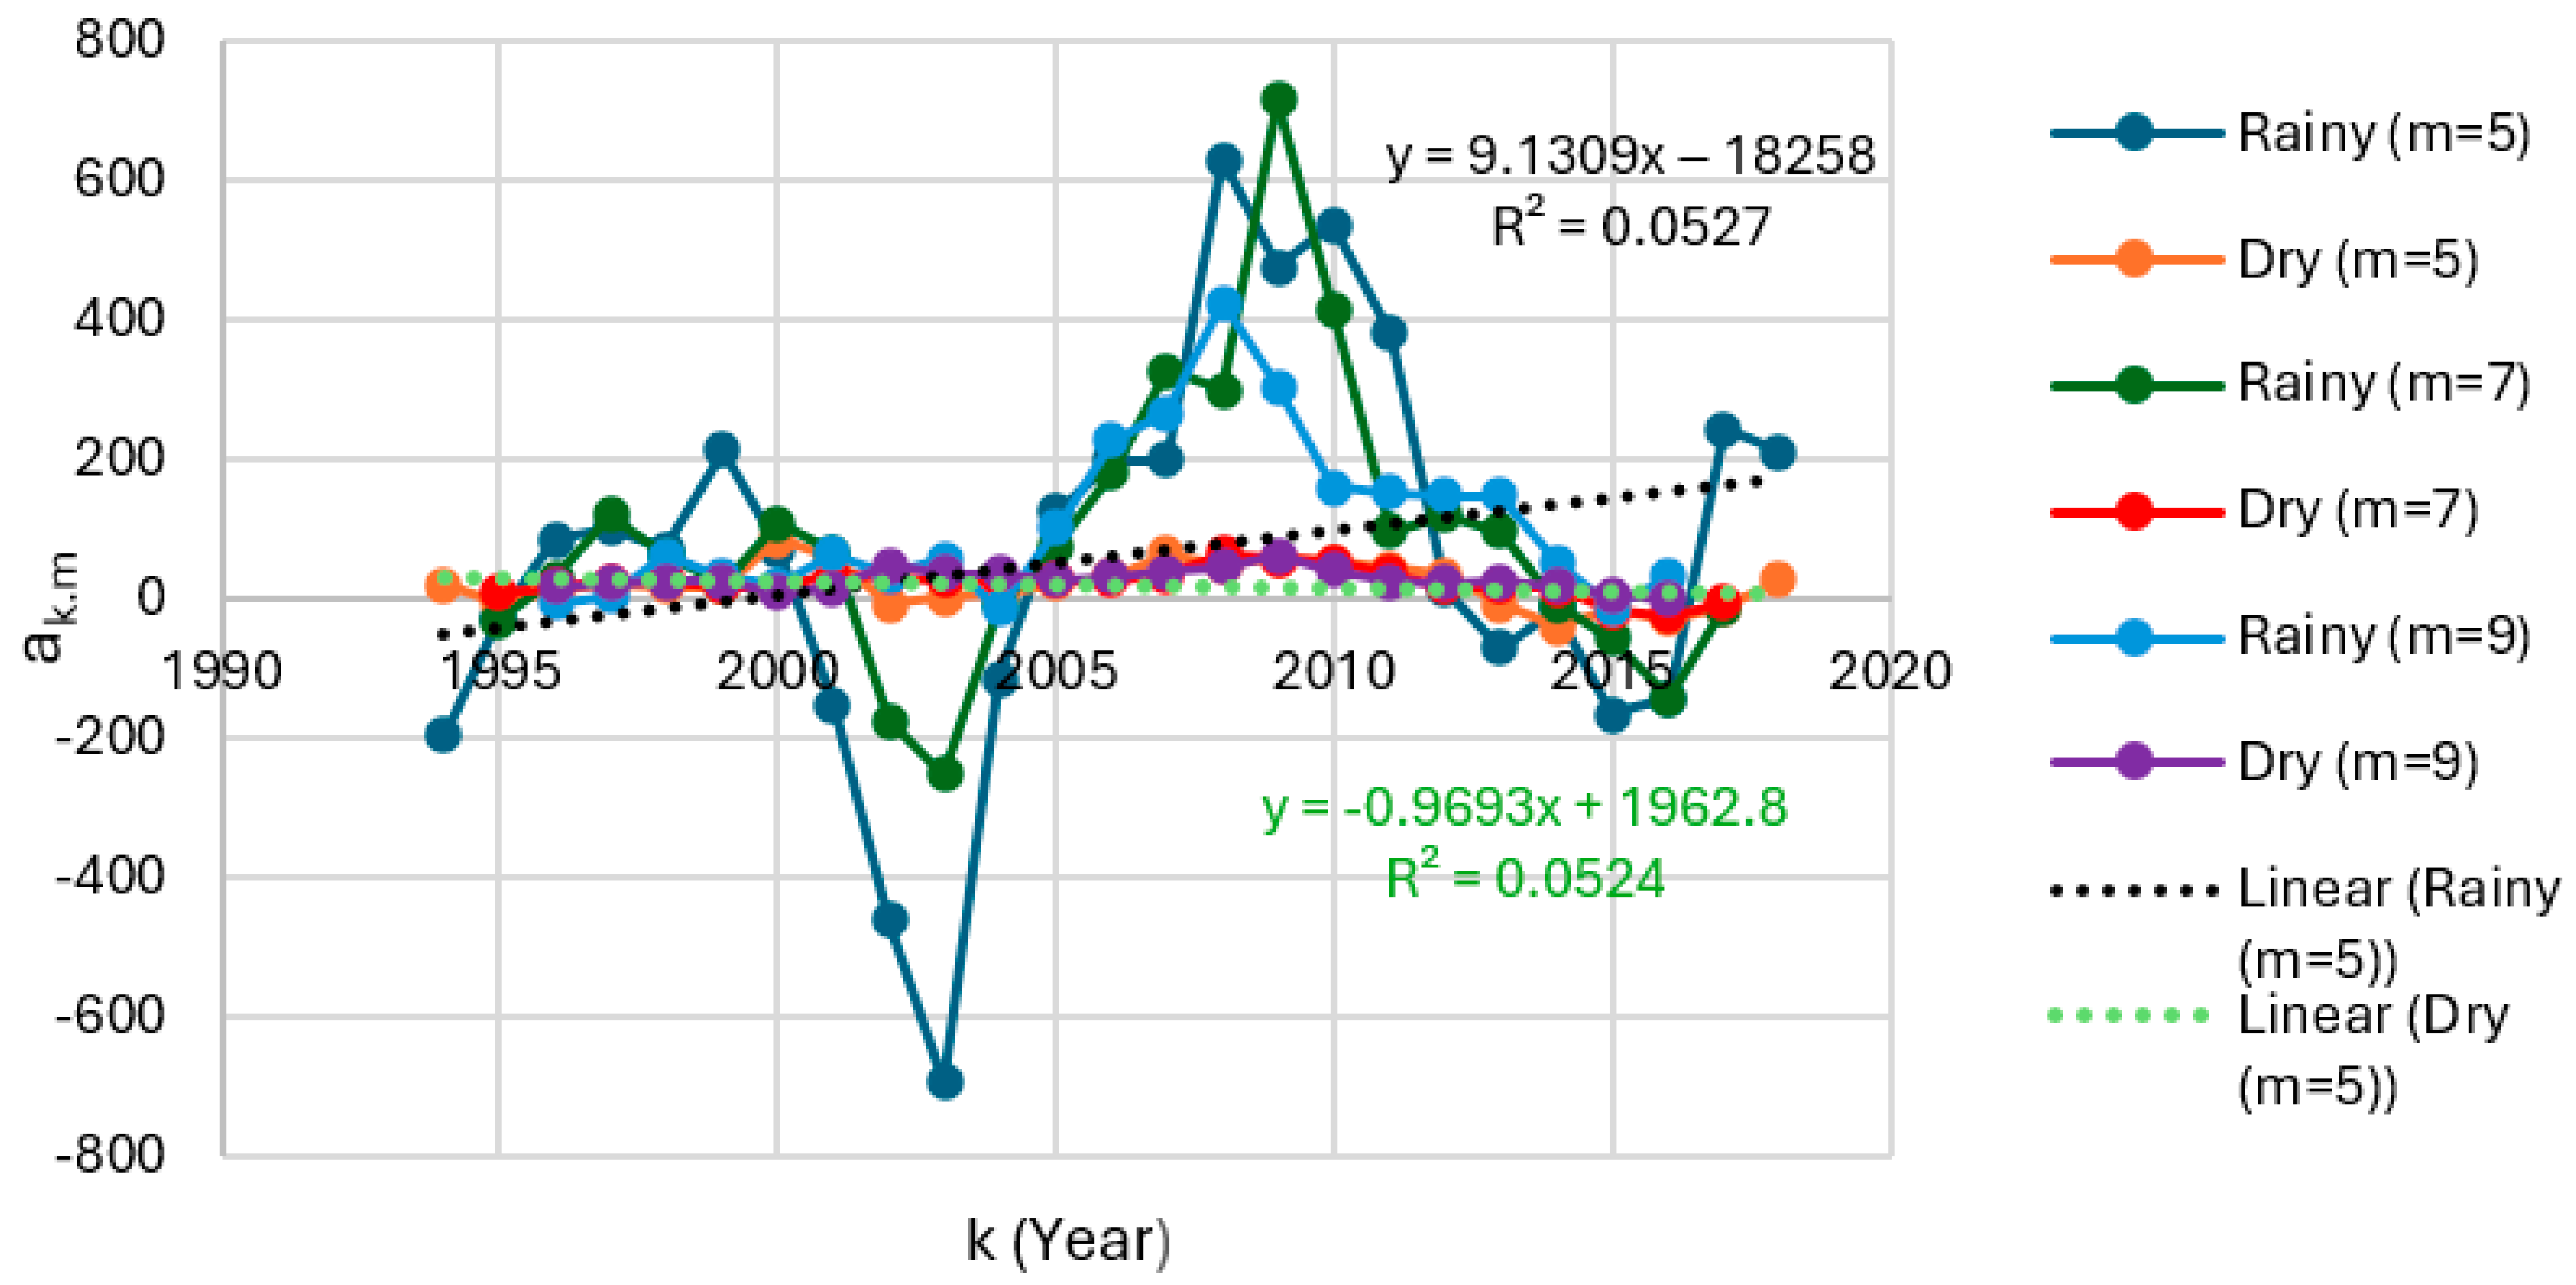
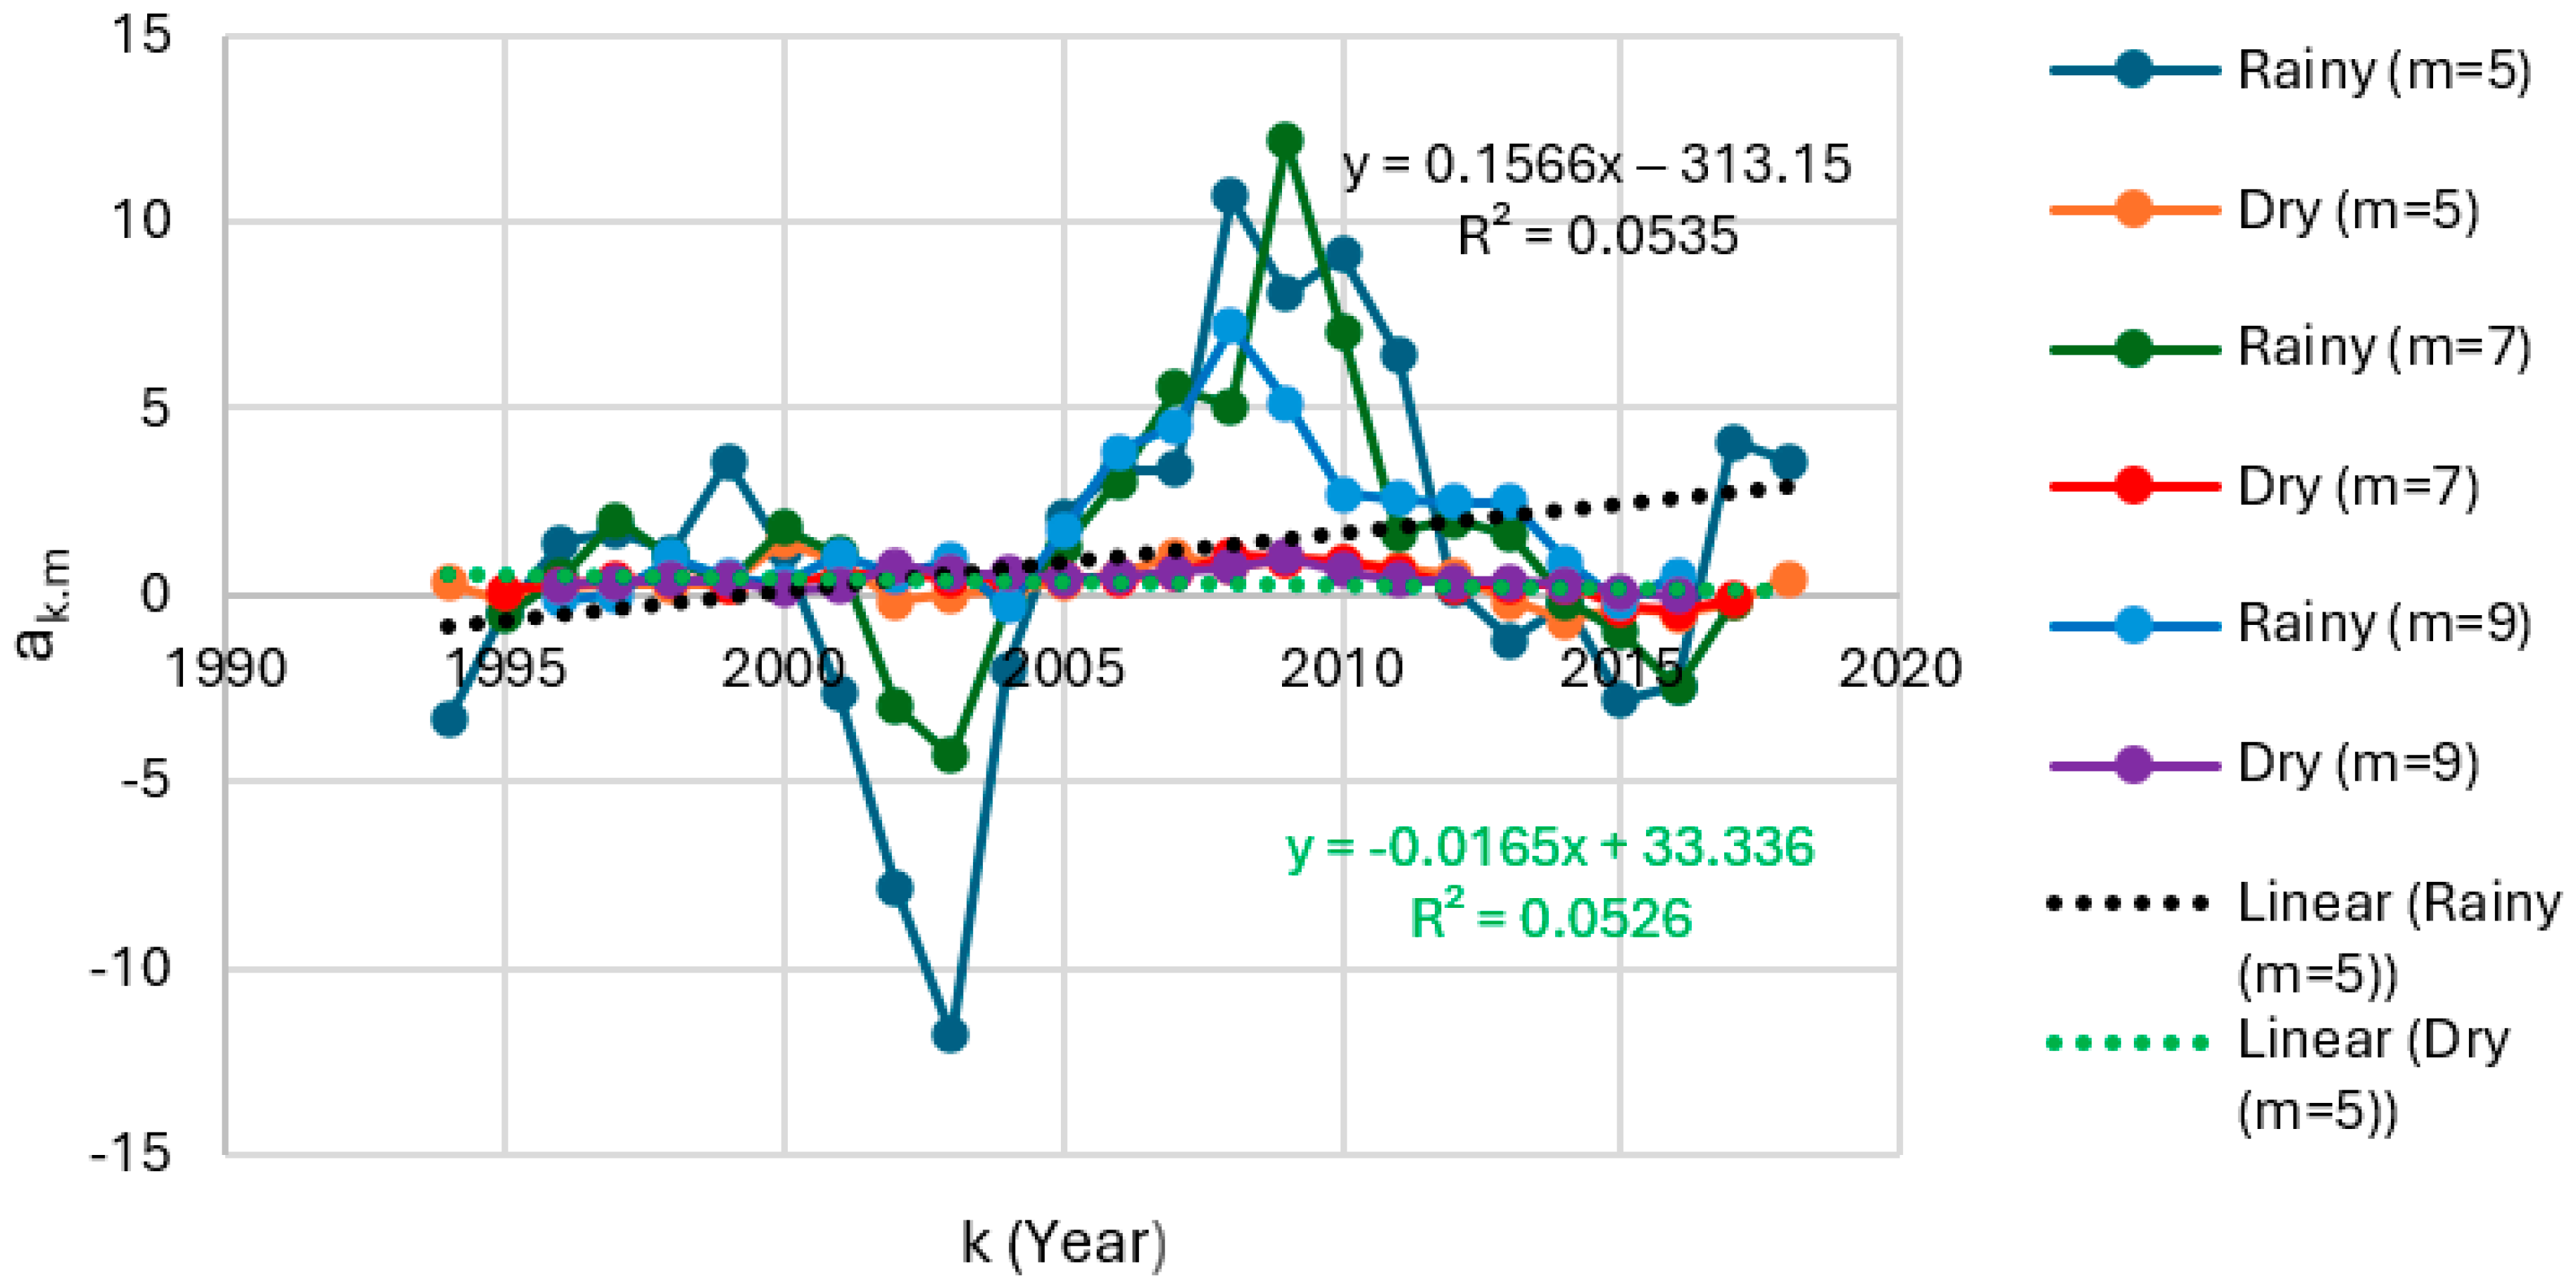
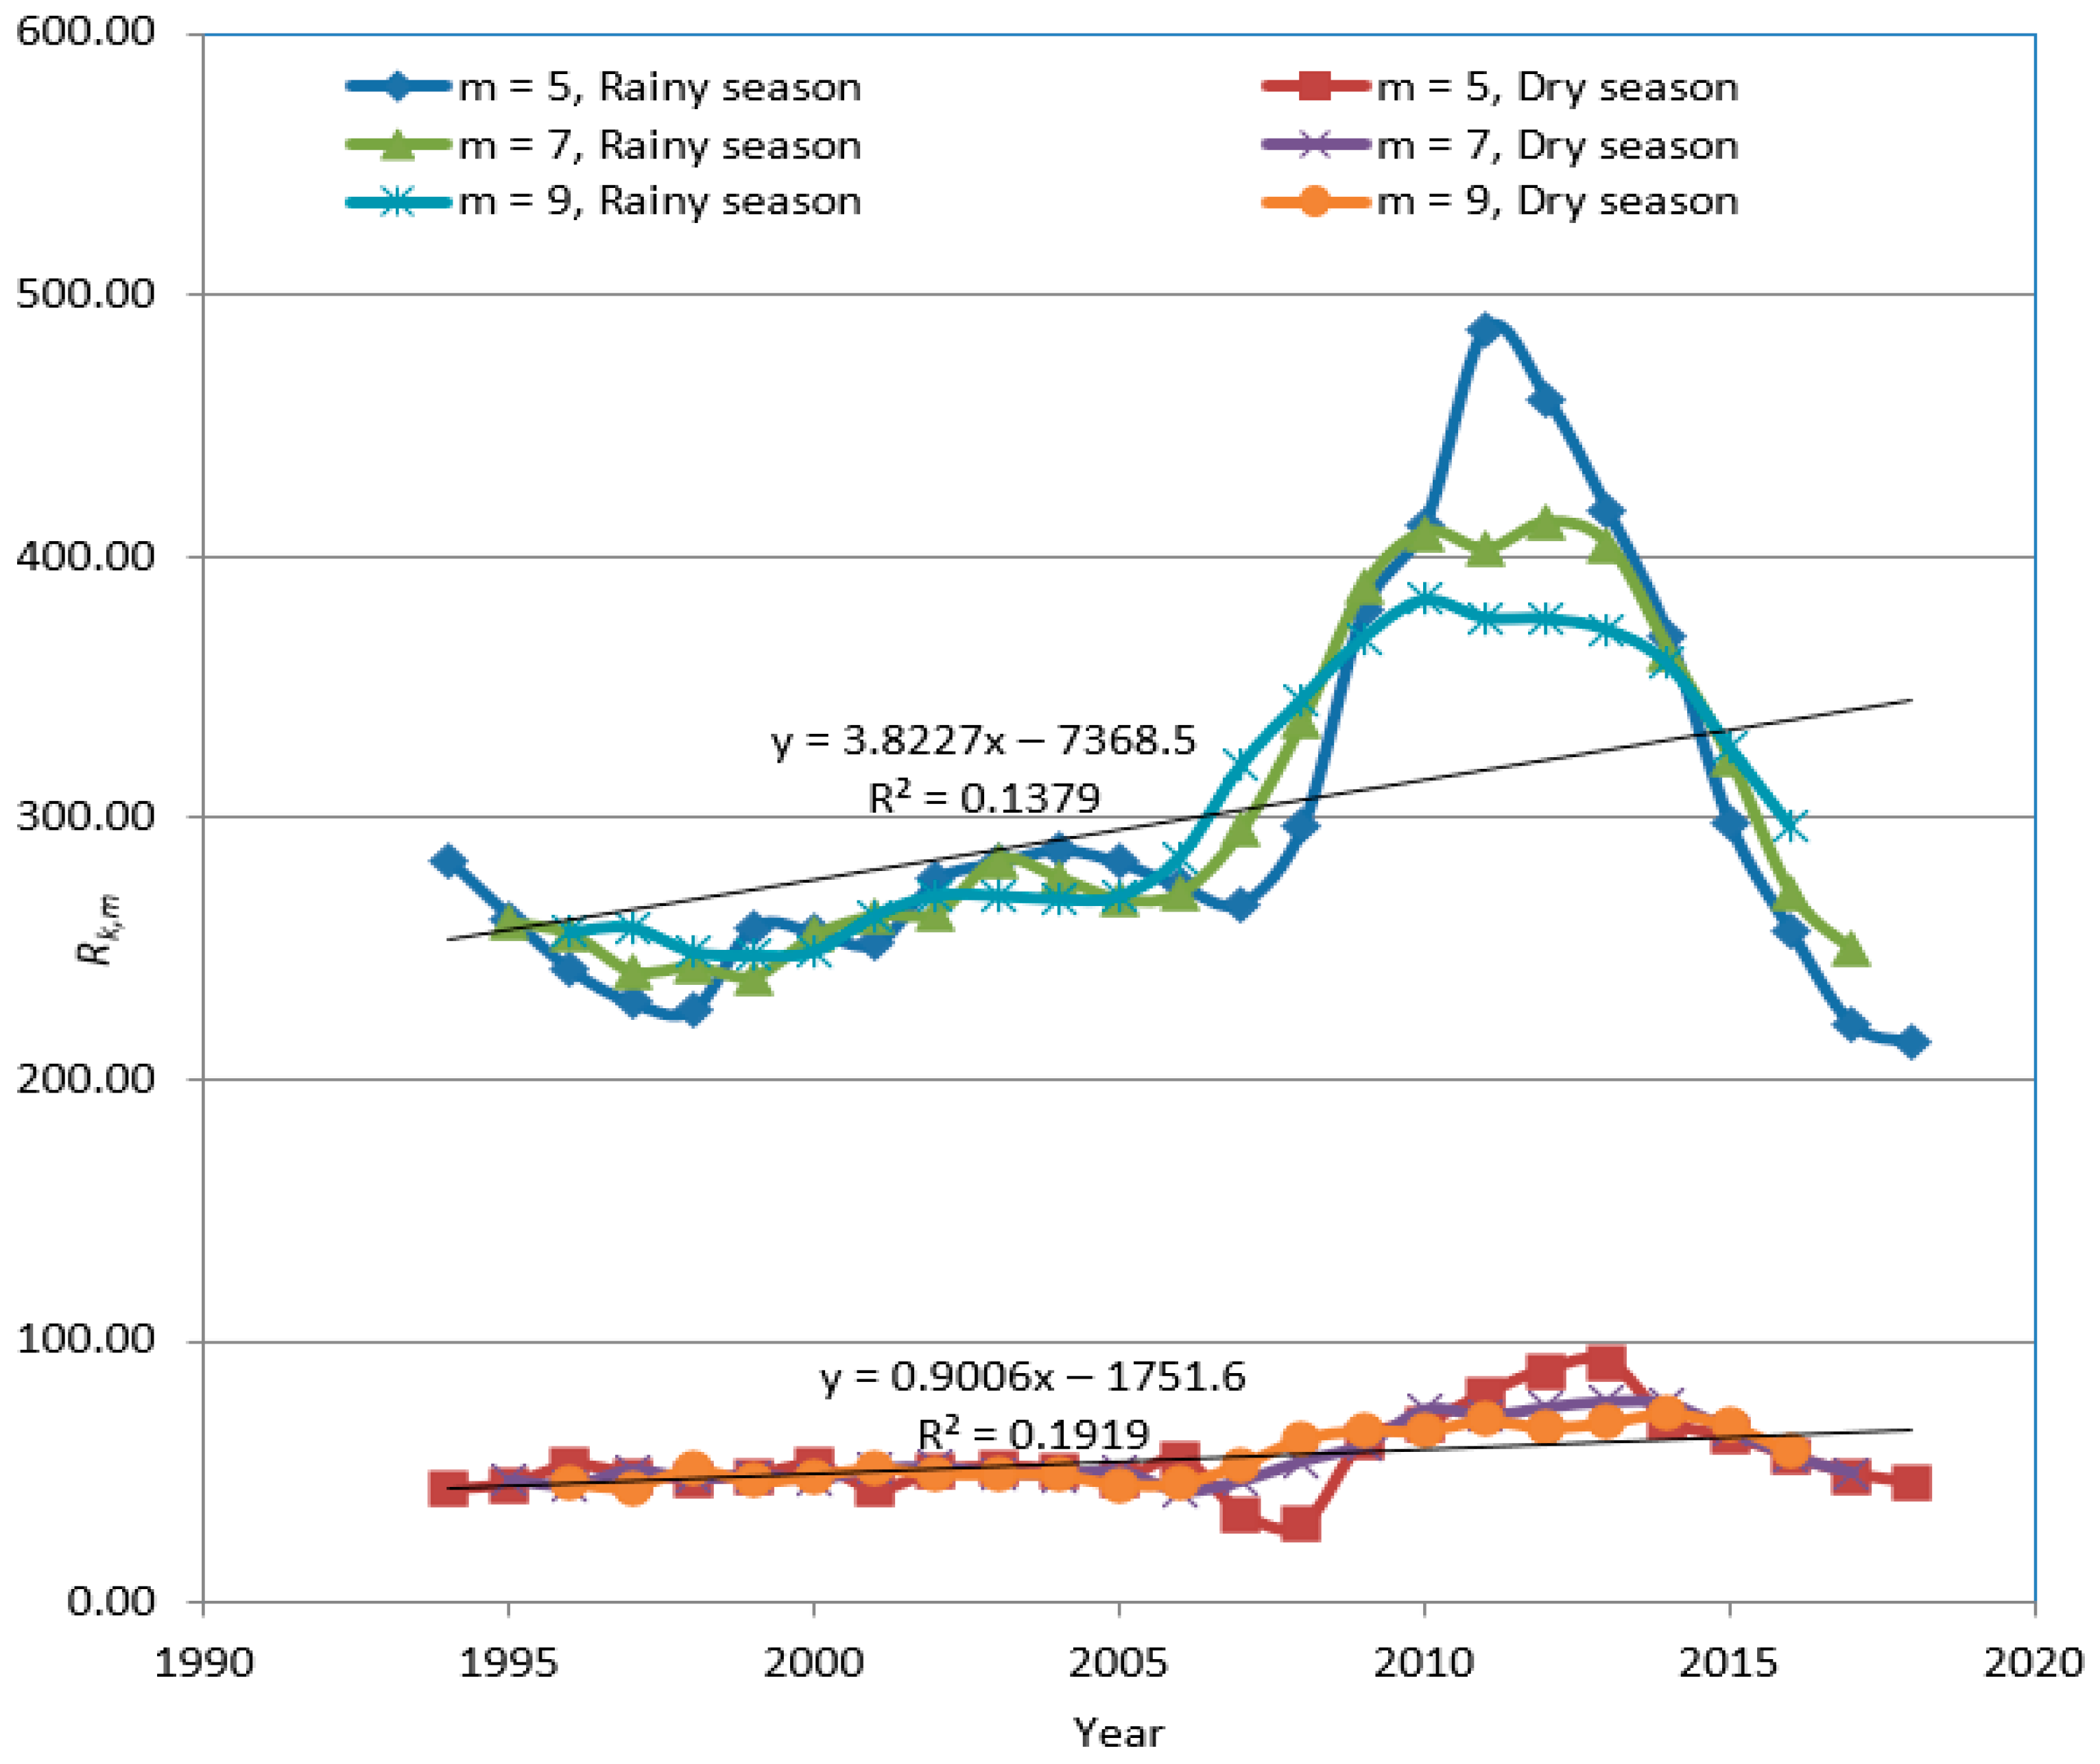
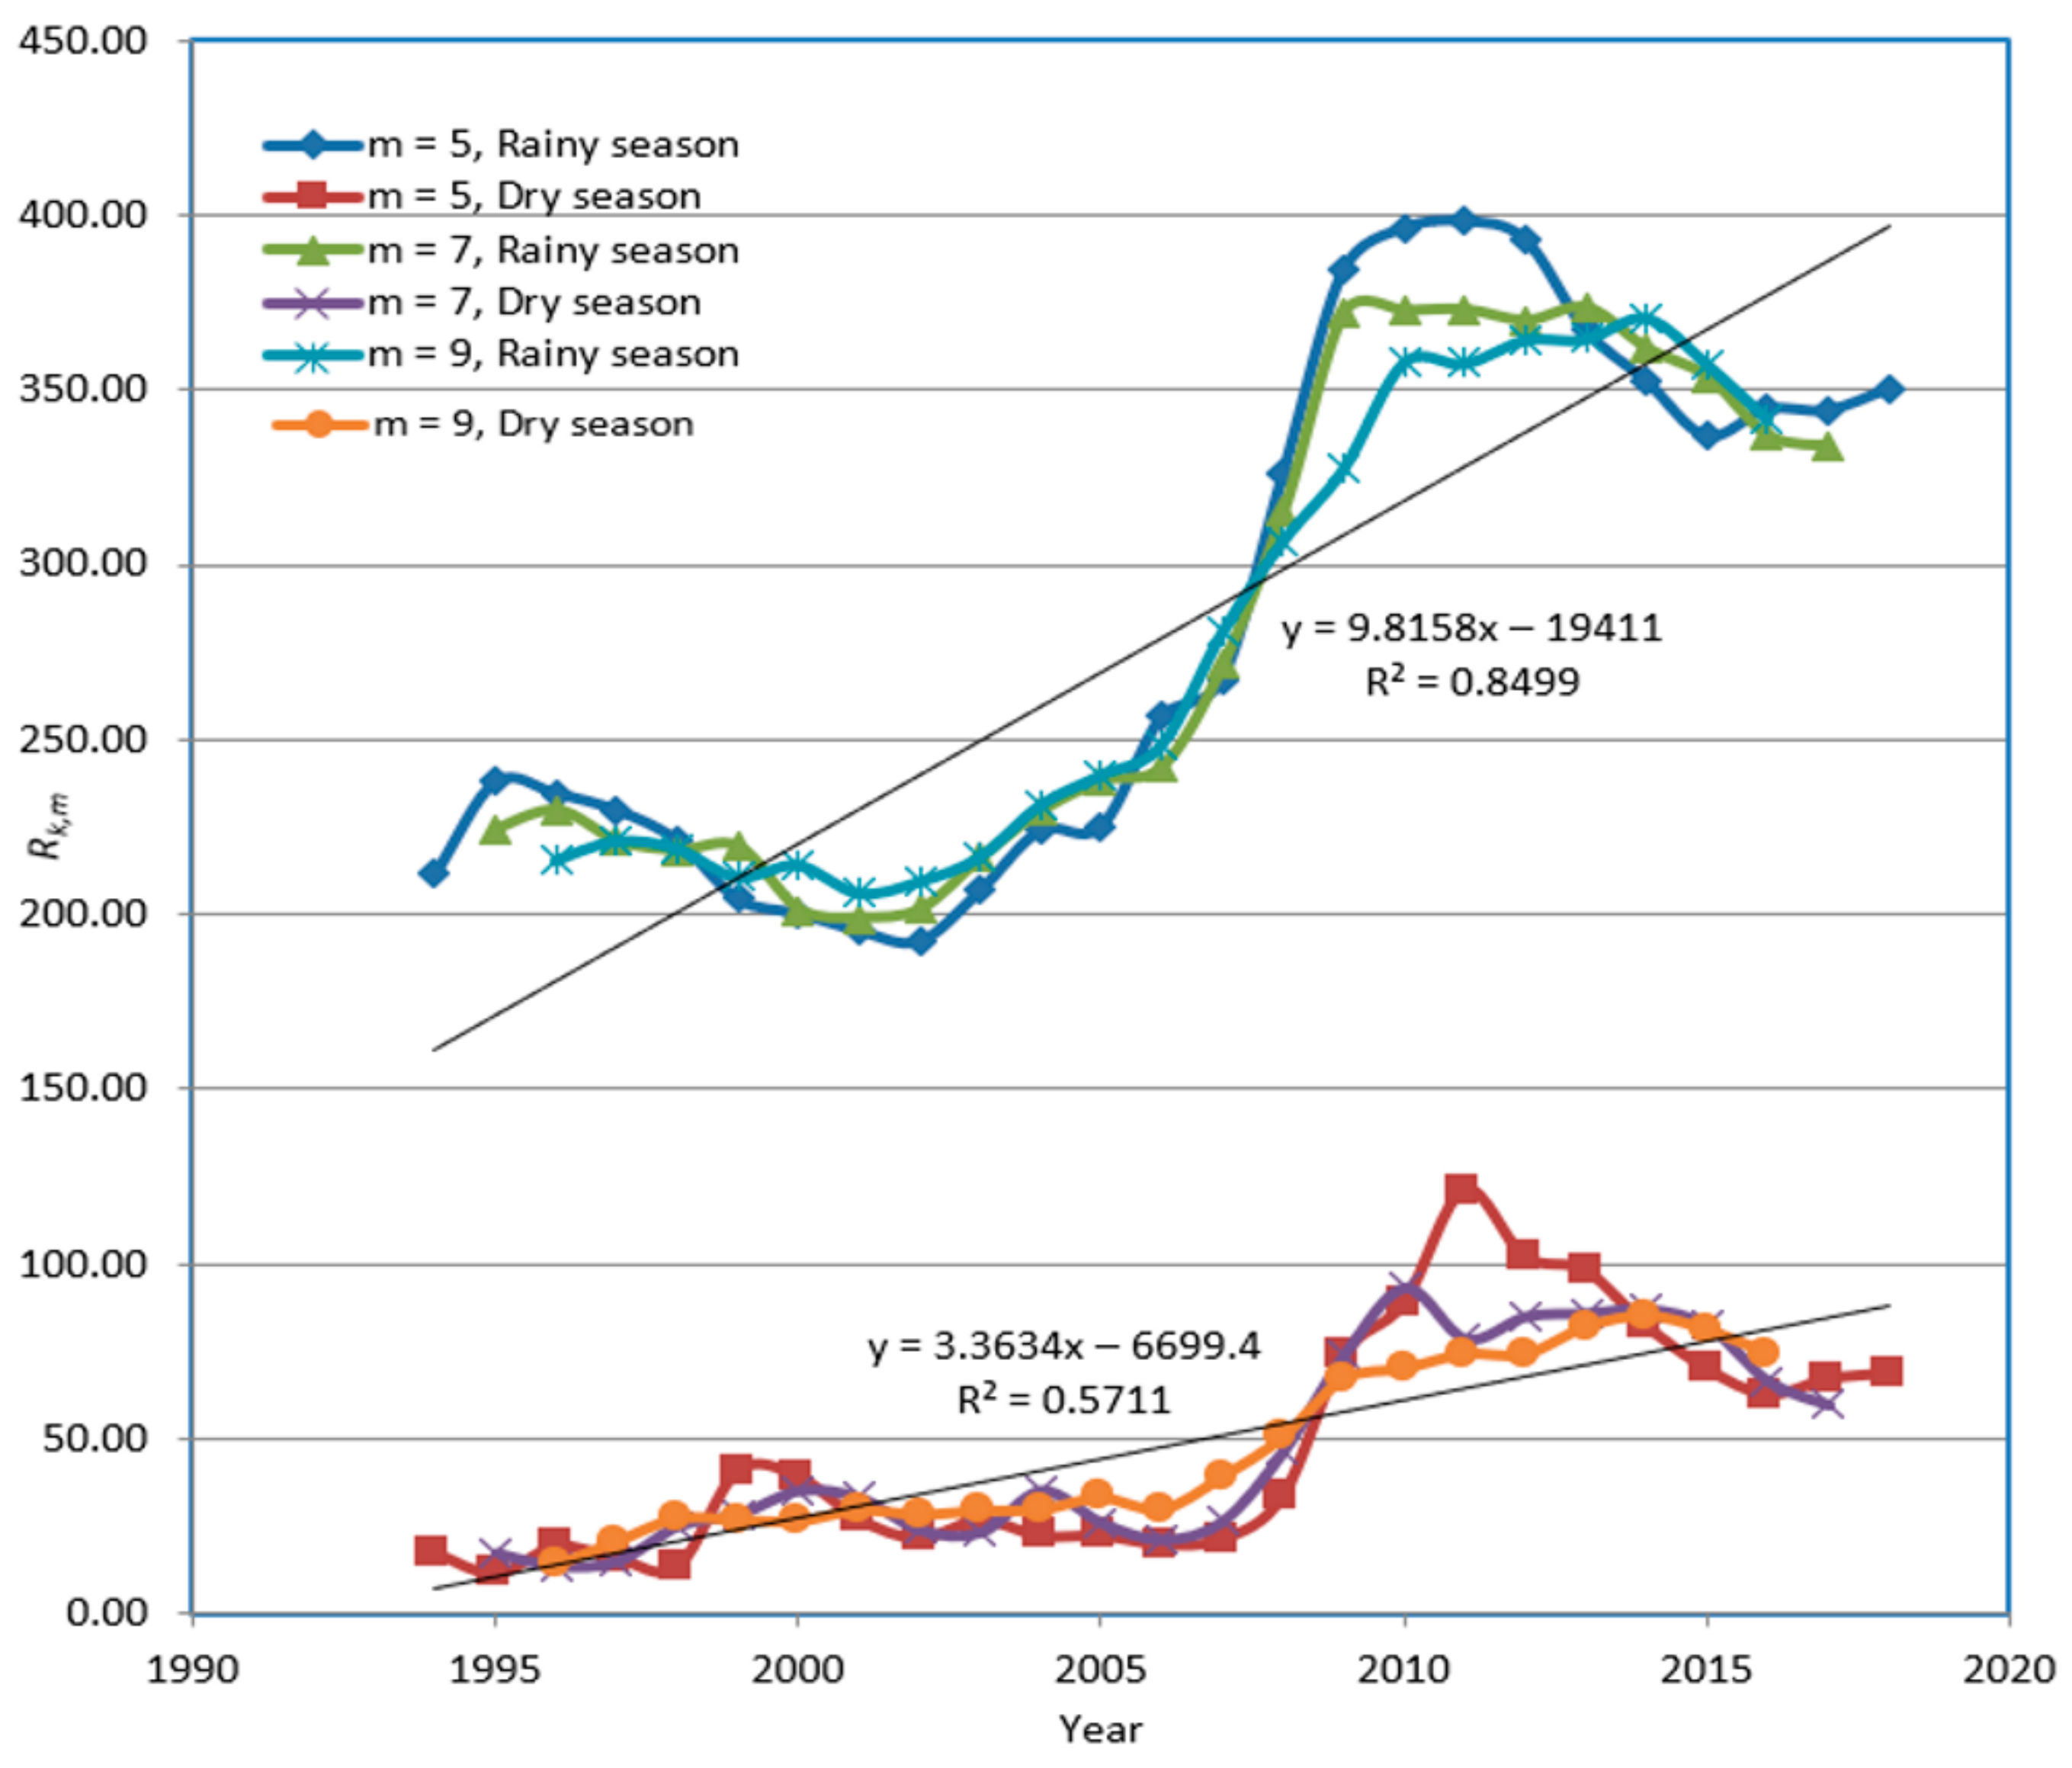
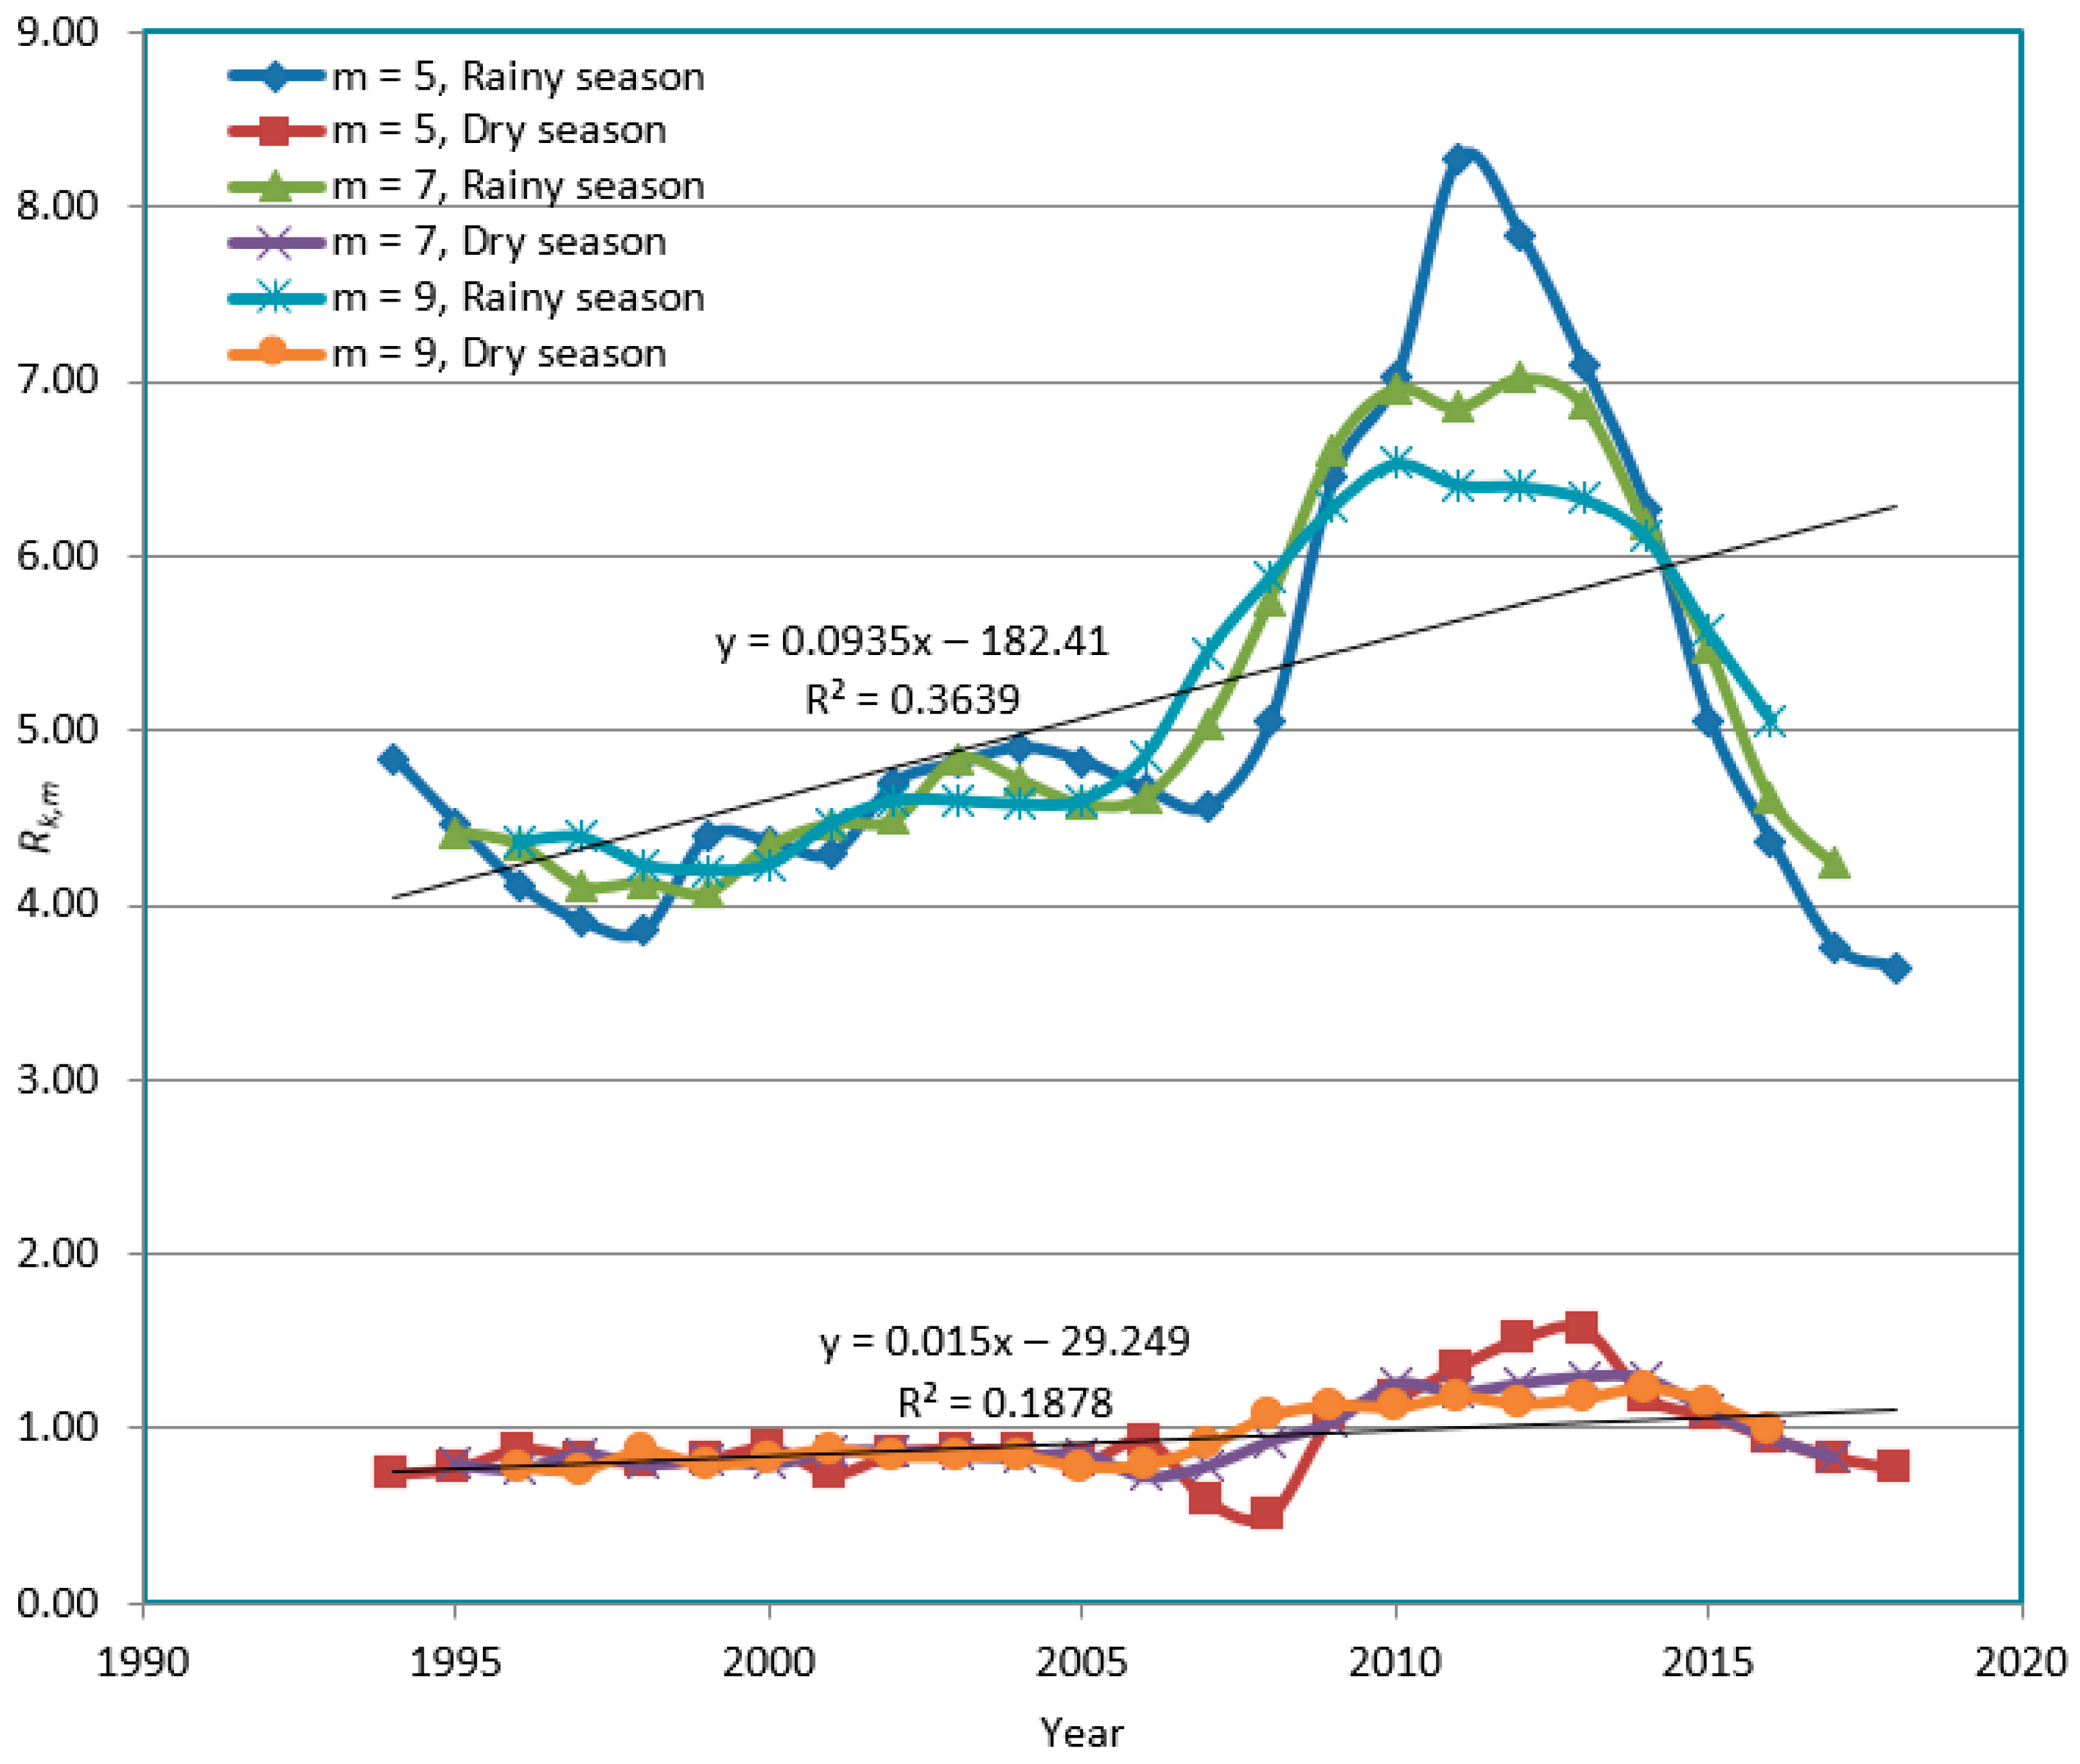
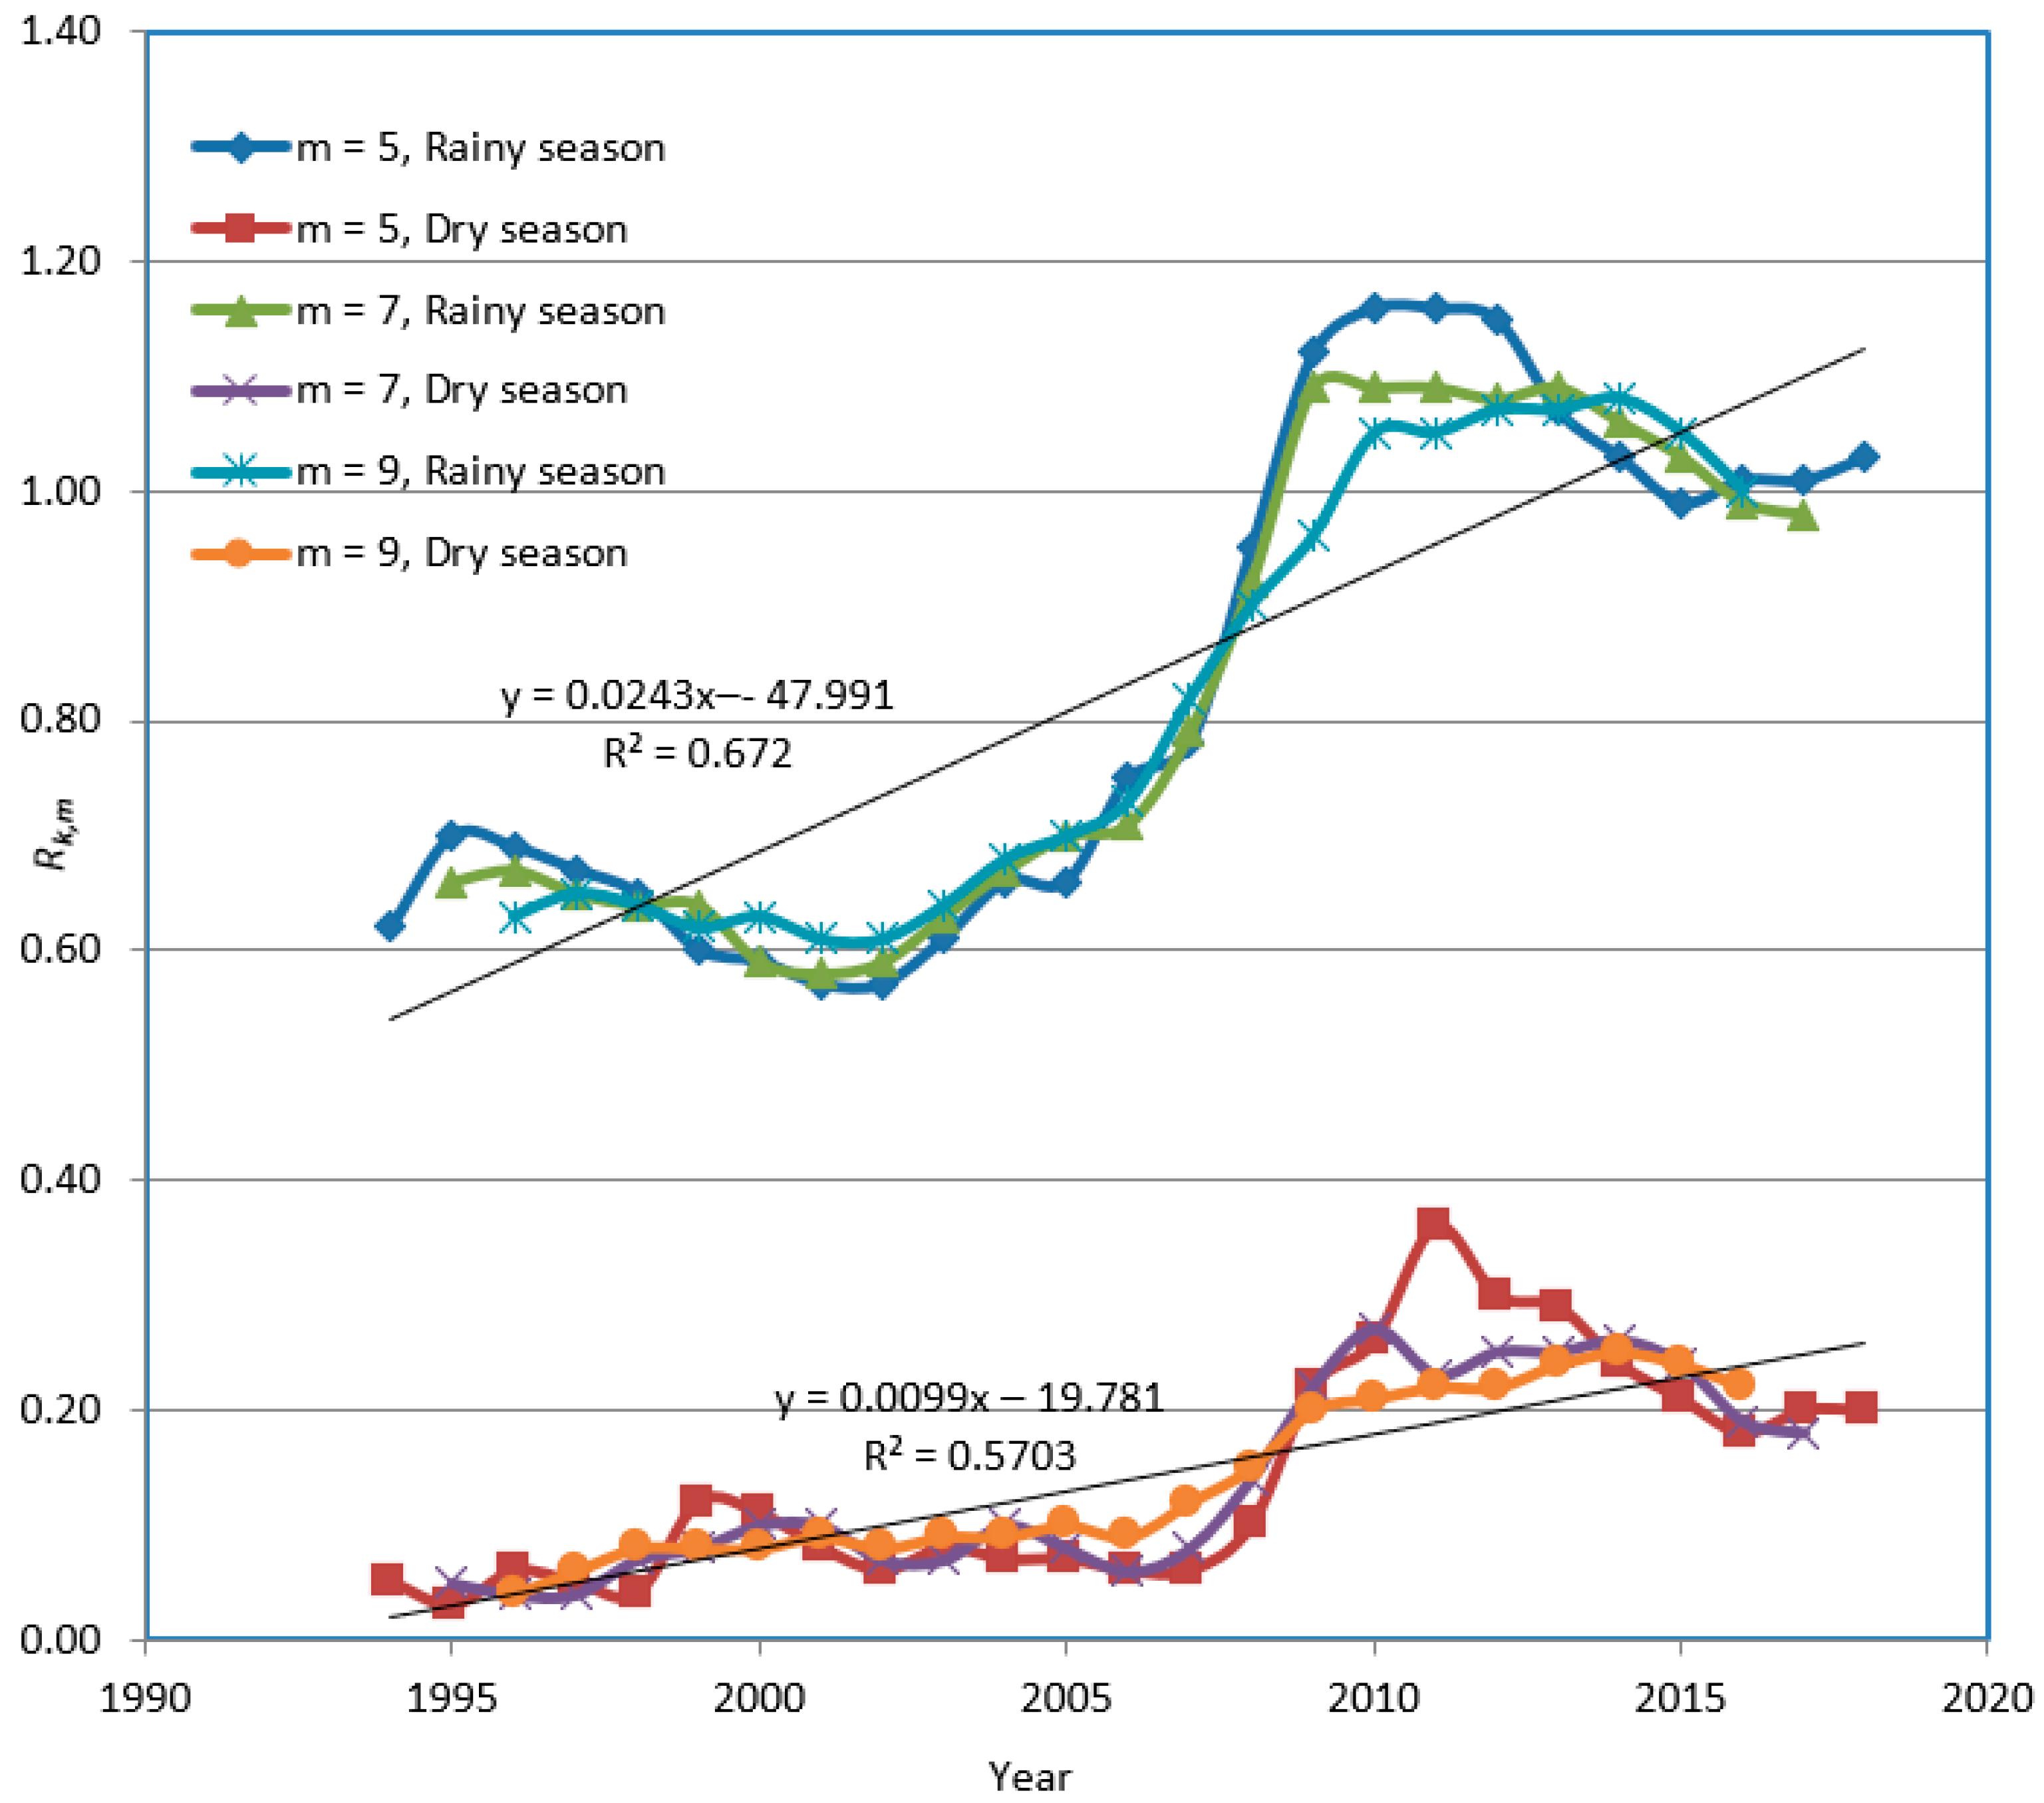
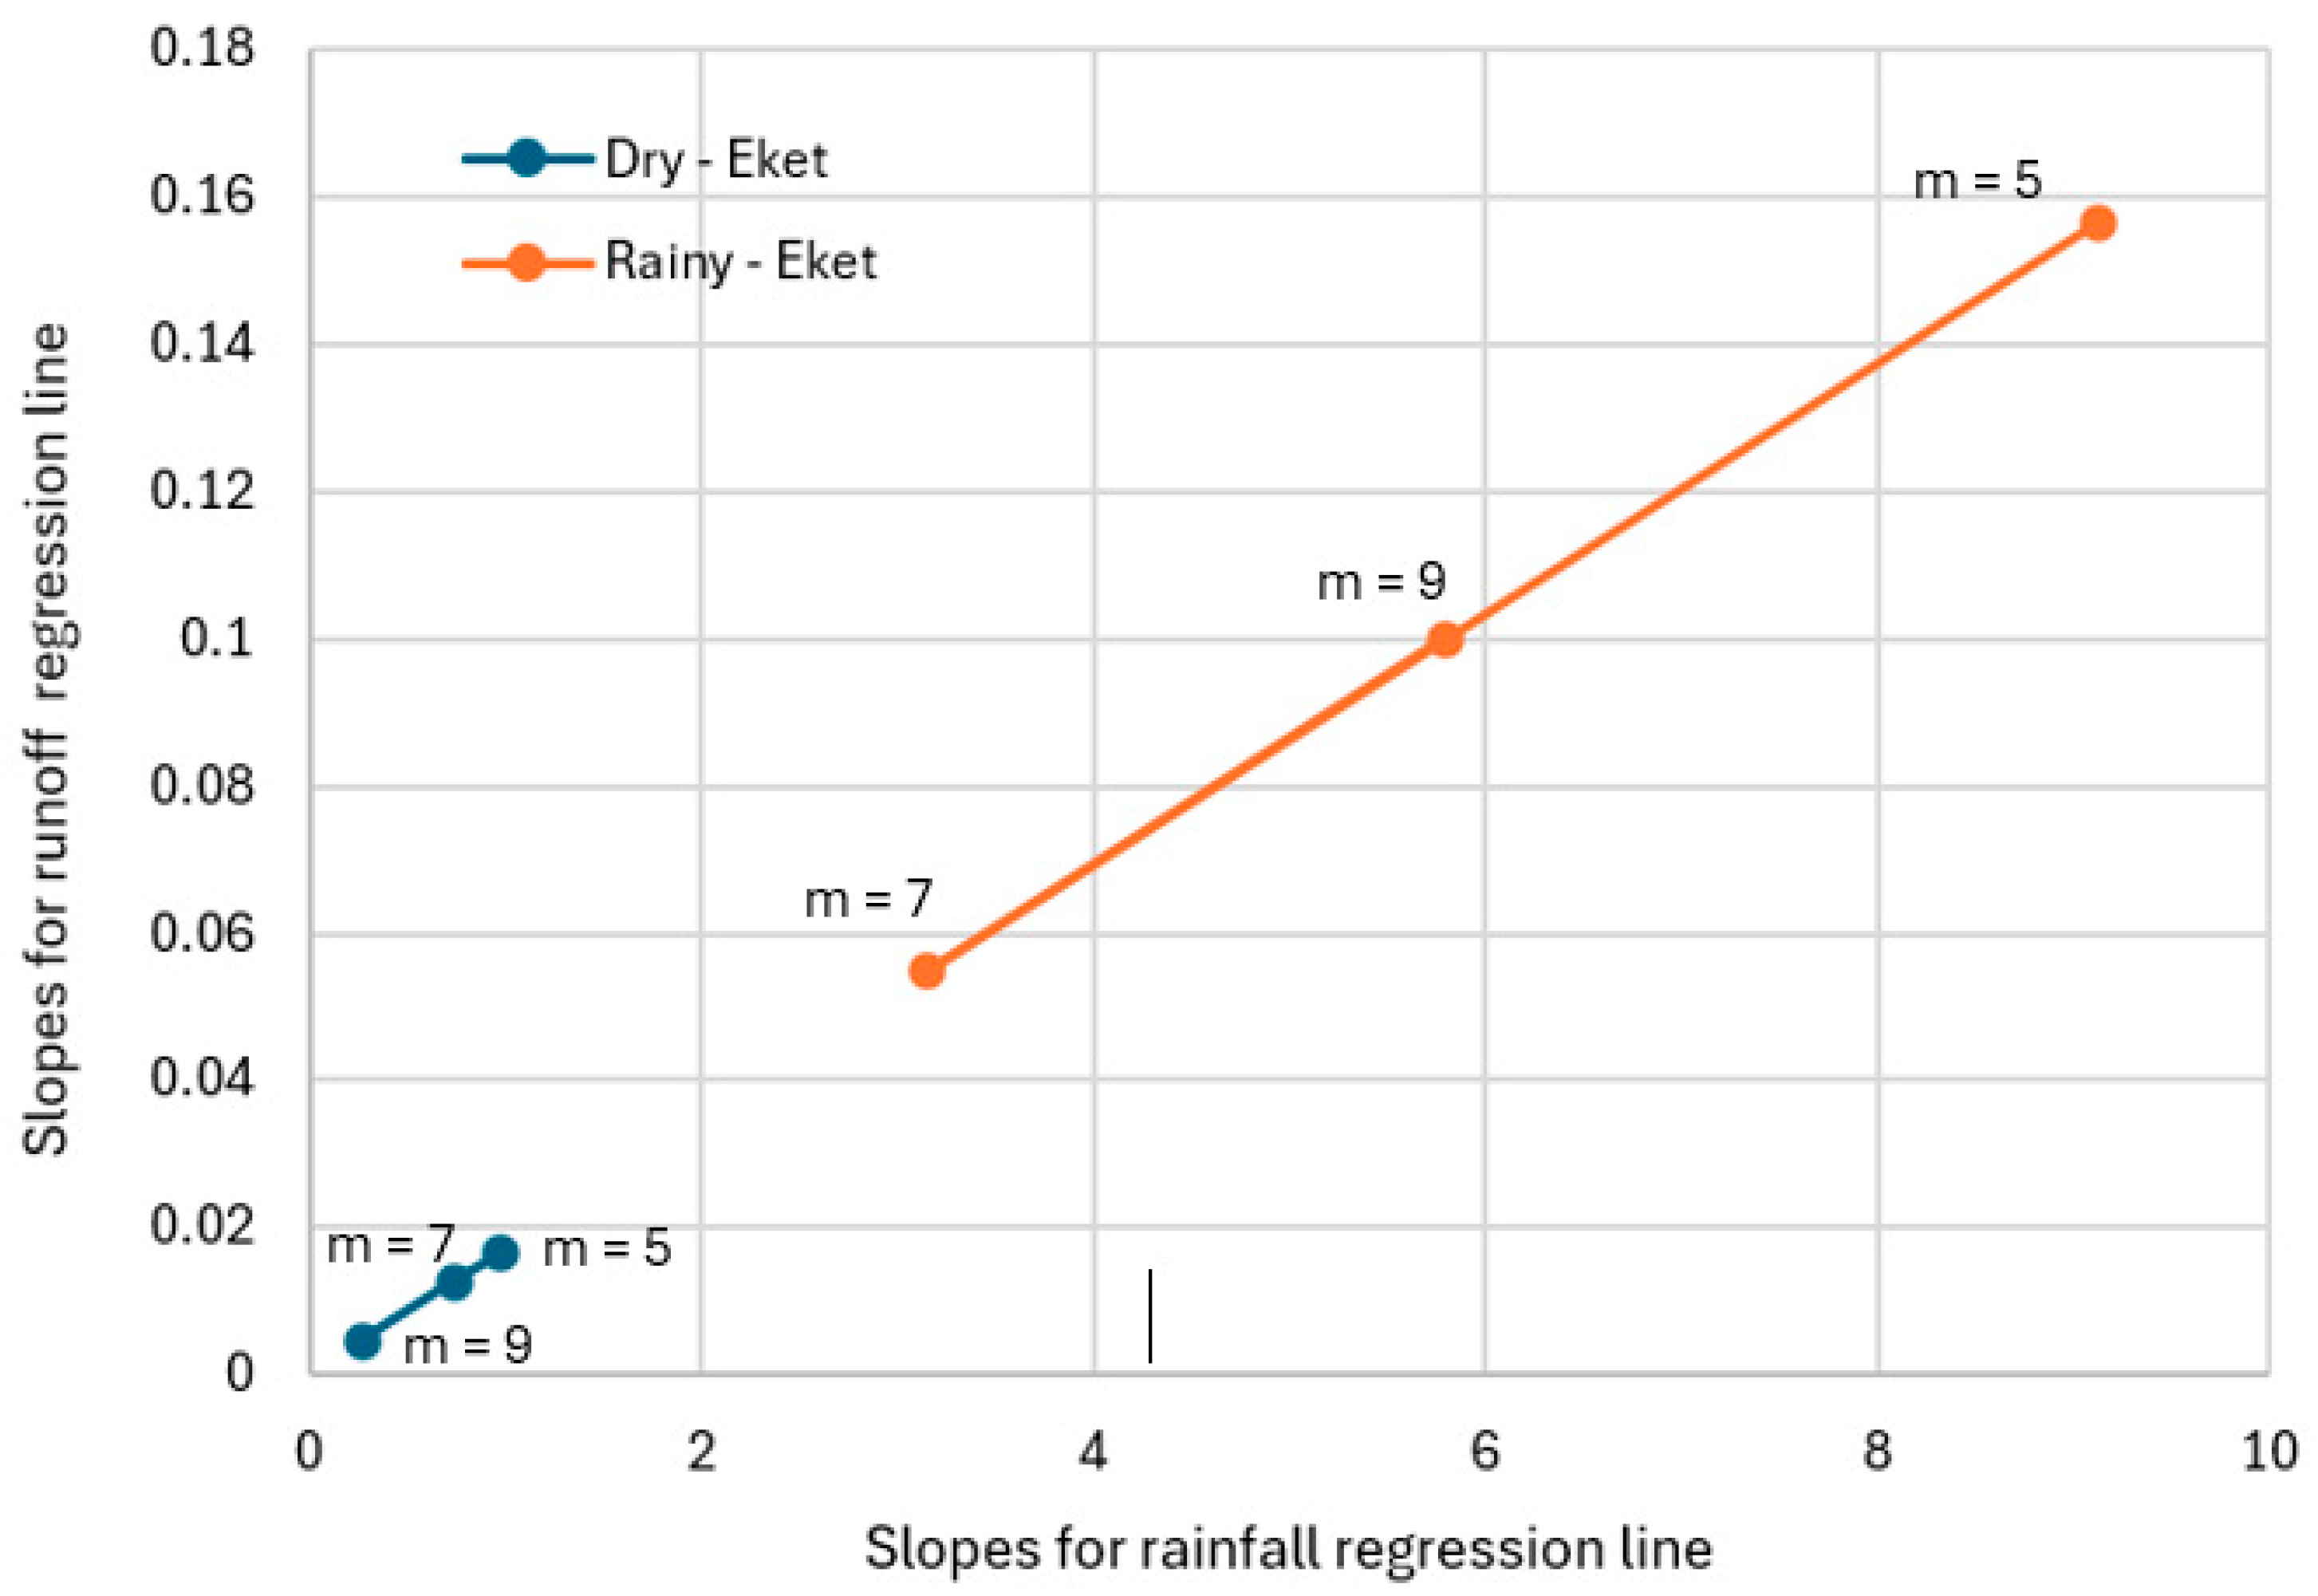
4.1.1. Correlation Analyses and Dynamic Slopes of Segmented Regression
- —Slope of the regression line calculated for the year using records of climatic data from m years including and around the year;
- —Year under observation;
- —Number of years considered for the analysis;
- —Average monthly climatic variable (e.g., rainfall depth or runoff in year ); and
- —Average monthly in year
4.1.2. Intercepts of the Regression Lines Using Annual Average Monthly SOIs and Climatic Variables
5. Conclusions
Author Contributions
Funding
Data Availability Statement
Conflicts of Interest
References
- Mahmood, F.; Mohammad, H.; Golmohammadi, H.; Safavi, R.; Rasoul, M.; Hassan, A. Trend Analysis of Hydrological and Water Quality Variables to Detect Anthropogenic Effects and Climate Variability on a River Basin Scale: A Case Study of Iran. J. Hydro-Environ. Res. 2021, 34, 11–23. [Google Scholar]
- Salami, A.W.; Mohammed, A.A.; Abdulmalik, Z.H.; Olanlokun, O.K. Trend Analysis of Hydro-Meteorological Variables Using the Mann-Kendall Trend Test: Application to the Niger River and the Benue Sub-Basins in Nigeria. Int. J. Technol. 2014, 5, 100–110. [Google Scholar] [CrossRef]
- Sujeet, D.; Singh, D.K.; Islam, A.; Sarangi, A.; Khanna, M. Trend Analysis of Climatic Variables in Betwa River Basin Indian. J. Agric. Sci. 2019, 89, 1033–1038. [Google Scholar]
- Hamed, K.H.; Rao, A.R. A Modified Mann-Kendall Trend Test for Auto-Correlated Data. J. Hydrol. 1998, 204, 182–196. [Google Scholar] [CrossRef]
- Mann, H.B. Nonparametric Tests against Trend. Econometrica 1945, 13, 245–259. [Google Scholar] [CrossRef]
- Kendall, M. Rank Correlation Methods, 4th ed.; Charles Griffin: San Francisco, CA, USA, 1975. [Google Scholar]
- Rai, R.K.; Upadhyay, A.; Ojha, C.S.P. Temporal Variability of Climatic Parameters of Yamuna River Basin: Spatial Analysis of Persistence, Trend and Periodicity. Open Hydrol. J. 2010, 4, 184–210. [Google Scholar] [CrossRef]
- Barsugli, J.; Anderson, C.; Smith, J.B.; Vogel, J.M. Options for Improving Climate Modeling to Assist Water Utility Planning for Climate Change; Water Utility Climate Alliance: Washington, DC, USA, 2009; Volume 144. [Google Scholar]
- Cannarozzo, M.; Noto, L.V.; Viola, F. Spatial Distribution of Rainfall Trends in Sicily (1921–2000). Phys. Chem. Earth 2006, 31, 1201–1211. [Google Scholar] [CrossRef]
- Oguntunde, P.G.; Abiodun, B.J.; Lischeid, G. Rainfall Trends in Nigeria, 1901–2000. J. Hydrol. 2011, 411, 207–218. [Google Scholar] [CrossRef]
- Gocic, M.; Trajkovic, S. Analysis of Changes in Meteorological Variables Using Mann-Kendall and Sen’s Slope Estimator Statistical Tests in Serbia. Glob. Planet. Chang. 2013, 100, 172–182. [Google Scholar] [CrossRef]
- Gemmer, M.; Becker, S.; Jiang, T. Observed Monthly Precipitation Trends in China 1951–2002. Theor. Appl. Climatol. 2004, 77, 39–45. [Google Scholar] [CrossRef]
- Partal, T.; Kahya, E. Trend Analysis in Turkish Precipitation Data. Hydrol. Process. 2006, 20, 2011–2026. [Google Scholar] [CrossRef]
- Liu, Q.; Yang, Z.; Cui, B. Spatial and Temporal Variability of Annual Precipitation during 1961–2006 in Yellow River Basin, China. J. Hydrol. 2008, 361, 330–338. [Google Scholar] [CrossRef]
- Tabari, H. Temporal Trends and Spatial Characteristics of Drought and Rainfall in Arid and Semiarid Regions of Iran. Hydrol. Process 2012, 26, 3351–3361. [Google Scholar] [CrossRef]
- Maidment, R.I.; Allan, R.P.; Black, E. Recent Observed and Simulated Changes in Precipitation over Africa. Geophys. Res. Lett. 2015, 42, 8155–8164. [Google Scholar] [CrossRef]
- Fauchereau, N.; Trzaska, S.; Rouault, M.; Richard, Y. Rainfall Variability and Changes in Southern Africa during the 20th Century in the Global Warming Context. Nat. Hazards 2003, 29, 139–154. [Google Scholar] [CrossRef]
- Le Barbé, L.; Lebel, T.; Tapsoba, D. Rainfall Variability in West Africa during the Years 1950–90. J. Clim. 2002, 15, 187–202. [Google Scholar] [CrossRef]
- Ogungbenro, S.B.; Morakinyo, T.E. Rainfall Distribution and Change Detection across Climatic Zones in Nigeria. Weather Clim. Extrem. 2014, 5, 1–6. [Google Scholar] [CrossRef]
- Tarhule, A.; Woo, M.-K. Changes in Rainfall Characteristics in Northern Nigeria. Int. J. Climatol. 1988, 18, 1261–1271. [Google Scholar] [CrossRef]
- Akinsanola, A.; Ogunjobi, K. Analysis of Rainfall and Temperature Variability over Nigeria. Glob. J. Hum. Soc. Sci. B 2014, 14, 1–18. [Google Scholar]
- Gleick, P.H. Climate Change, Hydrology and Water Resources. Rev. Geophys. 1989, 27, 329–344. [Google Scholar] [CrossRef]
- Karpouzos, D.K.; Kavalieratou, S.; Babajimopoulos, C. Trend Analysed of Precipitation Data in Pieria Region (Greece). Eur. Water 2010, 30, 31–40. [Google Scholar]
- Mondal, A.; Kundu, S.; Mukhopadhyay, A. Rainfall Trend Analysis by Mann-Kendall Test: A Case Study of North-Eastern Part of Cuttack District, Orissa. Int. J. Geol. Earth Environ. Sci. 2012, 2, 70–78. [Google Scholar]
- Jain, S.K.; Kumar, V. Trend Analysis of Rainfall and Temperature Data for India. Curr. Sci. 2012, 102, 37–49. [Google Scholar]
- Akpabio, E.M.; Watson, N.M.; Ite, U.E.; Ukpong, I.E. Integrated Water Resources Management in the Cross River Basin, Nigeria. Int. J. Water Resour. Dev. 2007, 23, 691–708. [Google Scholar] [CrossRef]
- Akpabio, E.M. Assessing Integrated Water Resources Management in Nigeria: Insights and Lessons from Irrigation Projects in the Cross River Basin. Water Policy 2007, 9, 149–168. [Google Scholar] [CrossRef]
- Okoji, M.A. Agriculture. In Southeastern Nigeria: Its Environment; Inyang, I.B., Ed.; Abaam Press: Kaduna, Nigeria, 2001; pp. 122–134. [Google Scholar]
- NCEI. El Niño/Southern Oscillation (ENSO). Available online: https://www.ncei.noaa.gov/access/monitoring/enso/soi (accessed on 7 May 2024).
- Fersi, W.; Lézine, A.M.; Bassinot, F. Hydro-Climate Changes over Southwestern Arabia and the Horn of Africa during the Last Glacial–Interglacial Transition: A Pollen Record from the Gulf of Aden. Rev. Palaeobot. Palynol. 2016, 233, 176–185. [Google Scholar] [CrossRef]
- Gedefaw, M.; Yan, D.; Wang, H.; Qin, T.; Girma, A.; Abiyu, A.; Batsuren, D. Innovative Trend Analysis of Annual and Seasonal Rainfall Variability in Amhara Regional State, Ethiopia. Atmosphere 2018, 9, 326. [Google Scholar] [CrossRef]
- Wang, H.; Zhang, M.; Zhua, H.; Dang, X.; Yang, Z.; Yin, L. Hydro-Climatic Trends in the Last 50 Years in the Lower Reach of the Shiyang River Basin, NW China. Catena 2012, 95, 33–41. [Google Scholar] [CrossRef]
- Kahya, E.; Kalaycı, S. Trend Analysis of Streamflow in Turkey. J. Hydrol. 2004, 289, 128–144. [Google Scholar] [CrossRef]
- Degefu, M.A.; Bewket, W. Variability and Trends in Rainfall Amount and Extreme Event Indices in the Omo-Ghibe River Basin, Ethiopia. Reg. Environ. Chang. 2014, 14, 799–810. [Google Scholar] [CrossRef]
- Wang, H.; Chen, L.; Yu, X. Distinguishing Human and Climate Influences on Streamflow Changes in Luan River Basin in China. Catena 2016, 136, 182–188. [Google Scholar] [CrossRef]
- Asfaw, A.; Simane, B.; Hassen, A.; Bantider, A. Variability and Time Series Trend Analysis of Rainfall and Temperature in Northcentral Ethiopia: A Case Study in Woleka Sub-Basin. Weather Clim. Extrem. 2018, 19, 29–41. [Google Scholar] [CrossRef]
- Khambhammettu, P. Mann-Kendall Analysis. Annual Groundwater Monitoring Report; HydroGeoLogic, Inc.: Fort Ord, CA, USA, 2005. [Google Scholar]
- Ogunrinde, A.T.; Oguntunde, P.G.; Akinwumiju, A.S.; Fasinmirin, J.T. Analysis of Recent Changes in Rainfall and Drought Indices in Nigeria, 1981-2015. Hydrol. Sci. J. 2019, 64, 1755–1768. [Google Scholar] [CrossRef]
- Osugiri, I.I.; Ben-Chendo, G.N.; Okwara, M.O.; Anyanwu, G.U.; Utazi, C.O. Analysis of the Trends of Climatic Variables in Southeast Nigeria. Int. J. Curr. Res. 2019, 11, 3910–3913. [Google Scholar]
- Salami, A.; Mohammed, A.; Adeyemo, J.; Olanloku, O. Assessment of Impact of Climate Change on Runoff in the Kainji Lake Basin Using Statistical Methods. Int. J. Water Resour. Environ. Eng. 2015, 7, 7–16. [Google Scholar]
- Zitta, W.S.; Madaki, D.H. Climate Change, Rainfall Trends and Variability in Jos Plateau. J. Appl. Sci. 2020, 20, 76–82. [Google Scholar]
- Tarek, M.; Mohsin, S.; Abdallah, S. Assessment of Seasonal and Annual Rainfall Trends and Variability in Sharjah City, UAE. Adv. Meteorol. 2016, 2016, 6206238. [Google Scholar]
- Ozi-Isah, M.; Mashi, A.; Oguche, J. Examining the Variability of Rainfall, Temperature and Runoff Data in the Niger and Benue Confluence Catchment in Lokoja, Kogi State North Central, Nigeria. Int. J. Res. Hum. Resour. Manag. 2021, 3, 28–39. [Google Scholar]
- Oguntunde, P.G.; Abiodun, B.J.; Olukunle, O.J.; Olufayo, A.A. Trends and Variability in Pan Evaporation and Other Climatic Variables at Ibadan, Nigeria. Meteorol. Appl. 2012, 19, 464–472. [Google Scholar] [CrossRef]
- Solomon, O.A.; Sunday, O.U. Analysis of Trends and Variations of Monthly Mean Wind Speed Data in Nigeria. IOSR J. Appl. Phys. 2015, 7, 31–41. [Google Scholar]
- Ogolo, E. Estimation of Global Solar Radiation in Nigeria Using a Modified Angstrom Model and the Trend Analysis of the Allied Meteorological Components. Indian J. Radio Space Phys. 2014, 43, 213–224. [Google Scholar]
- Amadi, S.O.; Udo, S.O.; Pekene, D.B.; Chigbu, T.O. Study of the Trends in Sunshine Duration Hours in Nigeria during 1961-2012 Using the Linear Regression Model. Int. J. Sci. Educ. 2019, 3, 1103–1107. [Google Scholar]
- Abodunrin, T.J.; Emetere, M.E. Exploring Pressure-Temperature Trends toward Climatic Change in Ikogosi. IOP Conf. Ser. Earth Environ. Sci. 2021, 665, 012056. [Google Scholar] [CrossRef]
- Ayeni, O.D.; Oloukoi, G. Analysis of Temperature Trend as an Indicator of Climate Change Using Land Surface Temperature (LST) and Meteorological Data in Akure, Southwest Nigeria. J. Res. For. Wildl. Environ. 2022, 14, 84–100. [Google Scholar]
- Nozar, G.A.; Ghahreman, A.; Javad, B.B.; Abuzar, G.C. Trend Analysis of Soil Surface Temperature in Several Regions of Iran. In Proceedings of the 19th World Congress of Soil Science, Soil Solutions for a Changing World 74, Brisbane, Australia, 1–6 August 2010; International Union of Soil Sciences (IUSS): Brisbane, Australia, 2010. [Google Scholar]
- Osang, J.E.; Egor, A.O.; Uquetan, U.I.; Eze, B.E.; Emeruwa, C.; Pekene, D.B.J. Investigation of the Relative Humidity Profile Variations in Calabar, Nigeria. Int. J. Sci. Eng. Res. 2016, 7, 1134–1144. [Google Scholar]
- Emmanuel, I. Linkages between El Niño-Southern Oscillation (ENSO) and Precipitation in West Africa Regions. Arab. J. Geosci. 2022, 15, 671. [Google Scholar] [CrossRef]
- Susilo, G.E.; Yamamoto, K.; Imai, T.; Ishii, Y.; Fukami, H.; Sekine, M. The Effect of ENSO on Rainfall Characteristics in the Tropical Peatland Areas of Central Kalimantan, Indonesia. Hydrol. Sci. J. 2013, 58, 539–548. [Google Scholar] [CrossRef]
- Ewona, I.O.; Udo, S.O. Climatic Condition of Calabar as Typified by Some Meteorological Parameters. Glob. J. Pure Appl. Sci. 2011, 17, 81–86. [Google Scholar]
- Smith, C.; Baker, J.C.A.; Spracklen, D.V. Tropical Deforestation Causes Large Reductions in Observed Precipitation. Nature 2023, 615, 270–275. [Google Scholar] [CrossRef]


| S/N | Station | LGA | State | Latitude | Longitude |
|---|---|---|---|---|---|
| 1 | Ogoja | Ogoja | Cross River | 6°36′ N | 8°48′ E |
| 2 | Calabar | Calabar Municipal | Cross River | 5°2′ N | 8°21′ E |
| 3 | Uyo | Uyo | Akwa Ibom | 5°0.6′ N | 7°53′ E |
| 4 | Eket | Onna Eket | Akwa Ibom | 4°38′ N | 7°53′ E |
| Station | Descriptive Statistics for Rainfall (mm) | |||||
|---|---|---|---|---|---|---|
| Minimum | Maximum | Mean | Standard Deviation | Skewness | Kurtosis | |
| Eket | 124.750 | 385.600 | 209.098 | 64.101 | 1.395 | 1.565 |
| Uyo | 1497.000 | 4627.200 | 2509.163 | 769.224 | 1.395 | 1.565 |
| Calabar | 2282.800 | 7094.300 | 4454.327 | 1495.442 | 0.140 | −1.394 |
| Ogoja | 104.280 | 337.080 | 196.861 | 61.542 | 0.661 | −0.522 |
| Station | Mann–Kendall Test for Rainfall (mm) | |||||||
|---|---|---|---|---|---|---|---|---|
| Mann– Kendall Statistic (S) | Kendall Tau | p-Value (2-Tailed Test) | Alpha | Test Interpretation | Trend Rate (Slope) | Trend Equation | Trend | |
| Eket | 0.036 | 0.007 | 0.972 | 0.05 | Accept H0 | 0.107 | 193 + 1.003 t | Not significant |
| Uyo | 0.036 | 0.007 | 0.972 | 0.05 | Accept H0 | 1.293 | 2322.608 + 12.036 t | Not significant |
| Calabar | −4.924 | −0.637 | 0.000 | 0.05 | Reject H0 | −147.833 | 6734.818 − 147.128 t | Significant downward trend |
| Ogoja | 4.139 | 0.536 | 0.000 | 0.05 | Reject H0 | 4.517 | 121.103 + 4.88 t | Significant upward trend |
| Station | Descriptive Statistics for Evaporation (mm) | |||||
|---|---|---|---|---|---|---|
| Minimum | Maximum | Mean | Standard Deviation | Skewness | Kurtosis | |
| Eket | 1.870 | 2.520 | 2.241 | 0.156 | −0.392 | 0.046 |
| Uyo | 1.900 | 2.500 | 2.233 | 0.149 | −0.086 | −0.173 |
| Calabar | 2.300 | 2.900 | 2.563 | 0.122 | 0.650 | 1.269 |
| Ogoja | 2.330 | 2.870 | 2.559 | 0.105 | 0.677 | 1.903 |
| Station | Mann–Kendall Test for Evaporation (mm) | |||||||
|---|---|---|---|---|---|---|---|---|
| Mann– Kendall Statistic (S) | Kendall Tau | p-Value (2-Tailed Test) | Alpha | Test Interpretation | Trend Rate (Slope) | Trend Equation | Trend | |
| Eket | −2.074 | −0.272 | 0.038 | 0.05 | Reject H0 | −0.007 | 2.323 − 0.005 t | Significant downward trend |
| Uyo | −1.766 | −0.247 | 0.077 | 0.05 | Accept H0 | −0.006 | 2.315 − 0.005 t | Not significant |
| Calabar | 1.040 | 0.150 | 0.298 | 0.05 | Accept H0 | 0.000 | 2.533 + 0.002 t | Not significant |
| Ogoja | 1.556 | 0.205 | 0.120 | 0.05 | Accept H0 | 0.003 | 2.522 + 0.002 t | Not significant |
| Station | Descriptive Statistics for Wind Speed (Knots) | |||||
|---|---|---|---|---|---|---|
| Minimum | Maximum | Mean | Standard Deviation | Skewness | Kurtosis | |
| Eket | 2.750 | 5.330 | 3.700 | 0.685 | 0.651 | −0.521 |
| Uyo | 3.000 | 5.000 | 3.733 | 0.785 | 0.524 | −1.153 |
| Calabar | 3.000 | 5.000 | 4.300 | 0.596 | −0.189 | −0.482 |
| Ogoja | 3.190 | 5.790 | 4.220 | 0.694 | 0.722 | −0.088 |
| Station | Mann–Kendall Test for Wind Speed (Knots) | |||||||
|---|---|---|---|---|---|---|---|---|
| Mann– Kendall Statistic (S) | Kendall Tau | p-Value (2-Tailed Test) | Alpha | Test Interpretation | Trend Rate (Slope) | Trend Equation | Trend | |
| Eket | 3.766 | 0.489 | 0.000 | 0.05 | Reject H0 | 0.055 | 2.782 + 0.059 t | Significant upward trend |
| Uyo | 4.018 | 0.592 | 0.000 | 0.05 | Reject H0 | 0.056 | 2.726 + 0.065 t | Significant upward trend |
| Calabar | −2.579 | −0.391 | 0.010 | 0.05 | Reject H0 | 0.000 | 4.814 − 0.033 t | Significant downward trend |
| Ogoja | −0.268 | −0.037 | 0.789 | 0.05 | Accept H0 | −0.003 | 4.298 − 0.005 t | Not Significant |
| Station | Descriptive Statistics for Solar Radiation (mj/m2/year) | |||||
|---|---|---|---|---|---|---|
| Minimum | Maximum | Mean | Standard Deviation | Skewness | Kurtosis | |
| Eket | 16.390 | 18.300 | 17.566 | 0.442 | −0.972 | 1.212 |
| Uyo | 16.400 | 18.300 | 17.570 | 0.449 | −0.874 | 0.915 |
| Calabar | 15.900 | 19.800 | 17.527 | 1.062 | 0.456 | −0.737 |
| Ogoja | 17.580 | 20.450 | 18.934 | 0.774 | −0.007 | −0.995 |
| Station | Mann–Kendall Test for Solar Radiation (mj/m2/year) | |||||||
|---|---|---|---|---|---|---|---|---|
| Mann– Kendall Statistic (S) | Kendall Tau | p-Value (2-Tailed Test) | Alpha | Test Interpretation | Trend Rate (Slope) | Trend Equation | Trend | |
| Eket | −1.321 | −0.173 | 0.186 | 0.05 | Accept H0 | −0.012 | 17.772 − 0.013 t | Not significant |
| Uyo | −1.509 | −0.203 | 0.131 | 0.05 | Accept H0 | −0.013 | 17.778 − 0.014 t | Not significant |
| Calabar | 2.039 | 0.269 | 0.041 | 0.05 | Reject H0 | 0.056 | 16.573 + 0.062 t | Significant upward trend |
| Ogoja | −0.393 | −0.053 | 0.695 | 0.05 | Accept H0 | −0.006 | 19.129 − 0.013 t | Not significant |
| Station | Descriptive Statistics for Sunshine (Hours) | |||||
|---|---|---|---|---|---|---|
| Minimum | Maximum | Mean | Standard Deviation | Skewness | Kurtosis | |
| Eket | 2.110 | 4.760 | 3.492 | 0.817 | −0.431 | −1.243 |
| Uyo | 2.100 | 4.800 | 3.503 | 0.827 | −0.430 | −1.222 |
| Calabar | 2.600 | 4.400 | 3.513 | 0.434 | 0.186 | −0.376 |
| Ogoja | 5.180 | 6.470 | 5.812 | 0.326 | −0.081 | −0.349 |
| Station | Mann–Kendall Test for Sunshine hours (Hours) | |||||||
|---|---|---|---|---|---|---|---|---|
| Mann– Kendall Statistic (S) | Kendall Tau | p-Value (2-Tailed Test) | Alpha | Test Interpretation | Trend Rate (Slope) | Trend Equation | Trend | |
| Eket | 1.535 | 0.201 | 0.125 | 0.05 | Accept H0 | 0.028 | 2.981 + 0.033 t | Not significant |
| Uyo | 1.396 | 0.185 | 0.163 | 0.05 | Accept H0 | 0.030 | 2.992 + 0.033 t | Not significant |
| Calabar | −3.802 | −0.504 | 0.000 | 0.05 | Reject H0 | −0.033 | 4.035 − 0.034 t | Significant downward trend |
| Ogoja | −1.017 | −0.134 | 0.309 | 0.05 | Accept H0 | −0.007 | 5.868 − 0.004 t | Not significant |
| Station | Descriptive Statistics for Atmospheric Pressure (Millibars) | |||||
|---|---|---|---|---|---|---|
| Minimum | Maximum | Mean | Standard Deviation | Skewness | Kurtosis | |
| Eket | 1011.890 | 1015.410 | 1014.629 | 0.877 | −2.524 | 5.537 |
| Uyo | 1014.400 | 1015.400 | 1014.890 | 0.228 | 0.338 | 0.366 |
| Calabar | 1010.800 | 1012.400 | 1011.760 | 0.470 | −0.459 | −1.138 |
| Ogoja | 1010.800 | 1012.370 | 1011.758 | 0.472 | −0.499 | −1.065 |
| Station | Mann–Kendall Test for Atmospheric Pressure (Millibars) | |||||||
|---|---|---|---|---|---|---|---|---|
| Mann– Kendall Statistic (S) | Kendall Tau | p-Value (2-Tailed Test) | Alpha | Test Interpretation | Trend Rate (slope) | Trend Equation | Trend | |
| Eket | −1.981 | −0.258 | 0.048 | 0.05 | Reject H0 | −0.014 | 1015.427 − 0.051 t | Significant upward trend |
| Uyo | −1.428 | −0.195 | 0.153 | 0.05 | Accept H0 | −0.007 | 1014.974 − 0.005 t | Not significant |
| Calabar | 1.797 | 0.241 | 0.072 | 0.05 | Accept H0 | 0.018 | 1011.456 + 0.020 t | Not significant |
| Ogoja | 1.767 | 0.231 | 0.077 | 0.05 | Accept H0 | 0.018 | 1011.447 + 0.020 t | Not significant |
| Station | Descriptive Statistics for Maximum Temperature (°C) | |||||
|---|---|---|---|---|---|---|
| Minimum | Maximum | Mean | Standard Deviation | Skewness | Kurtosis | |
| Eket | 30.570 | 32.610 | 31.690 | 0.440 | −0.047 | 0.383 |
| Uyo | 30.600 | 32.600 | 31.693 | 0.439 | −0.046 | 0.229 |
| Calabar | 30.200 | 31.700 | 30.990 | 0.420 | −0.107 | −1.113 |
| Ogoja | 30.610 | 33.750 | 32.346 | 0.989 | −0.413 | −1.206 |
| Station | Mann–Kendall Test for Maximum Temperature (°C) | |||||||
|---|---|---|---|---|---|---|---|---|
| Mann– Kendall Statistic (S) | Kendall Tau | p-Value (2-Tailed Test) | Alpha | Test Interpretation | Trend Rate (slope) | Trend Equation | Trend | |
| Eket | 2.303 | 0.300 | 0.021 | 0.05 | Reject H0 | 0.022 | 31.382 + 0.020t | Significant upward trend |
| Uyo | 2.351 | 0.313 | 0.019 | 0.05 | Reject H0 | 0.022 | 31.385 + 0.020t | Significant upward trend |
| Calabar | 2.956 | 0.391 | 0.003 | 0.05 | Reject H0 | 0.026 | 30.617 + 0.024t | Significant upward trend |
| Ogoja | −0.892 | −0.118 | 0.372 | 0.05 | Accept H0 | −0.038 | 33.325 − 0.063t | Not significant |
| Station | Descriptive Statistics for Soil Temperature (°C) | |||||
|---|---|---|---|---|---|---|
| Minimum | Maximum | Mean | Standard Deviation | Skewness | Kurtosis | |
| Eket | 28.420 | 29.430 | 28.910 | 0.297 | −0.089 | −0.971 |
| Uyo | 28.400 | 29.400 | 28.913 | 0.298 | −0.113 | −0.936 |
| Calabar | 26.100 | 28.900 | 27.553 | 0.852 | −0.240 | −1.367 |
| Ogoja | 26.120 | 28.910 | 27.557 | 0.851 | −0.236 | −1.375 |
| Station | Mann–Kendall Test for Soil Temperature (°C) | |||||||
|---|---|---|---|---|---|---|---|---|
| Mann– Kendall Statistic (S) | Kendall Tau | p-Value (2-Tailed Test) | Alpha | Test Interpretation | Trend Rate (Slope) | Trend Equation | Trend | |
| Eket | −0.661 | −0.088 | 0.509 | 0.05 | Accept H0 | −0.003 | 28.964 − 0.003t | Not Significant |
| Uyo | −0.701 | −0.096 | 0.483 | 0.05 | Accept H0 | −0.004 | 28.984 − 0.005t | Not Significant |
| Calabar | −0.662 | −0.089 | 0.508 | 0.05 | Accept H0 | −0.012 | 27.721 − 0.011t | Not Significant |
| Ogoja | −0.750 | −0.099 | 0.454 | 0.05 | Accept H0 | −0.01 | 27.731 − 0.011t | Not Significant |
| Station | Descriptive Statistics for Cloud Cover (Oktas) | |||||
|---|---|---|---|---|---|---|
| Minimum | Maximum | Mean | Standard Deviation | Skewness | Kurtosis | |
| Eket | 6.000 | 10.000 | 6.733 | 0.785 | 2.358 | 9.754 |
| Uyo | 7.000 | 7.000 | 7.000 | 0.000 | - | - |
| Calabar | 7.000 | 7.000 | 7.000 | 0.000 | - | - |
| Ogoja | 7.000 | 7.000 | 7.000 | 0.000 | - | - |
| Station | Mann–Kendall Test for Cloud Cover (Oktas) | |||||||
|---|---|---|---|---|---|---|---|---|
| Mann– Kendall Statistic (S) | Kendall Tau | p-Value (2-Tailed Test) | Alpha | Test Interpretation | Trend Rate (Slope) | Trend Equation | Trend | |
| Eket | 0.161 | 0.023 | 0.872 | 0.05 | Accept H0 | 0.000 | 7.003 + 0.013 t | Not significant |
| Uyo | NaN | NaN | NaN | 0.05 | Accept H0 | 0.000 | 7 + 0.000 t | Not significant |
| Calabar | NaN | NaN | NaN | 0.05 | Accept H0 | 0.000 | 7 + 0.000 t | Not significant |
| Ogoja | 1.46 | 0.197 | 0.144 | 0.05 | Accept H0 | 0.001 | 6.894 + 0.003 t | Not significant |
| Station | Descriptive Statistics for Relative Humidity (%) | |||||
|---|---|---|---|---|---|---|
| Minimum | Maximum | Mean | Standard Deviation | Skewness | Kurtosis | |
| Eket | 69.460 | 91.810 | 77.795 | 5.627 | 1.471 | 1.435 |
| Uyo | 69.000 | 92.000 | 77.500 | 5.600 | 1.537 | 1.682 |
| Calabar | 83.000 | 91.000 | 85.200 | 1.750 | 1.906 | 4.550 |
| Ogoja | 68.580 | 79.080 | 72.421 | 2.329 | 0.825 | 0.857 |
| Station | Mann–Kendall Test for Relative Humidity (%) | |||||||
|---|---|---|---|---|---|---|---|---|
| Mann– Kendall Statistic (S) | Kendall Tau | p-Value (2-Tailed Test) | Alpha | Test Interpretation | Trend Rate (slope) | Trend Equation | Trend | |
| Eket | 1.998 | 0.260 | 0.046 | 0.05 | Reject H0 | 0.105 | 74.587 + 0.207 t | Significant upward trend |
| Uyo | 1.609 | 0.219 | 0.108 | 0.05 | Accept H0 | 0.083 | 74.890 + 0.168 t | Not significant |
| Calabar | 0.315 | 0.047 | 0.752 | 0.05 | Accept H0 | 0.000 | 84.352 + 0.055 t | Not significant |
| Ogoja | 1.660 | 0.217 | 0.097 | 0.05 | Accept H0 | 0.072 | 71.334 + 0.070 t | Not significant |
| Z-Value | Sen’s Slope | p-Value | Kendall’s Tau | Lower Bound | Upper Bound | |
|---|---|---|---|---|---|---|
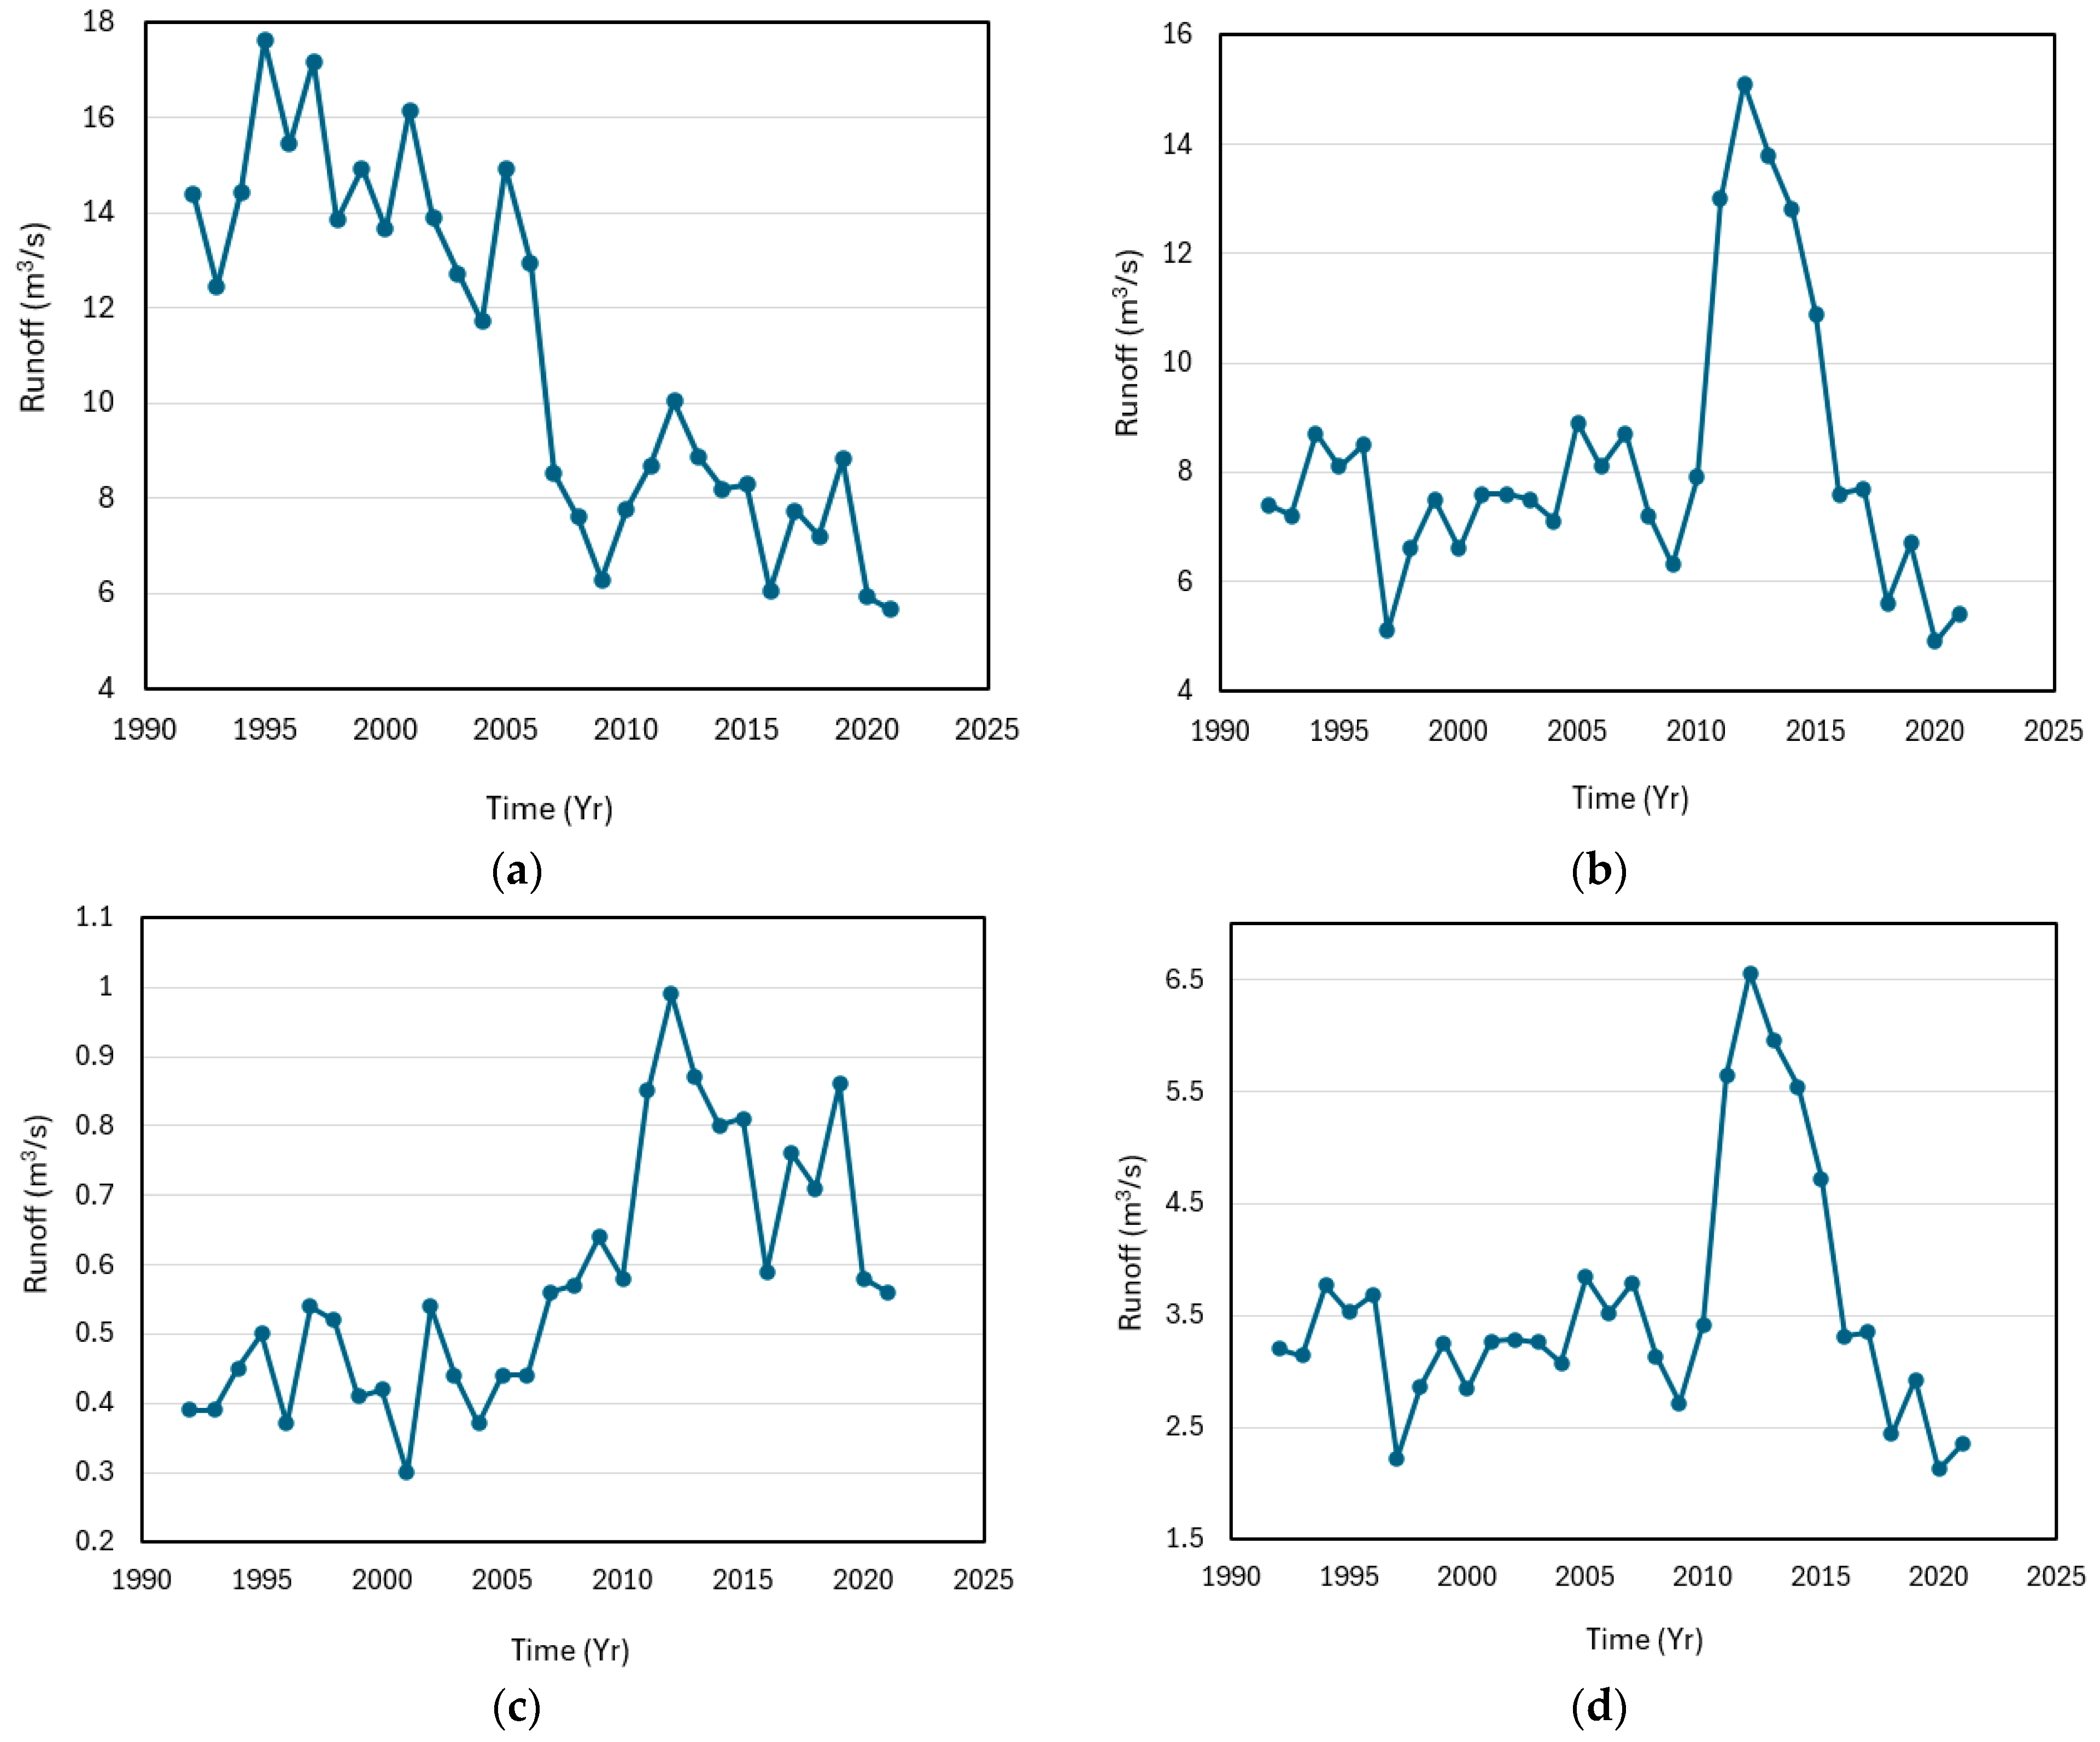
| Runoff | −4.924 | −0.367 | 0.000 | −0.637 | −3.733 | 3.126 |
| Rainfall | −4.924 | −147.833 | 0.000 | −0.637 | −3.841 | 3.268 |
| Max Temp | 2.956 | 0.026 | 0.003 | 0.382 | −2.223 | 2.405 |
| Min Temp | 2.700 | 0.022 | 0.007 | 0.347 | −2.598 | 2.688 |
| Solar Radiation | 2.039 | 0.056 | 0.041 | 0.264 | −2.958 | 2.662 |
| Sunshine Hours | −3.802 | −0.033 | 0.000 | −0.490 | −3.169 | 2.887 |
| Relative Humidity | 0.315 | 0.000 | 0.753 | 0.041 | −2.232 | 2.170 |
| Wind Speed | −2.579 | 0.000 | 0.010 | −0.292 | −1.944 | 1.948 |
| Atmospheric Pressure | 1.797 | 0.018 | 0.072 | 0.232 | −2.918 | 2.810 |
| Soil Temperature | −0.662 | −0.013 | 0.508 | −0.087 | −2.761 | 2.655 |
| Evaporation | 1.040 | 0.000 | 0.298 | 0.129 | −1.799 | 1.987 |
| Z-Value | Sen’s Slope | p-Value | Kendall’s Tau | Lower Bound | Upper Bound | |
|---|---|---|---|---|---|---|
| Runoff | 0.0000 | 0.0000 | 1.0000 | 0.0023 | −2.7424 | 2.6060 |
| Rainfall | 0.0357 | 1.2929 | 0.9715 | 0.0069 | −2.6672 | 2.6827 |
| Max Temp | 2.3511 | 0.0217 | 0.0187 | 0.3034 | −2.1906 | 2.3177 |
| Min Temp | 0.8256 | 0.0067 | 0.4090 | 0.1080 | −2.4873 | 2.4902 |
| Solar Radiation | −1.5091 | −0.0133 | 0.1313 | −0.1954 | −2.1174 | 2.1793 |
| Sunshine Hours | 1.3965 | 0.0300 | 0.1626 | 0.1816 | −2.3737 | 2.4587 |
| Relative Humidity | 1.6093 | 0.0833 | 0.1076 | 0.2069 | −1.9533 | 1.8646 |
| Wind Speed | 4.0176 | 0.0556 | 0.0001 | 0.4782 | −3.3786 | 3.5229 |
| Atmospheric Pressure | −1.4283 | −0.0067 | 0.1532 | −0.1839 | −2.1953 | 2.1232 |
| Soil Temperature | −0.7010 | −0.0043 | 0.4833 | −0.0920 | −1.8698 | 1.8650 |
| Evaporation | −1.7662 | −0.0056 | 0.0774 | −0.2230 | −1.9742 | 1.8870 |
| Z-Value | Sen’s Slope | p-Value | Kendall’s Tau | Lower Bound | Upper Bound | |
|---|---|---|---|---|---|---|
| Runoff | 0.0357 | 0.0021 | 0.9715 | 0.0069 | −2.7185 | 2.6512 |
| Rainfall | 0.0357 | 0.1071 | 0.9715 | 0.0069 | −2.6635 | 2.5762 |
| Max Temp | 2.3028 | 0.0225 | 0.0213 | 0.2989 | −2.2720 | 2.3085 |
| Min Temp | 0.7858 | 0.0073 | 0.4320 | 0.1034 | −2.4893 | 2.4537 |
| Solar Radiation | −1.3211 | −0.0123 | 0.1865 | −0.1724 | −2.3290 | 2.1309 |
| Sunshine Hours | 1.5353 | 0.0281 | 0.1247 | 0.2000 | −2.3483 | 2.3598 |
| Relative Humidity | 1.9982 | 0.1045 | 0.0457 | 0.2598 | −1.8405 | 1.9477 |
| Wind Speed | 3.7663 | 0.0553 | 0.0002 | 0.4874 | −3.4955 | 3.4722 |
| Atmospheric Pressure | −1.9813 | −0.0135 | 0.0476 | −0.2575 | −2.2568 | 2.2004 |
| Soil Temperature | −0.6607 | −0.0035 | 0.5088 | −0.0874 | −1.9401 | 1.8806 |
| Evaporation | −2.0737 | −0.0067 | 0.0381 | −0.2690 | −1.8276 | 1.9170 |
| Z-Value | Sen’s Slope | p-Value | Kendall’s Tau | Lower Bound | Upper Bound | |
|---|---|---|---|---|---|---|
| Runoff | 4.1448 | 0.0130 | 0.0000 | 0.5356 | −3.7578 | 3.7055 |
| Rainfall | 4.1391 | 4.5175 | 0.0000 | 0.5356 | −3.5570 | 3.7687 |
| Max Temp | −0.8923 | −0.0378 | 0.3722 | −0.1172 | −3.1179 | 3.4140 |
| Min Temp | 3.3725 | 0.0464 | 0.0007 | 0.4368 | −2.7336 | 2.8480 |
| Solar Radiation | −0.3926 | −0.0063 | 0.6946 | −0.0529 | −3.3308 | 3.7875 |
| Sunshine Hours | −1.0174 | −0.0067 | 0.3090 | −0.1333 | −1.9318 | 1.8760 |
| Relative Humidity | 1.6600 | 0.0722 | 0.0969 | 0.2161 | −1.8770 | 1.8460 |
| Wind Speed | −0.2677 | −0.0032 | 0.7889 | −0.0368 | −2.5429 | 2.4890 |
| Atmospheric Pressure | 1.7671 | 0.0178 | 0.0772 | 0.2299 | −2.9515 | 2.8078 |
| Soil Temperature | −0.7496 | −0.0100 | 0.4535 | −0.0989 | −2.7827 | 2.6644 |
| Evaporation | 1.5561 | 0.0026 | 0.1197 | 0.2023 | −1.9251 | 1.8840 |
| Location | Season | Slope (mm/Year) | ||
|---|---|---|---|---|
| Eket | Dry | 5 | 0.9693 | 0.0524 |
| 7 | 0.7351 | 0.0572 | ||
| 9 | 0.269 | 0.0131 | ||
| Rainy | 5 | 9.1309 | 0.0527 | |
| 7 | 3.1444 | 0.0108 | ||
| 9 | 5.7903 | 0.0942 | ||
| Ogoja | Dry | 5 | 0.5047 | 0.0274 |
| 7 | 0.6132 | 0.0477 | ||
| 9 | 0.6106 | 0.0902 | ||
| Rainy | 5 | 9.5191 | 0.0688 | |
| 7 | 3.3195 | 0.0141 | ||
| 9 | 1.9397 | 0.0133 |
| Location | Season | Slope (mm/Year) | ||
|---|---|---|---|---|
| Eket | Dry | 5 | 0.0165 | 0.0526 |
| 7 | 0.0126 | 0.0594 | ||
| 9 | 0.0047 | 0.0138 | ||
| Rainy | 5 | 0.1566 | 0.0535 | |
| 7 | 0.0548 | 0.0113 | ||
| 9 | 0.0999 | 0.0965 | ||
| Ogoja | Dry | 5 | 0.0015 | 0.0279 |
| 7 | 0.0016 | 0.0403 | ||
| 9 | 0.0036 | 0.2996 | ||
| Rainy | 5 | 0.0278 | 0.0685 | |
| 7 | 0.0097 | 0.0141 | ||
| 9 | 0.0166 | 0.0942 |
Disclaimer/Publisher’s Note: The statements, opinions and data contained in all publications are solely those of the individual author(s) and contributor(s) and not of MDPI and/or the editor(s). MDPI and/or the editor(s) disclaim responsibility for any injury to people or property resulting from any ideas, methods, instructions or products referred to in the content. |
© 2024 by the authors. Licensee MDPI, Basel, Switzerland. This article is an open access article distributed under the terms and conditions of the Creative Commons Attribution (CC BY) license (https://creativecommons.org/licenses/by/4.0/).
Share and Cite
Agbiji, N.M.; Agunwamba, J.C.; Eshiet, K.I.-I.I. Trend Analysis of Climatic Variables in the Cross River Basin, Nigeria. Geosciences 2024, 14, 172. https://doi.org/10.3390/geosciences14060172
Agbiji NM, Agunwamba JC, Eshiet KI-II. Trend Analysis of Climatic Variables in the Cross River Basin, Nigeria. Geosciences. 2024; 14(6):172. https://doi.org/10.3390/geosciences14060172
Chicago/Turabian StyleAgbiji, Ndifon M., Jonah C. Agunwamba, and Kenneth Imo-Imo Israel Eshiet. 2024. "Trend Analysis of Climatic Variables in the Cross River Basin, Nigeria" Geosciences 14, no. 6: 172. https://doi.org/10.3390/geosciences14060172