Article

Elemental Geochemistry on Paleoenvironment Reconstruction: Proxies on Miocene-Pliocene of Marine to Fluvial Sediment in Serpong, Banten, Indonesia

1
Research Center for Nuclear Material and Radioactive Waste Technology, National Research and Innovation Agency (BRIN), South Tangerang 15314, Indonesia
2
Faculty of Geological Engineering, Padjadjaran University, Bandung 45363, Indonesia
3
Research Center for Safety, Metrology, and Nuclear Quality Technology, National Research and Innovation Agency (BRIN), South Tangerang 15314, Indonesia
4
Research Center for Nuclear Beam Analysis Technology, National Research and Innovation Agency (BRIN), South Tangerang 15314, Indonesia
5
Geological Engineering Department, Universitas Trisakti, Jakarta 11440, Indonesia
*
Author to whom correspondence should be addressed.
Geosciences 2024, 14(7), 189; https://doi.org/10.3390/geosciences14070189
Submission received: 21 May 2024 / Revised: 26 June 2024 / Accepted: 11 July 2024 / Published: 13 July 2024
(This article belongs to the Section Geochemistry)

Abstract

:
Research of the depositional environment using geological mapping, petrography, gamma-ray (GR) log, palynology, and foraminifera fossils of the Bojongmanik Formation has led to the formation of several different conclusions about the transition to the marine environment, which are attractive to revisit. The expected results of this research are to determine the paleoenvironment of the Bojongmanik and Serpong Formations based on elemental geochemistry, the development of paleoenvironment proxies based on portable X-ray fluorescence (pXRF) in fluvial to transitional environments studies, and the contribution of paleoenvironment analysis to GR-log facies interpretation. The research methodology starts with GR-log facies analysis, Pearson’s correlation, paleoenvironment analysis based on elemental affinity and elemental ratio, and comparing the paleoenvironment with GR-log-based facies. The paleoenvironment analysis based on elemental geochemistry resulted in the Bojongmanik Formation in the research area deposited at the tidal point bar, lagoon, and shoreface, while the Serpong Formation was deposited at the fluvial point bar and floodplain. Compared to previous research, the Bojongmanik Formation in the research area could be stratigraphically related to the upper Bojongmanik Formation. Proxies based on elemental geochemical affinities of carbonate-associated, carbonate-productivity, terrigenous-associated elements, and redox-sensitive trace elements show contrast changes between facies. Proxies based on the specific ratio show a detailed paleoenvironment for paleoclimate (Sr/Cu), paleosalinity (Sr/Ba), paleoredox (Cu/Zn), paleo-hydrodynamics and water depth (Zr/Rb and Fe/Mn), sediment provenance (Cr/Zr), and siliciclastic-dominated (Zr + Rb)/Sr. Adding a geochemistry element-based paleoenvironment analysis benefits from a more specific justification for GR-log facies interpretation.

1. Introduction

The subsurface geological formation of the research area in Serpong comprises the Bojongmanik and Serpong Formation. The Bojongmanik Formation has previously been studied for its facies and sedimentation characteristics using several methods, including geological mapping, petrography, gamma-ray (GR) log, palynology, and foraminifera fossil [1,2,3,4,5,6].
Various depositional environments were examined through different methodological approaches in the Bojongmanik Formation distribution. The foraminifera-based research in the Bojongmanik to Leuwiliang area resulted in the examination of the outer neritic to delta plain [4]. The palynology-based research in the Bojongmanik to Leuwiliang area indicates that the area is a back mangrove. [1]. Detailed stratigraphic prospection in the Jasinga to Leuwiliang area shows that the area is a beach to a lagoon environment [7]. In the Maja area, based on foraminifera studies, the area is in the distal offshore to upper shoreface [8]. The interpretation of GR-log in the Serpong area shows that the area is a shallow marine to a lagoon [6] (Figure 1). These pieces of research resulted in debated conclusions on the depositional environment, making it attractive to be researched further, especially regarding the existence of a—deeper-than-known—depositional environment of middle to outer neritic zones or proximal to intermediate offshore.
Unconformably above the Bojongmanik Formation, the Serpong Formation was deposited in a fluvial environment. Although dispersed in distant locations, the depositional environment of the Serpong Formation has not been widely studied, including using an elemental geochemistry approach.
In this research, we applied elemental geochemistry based on portable X-ray fluorescence (pXRF) to reconstruct the paleoenvironment. The expected results of this research are to determine (1) the paleoenvironment of the Bojongmanik and Serpong Formations based on elemental geochemistry, (2) the development of paleoenvironment proxies based on pXRF in fluvial to transitional environments studies, and (3) the contribution of paleoenvironment analysis to GR-log facies interpretation.

2. Geological Setting

In the scheme of tectonic elements in West Java, the research area is located between the Banten Block and the Northwest Sea Java Basin. The tectonic elements of West Java generally consist of two patterns, namely, the North–South Pattern, which is distributed in the north, and the East–West Pattern, in the southern area [7,9]. In terms of the basin, the Bojongmanik Formation is located in the Rangkasbitung Basin, which is part of the Banten Depression. It is formed by a normal fault and filled mostly by marine deposits [4].
The geological history of the research area begins in the Early Miocene Period when West Java began to be inundated, and the limestone of the Rajamandala Formation that formed starting in the Oligocene was covered by volcanogenic material [10]. In the Middle Miocene, the North West Java area was an open sea while most of the southern part had already become land and some transitional seas. In the Banten area, the Bojongmanik Formation was deposited at this time.
The change in depositional environment facies can be well observed in the Leuwiliang area where the Bojongmanik Formation, which is a transitional marine depositional environment in the west, changes to the Cibulakan and Parigi Formations, which are open marine environments in the east. In the Late Miocene, the ocean in the northern part of West Java began to become shallower, and the Banten area is thought to have become land. In the Pliocene, volcanic activity in the Banten began. Eruptions caused the formation of deposits of the Genteng Formation, which occurred during the Pliocene to Early Pleistocene [7].
The geology of the research area covers several formations, which are (from old to young) the Bojongmanik Formation, Genteng Formation, Serpong Formation, Alluvial Fan, Young Volcanic Rocks Formation, and Alluvium [11,12]. However, this research focuses on the Bojongmanik and Serpong Formations (see Figure 1). The Bojongmanik Formation, composed of sandstone and mudstone with limestone inserts, has a thickness estimated to be at least 350 m, as shown in its type location [7]. The Bojongmanik Formation is also known as the impermeable bedrock for the Jakarta Basin [13]. The Serpong Formation is composed of conglomerate, sandstone, siltstone, claystone with plant remains, claystone conglomerate, and claystone tuff. Based on its position, stratigraphically, it overlies the Bojongmanik Formation and Genteng Formation and is overlain by young volcanic rocks. Based on its rock characteristics, sedimentary structure, and the shape of its distribution along the river, this formation is thought to have been deposited in an old river with a weaving and levee pattern and partly deposited in a swamp environment [12].

3. Materials and Methods

Portable X-ray fluorescence (pXRF) is an analytical tool that offers many advantages to other methods of elemental geochemical acquisition. It has long been used to measure elemental geochemistry in sediments and trace metal concentrations in algae, archaeological remains, contaminated soils, compost, wetland sediments, and paleolimnological studies. Another critical factor is the minimal sample preparation required to acquire data [14]. The X-ray emitted from a sample can offer rapid qualitative and quantitative rock compositional information and lithological discrimination [15,16,17]. An essential advantage of pXRF instruments is the availability to re-analyze and re-test specimens as needed, creating a reflexive methodology due to the ability to review data [18]. In modern or paleoenvironment studies, pXRF measurement has also been beneficially applied [19,20].
The drillhole DH-11 in the Puspiptek-Serpong was used as the primary material for this research. It is also completed with GR geophysical log and rock core. A “point and shoot” geochemical element measurement was conducted by pXRF on the DH-11 drillcore surface, along its axis, to create an elemental profile. If a clay blanket exists, it was first removed to prevent mixed-up rock material. The surface of the cores was made smooth before measurement to minimize the effect of surface roughness. It was also noted and cautioned during measurements and subsequent analyses that heterogeneity is difficult to control due to sediment grain size and stratification [21,22]. In general, matrix effects will also affect the measurement results, but, in some cases, a powdered drill core does not significantly improve accuracy compared to an unprepared drill core [22].
For creating a high-resolution paleoenvironment analysis, pXRF was measured at 10 cm intervals, resulting in 982 measurements. Another benefit of analyzing with denser data is to overcome the issue of uncertainty [23]. The pXRF measurement was performed using an Olympus Vanta C-series. The instrument operation consisted of three beams running sequentially. Each beam was set to scan a sample for 30 s (90 s per sample) [24].
To further ensure the device’s performance in terms of precision and accuracy, the Certified Reference Material (CRM) of OREAS 74B and OREAS 460 were measured 20 times. After that, the results were compared to the high and low of three standard deviations (3SD). It was noticed that the device produced high precision on S, K, Ti, Cr, Mn, Fe, Ni, and Cu for OREAS 74B, and S, K, Ca, Ti, Fe, Sr, V, Cr, Y, and Zr for OREAS 460. In accuracy, Ca, Zn, As, Rb, and Pb produced high-accuracy measurements for OREAS 74B and Ni, Zn, Mn, Rb, Pb, and As for OREAS 460.
The first research stage is electrofacies interpretation, based on the previous DH-12 interpretation, located 30 m from DH-11 [6]. The second stage is a correlation analysis of GR and elemental geochemistry. The third stage is paleoenvironment reconstruction from geochemistry and comparison with a GR-log-based interpretation.
Electrofacies analysis was used to infer gross depositional environments of the sand bodies based on GR-log trends [25]. The acquisition of GR-log was conducted using Mountsopris MGX-II well-logging devices. GR-log itself has been long used in lithology and depositional environment analysis. It increases with shale content due to potassium, for example, in marine shale. GR sources are uranium, thorium, and potassium, which are also present in chalk, gypsum, marl, calcareous sandstone, limestone, beech deposits, and red clay soil. Therefore, GR trends could be interpreted on subsurface sedimentary facies or electrofacies analysis [26]. A facies is a body of sedimentary rock with specific characteristics, including lithology, fossils, and hydraulic properties [27]. Electrofacies analysis from GR is performed by two successive procedures: first, clustering the data set into electrofacies units, and then classification and assigning geological meaning of depositional environments [25,28].
The correlation of GR and elemental geochemistry aims to analyze the relationship between them. Pearson’s coefficient is used for correlation analysis in this research. It has an output range of −1~1. Where 0 represents no correlation, negative represents negative correlation, and positive represents positive correlation [29].
Based on geochemical affinities, elemental compositions are principally divided into four groups, which are (1) carbonate-associated elements, (2) carbonate-productivity proxies, (3) terrigenous-associated elements, and (4) redox-sensitive trace elements [30]. The paleoenvironmental geochemistry was addressed based on the paleoclimate, paleosalinity, paleoredox, paleo-hydrodynamics, sediment provenance, and siliciclastic-dominated [31,32].
The climate-sensitive trace elements strontium (Sr) and copper (Cu) in paleoclimate analysis can reflect paleoclimate conditions. The Sr/Cu ratio can be used to evaluate paleoclimate conditions, with a Sr/Cu ratio higher than 5 for dry and hot climates and 1–5 for warm and humid climatic conditions [33]. Paleosalinity is the water salinity recorded in ancient sediments. It provides crucial information for analyzing the characteristics of the sedimentary environment in geological history. The Sr/Ba ratio is a reliable proxy for estimating paleosalinity, except in carbonate rocks, where Sr could be enriched and affect the results. Usually, Sr/Ba ratios >0.5 indicate a marine environment, 0.2–0.5 indicate brackish water, and <0.2 indicates a terrestrial environment dominated by freshwater [32].
In paleoredox analysis, redox-sensitive elements, e.g., V, U, Fe, Mn, Co, Cr, and Ni, indicate the redox characteristics of the depositional environment because they do not move after deposition and burial. This fact makes these redox-sensitive elements an ideal proxy for interpreting paleoredox conditions of sedimentary rocks. The Cu/Zn ratio defines the paleoredox environment, in which high Cu/Zn ratios reflect reducing depositional conditions and low Cu/Zn values indicate oxidizing depositional conditions [32,34]. The Cu/Zn ratio is another index of redox conditions; the lower the ratio is, the more anoxic the environment. A Cu/Zn ratio less than 0.21 represents an anoxic environment, a Cu/Zn ratio between 0.21 and 0.38 represents a weak anoxic environment, a Cu/Zn ratio between 0.38 and 0.5 represents a transition from a weak anoxic to a weak oxic environment, a Cu/Zn ratio between 0.5 and 0.63 represents a weak oxic environment, and a Cu/Zn ratio greater than 0.63 represents a relatively oxic environment [35]. The redox-sensitive trace elements (e.g., V, Cr, Ni, Cu, and Zn) behave differently under different redox conditions, and they are enriched under anoxic (oxygen-free) sediment pore and bottom water conditions [36].
In paleo-hydrodynamics analysis, a lower Zr/Rb ratio indicates greater water depth and weaker hydrodynamic pressure. A high Zr/Rb ratio indicates shallow water and strong hydrodynamic pressure. A Zr/Rb ratio <1.25 commonly shows a weak paleo-hydrodynamic regime, 1.25–4.76 indicates intermediate to strong hydrodynamic pressure, and >4.76 indicates a strong hydrodynamic regime. Fe and Mn major elements possess different characteristics in the transportation and sedimentation process in the sedimentary basin due to their chemical properties. The Fe element can easily oxidize and precipitate, and Mn is a major stable element that can be transferred to the deep water region. Since the Fe/Mn ratio has a strong relationship with water depth, it can be used to classify paleo-water depth, in which higher ratios indicate shallower water conditions [32].
Sediment provenance analysis is determined by the ratio of two conservative elements, Cr/Zr. Higher Cr/Zr ratios indicate higher contributions from mafic sources comparatively to felsic ones [37]. In siliciclastic-dominated analysis, the (Zr + Rb)/Sr indicates variations in grain size on the fine-grained siliciclastic sedimentary succession [38]. The conclusions of the geochemical proxies to be used in the geochemical paleoenvironment reconstruction are shown in Table 1.

4. Results

4.1. GR-Log Facies Analysis

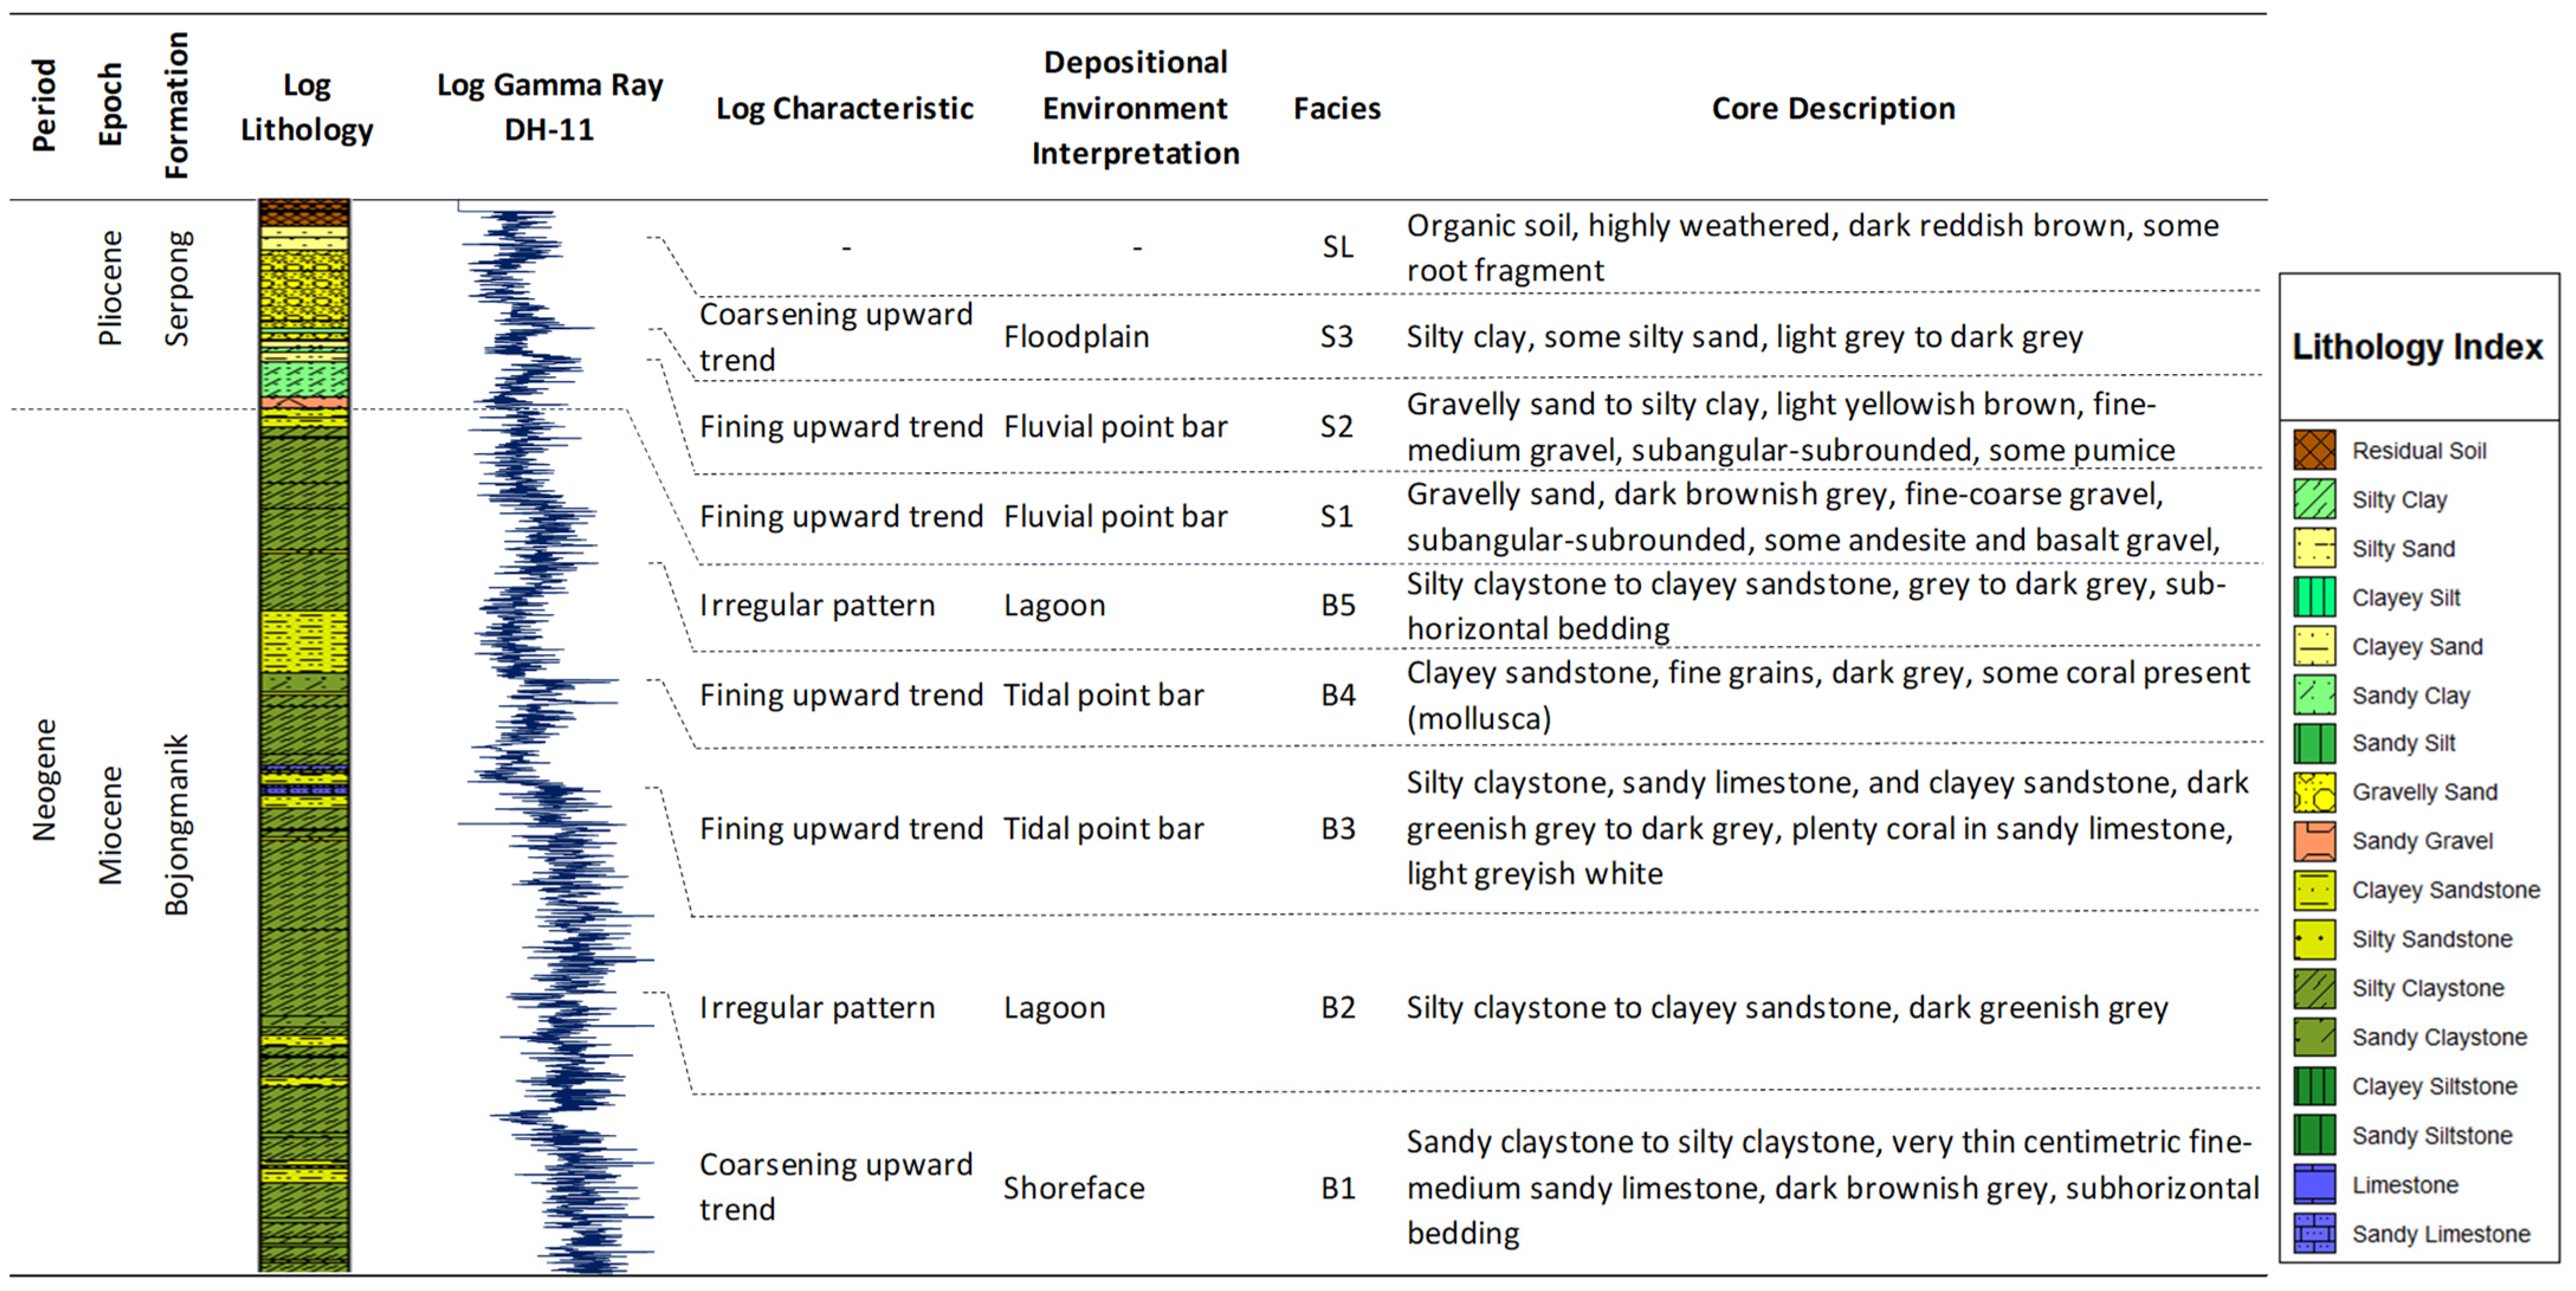
An earlier facies analysis conducted in the area concluded that the Bojongmanik Formation was deposited on a lagoonal marine environment with a weak wave influence. Log GR shows the shape of the funnel, serrated, and symmetry, indicating tidal point bar, lagoon, and shoreface facies. The basin sedimentation direction of the Bojongmanik Formation was interpreted relative to the north. Serpong Formation was deposited on a meandering river system composed of a point bar deposit, crevasse splay, and floodplain deposit [6]. A similar analysis of the facies unit of the DH-11, which is located 30 m from the previously analyzed DH-12, shows a clear trend in units from B1 to B5 in the Bojongmanik Formation, and S1 to S3 in the Serpong Formation. The trend comprises coarsening upward, fining upward, and irregular patterns (Figure 2).
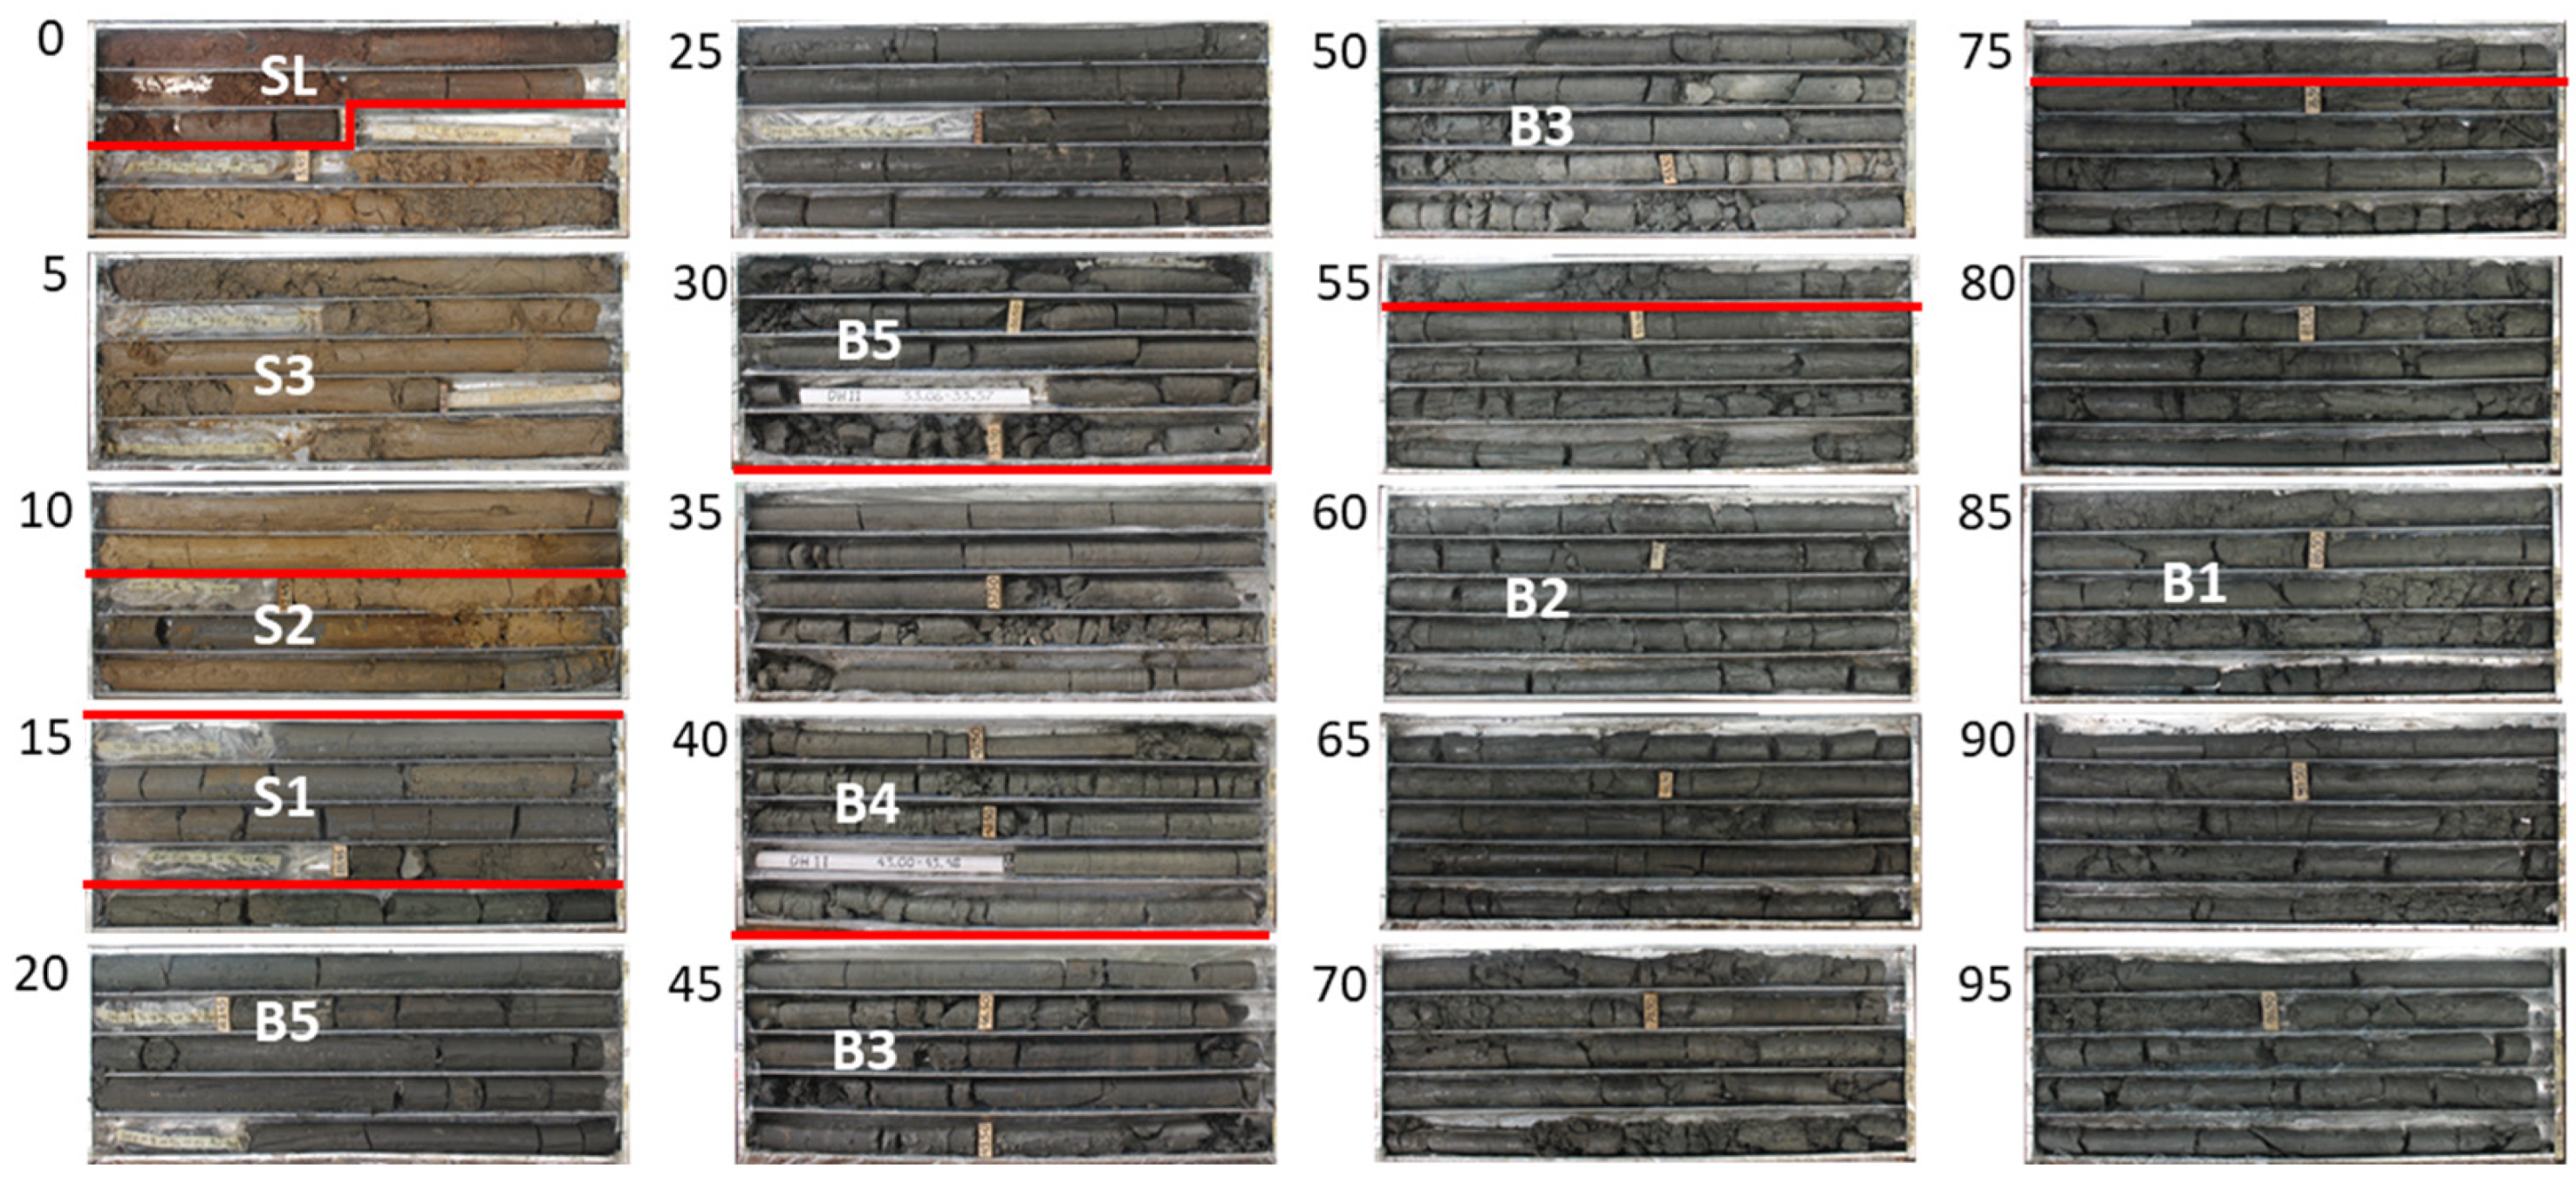
The Bojongmanik Formation shows a dark greenish-grey to dark-grey color. Serpong Formation generally has characteristics of light grey, except for the lowest S1 unit, which contains dark clay and might have resulted from the erosional process of its bedrock of the Bojongmanik Formation. Topsoil (SL) is highly weathered and is excluded from analysis due to its already undergoing oxidation processes that might leach or precipitate some other elements (Figure 3).

4.2. Geochemistry Paleoenvironment Analysis

Major and trace elements that have considerable values for paleoenvironment analysis are S, K, Ca, Ti, V, Cr, Fe, Mn, Ni, Cu, Zn, As, Rb, Sr, Y, Zr, Nb, Ba, and Pb. Furthermore, they were selected again to fit the purpose of paleoenvironment analysis based on elemental affinity and elemental ratio.

4.2.1. Correlation of GR and Elemental Geochemistry

The Pearson correlation was conducted to analyze the relationship between elements and GR. Based on the results of the analysis, a moderate correlation relationship exists between S with K and Ba, K with Ca, Ca with Ti and Cr, Ti with Zr, Pb and GR, V with Ba, Cu with Zn, Rb with GR, and Ba with GR. Strong correlation relationships exist between S with V and Cr with V. A very strong correlation relationship exists between S with Cr and Rb with K. The very strong correlation between S with Cr can be explained by the similarity as carbonate associations, and between Rb with K can be explained by the similarity as terrigenous-associated elements.
The correlation between GR and K is very low at 0.25. This number indicates a significant variation in the other radioactive elements of U and Th, as the other GR sources. However, the values of U and Th were mostly under the detection limit. The elements that correlate with GR are Ti, Rb, and Ba, with a moderate correlation relationship (Table 2).

4.2.2. Paleoenvironment Analysis Based on Elemental Affinity

The analysis of elemental geochemical affinities is divided into four groups, which are (1) carbonate-associated elements (Ca), (2) carbonate-productivity proxies (S and Sr), (3) terrigenous-associated elements (K, Fe, Ti, Cr, Mn, and Rb), and (4) redox-sensitive trace elements (Cu) [30]. Overall, the large number and close interval of measurements significantly aid in the qualitative interpretation of paleoenvironment reconstructions in terms of contrast or smooth elemental change gradation.
A direct comparison of elemental geochemistry with previous electrofacies unit interpretation is then conducted to describe facies units based on elemental geochemistry. Ca represents the limestone lithology and is elevated in the facies unit of B3 with a Ca content of up to 42.5% and B4 with a Ca content of up to 18.8%. They have sharply contrasted values to other marine facies units, which are only 3.1% on average.
As one proxy of carbonate-productivity, S displays an influence of marine deposition from the lowest unit of B1 to S1 in the fluvial deposit. The S content is from 0.3% to 21.9%. The base erosional process during fluvial deposition is interpreted as the reason for high S in the fluvial deposit. In the upper fluvial unit of S2 and S3, the S content averaged 0.02%. Another proxy of carbonate-productivity, Sr, shows a clear elevated trend boundary of the carbonate-productivity between the B3 and B5 units, while it is significantly depleted in B1 and B2. Sr is 138–7770 ppm in this zone, averaging 1934 ppm. In fluvial S1 to S3, the Sr averaged 170 ppm, and in B1 to B4 it averaged 515 ppm.
From the perspective of terrigenous-associated elements, K has a decreased upward profile, which characterizes the fluvial sediment of the S1 to S3 unit. It has 2.3% at the bottom and 0.2% at the top, with 1.2% on average. K is very low in the area from B3 to B5 and high in B1 and B2. In the area from B3 to B5, K ranged from 0.04–1.45%, with an average of 0.36%. In the area from B1 to B2, K ranged from 0.06–1.78%, with an average of 0.99%. Fe, in the unit of B5, also increased by 2.26–19.5%, with an average of 6.50%. Ti has the same trend in B5, with 0.12–0.50% and an average of 0.31%. In the bottom profile, from B1 to B2, Ti also enriched from 0.16–0.80%, with an average of 0.43%.
Cr shows no clear trend to differ facies units except between fluvial and marine deposits. Mn is enriched in the lower zone of B2 with a range of 62–31,913 ppm and an average of 2269 ppm. Generally, Mn is very low, at nearly 0%. Rb shows a contrast profile, enriched in the area from B1 to B2, with a range of 20–86 ppm and an average of 57 ppm. It was depleted in the area from B3 to B5, with a range of 4–61 ppm and an average of 21 ppm, and enriched in the area from S1 to S3, with a range of 24–114 ppm and an average of 57 ppm. Similar to K, Cr also clearly differed in the facies units of B1 and B2.
From the perspective of redox characterization, Cr is enriched in marine deposits in the area from B1 to B5 due to the presence of the same redox conditions. It has a very similar profile to S, as analyzed above, with a correlation coefficient of 0.85 (see Table 2). On the contrary, Cu is enriched in fluvial deposits in the area from S1 to S3 with a range of 11–1088 ppm and an average of 83 ppm (Figure 4).

4.2.3. Paleoenvironment Analysis Based on Elemental Ratio

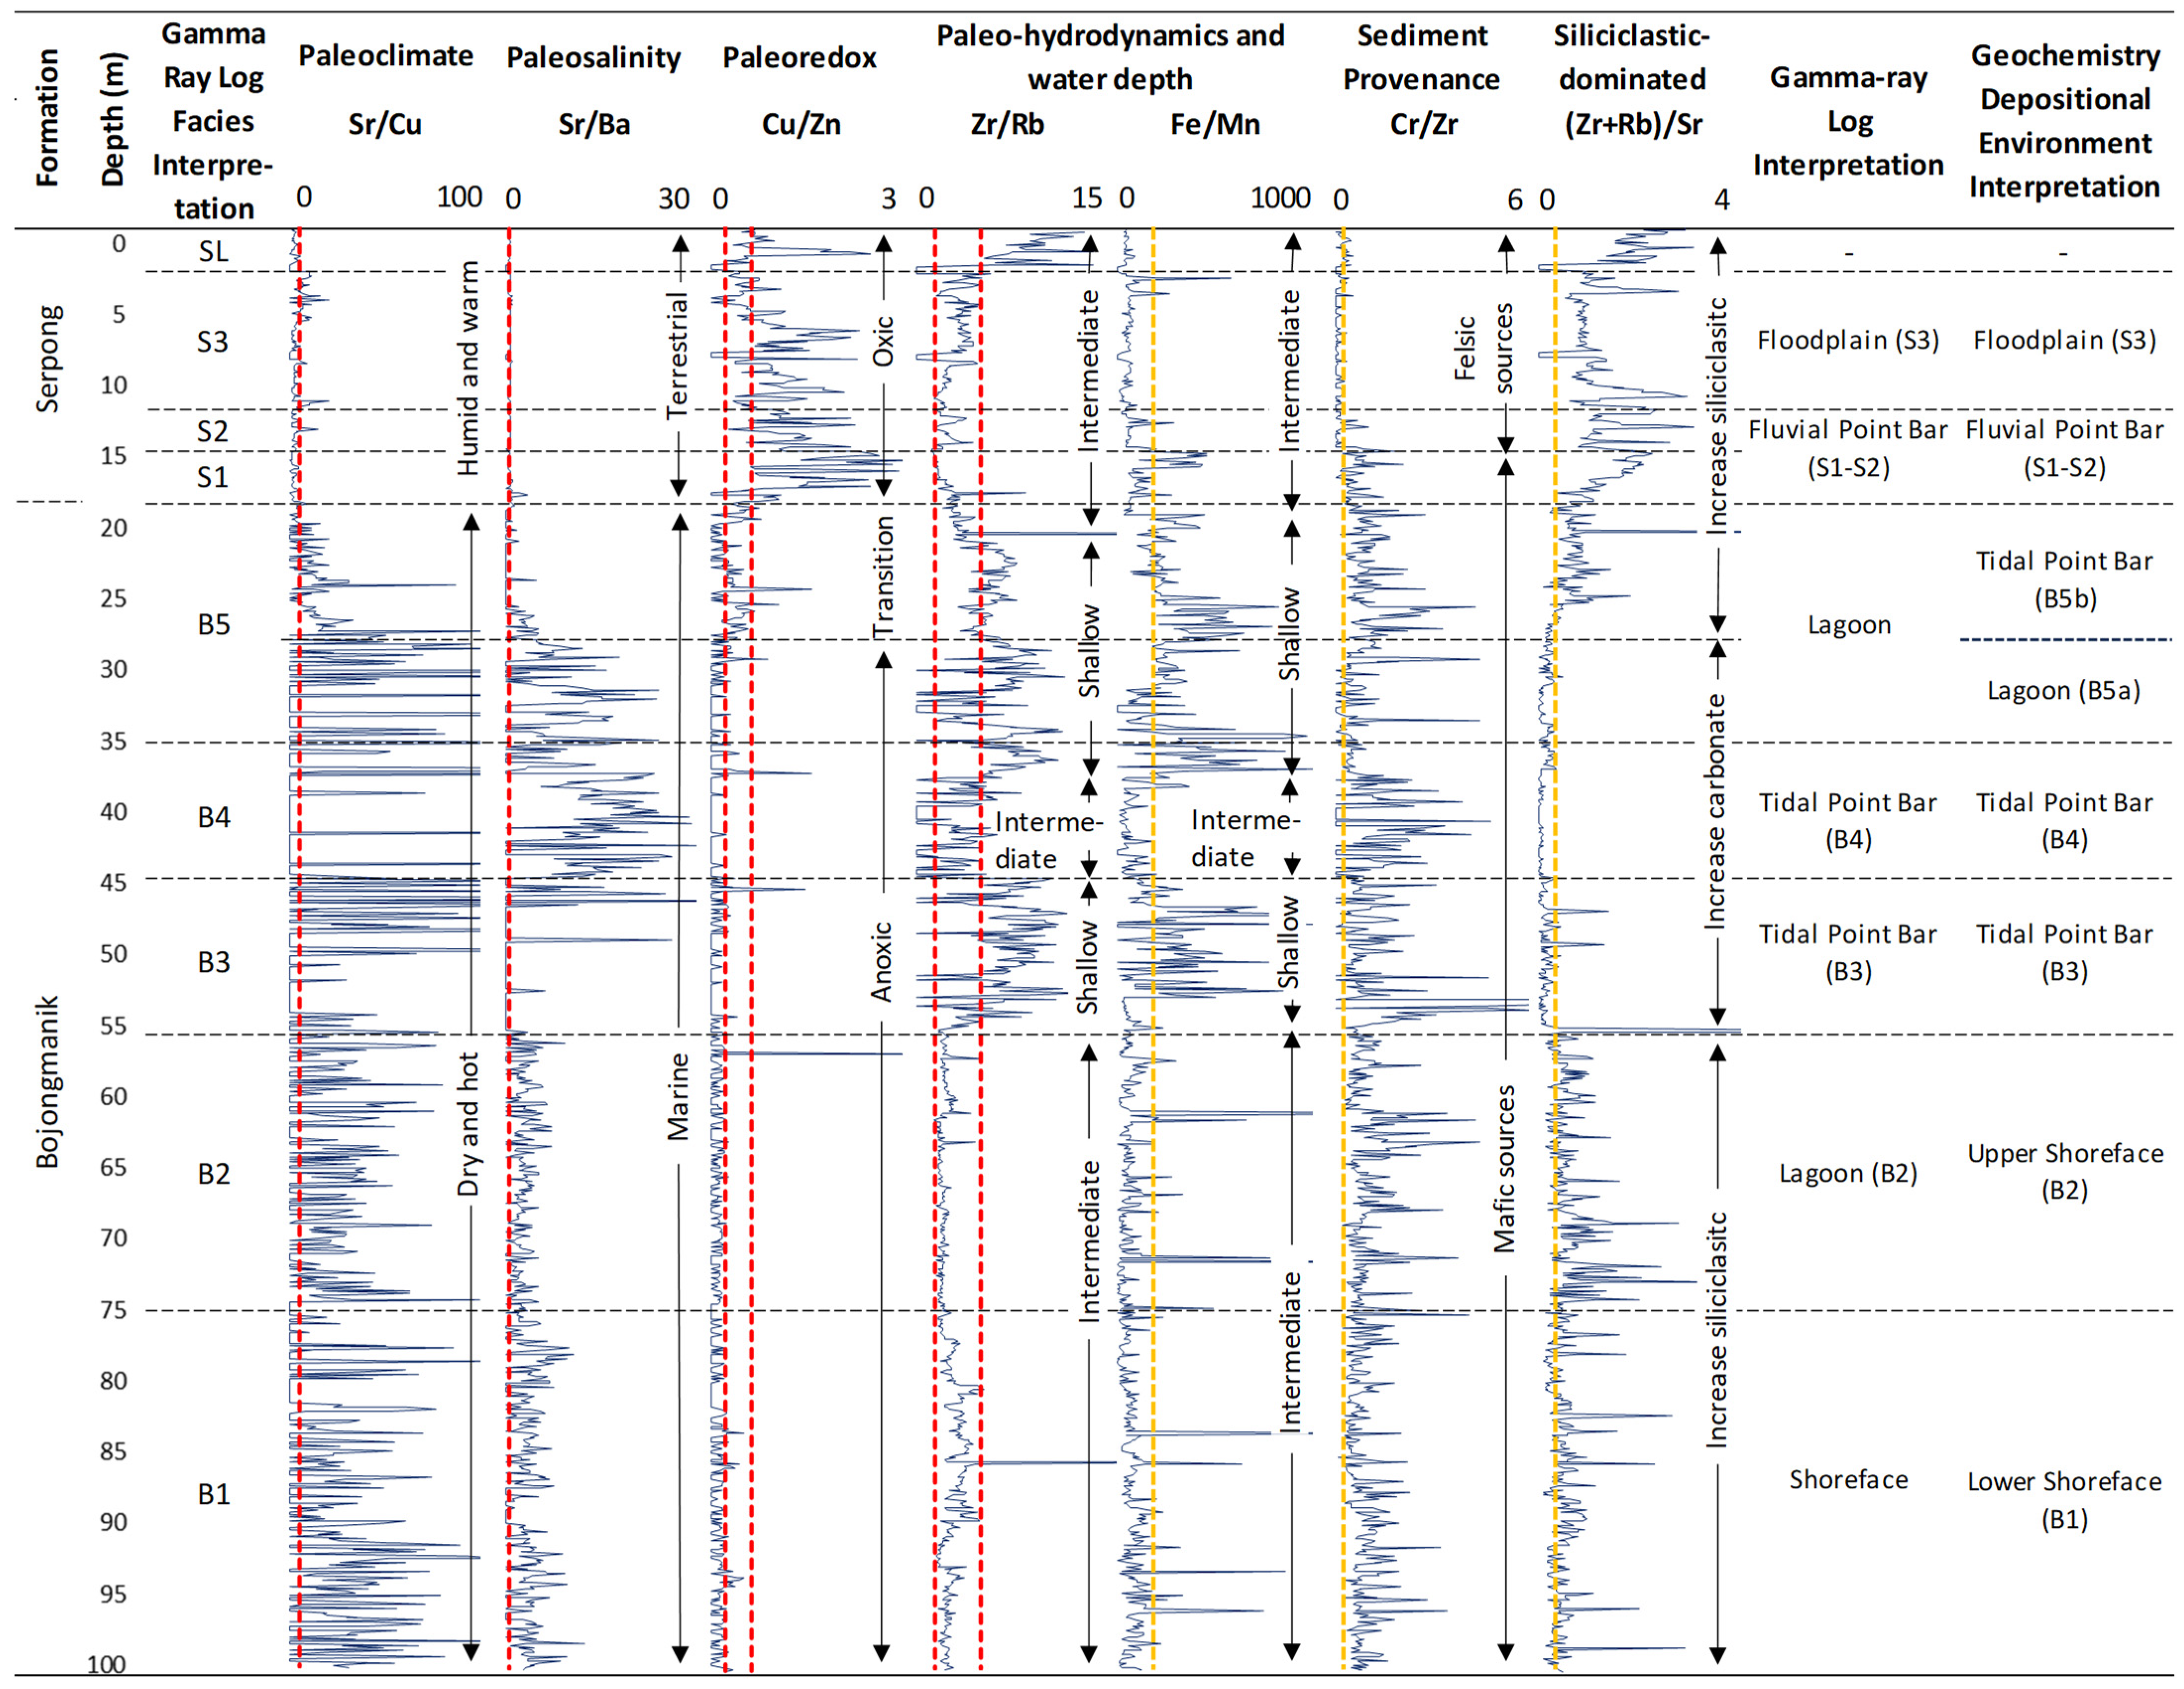
Further analysis of the paleoenvironment reconstruction using the quantitative elemental ratio is shown in Figure 5. The paleoclimate was analyzed by Sr/Cu, paleosalinity by Sr/Ba, paleoredox by Cu/Zn, paleo-hydrodynamics and water depth by Zn/Rb and Fe/Mn, sediment provenance by Cr/Zr, and siliciclastic dominated by (Zr + Rb)/Sr. In the paleoclimate analysis, the fluvial deposit in the area from S1 to S3 lies under a Sr/Cu ratio of 5 and indicates a humid and warm climate, while the marine deposit in the area from B1 to B5 has a Sr/Cu ratio of more than 5, which indicates a dry and hot climate.
Considering paleoredox proxies, threshold values are primarily applied in marine shale and mudrock, although proxies should be used with caution to evaluate sandstone and limestone. In some cases, paleoredox analysis in shales must be taken cautiously due to the hydrogenous signal [39]. Previous studies applied a high ratio of Cu/Zn to reflect reducing depositional conditions, whereas low Cu/Zn values reflected oxidizing depositional conditions [32]. Nevertheless, in this research, the condition is vice-versa. Low Cu/Zn reflects an anoxic environment. The Bojongmanik Formation generally is black shale deposition, indicating an anoxic environment. This formation is a typical deposit of the Banten Block, especially the Rangkasbitung basin, deposited in a semi-restricted composed of localized biostromes on a clastic shelf in the intra-arc region [7,40,41]. Applying the Cu/Zn threshold from rich organic matter sediments seems more appropriate, which resulted in the fluvial deposit of S1–S3 being oxic, the marine deposit of B5 being a half transition and half anoxic, and the marine B1–B4 being anoxic [35].
Zr/Rb and Fe/Mn had relatively consistent results for the paleo-hydrodynamics and water depth analysis. After the comparison of those two proxies, the Fe/Mn ratio of 200 is applied as a threshold value between intermediate and shallow water. Fluvial deposits of S1–S3 are in intermediate water depth, the marine area from B3 to B5 in shallow water and partial intermediate, and the area from B1 to B2 in intermediate water depth.
Sediment provenance analysis is determined by the ratio of two conservative elements, Cr/Zr. A low ratio of Cr/Zr in the area from S2 to S3 indicates a felsic source and a high ratio in S1 indicates mafic sources. A high ratio of B1 to B5 indicates a mafic source. The ratio of 0.5 Cr/Zr is applied in this research as the threshold of mafic and felsic sources. The (Zr + Rb)/Sr ratio reflects the balance between clastic and carbonate components, sometimes measuring the sediment’s biogenic content. High values are typically found in samples with fewer carbonates [42]. The value of 0.5 of (Zr + Rb)/Sr is applied in this research as the threshold between the increase in carbonates and the increase in siliciclastic. Zones of high carbonate are in units of B3, B4, and half of B5. Other facies units are generally siliciclastic dominated.

5. Discussion

Research on foraminifera to reconstruct the paleoenvironment from west to east in Bojongmanik to Jasinga to Leuwiliang resulted in the conclusion that the lower part of the Bojongmanik Formation is dominantly deposited at 100–200 m or outer neritic (in the area of Bojongmanik to Jasinga) and 100–80 m or middle neritic (in Leuwiliang). After the regression, the upper Bojongmanik succession was mainly deposited in the transitional to edge neritic, and a part of sediments was formed as upper to lower delta plain facies [4]. Research on palynology in Bojongmanik and Leuwiliang on the Sandstone Unit of Bojongmanik Formation resulted in the conclusion of the back mangrove depositional environment [1].
Based on the geological prospection in the Jasinga to Leuwiliang, the lower part of the Bojongmanik Formation shows the depositional environment of the sand bar in a brackish water environment. The middle part indicates a lagoon deposit, and the upper part indicates a river sandbar deposit and floodplain deposits. Thus, it can be interpreted that the Bojongmanik Formation was deposited in the transition environment, on the beach to the lagoon [7].
Research on the planktonic and benthonic foraminifera content of the Bojongmanik Formation in the Maja shows the depositional environment of shallow marine. It consists of a littoral edge Neritic to middle Neritic (10–180 m). Planktonic and benthic foraminifera in the Bojongmanik Formation were also reviewed to understand and show the transitional environment (3–80 m). According to bathymetric ranges for continental shelf, the depositional environment in the N11-N13 can be interpreted as distal offshore to lower shoreface, and, in N13–N14, changes to intermediate offshore to upper shoreface [8,43].
In Serpong, from a GR-log and lithology interpretation, the Bojongmanik Formation is interpreted to have formed in a shallow marine–lagoonal environment with a weak wave influence. Above the Bojongmanik Formation, the Serpong Formation was deposited unconformably in a meandering river depositional environment composed of point bar, crevasse splay, and floodplain deposits [6].
Elemental geochemical analysis in paleoenvironment reconstruction analysis provides significant information. The information could be used as a threshold value or a log pattern. Based on GR-log interpretation, the research area comprises shoreface B1, the tidal point bar to the lagoon of B2–B4, and the fluvial deposits fluvial point bar and floodplain of S1–S3. Further, elemental geochemistry provides information on the paleoenvironment. Thus, the depositional environment interpretation is well improved.
Based on geochemical affinity indicators, facies B1 and B2 can be clearly distinguished from the terrigenous associate proxies of K, Ti, and Rb. Although they are both clastic sediments, there are apparent differences in the element content. In addition, the stable element Mn shows a decrease upward. The highest Mn levels are at the boundary between the two facies (see Figure 4). Based on the paleosalinity proxy of Sr/Ba, the boundary between B1 and B2 can be clearly distinguished with a lower ratio value in B2. The boundary also contrasts with a different pattern in the paleo-hydrodynamics proxy of Zr/Rb and the siliciclastic-dominated proxy of (Zr + Rb)/Sr (see Figure 5).
Furthermore, the B2 facies can be distinguished from B3 based on the content of the carbonate association proxy of Ca. The Ca content is flat in B2 and very high in B3. In addition, the pattern of the carbonate productivity proxy of S is also different in each facies unit. In B2, the convex pattern is not obvious, while, in B3, it is obvious. The Sr carbonate productivity proxies also show a flat pattern contrast in B2, compared with B3, which has an increasing pattern towards the top. This Sr proxy suggests a different environment between the two facies.
Based on the indicator of terrigenous element proxies of K, the B2 and B3 experienced a very contrasting deflection value. The pattern of both facies is shown as flat with a sharp contact boundary rather than a gradation. Therefore, it is interpreted that there is a significantly different paleoenvironment between B2 and B3, an open environment in B2, and a relatively isolated environment in B3. The same contrast between B2 and B3 is also shown by the decrease in Rb value of more than 20% (see Figure 4). Referring to the previous analysis of GR-log facies analysis of B2 as a lagoon [6], the geochemical proxies show that it is more appropriate for a shoreface rather than a lagoon. It is indicated by the open environmental conditions with siliciclastic sediment supply based on the (Zr + Rb)/Sr proxies and the intermediate seawater depth based on the Zr/Rb and Fe/Mn indicators (see Figure 5).
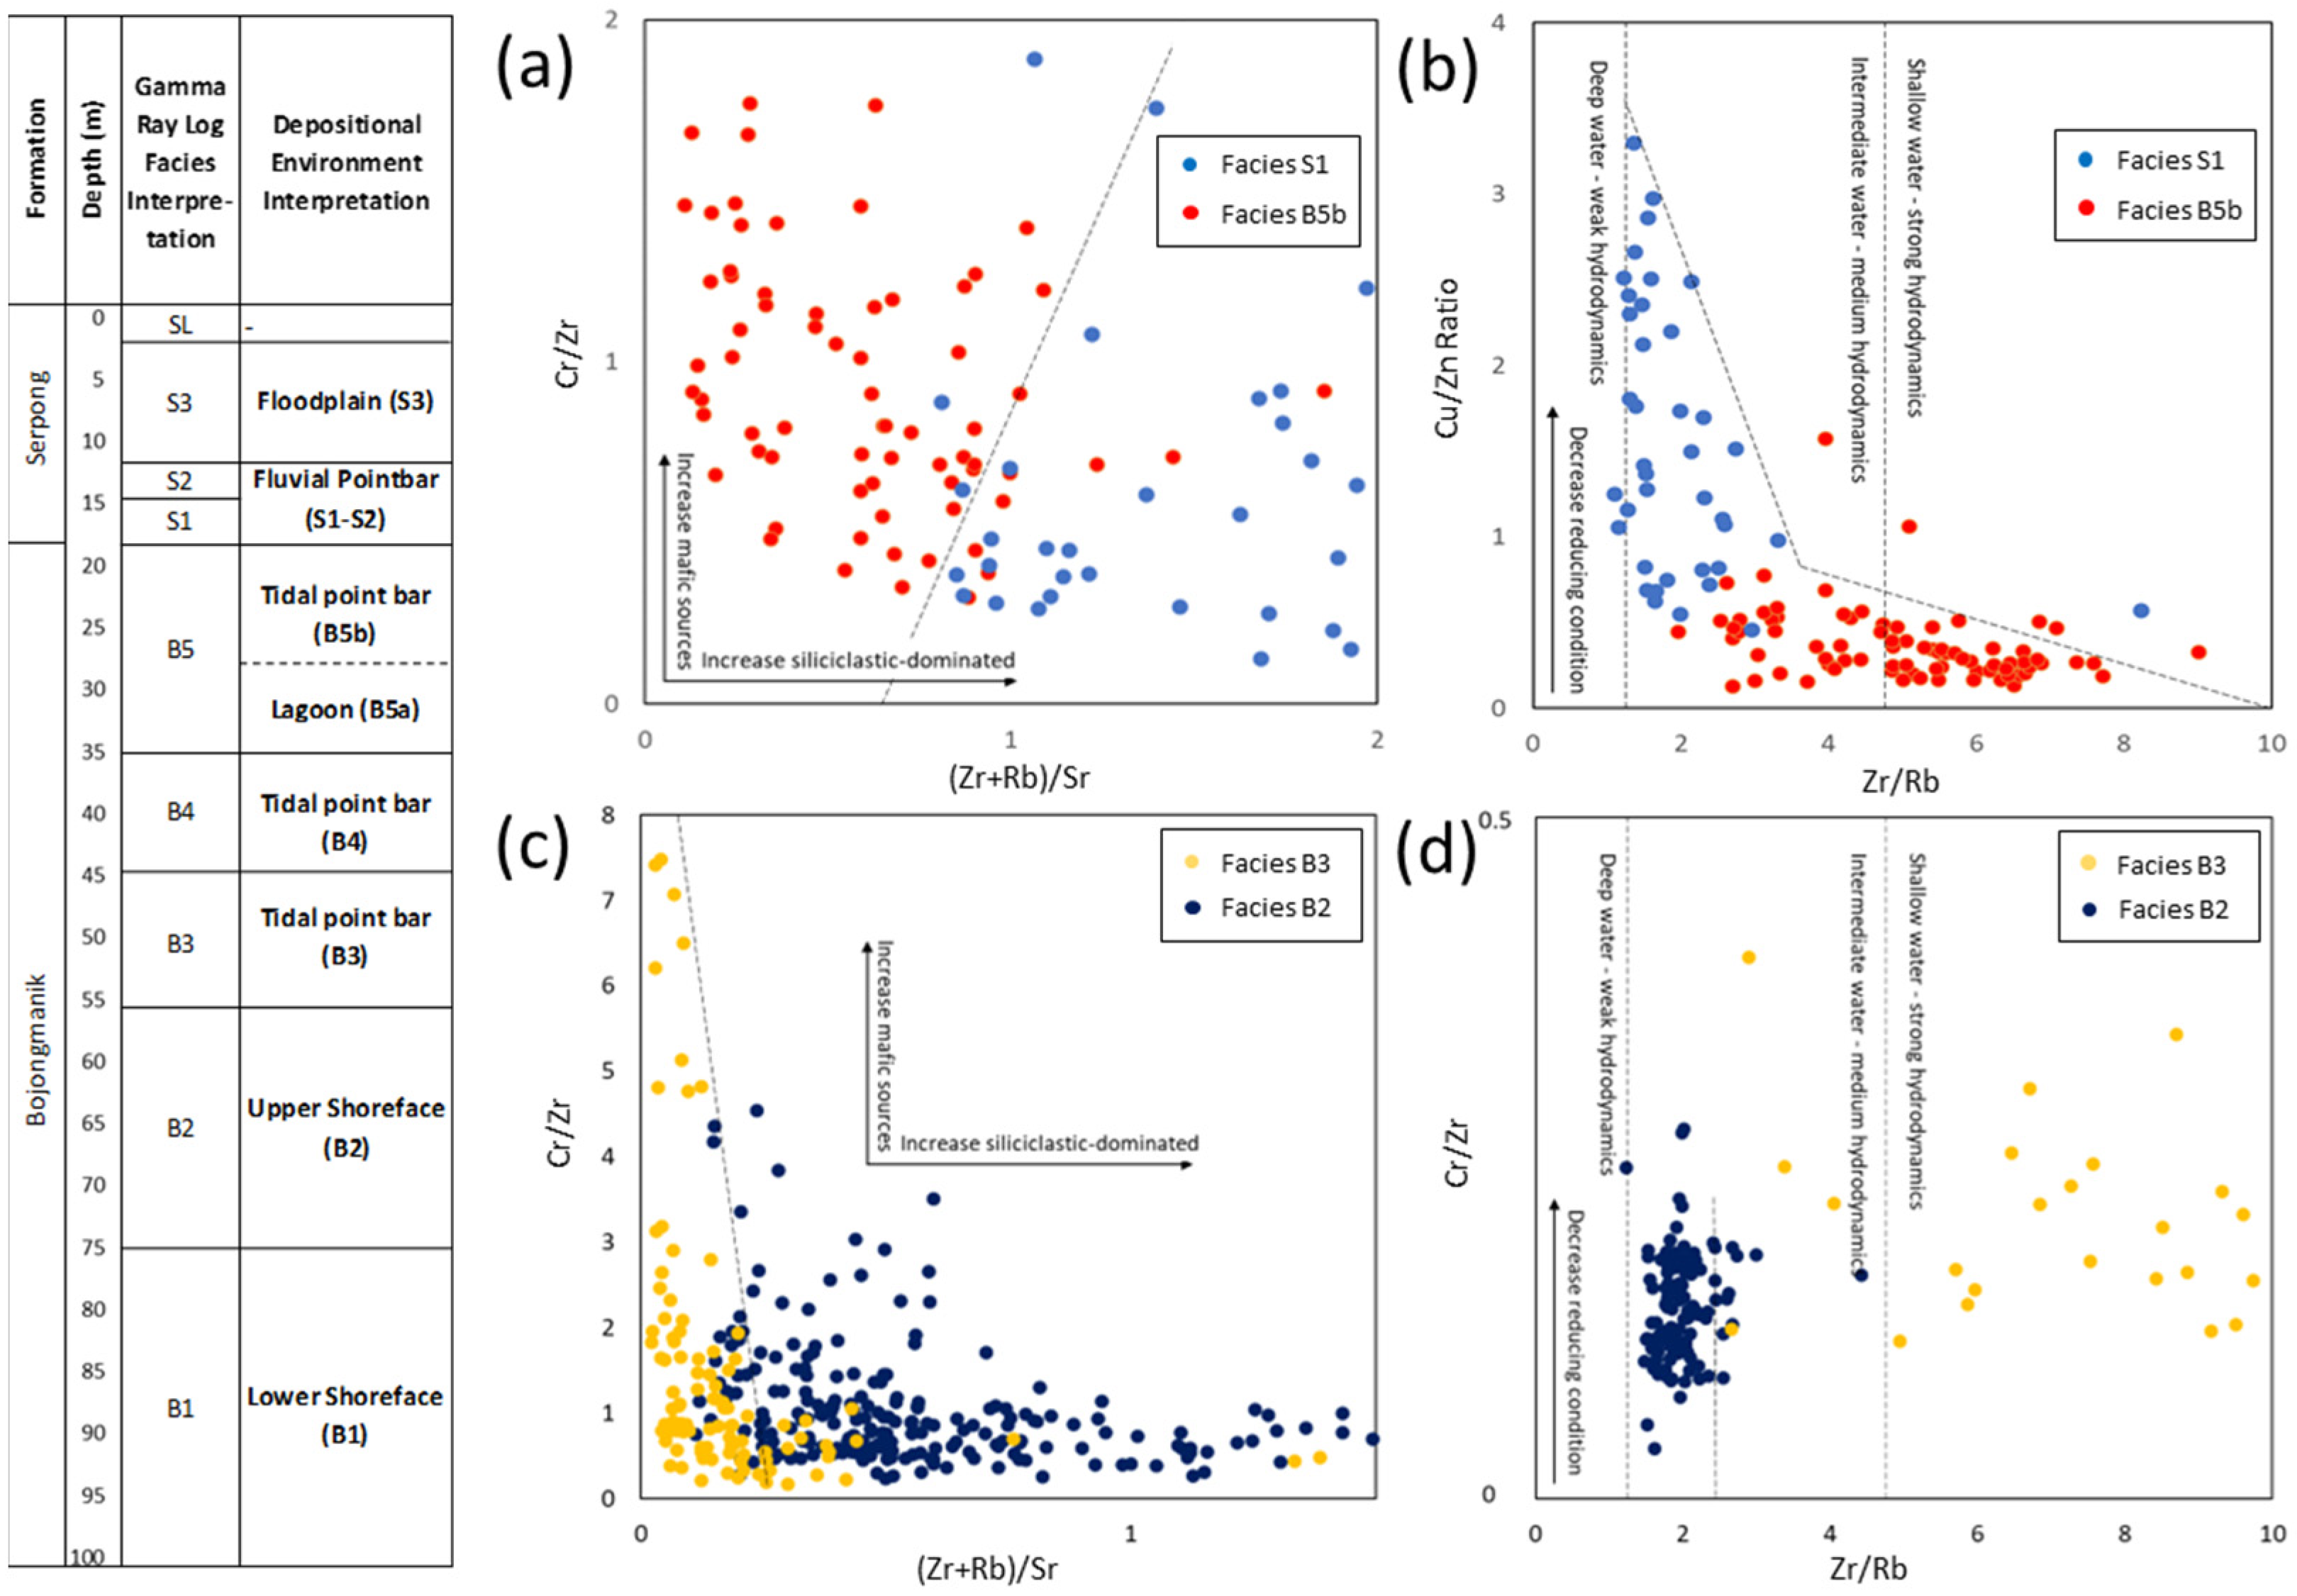
An alternative technique to show the change in the paleoenvironment is by making a scatter plot between proxies. Changes from the shoreface (B2) to the tidal point bar (B3) are indicated by the sediment provenance proxy of Cr/Zr versus the siliciclastic-dominated proxy of (Zr + Rb)/Sr. The shoreface facies of B2 showed an increase in siliciclastic-dominated character, with high (Zr + Rb)/Sr and lower mafic source proxy of Cr/Zr compared to tidal point bar facies of B3. B3 is indicated by low (Zr + Rb)/Sr and a wide range of Cr/Zr ratio, which indicates an increase in mafic sources (Figure 6c). Changes in the area from B2 to B3 were also identified in the paleoredox proxy of Cu/Zn versus the water depth proxy of Zr/Rb. B2 and B3 are in the same anoxic paleoredox, but B2 is deposited in intermediate water and B3 in shallow water (Figure 6d).
B3 and B4 have differences in Ca and S convexity patterns, which are associated with the presence of carbonate rock. B3 has the characteristic of a high convex Ca pattern at the bottom due to sandy limestone layers. In comparison, the convex Ca pattern in B4 is not too high because it only relates to the coral fragments in the sandstone layer. The convex pattern of S in B3 and B4 is almost the same, with a clear boundary between units (see Figure 4). From the water depth proxies, B3 and B4 have different water depths. B3, as the tidal point bar, has a shallow water depth compared to B4, which has an intermediate-to-shallow water depth.
B4 and B5 have very contrasting patterns in the proxies of carbonate association, carbonate productivity, and terrigenous association. The carbonate association content of Ca in B4 is convex, while, in B5, it is flat. The carbonate productivity of S shows a convex boundary pattern between B4 and B5. The same convex boundary condition is also present in the terrigenous association pattern of Cr content in B4 and B5 (see Figure 4). From the elemental ratio, B4 and B5 indicated differences in the paleosalinity proxy of Sr/Ba with a different convex pattern (see Figure 5).
Another finding from geochemical element affinities is that the boundaries in B5 are not observed in the GR-logs. The change in the Sr carbonate productivity proxy pattern changed from convex in lower B5 (B5a) to flat in upper B5 (B5b). There is also a change in the pattern of the Fe and Ti terrigenous association proxies from relatively zero values in lower B5 to reasonably high values in upper B5. The paleoenvironment boundary can also be observed from the appearance of the redox-association element Cu in upper B5 (see Figure 4). From the elemental ratio proxy of paleosalinity Sr/Ba, the boundary was also detected with a more brackish water environment in B5b compared to B5a. The paleoredox proxy of Cu/Zn also indicates a change from an anoxic environment in B5a to a transition environment in B5b. The siliciclastic-dominated proxy of (Zr + Rb)/Sr also indicates changes, from an increase in carbonate in B5a to an increase in siliciclastic in B5b (see Figure 5).
All proxy elements indicate a change from a marine B5b to a fluvial S1 environment, whether based on element affinity or paleoenvironment proxies. The most apparent boundaries are indicated by the terrigenous-associated element proxies of K and Rb, and the paleoredox proxy of Cu (see Figure 4). It is also clearly indicated from the paleoclimate proxy of Sr/Cu, paleosalinity proxy of Sr/Ba, paleoredox proxy of Cu/Zn, and siliciclastic-dominated proxy of (Zr + Rb)/Sr. The paleoclimate indicates climate change from dry and hot to humid and warm, paleosalinity indicates a change from marine to fluvial, paleoredox indicates a change from transition to oxic, and the siliciclastic-dominated proxy indicates a change from an increase in carbonate to an increase in siliciclastic (see Figure 5).
Based on the scatter diagram of Cr/Zr versus (Zr + Rb)/Sr, the changes in the paleoenvironment from marine B5b to fluvial S1 are clearly indicated by a siliciclastic-dominated proxy. There is no significant change in the range of sediment provenance indicator of Cr/Zr due to erosion and re-deposition of marine sediment in S1 facies. Nevertheless, the proxy of siliciclastic-dominated (Zr + Rb/Sr) distinguishes the fluvial S1 from the marine B5b (Figure 6a). Further, the scatter diagram of the paleoredox proxy of Cu/Zn versus the water depth proxy of Zr/Rb clearly divides the two zones of B5b and S1 facies. B5b has low levels of Cu/Zn or is in reducing conditions in intermediate to shallow water environments. S1 is in oxic conditions and an intermediate water depth environment (Figure 6b).
S1 and S2 are clearly distinguished by the change in the carbonate productivity proxy of S and the terrigenous association proxy of Cr, in which S1 is still influenced by bedrock marine sediment erosion, and S2 is a clean fluvial point bar (see Figure 4). Based on the sediment provenance proxy of Cr/Zr and siliciclastic-dominated proxy of (Zr + Rb)Sr, both facies units are distinguished by a different pattern (see Figure 5).
S2 and S3 have different terrigenous proxy patterns of K and Rb, both elements that have very strong correlations (see Table 2 and Figure 4). The paleoenvironment proxy of paleoredox Cu/Zn has been distinguished on the both facies.The siliciclastic-dominated proxy of (Zr + Rb)/Sr also distinguished both facies by decreasing the ratio of S3 compared to S2 (see Figure 5).
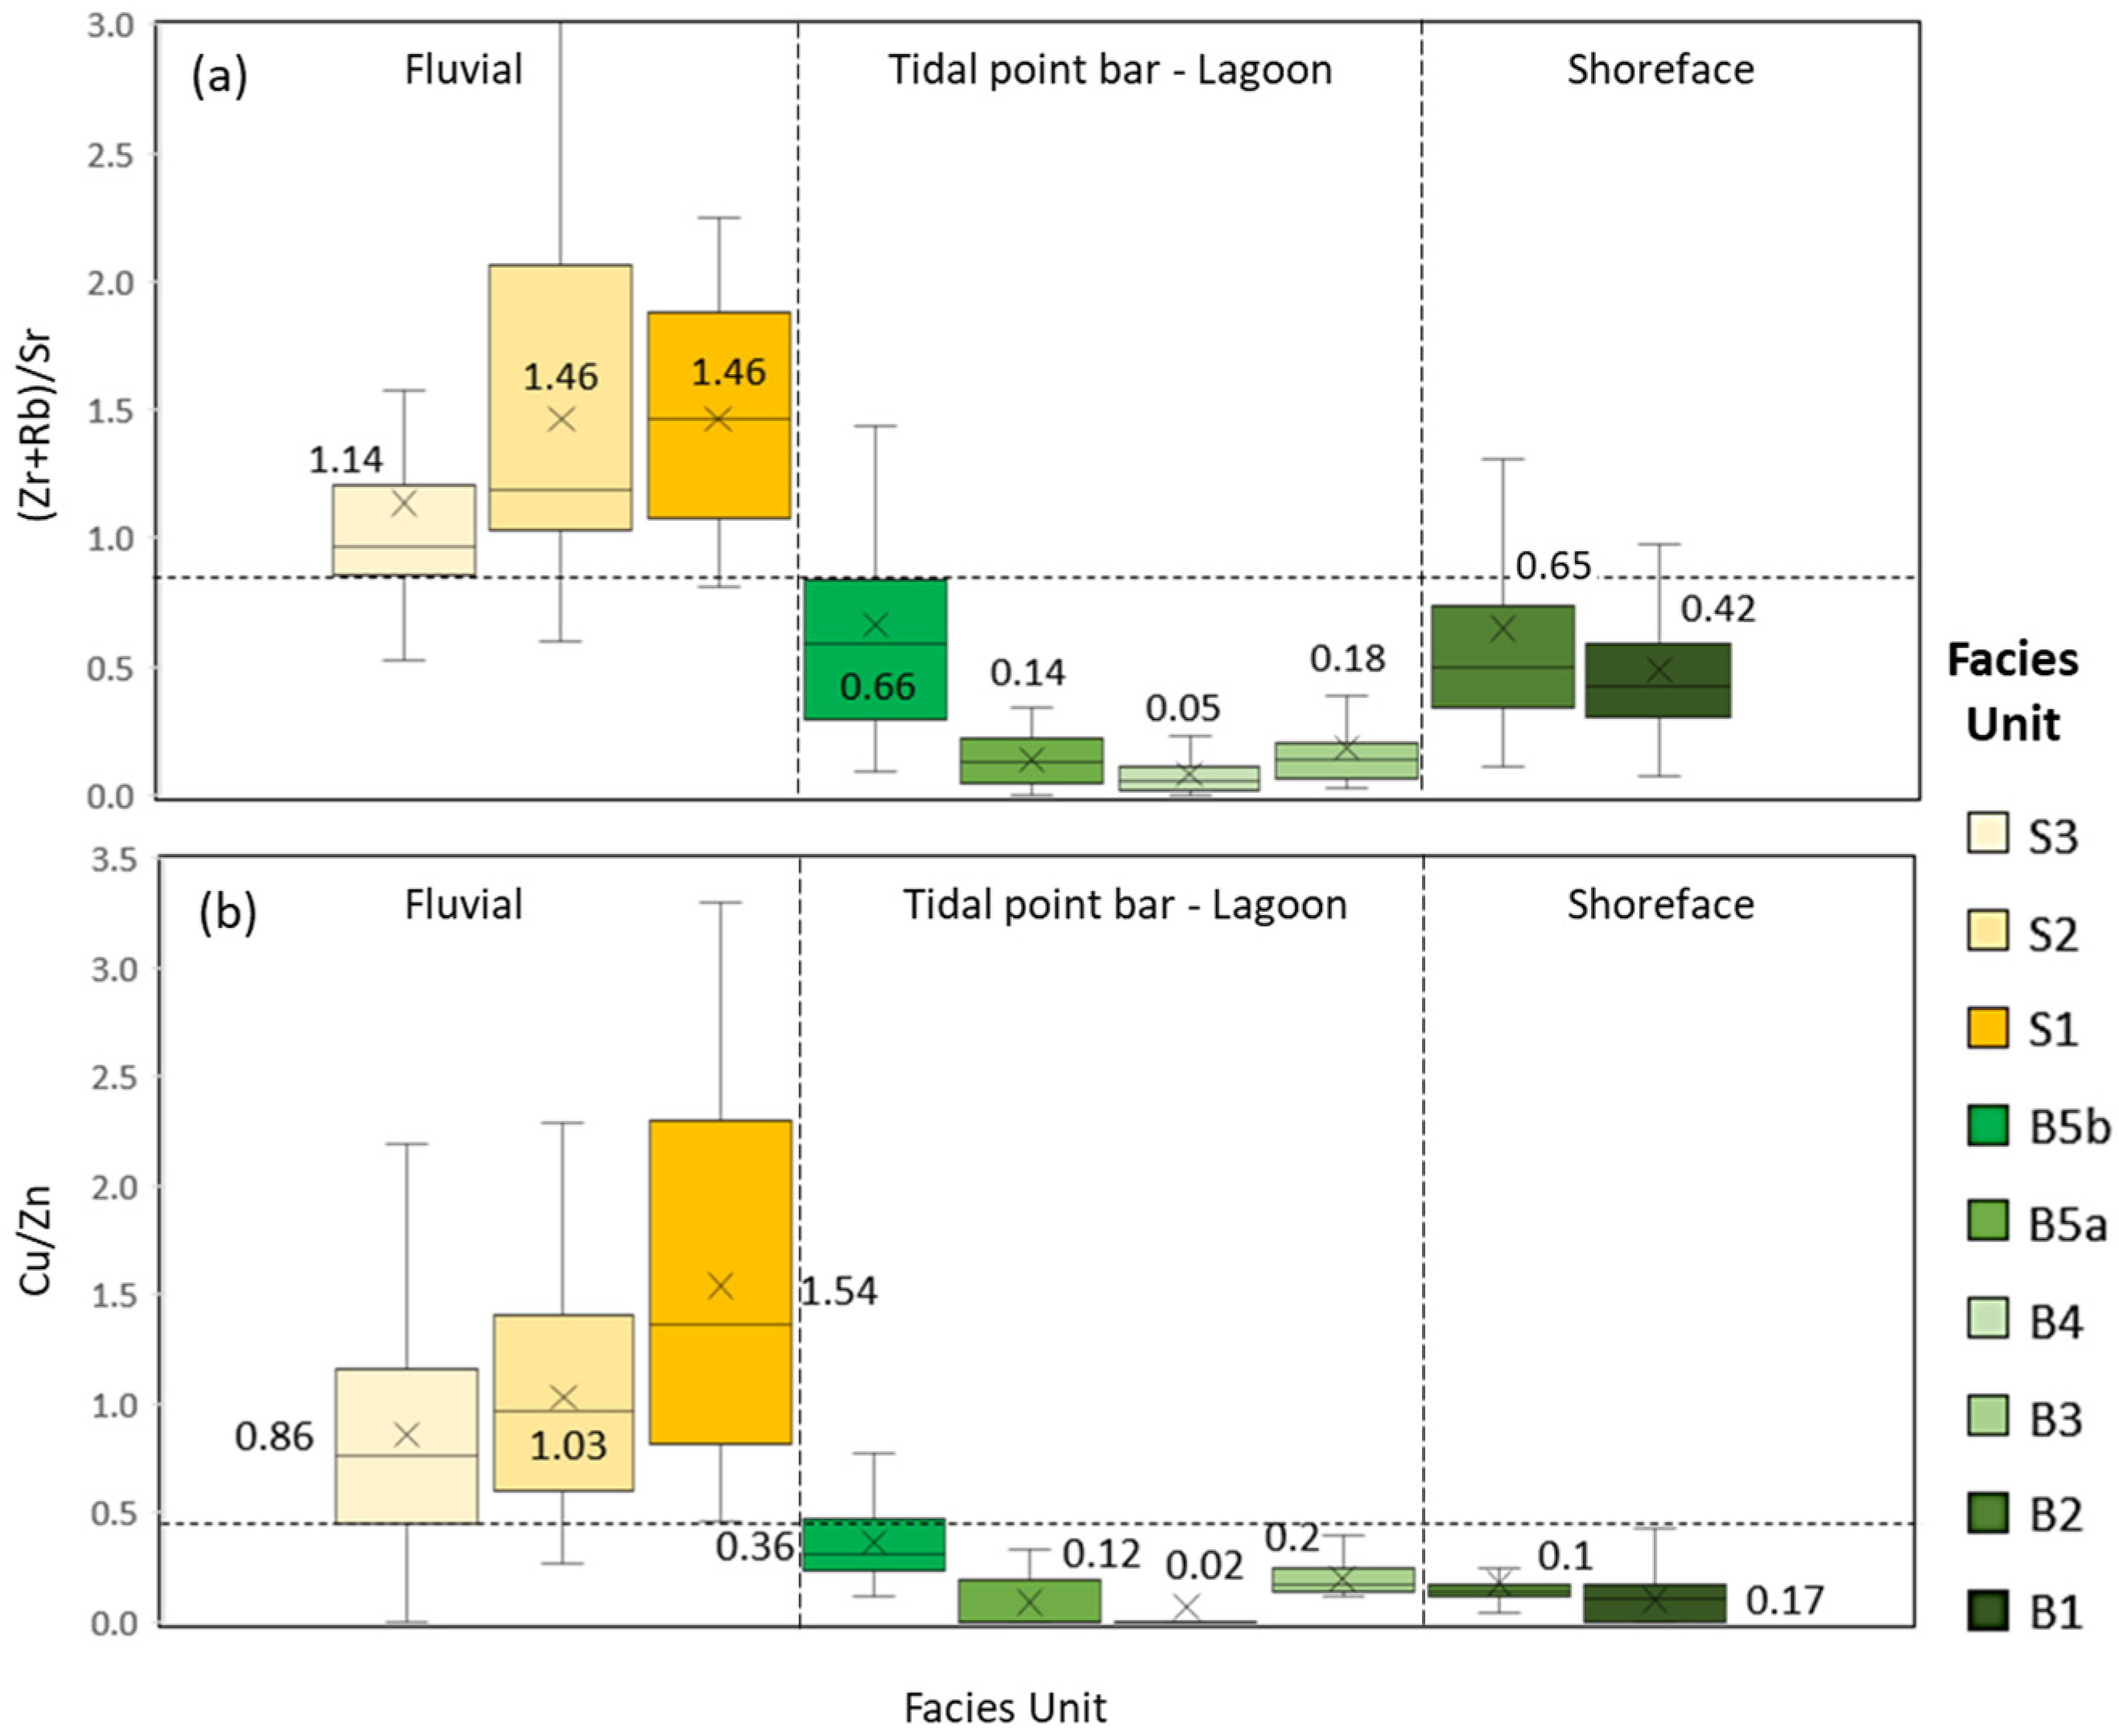
The box plot distinguishes three environments in the research area: a shoreface, a tidal point bar to the lagoon, and a fluvial environment. Based on the siliciclastic-dominated proxy of (Zr + Rb)Sr, all unit facies have a unique box plot. The line ratio of 0.85 distinguishes the marine and fluvial depositional environment. The paleoredox proxy of Cu/Zn with the line of 0.45 also clearly distinguishes the marine and fluvial environments (Figure 7).
Based on the overall result of the paleoenvironment analysis, the Bojongmanik Formation in the research area consists of the tidal point bar, lagoon, and shoreface depositional environment. Compared to the seawater depth, it is in the littoral to inner neritic, or in the maximum of tens of meters [43]. Based on the current research, there is no sediment in the research area deposited deeper than the inner neritic depositional environment, which is middle to outer neritic [4]. Nevertheless, it could also be a result of the research area located in the northernmost part of the Bojongmanik Formation or the shallower part of the basin and the southern Bojongmanik Formation area in the deeper basin area.
In relation to previous foraminifera studies on the Bojongmanik Formation, the research area can be stratigraphically connected to the upper Bojongmanik Formation [4,7]. Compared to geological research in Jasinga and Leuwiliang, this research also has the same result on the depositional environment, which is the transition environment from the beach to the lagoon [7].

6. Conclusions

Paleoenvironment analysis based on elemental geochemistry resulted in the Bojongmanik Formation in the research area deposited in the tidal point bar, lagoon, and shoreface, while the Serpong Formation was deposited in the fluvial point bar and floodplain. Compared to previous research, the Bojongmanik Formation in the research area could be stratigraphically related to the upper Bojongmanik Formation.
Proxies based on pXRF could be classified into qualitative and quantitative methods. A qualitative study based on elemental geochemical affinities, which are (1) carbonate-associated elements (Ca), (2) carbonate-productivity proxies (S and Sr), (3) terrigenous-associated elements (K, Fe, Ti, Cr, Mn, and Rb), and (4) redox-sensitive trace elements (Cu). All of these proxies show contrasting changes in between facies. A quantitative study is performed and shows a detailed paleoenvironment using the specific ratios for paleoclimate (Sr/Cu), paleosalinity (Sr/Ba), paleoredox (Cu/Zn), paleo-hydrodynamics and water depth (Zr/Rb and Fe/Mn), sediment provenance (Cr/Zr), and siliciclastic-dominated (Zr + Rb)/Sr.
Adding a geochemistry-based paleoenvironment analysis benefits from a more specific justification for GR-log facies interpretation. The paleoclimate divides the dry and hot Bojongmanik Formation with the humid and warm Serpong Formation. The paleosalinity divides the lagoon, tidal point bar, and shoreface as marine deposits from the fluvial point bar and floodplain as terrestrial deposits. The paleoredox divides the marine anoxic to transition with fluvial oxic. The paleo-hydrodynamics and water depth divide the intermediate water depth in shoreface and fluvial, with intermediate to shallow water depth in the lagoon and tidal point bar. The sediment provenance divides the Bojongmanik Formation’s mafic sources with the Serpong Formation’s felsic sources. The siliciclastic-dominated area divides the increased siliciclastic in the shoreface and fluvial zone with the increased carbonate in the lagoon to the tidal point bar.

Supplementary Materials

The following supporting information can be downloaded at: https://www.mdpi.com/article/10.3390/geosciences14070189/s1.

Author Contributions

Conceptualization, H.S., S.B., B.M. and Z.Z.; methodology, H.S., B.M., R.C.C., A.S., Z.Z. and A.G.M.; software, R.C.C., A.G.M. and F.D.I.; validation, H.S., F.D.I., N., N.M., P.S. and S.W.; formal analysis, H.S., I.G.S., H.A.P., N., S.W. and M.B.; investigation, H.S., I.G.S., F.D.I., N.M. and A.G.M.; resources, H.S., I.G.S., F.D.I., N.M., M.B., N., P.S. and Z.Z.; data curation, R.C.C., A.S. and H.A.P.; writing—original draft preparation, H.S., R.C.C. and A.G.M.; writing—review and editing, M.B., S.B., B.M., P.S. and Z.Z.; visualization, H.S. and R.C.C.; supervision, S.W., M.B., H.A.P. and A.S.; project administration, H.S. and F.D.I.; funding acquisition, H.S., I.G.S., R.C.C., H.A.P. and S.B. All authors have read and agreed to the published version of the manuscript.

Funding

This research was funded by the National Research and Innovation Agency (BRIN), grant number RP HITN D2471/2023.

Data Availability Statement

All relevant data are in the paper and Supplementary Materials.

Acknowledgments

The author would like to offer his sincere gratitude to the National Nuclear Energy Agency (BATAN) for all the research material, and to the Chairman of the Research Organization for Nuclear Energy-BRIN for their kind support throughout the work.

Conflicts of Interest

The authors declare no conflicts of interest.

References

  1. Yoga, K.E.; Syahrulyati, T. Winantris Umur dan Lingkungan Purba Satuan Batupasir Sisipan Batulempung Formasi Bojongmanik Berdasarkan Data Palinologi. Padjadjaran Geosci. J. 2020, 4, 376–392. [Google Scholar]
  2. Hidayatullah, A.Y.; Sihombing, F.M.H. Microfacies and Diagenesis of Limestone in Bojongmanik Formation in the Western Endut Mountain Area, Lebak Regency, Banten Province Based on Petrographical Analysis Methods. IOP Conf. Ser. Earth Environ. Sci. 2021, 830, 012047. [Google Scholar] [CrossRef]
  3. Rangga, A.D.; Mayasari, E.D.; Wiwik, E. Analisis Diagenesa dan Identifikasi Batugamping Formasi Bojongmanik daerah Cigudeg, Bogor, Jawa Barat. In Proceedings of the Seminar Nasional AVoER XI 2019, Palembang, Indonesia, 22–23 October 2019; pp. 235–242. [Google Scholar]
  4. Syahrulyati, T.; Isnaniawardhani, V.; Rosana, M.F.; Winantris, W. Bojongmanik Formation Sedimentation Mechanism in the Middle to Late Miocene (N9-N17) in the Rangkasbitung Basin. Sci. Contrib. Oil Gas 2020, 43, 115–123. [Google Scholar] [CrossRef]
  5. Isnaniawardhani, V.; Rivaldy, M.; Ismawan; Sophian, R.I.; Andyastiya, A.S. The Miocene (25.2–5.6 million years ago) climate changes recorded by foraminifera and nannofossils assemblages in Bogor Basin, Western Java. IOP Conf. Ser. Earth Environ. Sci. 2020, 575, 012222. [Google Scholar] [CrossRef]
  6. Syaeful, H.; Muhammad, A.G. Interpretation of Depositional Environment of Rock Formation using Electrofacies Analysis in Pupiptek Site, Serpong. Eksplorium 2017, 38, 29–42. (In Indonesian) [Google Scholar] [CrossRef]
  7. Martodjojo, S. Evolution of Bogor Basin, West Java; ITB Bandung: Bandung, Indonesia, 2003. (In Indonesian) [Google Scholar]
  8. Syahrulyati, T.; Isnaniawardhani, V.; Fatimah, M. The Environmental Construction of the Bojongmanik Formation in the Rangkasbitung Basin. Int. J. Innov. Creat. Chang. 2020, 12, 504–520. [Google Scholar]
  9. Abdurrokhim; Ito, M. The role of slump scars in slope channel initiation: A case study from the Miocene Jatiluhur Formation in the Bogor Trough, West Java. J. Asian Earth Sci. 2013, 73, 68–86. [Google Scholar] [CrossRef]
  10. Clements, B.; Hall, R. Cretaceous to Late Miocene stratigraphic and tectonic evolution of West Java. In Proceedings of the Indonesian Petroleum Association, Jakarta, Indonesia, 14–16 May 2007. [Google Scholar] [CrossRef]
  11. Yuliastuti, Y.; Syaeful, H.; Syahbana, A.J.; Alhakim, E.E.; Sembiring, T.M. One dimensional seismic response analysis at the non-commercial nuclear reactor site, Serpong—Indonesia. Rud. Geol. Naft. Zb. 2021, 36, 1–10. [Google Scholar] [CrossRef]
  12. Turkandi, T.; Sidarto; Agustiyanto, D.; Hadiwidjojo, M. Geologic Map of Jakarta and Kepulauan Seribu Quadrangles, Jawa; GRDC: Bandung, Indonesia, 1992. [Google Scholar]
  13. Delinom, R.M.; Assegaf, A.; Abidin, H.Z.; Taniguchi, M.; Suherman, D.; Fajar, R.; Yulianto, E. The contribution of human activities to subsurface environment degradation in Greater Jakarta Area, Indonesia. Sci. Total Environ. 2008, 407, 3129–3141. [Google Scholar] [CrossRef]
  14. Dunnington, D.W.; Spooner, I.S.; Mallory, M.L.; White, C.E.; Gagnon, G.A. Evaluating the utility of elemental measurements obtained from factory-calibrated field-portable X-Ray fluorescence units for aquatic sediments. Environ. Pollut. 2019, 249, 45–53. [Google Scholar] [CrossRef]
  15. Houshmand, N.; Goodfellow, S.; Esmaeili, K.; Ordóñez Calderón, J.C. Rock Type Classification Based on Petrophysical, Geochemical, and Core Imaging Data Using Machine and Deep Learning Techniques. Appl. Comput. Geosci. 2022, 16, 100104. [Google Scholar] [CrossRef]
  16. Heidarian, H.; Lentz, D.R.; Thorne, K.; Rogers, N. Application of portable X-ray and micro-X-ray fluorescence spectrometry to characterize alteration and mineralization within various gold deposits hosted in southern New Brunswick, Canada. J. Geochem. Explor. 2021, 229, 106847. [Google Scholar] [CrossRef]
  17. Rawal, A.; Chakraborty, S.; Li, B.; Lewis, K.; Godoy, M.; Paulette, L.; Weindorf, D.C. Determination of base saturation percentage in agricultural soils via portable X-ray fluorescence spectrometer. Geoderma 2019, 338, 375–382. [Google Scholar] [CrossRef]
  18. Dillian, C.D.; Burnett, J.S.; Oweidi, A.; Gharib, R. Geochemical characterization of Jordanian basalts using portable X-ray fluorescence spectrometry and sourcing of the Amman Theater Statue. J. Archaeol. Sci. Rep. 2022, 46, 103720. [Google Scholar] [CrossRef]
  19. Barago, N.; Pavoni, E.; Floreani, F.; Crosera, M.; Adami, G.; Lenaz, D.; Larese Filon, F.; Covelli, S. Portable X-ray Fluorescence (pXRF) as a Tool for Environmental Characterisation and Management of Mining Wastes: Benefits and Limits. Appl. Sci. 2022, 12, 12189. [Google Scholar] [CrossRef]
  20. Bercovici, A.; Cui, Y.; Forel, M.B.; Yu, J.; Vajda, V. Terrestrial paleoenvironment characterization across the Permian-Triassic boundary in South China. J. Asian Earth Sci. 2015, 98, 225–246. [Google Scholar] [CrossRef]
  21. Ravansari, R.; Wilson, S.C.; Tighe, M. Portable X-ray fluorescence for environmental assessment of soils: Not just a point and shoot method. Environ. Int. 2020, 134, 105250. [Google Scholar] [CrossRef] [PubMed]
  22. McNulty, B.A.; Fox, N.; Berry, R.F.; Gemmell, J.B. Lithological discrimination of altered volcanic rocks based on systematic portable X-ray fluorescence analysis of drill core at the Myra Falls VHMS deposit, Canada. J. Geochem. Explor. 2018, 193, 1–21. [Google Scholar] [CrossRef]
  23. Lemière, B. A review of pXRF (field portable X-ray fluorescence) applications for applied geochemistry. J. Geochem. Explor. 2018, 188, 350–363. [Google Scholar] [CrossRef]
  24. Nawar, S.; Richard, F.; Kassim, A.M.; Tekin, Y.; Mouazen, A.M. Fusion of Gamma-rays and portable X-ray fluorescence spectral data to measure extractable potassium in soils. Soil Tillage Res. 2022, 223, 105472. [Google Scholar] [CrossRef]
  25. Momta, P.S.; Odigi, M.I. Reconstruction of the Depositional Setting of Tortonian Sediments in the Yowi Field, Shallow Offshore Niger Delta, Using Wireline Logs. Am. J. Geosci. 2016, 6, 24–35. [Google Scholar] [CrossRef]
  26. Nazeer, A.; Ahmed, S.; Hussain, S. Sedimentary facies interpretation of Gamma Ray (GR) log as basic well logs in Central and Lower Indus Basin of Pakistan. Geod. Geodyn. 2016, 7, 432–443. [Google Scholar] [CrossRef]
  27. Maliva, R.G. Aquifer Characterization Techniques; Springer Science and Business Media LLC: Dordrecht, The Netherlands, 2016; ISBN 9783319321370. [Google Scholar] [CrossRef]
  28. Roslin, A.; Esterle, J.S. Electrofacies analysis for coal lithotype profiling based on high-resolution wireline log data. Comput. Geosci. 2016, 91, 1–10. [Google Scholar] [CrossRef]
  29. Wang, X.; Wang, C.; Jin, X.; Wang, H. Coordinated analysis of county geological environment carrying capacity and sustainable development under remote sensing interpretation combined with integrated model. Ecotoxicol. Environ. Saf. 2023, 257, 114956. [Google Scholar] [CrossRef] [PubMed]
  30. Chan, S.A.; Bălc, R.; Humphrey, J.D.; Amao, A.O.; Kaminski, M.A.; Alzayer, Y.; Duque, F. Changes in paleoenvironmental conditions during the Late Jurassic of the western Neo-Tethys: Calcareous nannofossils and geochemistry. Mar. Micropaleontol. 2022, 173, 102116. [Google Scholar] [CrossRef]
  31. Lei, W.; Chen, D.; Liu, Z.; Cheng, M. Paleoenvironment-driven organic matter accumulation in lacustrine shale mixed with shell bioclasts: A case study from the Jurassic Da’anzhai member, Sichuan Basin (China). J. Pet. Sci. Eng. 2023, 220, 111178. [Google Scholar] [CrossRef]
  32. Omietimi, E.J.; Lenhardt, N.; Yang, R.; Götz, A.E.; Bumby, A.J. Sedimentary geochemistry of Late Cretaceous-Paleocene deposits at the southwestern margin of the Anambra Basin (Nigeria): Implications for paleoenvironmental reconstructions. Palaeogeogr. Palaeoclimatol. Palaeoecol. 2022, 600, 111059. [Google Scholar] [CrossRef]
  33. Zhang, L.; Dong, D.; Qiu, Z.; Wu, C.; Zhang, Q.; Wang, Y.; Liu, D.; Deng, Z.; Zhou, S.; Pan, S. Sedimentology and geochemistry of Carboniferous-Permian marine-continental transitional shales in the eastern Ordos Basin, North China. Palaeogeogr. Palaeoclimatol. Palaeoecol. 2021, 571, 110389. [Google Scholar] [CrossRef]
  34. Li, T.J.; Huang, Z.L.; Chen, X.; Li, X.N.; Liu, J.T. Paleoenvironment and organic matter enrichment of the Carboniferous volcanic-related source rocks in the Malang Sag, Santanghu Basin, NW China. Pet. Sci. 2021, 18, 29–53. [Google Scholar] [CrossRef]
  35. Wei, M.; Bao, Z.; Munnecke, A.; Liu, W.; Harrison, G.W.M.; Zhang, H.; Zhang, D.; Li, Z.; Xu, X.; Lu, K.; et al. Paleoenvironment of the Lower-Middle Cambrian Evaporite Series in the Tarim Basin and Its Impact on the Organic Matter Enrichment of Shallow Water Source Rocks. Minerals 2021, 11, 659. [Google Scholar] [CrossRef]
  36. Ghandour, I.M. Paleoenvironmental changes across the Paleocene–Eocene boundary in West Central Sinai, Egypt: Geochemical proxies. Swiss J. Geosci. 2020, 113, 3. [Google Scholar] [CrossRef]
  37. Vandermaelen, N.; Vanacker, V.; Clapuyt, F.; Christl, M.; Beerten, K. Reconstructing the depositional history of Pleistocene fluvial deposits based on grain size, elemental geochemistry and in-situ 10Be data. Geomorphology 2022, 402, 108127. [Google Scholar] [CrossRef]
  38. Doerner, M.; Berner, U.; Erdmann, M.; Barth, T. Geochemical characterization of the depositional environment of Paleocene and Eocene sediments of the Tertiary Central Basin of Svalbard. Chem. Geol. 2020, 542, 119587. [Google Scholar] [CrossRef]
  39. Algeo, T.J.; Liu, J. A re-assessment of elemental proxies for paleoredox analysis. Chem. Geol. 2020, 540, 119549. [Google Scholar] [CrossRef]
  40. Zhang, S.; Barnes, C.R. Late Ordovician (Katian) conodont community analysis and anoxic shallow water origin of organic-rich black shales, Red Head Rapids Formation, Southampton Island, Canadian Arctic. Palaeogeogr. Palaeoclimatol. Palaeoecol. 2022, 592, 110896. [Google Scholar] [CrossRef]
  41. März, C.; Poulton, S.W.; Beckmann, B.; Küster, K.; Wagner, T.; Kasten, S. Redox sensitivity of P cycling during marine black shale formation: Dynamics of sulfidic and anoxic, non-sulfidic bottom waters. Geochim. Cosmochim. Acta 2008, 72, 3703–3717. [Google Scholar] [CrossRef]
  42. Dypvik, H.; Harris, N.B. Geochemical facies analysis of fine-grained siliciclastics using Th/U, Zr/Rb and (Zr + Rb)/Sr ratios. Chem. Geol. 2001, 181, 131–146. [Google Scholar] [CrossRef]
  43. Allen, J.R.L. Late Quaternary Niger Delta and adjacent areas: Sedimentary environments and lithofacies. Am. Assoc. Pet. Geol. Bull. 1965, 49, 547–600. [Google Scholar]
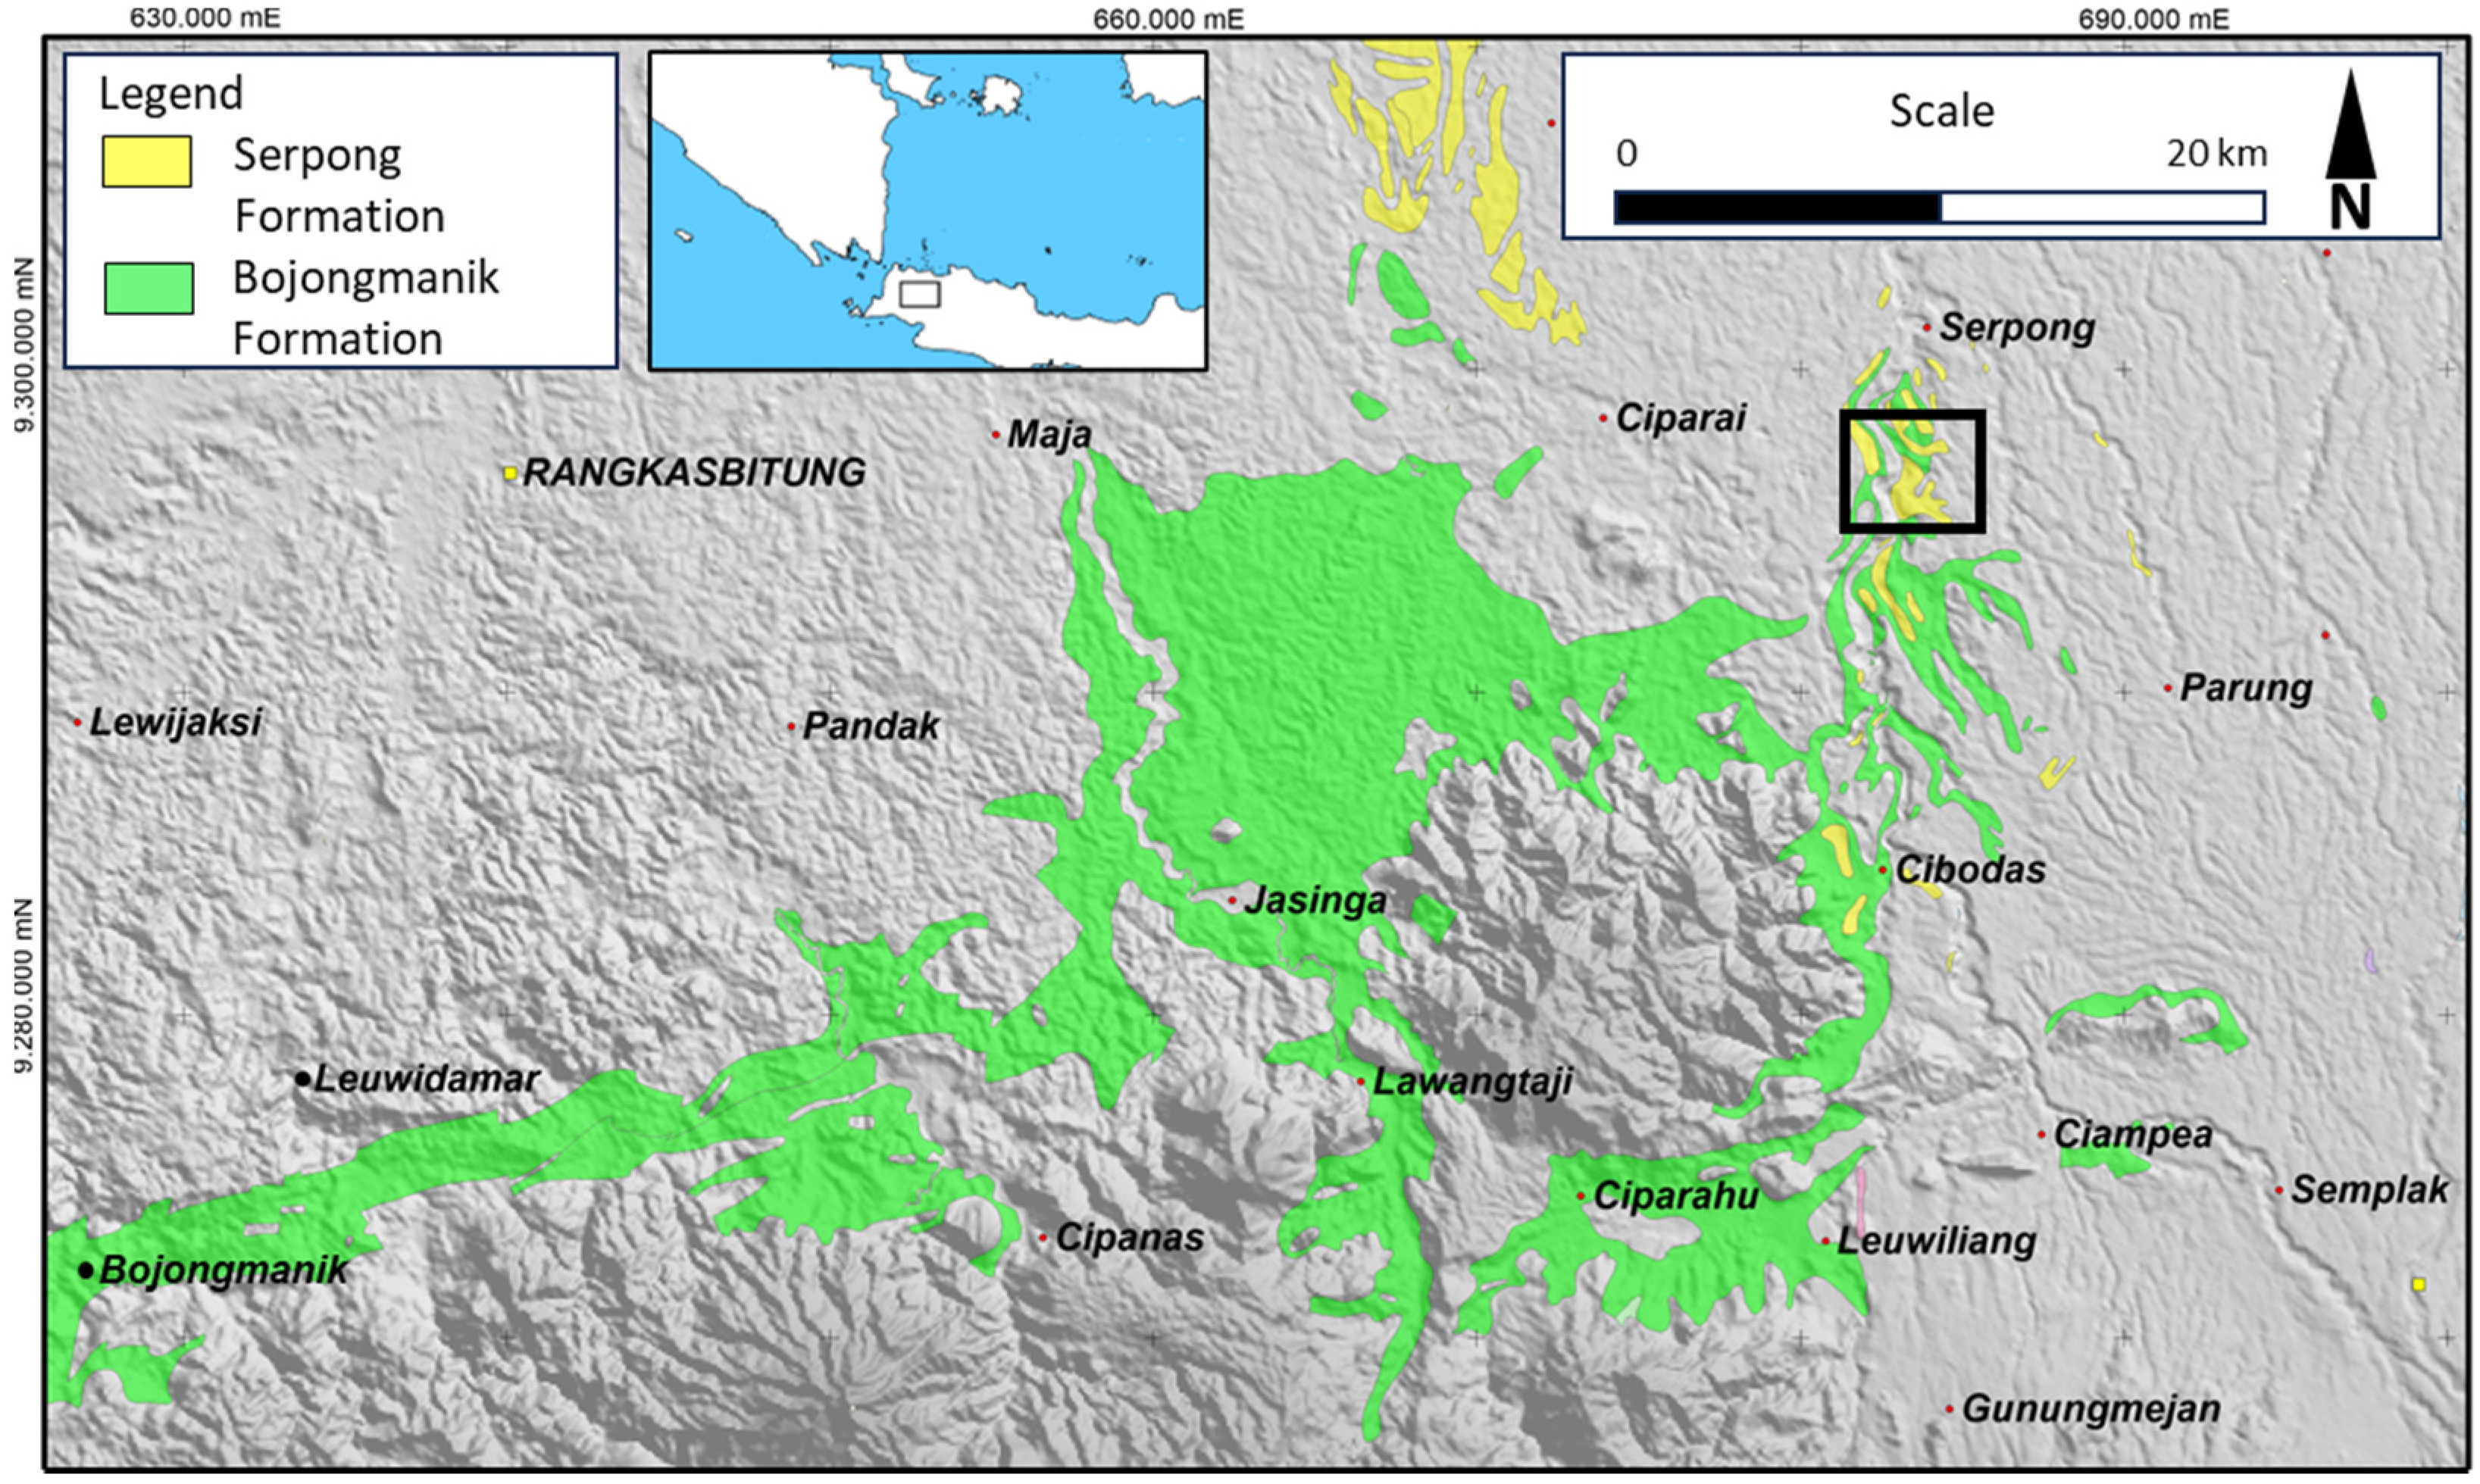
Figure 1. Distribution of Bojongmanik and Serpong Formations surrounding the research area (black box).
Geosciences 14 00189 g001
Figure 2. GR-log facies analysis of DH-11.
Geosciences 14 00189 g002
Figure 3. Drill core and facies unit of DH-11.
Geosciences 14 00189 g003
Figure 4. Paleoenvironment analysis based on elemental affinity. Note: The arrow shows the enriched zone.
Geosciences 14 00189 g004
Figure 5. Paleoenvironment analysis based on elemental ratio. Note: the red dashed line is the threshold from previous research, and the yellow dashed line is defined in this research.
Geosciences 14 00189 g005
Figure 6. Paleoenvironmental change from the tidal point bar to the fluvial point bar (a,b) and from the upper shoreface to the tidal point bar (c,d).
Geosciences 14 00189 g006
Figure 7. Box plot of the result of paleoenvironment reconstruction from (Zr + Rb)/Sr (a) and Cu/Zn (b). The vertical dashed line indicates the boundary of the depositional environment, while the horizontal dashed line indicates the threshold value between the marine and fluvial environments.
Geosciences 14 00189 g007
Table 1. Geochemical proxies for paleoenvironment reconstruction in this research.
PaleoclimatePaleosalinityPaleoredoxPaleo-HydrodynamicsSediment
Provenance
Siliciclastic-Dominated
Dry and hotSr/Cu >5MarineSr/Ba > 0.5AnoxicCu/Zn < 0.21Weak/
Deepwater
Zr/Rb < 1.25, low Fe/MnMafic sourcesHigh Cr/ZrIncrease siliciclasticHigh (Zr + Rb)/Sr
BrackishSr/Ba 0.2–0.5Weak anoxicCu/Zn 0.21–0.38IntermediateZr/Rb 1.25–4.76
Warm and humidSr/Cu 1–5TransitionCu/Zn 0.38–0.5Felsic sourcesLow Cr/ZrIncrease carbonateLow (Zr + Rb)/Sr
Terres-trialSr/Ba < 0.2Weak oxicCu/Zn 0.5–0.63Strong/Shallow waterZr/Rb > 4.76,
high Fe/Mn
OxicCu/Zn > 0.63
Table 2. Pearson’s correlation of GR and elemental geochemistry.
S (ppm)K (ppm)Ca (ppm)Ti (ppm)V (ppm)Cr (ppm)Mn (ppm)Fe (ppm)Ni (ppm)Cu (ppm)Zn (ppm)As (ppm)Rb (ppm)Sr (ppm)Y (ppm)Zr (ppm)Nb (ppm)Ba (ppm)Pb (ppm)GR
S (ppm)1.00
K (ppm)−0.401.00
Ca (ppm)0.13−0.441.00
Ti (ppm)−0.150.25−0.441.00
V (ppm)0.74−0.120.250.041.00
Cr (ppm)0.85−0.260.42−0.160.751.00
Mn (ppm)−0.030.140.090.210.110.101.00
Fe (ppm)0.14−0.070.040.170.020.280.011.00
Ni (ppm)−0.120.26−0.080.280.01−0.040.210.061.00
Cu (ppm)−0.190.13−0.03−0.08−0.21−0.190.090.020.101.00
Zn (ppm)−0.090.15−0.180.38−0.04−0.110.150.150.270.511.00
As (ppm)0.110.18−0.090.020.050.13−0.060.310.030.030.021.00
Rb (ppm)−0.080.81−0.380.380.12−0.040.23−0.130.33−0.020.240.211.00
Sr (ppm)0.17−0.390.27−0.340.320.12−0.03−0.17−0.05−0.14−0.19−0.19−0.351.00
Y (ppm)0.070.06−0.120.180.060.020.120.170.13−0.120.160.180.16−0.111.00
Zr (ppm)−0.050.12−0.370.40−0.09−0.130.02−0.070.06−0.040.10−0.030.17−0.290.091.00
Nb (ppm)0.040.05−0.050.260.130.050.220.060.16−0.120.040.070.250.080.170.201.00
Ba (ppm)−0.420.20−0.14−0.23−0.40−0.36−0.05−0.10−0.140.27−0.05−0.070.01−0.06−0.240.11−0.081.00
Pb (ppm)0.030.23−0.190.450.160.100.170.310.31−0.110.340.090.32−0.130.190.080.24−0.191.00
GR0.230.25−0.230.440.340.180.150.000.27−0.320.120.160.51−0.160.230.160.22−0.500.341.00
Note: blue (0.40–0.59) for moderate correlation, yellow (0.60–0.79) for strong correlation, and orange (0.80–1.00) for very strong correlation.
Disclaimer/Publisher’s Note: The statements, opinions and data contained in all publications are solely those of the individual author(s) and contributor(s) and not of MDPI and/or the editor(s). MDPI and/or the editor(s) disclaim responsibility for any injury to people or property resulting from any ideas, methods, instructions or products referred to in the content.