Article

The Manhattan Schist, New York City: Proposed Sedimentary Protolith, Age, Boundaries, and Metamorphic History

1
Department of Earth & Environmental Sciences, Rutgers University, Newark, NJ 07102, USA
2
Independent Researcher, Cocoa Beach, FL 32931, USA
3
Independent Researcher, South Amboy, NJ 08879, USA
*
Author to whom correspondence should be addressed.
Geosciences 2024, 14(7), 190; https://doi.org/10.3390/geosciences14070190
Submission received: 8 May 2024 / Revised: 26 June 2024 / Accepted: 12 July 2024 / Published: 15 July 2024
(This article belongs to the Section Geochemistry)

Abstract

:
There are some persistent basic questions pertaining to the bedrock schist of New York City (NYC). How many mappable schist formations are exposed in NYC, and what was the sedimentary protolith of the Manhattan schists? Our proposed answers are based in part on a blending of published paleontological and radiometric dating results that constrain the timing of Taconic subduction and the best choice of a pelitic protolith for the schists of NYC. We have chemically analyzed some samples of schist and shales at key locations to evaluate the plausibility of our proposals. The compelling published evidence indicates that the Taconic Orogeny began about 475 Ma, when peri-Laurentian plates began the process of east-dipping subduction under the Moretown Terrane, resulting in a magmatic flareup of the Shelburne Falls arc that carried the Moretown Terrane west across NYC. East-dipping subduction accounts for early Ordovician metamorphism until an oceanic slab break-off event at about 466 Ma. Our review of the biostratigraphic data indicates a continuation of subduction and the deposition of pelitic sediments until about 455 Ma, during the transition to deep-water turbiditic sediment deposition. This disqualifies all post-455 Ma turbidites as viable protoliths for the NYC Manhattan schists but does include the Late Cambrian to lowermost Late Ordovician pelites of the Jutland Sequence that are exposed directly west of NYC in New Jersey. Our new chemical analyses of Jutland sediments and each of the three named schists from the NYC plot as a single geochemical population. We, therefore, propose that the schists of NYC could collectively be referred to as the Manhattan schist of the Late Cambrian to lower Late Ordovician.

1. Introduction

Most of the bedrock of New York City (NYC) is an amphibolite facies mica schist that is exposed in the form of large outcrops throughout Central Park and other NYC parks and is enjoyed by countless residents and visitors to the city every day. However, the number of mappable schist formations, their boundaries and age, and the identity of their sedimentary protolith are not fully constrained.—The answers to each of these questions are complex and involve evidence from multiple sources. Our literature search has uncovered some previously overlooked clues and our new chemical analysis of samples from some key locations allows us to propose some resolution to this problem.

1.1. Geologic Setting

NYC is located near the southern end of the Northern Appalachian Mountain Range, which extends north into the New England states of eastern North America and into north-eastern Canada. There is a general consensus that the Northern Appalachians experienced the profound effects of the Taconic Orogeny during the Ordovician Period about 485 to 444 million years ago. There is also a general consensus that the bedrock of NYC fully participated in Taconic Orogenesis and that the bedrocks are largely metasedimentary rocks, including quartzite, marble, and metapellite (schist). Upper almandine amphibolite facies metamorphism has largely destroyed any fossil content, resulting in considerable speculation concerning the age of the metasediments [1,2,3,4,5,6,7,8,9,10]. There is also considerable speculation pertaining to the number of schist formations, the relative abundance of more than one schist formation, and the identity of the protolith or protoliths of the schist or schists [1,2,3,4,5,6,7,8,9,10,11,12,13,14].

1.2. Question 1: How Many Mappable Schist Formations Are Exposed in NYC?

The first objective of our research is to determine the number of schist formations exposed in the bedrock of NYC. The “Geologic Map of New York City” [1] invokes the “New York City Group” to include the “Manhattan Formation”, which includes the mica schists and associated amphibolites and gneisses, along with the formation names “Inwood Marble” and “Fordham Gneiss” of the Lower Paleozoic and/or Precambrian period. Subdivision of the Manhattan Formation into an autochthonous 150-meter-thick mid-Ordovician schist (Member A), an allochthonous 60-meter-thick Cambrian amphibolite (Member B), and an allochthonous 1600-meter-thick Cambrian schist (Member C) was proposed in 1968 [2], and this has been generally accepted. However, in 1983 and 1986, it was also proposed [3,4] that: (1) most but not all the exposed schists of Manhattan are Cambrian and Ordovician correlatives of the Hartland Formation of Connecticut, based on similar lithology. (2) The pelitic sediments of the proto-Hartland Formation were deposited in much deeper oceanic water than those of the Manhattan Formation, and (3) the Hartland Formation has been thrust over most of Manhattan Members B and C by a Taconic thrust fault. The leading edge of this thrust fault is “Cameron’s Line”, which has been interpreted as a plate suture. The extent to which the Manhattan Formation has been covered by the Hartland Formation thus depends largely on the identification of Cameron’s Line.
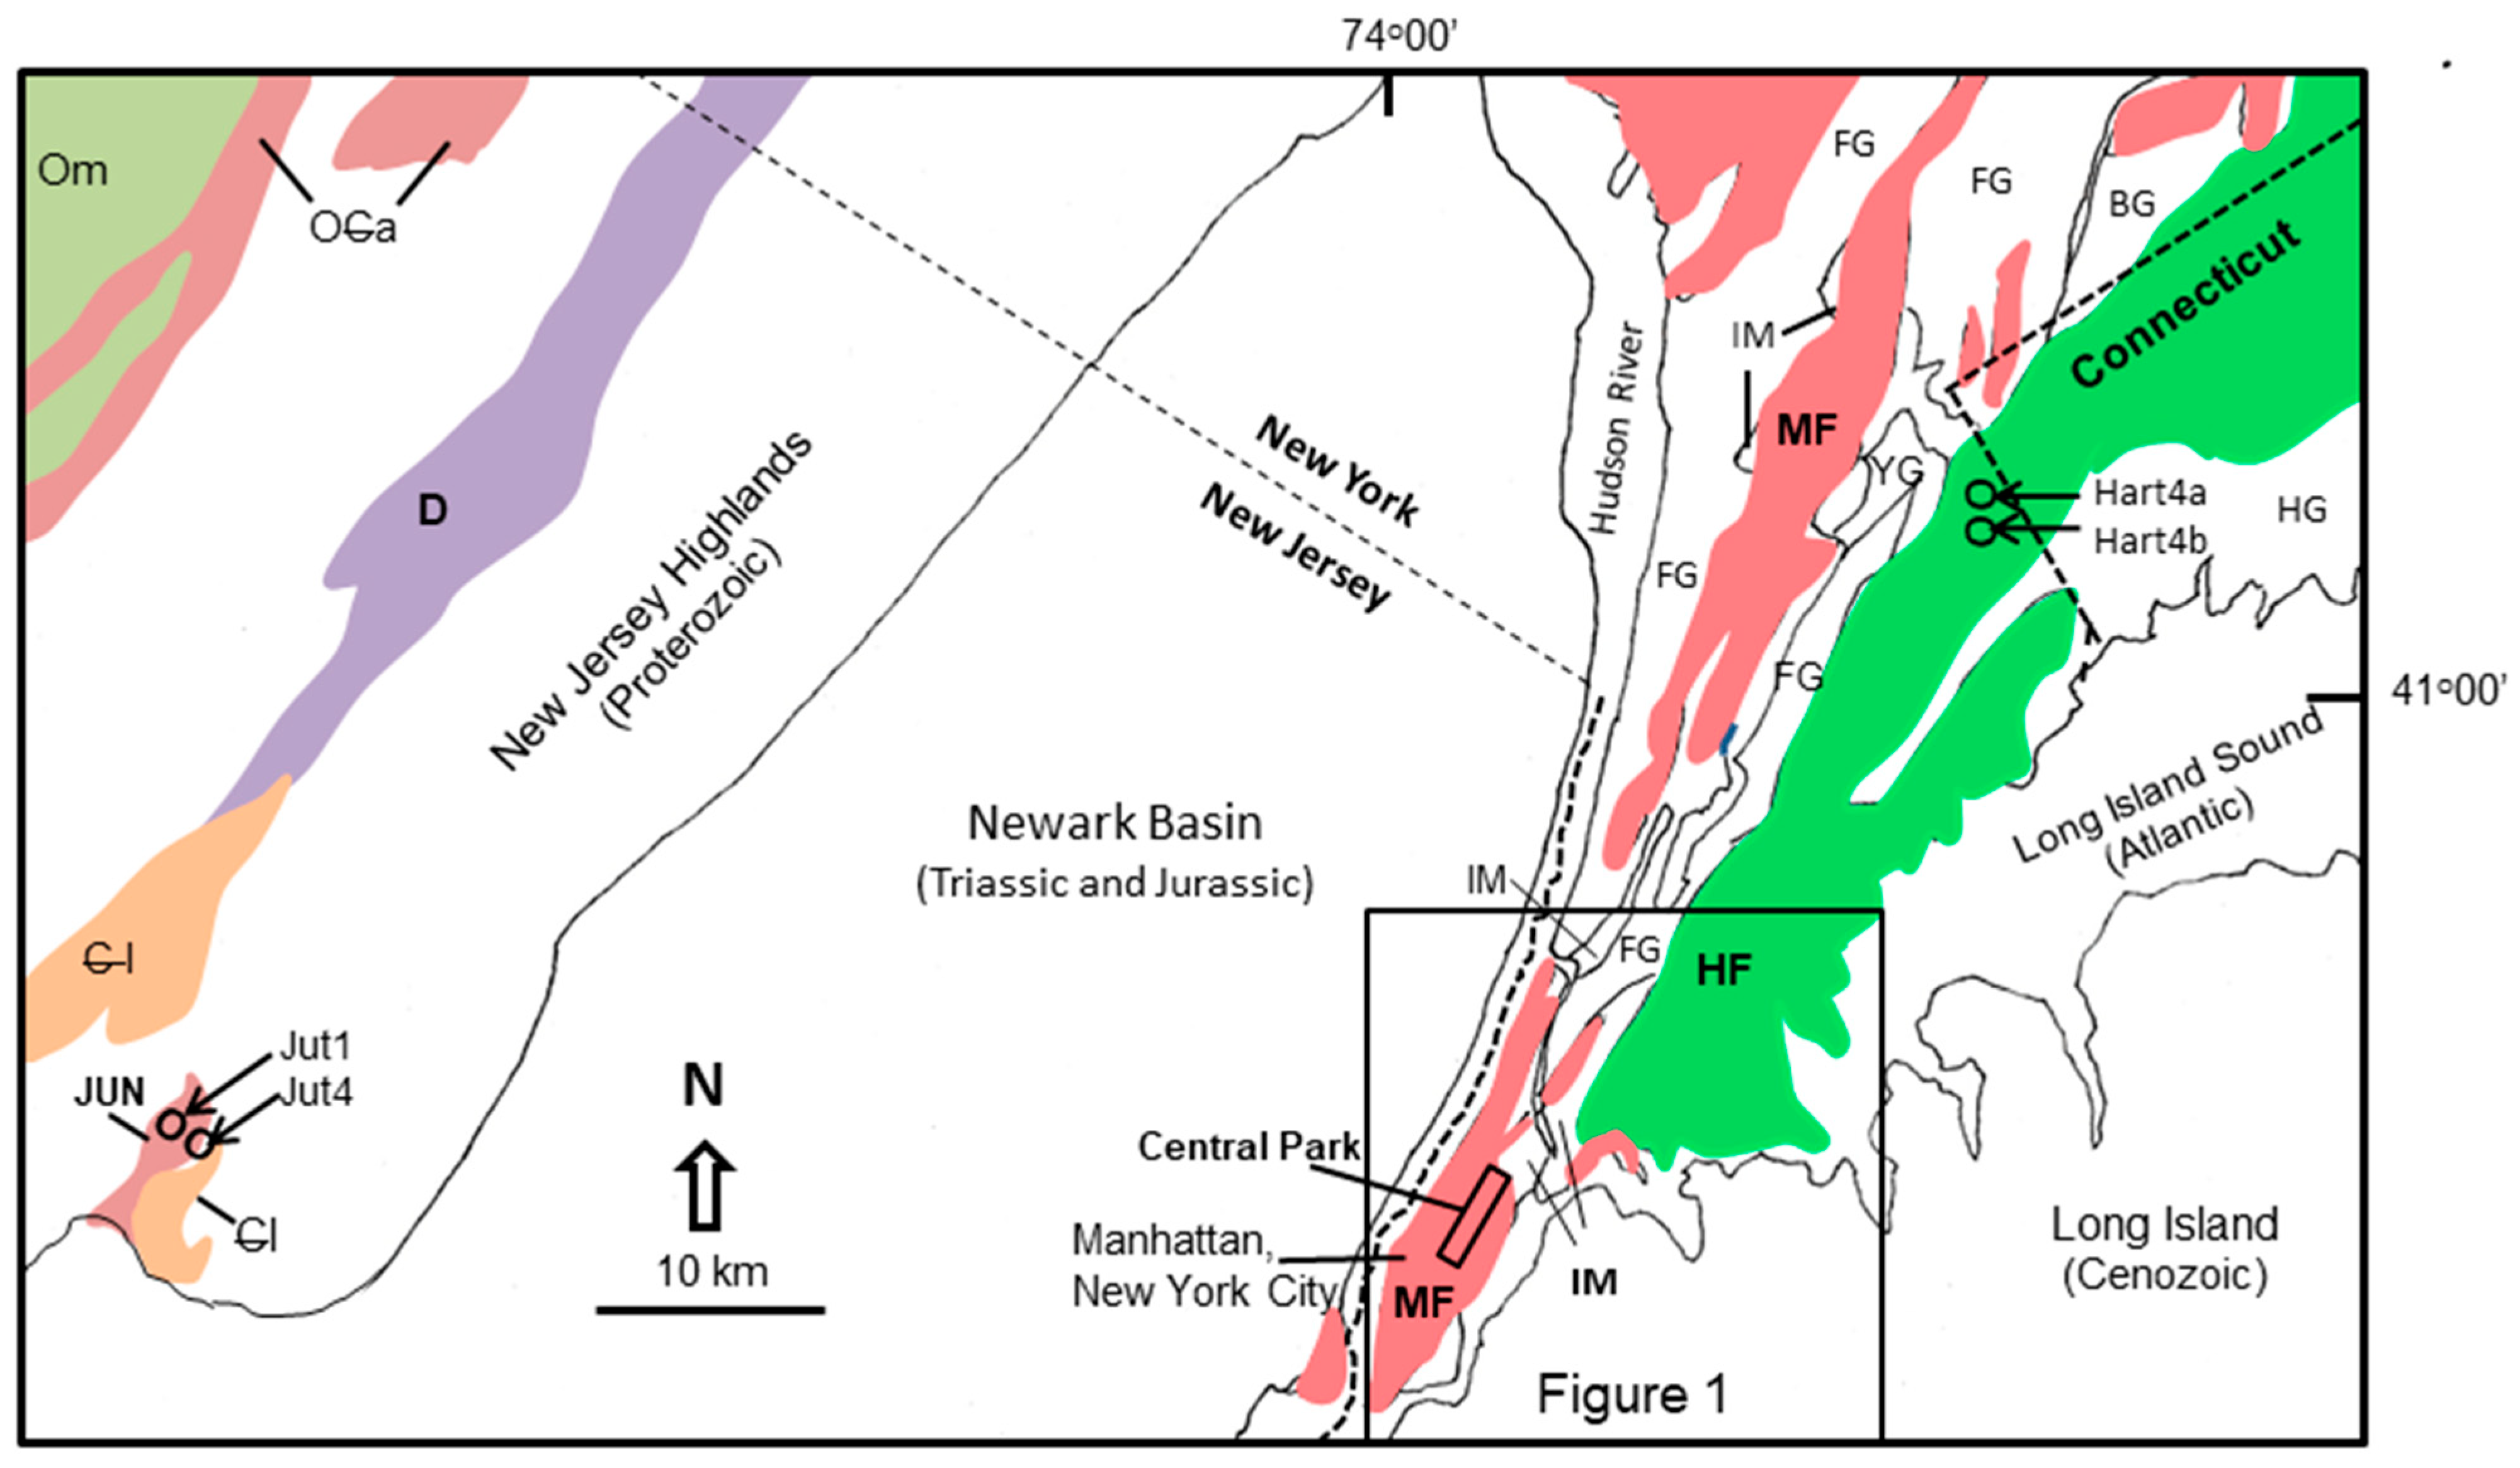
Geologic maps of NYC published from 1987 to 2004 [5,6,7,8,9,10] have moved Cameron’s Line westward to varying degrees and have expanded the area mapped as the Hartland Formation from Connecticut, deep into NYC (Figure 1). However, this has left the geology of almost all the areas of NYC in dispute, with only a few locations where the geology is agreed upon [5,6,7,8,9,10].
Currently, we are left with three proposed mica schist formations: an autochthonous Manhattan Member A, an allochthonous Manhattan Member C, and an allochthonous Hartland Formation. However, the basis for making these subdivisions and name changes is not indisputable (Figure 1). We will entertain the possibility that all the mica schists of NYC are indistinguishable from each other. To minimize confusion throughout this paper, we will use “Manhattan schist” as a generic term for any of the three named schists, unless otherwise indicated.
Currently, there is also no agreed version of any geologic map of NYC, although the existence of three schist units (Hartland Formation, Manhattan Formation, and Members A and C) is becoming entrenched in the literature. The western boundary of the Hartland Formation is based on the position and validity of Cameron’s line. However, the position of Cameron’s line is disputable (Figure 1), and the interpretation of Cameron’s line as the boundary between two mappable formations is also disputable. We will attempt to determine the number of mappable (unique) schist formations within NYC by chemically analyzing each proposed schist formation to search for any unique geochemical characteristic. Other characteristics, such as mineralogy or metamorphic grade, overlap and are ambiguous.

1.3. Question 2: What Was the Sedimentary Protolith of the Manhattan Schists?

The most obvious choice of protolith would be any of the thick early Paleozoic shale or slate formations located west of Manhattan, including the Martinsburg Formation of New Jersey and the Normanskill Formation of New York (Figure 2), or perhaps a more distal northern formation, such as the Walloomsac, or even an eastern source such as an exotic terrane accreted during the early Paleozoic. Compelling, recently published radiometric evidence demonstrates that the zircon content of both Hartland and Manhattan C schist from NYC is dominantly Grenvillian-aged and is, therefore, Laurentian and not Gondwanan or eastern exotic terrane-sourced [11]. This has constrained the choice of protoliths to a Grenvillian and, therefore, Laurentian or western source. Additional constraints that are needed to determine the best choice of protolith include geochemical consistency, proximity, and stratigraphic considerations. We will, therefore, review the latest published radiometric evidence pertaining to the timing of the Taconic subduction, which was responsible for the metamorphism of the Manhattan schist. The time range of active Taconic subduction will constrain the choice of any protolith. Any pelite that was deposited after Taconic subduction was active can be eliminated as a viable choice. We have also chemically analyzed plausible protolith samples to determine their degree of chemical resemblance to the Manhattan schist.
The 3.25-km-thick [16] Martinsburg Formation of Northern New Jersey and its correlatives across the New York State line to the north, particularly the Normanskill Formation, are widespread and well-known. However, there is also the much less well-known Jutland Klippe Sequence (Figure 2 and Figure 3) to consider. Although the Jutland Klippe Sequence is not exposed over very large areas that are comparable to the Martinsburg Formation, it is exposed intermittently across the 45-km southeastern boundary of the New Jersey Highlands, directly west of NYC (Figure 2 and Figure 3), and is 1.27 to 1.37 km thick [17]. Until further constrained by additional evidence (which we will provide), each of these pelites is a viable candidate.
If the protolith can be determined and if the age of deposition of the protolith can be determined, an added bonus would be the obvious determination of the depositional age of the Manhattan schist. Luckily, each of the leading candidates for protolith contains datable fossils. The greywackes and turbidities of the Martinsburg Formation are commonly barren of fossil content, but there are beds containing graptolite assemblages, ranging from Climacograptus bicornis and Corynoicdes americanus at the base to Orthograptus ruedemanni and Climacograpyus spiniferus near the top, which were interpreted as Upper and Middle Ordovician in 1967 [16]. The fossil content of the Jutland sediments is relatively abundant and has recently been described [17].
Subdivisions of the Jutland Klippe (Figure 3) are defined [17] as the Hensfoot Formation (500 to 600 m thick), which is described as a “Heterogeneous sequence of interbedded red and green, thin-bedded shale, interlaminated with dolomite…” containing graptolites ranging from Zone 4 to Zone 12 [18] of the Lower Ordovician to the lower Upper Ordovician and conodonts ranging from Prioniodus triangularis (upper Lower Ordovician) to Pygodus anserinus (lower Upper Ordovician). The underlying Spruce Run Formation was subdivided into two members [17]. The upper member is the Mulhockaway Creek Member, which has been described as a 500-meter-thick “Interbedded red, pale brown and green, thin-bedded shale…” containing graptolites in the span of Zone 2 and Zone 4 [18], or the lower Lower Ordovician to mid-Lower Ordovician, and conodonts in the span of Euconodontus notchpeakensis to Paroistidus proteus, or the uppermost Cambrian to mid-Lower Ordovician. The lower member is the Van Syckel Member, which is described as an Upper Cambrian rock, 270 m thick, comprising medium gray to brown, fine- to coarse-grained sandstone and quartz-pebble conglomerate, and medium to dark gray shale and siltstone [17]. The age of the Jutland Klippe sediments is, therefore, distinctly older than the Martinsburg sediments and correlatives of the Martinsburg.

2. Methods

Samples for chemical analyses were selected at key locations to represent each of the three mapped Manhattan schist units of NYC (Members A and C of the Manhattan Formation and the Hartland Formation) in order to address question 1: How many mappable schist formations are exposed in NYC? One of the sedimentary protolith candidates, the Jutland Formation, was also sampled to address question 2: What was the sedimentary protolith of the Manhattan schists? The data in Table 1 represent the first near-complete chemical analyses of the Hartland and Manhattan schists and Jutland Klippe sediments published to date.

2.1. Chemical Analyses

Major elements were chemically analyzed using inductively coupled plasma atomic emission spectrometry (ICP-AES). The trace metals As, Bi, Hg, In, Re, Sb, Se, Te, and Tl were analyzed using inductively coupled plasma mass spectrometry (ICP-MS). A lithium borate fusion preparation was administered before ICP-MS for the lanthanides and Ba, Cr, Cs, Ga, Ge, Hf, Nb, Rb, Sn, Sr, Ta, Th, U, V, W, Y, and Zr. The base metals Ag, Cd, Co, Cu, Li, Mo, Ni, Pb, Sc, and Zn were digested in a four-acid preparation before ICP-AES analysis. Loss on ignition was determined gravimetrically at 1000 °C. Total sulfur and total carbon were determined using LECO infrared spectroscopy. The registered unidentified rock standards, AMIS0304 and OREAS-101b, and the granite standard AMIS0085 were utilized for ICP-AES and lithium borate fusion ICP-MS analyses [19]. The standard GS310-10, containing 1.05 wt.% C and 0.26 wt.% S, and MA-1b, containing 2.48 wt.% C and 1.12 wt.% S, were utilized for the LECO analyses. The standards MRCA-21 and OREAS-101b, containing <20 ppm of As, Bi, Hg, In, Re, Sb, Se, Te, and Tl were utilized for conventional ICP-MS analyses. The standards AMIS0343 and EMOG-17, containing wide-ranging base metal contents (8270 ppm to 1.0 ppm), were utilized for the 4-acid digestion ICP-AES analyses. The lower target range for the blank analyses consisted of values < LOD, while the upper target range was twice the value for LOD. Blanks for each element were determined to fall within the target range except for SiO2, which was measured at 0.03% and which is outside the target range of <0.01 and 0.02%. Duplicate analyses were run on a standard and on the sample Jut1, with results that were, in each case, within the target range of acceptability. The LOD values are presented in Appendix B, Table A2.

2.2. Sample Selection

Samples were taken, considering the overlapping zones in the proposed mapping on recent geologic maps and the previously proposed members (Figure 1 and [20]).
Manhattan A sample “ManA6” was collected at the western edge of Borough Hall Park, Bronx, NYC, also known as Walter Gladwin Park (Figure 1). It is a garnet-muscovite-quartz-plagioclase-biotite schist located at 40.8458591, −73.8966214. Eight additional samples of Manhattan A from Borough Hall Park were collected and chemically analyzed for their major element content [21].
Manhattan C sample “ManC2” was collected from the southeastern edge of the City College of New York campus at 40.8177734, −73.9498419. Manhattan C (sample ManC15) was collected along the east side of Central Park West at 40.7977206, −73.9602443. Fifteen additional samples of Manhattan C were collected for major element analysis [22] from northern Central Park, at locations interpreted in [5,9] as Manhattan C.
Hartland Formation samples were collected at the north end of Orchard Beach, Pelham Bay, the Bronx Borough of NYC, at 40.871894, −73.783239 (Figure 1). These samples are a garnet-rich biotite schist. HartOB1–HartOB4 were collected at 100-meter intervals from north to south along the shoreline. The mineralogy, textures, and structures of the rocks have been described in detail elsewhere [23,24]. Two additional samples of Hartland Formation were collected near the Connecticut State Line (Figure 2). Sample Hart4a was collected at 41.014648, −73.711748, described in [2] as the schist and granulite member of the Hartland Formation, which has been correlated in [12] with the Moretown Formation. Sample Hart4b was collected at 41.014240, −73.711212. Both samples are a light pinkish muscovite-biotite-quartz-feldspar granulite. Thirteen samples of Hartland schist were also collected and analyzed for major element content from each of the thirteen largest outcrops located within Central Park, Manhattan south of Cameron’s Line [22]. These thirteen sample locations were interpreted as being in the Hartland Formation [5,9].
Jutland Klippe Sequence samples (Figure 2) were collected at Chester New Jersey at 40.77103, −74.64248. Sample Jut1 is an argillaceous slate. Sample Jut4 is a green silty slate. The Newark Basin depicted in Figure 2 is an entirely post-Taconic structure that, if eliminated from the picture, would bring the Jutland pelites directly adjacent to Manhattan schist exposures. It is probable that a very large part of the Jutland Klippe Sequence remains hidden from view by the Mesozoic sediments [25].
Chemical analyses of the Martinsburg and Normanskill Formations for comparison with the Manhattan schists have been published previously [26,27,28] (Supplement 1).

3. Results

The results of our chemical analyses are presented in Table 1.
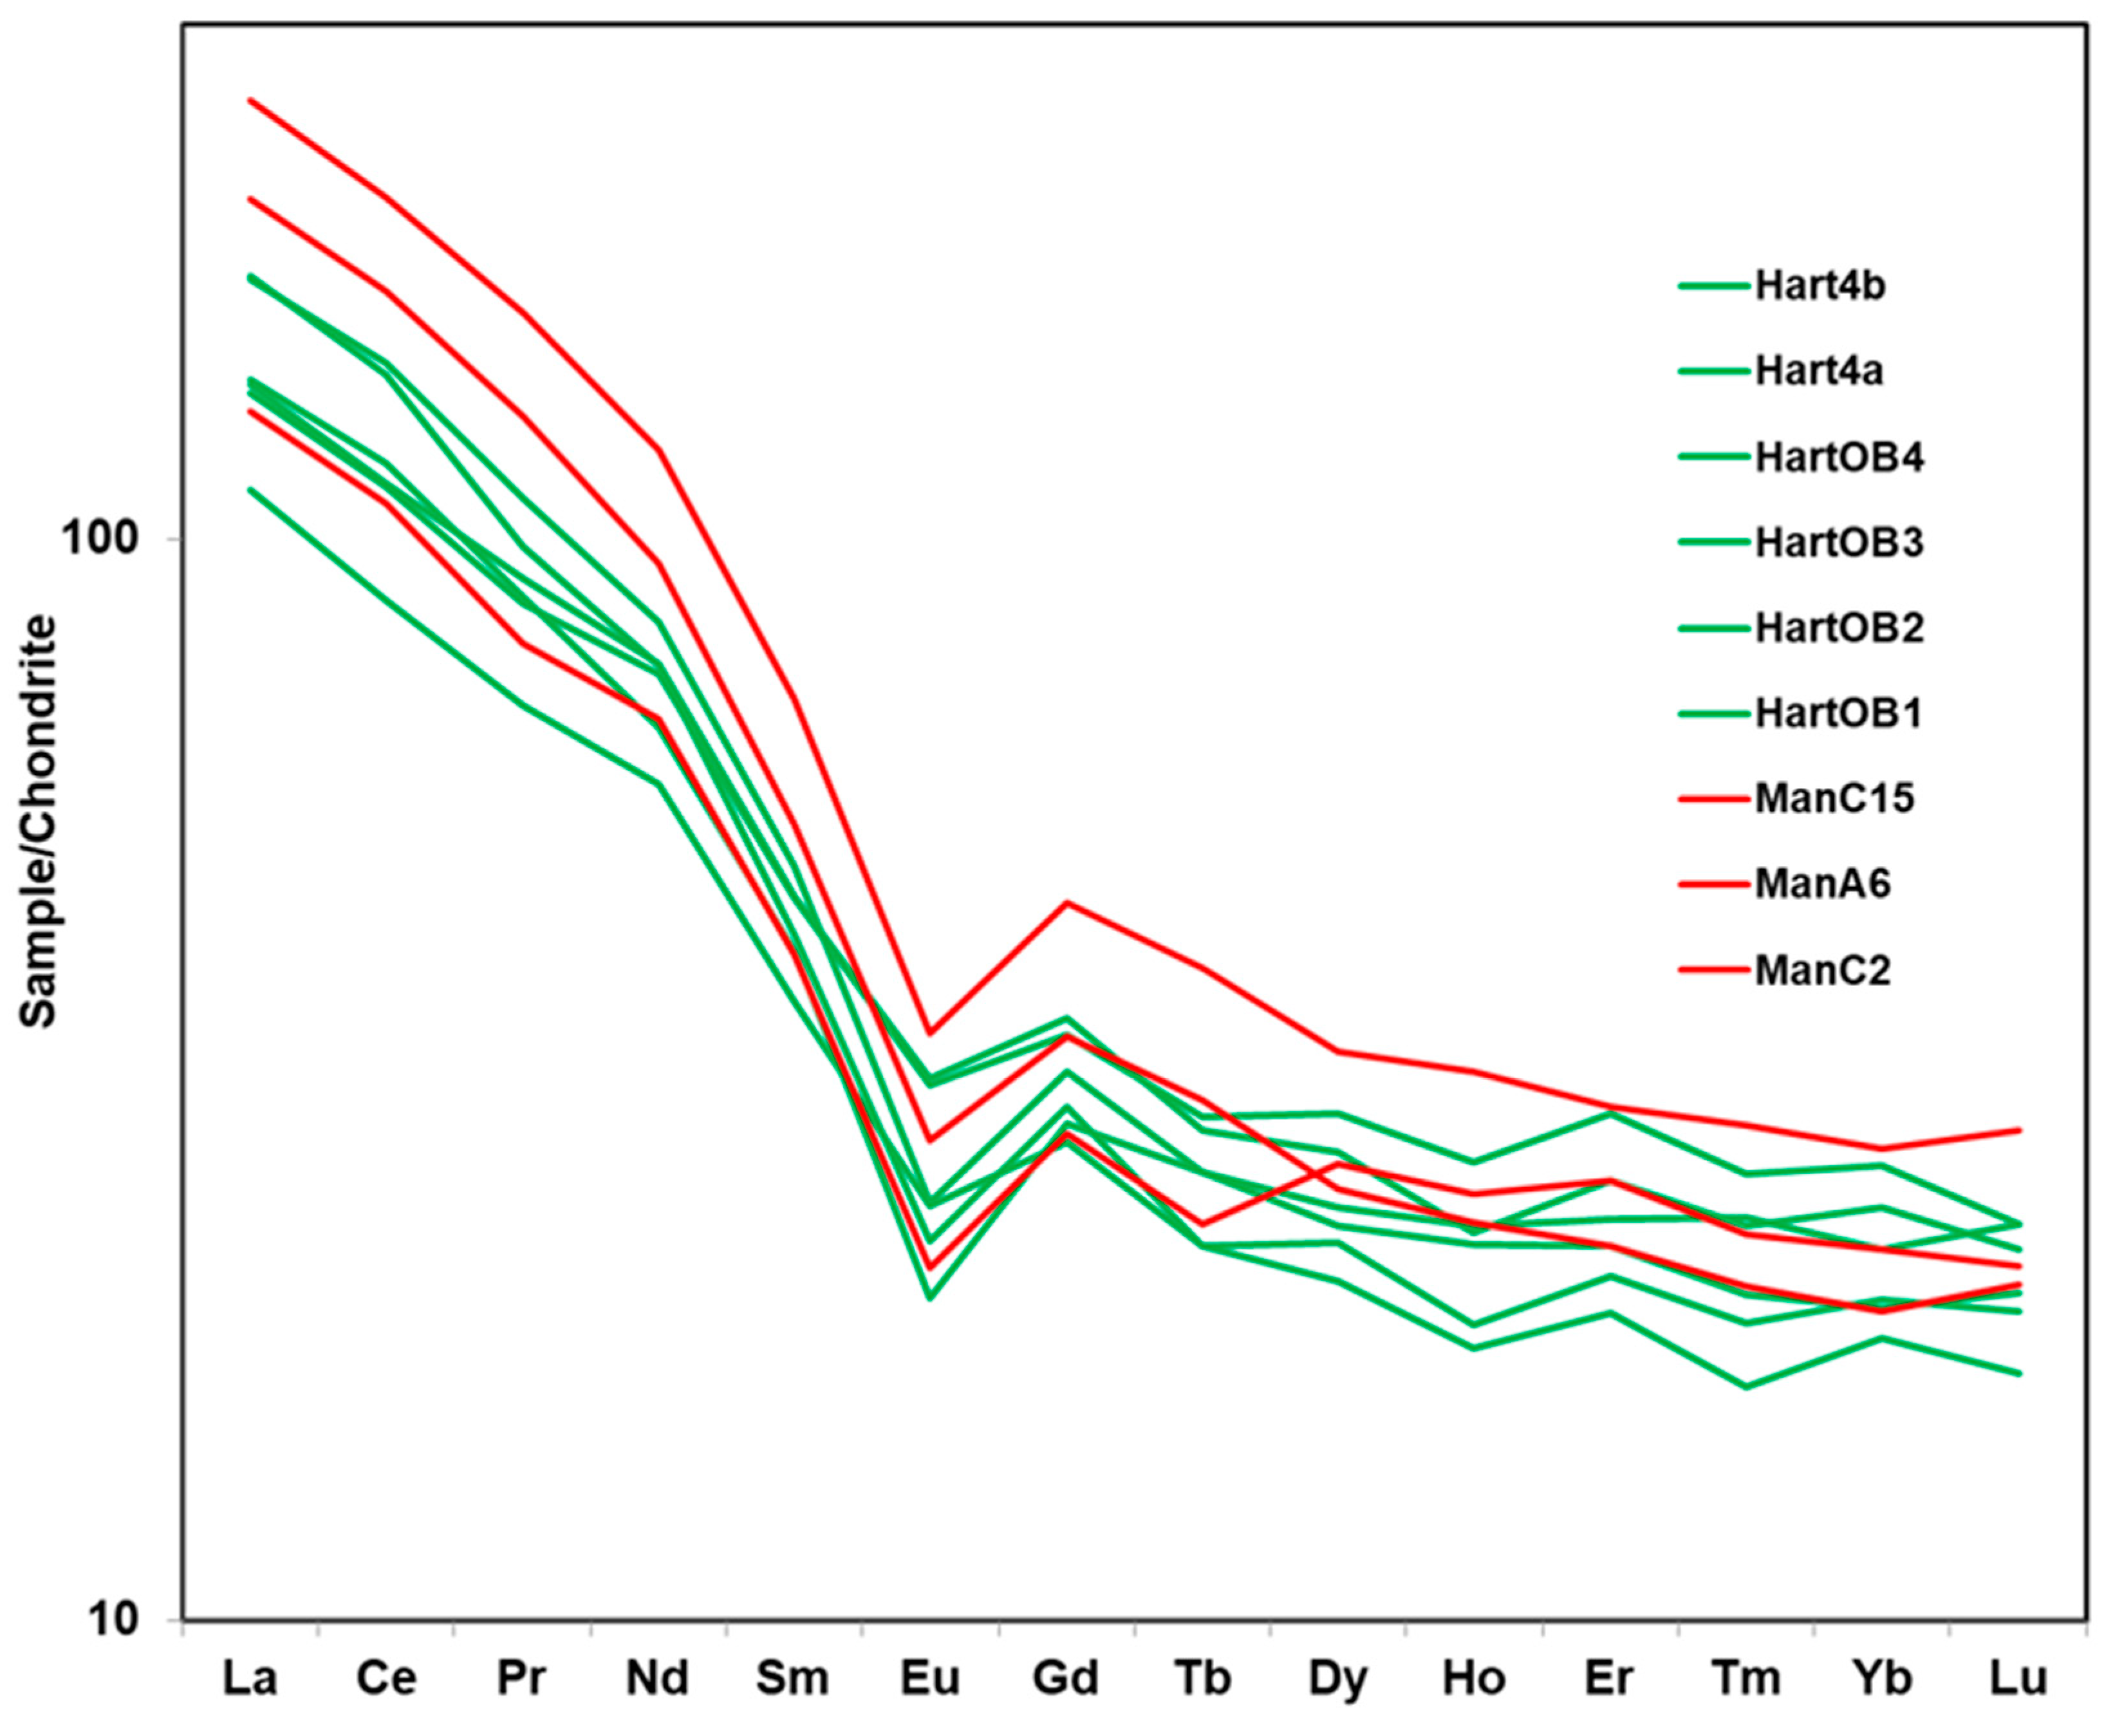
This Results section is devoted to descriptions of the geochemical findings in ways that will allow meaningful interpretations, as will be discussed in the following Discussion section. One way to describe the data is to focus on the most insoluble elements in an attempt to filter out random variations that are sensitive to weathering or local hydrothermal activity [29,30]. Elements displaying the highest degree of variability tend to be the most soluble elements. In addition, variations in the K2O and Na2O data are a function of the random variability in the biotite and sodic plagioclase content at the outcrop site level, which was observed at all sample locations. However, the most insoluble or inert element contents display less variation and, in most cases, do not correlate with K2O or Na2O content (Table 1) or the sample location (Figure 1 and Figure 2). Therefore, to avoid questions about the reliability of soluble elements, only the most inert elements (the REEs) were compared in Figure 4. The results seem to indicate that only one population of data is presented, although more sampling is needed for this to be statistically conclusive.
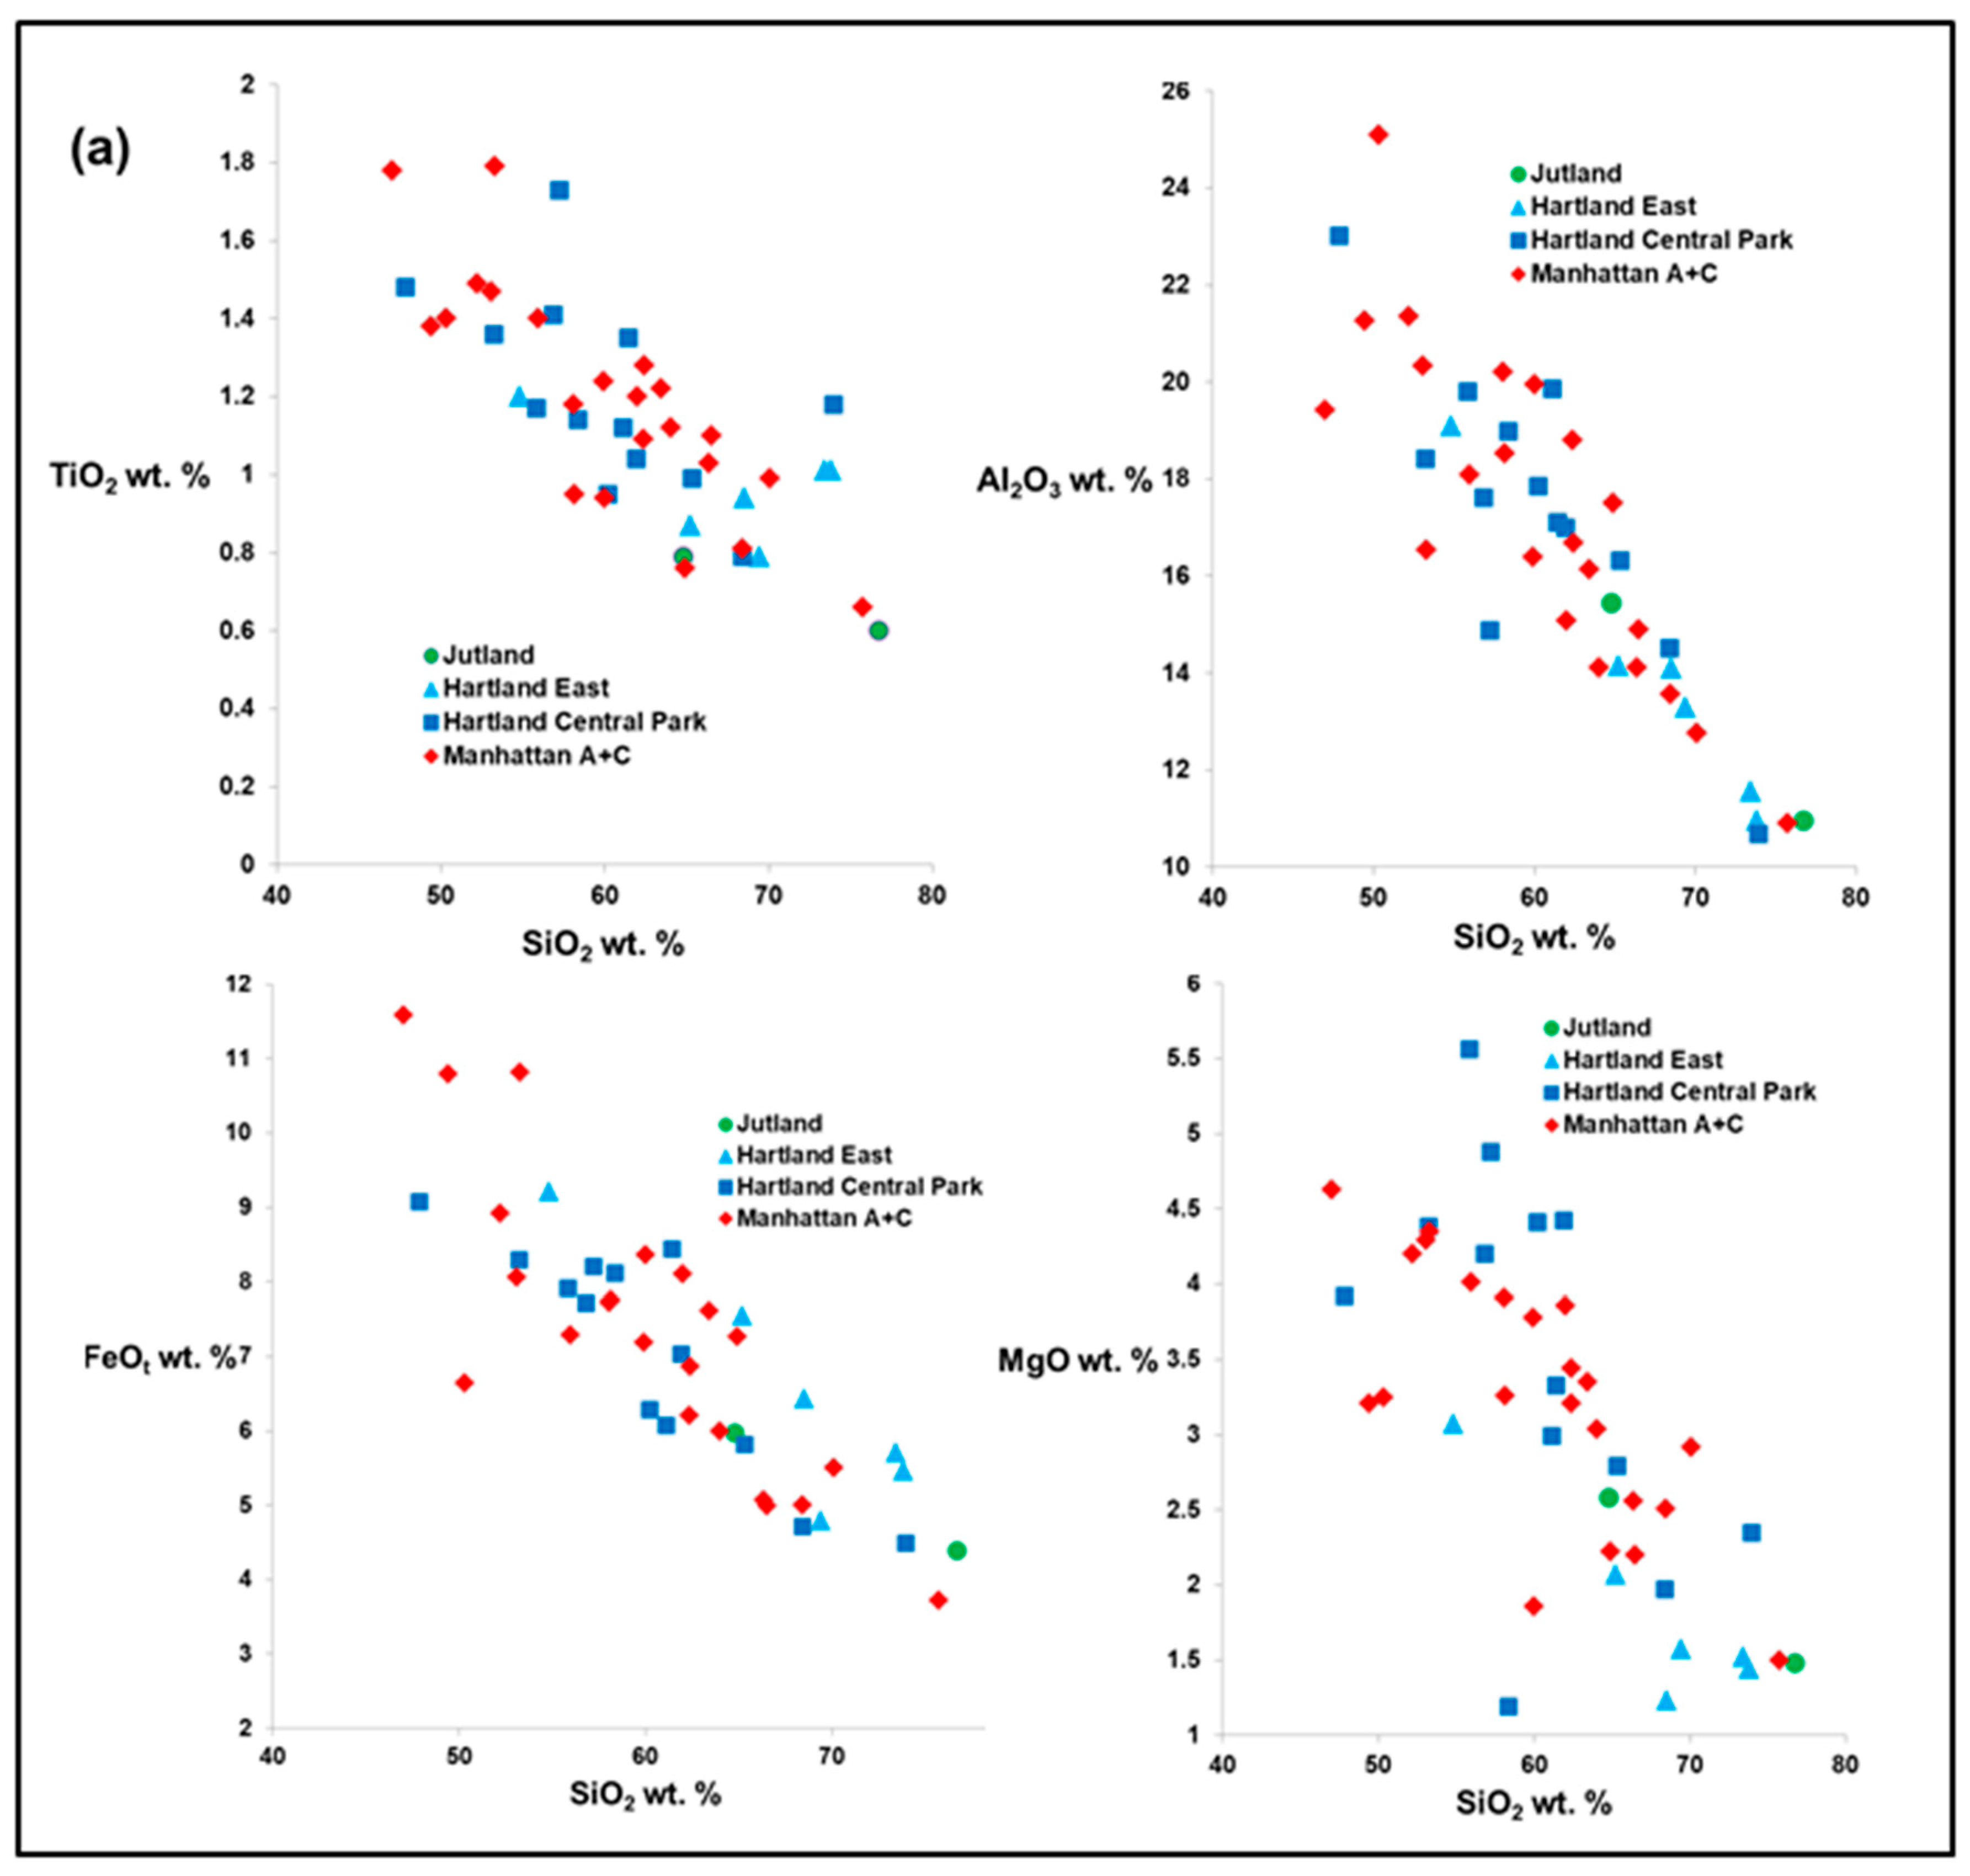
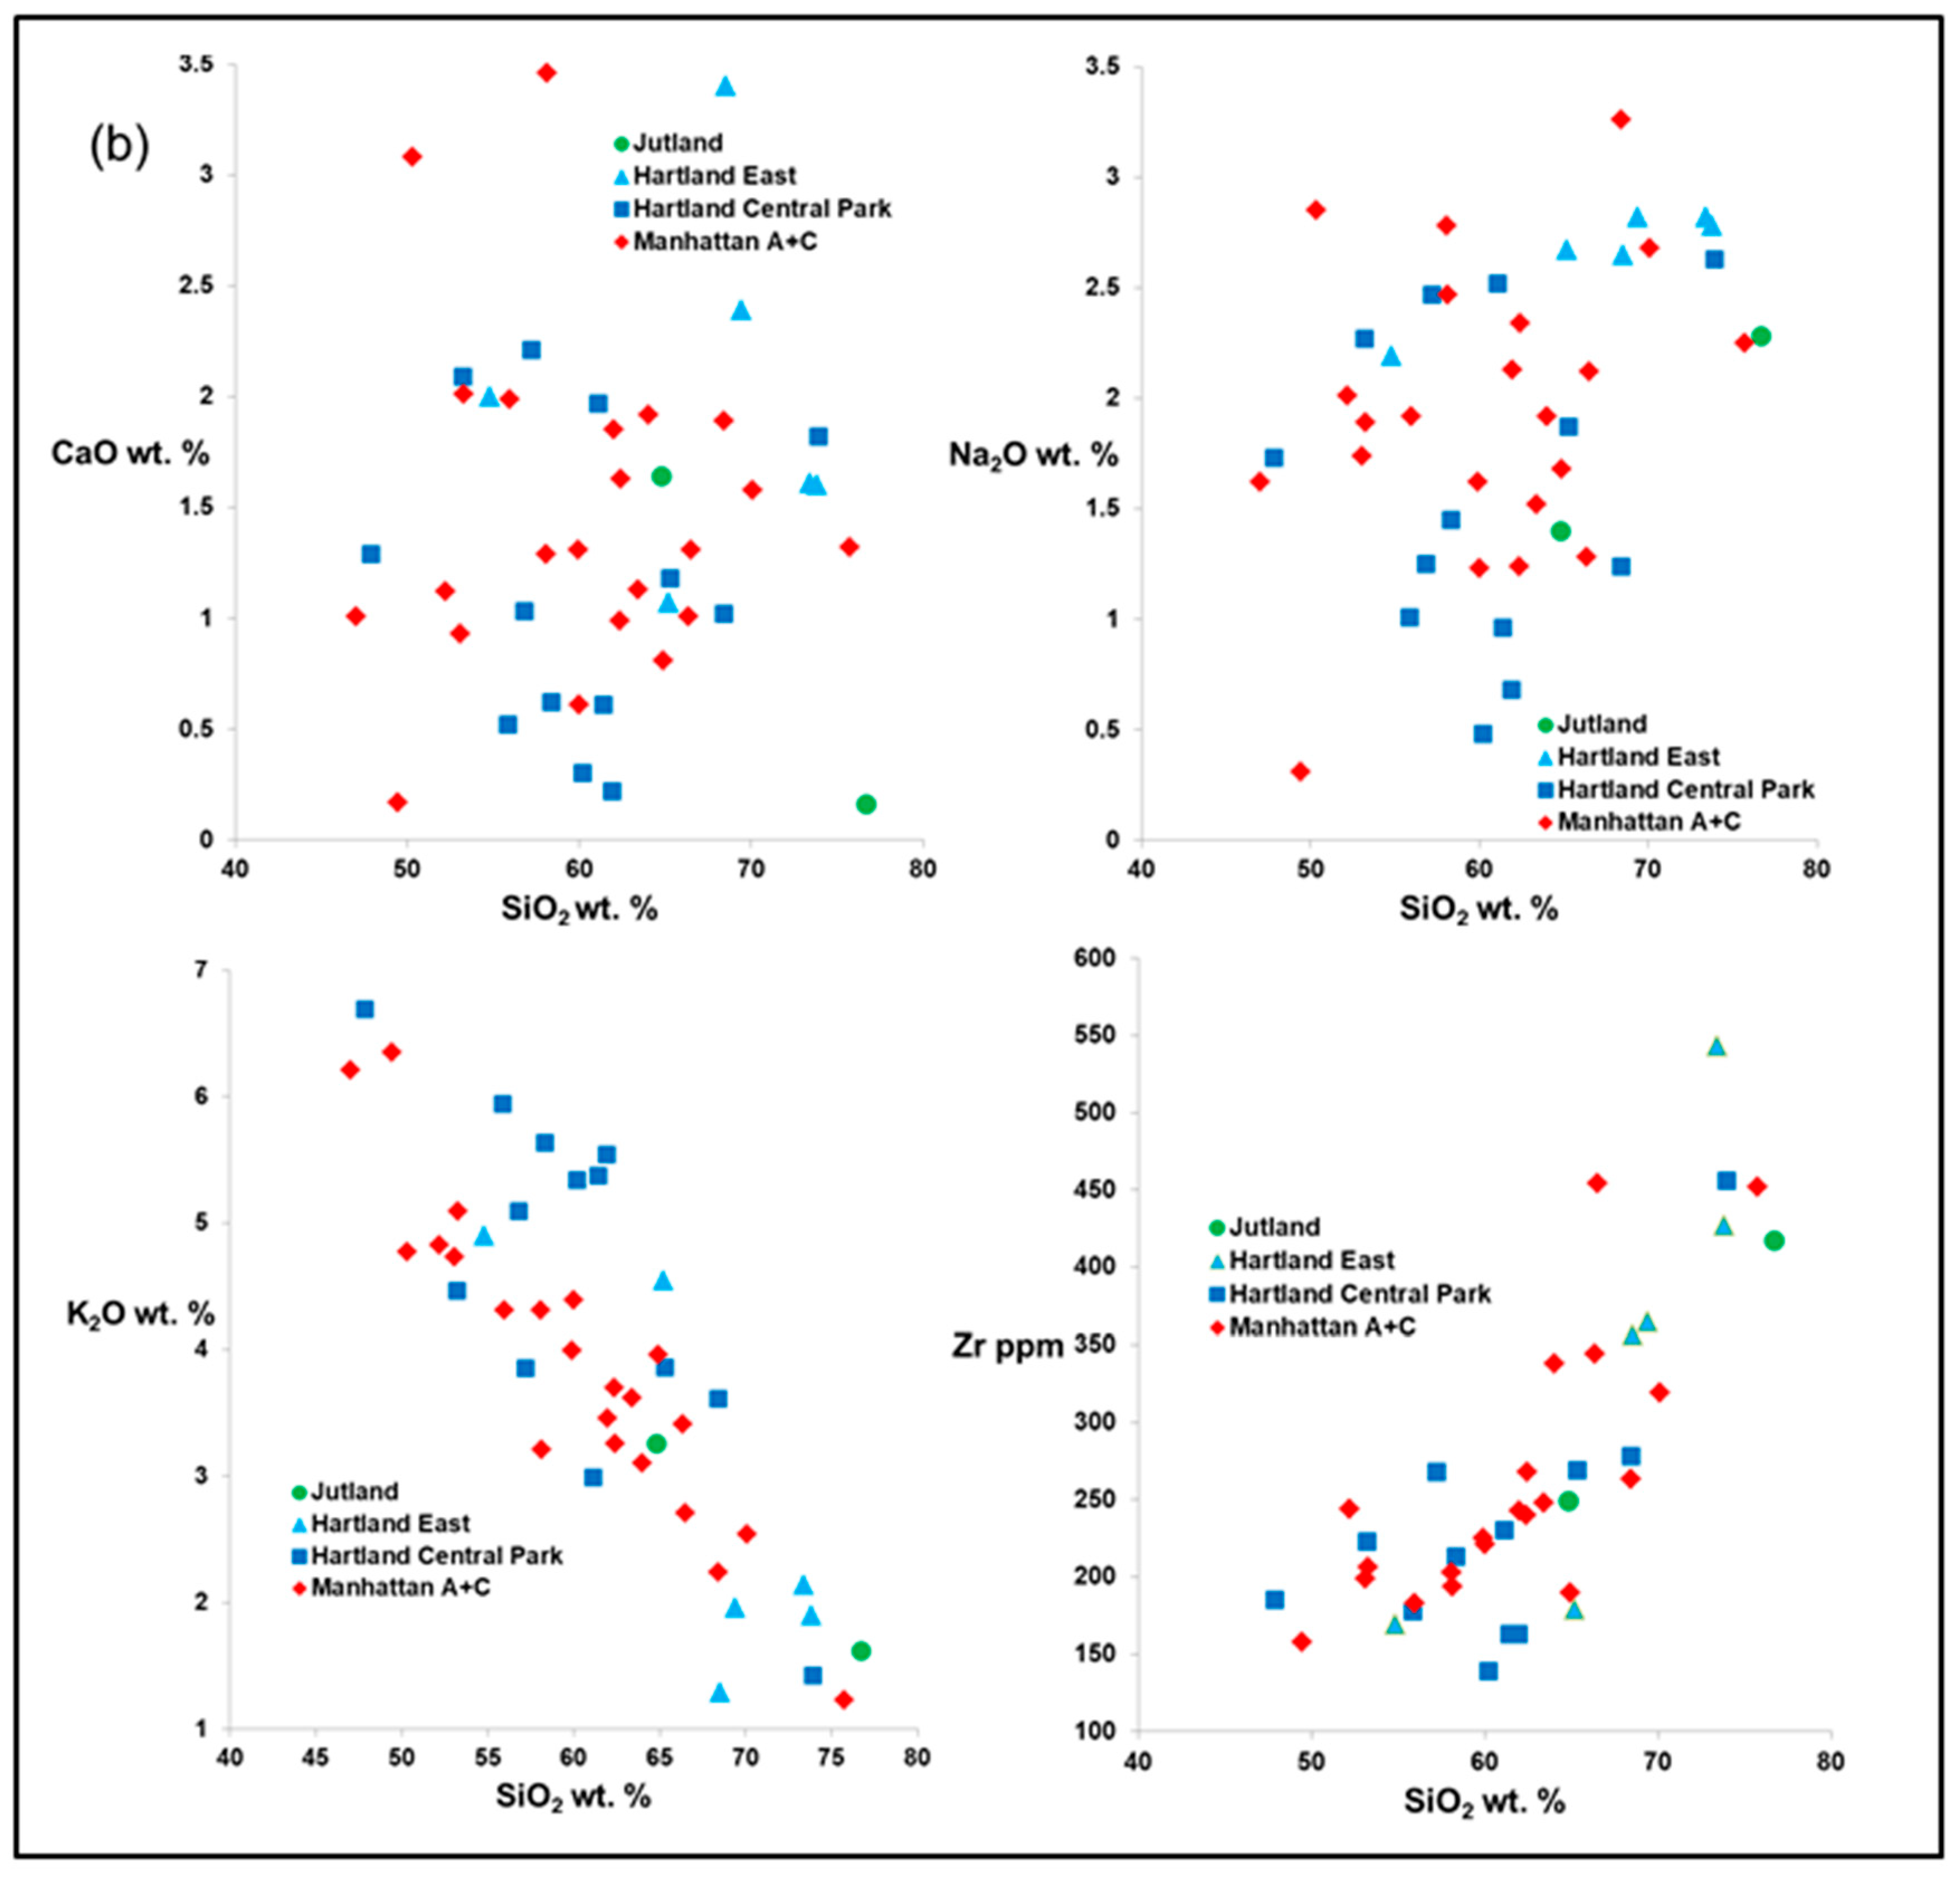
Another popular way to describe the geochemical composition of sedimentary and metamorphic rocks (Table 1) is to focus on the major element content, plotted against the silica content. These plots utilize the most commonly published geochemical data and allow the accumulation of large databases. We have, therefore, combined our new analyses (Table 1) with the previously published major element chemical analyses of the schists of NYC [22]. Each of the major element oxides, together with Zr (a particularly insoluble element), plotted vs. the silica content, are displayed in Figure 5.
As was the case with Figure 4, each of the eight major element vs. silica plots (Figure 5) display only one diverse population of data. The samples of Hartland schist, Manhattan A, Manhattan C and Jutland shale do not plot as definable clusters of data. Our interpretation of this consistent data pattern will be made in the following Discussion section.
Still another diagram (Figure 6) represents the contents of two of the most compatible elements (Ni and Cr) in contrast to Figure 4, which illustrates the distribution of the most incompatible elements. Compatible elements tend to partition into mafic vs. felsic rocks and may supply information pertaining to the source, or provenance, of the various schist samples. The data of Table 1, together with the data from [22], again plot as one diverse population.
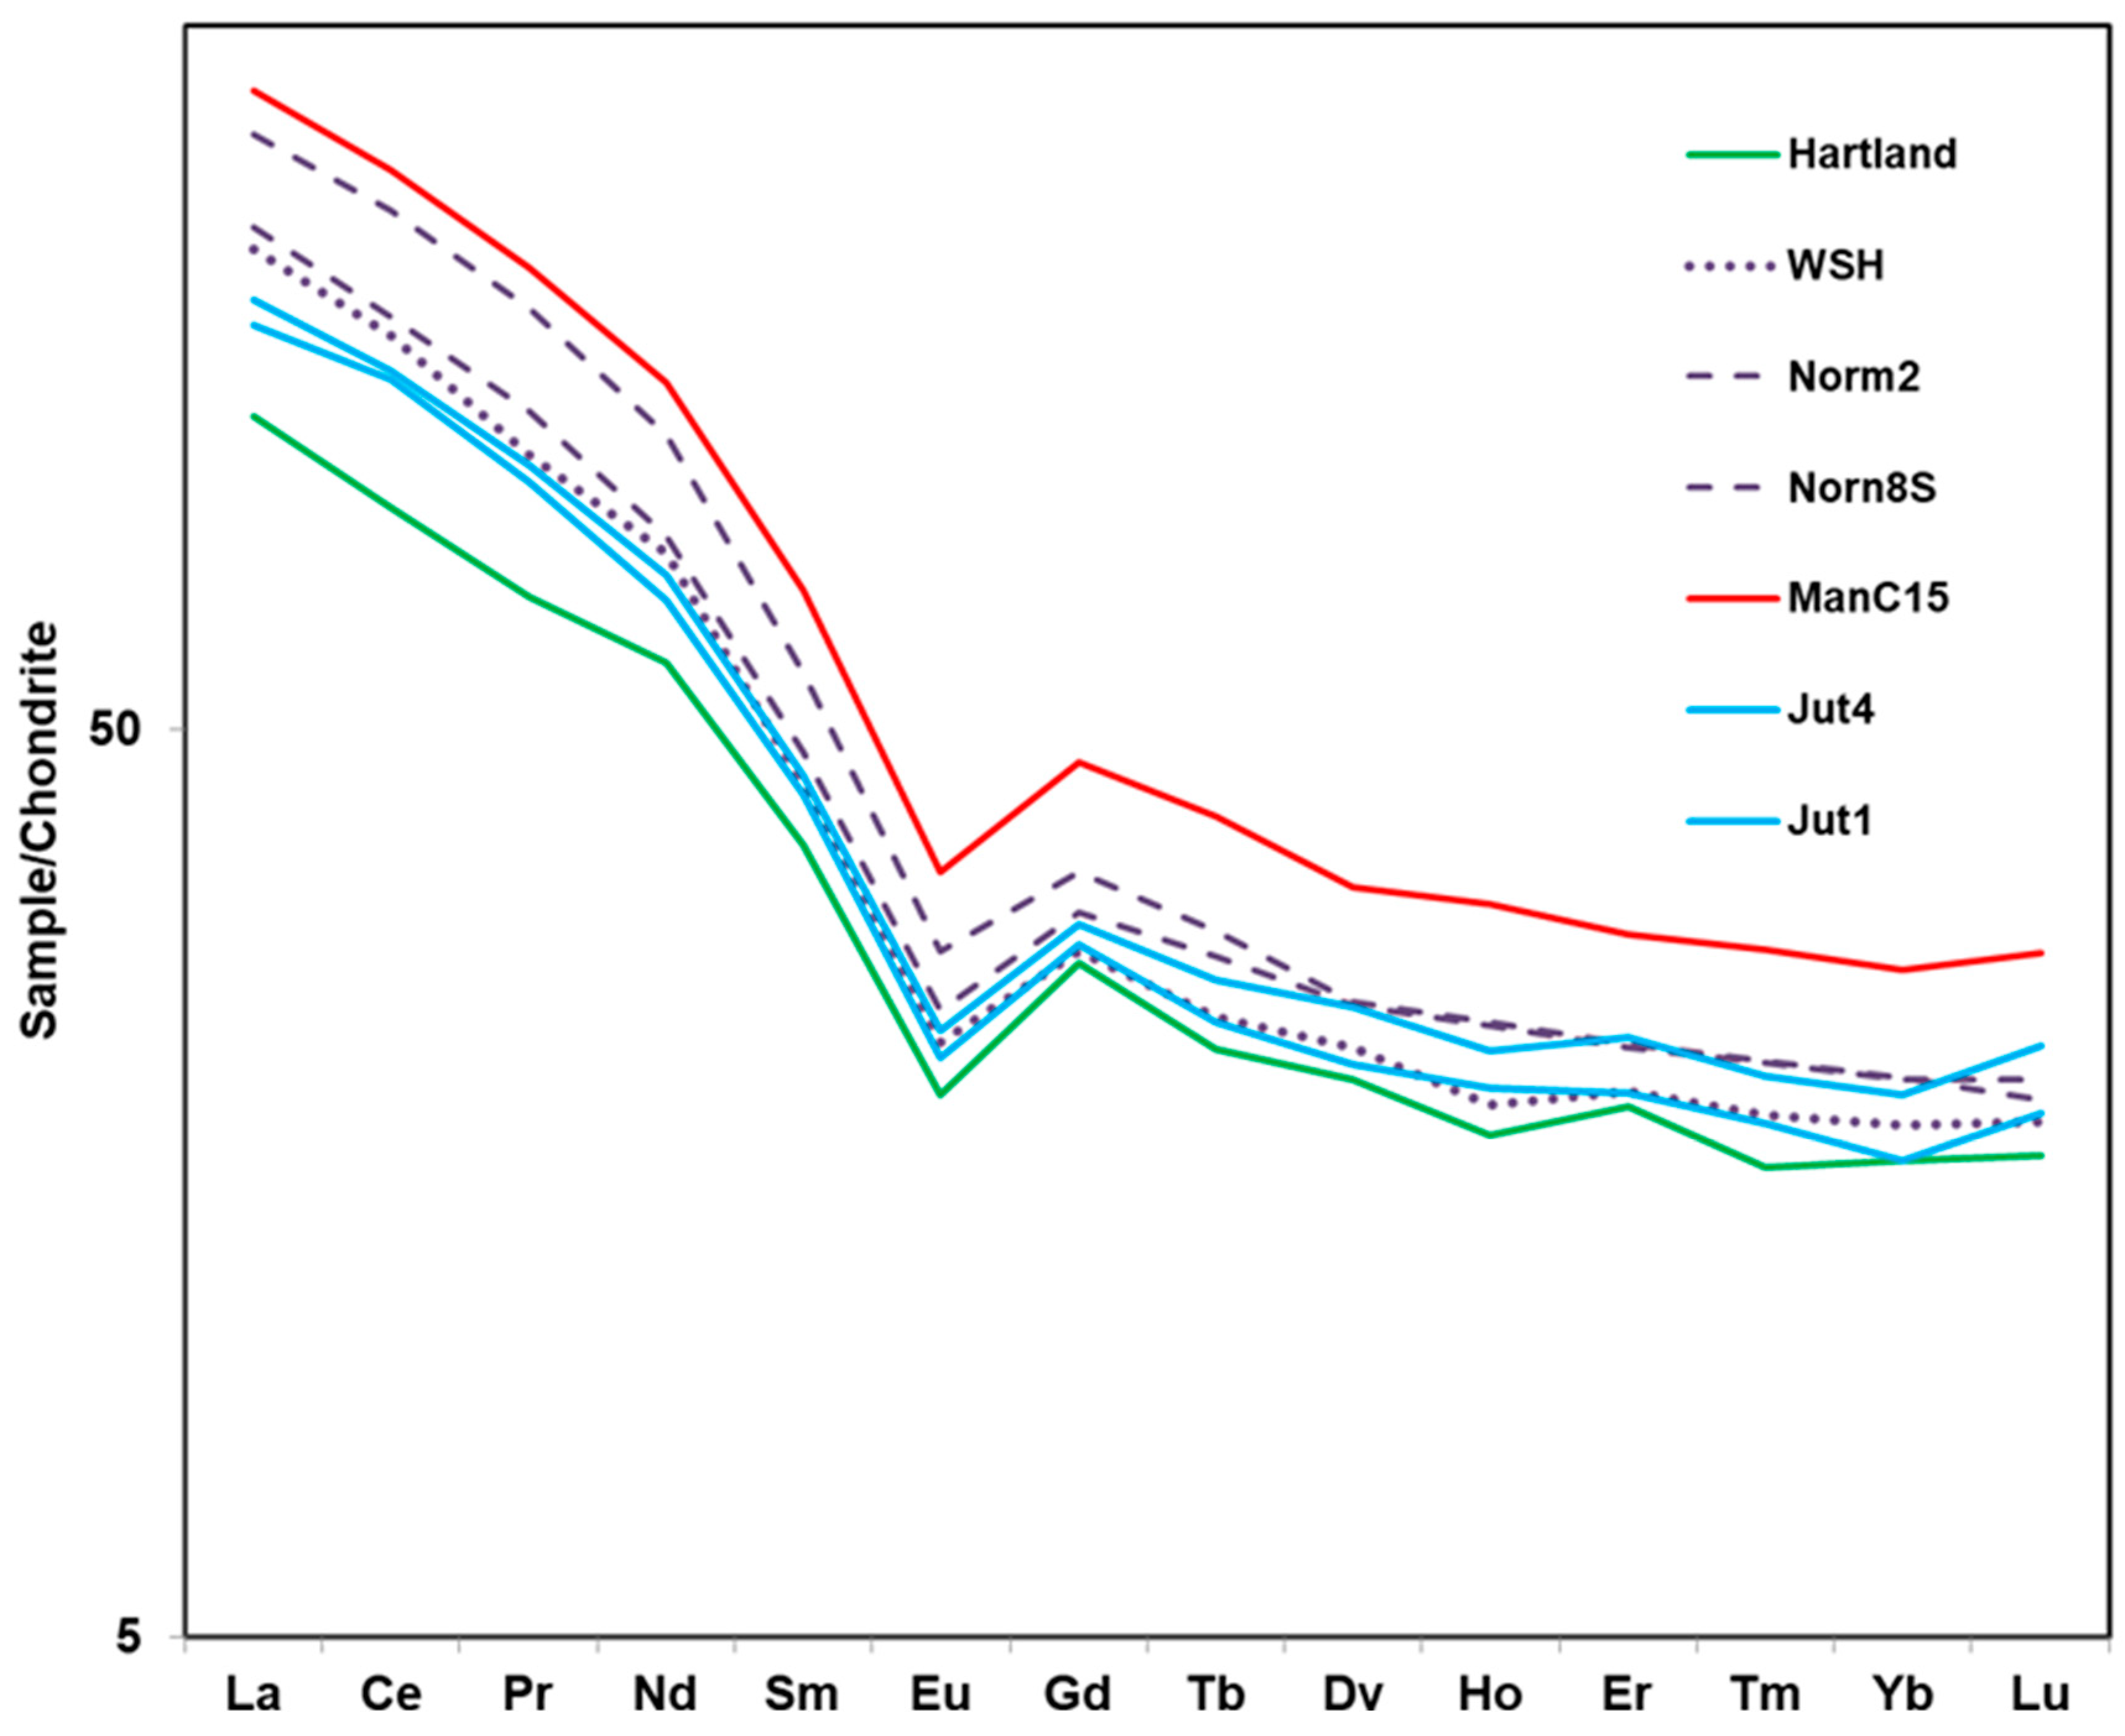
Finally, the results of Table 1 may also be described in terms of: (1) an assessment as to how common or unusual the compositions are; (2) whether or not they are chemically similar to the shales of the Jutland Klippe Sequence; and (3) whether or not the NYC schist compositions are similar to other potential protolith formations located west of NYC. We have, therefore, plotted the upper and lower ranges of the NYC schist data, together with the calculated “World Shale Average” (WSA) [32], onto Figure 7. The results show that the NYC schists could be described as approximately average, to the extent that the WSA plots fall completely within the range of the NYC schist (meta-shale) samples.
Figure 7 also shows that the composition of Jutland Schist samples Jut1 and Jut2 (Table 1) plots fall completely within the range of the NYC schist samples. However, two representative samples of the Austin Glen Member of the Normanskill Formation [27] also plot within the range of the analyzed Manhattan schist samples. The Austin Glen Member is the uppermost member of the Normanskill Formation, which is part of the Taconian flysch belt that reaches from Newfoundland to Alabama. The Normanskill samples that are plotted in Figure 7 were collected about 100 km north of NYC, along Route 44, just west of the Mid-Hudson Bridge [27].

4. Discussion

4.1. Question 1: How Many Mappable Schist Formations Are Exposed in NYC?

The answer to question 1 is provided by the above diagrams 4, 5, 6, and 7, and by the conclusions given in [11]. We have found no geochemical evidence supporting the occurrence of more than one schist formation throughout NYC.

4.2. Question 2: What Was the Protolith of the Manhattan Schist?

Although the geochemical evidence provides some constraints for the answer to question 2, the evidence has been found to be ambiguous because the composition of both the Jutland Klippe shales and the Normanskill schist (a Martinsburg correlative) plots fall within the range of Manhattan schist (Figure 7). We have found, instead, that the determination of the specific source formation or protolith (question 2) is best constrained by the timing of the Taconic sequence of events, which have recently been refined by radiometric studies including Refs. [11,33,34,35,36,37,38,39,40,41] and related structural reviews [42,43].

4.3. Four Tectonic Stages

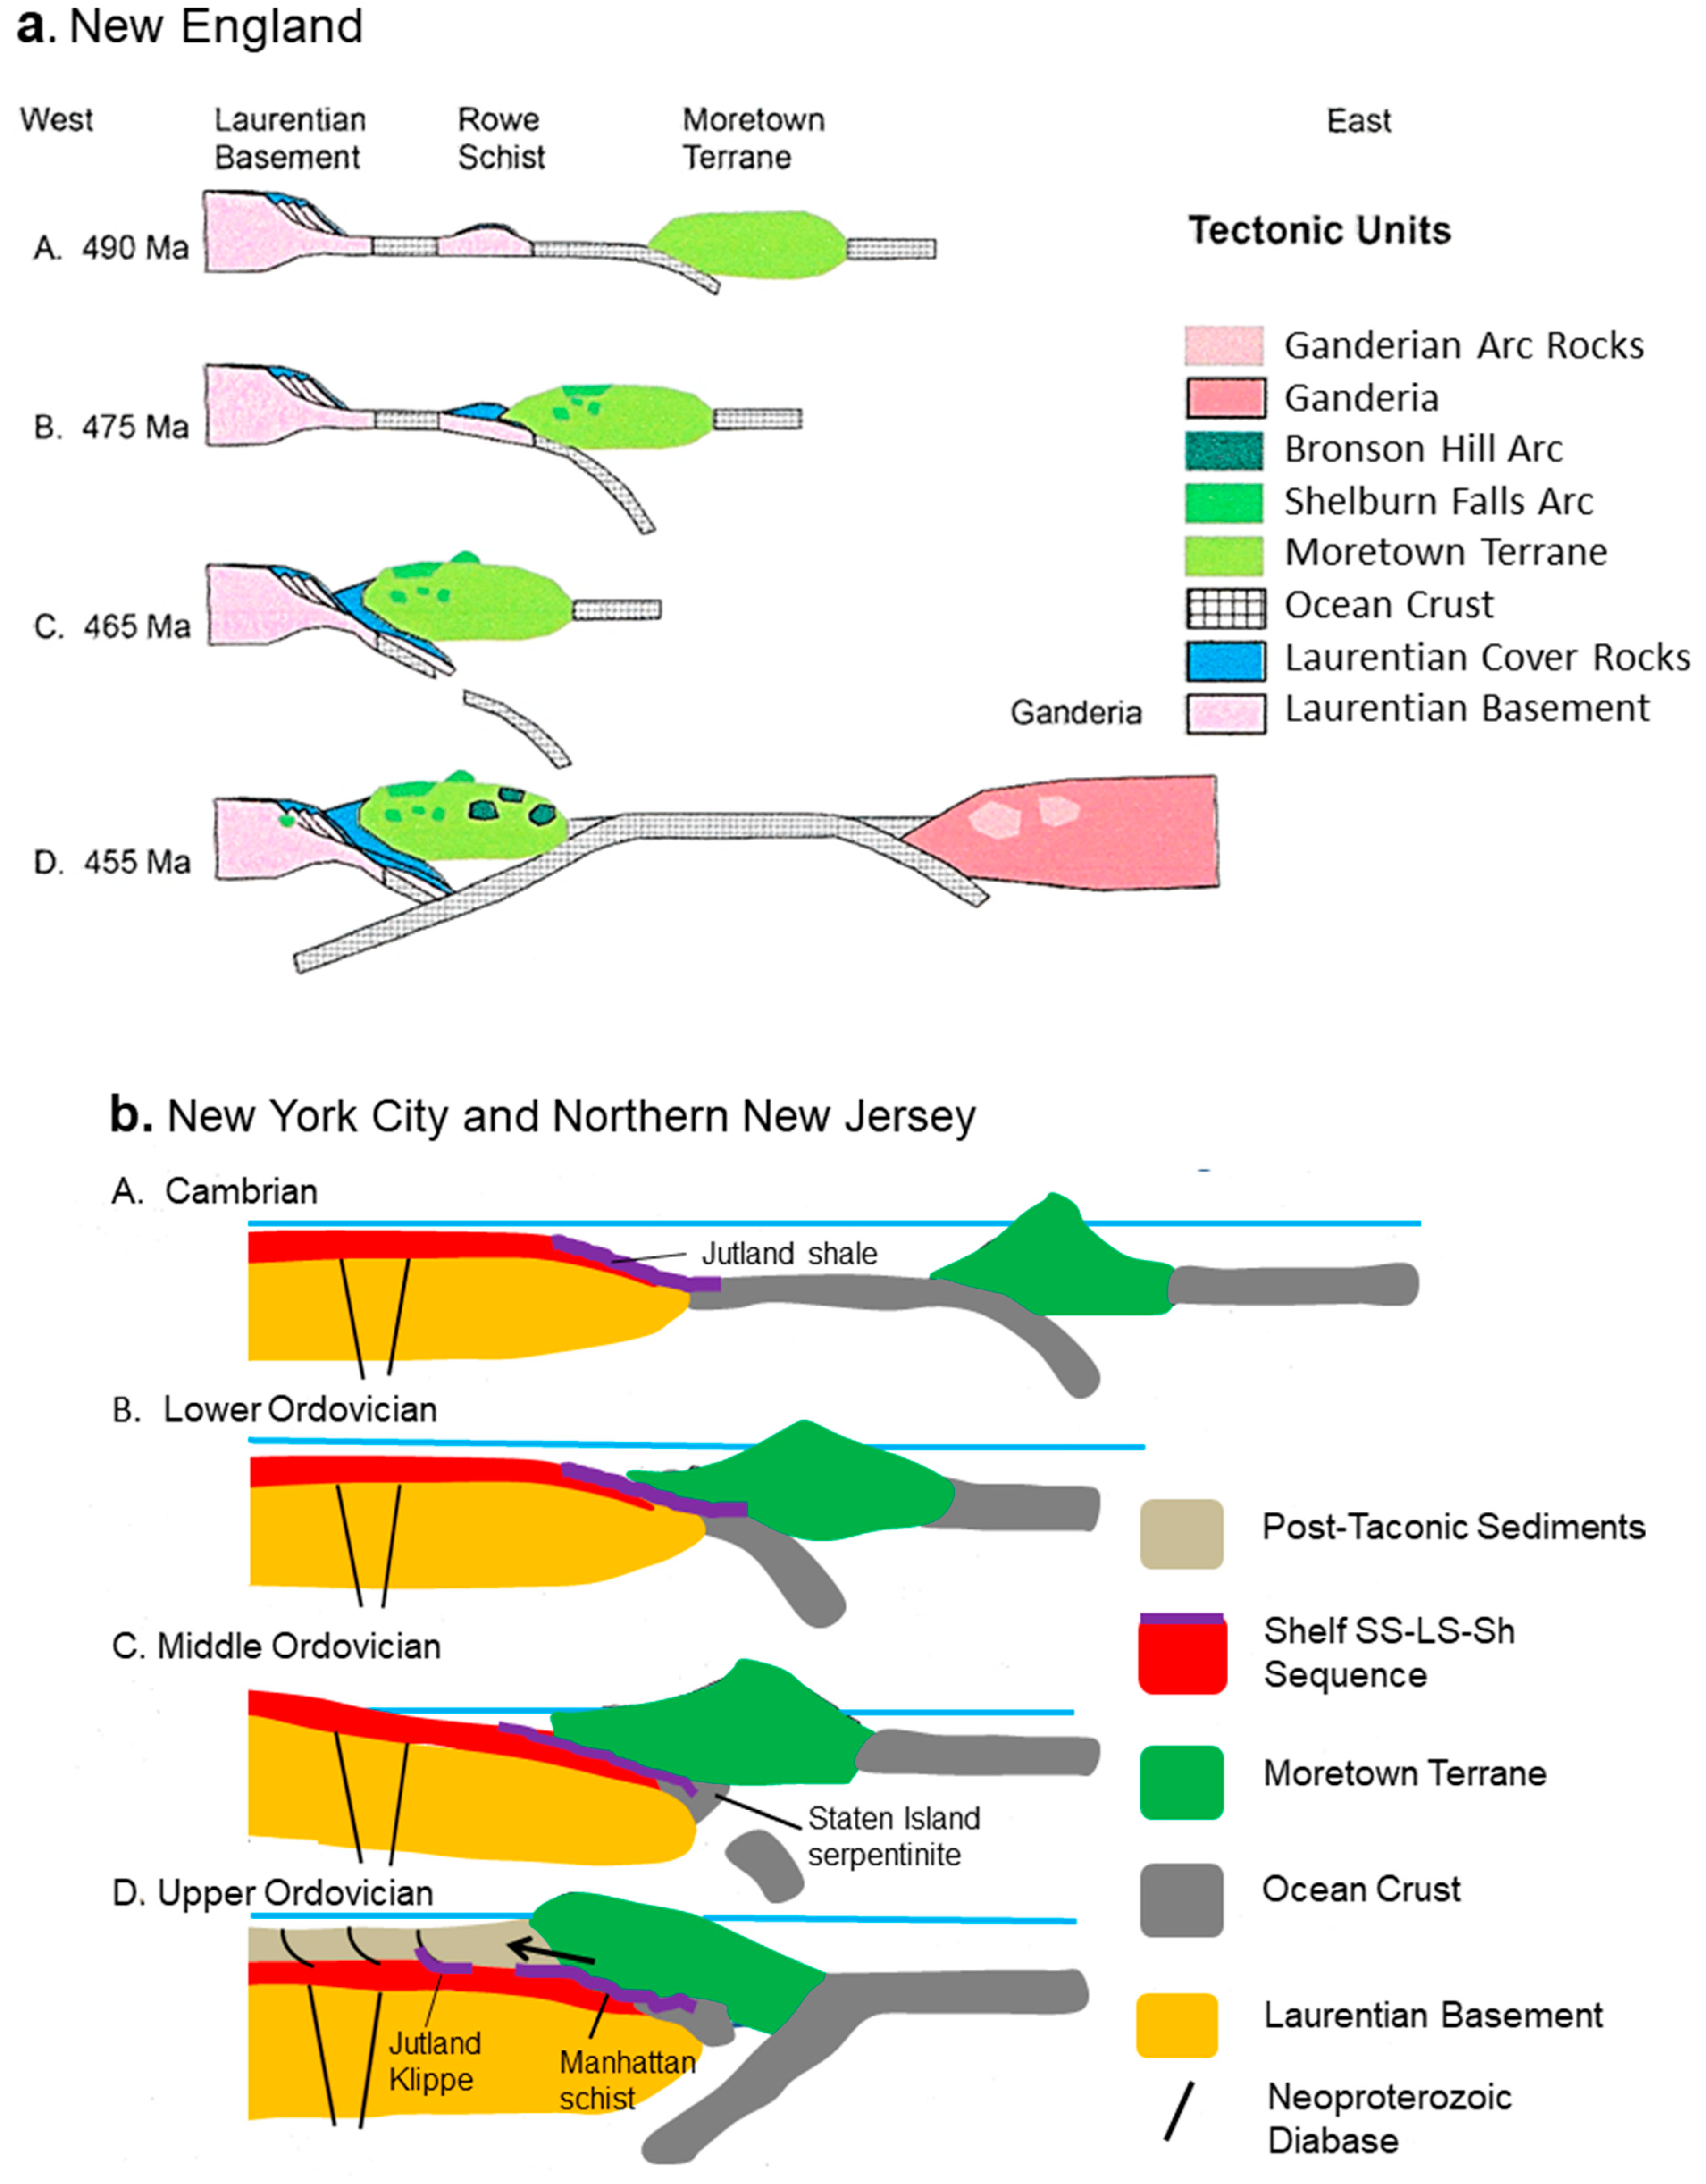
The Taconic Orogeny, as it affected New England, has been subdivided into four Taconic stages [33,34], as shown in Figure 8a. Our proposed model (Figure 8b) draws heavily on published models pertaining to the Taconic Orogeny of New England, particularly in [33,34] but also pertains to the local geology of the NYC area, located at the southern end of the northern Appalachians.
The four stages that involve the geologic history of the Manhattan schists (Figure 8) are: Stage A—Cambrian deposition of pelitic sediments; Stage B—Lower Ordovician collision of the Moretown Terrane with Laurentia and subsequent metamorphism; Stage C—Middle Ordovician oceanic slab break-off and the reversal of slab polarity events; and Stage D—Upper Ordovician deposition of turbidites in a foreland basin and retro-arc thrusting.

4.3.1. Stage A, Cambrian

New England Events: As shown in Figure 8a, stage A, the pelitic protolith of the Rowe schist was deposited on the trailing edge of the Laurentian shelf. The Gondwanan-sourced Moretown Formation migrated across the Iapetus Ocean, above an east-dipping subduction zone [33], as it approached Laurentia.
New York City and Northern New Jersey Events: The first Cambrian sediment deposited across the Laurentian trailing shelf of New Jersey (Figure 8b, stage A) was Lower Cambrian Hardyston Quartzite. Hardyston Quartzite [13] is a medium- to coarse-grained quarzitic sandstone containing fragments of the trilobite, Olenellus thompsoni, from the early Cambrian period (Figure 9). Hardyston Quartzite is up to 62 m thick [13] and is a potential correlative of the Lowerre Quartzite of Manhattan, New York.
The age distribution of the zircons deposited in the Hardyston Quartzite demonstrates peaks at 1000 to 1200 Ma but exhibits a few zircons between 550 and 650 Ma [54]. The 550 to 650 Ma Hardyston zircons could only have been derived from a source upstream of the site of deposition, on the Laurentian passive margin.
We propose that the 550 to 650 Ma zircon population was sourced primarily from widespread basalt flows and that the associated diabase dikes intruded into the Laurentian basement during the rifting of Rodinia. These dikes are depicted as black, near-vertical lines in Figure 8b. Radiometric evidence [55] indicates a peak of eastern Laurentian basaltic magmatism at about 550 Ma. The distribution of zircon ages in the Hardyston Quartzite is the same as the distribution of zircon ages in both the Manhattan and Hartland schists [11], and the source of these zircons is probably the same. If so, this strengthens the interpretation recently made by the authors of [11] that each of the Manhattan schists is from a Laurentian source. The Hardyston zircons could not have been derived from a Gondwanan source during the Cambrian period, a time when Laurentia was on the other side of the Iapetus Ocean. Therefore, there is also no need for any sediment contribution from eastern or Gondwanan sources for the Manhattan schists.
Hardyston Quartzite is overlain by about 305 m of Middle and Early Cambrian Leithsville Formation, consisting of dolomite with lenses of quartz sand near its lower conformable contact with the Hardyston deposit [13]. The Leithsville Formation contains archaeocyathids of the Early Cambrian [56].
Allentown Dolomite was deposited conformably on the Leithsville Formation (Figure 9). Ripple marks, mud cracks, oolites, and algal stromatolites occur throughout the Allentown Dolomite, indicating shallow water deposition. The lower beds of the Allentown deposit contain trilobites of the early Late Cambrian and the upper beds contain the latest Cambrian fauna [57].
While carbonate deposition was occurring in shallow water on the Laurentian shelf, the coeval deposition of pelitic sediment was occurring in deeper water to the east.
Two layers of pelitic sediment, known collectively as the Jutland Klippe Sequence (Figure 2, Figure 3, Figure 8b and Figure 9), were thrust as a klippe over the Allentown Dolomite [13,17,45] (Figure 2 and Figure 8b). Both layers consist largely of interbedded red, green, and tan shale. The lower unit contains graptolites of Zones 2 through 4 [25] and conodonts of the Cordylodus proavus to Paroistodus proteus faunae [45]. The portion of the lower Jutland Klippe Sequence surrounding the Spruce Run Reservoir in New Jersey (Figure 3) was assigned the name Spruce Run Formation, with a thickness of 770 m [17].
The Spruce Run Formation is, therefore, a time and lithostratigraphic correlative of the Rowe schist of northern New England, on the basis of their mutual early Paleozoic deposition [17,33]. The lithology and stratigraphic positions of the Hardyston Quartzite, Leithsville Dolomites, and Jutland pelites also make them potential correlatives of Lowerre Quartzite, Inwood Marble, and the schists of Manhattan (Figure 9).

4.3.2. Stage B, Lower Ordovician

New England Events: Near the beginning of the Taconic Orogeny, about 475 Ma, portions of Newfoundland became subducted under the Moretown Terrane [33]. East of central New England, the Shelburne Falls volcanic arc developed around the Moretown Terrane and then collided with the peri-Laurentian terrains of eastern New England, generating peak volcanic activity dated to 475 Ma. [33]. This igneous activity may have been fluxed by the subduction of distal Laurentian wet pelitic (Rowe Formation) sediments just prior to collision [34] (Figure 8a, stage B).
New York City and Northern New Jersey Events: As shown in Figure 8b, stage B, the distal portions of Cambrian sediment layers including the Hardyston, Leithsville (illustrated in red), and lower portions of the Jutland Sequence (illustrated in purple) began to subduct under the western-advancing Moretown Terrane, beginning in 475 Ma [33]. We propose that the lower distal layers of Jutland pelites were metamorphosed into a biotite schist that chemically resembled the schists of Manhattan during this time.
An upper layer of Jutland pelites up to 550 m thick was deposited onto the lower layer, beginning during the middle Lower Ordovician [13]. The portion of the upper layer located near Jutland, New Jersey (Figure 4), was assigned the name “Hensfoot Formation” [17]. The upper layer of the Jutland Klippe Sequence is a continuation of multicolored, heterogeneous interbedded and interlaminated mixtures of pelitic sediments, dominated by shale that includes thin dolomite layers, fine-grained siltstone, and medium-grained sandstone containing a wide variety of fossils of Lower to Upper Ordovician age [17] (Figure 3). The fossil evidence [13,17,25,45] is consistent with deposition on a continental slope that descends down to in oceanic basin environments, as indicated in Figure 8b, stage B.

4.3.3. Stage C, Middle Ordovician

New England Events: As shown in Figure 8a, stage C, Taconic Barrovian metamorphism of the Rowe Formation (and other Cambrian to mid-Ordovician sediments) continued under the east-dipping subduction zone beneath the Moretown Terrane. The metamorphic 40Ar-39Ar cooling period dates between 471 and 460 Ma; rocks at several New England locations [58,59] record cooling from metamorphic temperatures and provide evidence of Laurentian subduction after the collision of Laurentia with the Moretown Terrane [34]. These metamorphic dates overlap the 40Ar-39Ar white mica cooling dates of 463 +/− 5 Ma that have been reported in Quebec [60]. In addition, there is no record of an Early Ordovician arc magmatic intrusion into rocks, which would be expected if the subduction had dipped westward under the Laurentian margin [34]. However, since, eventually, the oceanic lithosphere was no longer available to the east-dipping subduction zone after the collision, it has been suggested [34] that slab break-off occurred and coincided with the 466 Ma Barnard volcanism in the Indian River Formation in the Taconic allochthons [61].
During the next 10 Ma, the Moretown Terrane developed a reversal of slab polarity as the Bronson Hill Arc became accreted onto the Laurentian margin. The east-dipping subduction activity was replaced by west-dipping subduction on the distal margin, on the Bronson Hill side of the Moretown Terrane (stage C of Figure 8a). The Taconic Orogeny ended when the convergence between Laurentia and the Iapetus plate was taken up by the subduction of the oceanic lithosphere instead of crustal thickening involving the accretion of the Moretown Terrane [41]. The beginning of the unimpeded southern New England subduction of the Iapetus Ocean crust occurred approximately 455 Ma with the accretion of the Bronson Hill Arc (stage D of Figure 8a). Subduction throughout southern New England that was capable of any Barrovian metamorphism into the upper amphibolite facies schists of Manhattan ended at about this time. It has been suggested that the exact timing of the accretionary events associated with sediment deposition in the foreland basin remains poorly understood [34]. However, it has previously been concluded [34] that the suturing of the Moretown Terrane to the Laurentian margin (the Moretown–Rowe contact) was complete by the time of intrusion of the Brookfield Plutonic Suite 453 +/− 3 Ma, in southwestern Connecticut [62]. Further north in New England, some Taconic orogenic activity may have persisted until as late as the intrusion of the Middlefield Granite 444.8 +/− 0.1 Ma [33] into the Rowe schist–Moretown suture, which was not offset by subsequent motion [34]. However, Taconic Orogenesis in southwestern Connecticut and, presumably, the closely adjacent NYC area had already ceased (Figure 9).
New York City and Northern New Jersey Events: During the interval between 465 and 455 Ma, water levels fluctuated. The accretion of the Moretown Terrane created a foreland basin that was blocked to the east from the Iapetus Ocean.
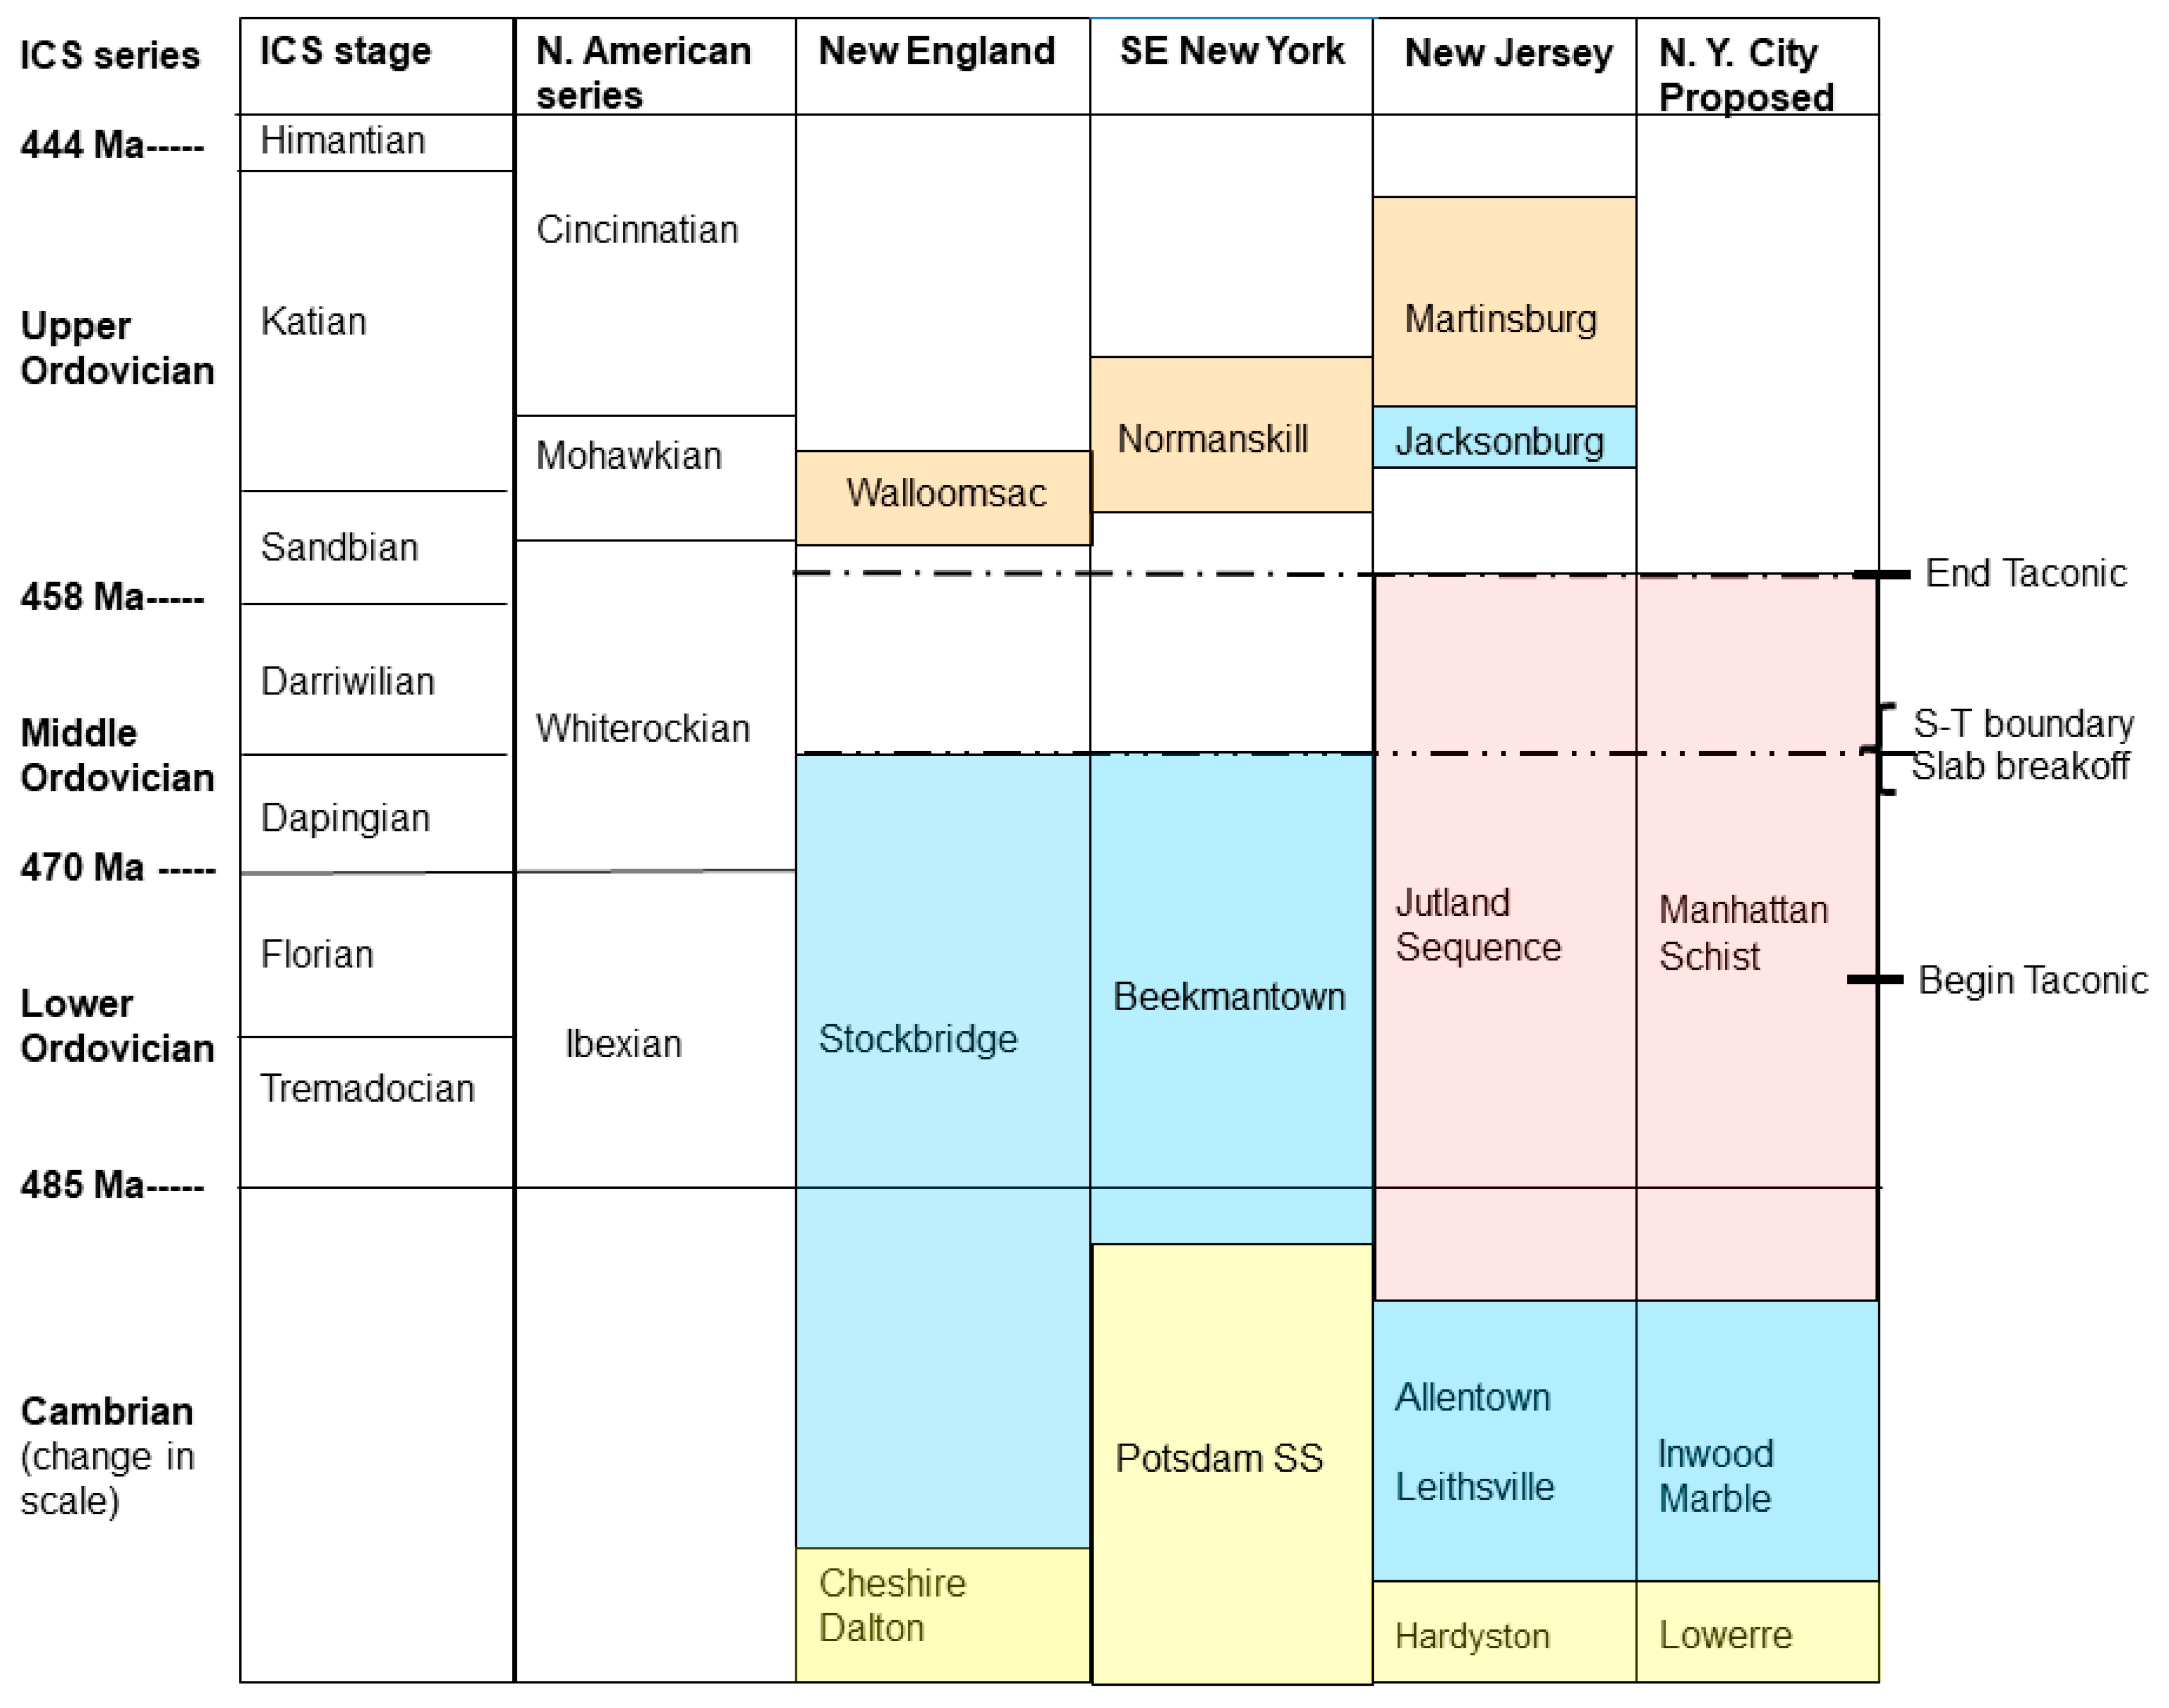
This foreland basin experienced rapid deepening (Figure 8b, stage C) due to plate loading [63,64]. The deposition of the upper layers of the Jutland Klippe Sequence continued in deep eastern waters until the Sandbian stage or about 455 Ma [25]. Meanwhile, further west in northwestern New Jersey, the Beekmantown carbonates continued to undergo coeval deposition followed by widespread sea-level fall and erosion. There is considerable evidence for a widespread erosional hiatus at about 465 Ma that did not affect the deep-water sedimentation of the Jutland Sequence until about 454 Ma (Figure 9). An examination of the Jutland Klippe Sequence [46] focused on graptolite biostratigraphy and confirmed the absence of any depositional overlap between the youngest Jutland samples and the oldest overlying Martinsburg samples. In addition, there is no continuous sequence of graptolite-bearing strata [47] from the upper Middle Ordovician Deepkill Formation or from the correlative uppermost portion of the Beekmantown Group [48] into the overlying Normanskill Shale (Figure 9). The unconformity on top of the Beekmantown Group is widely recognized [65,66] and is interpreted [48] as part of the Sauk–Tippecanoe super-cycle boundary [44,67], which is defined [44] as occurring at basal Chazyan time, which is equal to mid-Whiterockian or early Darriwilian time (about 466 Ma; Figure 9) [68].
The Sauk Sequence, by definition [44], comprises those strata that overlie the North American unconformity cut on Precambrian rocks and underlie the unconformity with the overlying Tippecanoe sequence. The Sauk Sequence is characterized by a basal sandstone (such as the Hardyston of New Jersey) and a transgressive overlap of alternating shales and limestones (such as the Leithsville Formation, Jutland Klippe Sequence, and the Allentown Dolomite of New Jersey (Figure 2). In addition, it has previously been proposed [19] that the schists of Manhattan, New York, including both the Hartland and Manhattan Formation schists, are derived from coeval Sauk cycle deep-water sediments. The Tippecanoe Sequence [44], in contrast, is characterized by a deep-water transgression and a lack of any basal sandstone and is dominated by the rapid deposition of clastic turbidites into deep-water basins, such as the Upper Ordovician Martinsburg Formation of New Jersey and its correlatives in New York (Figure 9).

4.3.4. Stage D, Upper Ordovician

New England Events: As shown in stage D of Figure 8a, the deposition of Tippecanoe turbidite sediments quickly filled the deepened Taconic foreland basin. After 455 Ma, the Moretown Terrane became a westward-thrusting post-orogenic retro-arc that was incapable of generating deep Barrovian metamorphism. However, some late shallow thrust-faulting, nappe, and klippe development presumably occurred during this time.
New York City and Northern New Jersey Events: As indicated by “D” of Figure 8b, deposition in the post-Taconic cycle began with the deposition of early Katian Jacksonburg limestone in shallow water, which was after the erosional hiatus but just before the beginning of rapid flooding in the foreland basin. The Upper Ordovician turbidite sediment deposition of the Trenton Group, Walloomsac Formation, the Normanskill Shale of New York, and the Martinsburg Formation of New Jersey and eastern Pennsylvania occurred during this time (Katian, Figure 8) [49,50,51,52], based largely on graptolite evidence [47,69]. Significantly, the deposition of these sediments was too late for the deposits to have participated in Taconic subduction and the related high-pressure metamorphism (Figure 8b and Figure 9) that characterizes the Manhattan schist. However, the pre-Katian, syn-Taconic and Sauk-type Jutland Klippe Sequence remains a viable protolith for the schists of the Manhattan and Hartland Formations, based in part on its complete deposition before the 455 Ma Taconic Orogenic cut-off date.
Important research published in 1984 [52] was among the first work to recognize the timing of the Taconic Orogeny and to conclude that the deposition of the Martinsburg Formation was probably initiated at the end of Kirkfieldian time (lower Katian time) after Taconic subduction had ended, and that the Upper Ordovician closure of the Jacksonburg–Martinsburg foreland basin was accompanied by thrust faults and the development of a sequence of stacked nappes and klippes [52]. This is probably when the Jutland Sequence was thrust up as a klippe, finally resting on beds of Allentown Dolomite, Beekmantown Dolomite, and Jacksonburg Dolomite (Figure 8b).

4.4. Additional Evidence

The metamorphic P-T paths were recently calculated [70] for a sample of schist from northern Manhattan, which was mapped as Manhattan C [5,7], and another schist sample from Borough Hall Park (Figure 1) that was mapped by the same authors as part of the Hartland Formation. Their results are based on mineral assemblage diagrams (MADS), or pseudosections, which are phase diagrams displaying the stable mineral assemblages for a given segment of whole-rock composition over a range of P-T space. Their analysis indicates that both samples experienced similar clockwise P-T histories, peaking at an upper amphibolite facies temperature close to 750 °C and 8–11 kbar, and retrograding to final equilibration at about 700 °C and 6.6 kbar. Their data are consistent with a similar high-pressure subduction environment for both samples. Their research [70] concludes that Cameron’s Line is not a fundamental terrane boundary.
This agrees with important recent radiometric evidence [11] that both the Hartland and Manhattan schists are Laurentian-sourced. We propose that the only arc terrane input was the accretion of some Iapetus crust that was dragged under the Moretown Terrane about 475 to 465 Ma (Figure 8b, stage C). Remnants of Iapetus Ocean crust may include some thick amphibolites, including Manhattan B, which were scraped off the top of the crust and probably include the Staten Island Serpentinite of NYC but not any of the meta-pelites that comprise the Manhattan schists.

5. Conclusions

Pertaining to question 1 (How many mappable schists occur in NYC?), we find no geochemical basis for distinguishing between the Hartland Formation and Members A and C of the Manhattan Formation throughout the sampled extent of the greater NYC area (Figure 2).
Pertaining to question 2 (What was the protolith of the Manhattan schists?), we conclude that the most likely protolith of the Manhattan schist of NYC is the Jutland Klippe Sequence, which was exposed directly west of NYC in northern New Jersey. Biostratigraphic evidence indicates that the deposition of the Jutland Sequence onto the Laurentian shelf spans the interval between the Late Cambrian and the lower Upper Ordovician. This time span precedes and overlaps the time span of active Taconic orogenic subduction and the related metamorphism of the Laurentian-sourced Manhattan schists. The Jutland Sequence is the only pelite that was deposited throughout Northern New Jersey preceding the cessation of Taconic subduction and the related metamorphism. In addition, our conclusion is supported by the close geochemical resemblance of the Jutland Sequence to the Manhattan schists.

Author Contributions

Conceptualization, J.H.P. and J.R.M.; formal analysis, J.H.P.; investigation, J.H.P., J.R.M. and J.O.B.; methodology, J.H.P. and J.R.M.; software, J.R.M. and J.H.P.; writing—original draft preparation, J.H.P., J.R.M. and J.O.B.; writing—review and editing, J.H.P., J.R.M. and J.O.B. All authors have read and agreed to the published version of the manuscript.

Funding

This research received no external funding.

Data Availability Statement

The data used to support this study are included within the article.

Acknowledgments

We are grateful to Alan Benimoff and the late Jeffery Steiner for help with sample selection and analysis.

Conflicts of Interest

The authors declare no conflicts of interest.

Appendix A. Comparison of Potassic, REE-Depleted Normanskill Shale and Manhattan Schist Samples

Two samples of unusual Manhattan schist collected near Cortlandt New York were compared with two samples of geochemically unusual Normanskill shale. The Normanskill samples (BB-25S and BB-2ST) were collected [27] along Route 40 near Peekskill, New York, about 100 km north of NYC. The Manhattan schist samples MSVP1 and MSTC1 were collected about 92 km north of NYC. Sample MSVP1 was collected from a roadcut along Broadway in Verplanck, New York, east of the Verplanck Quarry, a quarry near Verplanck, New York, and is a black fine-grained biotite-rich schist. Sample MSTC1 is a dark gray medium-grained biotite schist collected in Tomkins Cove, New York, in a railroad cut along the west side of the quarry 2 km south of Tomkins Cove, New Jersey, near the Stoney Point Battlefield State Park. It is unlikely that the two sets of samples are time stratigraphic correlatives, but their major element compositions are similar. This presents an opportunity to compare the REE pattern of an unusually potassic shale with an unusually potassic schist (Table A1 and Figure A1).
The contrasting REE contents of the Normanskill shale and the Manhattan schist samples (Figure A1) support our interpretation that the two rocks are not correlatives. However, both sample sets (Table A1) are anomalies that are well outside the geochemical range of typical samples or the World Shale Average [32] and are unlike any of the representative samples plotted in Figure 4, Figure 5, Figure 6 and Figure 7.
The chondrite-normalized distribution of the Normanskill shale samples seems to be controlled by sedimentary factors, while the Manhattan schist samples seem to be controlled by unrelated metamorphic factors. The two Normanskill samples represent the depleted end of the range of REE content, particularly light REEs, among the 13 analyzed samples [27]. The Normanskill samples were previously described [27] as lacking K-spar and plagioclase feldspar and are interpreted as being dominated by recycled sedimentary content after having undergone two cycles of weathering. The extremely negative Eu anomaly is consistent with the removal of almost all plagioclase after repeated weathering erosion and deposition cycles. If most of the clay was washed from the sediment, leaving residual quartz, that would account for the light REE depletion but not the heavy REE enrichment. It has been proposed [27] that the high K2O content of some of the Normanskill samples is due to subsequent enrichment during diagenesis, which may also have elevated the heavy REE content.
The REE-depleted Manhattan schist samples (Table A1) are highly enriched in biotite, by as much as 72 volume percent, compared to the 20 to 55 percent of the typical samples presented in Table A1. The samples are dark grey and medium- to fine-grained. The high K2O, Rb, Ba, and Cr contents of the samples and the low REE contents reflect the enrichment of typical low-temperature, iron-rich biotite. It is also possible that the samples may have been altered by the metasomatic effects of the Cortland Complex, which intruded within 0.25 km of the sample locations.
Table A1. The chemical composition of ultra-potassic Manhattan schist (this study) and potassic Normanskill shale [27].
MSVP1MSTC1BB-2STBB5S
Sample #Manhat.Manhat.Norman.Norman.
RockSchistSchistShaleShale
Wt%
SiO269.4057.3061.6860.11
TiO20.590.970.780.79
Al2O313.8015.8018.5218.08
FeO4.4310.056.786.17
MgO3.533.012.432.50
MnO0.020.050.030.05
CaO0.550.450.202.50
Na2O0.881.001.201.14
K2O6.249.513.973.98
P2O50.090.180.100.12
C0.040.02ndnd
S<0.01<0.01ndnd
LOI1.291.143.604.10
Total100.8699.4899.2999.54
Trace ppm
Ba831.001145.00619.00695.00
Cr79.0091.0078.0067.00
Cs7.426.00ndnd
Ga18.2024.60ndnd
Ge2.202.20ndnd
Hf5.385.84ndnd
Nb10.7520.70ndnd
Rb163.00202.00188.00158.00
Sr84.80192.5028.0081.00
Ta0.701.10ndnd
Th8.4818.50ndnd
U1.030.86ndnd
V90.00133.00148.00135.00
W1.301.50ndnd
Y11.7016.4020.0031.00
Zr223.00232.00105.00125.00
Bi0.050.11ndnd
Tl0.350.58ndnd
Co12.0022.00ndnd
Cu15.0025.0025.0024.00
Li80.0050.00ndnd
Ni33.0052.0042.0039.00
Pb14.0028.00ndnd
Sc11.0020.00ndnd
Zn78.00114.00108.0094.00
REE ppm
La13.7027.706.009.56
Ce29.5066.4011.7017.57
Pr3.336.63ndnd
Nd12.0024.406.408.60
Sm2.234.001.902.54
Eu0.560.880.480.65
Gd1.933.244.153.99
Tb0.300.52ndnd
Dy1.922.993.705.28
Ho0.420.61ndnd
Er1.382.002.703.43
Tm0.220.29ndnd
Yb1.362.132.503.19
Lu0.210.31ndnd
Note: nd—non-detected.
Figure A1. Chondrite-normalized diagram comparing potassic Normanskill shales (Norm) [27] with potassic Manhattan schists (PK) (Table A1) and the World Shale Average (WSH) [32].
Geosciences 14 00190 g0a1

Appendix B. Minimum Detection Limits for the Methods Used to Analyze the Data in Table 1

Table A2. Minimum detection limits for methods used to analyzed data of Table 1.
Major ElementsLOD, Wt. %Trace ElementsLOD, ppmREEsLOD, ppm
SiO20.01Ba0.5La0.01
TiO20.01Cr5Ce0.1
Al2O30.01Cs0.01Pr0.02
Fe2O30.01Ga0.1Nd0.1
MgO0.01Ge0.5Sm0.03
MnO0.01Hf0.05Eu0.02
CaO0.01Nb0.05Gd0.05
Na2O0.01Rb0.2Tb0.01
K2O0.01Sr0.1Dy0.05
P2O50.01Ta0.1Ho0.01
C0.01Th0.05Er0.03
S0.01U0.05Tm0.01
LOI0.01V5Yb0.03
W0.5Lu0.01
Y0.1
Zr1
Bi0.01
Tl0.02
Co1
Cu1
Li10
Ni1
Pb2
Sc1
Zn2

References

  1. Fisher, D.W.; Isachsen, Y.W.; Richard, L.V. Geological Map of New York State; Lower Hudson Sheet, 1:250,000; New York State Museum and Science Service Map and Chart Series 15; The University of the State of New York: New York, NY, USA, 1970. [Google Scholar]
  2. Hall, L.M. Geology in the Glenville area, Southwesternmost Connecticut and southeastern New York. In Guidebook for Fieldtrips in Connecticut, Proceedings of the New England Intercollegiate Geological Conference, New Haven, CT, USA, 25–27 October 1968; Orville, P.E., Ed.; Guidebook No. 2. The State Librarian: Hartford, CT, USA, 1968. [Google Scholar]
  3. Merguerian, C. Tectonic significance of Cameron’s line in the vicinity of the Hodges Complex; An imbricate thrust model for western Connecticut. Am. J. Sci. 1983, 283, 341–368. [Google Scholar] [CrossRef]
  4. Merguerian, C. Tunnel vision–A deep view of the bedrock geology of New York City. In Geological Society of America Abstracts with Programs; Geological Society of America: Boulder, CO, USA, 1986; Volume 18, pp. 54–55. [Google Scholar]
  5. Merguerian, C.; Merguerian, M. Geology of Central Park–From rocks to ice. In Long Island Geologists Program with Abstracts, Proceedings of the Eleventh Annual Conference on Geology of Long Island and Metropolitan New York, 17 April 2004; Hanson, G.N., Ed.; State University of New York at Stony Brook: New York, NY, USA, 2004; Volume 17, 24p, Available online: http://www.geo.sunysb.edu/lig/Conferences/abstracts-04/merguerian/Merguerians2004.htm (accessed on 11 July 2024).
  6. Baskerville, C.A.; Coch, N.K.; Horenstein, S.; Prinz, M.; Puffer, J.H.; Roberts-Dolgin, G.R.; Weiss, D. Geology and Engineering Geology of the New York Metropolitan Area. In Field Trip Guidebook; AGU: Washington, DC, USA, 1989; Volume T361, 59p. [Google Scholar] [CrossRef]
  7. Baskerville, C.A. Bedrock and Engineering Geologic Maps of Bronx County and Parts of New York and Queens Counties, New York; U.S. Geological Survey Miscellaneous Investigations Series; Map 1-2003, Scale 1:24,000; U.S. Geological Survey: Reston, VA, USA, 1992. [Google Scholar]
  8. Baskerville, C.A. Bedrock and Engineering Geology Maps of New York County and Parts of Kings and Queens Counties, New York and Parts of Bergen and Hudson Counties, New Jersey; U.S. Geological Survey Miscellaneous Investigations Series; Map I-2306 (2 Sheets; Colored Maps on Scale of 1/24,000); U.S. Geological Survey: Reston, VA, USA, 1994. [Google Scholar]
  9. Taterka, B.D. Bedrock Geology of Central Park, New York City. Master’s Dissertation, University of Massachusetts, Amherst, MA, USA, 1987. [Google Scholar]
  10. Brock, P.J.C.; Brock, P.W.G. Bedrock Geology of New York City: More Than 600 m.y. of Geologic History. In Abstracts “Geology of Long Island and Metropolitan New York”; Long Island Geologists, SUNY Stony Brook: New York, NY, USA, 2001; 11p, Available online: http://pbisotopes.ess.sunysb.edu/reports/NYCity/index.html (accessed on 11 July 2024).
  11. Jaret, S.J.; Tailby, N.D.; Hammond, K.G.; Rasbury, E.T.; Wooton, K.; Ebel, D.S.; Plank, T.; DiPadova, E.; Yuan, V.; Smith, R.; et al. The Manhattan project: Isotope geochemistry and detrital zircon geochronology of schists in New York City, USA. Geol. Soc. Am. Bull. Online 2023, 136, 2483–2493. [Google Scholar] [CrossRef]
  12. Hall, L.M. Preliminary correlation of rocks in southwestern Connecticut. In Contributions to the Stratigraphy of New England; Page, L.R., Ed.; Geological Society of America Memoir; Geological Society of America: Boulder, CO, USA, 1976; Volume 148, pp. 337–349. [Google Scholar]
  13. Drake, A.A.; Volkert, R.A.; Monteverde, D.H.; Herman, G.C.; Houghton, H.F.; Parker, R.A.; Dalton, R.F. Bedrock Geologic Map of New Jersey; U.S. Geological Survey Miscellaneous Investigations Series; Map I-2540-A, 2 Sheets, Scale 1:100,000; U.S. Geological Survey: Reston, VA, USA, 1996. [Google Scholar]
  14. Walsh, G.J. Bedrock Geologic Map of the New Milford Quadrangle, Litchfield and Fairfield Counties, Connecticut; U.S. Geological Survey: Reston, VA, USA, 2003. [Google Scholar]
  15. American Museum of Natural History (AMNH). Felix, M. Warburg Hall of New York State Environment; New York State Geological Map and Legend; American Museum of Natural History: New York, NY, USA, 2017. [Google Scholar]
  16. Drake, A.A., Jr.; Epstein, J.B. The Martinsburg Formation (Middle and Upper Ordovician) in the Delaware Valley Pennsylvania-New Jersey; U.S. Geological Survey Bullet 1244-H; U.S. Government Printing Office: Washington, DC, USA, 1967; 16p. [Google Scholar]
  17. Monteverde, D.H.; Volkert, R.A.; Dalton, R.F. Bedrock Geology Map of the High Bridge Quadrangle Hunterdon and Warren Counties, New Jersey; NJGWS 2015, Geologic Map Series GMS 15, Plates 1 and 2; U.S. Geological Survey: Reston, VA, USA, 2015. [Google Scholar]
  18. Berry, W.B. Age of Bogo Shale and western Ireland graptolite faunas and their bearing on dating early Ordovician deformation and metamorphism in Norway and Britain. Nor. Geol. Tidsskr. 1968, 48, 17–230. [Google Scholar]
  19. ALS USA Inc. 4977 Energy Way Reno NV 89502. Available online: www.alsglobal.com/geochemistry (accessed on 11 July 2024).
  20. Fuller, T.; Short, L.; Merguerian, C. Tracing the St. Nicholas thrust and Cameron’s Line through the Bronx NYC. In Long Island State University of New York at Stony Brook, NY Program with Abstracts, Proceedings of the Sixth Annual Conference on Geology of Long Island and Metropolitan New York, 24 April 1999; Hanson, G.N., Ed.; State University of New York at Stony Brook: New York, NY, USA, 1999; pp. 16–23. [Google Scholar]
  21. Cadmus, D.; Hodgson, R.; Gatto, L.M.; Puffer, J.H. Geochemical Traverse across Cameron’s Line, Borough Hall Park, Bronx, New York. In Geology of Long Island and Metropolitan New York; Hanson, G.N., Ed.; Long Island Geologists, SUNY Stony Brook: New York, NY, USA, 1996; pp. 26–32. [Google Scholar]
  22. Puffer, J.H.; Benimoff, A.I.; Steiner, J.C. Geochemical Characterization of New York City Schist Formations. In Field Trip Guidebook, Proceedings of the 82nd Annual Meeting; New York State Geological Association: Geneva, NY, USA, 2010; pp. 163–182. [Google Scholar]
  23. Merguerian, C.; Baskerville, C.A. The geology of Manhattan Island and the Bronx, New York City, New York. In Northeastern Section of the Geological Society of America (Centennial Field-Guide); Roy, D.C., Ed.; Geological Society of America: Boulder, CO, USA, 1987; Volume 5, pp. 137–140. [Google Scholar]
  24. Seyfert, C.K.; Leveson, D.J. Structure and petrology of Pelham Bay Park. In Guidebook to Field Excursions, Proceedings of the Annual Meeting, 40th, Queens College, Flushing, NY, USA, 1968; Finks, R.M., Ed.; New York State Geological Association: Geneva, NY, USA, 1968; pp. 175–195. [Google Scholar]
  25. Perissoratis, C.; Brock, P.W.G.; Bruckner, H.K.; Drake, A.A., Jr.; Berry, W.B.N. The Taconides of western New Jersey: New evidence from the Jutland klippe. Geol. Soc. Am. Bull. 1979, 90, 154–177. [Google Scholar] [CrossRef]
  26. Lee, J.H.; Peacor, D.R.; Lewis, D.D.; Wintsch, R.P. Evidence for syntectonic crystallization for the mudstone to slate transition at Lehigh Gap, Pennsylvania, USA. J. Struct. Geol. 1986, 8, 767–780. [Google Scholar] [CrossRef]
  27. Bock, B.; McLennan, S.M.; Hanson, G.N. Geochemistry and provenance of the middle Ordovician Austin Glen member (Normanskill formation) and the Taconian orogeny in New England. Sedimentology 1998, 45, 635–655. [Google Scholar] [CrossRef]
  28. Wintsch, R.P.; Kvale, C.; Kisch, H.J. Open-system, constant-volume development of slaty cleavage, and strain-induced replacement reactions in the Martinsburg Formation, Lehigh Gap, Pennsylvania. Geol. Soc. Am. Bull. 1991, 103, 916–927. [Google Scholar] [CrossRef]
  29. Ague, J.J. Evidence for major mass transfer and volume strain during regional metamorphism of pelites. Geology 1991, 19, 855–858. [Google Scholar] [CrossRef]
  30. Moss, B.E.; Haskin, L.A.; Dymek, R.F.; Shaw, D.M. Redetermination and reevaluation of compositional variations in metamorphosed sediments of the Littleton Formation, New Hampshire. Am. J. Sci. 1995, 295, 988–1019. [Google Scholar]
  31. Sun, S.S.; McDonough, W.F. Chemical and Isotopic Systematics of Oceanic Basalts: Implications for Mantle Composition and Processes; Geological Society, London, Special Publications: London, UK, 1989; Volume 42, pp. 313–345. [Google Scholar]
  32. Bau, M.; Schmidt, K.; Pack, A.; Bendel, V.; Kraemer, D. The European Shale: An improved data set for normalization of rare earth element and yttrium concentrations in environmental and biological samples from Europe. Appl. Geochem. 2018, 90, 142–149. [Google Scholar]
  33. Macdonald, F.A.; Ryan-Davis, J.; Coish, R.A.; Crowley, J.L.; Karabinos, P. A newly identified Gondwanan terrane in the northern Appalachian Mountains: Implications for the Taconic orogeny and closure of the Iapetus Ocean. Geology 2014, 42, 539–542. [Google Scholar] [CrossRef]
  34. Karabinos, P.; Macdonald, F.A.; Crowley, J.L. Bridging the gap between the foreland and hinterland I: Geochronology and plate tectonic geometry of Ordovician magmatism and terrane accretion on the Laurentian margin of New England. Am. J. Sci. 2017, 317, 515–554. [Google Scholar] [CrossRef]
  35. Coish, R.; Kim, J.; Morris, N.; Johnson, D. Late stage rifting of the Laurentian continent: Evidence from the geochemistry of greenstone and amphibolite in the central Vermont Appalachians. Can. J. Earth Sci. 2012, 49, 43–58. [Google Scholar] [CrossRef]
  36. Dorais, M.J.; Atkinson, M.; Kim, J.; West, D.P.; Kirby, G.A. Where is the Iapetus suture in northern New England? A study of the Ammonoosuc volcanics, Bronson Hill terrane, New Hampshire. Can. J. Earth Sci. 2012, 49, 189–205. [Google Scholar] [CrossRef]
  37. Dorais, M.J.; Wintsch, R.P.; Kunk, M.J.; Aleinikoff, J.; Burton, W.; Underdown, C.; Kerwin, C.M. P-T-t conditions, Nd and Pb isotopic compositions and detrital zircon geochronology of the Massabesic Gneiss Complex, New Hampshire: Isotopic and metamorphic evidence for the identification of Gander basement, central New England. Am. J. Sci. 2012, 312, 1049–1097. [Google Scholar] [CrossRef]
  38. Karabinos, P.; Williamson, B.F. Constraints on the timing of Taconian and Acadian deformation in western Massachusetts. Northeast. Geol. 1994, 16, 1–8. [Google Scholar]
  39. Karabinos, P.; Samson, S.D.; Hepburn, J.C.; Stoll, H.M. Taconian orogeny in the New England Appalachians: Collision between Laurentia and the Shelburne Falls arc. Geology 1998, 26, 215–218. [Google Scholar] [CrossRef]
  40. Karabinos, P.; Aleinikoff, J.N.; Fanning, C.M. Distinguishing Grenvillian basement from pre-Taconian cover rocks in the northern Appalachians. Am. J. Sci. 1999, 299, 502–515. [Google Scholar] [CrossRef]
  41. Karabinos, P.; Stoll, H.M.; Hepburn, J.C. The Shelburne Falls Arc-Lost Arc of the Taconic Orogeny. In Guidebook for Field Trips in the Five College Region: Amherst and Northampton, Massachusetts, Proceedings of the 95th Annual Meeting of the New England Intercollegiate Geologic Conference; Williams College: Williamstown, MA, USA, 2003; pp. B3-1–B3-17. [Google Scholar]
  42. White, S.E.; Waldron, J.W. Along-strike variations in the deformed Laurentian margin in the Northern Appalachians: Role of inherited margin geometry and colliding arcs. Earth-Sci. Rev. 2022, 226, 103931. [Google Scholar] [CrossRef]
  43. Waldron, J.W.; McCausland, P.J.; Barr, S.M.; Schofield, D.I.; Reusch, D.; Wu, L. Terrane history of the Iapetus Ocean as preserved in the northern Appalachians and western Caledonides. Earth-Sci. Rev. 2022, 233, 104163. [Google Scholar] [CrossRef]
  44. Sloss, L.L. Sequences in the cratonic interior of North America. Geol. Soc. Am. Bull. 1963, 74, 93–114. [Google Scholar] [CrossRef]
  45. Harris, A.G.; Repetski, J.E.; Stamm, N.R.; Weary, D.J. Conodont Age and CAI Data for New Jersey; Open-File Report (No. 95-557); US Department of the Interior, U.S. Geological Survey: Flagstaff, AZ, USA, 1995; 31p. [Google Scholar]
  46. Parris, D.C.; Miller, L.F.; Finney, S.C. Comparative Graptolite Biostratigraphy of the Jutland Klippe to the Martinsburg Formation at Delaware Water Gap National Recreation Area. In National Park Service Paleontological Research; Santucci, V.L., Ed.; United States Department of the Interior, National Park Service, Geological Resource Division: Denver, CO, USA, 1998; pp. 49–52. [Google Scholar]
  47. Berry, W.B.N. Stratigraphy, zonation, and age of Schaghticoke, Deepkill, and Normanskill shales, eastern New York. Geol. Soc. Am. Bull. 1962, 73, 695–718. [Google Scholar] [CrossRef]
  48. Kröger, B.; Landing, E. Early Ordovician community evolution with eustatic change through the middle Beekmantown Group, northeast Laurentia. Palaeogeogr. Palaeoclim. Palaeoecol. 2010, 294, 174–188. [Google Scholar] [CrossRef]
  49. Ettensohn, F.R.; Lierman, R.T. Using Black Shales to Constrain Possible Tectonic and Structural Influence on Foreland-Basin Evolution and Cratonic Yoking: Late Taconian Orogeny, Late Ordovician Appalachian Basin, Eastern USA; Geological Society, London, Special Publications: London, UK, 2015; Volume 413, pp. 119–141. [Google Scholar]
  50. Berg, T.M.; McInerney, H.K.; Way, H.H.; Mac-Lachlan, D.B. Stratigraphic Correlation Chart of Pennsylvania; General Geology Report, 4th Ser.; Pennsylvania Geological Survey: Middletown, PA, USA, 1993; 75p. [Google Scholar]
  51. Epstein, J.B.; Berry, W.B. Graptolites from the Martinsburg Formation, Lehigh Gap, eastern Pennsylvania. U.S. Geol. Survey J. Res. 1973, 1, 33–37. [Google Scholar]
  52. Lash, G.G.; Drake, A.A. The Richmond and Greenwich Slices of the Hamburg Klippe in Eastern Pennsylvania: Stratigraphy, Sedimentology, Structure, and Plate Tectonic Implications; Professional Paper 1312; U.S. Geological Survey: Reston, VA, USA, 1984; pp. 1–40. [Google Scholar]
  53. Ratcliffe, N.M.; Harris, A.G.; Walsh, G.J. Tectonic and regional metamorphic implications of the discovery of Middle Ordovician conodonts in cover rocks east of the Green Mountain massif, Vermont. Can. J. Earth Sci. 1999, 36, 371–382. [Google Scholar] [CrossRef]
  54. Eriksson, K.A.; Campbell, I.H.; Palin, J.M.; Allen, C.M.; Bock, B. Evidence for multiple recycling in Neoproterozoic through Pennsylvanian sedimentary rocks of the central Appalachian basin. J. Geol. 2004, 112, 261–276. [Google Scholar] [CrossRef]
  55. Puffer, J.H. A late Neoproterozoic, Eastern Laurentian superplume: Location, size, chemical composition, and environmental impact. Am. J. Sci. 2002, 302, 1–27. [Google Scholar] [CrossRef]
  56. Palmer, A.R.; Rozanov, A.Y. Archaeocyatha from New Jersey: Evidence for an intra-Cambrian unconformity in the north-central Appalachians. Geology 1976, 4, 773–774. [Google Scholar] [CrossRef]
  57. Howell, B.F.; Roberts, H.; Willard, B. Subdivision and dating of the Cambrian of eastern Pennsylvania. Geol. Soc. Am. Bull. 1950, 61, 1355–1368. [Google Scholar] [CrossRef]
  58. Castonguay, S.; Kim, J.; Thompson, P.J.; Gale, M.H.; Joyce, N.; Laird, J.; Doolan, B.L. Timing of tectonometamorphism across the Green Mountain anticlinorium, northern Vermont Appalachians: 40Ar/39Ar data and correlations with southern Quebec. Geol. Soc. Am. Bull. 2012, 124, 352–367. [Google Scholar] [CrossRef]
  59. Laird, J.; Lanphere, M.A.; Albee, A.L. Distribution of Ordovician and Devonian metamorphism in mafic and pelitic schists from northern Vermont. Am. J. Sci. 1984, 284, 376–413. [Google Scholar] [CrossRef]
  60. Whitehead, J.; Reynolds, P.H.; Spray, J.G. 40Ar/39Ar age constraints on Taconian and Acadian events in the Quebec Appalachians. Geology 1996, 24, 359–362. [Google Scholar] [CrossRef]
  61. Macdonald, F.A.; Karabinos, P.M.; Crowley, J.L.; Hodgin, E.B.; Crockford, P.W.; Delano, J.W. Bridging the gap between the foreland and the hinterland II: Geochronology and tectonic setting of Ordovician magmatism and basin formation on the Laurentian margin of New England and Newfoundland. Am. J. Sci. 2017, 317, 555–596. [Google Scholar] [CrossRef]
  62. Sevigny, J.H.; Hanson, G.N. Late-Taconian and pre-Acadian history of the New England Appalachians of southwestern Connecticut. Geol. Soc. Am. Bull. 1995, 107, 487–498. [Google Scholar] [CrossRef]
  63. Tankard, A.J. On the depositional response to thrusting and lithospheric flexure: Examples from the Appalachian and Rocky Mountain basins. In Foreland Basins; Allen, P.A., Homewood, P., Eds.; International Association of Sedimentologists Special Publication; John Wiley & Sons: Hoboken, NJ, USA, 1986; Volume 8, pp. 369–392. [Google Scholar]
  64. Quinlan, G.M.; Beaumont, C. Appalachian thrusting, lithospheric flexure, and the Paleozoic stratigraphy of the eastern interior of North America. Can. J. Earth Sci. 1984, 21, 973–996. [Google Scholar] [CrossRef]
  65. Lash, G.G. Model for a passive to active continental margin transition: Implications for hydrocarbon exploration: Discussion. AAPG Bull. 1983, 67, 1032–1035. [Google Scholar]
  66. Rodgers, J. The Taconic Orogeny. Geol. Soc. Am. Bull. 1971, 82, 1141–1178. [Google Scholar] [CrossRef]
  67. Longwell, C.R. Sedimentary Facies in Geologic History; Geological Society of America Memoir; Geological Society of America: Boulder, CO, USA, 1949; Volume 39, p. 171. [Google Scholar]
  68. Goldman, D.; Sadler, P.M.; Leslie, S.A.; Melchin, M.J.; Agterberg, F.P.; Gradstein, F.M. The Ordovician Period. In Geologic Time Scale; Chapter 20; Elsevier: Amsterdam, The Netherlands, 2020; Volume 2, pp. 631–694. [Google Scholar]
  69. Lash, G.G. The Structure and Stratigraphy of the Pen Argyl Member of the Martinsburg Formation in Lehigh and Berks Counties, Pennsylvania. Master’s Thesis, Lehigh University, Bethlehem, PA, USA, 1978. [Google Scholar]
  70. Morin, K.D.; Brunet, I.M.; Merrill, E.J.; Painter, S.; Ochoa, A.V.; Castro, A.E. Preliminary Metamorphic P–T Paths for the Manhattan and Hartland Schists. In Long Island Geologists Program with Abstracts, Proceedings of the Annual Conference on Geology of Long Island and Metropolitan New York; Hanson, G.N., Ed.; Sunybb.edu LIG-Past Conferences-Abstracts; State University of New York at Stony Brook: New York, NY, USA, 2023; 24p, p. 24. [Google Scholar]
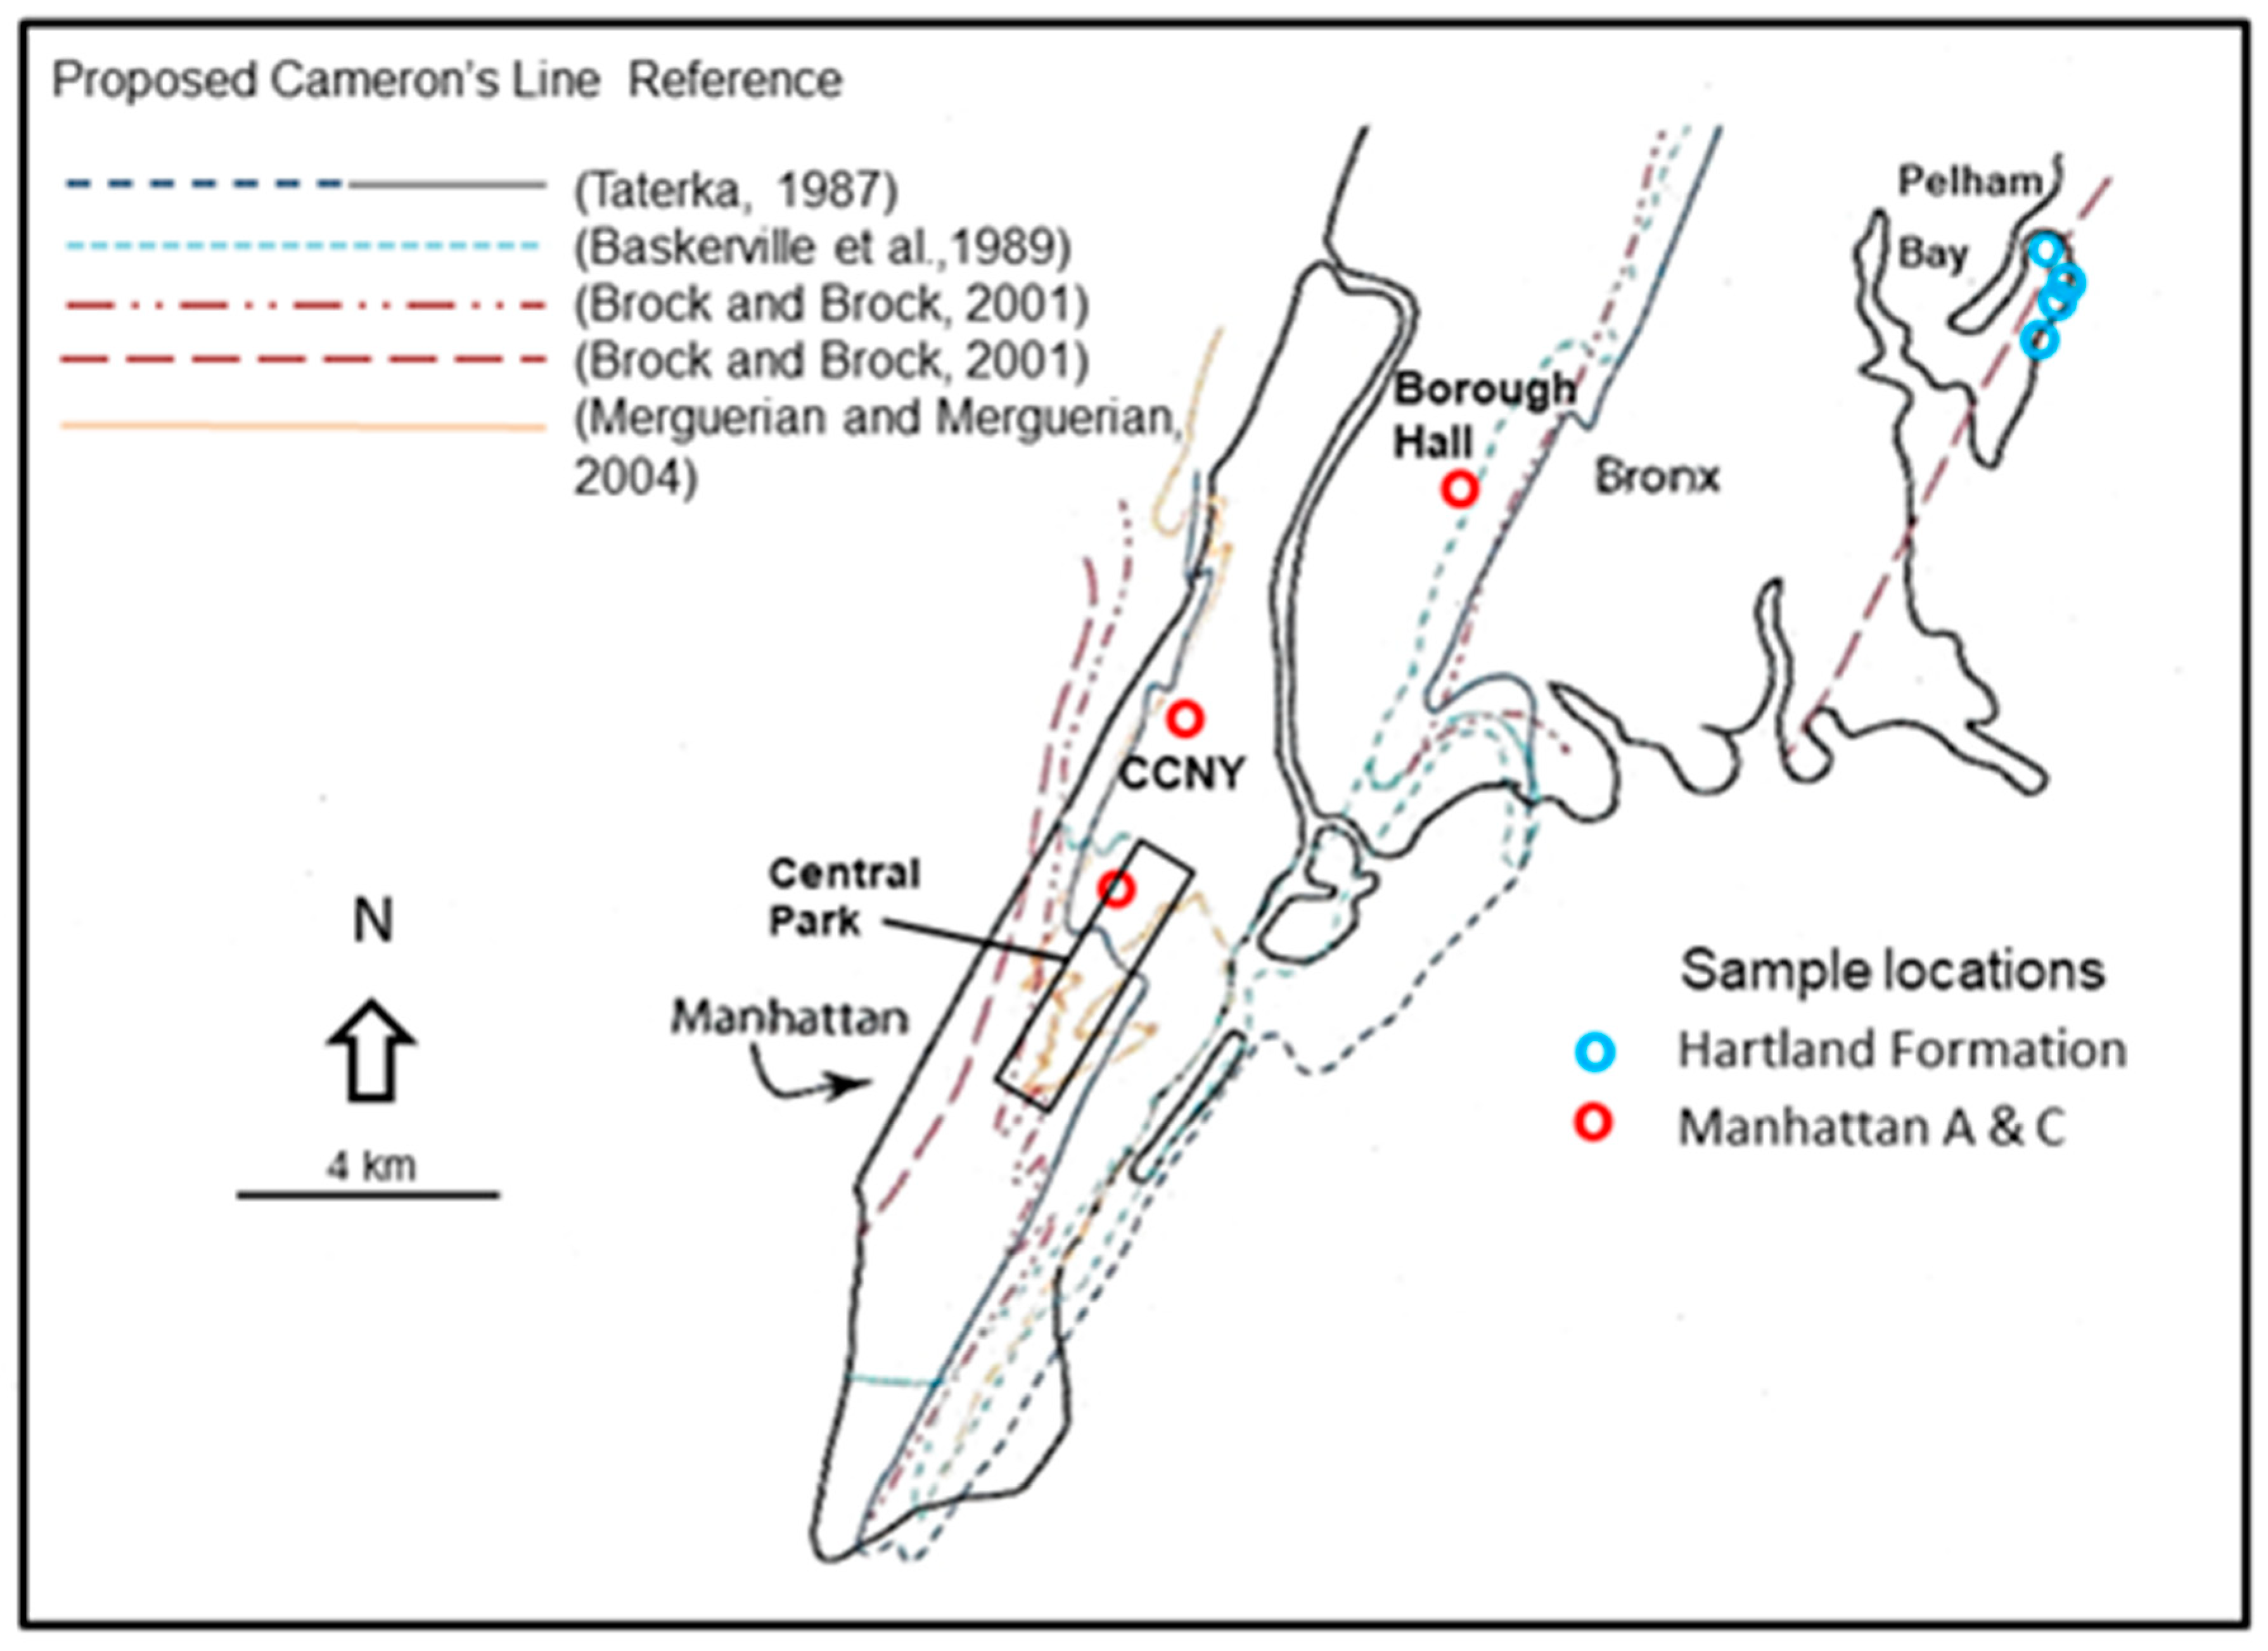
Figure 1. Simplified sketch map of NYC modified after [11], illustrating some of the proposed locations of Cameron’s Line, interpreted as thrust-plate boundaries between the Hartland Formation and Members A or C of the Manhattan Formation.
Geosciences 14 00190 g001
Figure 2. Simplified sketch map illustrating the distribution of the Hartland and Manhattan Formations and some potential Paleozoic protoliths throughout the area surrounding NYC. The New York State map unit boundaries are based on the New York State Geologic Map [15]. The New Jersey map boundaries are based on the Bedrock Geologic Map of New Jersey [13]. Note that the western boundary of the Hartland Formation (Cameron’s Line) is located east of most of those areas appearing in Figure 1 and offers still another choice. Map legend: MF is the Manhattan Formation in red, HF is the Hartland Formation in green, IM is Inwood Marble, FG is Fordham Gneiss, HG is Harrison Gneiss, BG is Bedford Gneiss, YG is Yonkers Gneiss, Om is the Martinsburg Formation, shown in green, Oa is the Allentown Dolomite, shown in tan, D is largely sandstone of the Devonian age, l is the Leithsville dolomite, and JUN is the Jutland Sequence Undifferentiated. The Mesozoic Newark Basin and the Proterozoic rocks of the New Jersey Highlands are labeled. The locations of the samples analyzed for this study are indicated with black circles.
Geosciences 14 00190 g002
Figure 3. Distribution map of the Jutland Klippe exposures [13,17].
Geosciences 14 00190 g003
Figure 4. Chondrite-normalized [31] REE distribution of the samples appearing in Table 1. Hartland Formation samples are indicated in green; Manhattan Formation samples are indicated in red.
Geosciences 14 00190 g004
Figure 5. Diagrams illustrating the (a) SiO2-TiO2, SiO2-Al2O3, SiO2-FeOt, and SiO2-MgO contents and (b) the SiO2-CaO, SiO2-Na2O, SiO2-K2O, and SiO2-Zr contents of Hartland schist samples compared to Manhattan schist samples, Hartland East samples, and Jutland shale samples. The Hartland East samples are from locations east of Central Park, NYC. Data sources: ref. [22] and this study.
Geosciences 14 00190 g005aGeosciences 14 00190 g005b
Figure 6. Diagram illustrating the content of Ni and Cr in Hartland schist samples, compared to Manhattan schist samples and Jutland shale samples. The Hartland East samples are from locations east of Central Park, NYC. Data sources: ref. [22] and this study.
Geosciences 14 00190 g006
Figure 7. Chondrite-normalized [31] spider diagram illustrating the upper and lower range of Manhattan schist samples compared to Jutland schist compositions (Jut1 and Jut4, Table 1), Normanskill schist compositions (Norm2 and Norm8s) [27], and the “World Shale Average” WSH [32]. The range is bounded by sample ManC15 (red) and the most REE-depleted Hartland data (green) (Table 1).
Geosciences 14 00190 g007
Figure 8. Taconic orogenic models: (a) across central New England, modified after [34], and (b) across New York City and Northern New Jersey.
Geosciences 14 00190 g008
Figure 9. Ordovician and Cambrian Series/Epoch stratigraphic units, with the dominant lithologies. Blue indicates carbonates, red indicates pelites and meta-pelites, yellow indicates quartzites, and brown indicates post-Taconic turbidites. The Sauk-Tippecanoe unconformity (S-T unconformity) is defined [44] as from the early Chazyan period (about 465 Ma). The proposed age of the NYC schists is based on its correlation with the Jutland Klippe Sequence (this study). The ages of the named formations are based primarily on fossil evidence, including: the Jutland Klippe Sequence [17]; the Jacksonburg [45,46]; the Normanskill [47]; the Beekmantown and Potsdam [48]; the Martinsburg [49,50,51,52] and the Walloomsac [53] formations. Other formation ages are based on geologic maps [1,13].
Geosciences 14 00190 g009
Table 1. Chemical composition of the schists of NYC and the Jutland Sequence.
Sample #Jut1Jut4ManC2ManA6ManC15HartOB1HartOB2HartOB3HartOB4Hart4aHart4b
FormationJutlandJutlandManhatCManhatAManhatCHartland HartlandHartlandHartlandHartlandHartland
Wt.%
SiO264.8076.7058.1364.9060.0065.2054.8069.4068.5073.8073.40
TiO20.790.600.950.760.940.871.200.790.941.011.01
Al2O315.4510.9518.5217.5019.9514.1519.1013.3014.1010.9511.55
Fe2O3t5.974.397.767.278.367.559.214.796.435.465.71
MgO2.581.483.262.221.862.073.071.571.231.441.52
MnO0.060.110.220.090.110.400.170.070.140.090.11
CaO1.640.163.460.810.611.072.002.393.401.601.61
Na2O1.402.282.471.681.232.672.192.822.652.782.82
K2O3.261.623.213.964.394.544.901.961.291.902.14
P2O50.150.150.120.130.190.100.140.160.390.150.18
C0.040.05nd0.070.05ndndndnd0.050.04
S0.01<0.01nd0.010.01ndndndnd<0.01<0.01
LOI4.602.600.971.902.290.390.790.680.200.570.76
Total101.11101.1699.07101.3099.9999.0197.5797.9399.2799.80100.85
Trace ppm
Ba515.00291.00525.00719.00734.00623.00949.00445.00342.00217.00274.00
Cr76.0044.0099.0078.0093.0060.0070.0040.0050.0068.0064.00
Cs5.722.764.544.894.514.472.351.230.965.525.81
Ga21.4013.2018.9025.5028.8019.8027.2015.8019.6017.3017.80
Ge2.101.50nd2.202.20ndndndnd1.801.80
Hf6.269.866.944.855.785.304.9010.109.9010.1012.80
Nb16.4512.5015.8117.7521.5016.3018.1011.4014.0020.3026.60
Rb125.0065.60124.00140.00153.50162.50150.5061.7047.9090.30102.00
Sr71.7041.70292.00182.00139.50110.50106.0097.40159.00182.50191.50
Ta1.100.800.901.001.100.900.900.700.901.301.60
Th11.559.1210.7612.7014.1513.656.617.078.2210.7513.70
U3.022.302.452.693.170.740.951.842.034.645.23
V120.0069.00128.00113.00131.0069.0097.0064.0079.0090.0095.00
W3.001.501.401.201.401.001.00<11.000.801.50
Y33.7030.5046.9035.4048.1027.1042.4029.1036.5039.0035.30
Zr249.00417.00194.00190.00221.00179.00169.00365.00356.00427.00543.00
Bi0.110.08nd0.160.14ndndndnd0.050.06
Tl0.080.06<0.50.390.46<0.5<0.5<0.5<0.50.480.52
Co9.0011.0013.0018.0022.0022.2024.007.5011.5012.0013.00
Cu37.0026.0031.0052.0052.007.00< 517.0016.0023.0035.00
Li70.0040.0060.0050.0050.00ndndndnd60.0070.00
Ni48.0027.0056.0041.0049.0039.0037.0010.0014.0024.0023.00
Pb11.0016.0018.0040.0062.0031.0017.0024.0021.0021.0024.00
Sc14.009.0012.0016.0018.00ndndndnd10.0010.00
Zn94.0080.0085.0096.00117.00110.00179.0052.0089.0080.0092.00
REE ppm
La35.4033.2031.0748.9060.3041.5032.4026.3032.9033.3041.20
Ce76.2074.7066.12104.00127.0087.0068.5053.8068.9072.0089.20
Pr9.308.937.6412.3515.409.368.296.668.748.4010.35
Nd34.7032.5031.8044.3056.4035.7035.1027.7035.8031.3039.20
Sm6.816.496.288.3210.906.597.125.727.146.367.62
Eu1.351.261.211.612.021.301.811.401.841.151.41
Gd6.285.965.807.119.476.137.145.697.405.926.60
Tb0.990.890.851.131.500.831.090.831.060.970.97
Dy6.285.436.716.378.535.237.465.676.896.125.88
Ho1.251.141.401.321.821.011.501.061.291.311.26
Er3.793.294.223.674.933.184.863.444.223.883.67
Tm0.530.470.580.520.730.420.660.480.590.600.51
Yb3.362.853.753.284.633.104.483.374.093.753.31
Lu0.570.480.540.520.720.430.590.490.560.590.51
Note: nd—Non-detected.
Disclaimer/Publisher’s Note: The statements, opinions and data contained in all publications are solely those of the individual author(s) and contributor(s) and not of MDPI and/or the editor(s). MDPI and/or the editor(s) disclaim responsibility for any injury to people or property resulting from any ideas, methods, instructions or products referred to in the content.