Article

Geological Assessment of Faults in Digitally Processed Aerial Images within Karst Area

by
Laszlo Podolszki
1,
Nikola Gizdavec
1,*,
Mateo Gašparović
2 and
Tihomir Frangen
1
1
Croatian Geological Survey, Ulica Milana Sachsa 2, 10000 Zagreb, Croatia
2
Faculty of Geodesy, University of Zagreb, Kačićeva ulica 26, 10000 Zagreb, Croatia
*
Author to whom correspondence should be addressed.
Geosciences 2024, 14(7), 195; https://doi.org/10.3390/geosciences14070195
Submission received: 4 June 2024 / Revised: 12 July 2024 / Accepted: 16 July 2024 / Published: 18 July 2024
(This article belongs to the Section Structural Geology and Tectonics)

Abstract

:
The evolution of map development has been shaped by advancing techniques and technologies. Nevertheless, field and remote mapping with cabinet data analysis remains essential in this process. Geological maps are thematic maps that delineate diverse geological features. These maps undergo updates reflecting changes in the mapped area, technological advancements, and the availability of new data. Herein, a geological assessment example focused on enhancing mapped data using digitally processed historical (legacy) aerial images is presented for a case study in the Dinarides karst area in Croatia. The study area of Bribirske Mostine is covered by the Basic Geological Map of Yugoslavia (BGMY) at a 100,000 scale, which was developed during the 1960s. As the BGMY was developed 60+ years ago, one of its segments is further analyzed and discussed, namely, faults. Moreover, applying modern-day technologies and reinterpretation, its data, scale, presentation, and possible areas of improvement are presented. Georeferenced digital historical geological data (legacy), comprising BGMY, archive field maps, and aerial images from 1959 used in BGMY development, are reviewed. Original faults were digitalized and reinterpreted within the geographic information system with the following conclusions: (i) more accurate data (spatial positioning) on faults can be gained by digitally processing aerial photographs taken 60+ years ago with detailed review and analysis; (ii) simultaneously, new data were acquired (additional fault lines were interpreted); (iii) the map scale can be up-scaled to 1:25,000 for the investigated area of Bribirske Mostine; and (iv) a newly developed map for the Bribirske Mostine study area is presented.

1. Introduction

Geological maps are thematic maps showing various geological features [1,2,3,4,5,6]. On these maps, rock units (lithologies) are typically delineated with their corresponding age (stratigraphy) and structural characteristics (such as bedding planes, faults, and folds) [1,5,6,7,8]. Commonly, other mappable natural and artificial surface features are also present on the map(s): surface water elements, mineral resources, superficial processes, settlements, roads, etc. [9,10,11]. As geological maps differ in scale, purpose, and area, it is evident that there are many variations [4,6,12,13,14]. The process of map development evolved as different techniques and technologies developed [15,16,17]. Still, field and remote mapping with cabinet data analysis is the most important in this process [5,18,19,20]. Geological maps can also be updated as changes in the mapped area occur, new technologies are developed, and new data become available [1,15,19,20].
Geological remote sensing applications emerged with the application of black-and-white aerial images used in oil and gas exploration in the early 1920s [21]. Surfaces covered in vegetation are very often a limiting factor for conducting remote geological surveys [18,19,22]. Conversely, intensive methodology (for example, in the machine learning field) and technology development (for example, remote sensing using different types of sensors located on several types of aircraft) play important roles in Earth observation sciences, like geology [23].
Aerial images were also used in the Basic Geological Map of Yugoslavia’s (BGMY) development, especially for fault discrimination [24,25]. These aerial images were created more than 60 years ago. Therefore, they are currently considered a precious source of information, providing insight into the past. For example, back then, there was less vegetation in the Dinarides karst area in Croatia [26], which can be concluded from the initial review of those recordings and the normalized difference vegetation index (NDVI) [27] derived from a multispectral sensor on the European Space Agency’s (ESA) Sentinel-2A satellites (MSI S-2A) [28,29].
By applying modern-day technologies and practicing reinterpretation in a geographic information system (GIS) and computer-aided design (CAD) environment, one of the BGMY segments was further analyzed and discussed in this research, namely, faults, as well as the data, scale, presentation, and possible areas of map improvement. Georeferenced digital historical geological data are reviewed, comprising the map itself (BGMY), old field maps (from the Croatian Geological Survey archive), and aerial images from 1959 used in BGMY development [24,25]. For Croatia, historical geological data are valuable and often the prime source of geo data for some areas. In that sense, they can be considered geoheritage. As these data are mainly available at a 1:100,000 scale, they are relatively coarse (in the sense of the presented details); however, through their reinterpretation and analysis with modern-day technologies, the mapped data accuracy (spatial positioning) can be improved, leading to up-scaled map development with new, additional sets of georeferenced data.
For this research, as one implement to verify the results, we used unpublished, original fieldwork geological maps of the Bribirske Mostine locality at a 1:25,000 scale (developed by the Croatian Geological Survey more than 60 years ago), in addition to the BGMY sheet of Šibenik at a 1:100,000 scale, more than 60-year-old legacy aerial images, MSI S-2A and digital orthophoto images (DOP) from 2020 from the National Geodetic Administration of Croatia (NGA), and a high-resolution digital elevation model (hDEM with a 1 × 1 m cell size, developed by NGA). As a processing tool, a geographic information system (ArcGIS) was used in conjunction with computer-aided design (StereoCAD) and semi-automatic processes for the development of a new raster data sets. For the BGMY, with the technological advancement in digitalization and GIS-based system improvements, certain geometrical deviations of the lithological boundaries were determined, as described in [26]. However, since that work focused on the application of remote sensing methods for lithological unit discrimination using the MSI S-2A sensor, the extraction of linear structural elements was omitted, although this is usually integral to geological maps. Additionally, it is believed that the digital processing of aerial photographs taken 60+ years ago will yield significantly more accurate data on fault data than appear in the BGMY. This research hypothesizes that deviations are also possible in the number and geometry of faults. The scope of this work is to further refine the geology of the research area published in [26], with more precisely determined spatial positions of the faults. Integrating all the obtained data with the existing literature will form a newly available data set of significance for all spatial users in the study area. The developed method may also be useful for the reinterpretation and improvement of existing geological data sets for the Croatian karst area as part of the wider Alpine–Dinaric karst. For the research area, the term “Dinarides karst area” will be used further in the text, in accordance with [30,31,32].

2. Materials and Methods
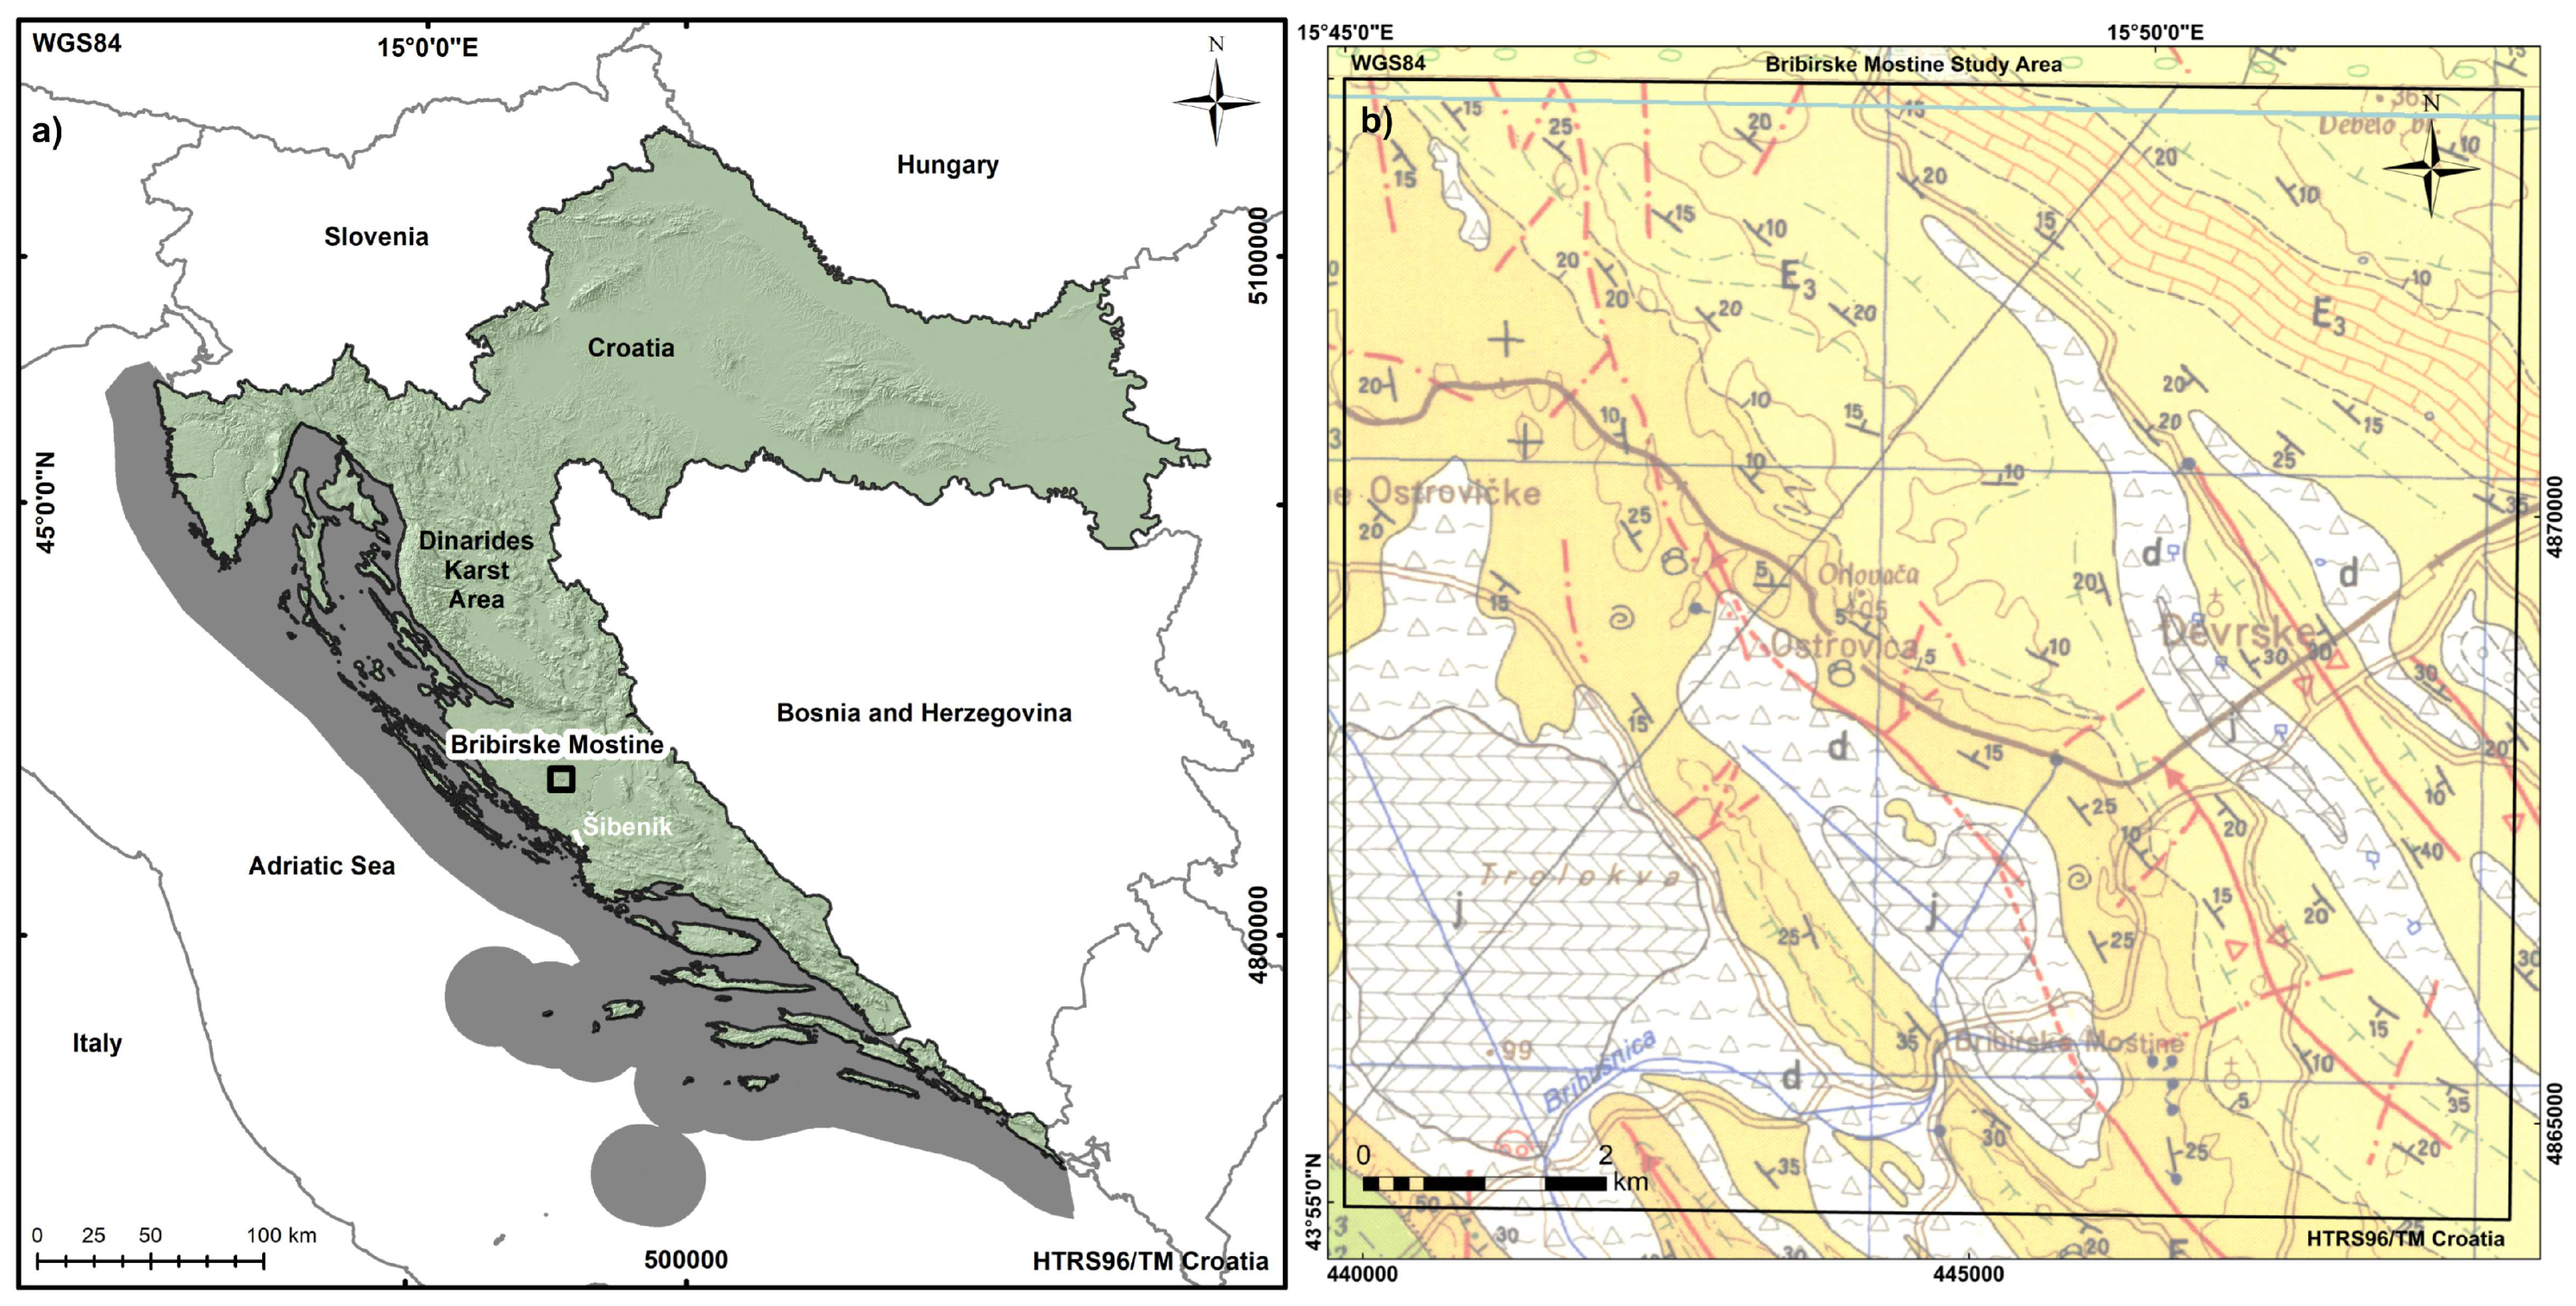
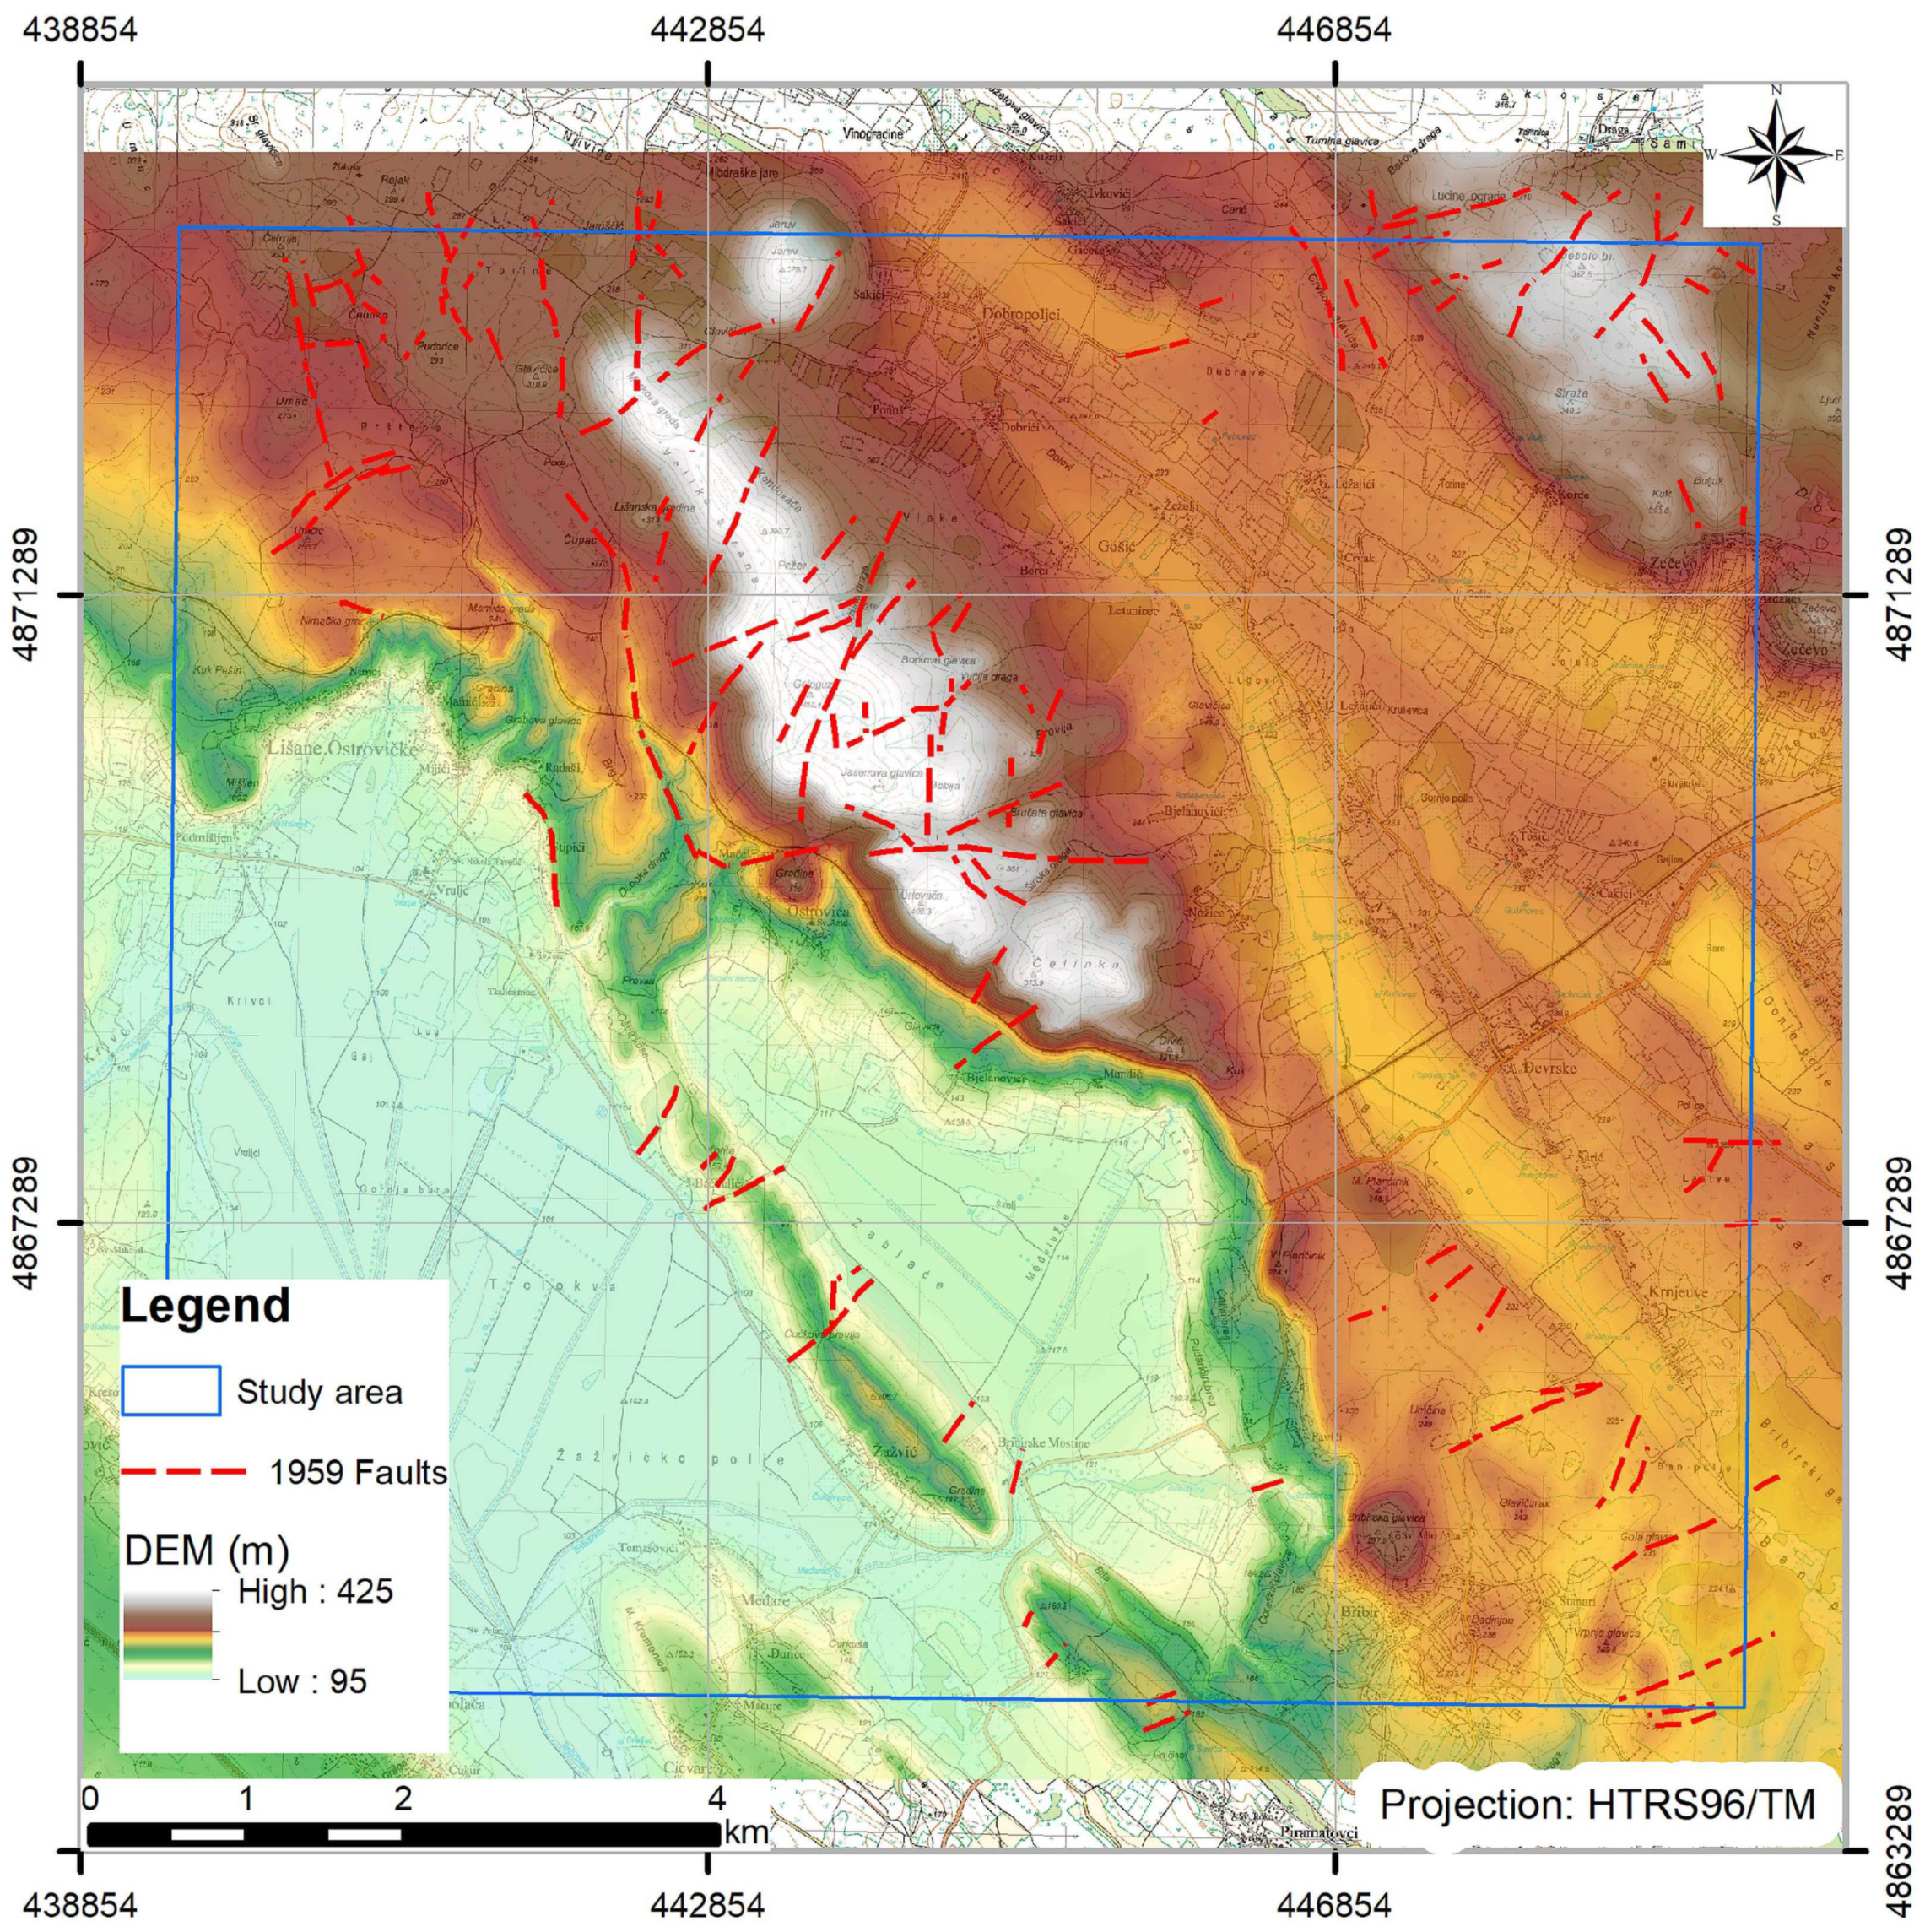
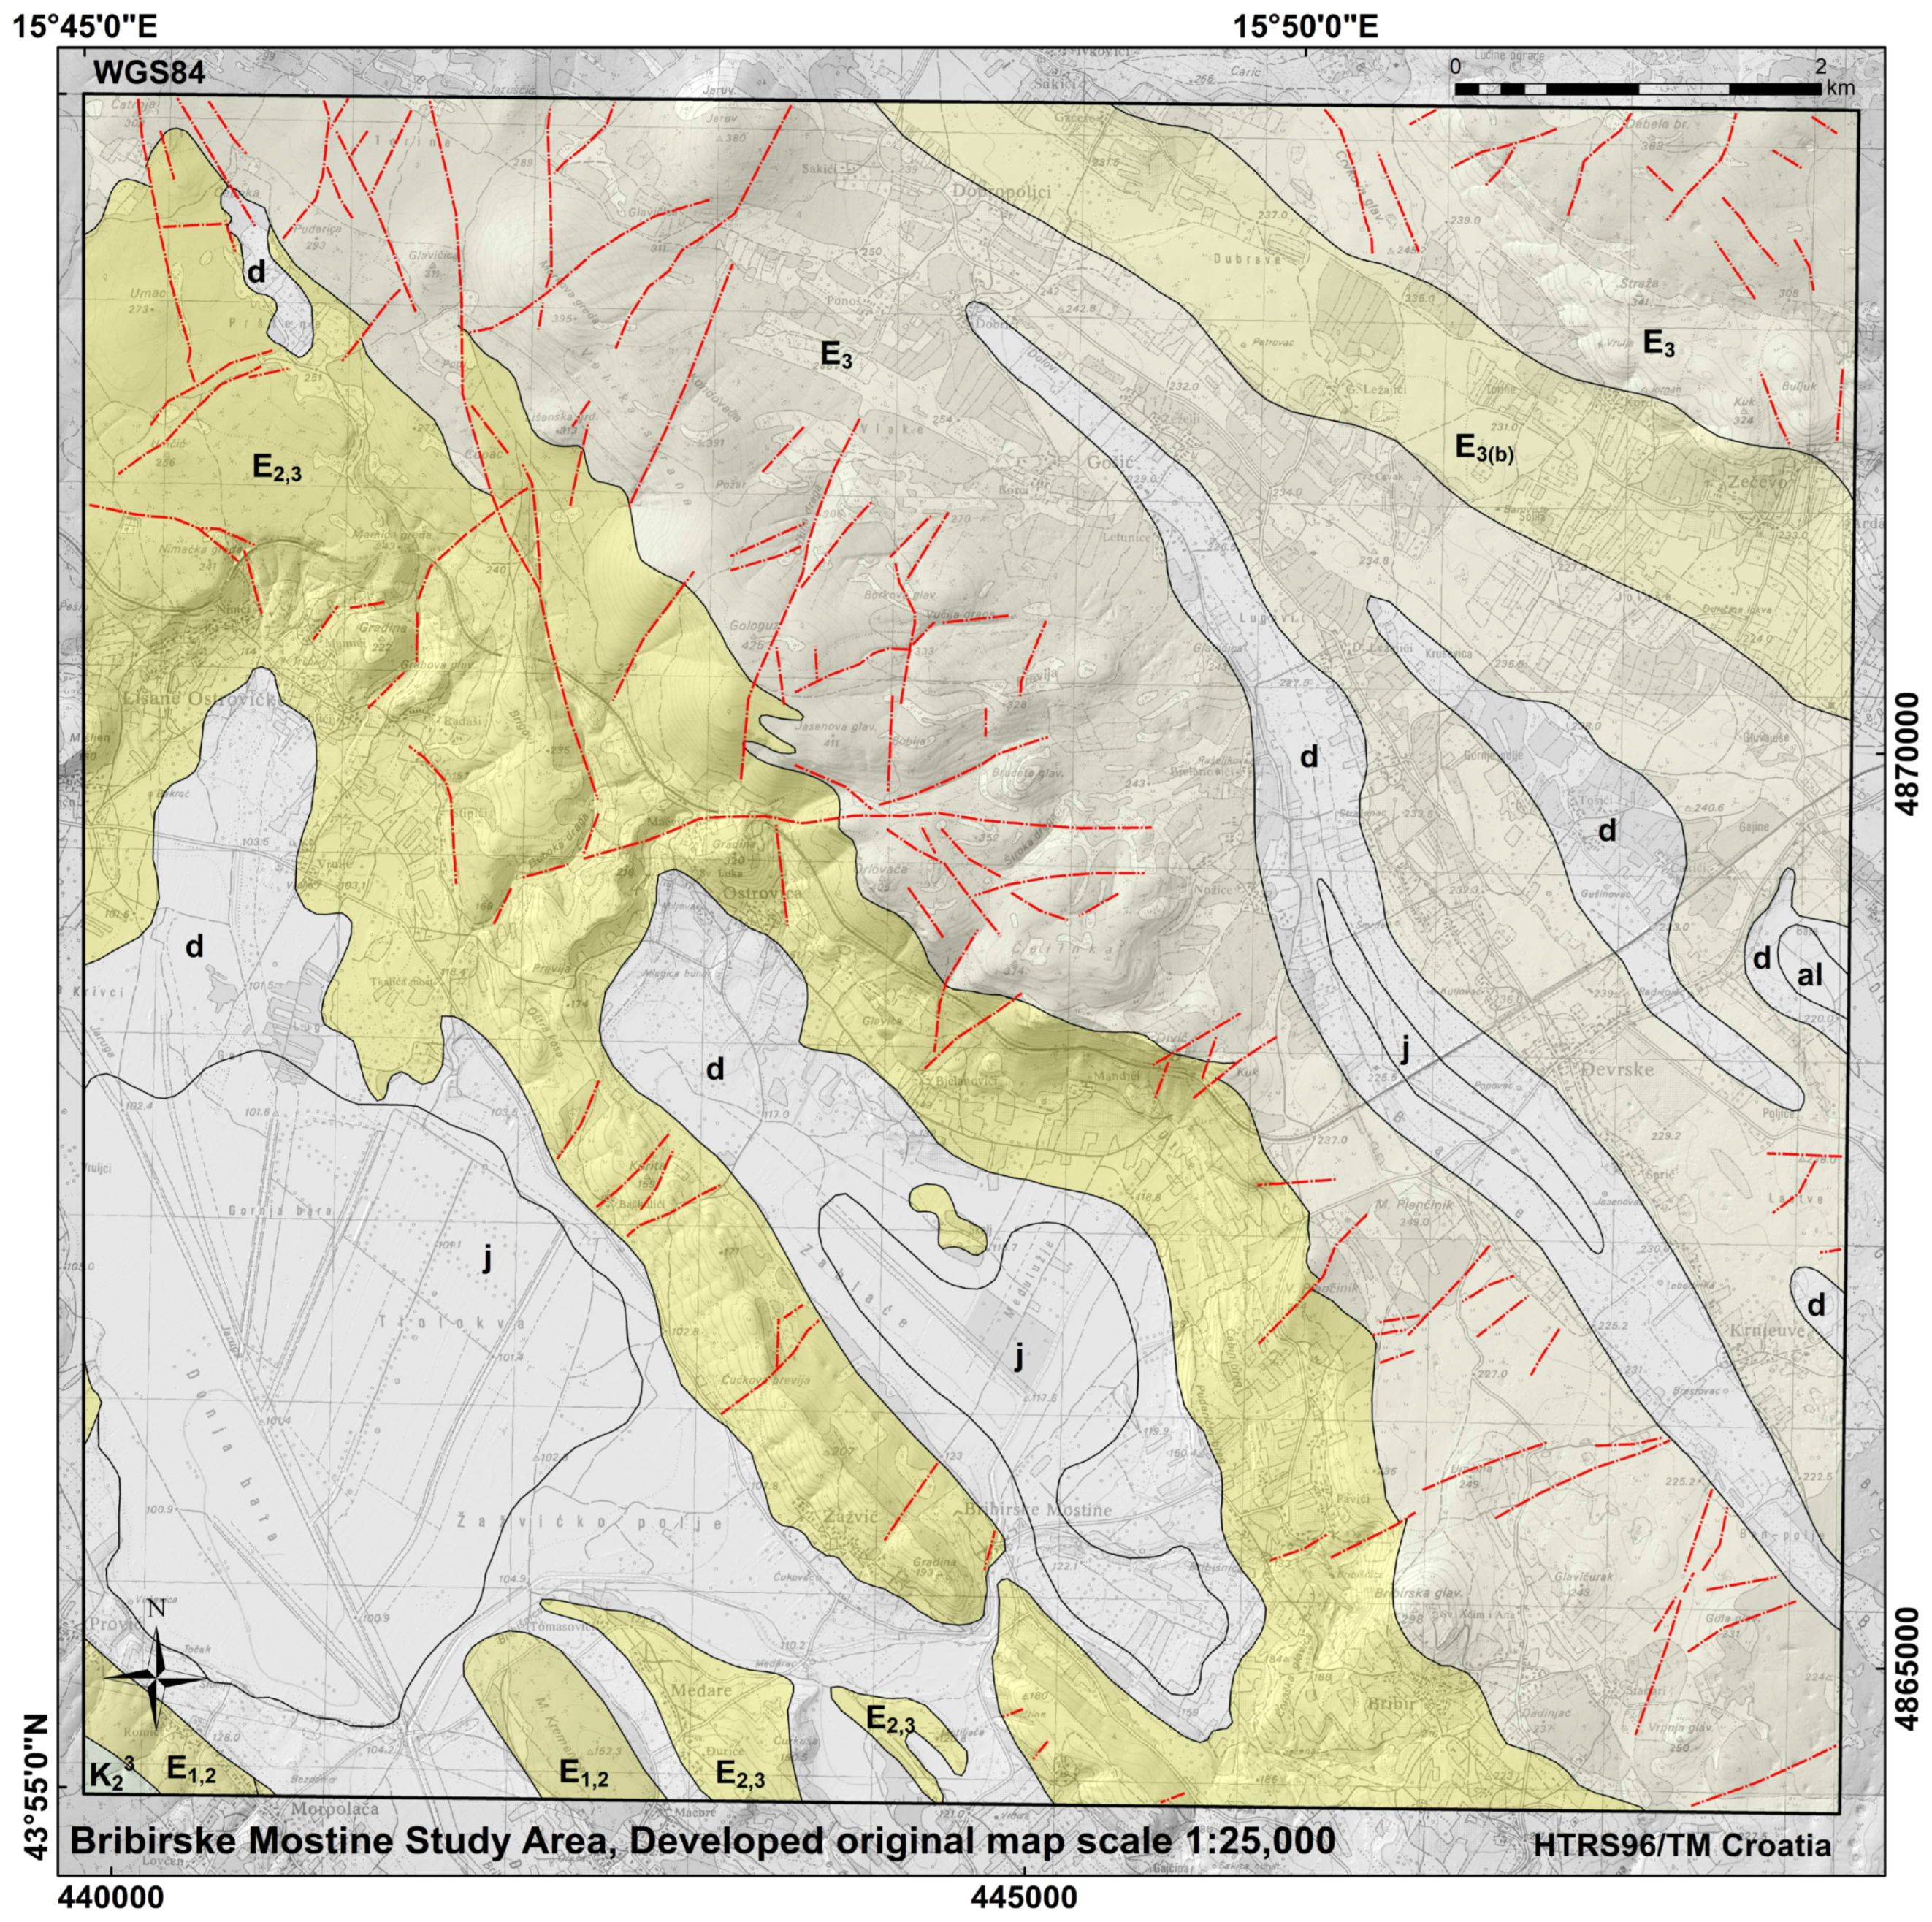
It must be noted that ~50% of Croatia is in karst [30,31,32], and for the majority of this area, the most detailed geological data available are geological maps at a 1:100,000 scale (sheets of BGMY with guides). The BGMY was based on extensive field research and unpublished field maps at a 1:25,000 scale (some of them can be tracked down as analog archive data), and they were produced in the 1960s–1980s. As such extensive field research is unlikely to be performed in the future (due to economic reasons), one way to review and upgrade these data sets is by utilizing new technologies, such as remote sensing techniques and GIS and CAD environments, as they can provide geospatial data with reliably high accuracy [33,34,35,36,37].
Herein, mapped data improvement for a case study in the Dinarides karst area in Croatia is presented. The Bribirske Mostine locality was chosen as the research area, as the vegetation is relatively sparse, which is important for remote mapping. Different data sets are available, namely, aerial photography from 1959, which was used in the basic geological map development (BGMY) [24,25], and new aerial photography from 2020. These data sets are important, as photography from 1959 could be reviewed using new technologies (ArcGIS and StereoCAD), while photography from 2020 could illuminate the on-site land cover situation and be used to verify the 60-year-old data set.

2.1. Study Area

The study area of Bribirske Mostine (Figure 1a) is covered by the BGMY sheet of Šibenik at a 1:100,000 scale, which was developed during the 1960s [24] (Figure 1b). As the BGMY was developed 60+ years ago, expert reports and scientific research indicate that there is room for its improvement in terms of scale and the presented data [26]. The study area is focused on the ~90 km2 research area, located between 43°55′00′′ and 44°00′00′′ northern latitude and 15°45′00′′ and 15°52′30′′ eastern longitude. Translated into the official coordinate system used in the Republic of Croatia (HTRS96/TM Croatia), this is an area located between 4873581 N and 439529 E and 4864272 N and 449396 E.
The study area is in the Dinarides karst area [30,31]. Since it is a bare karst area with a lack of vegetation, it is suitable for fault mapping in the field and with remote sensing techniques. Basic descriptions of the lithological units for this area are given in [25,26], including different types of Eocene limestone (marked yellow on the BGMY) and Quaternary sediments (alluvial, deluvial, and lake and swamp sediments, which consist mostly of gravels, sands, silts, and clays, marked white on the BGMY) (Figure 1b).

2.2. Development of Digital Data Sets from Aerial Imagery

The first steps were to digitalize the available historical analog geological data, namely, faults from the geological map at a 1:100,000 scale and faults from the (unpublished) field geological maps of Bribirske Mostine locality at a 1:25,000 scale (developed by the Croatian Geological Survey more than 60 years ago), as well as to develop digital data based on the BGMY [24] and field maps. As described in [26], some modifications of geological boundaries are possible with satellite imaginary analysis and usage of the GIS environment. Still, fault lines were not analyzed during that research.
From the NGA, stereopairs from 1959 were acquired. As these images were used in the development of the geological map at a 1:100,000 scale (BGMY, [24]), the intention was to (i) develop a DEM and to analyze it (new data); (ii) develop a digital fault data set for the research area (based on stereopairs from 1959, new digital data); and (iii) compare the developed digital fault data set with fault data set from the BGMY [24,25].
Stereopairs from 2020 were also acquired from the NGA. As these images are recent, the intention was to (i) develop a DEM and to analyze it (new data); (ii) develop a digital fault data set for the research area (based on stereopairs from 2020, new digital data); (iii) visually compare the changes in land use; and (iv) compare the developed digital fault data set with the fault data set developed based on the stereopairs from 1959 and with the fault data set from the BGMY [24].

2.3. Mapping Criteria

Faults, from a geological viewpoint, are important features; they indicate structural relations [1,7] and tectonic activity [3,8], and they offset geological formations [1,3,5,7,38,39]. For the research area, the offset of the beddings can be visually identified and tracked (more or less) on the available and analyzed aerial images (Figure 2). This was the main mapping criterion used: the offset can be tracked (more or less) in limestone sediments. As additional criteria used for fault identification or confirmation, existing and visible geomorphological terrain features were used: changes in the terrain morphology, the presence of terraces or valleys, the stream network distribution, and in some cases, even man-made paths were indicative [3,7,8,9,10,40,41]. Also, additional raster data sets were developed and analyzed as auxiliary information for the decision making in fault identification (described in detail in Section 3.2).
On the available archive field maps and BGMY, only a couple of the assumed photo-geological interpreted faults are presented for the research area of ~90 km2 (red dash dot lines, Figure 1b). For the performed cabinet analysis of the aerial images from 1959 and 2020, the same approach was adopted: only faults according to the described mapping criteria were identified, all of the identified faults were marked as assumed as they were identified in cabinet (without field verification), all of the faults were interpreted in the same way (photo-geological interpretation or assumption), and all of the faults were marked the same way (with red dash dot lines on developed map).

2.4. Semi-Automatic Process Input for the Development of Digital Data Sets from Historical Aerial Images

The development of the semi-automatic process for the development of digital data sets from historical aerial images started with the photogrammetric processing of aerial images. Due to the available metadata on aerial imagery and possibly performed national historical aerial triangulation, it was necessary to obtain external orientation parameters of each aerial image [42]. For all images, reviewing and inputting the camera data and imagery external orientation parameters are manual processes, as the first step for photogrammetry processing. With adequate camera and imagery data, historical aerial images can be re-used in modern day environments (for example, Agisoft or Pix4D), and different raster data sets (for example, DEMs or DOPs) can be developed with a semi-automatic process [43]. However, manual and experience-based corrections are needed in data review and analysis.
The location of each image in the coordinate system, in our case, the Croatian terrestrial reference frame (HTRS96TM) based on the European Terrestrial Reference System 1989.0 datum and Transverse Mercator Projection, is key to the external orientation parameters. In addition to the location of each image, it was necessary to obtain the external orientation angles (Omega, Phi, Kappa) and the internal orientation parameters, i.e., the camera file. The camera file included the adjusted camera constant (or focal length), the principal point coordinates, the fiducial mark’s coordinates (given that it was analog imagery), and the camera distortion parameters. In this case, the original aerial imageries were acquired in 1959 with the airborne photogrammetric camera RC8 of the company Wild with image dimensions of 23 × 23 cm.
The developed raster data and GIS environment can help in detecting major changes in bedding dip directions and in the fold axis determination [44], while measures of the horizontal stream network’s accuracy for assessing quality and variation in the hydrographic features can give indications of the tectonics of the area [45]. From comparison of different DEMs, information about terrain changes can be gained [43].

2.5. Verification Process

For the research area, the obtained new digital data sets were crosschecked in cabinet. For the chosen test sites, additional field verification and mapping is planned (see Section 3). The test sites were chosen based on the following criteria (see Section 3.1): (i) a location with “clear and confident” fault interpretation both on available aerial images and BGMY (Test Site 1), (ii) a location with “clear and confident” fault interpretation on available aerial images but without faults on the BGMY (map scale upgrade possibility check, Test Site 2); and (iii) a location with “uncertain” fault interpretation on available aerial images and without faults on the BGMY (map scale upgrade possibility and new fault data set development check, Test Site 3). As field verification was not performed (only planned to be executed), an additional layer was used in the cabinet data verification: for the whole research area, the results were crosschecked with a high-resolution digital elevation model (hDEM with 1 × 1 m cell size, developed by the NGA).

3. Results

The original fault data sets were digitalized from a historical geological map (BGMY, [24]) and the (unpublished) field geological map of the Bribirske Mostine locality and reinterpreted, resulting in the following conclusions: (i) through the digital processing of historical maps and aerial photographs taken 60+ years ago and a detailed review and analysis, more accurate data (spatial positioning) on faults can be gained (up to ~150 m, Figure 3); (ii) new data were acquired (additional fault lines were interpreted, Table 1); and (iii) the map scale can be up-scaled to 1:25,000 for the investigated area. A semi-automatic process for developing digital data sets from historical aerial images was also tested, with limited results, and the applied methodology flow chart was developed, along with a new map of the Bribirske Mostine area.

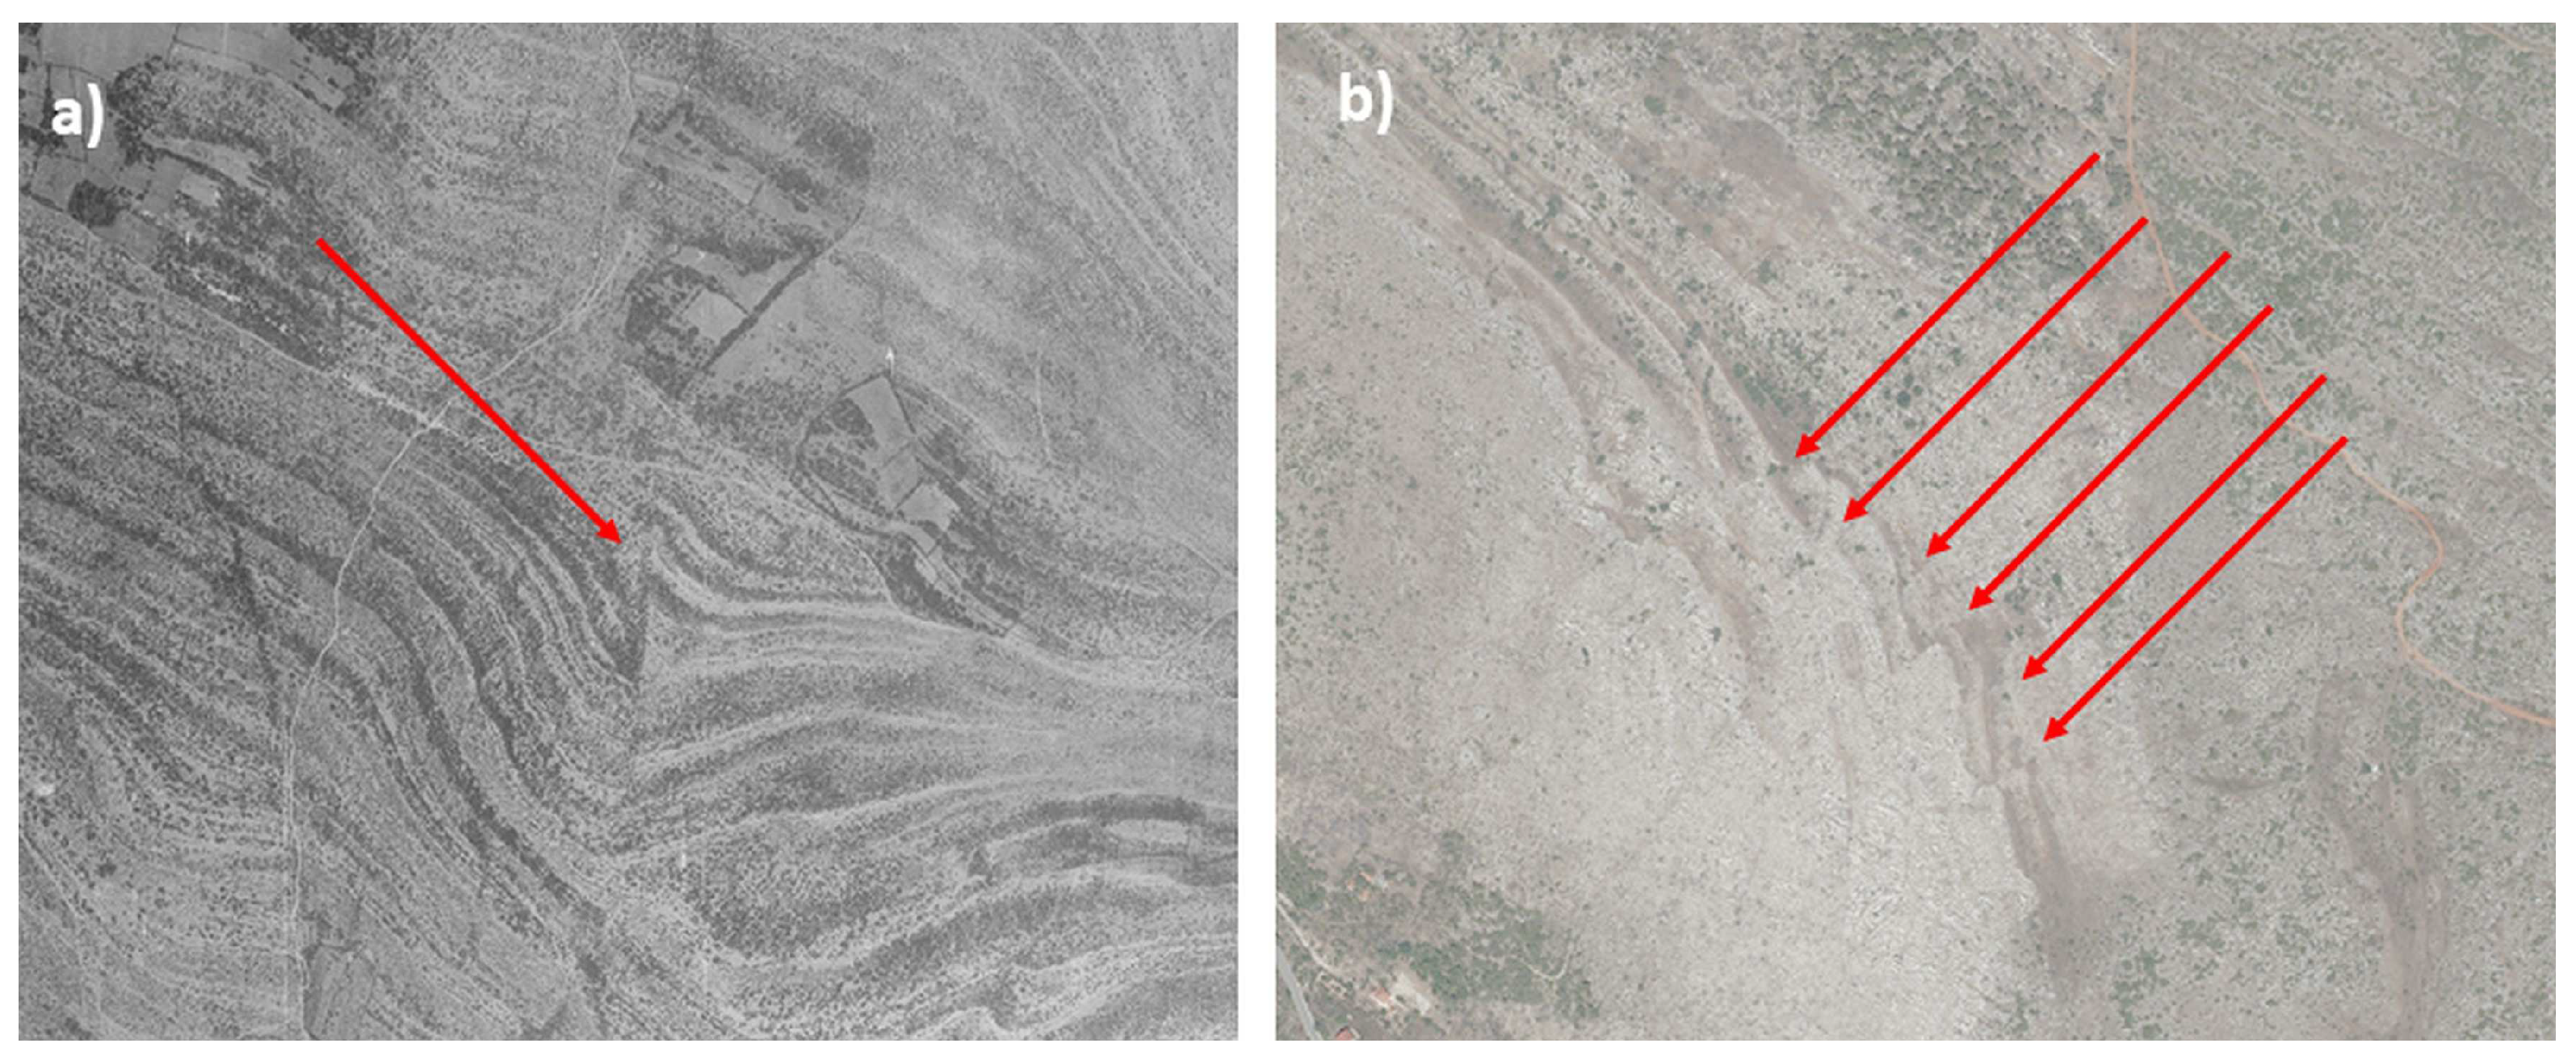
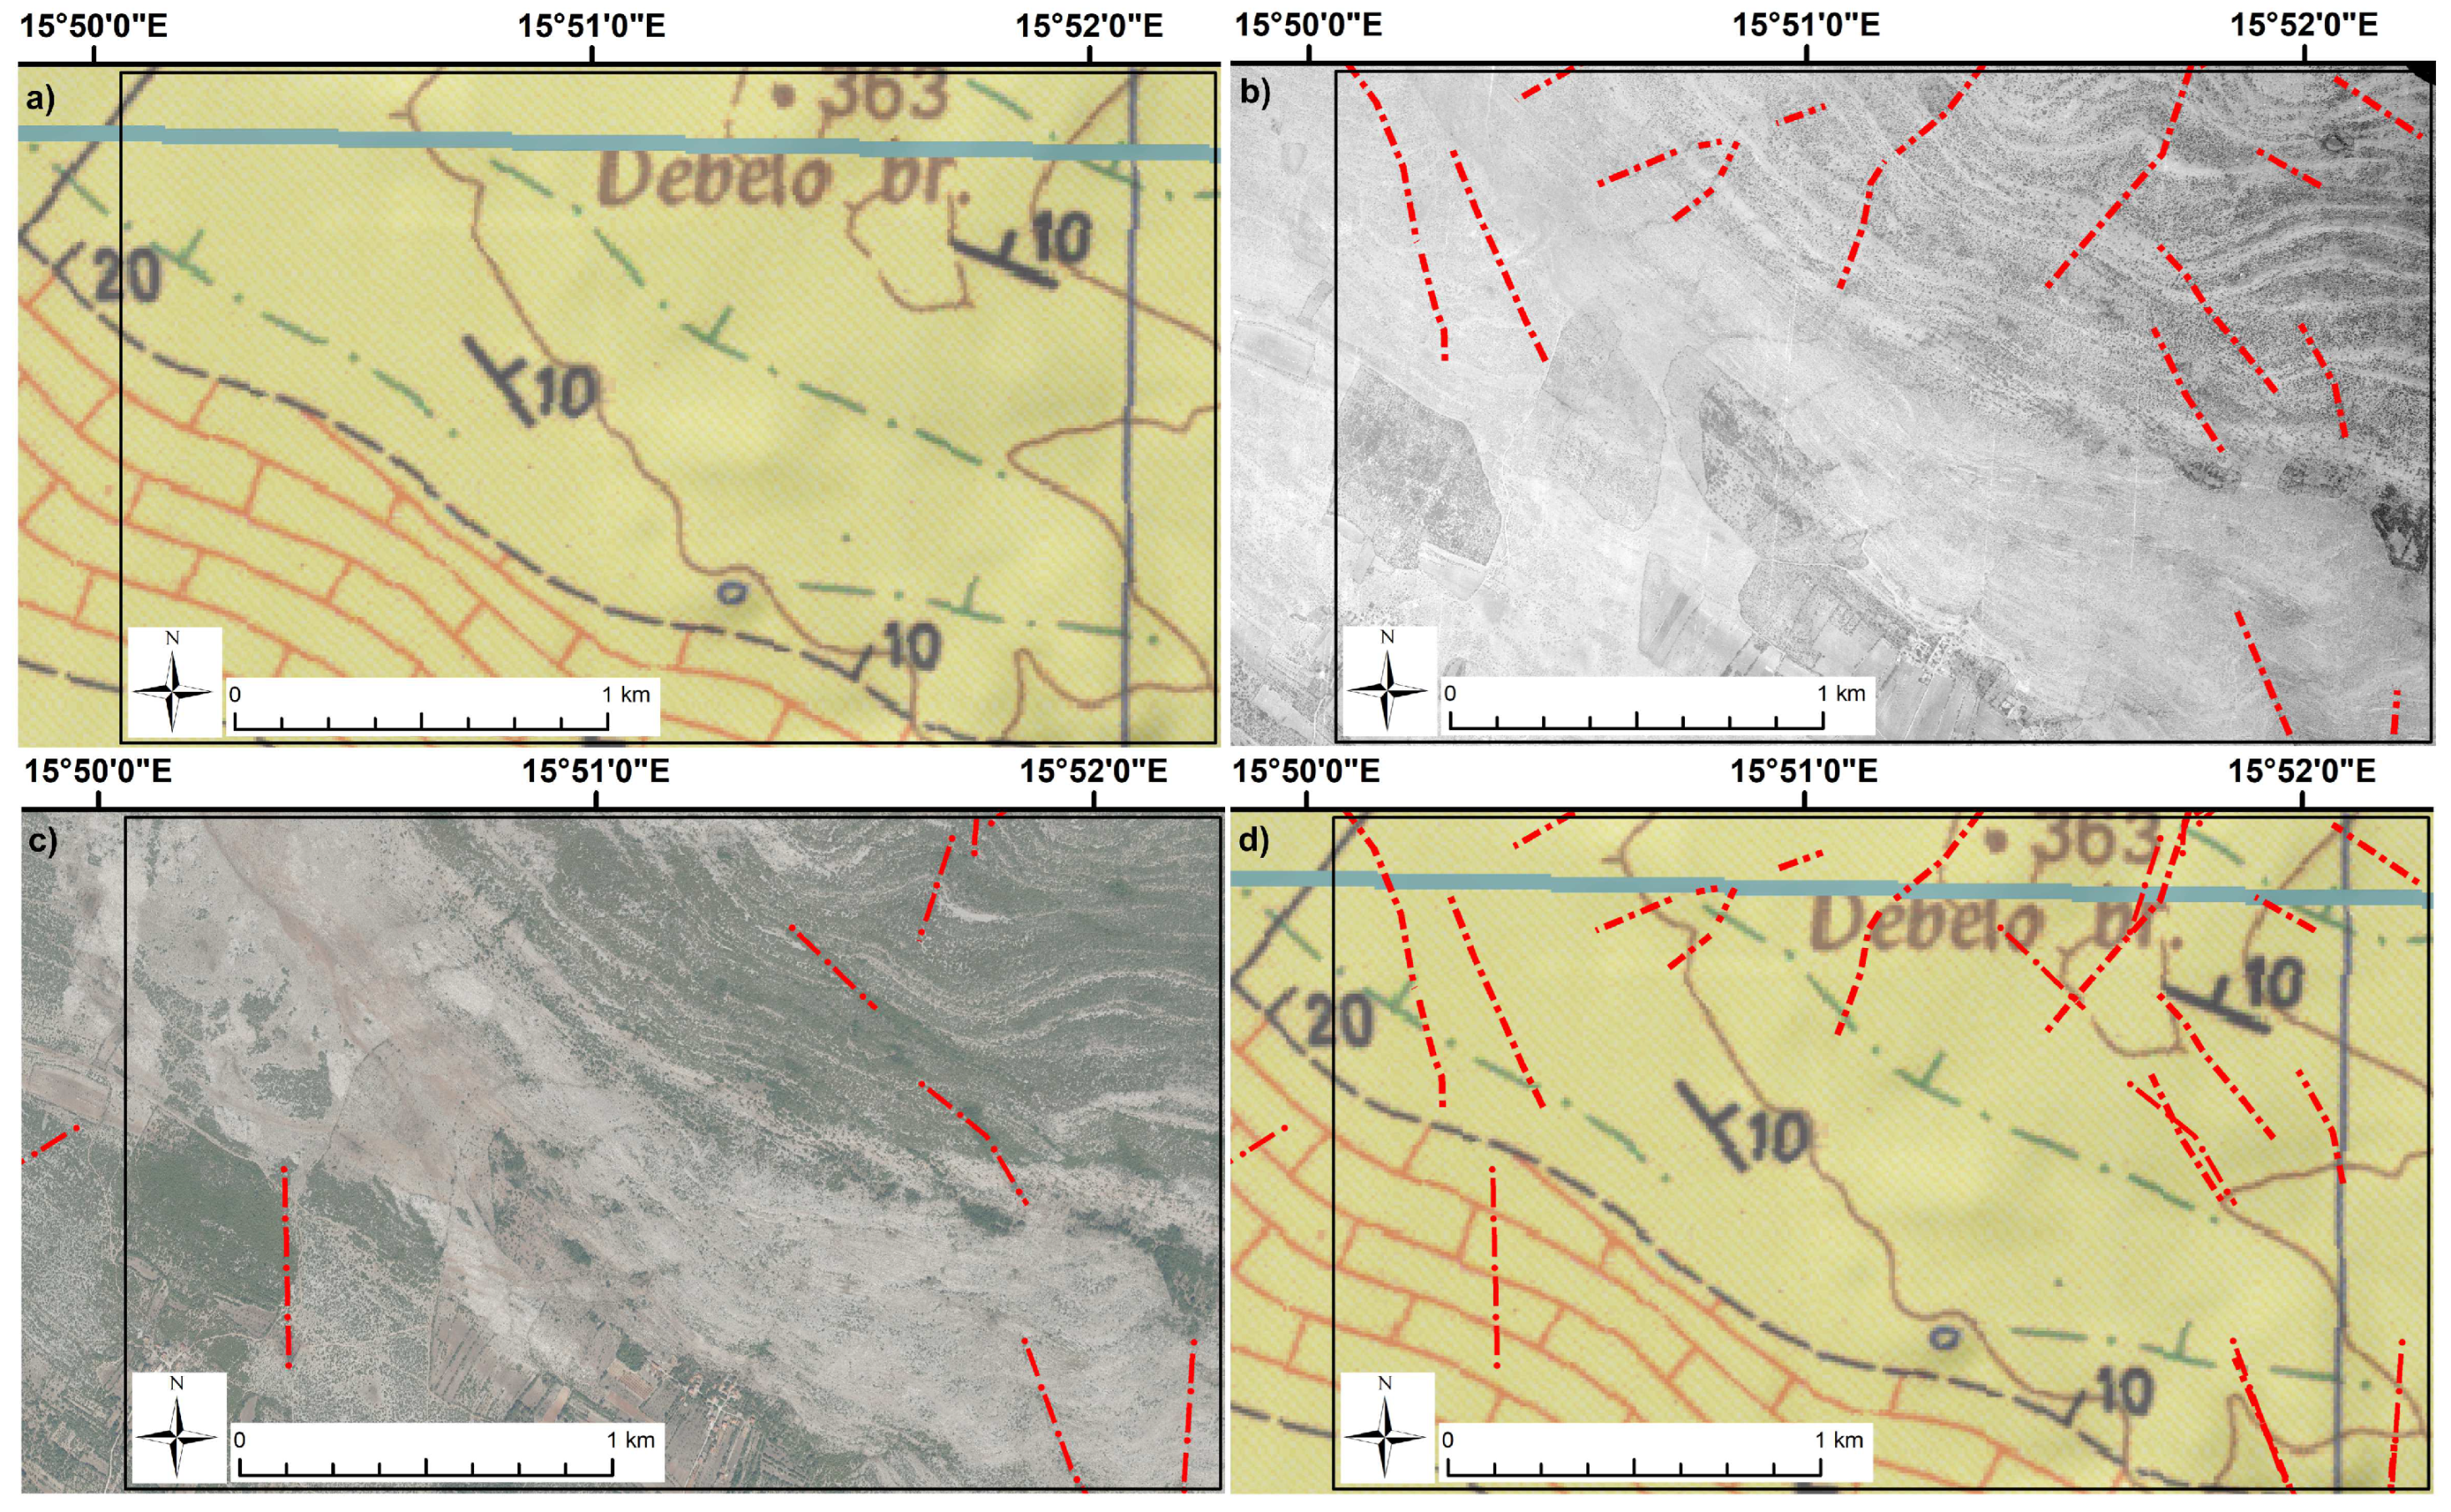
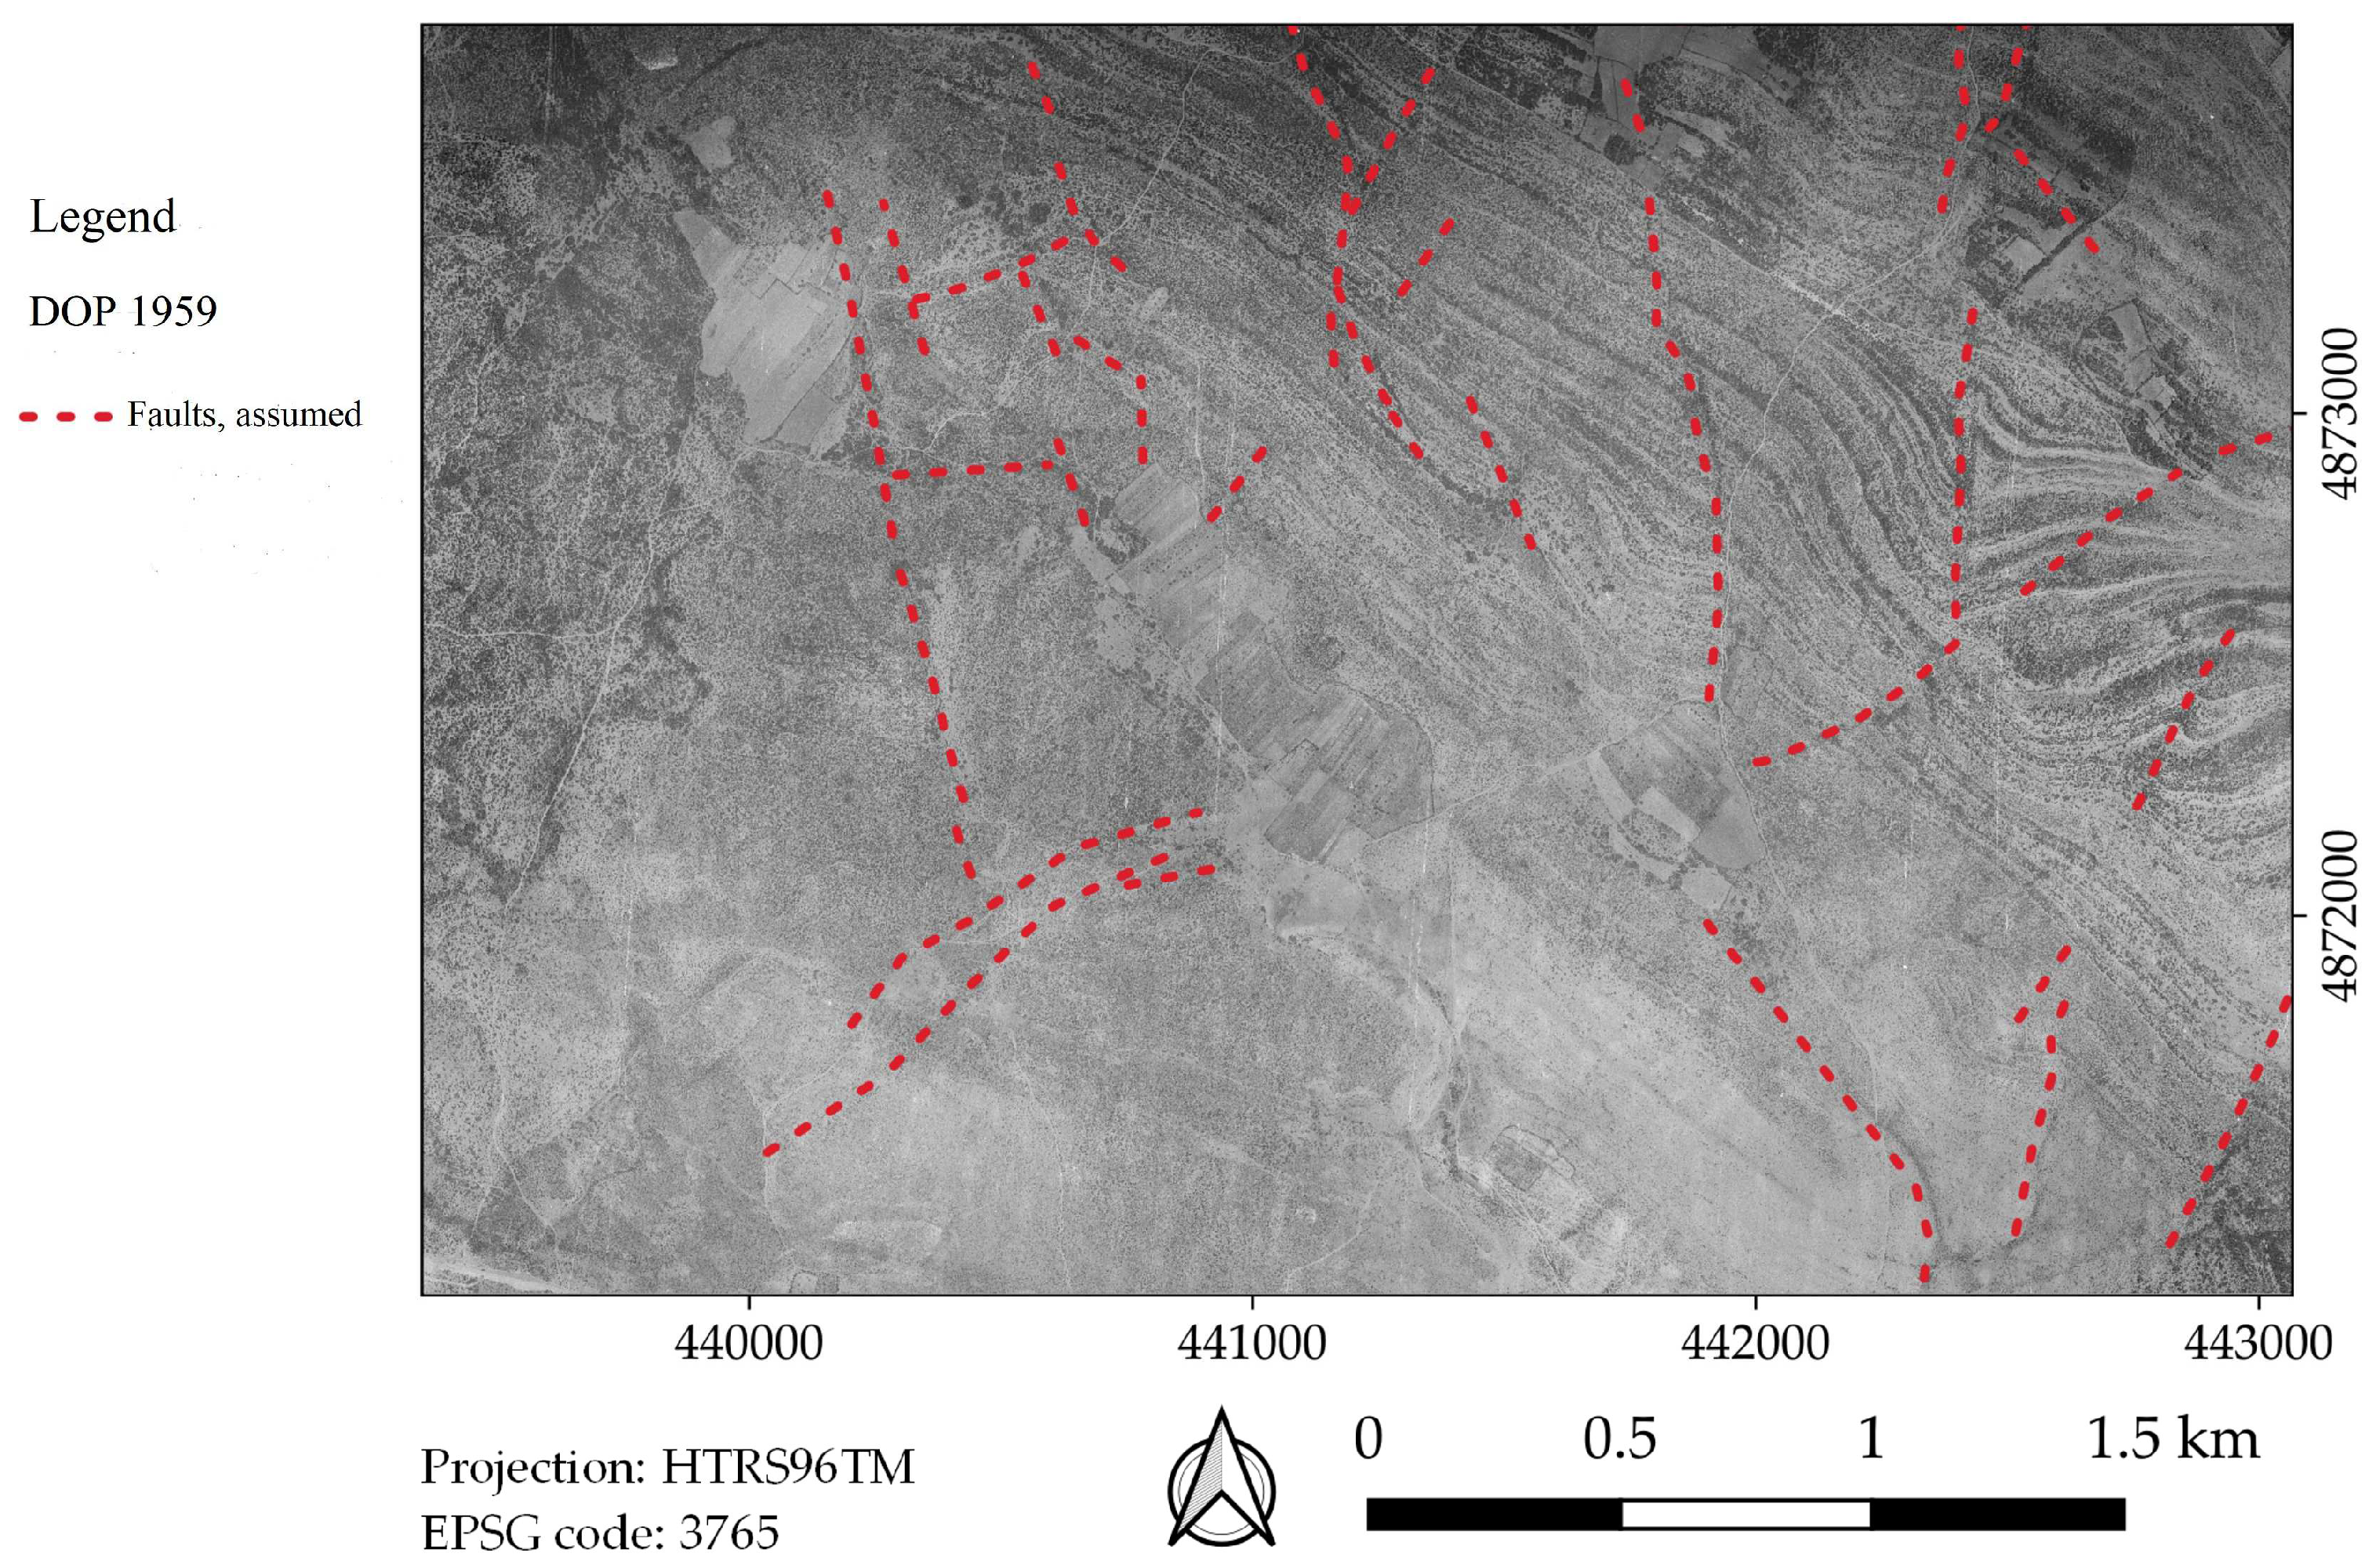
3.1. Analysis and Interpretation of Aerial Images from 1959 and 2020

The oldest available aerial images for the area of research are from 1959, and that set of photographs was used in the BGMY development [24,25]. For the study area, the original faults were interpreted from these black-and-white photographs and field mapping. Still, due to the available technology (analog stereoscopes) and developed map scale (1:100,000), they are relatively scarce (Figure 1b). Only 22 photo geological interpreted assumed faults are on the BGMY, and there are only 13 faults on the field maps, with the same markings. As current technology is more advanced, the NGA provided georeferenced digital aerial images from 1959 and 2020. These 33 × 2 photos were then reviewed and analyzed with the (Arc)GIS and (Stereo)CAD environments, which enabled the upscaling of details and the development of new digital fault data set(s). As a result of the analysis, more accurate spatial positioning of the faults was gained, and simultaneously, new data were acquired (additional fault lines were interpreted), as shown for the example test sites in Figure 4a–d, Figure 5a–d and Figure 6a–d. However, the following must be emphasized: the original developed fault data set was high in quality, and generally, the original and new fault data (more or less) overlap. Still, some exceptions exist: some original faults or fault segments could not be confirmed on the newly developed set(s). In general, the new fault data set contains a higher number of faults with a more precise interpretation of strike and breaking points (points where changes in the fault direction strike occur), as shown in Table 1 and Figure 3.
Another relevant factor for remote mapping is vegetation cover, i.e., its presence, type, or density [22,27,46,47]. From this viewpoint, aerial images from 1959 are a good example of sparse vegetation. More specifically, the study area is in a bare karst area, and the vegetation is scarce or non-existent, so the reinterpreted faults were (generally) determined with great confidence and added value (in number and spatial positioning) to the existing historical fault data set (Test Site 1, Figure 4a–d).
Aerial in-color images from 2020 were reviewed and interpreted with two main intentions: to verify the data set developed from the aerial images from 1959 and to obtain insight into the conditions of the present land cover. From the analysis of the images from 2020, the following conclusions can be drawn: (i) vegetation was more expressed in the study area in 2020 than in 1959, so for the visual identification of faults, the images from 1959 are more appropriate; (ii) the confirmation of original fault data from the BGMY [24] was partially possible, (iii) which is also true for the confirmation of the new fault data developed from the images from 1959 (partially possible); still, (iv) for some study area segments, the new fault data set could be developed based on images from 2020 (Test Site 2, Figure 5a–d).
As a result of the interpretation of the 1959 and 2020 aerial images, two new fault data sets were developed for the study area (~90 km2). When the developed data sets and existing BGMY [24] overlapped, for some segments, it was concluded that the BGMY [24] could be upgraded and improved, as shown in Figure 6a–d. In the presented example (Test Site 3, Figure 6a–d), no fault data were interpreted on the BGMY [24], but they could be interpreted from the aerial images from 1959 and 2020.
The original data state (BGMY segment) is shown in Figure 4a and Figure 5a. With the overlapping of the BGMY segment and the aerial images from 1959 (Figure 4b) and 2020 (Figure 5b), spatial discrepancies can be observed. The digitalized fault lines from the BGMY are presented on the correctly positioned aerial images from 1959 (Figure 4c) and 2020 (Figure 5c), with visible historical fault data set offset. Spatial error occurring in the fault line positioning is probably due to the available technologies used 50+ years ago in geo-referencing. The newly developed, more abundant, and spatially precise fault data set on the spatially correctly positioned aerial images from 1959 and 2020 is presented on Figure 4d and Figure 5d. The upgrades to the existing fault data set can be tracked in Figure 4a–d and Figure 5a–d. A segment of the BGMY without fault lines is presented in Figure 6a. However, in both of the aerial images of the same area from 1959 (Figure 6b) and 2020 (Figure 6c), faults can be interpreted. If the new fault data sets are overlapped with the original BGMY segment (Figure 6d), the result (difference) is pronounced (Figure 6a–d). The presented analysis of Figure 4, Figure 5 and Figure 6 is a result of cabinet research.

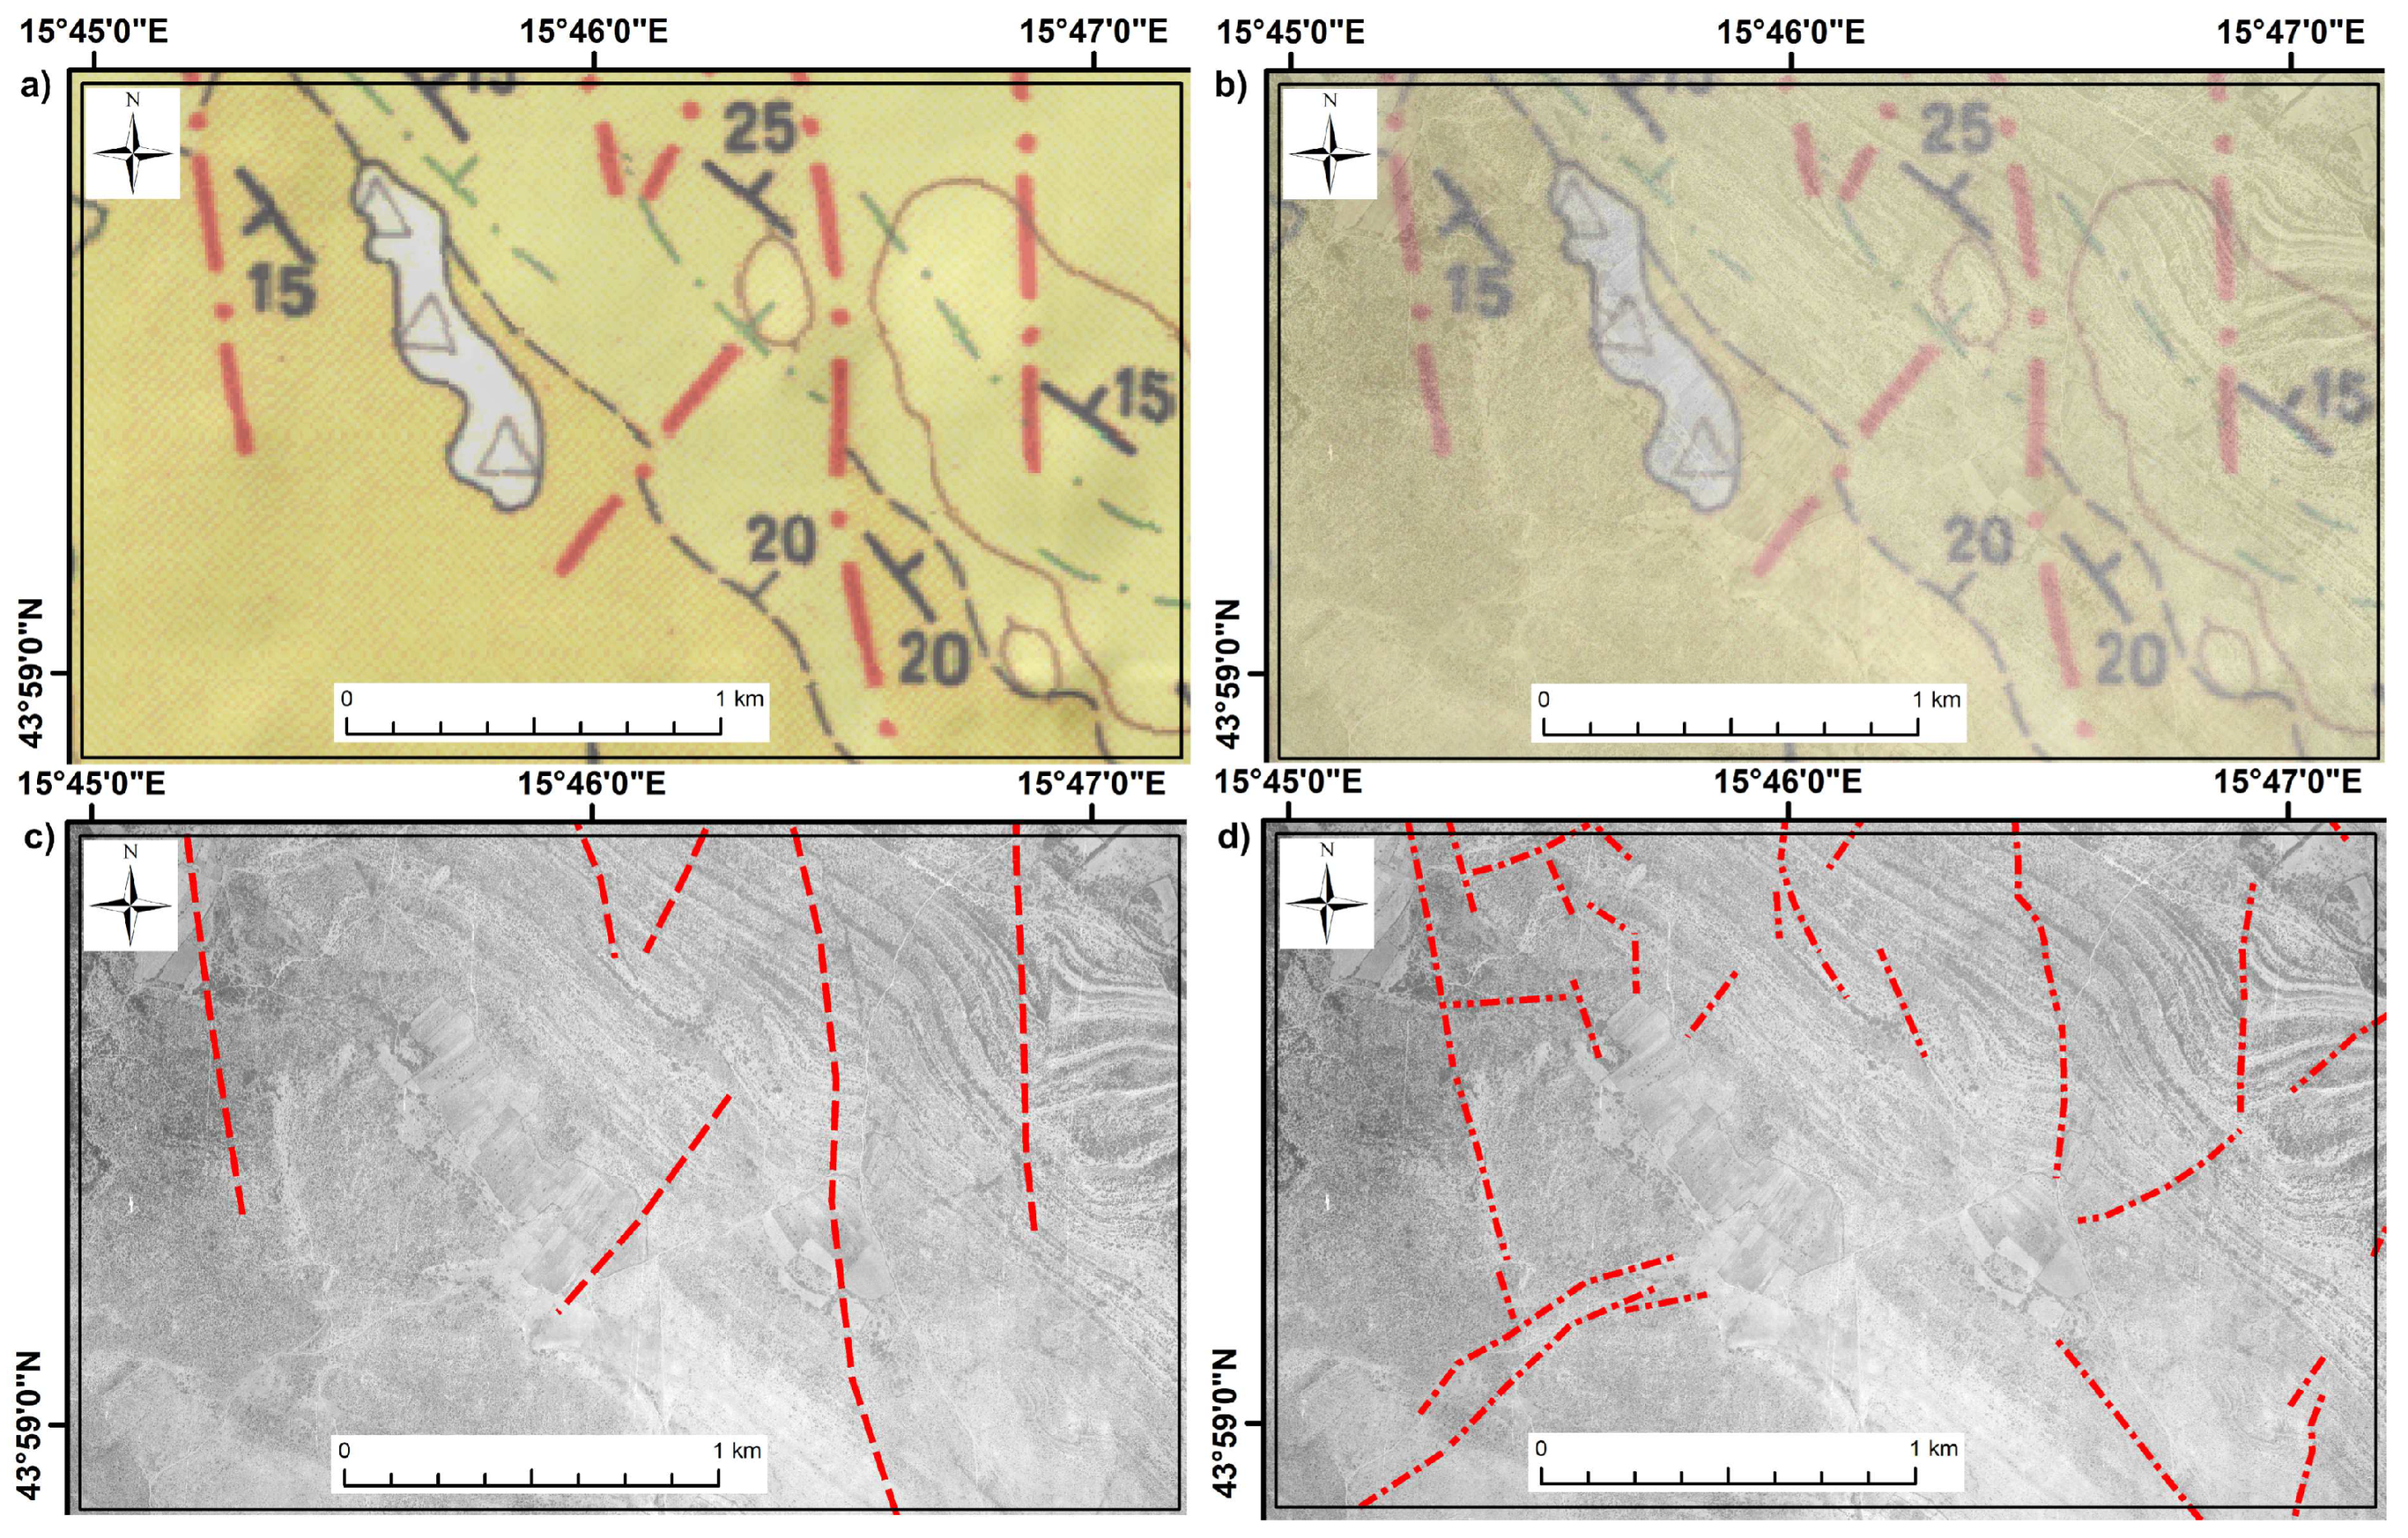
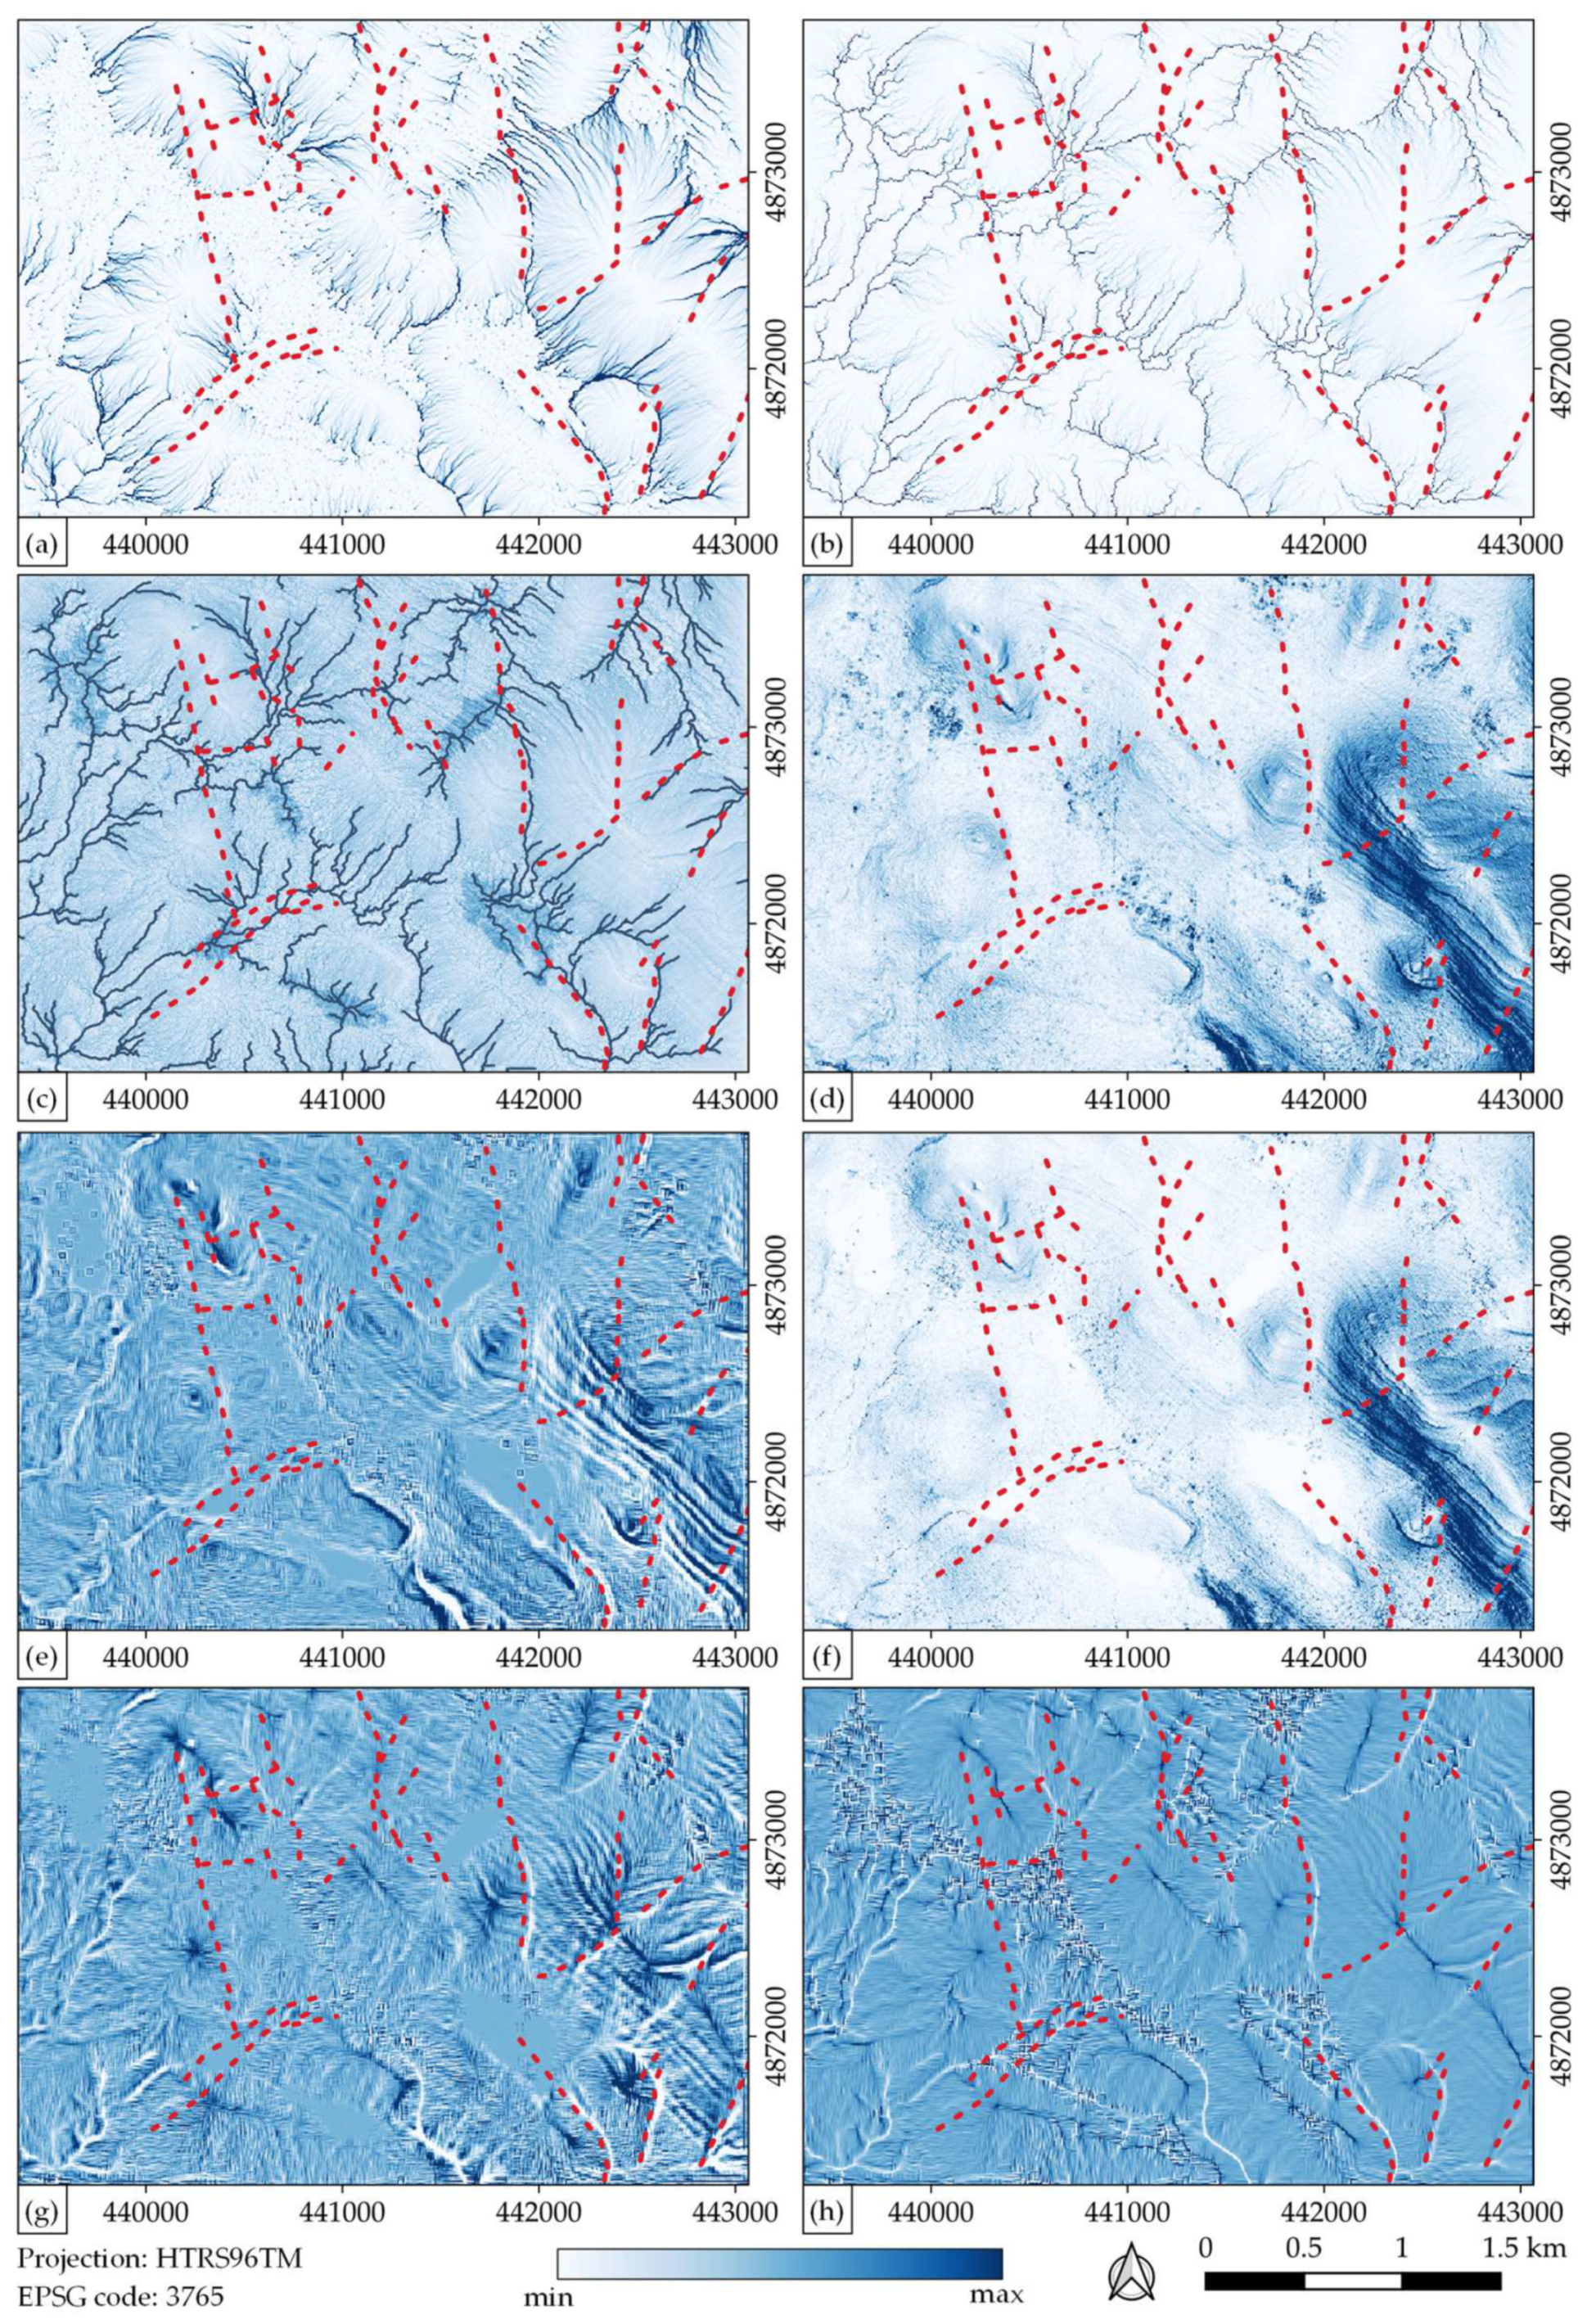
3.2. Semi-Automatic Process for the Development of Digital Data Sets from Historical Aerial Images

According to previous research [48,49], automatic correlation was performed on all the images for the automatic detection of their tie points. After that, aero triangulation with self-calibration was performed based on the input parameters of external orientation. After the phototriangulation process, the parameters of external and internal orientation were calculated for all images, followed by the autocorrelation process for the production of a digital elevation model (DEM, Figure 7) and a high-resolution digital orthophoto (DOP, <1 m spatial resolution, Figure 8).
The semi-automatic process for developing digital data sets continues with the raster analysis developed by DOP and DEM maps. For decision making and improved structural element mapping by a geological expert, it was necessary to provide various geospatial analyses and create different maps, such as maps for: flow accumulation (Figure 9a), total catchment area (Figure 9b), topographic wetness index and channels (Figure 9c), slope inclination (Figure 9d), profile curvature (Figure 9e), LS factor (Figure 9f), plan curvature (Figure 9g), and convergence index (Figure 9h). Using the abovementioned, developed geospatial analyses and created maps, geology experts can make better decisions and more easily and accurately detect and map structural elements on geological maps.
The presented maps and raster analysis can help operators to better understand Earth’s surface [41,43]. All raster data sets were created automatically and represent auxiliary data (Figure 9). The operator manually interprets and maps faults using all the data, analyses, and developed stereo models. The red dashed lines represent manually mapped elements provided by an expert, overlapped with automatically developed raster data sets. Many researchers have suggested the benefits of using expert judgment and GIS analysis for better, more accurate, and faster geological structure mapping [41,44,45].

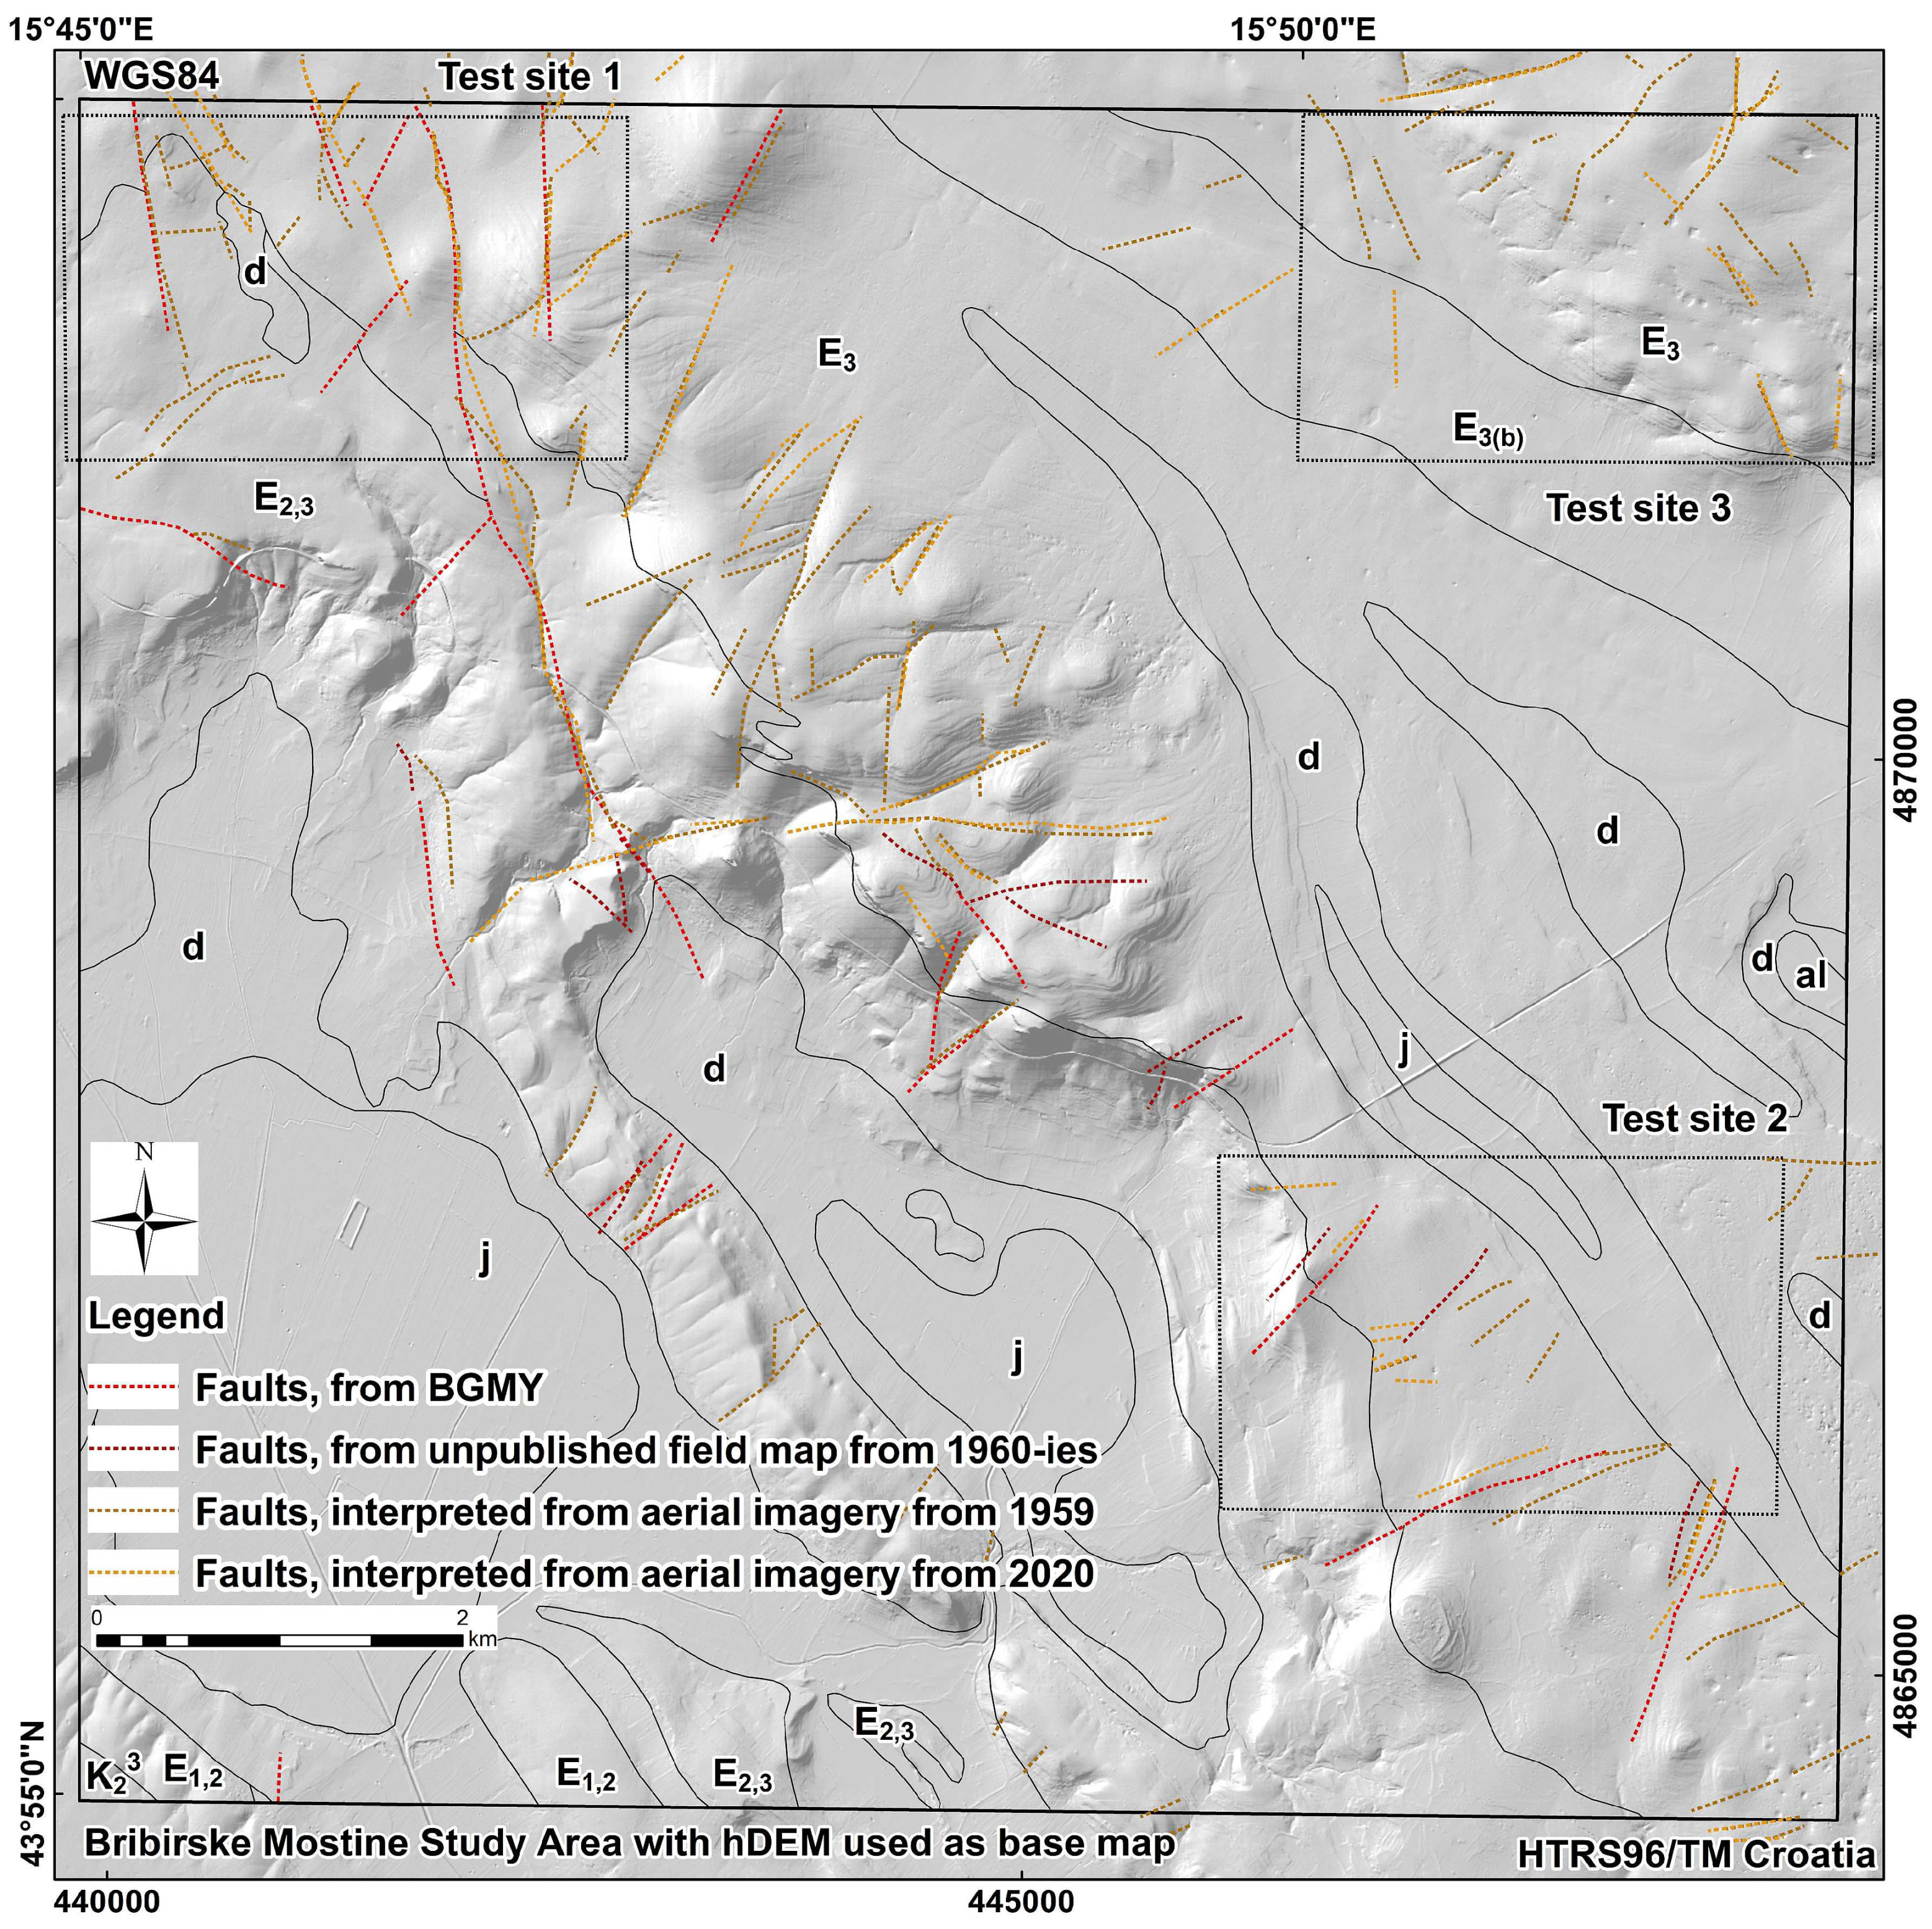
3.3. Final Product—Upgraded Map for Bribirske Mostine Study Area

The development of digital historical and new data and their review using aerial images from 1959 and 2020, along with the re-interpretation and the usage of the semi-automatic digital data sets and produced maps from the historical aerial images from1959, led to the development of an upgraded map of the Bribirske Mostine study area (Figure 10). The developed map is digital, 1:25,000 in scale (original), and improved in terms of its quality (fault data accuracy and spatial positioning) and quantity (fault data abundance). However, the following must be emphasized: the final product is optimized, as not all the (developed) faults are presented, and in choosing the best result display, engineering judgment was used to ensure a clean, simple, and accurate final map. The presented results are a result of performed cabinet research and analysis, and consequently, all of the new faults are described as assumed photo geological interpreted faults and marked with red dashed dot lines (Figure 10). For the original BGMY map, refer to Figure 1b.

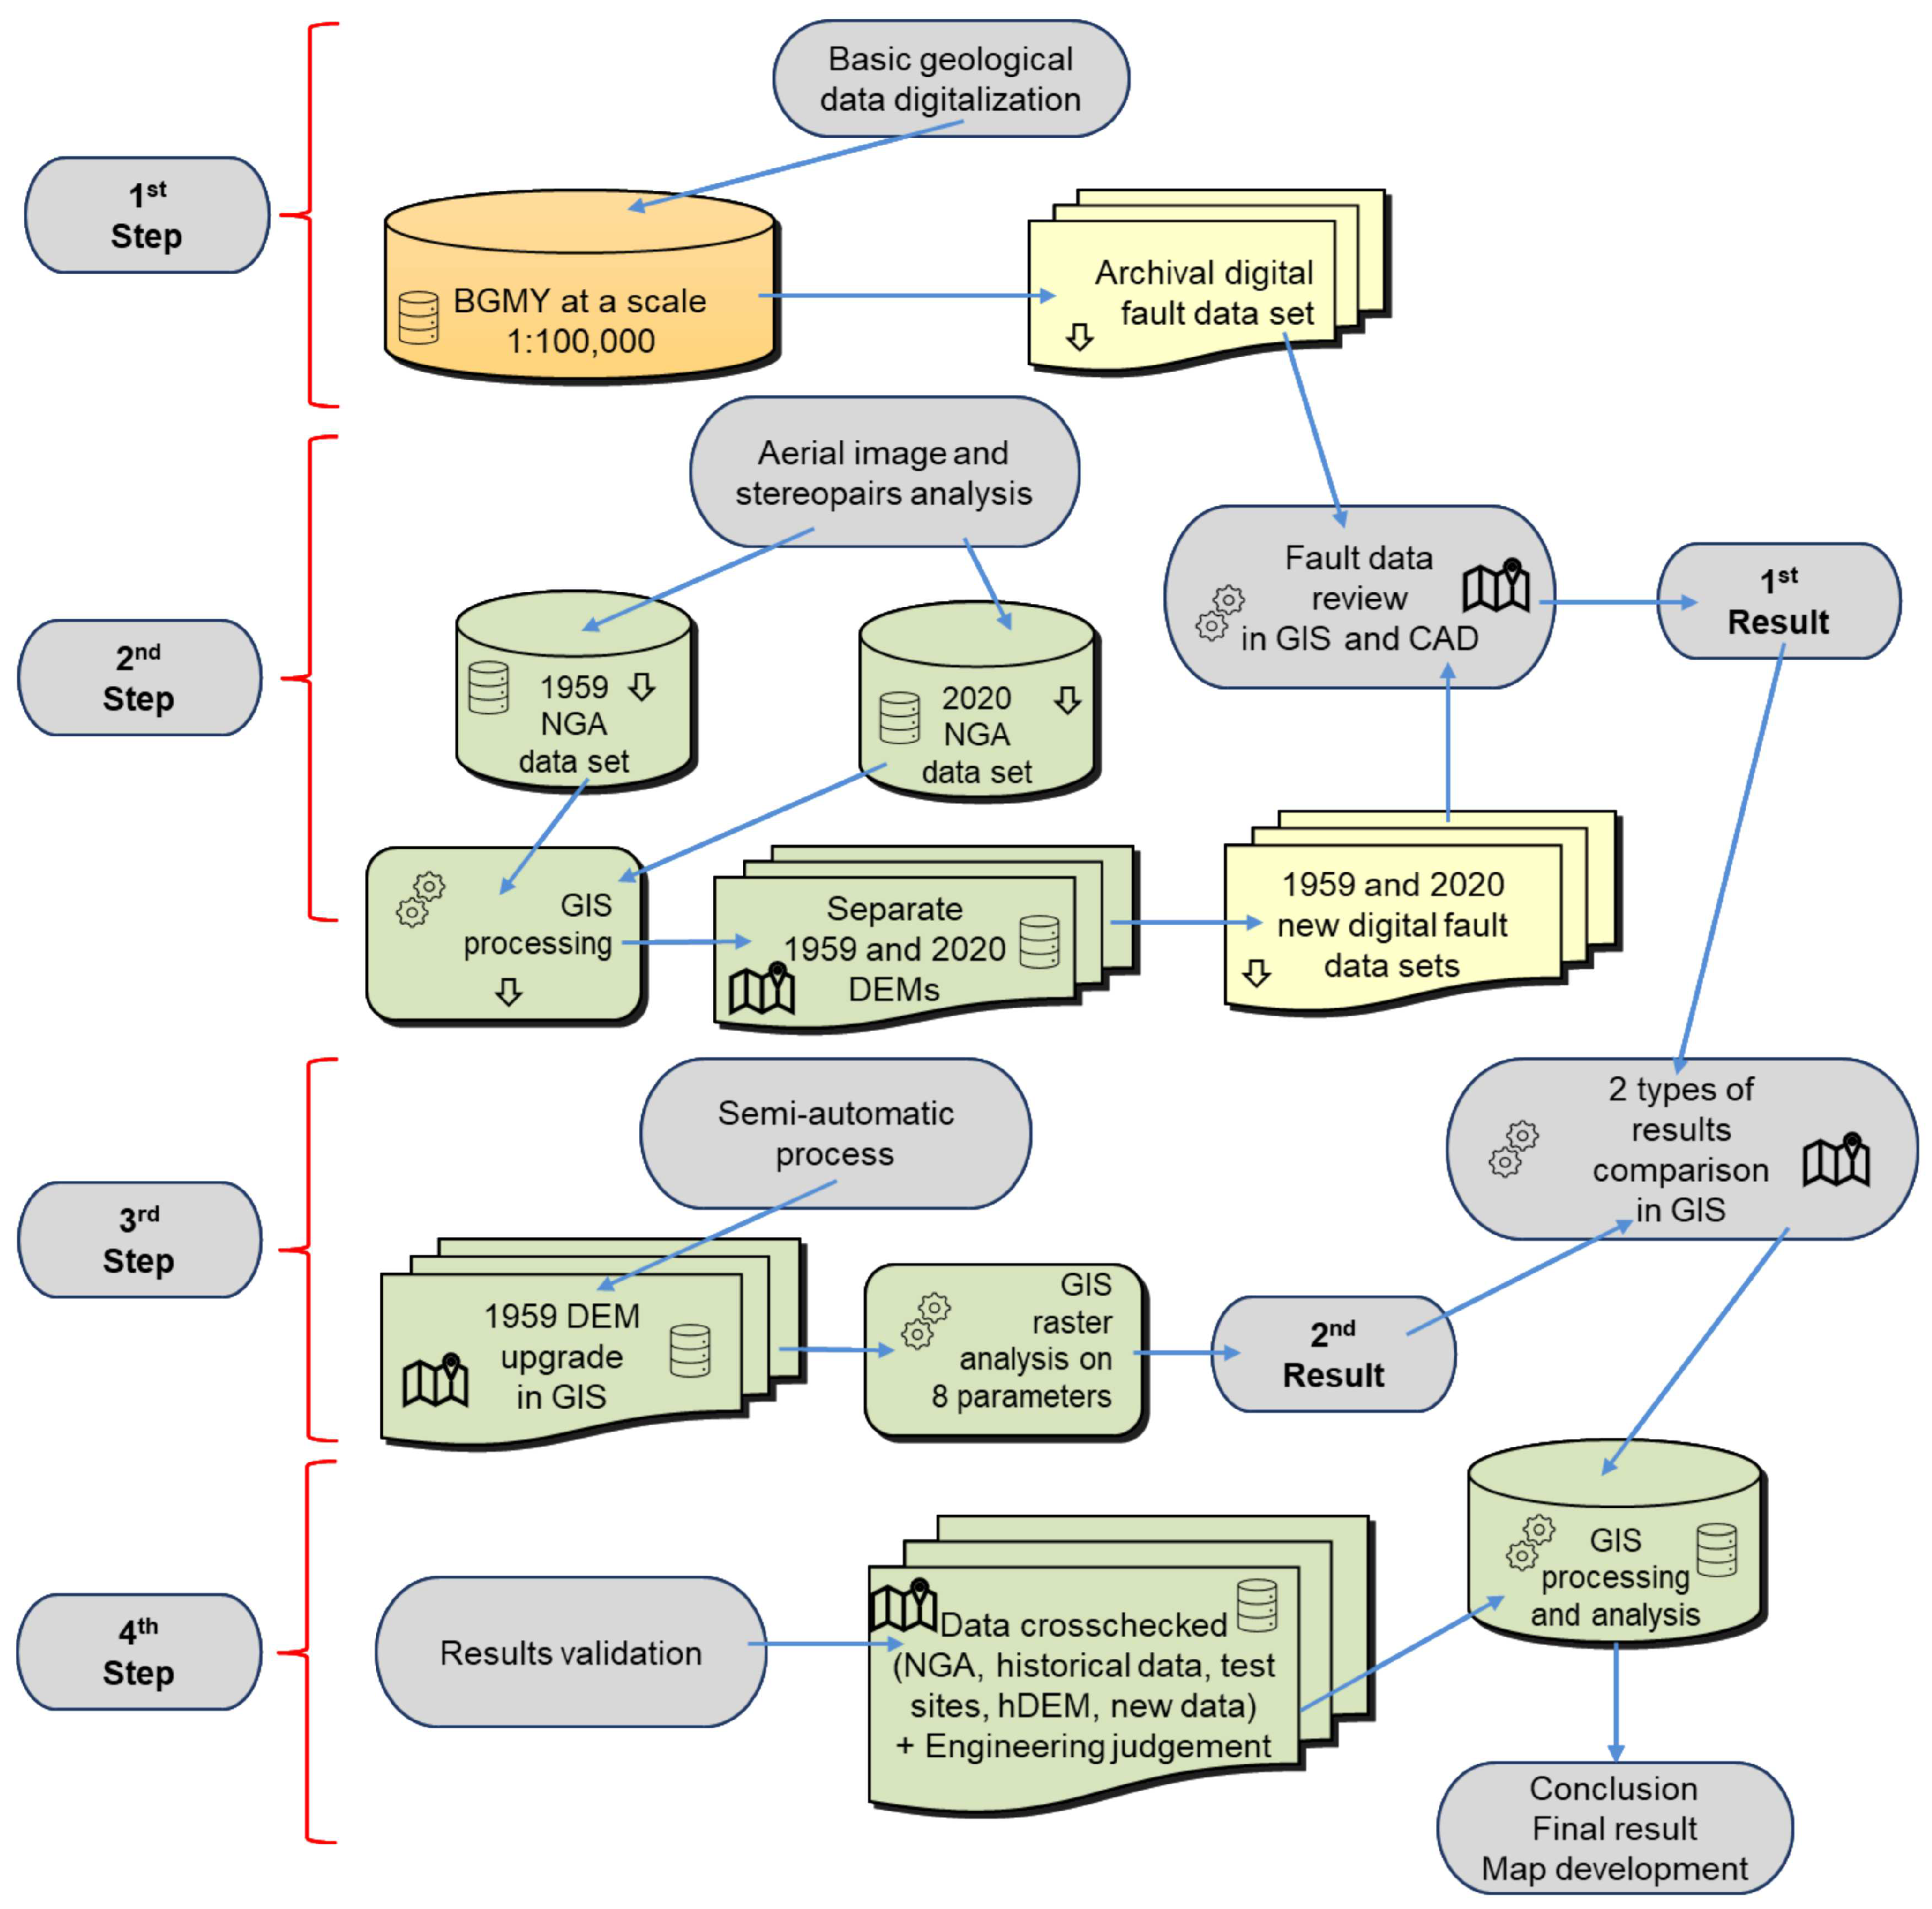
3.4. Flow Chart for Upgraded Map Development

In similar cases (in terms of geological setting and data availability), the herein-presented process can be applied to upgrade the existing historical geological data/maps (Figure 11). For example, ~50% of Croatia is in karst [30,31], and the vegetation cover is relatively scarce, with the most detailed available geological data at a 1:100,000 scale. Also, the presented developed method can be useful in the wider Dinarides karst area for the reinterpretation and improvement of existing geological data sets.

4. Discussion

4.1. Analysis and Interpretation of Aerial Images

Historical aerial images are a valuable asset that is often neglected in modern-day research due to the availability of new, large data sets and the technologically enabled ability to acquire a new raster(s) quickly and in high resolution(s) with relatively low cost(s) [20,23,48]. Still, historical (aerial) images provide a view into the past and may serve as a crucial source of information for decision making (especially in subjective analyses) [19,22,49]. For the Brbirske Mostine area, aerial images from 1959 proved to be a reliable source of information due to the lower vegetation cover present than in the aerial images from 2020. However, optimal results were gained from the usage of both data sets (from 1959 and 2020), as it enabled crosschecking, improvement, and fine tuning of the results (Figure 10).

4.2. Applied Semi-Automatic Process

As aerial image interpretation is subjective [19,22], the semi-automatic process for developing digital data sets from historical aerial images was tested to minimize the subjectivity of the interpreter, i.e., additional data sets and maps were developed to enhance the interpretation results. From the aerial images from 1959 and 2020, two DEMs with a 1 × 1 m grid were developed as auxiliary data, along with raster data sets, described in Section 3.2. Although the additional data sets were developed with a semi-automatic process, which is relatively quick and reliable, it provided limited results. The geoelements presented in Figure 9 are useful for geoexperts seeking to compile evidence of (not so) distinct mapped features. However, the reliance on subjective decision making, regardless of technological advances, remains [49,50].

4.3. Map Development for the Bribirske Mostine Study Area

Regarding the map development process for the study area, the following should be noted: (i) only one segment of the existing map (BGMY, [24,25]) was reviewed—faults; (ii) new digital georeferenced fault data sets were developed with analysis of the aerial images from 1959 and 2020 in the GIS and CAD environments; (iii) aerial image interpretation is subjective, and to limit this subjectivity, mapping criteria were established and raster analysis for a semi-automatic process for developing digital data sets was attempted, but non-conclusive and limited results were obtained; and (iv) a subjective re-check (based on engineering judgement) and the final map’s optimization was performed. In the final map development, subjectivity remained; all of the aforementioned steps have their own limitations, and expert interpretation is necessary [19,22,47]. Also, some of the interpreted (fault) data were discarded due to low interpretation confidence. On the final map, the reviewed and clarified fault data sets are presented as one final layer, regardless of the source (Figure 10) and without overlaps. However, it must be emphasized that (generally) the spatial positioning of the presented faults (or its segments) was improved (in the range of ~1–150 m), and the abundance was increased (from the original 22 fault lines from the BGMY to 125 fault segments on the newly developed map), Figure 10.

4.4. Flow Chart for the Improvement of Existing Geological Data Sets

The benefit of this research (beyond the upgraded geological data and newly developed map) lies in the fact that the presented approach and used methodology (summarized in the flowchart on Figure 11) is relatively simple and applicable to other areas with similar geo-settings. The authors believe that, for the Dinarides karst area in Croatia, or even for the wider Alpine–Dinaric karst area, the results of the re-interpretation of the existing geological data can be significant.

4.5. Result Verification

In this research, valuable information for verification was derived from the comparison of two image data sets from different eras (1959 and 2020) and their comparison with historical data (the BGMY and an unpublished field map from the 1960s). Although this research focused on the reinterpretation of the images from 1959 with modern-day technologies, a new product was also used in the final map verification and development: hDEM with a 1 × 1 m cell size (based on LIDAR data from 2023 and provided by the NGA). The hDEMs developed from the aerial images and the hDEM provided by the NGA and used for verification of the results proved to be useful tools; however, if these are not available and the same approach is used as presented herein, the recommendation is to choose and focus on characteristic test sites and on the methods of field verification. As an auxiliary method, these test sites could also be checked on the field (by mapping) and by using unmanned aerial vehicles (UAVs) to gain precise, relevant, and up-to-date spatial data.

4.6. List of Specific Challenges and Broader Research Context

In the presented research, some specific challenges emerged, and they can be divided into research weak points and research strong points. For the executed research, the following can be considered weak points:
  • The spatial positioning of the historical geological data sets (analog archive field maps and the BGMY).
  • The interpreter(s) subjectivity during the analysis and fault interpretation.
  • The verification of the results was conducted only in cabinet.
On the other hand, for the executed research, the following could be considered strong points:
  • Mapping criteria were established to minimize the interpreter(s) subjectivity.
  • Two generations of aerial images were analyzed, one used during the original research (the development of the BGMY) and one recent, to better understand the characteristic terrain features and the changes in the research area (especially in land cover).
  • Auxiliary raster data sets were created and used with modern day environments (GIS and CAD), to help in the analysis and decision making (fault interpretation).
  • For verification of the results, an hDEM based on spatially precise and recent data was utilized (developed and provided by the NGA).
  • Although, the research provided improvements in the existing fault data quality, quantity, and presentation, future improvements and enhancements are still possible with the application of relatively simple field methods (for example, field mapping in combination with the usage of UAVs for acquiring new, spatially precise, and high-resolution data).
The presented research focus was on the faults; however, in the broader context, there is a relationship with studies regarding recent tectonics [38,40], terrain morphology [41], crustal movements [39], and hDEM analysis [43].

5. Conclusions

For large areas (for example, the Dinarides karst area in Croatia), the available geological data are coarse (100,000 in scale or larger) and old (developed 50+ years ago). Modern-day technologies and products (semi-automatic processes, hDEMs, etc.), and environments (GIS, CAD, etc.) provide a means for reviewing existing (in this case, geological) data, their reinterpretation, and the improvement and development of new, quality data sets. However, the limiting factors must be considered: surface vegetation cover and the remaining subjectivity in decision making. Although, the research and verification of the results were conducted only in cabinet, two sets of aerial images and an hDEM based on spatially precise and recent data were analyzed to minimize this shortcoming. Field verification of the presented results is planned, and further improvements to the existing fault data set are reasonable to expect.
The proposed methodology is also practically applicable in other geological disciplines (not just structural geology with tectonics), including engineering geology, hydrogeology, and mineral resource management. The study area is situated within the Dinarides karst area, contiguous to the eastern Adriatic coast. Given Croatia’s strategic emphasis on tourism and the promotion of new construction(s) and mineral resource acquisitions, the proposed methodology is of significant importance, as it facilitates and improves the early-stage geological research of an area with limited geo-data.
The herein-used methodology can be described as a four-step process (Figure 11): (i) the development of digital data sets from analog historical data (maps, images, etc.); (ii) the re-evaluation of historical data sets and the analysis of relevant data; (iii) the use of auxiliary methods that could improve the results; and (iv) result verification and final product development (new data sets, new map, etc.). By applying this relatively simple (herein-presented) methodology, multiple benefits can be achieved, including: (i) improvements in data quality (spatial positioning); (ii) improvements in data quantity (data abundance); (iii) improvements in data presentation (an upgraded map scale); and (iv) the development of new digital georeferenced data sets that are easily further updated and transferred within multiple platforms for new analysis, research, and usage. An important aspect of the specific contribution of this research is the possibility to apply it to a wider regional area in terms of improving the existing geological data (fault data sets in particular and mapping data), and at the same time, doing it uniformly at the regional level with transcending political borders.

Author Contributions

Conceptualization, L.P. and N.G.; methodology, N.G., L.P. and M.G.; validation, M.G. and T.F.; formal analysis, L.P., N.G. and M.G.; resources, M.G. and T.F.; data curation, M.G. and T.F.; writing—original draft preparation, L.P. and N.G.; writing—review and editing, M.G. and T.F.; visualization, L.P. and N.G.; funding acquisition, L.P. and N.G. All authors have read and agreed to the published version of the manuscript.

Funding

The authors would like to acknowledge (I) the H2020-WIDESPREAD-05-2017-Twinning project (project acronym: GeoTwinn, project ID: 809943) and its members, with a special thanks for their support of open access, and the (II) project supported by the ESA Network of Resources Initiative. Data were provided by the European Space Agency.

Data Availability Statement

In the presented research, third-party data were used (base maps and aerial images from 1959 and 2020 from the National Geodetic Administration of Croatia, NGA, https://dgu.gov.hr/) and restrictions apply to the availability of these data. Although, the data obtained from the NGA are available from the authors with the permission of the NGA. In addition, the raw data supporting the conclusions of this article will be made available by the authors on request (without any conditions). This minimally research data set includes the research area, test sites, and developed faults data set and is available as georeferenced (HTRS96/TM Croatia) shape (shp) files. Also, any further inquiries can be directed to the corresponding author/s and for non-commercial scientific studies, other raw data or working materials can be available, i.e., the authors will provide it upon a reasonable request, even though the data are part of an ongoing study.

Acknowledgments

The authors would like to express their thanks to (I) the National Geodetic Administration of Croatia (NGA), who helped this research by providing images and base maps, (II) and colleagues from the Croatian Geological Survey (HGI-CGS), who helped with all aspects of this research, with special thanks to Nikolina Ilijanić and Slobodan Miko. Finally, the authors thank the HGI-CGS for providing archive data.

Conflicts of Interest

The authors declare no conflicts of interest.

References

  1. Compton, R.R. Geology in the Field; Wiley: Cape Town, South Africa, 2016; pp. 1–398. ISBN 978-0-620-70842-5. [Google Scholar]
  2. Galván Aguilar, E.L.; Chávez, O.E. Geological Mapping. Geol. Community Newsl. 2012, 1, 4–5. Available online: https://www.researchgate.net/publication/262724196_Geological_Mapping (accessed on 19 February 2024).
  3. Lisle, R.J. Geological Structures and Maps: A Practical Guide, 14th ed.; Butterworth-Heinemann: Oxford, UK, 2020; pp. 1–117. [Google Scholar]
  4. Maltman, A. Geological Maps: An Introduction, 2nd ed.; Springer Science & Business Media: Berlin/Heidelberg, Germany, 2012; pp. 1–184. [Google Scholar]
  5. Plummer, C.; Carlson, D.; Hammersley, L. Physical Geology, 14th ed.; McGraw-Hill Education: New York, NY, USA, 2012. [Google Scholar]
  6. Varnes, D.J. The Logic of Geological Maps, with Reference to Their Interpretation and Use for Engineering Purposes; USGS Professional Paper 837; USGS: Alexandria, VA, USA, 1974; pp. 1–48. [Google Scholar]
  7. Bennison, G.M.; Olver, P.A.; Moseley, K.A. An Introduction to Geological Structures and Maps, 8th ed.; Routledge: London, UK, 2011; pp. 1–184. [Google Scholar] [CrossRef]
  8. Fossen, H. Structural Geology, 2nd ed; Cambridge University Press: Cambridge, UK, 2016; pp. 1–503. [Google Scholar]
  9. Allison, R.J. Applied Geomorphology: Theory and Practice; John Wiley & Sons Ltd.: London, UK, 2002; pp. 1–461. [Google Scholar]
  10. Coe, A.L. Geological Field Techniques; John Wiley & Sons: New York, NY, USA, 2010; pp. 1–336. [Google Scholar]
  11. Lisle, R.J.; Brabham, P.; Barnes, J.W. Basic Geological Mapping, 5th ed.; John Wiley & Sons: New York, NY, USA, 2011; pp. 1–209. [Google Scholar]
  12. Dearman, W.R.; Fookes, P.G. Engineering geological mapping for civil engineering practice in the United Kingdom. Qual. J. Eng. Geol. Hydrogeol. 1974, 7, 223–256. [Google Scholar] [CrossRef]
  13. Downs, T.C.; Mackaness, W.A. An Integrated Approach to the Generalization of Geological Maps. Cartogr. J. 2002, 39, 137–152. [Google Scholar] [CrossRef]
  14. Struckmeier, W.F.; Margat, J. Hydrogeological Maps–A Guide and a Standard Legend; Day, J.B.W., Ed.; International Association of Hydrogeologists: Hannover, Germany, 1995; pp. 1–177. ISBN 3-922705-98-7. [Google Scholar]
  15. Chacón, J.; Irigaray, C.; Fernández, T.; El Hamdouni, R. Engineering Geology Maps: Landslides and Geographical Information Systems. Bull. Eng. Geol. Environ. 2006, 65, 341–411. [Google Scholar] [CrossRef]
  16. Kraak, M.J.; Ormeling, F. Cartography: Visualization of Geospatial Data, 4th ed.; CRC Press: Boca Raton, FL, USA; Tayor & Francis Group: Abingdon, UK, 2020; pp. 1–243. [Google Scholar] [CrossRef]
  17. MacEachren, A.M. The evolution of thematic cartography—A research methodology and historical review. Can. Cartogr. 1979, 16, 17–33. [Google Scholar] [CrossRef]
  18. Gupta, R.P. Remote Sensing Geology, 3rd ed.; Springer: Berlin/Heidelberg, Germany, 2018; pp. 1–428. [Google Scholar] [CrossRef]
  19. Paine, D.P.; Kiser, J.D. Aerial Photogrametry and Image Interpretation; John Wiley & Sons, Inc.: Hoboken, NJ, USA, 2012; pp. 1–629. [Google Scholar]
  20. Guzzetti, F.; Mondini, A.C.; Cardinali, M.; Fiorucci, F.; Santangelo, M.; Kang-Tsung, C. Landslide inventory maps: New tools for an old problem. Earth Sci. Rev. 2012, 112, 42–66. [Google Scholar] [CrossRef]
  21. Henderson, F.B., III; Swann, G.A. Geological Remote Sensing from Space; No. TID-27689; California University, Lawrence Berkeley Lab: Berkeley, CA, USA, 1976. [Google Scholar]
  22. Podolszki, L.; Kurečić, T.; Bateson, L.; Svennevig, K. Remote Landslide Mapping, Field Validation and Model Development—An Example from Kravarsko, Croatia. Geol. Croat. 2022, 75, 67–82. [Google Scholar] [CrossRef]
  23. Rajan Girija, R.; Mayappan, S. Mapping of mineral resources and lithological units: A review of remote sensing techniques. Int. J. Image Data Fusion 2019, 10, 79–106. [Google Scholar] [CrossRef]
  24. Mamužić, P.; Korolija, B.; Majcen, Ž.; Borović, I.; Magaš, N.; Bojanić, L.; Božićević, S.; Babić, L.; Šimunić, A. Osnovna Geološka Karta SFRJ 1:100.000, List Šibenik K33-8 [Basic Geological Map SFRY in Scale of 1:100,000—Sheet Šibenik K33-8]; Geological Survey: Belgrade, Serbia, 1971. (In Croatian) [Google Scholar]
  25. Mamužić, P.; Vrsalović, I.; Muldini-Mamužić, S.; Korolija, B.; Majcen, Ž.; Borović, I. Osnovna Geološka Karta SFRJ 1:100000: Tumač za List Šibenik K33-8 [Explanatory Notes for Basic Geological Map SFRY in Scale of 1:100,000—Sheet Šibenik K33-8]; Geological Survey: Belgrade, Serbia, 1975. (In Croatian) [Google Scholar]
  26. Gizdavec, N.; Gašparović, M.; Miko, S.; Lužar-Oberiter, B.; Ilijanić, N.; Peh, Z. Discrimination of Rock Units in Karst Terrains Using Sentinel-2A Imagery. Remote Sens. 2022, 14, 5169. [Google Scholar] [CrossRef]
  27. Huang, S.; Tang, L.; Hupy, J.P.; Wang, Y.; Shao, G. A Commentary Review on the Use of Normalized Difference Vegetation Indeks (NDVI) in the Era of Popular Remote Sensing. J. For. Res. 2021, 32, 1–6. [Google Scholar] [CrossRef]
  28. Gascon, F.; Bouzinac, C.; Thépaut, O.; Jung, M.; Francesconi, B.; Louis, J.; Lonjou, V.; Lafrance, B.; Massera, S.; Gaudel-Vacaresse, A.; et al. Copernicus Sentinel-2A Calibration and Products Validation Status. Remote Sens. 2017, 9, 584. [Google Scholar] [CrossRef]
  29. Van der Meer, F.D.; van der Werff, H.M.A.; van Ruitenbeek, F.J.A. Potential of ESA’s Sentinel-2 for Geological Applications. Remote Sens. Environ. 2014, 148, 124–133. [Google Scholar] [CrossRef]
  30. Vlahović, I.; Tišljar, J.; Velić, I.; Matičec, D. Evolution of the Adriatic Carbonate Platform. Palaeogeography, Main Events and Depositional Dynamics. Palaeogeogr. Palaeoclimatol. Palaeoecol. 2005, 220, 333–360. [Google Scholar] [CrossRef]
  31. Korbar, T. Orogenic Evolution of the External Dinarides in the NE Adriatic Region: A Model Constrained by Tectonostratigraphyof Upper Cretaceous to Paleogene Carbonates. Earth-Sci. Rev. 2009, 96, 296–312. [Google Scholar] [CrossRef]
  32. Schmid, S.M.; Fügenschuh, B.; Kounov, A.; Maţenco, L.; Nievergelt, P.; Oberhänsli, R.; Pleuger, J.; Schefer, S.; Schuster, R.; Tomljenović, B.; et al. Tectonic units of the Alpine collision zone between Eastern Alps and western Turkey. Gondwana Res. 2020, 78, 308–374. [Google Scholar] [CrossRef]
  33. Alpaydin, E. Introduction to Machine Learning, 4th ed.; The MIT Press: Cambridge, MA, USA; London, UK, 2020; pp. 1–712. [Google Scholar]
  34. Bishop, C.; Rivard, B.; de Souza Filho, C.; van der Meer, F. Geological Remote Sensing. Int. J. Appl. Earth Obs. Geoinf. 2018, 64, 267–274. [Google Scholar] [CrossRef]
  35. Cracknell, M.J. Machine Learning for Geological Mapping: Algorithms and Applications. Ph.D. Thesis, University of Tasmania, Hobart, Australia, 2014; pp. 1–275. [Google Scholar]
  36. Cracknell, M.J.; Reading, A.M. Geological Mapping Using Remote Sensing Data: A Comparison of Five Machine Learning Algorithms, Their Response to Variations in the Spatial Distribution of Training Data and the Use of Explicit Spatial Information. Comput. Geosci. 2014, 63, 22–33. [Google Scholar] [CrossRef]
  37. Sikakwe, G.U. Mineral exploration employing drones, contemporary geological satellite remote sensing and geographical information system (GIS) procedures: A review. Remote Sens. Appl.-Soc. Environ. 2023, 31, 100988. [Google Scholar] [CrossRef]
  38. Demoulin, A. Quaternary tectonics in the northern Ardennes, Belgium. Tectonophysics 1989, 163, 315–321. [Google Scholar] [CrossRef]
  39. Demoulin, A.; Launoy, T.; Zippelt, K. Recent crustal movements in the southern Black Forest (western Germany). Geol. Rundsch. 1998, 87, 43–52. [Google Scholar] [CrossRef]
  40. Cornet, Y.; Demoulin, A. Neotectonic implications of a lineament-coplanarity analysis in southern Calabria, Italy. Geol. Soc. Lond. Spec. Publ. 1999, 146, 111–127. [Google Scholar] [CrossRef]
  41. Demoulin, A.; Bovy, B.; Rixhon, G.; Cornet, Y. An automated method to extract fluvial terraces from digital elevation models: The Vesdre valley, a case study in eastern Belgium. Geomorphology 2007, 91, 51–64. [Google Scholar] [CrossRef]
  42. Cramer, M. Digital Airborne Cameras-Status and Future. In Proceedings of the ISPRS Hannover Workshop, Hannover, Germany, 17–20 May 2005; Available online: https://www.isprs.org/proceedings/XXXVI/1-W3/PDF/139-cramer.pdf (accessed on 14 March 2024).
  43. Dewitte, O.; Jasselette, J.-C.; Cornet, Y.; Collignon, A.; Demoulin, A. Tracking landslide evolution over decades: Application of aerial digital photogrammetry to the Oudenaarde area (W Belgium). In Proceedings of the 12th International Congress of Society for Mathematical Geology, Liège, Belgium, 3–8 September 2006; S08-04. Available online: https://hdl.handle.net/2268/5991 (accessed on 9 July 2024).
  44. Kociánová, L.; Melichar, R. OATools: An ArcMap add-in for the orientation analysis of geological structures. Comput. Geosci. 2016, 87, 67–75. [Google Scholar] [CrossRef]
  45. Jenson, S.K.; Domingue, J.O. Extracting topographic structure from digital elevation data for geographic information system analysis. Photogramm. Eng. Remote Sens. 1988, 54, 1593–1600. Available online: https://www.asprs.org/wp-content/uploads/pers/1988journal/nov/1988_nov_1593-1600.pdf (accessed on 9 July 2024).
  46. Muchoney, D.; Borak, J.; Chi, H.; Friedl, M.; Gopal, S.; Hodges, J.; Morrow, N.; Strahler, A. Application of the MODIS global supervised classification model to vegetation and land cover mapping of Central America. Int. J. Remote Sens. 2000, 21, 1115–1138. [Google Scholar] [CrossRef]
  47. Podolszki, L.; Karlović, I. Remote Sensing and GIS in Landslide Management: An Example from the Kravarsko Area, Croatia. Remote Sens. 2023, 15, 5519. [Google Scholar] [CrossRef]
  48. Gašparović, M.; Seletković, A.; Berta, A.; Balenović, I. The evaluation of photogrammetry-based DSM from low-cost UAV by LiDAR-based DSM. South-east European forestry: SEEFOR. Int. Sci. J. Field For. 2017, 8, 117–125. [Google Scholar] [CrossRef]
  49. Jurjević, L.; Gašparović, M.; Liang, X.; Balenović, I. Assessment of close-range remote sensing methods for DTM estimation in a lowland deciduous Forest. Remote Sens. 2021, 13, 2063. [Google Scholar] [CrossRef]
  50. Honkavaara, E.; Arbiol, R.; Markelin, L.; Martinez, L.; Cramer, M.; Bovet, S.; Chandelier, L.; Ilves, R.; Klonus, S.; Marshal, P.; et al. Digital Airborne Photogrammetry—A New Tool for Quantitative Remote Sensing?—A State-of-the-Art Review On Radiometric Aspects of Digital Photogrammetric Images. Remote Sens. 2009, 1, 577–605. [Google Scholar] [CrossRef]
Figure 1. Study area: (a) in Croatia’s coastal area, near the city of Šibenik. Bribirske Mostine is located within the wider Dinarides bare karst area with sparse vegetation cover; therefore, it is suitable for remote and field fault mapping; (b) segment of the BGMY for the study area, with assumed photo-geological interpreted faults (red dash dot lines). Different types of Eocene limestone are marked yellow on the map, while Quaternary sediments are marked white (alluvial, deluvial, and lake and swamp sediments, which consist mostly of gravels, sands, silts, and clays) [24].
Geosciences 14 00195 g001
Figure 2. Aerial image interpretation examples with marked bedding offset (red arrow): (a) segment from image from 1959 with marked offset of series of beddings on larger area, indicating a significant fault for the area; (b) segment of an image from 2020 with marked series of offsets of bedding segments in a smaller area, indicating a zone with multiple faults.
Geosciences 14 00195 g002
Figure 3. Developed digital fault data sets for the Bribirske Mostine study area with marked areas of test sites. Photo-geological interpreted assumed fault data sets are presented on the map. Different types of Eocene limestone geological borders are marked (E), the same applies to the Quaternary sediment geological borders (alluvial—al; deluvial—d; lake and swamp sediments—j). As a base map, hDEM with a 1 × 1 m cell size was used (developed and provided by the NGA).
Geosciences 14 00195 g003
Figure 4. Study area segment (Test Site 1; for test site locations, also refer to Figure 2): (a) details from the historical geological map (BGMY [24]); (b) same details overlapped with aerial image from 1959 used in BGMY development; (c) dashed lines indicate digitalized original faults; (d) dash-dot-dash lines indicate developed fault data set.
Geosciences 14 00195 g004
Figure 5. Study area segment (Test Site 2; for test site locations, also refer to Figure 2): (a) details from the historical geological map (BGMY, [24]); (b) same details overlapped with aerial images from 2020; (c) dashed lines indicate digitalized original faults; (d) dash-dot-dash lines indicate developed fault data set.
Geosciences 14 00195 g005
Figure 6. Study area segment (Test Site 3; for test site locations, also refer to Figure 2): (a) details without interpreted faults from the historical geological map (BGMY, [24]); (b) same details on aerial images from 1959 with developed fault data set, indicated by dash-dot-dash lines; (c) same details on aerial images from 2020 with developed fault data set, indicated by dash-dot-dash lines; (d) reinterpreted BGMY [24] with developed fault data sets from 1959 and 2020, indicated by dash-dot-dash lines.
Geosciences 14 00195 g006
Figure 7. High-resolution digital elevation model (DEM) developed using aerial images from 1959 and developed fault data set for the study area. The topographical base map at the original 1:25,000 scale was provided by the NGA.
Geosciences 14 00195 g007
Figure 8. A detail of a high-resolution digital orthophoto (DOP) developed using aerial images from 1959 and the developed fault data set.
Geosciences 14 00195 g008
Figure 9. Raster analysis for semi-automatic process of developing digital data sets (detail): (a) flow accumulation; (b) total catchment area; (c) topographic wetness index and channels (dark blue solid line); (d) slope inclination; (e) profile curvature; (f) LS factor; (g) plan curvature; and (h) convergence index. The red dashed line represents developed fault data set.
Geosciences 14 00195 g009
Figure 10. Developed upgraded map for Bribirske Mostine study area at the original 1:25,000 scale with the revised (final) digital fault data set: assumed photo-geological interpreted faults (red dash-dot lines) and geological borders according to the BGMY [24]. Different types of Eocene limestone are marked yellow (E), while Quaternary sediments are marked white (alluvial—al; deluvial—d; lake and swamp sediments—j, which consist mostly of gravels, sands, silts, and clays). As base maps, a topographical map at the original 1:25,000 scale (provided by the NGA) and hDEM (1 × 1 m cell size, developed and provided by the NGA) were used. For the presented layers, a transparency setting of 50% was used, with hDEM as the base, topographical data as the intermediate, and geological data on the top.
Geosciences 14 00195 g010
Figure 11. Flow chart for upgraded map development: applied four-step methodology.
Geosciences 14 00195 g011
Table 1. Overview of developed digital fault data sets.
Digital Fault Data SetsFrom BGMYFrom Field GeoMapFrom 1959 ImagesFrom 2020 Images
Number of faults/segments in data set221314555
Disclaimer/Publisher’s Note: The statements, opinions and data contained in all publications are solely those of the individual author(s) and contributor(s) and not of MDPI and/or the editor(s). MDPI and/or the editor(s) disclaim responsibility for any injury to people or property resulting from any ideas, methods, instructions or products referred to in the content.

