Article

Mineralogical and Engineering Properties of Soils Derived from In Situ Weathering of Tuff in Central Java, Indonesia

Department of Geological Engineering, Faculty of Engineering, Universitas Gadjah Mada, Yogyakarta 55281, Indonesia
*
Author to whom correspondence should be addressed.
Geosciences 2024, 14(8), 213; https://doi.org/10.3390/geosciences14080213
Submission received: 26 June 2024 / Revised: 8 August 2024 / Accepted: 8 August 2024 / Published: 10 August 2024
(This article belongs to the Special Issue Soil-Structure Interactions in Underground Construction)

Abstract

:
This paper presents the results of borehole investigations and laboratory tests carried out to characterize the soils derived from in situ weathering of tuff in Central Java, Indonesia. The 70 m thick weathering profile of the Quaternary tuff consisted of residual soil and completely to highly decomposed rocks. The relatively low dry unit weight and cohesion but high water content, porosity, plastic and liquid limits, and angle of internal friction of the soils in the present study were related to the dominance of halloysite clay minerals. The established relationships to predict soil shear strength parameters from the soil plasticity index and standard penetration test (SPT) N-values were examined, and linear and non-linear relationships for soils derived from in situ weathering of tuff were proposed.

1. Introduction

In situ rock weathering produces weathering profiles and soil properties that vary across geographic areas depending on the range and inter-relationship of various factors, such as parent material, climate, drainage, hydrology, geomorphology, geological setting, and vegetation [1,2,3,4]. The distinct engineering properties and behavior of soils derived from rock weathering, as compared to soils derived from weathering of sedimentary rocks or sedimentary (transported) soils, have been receiving increasing attention. The soils derived from in situ rock weathering generally have engineering properties closely related to those of their parent rocks. Brenner et al. [5] describe how density, void ratio, and shear strength of sedimentary soils are influenced by the stress history, while those of the soils derived from in situ weathering depend on the weathering degree of the parent rock.
Of particular interest in the present study are the soils derived from in situ weathering of tuff, a pyroclastic rock consisting of > 75% volcanic ash, which are widespread in volcanic regions. The relatively high porosity and permeability may cause the pyroclastic rock to weather rapidly into clay minerals (e.g., [6,7,8]). Soils derived from in situ weathering of tuff have been considered to have high shear strength. Sandeep et al. [9,10] found that the friction angle of completely decomposed tuff taken from a landslide in Hong Kong was relatively high. In particular, the engineering properties and behavior of halloysite-rich soils derived from in situ weathering of tuff have been receiving increasing attention. The halloysite-rich soils are also commonly considered to have relatively high angles of internal friction and, consequently, the natural steep slopes comprising such soils are commonly stable [11]. The halloysite-rich soils may, however, lose shear strength significantly once the structure breaks down, triggered by external factors such as rainfall or earthquake [12]. The high sensitivity of the halloysite-rich soils has been related to a number of slope failure cases in volcanic areas (e.g., [13,14,15]). Detailed investigations of soil mineralogy and the relationship with the engineering properties are, therefore, essential to better understand the ground behavior in the planning of construction projects.
The use of standard penetration tests (SPTs) for determination of in situ shear strength of soils derived from rock weathering have been criticized, mainly due to their inconsistency and high variability. Despite its limitations, however, the considerably low-cost and simple in situ test is routinely carried out as part of ground investigation. Correlations of SPT N-values with soil shear strength parameters are mostly made for granular and cohesive sedimentary (or transported) soils (e.g., [16,17,18]). In practice, the empirical correlations of SPT N-values with the soil shear strength parameters of sedimentary soils are often applied to designs of construction projects in soils derived from in situ rock weathering. As highlighted by several authors (e.g., [19,20]), the estimation of shear strength parameters of soils derived from in situ rock weathering from SPT N-values should be based on correlations established from local geological conditions rather than those using general relationships of sedimentary soils in the literature. An attempt has been made by Priddle et al. [21] to correlate SPT N-values with undrained shear strength (Su) of residual soil derived from weathering of tuff in South East Queensland, but a relatively poor SPT N-value–Su relationship was observed, probably due to the limited data used in the analysis. To date, the relationship between SPT N-values and shear strength parameters of soils from in situ weathering of tuff is still poorly understood and, therefore, requires further studies.
In relation to construction planning of a road tunnel in Central Java, Indonesia, this paper presents the results of borehole investigations and laboratory tests conducted to characterize the materials along the tunnel route (Figure 1). Emphasis is given to the characteristics of materials comprising the 70 m thick weathering profile of tuff, variations in the soil properties with depth and rock weathering degree, and relationships between the index properties, penetration resistance, and shear strength parameters of the soils. The empirical correlations between the plasticity index and SPT N-values and soil shear strength parameters developed in the present study is expected to provide insight into the estimation of shear strength of soils derived from in situ weathering of tuff.

2. Materials and Methods

Borehole investigations, including core sampling, in situ permeability test, and SPT, were carried out by PT JJB [22] for designs of the road tunnel construction method and support system. The core sampling was carried out using thin-walled tubes in conjunction with rotary drilling. The in situ permeability test was conducted using the constant head injection method, while the SPT was conducted by driving a split-barrel sampler at two-meter intervals. The ground investigations were carried out following the procedures described in ASTM International [24]. The core samples were carefully handled and transported to minimize sample disturbance. The extruded core samples were encased in plastic wrap, aluminum foil, and paraffin to preserve the moisture. Visual observation of the core samples from the ground surface down to the depth of 70 m from 10 boreholes were carried out in the present study to estimate the rock weathering profile along the tunnel route (Figure 2). The rock composition and fabric were confirmed by conducting petrographic analyses of thin sections. Abrar [25] and Tamado [2] conducted laboratory tests of core samples to investigate the soil index properties and shear strength parameters mainly for stability analyses of the tunnel portal zone. Their laboratory testing programs were extended in the present study to account for the spatial variability of the rock weathering degree. The index properties of core samples were determined following the procedures described in ASTM International [24], while the shear strength parameters of the core samples were determined by direct shear tests, as specified in ASTM International [26]. The present study was initially intended to assess the tunnel stability during or immediately after excavation, and, therefore, the soil’s undrained shear strength parameters were investigated. As previous authors (e.g., [11,12]) indicated that the internal friction angle (ϕ) values of soils derived from in situ weathering of pyroclastic rocks were relatively high and, therefore, could not be neglected, both the undrained cohesion (cu) and internal friction angle (ϕ) values were measured. The borehole investigations indicated that the soil permeability values were in the range of 1.1 × 10⁻⁷ to 6.6 × 10⁻⁷ m/s. A shearing rate of 0.5 mm/min was applied during the direct shear tests to simulate the undrained conditions during the in situ penetration resistance tests. Although the true undrained conditions during the direct shear tests might not be attained, as the drainage could not be controlled, the cohesion and internal friction angle values reported in the present study are considered to be the undrained shear strength parameters (i.e., cu and ϕ). The SPT N-values presented in this paper are essentially the field SPT N-values that have been corrected for the 60% energy and are denoted as SPT N60-values. Although several boreholes were drilled down deeper, only the SPT N-values down to the maximum depth of 70 m were analyzed in the present study, as the penetration tests were generally terminated once the N-values exceeded 60, which were considered as a refusal. The index properties and N60-values were correlated with the respective shear strength parameters for the development of empirical correlations, allowing the estimation of shear strength parameters of the soils derived from in situ weathering of tuff.

3. Results and Discussion

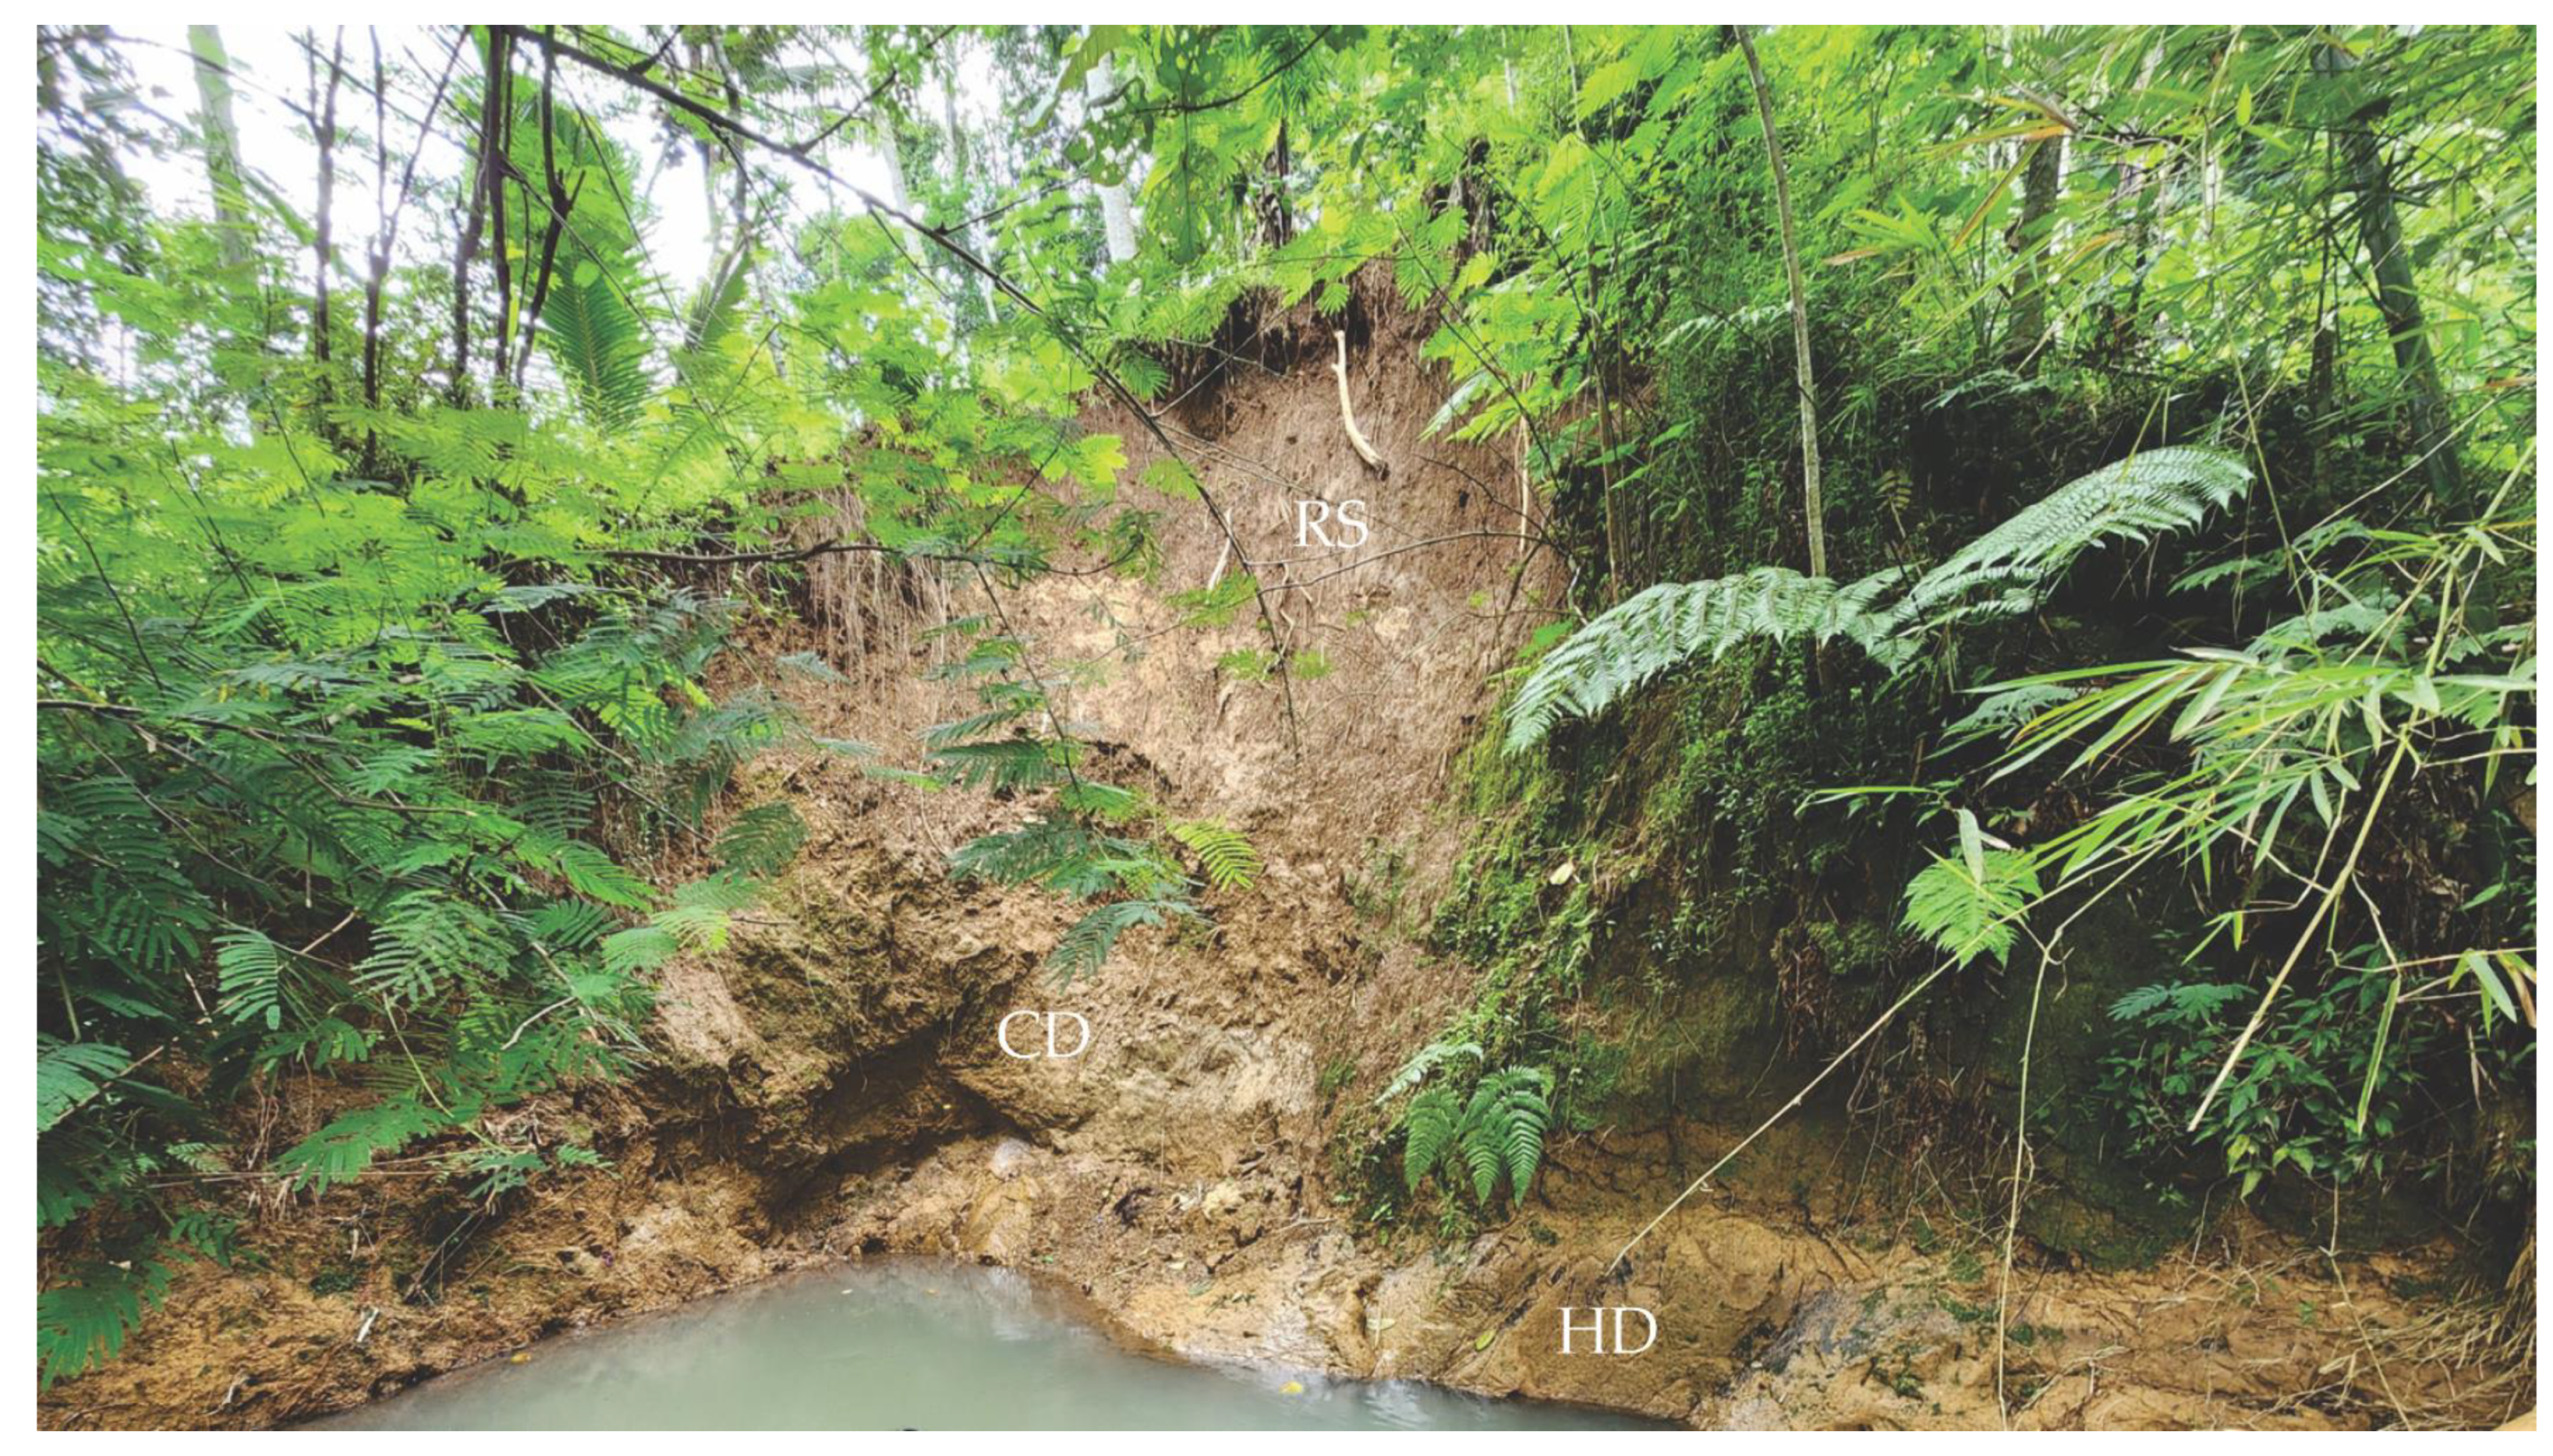
3.1. Weathering Profile

The road tunnel was planned to pass through Quaternary volcanic rocks, which Thanden et al. [27] defined as the Kaligetas Formation (Qpkg) and Gilipetung Volcanic Rocks (Qg). Thanden et al. [27] also reported that the Kaligetas Formation (Qpkg) might have a thickness ranging from 50 to 200 m and consisted of volcanic breccia, lava flows, tuff, tuffaceous sandstone, and claystone. The geological map and profile in Figure 2 show that the tunnel route is dominated by the tuff of this rock formation. Tuff breccia exists in the northeast side of the tunnel route. Abrar [25] indicated that vesicular lava of the younger Gilipetung Volcanic Rocks (Qg) could also be observed locally along the riverbeds.
The upper 8 to 10 m of the tuff weathering profile is typically the residual soil (grade VI). The thickness of the residual soil, as well as the underlying completely decomposed tuff (grade V), varies with topography and typically becomes thinner toward the slopes. Less than 2 m thick residual soil layers may be observed along the river slopes (Figure 3). The core samples of the residual soil at the 0–10 m depth interval were brown to reddish brown in color, but the upper 0.5 to 1 m layers were typically dark brown to yellowish gray due to humus content (Figure 4a,b). The parent rock-forming minerals were mostly altered to clay minerals, and the parent rock texture was completely destroyed. They were typically easily crumbled by hand and finger pressure into constituent grains.
The residual soil layer is underlain by the completely decomposed tuff (grade V) and, subsequently, the highly decomposed tuff (grade IV). Dearman [28] used the term of extremely decomposed rock for the rock material weathering grade V. The core samples of the completely decomposed tuff were typically brown to yellowish brown in color, but they could be mottled (Figure 4c,d). Although the minerals comprising the completely decomposed tuff (grade V) were mostly decomposed, the rock texture was still recognizable, particularly using hand lenses and in thin sections. The core samples often contained weathered coarse lithic fragments and less weathered specimens of yellowish white, highly decomposed tuff (grade IV) and light gray, moderately decomposed tuff (grade III). Plagioclase minerals are hardly recognizable by the naked eye but could still be identified in a few thin sections (Figure 5). The visible relict joints in the completely decomposed tuff (grade V), as well as in the highly decomposed tuff (grade IV), were often filled with quartz or marked with iron staining. The core samples of the completely decomposed tuff were increasingly denser with depth, but they were also typically easily crumbled by hand and finger pressure and were classified as soft soils to extremely weak rocks with the estimated uniaxial compressive strength (UCS) values less than 0.5 MPa. The core samples were mostly slake in water. The slake durability index values of the core samples from 7 to 40 m depth reported in the previous study by PT JJB [22] were relatively low, ranging from 0.75 to 26%. Based on the strength and penetration resistance, the core samples from 10 to 20 m depth were marked as the more intensely weathered rock of the completely decomposed tuff, while the soils from 20 to 30 m depth were considered the least weathered rock of the completely decomposed tuff. The interface between the completely and highly decomposed tuff (grades V and IV) was estimated to be located at about the depth of 30 m. The scatter data of the soil mineralogy, index properties, and penetration resistance from 20 to 30 m depth might suggest the spatial inhomogeneity of rock weathering in the zone of transition from highly decomposed tuff (grade IV) to completely decomposed tuff (grade V).
The core samples of the highly decomposed tuff (grade IV) from 30 to 70 m depth were mostly brown to brownish gray in color and mottled and often contained a significant proportion of lithic fragments and less weathered corestones of white to yellowish white, moderately decomposed (grade III), and light gray, slightly decomposed tuff (grade II) (Figure 4e,f). The core samples were increasingly coarser and denser with depth. The core samples could, however, still be crumbled by hand and finger pressure and were classified as very weak to weak rocks with the estimated UCS values to be less than 2 MPa. The relatively low UCS values were confirmed by the relatively low penetration resistance and shear strength values described in the following section. Hencer and Martin [29] and GEO [30] defined the highly decomposed volcanic rocks in Hong Kong as having UCS values from 0.5 to 5 MPa. As the UCS values of the tuff from the depth range of 30 to 70 m in the present study were on the low side of those of the commonly described highly decomposed volcanic rocks, the core samples in this depth interval were considered to represent the intensely weathered rocks of the highly decomposed tuffs (grade IV). The term soil used in this paper refers to all materials that make up the entire weathering profile down to the depth of 70 m, following the terminology commonly applied in engineering geology (e.g., [30]). Characteristics of the core samples in the present study are summarized in Table 1.

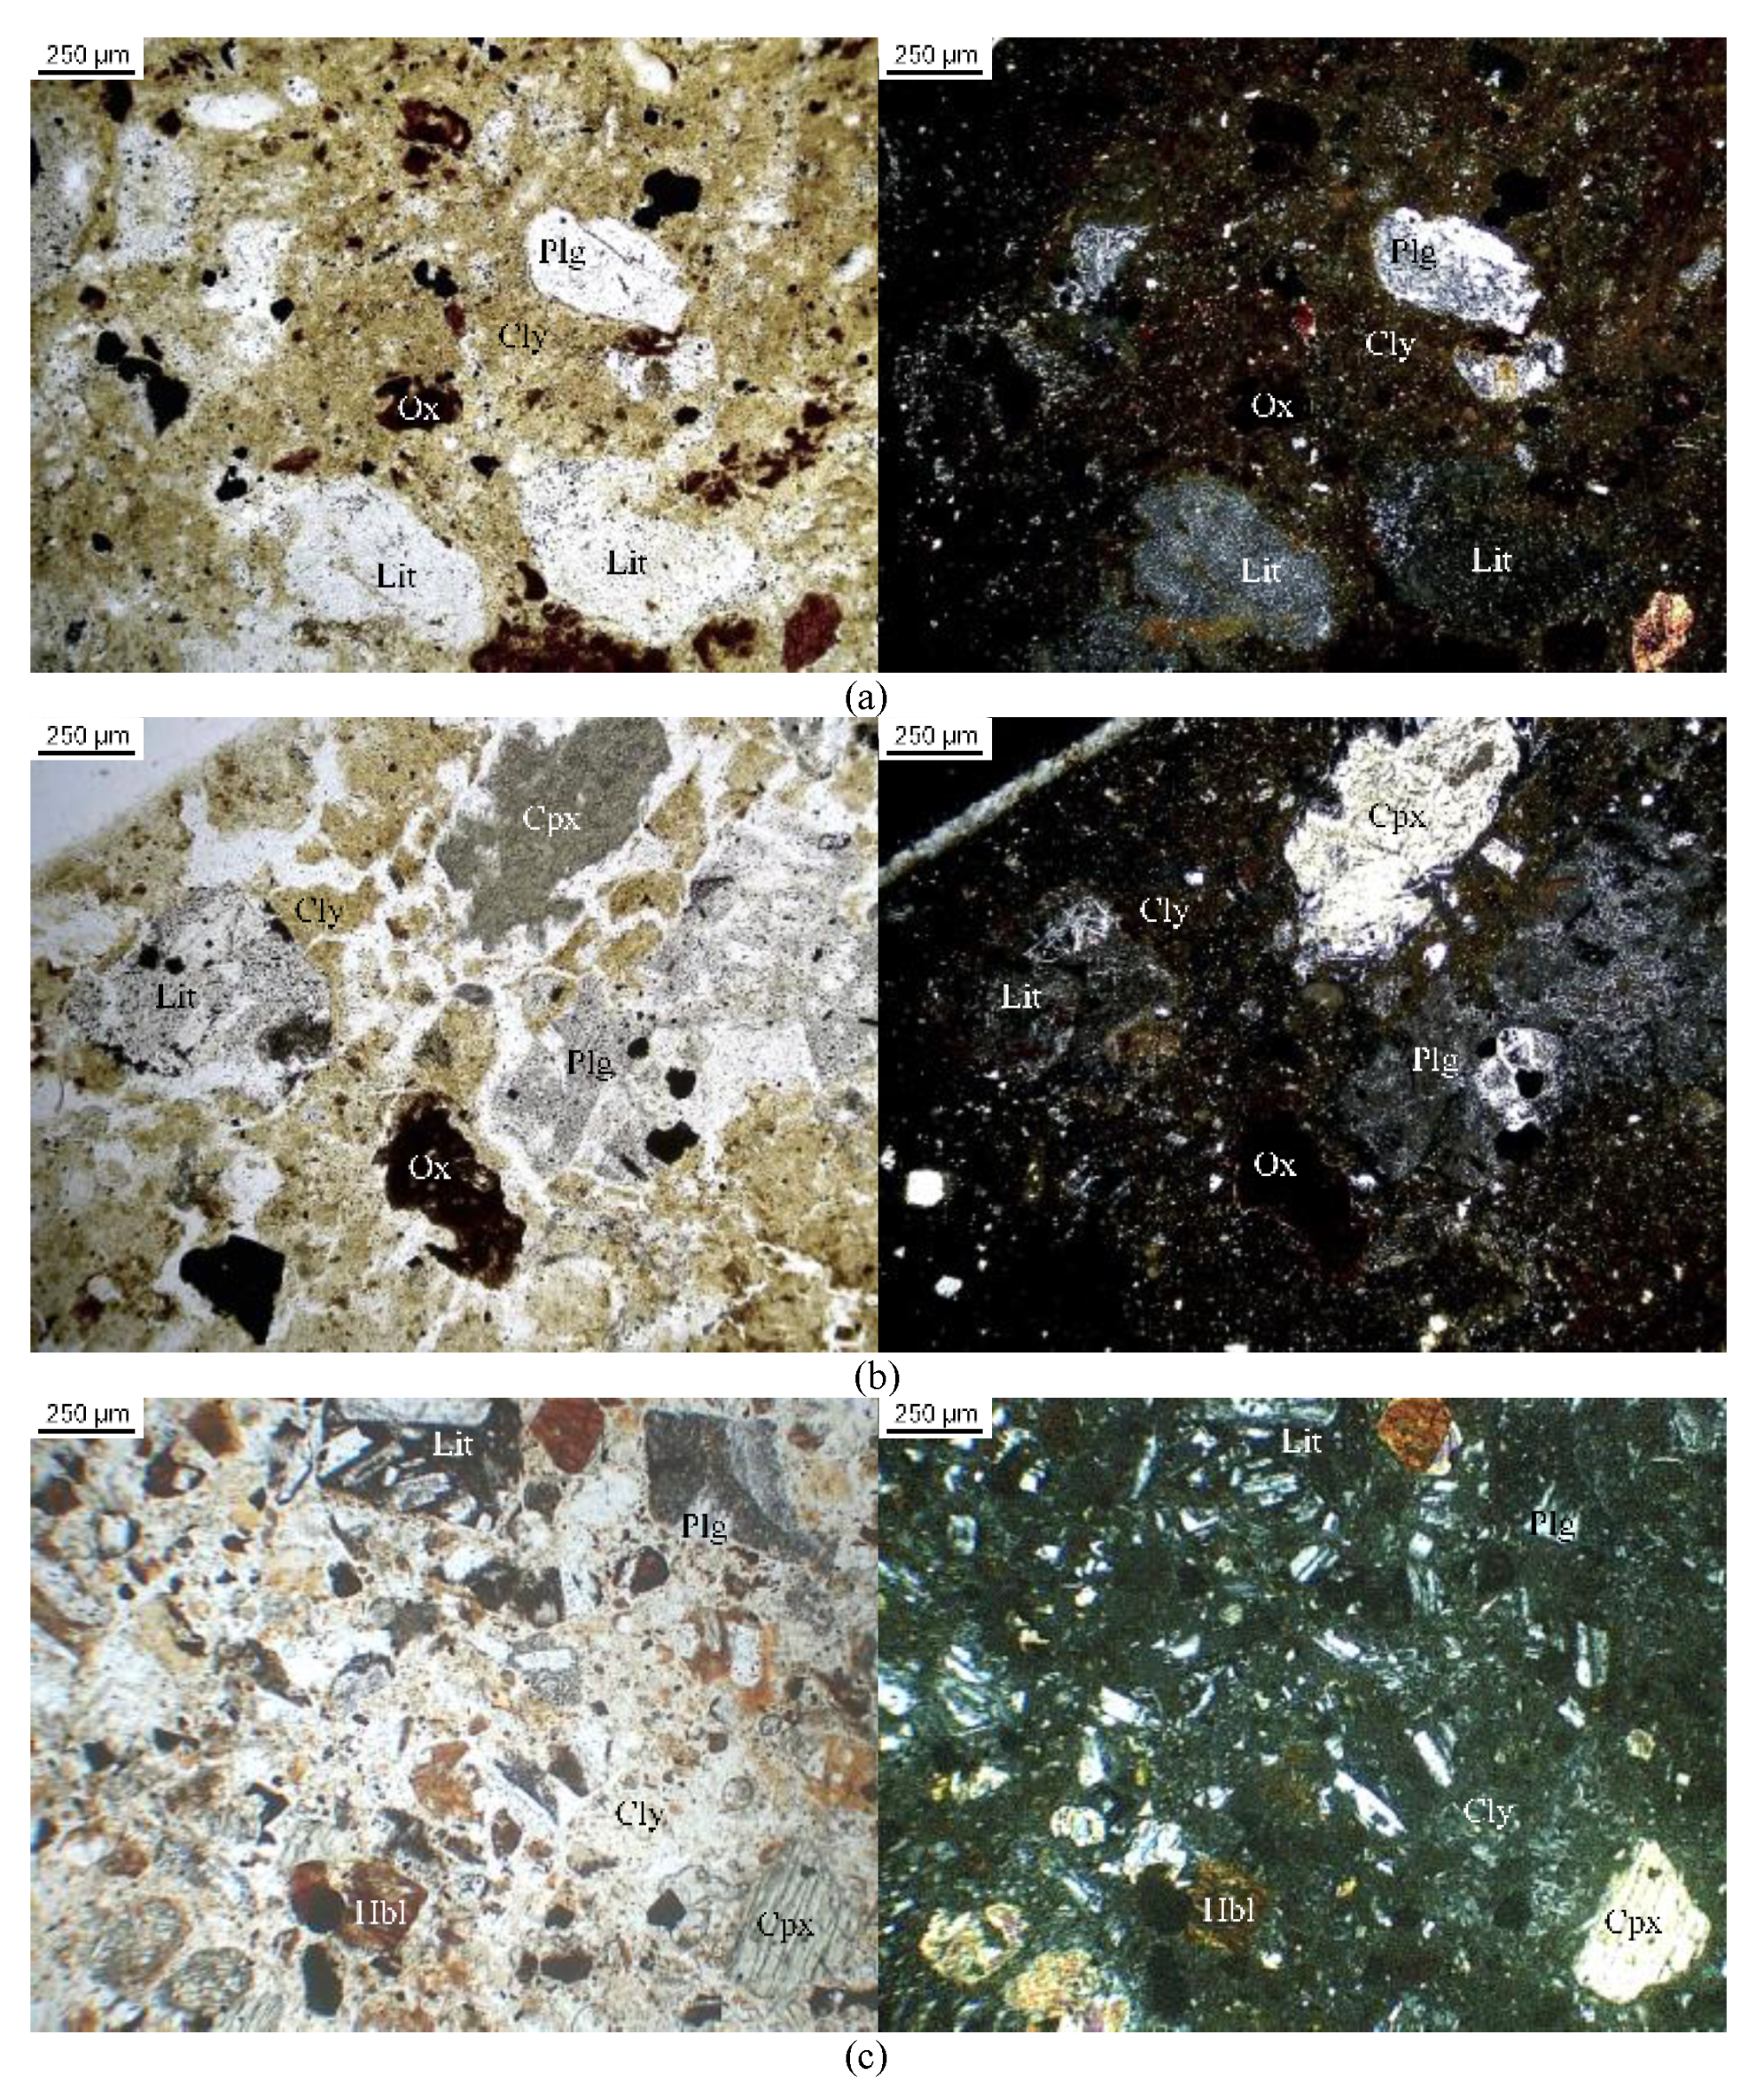
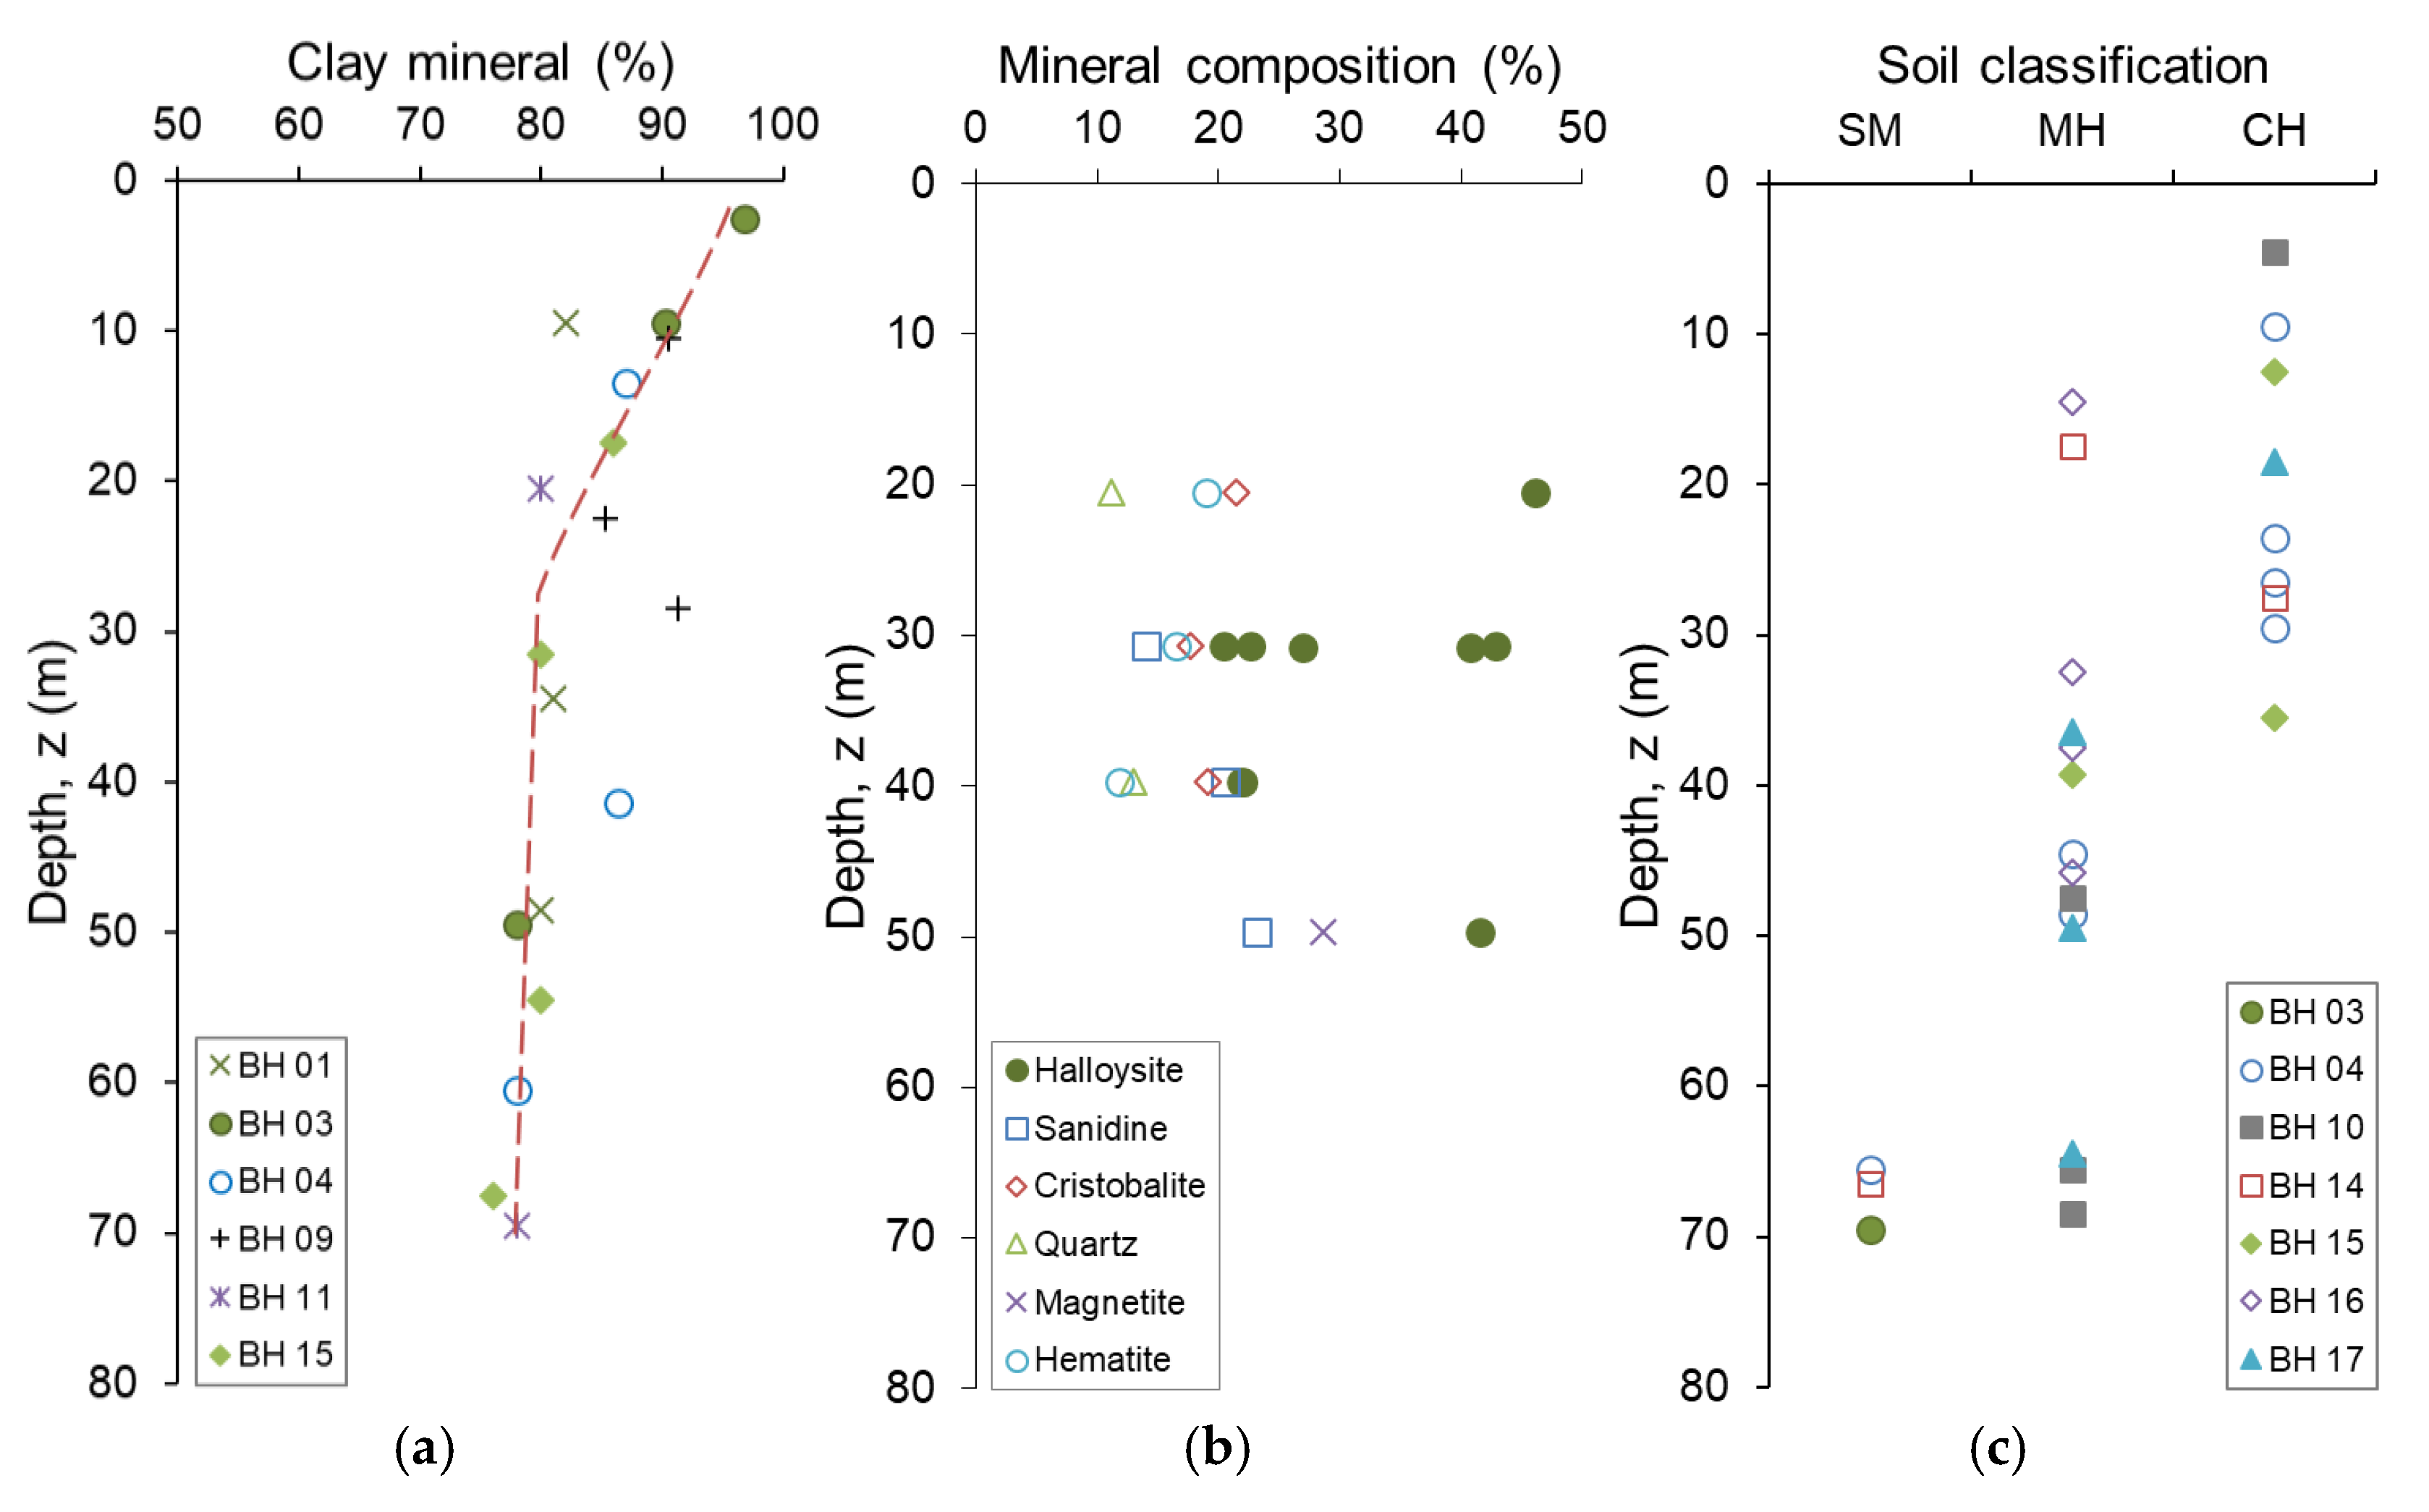
3.2. Mineral Composition

Figure 5 shows typical photomicrographs of crystal tuffs, which dominate the study area. The core samples predominantly consist of clay minerals. Weathered lithic, plagioclase, iron oxide, hornblende, clinopyroxene, and quartz minerals were commonly observed in less than 12%. Quartz minerals were often observed in veins. Figure 6a shows the distribution of the clay minerals in the tuff weathering profile ranging from 76 to 97%. The amount of clay minerals increases with the increase in the rock weathering degree.
The common minerals comprising the core samples from 20 to 50 m depth reported in the previous study [22] are plotted in Figure 6b. The core samples commonly consist of halloysite (22–46%), sanidine (14–23%), cristobalite (13–22%), quartz (11–15%), magnetite (10–29%), and hematite (10–19%). The less common minerals, which include chloritoid, muscovite, sepiolite, and monetite, were detected only in several core samples and typically in less than 10%. The types of minerals observed in the present study commonly present in volcanic ashes erupted from volcanoes in other parts of Central Java and East Java, as reported in the previous study by Supriyo et al. [31].
Halloysite is a common clay mineral in soils derived from in situ weathering of pyroclastic rocks (e.g., [14,32]). The 1:1 structure of clay mineral may be formed from the weathering of volcanic glass and plagioclase comprising volcanic ash or from the weathering of allophane clay mineral [33,34,35,36,37]. The natural occurrence and morphology of the halloysite mineral are described in detail in Bailey [38] and Joussein et al. [39]. Irfan [40] reported that halloysite is abundant in the least weathered rocks of completely decomposed tuff, but kaolinite is dominant in the more intensely weathered rocks of completely decomposed tuff and in transition grade soil in Hong Kong. Duzgoren-Aydin [32] found that halloysite is the dominant clay mineral in the moderately to highly decomposed pyroclastic rocks in Hong Kong. Despite the limited clay mineralogy data presented in Figure 6b, the trend of halloysite being the dominant clay mineral in the completely to highly decomposed tuff in the present study is similar to that in Hong Kong. The relatively high proportion of halloysite minerals is likely responsible for the distinct soil engineering properties.

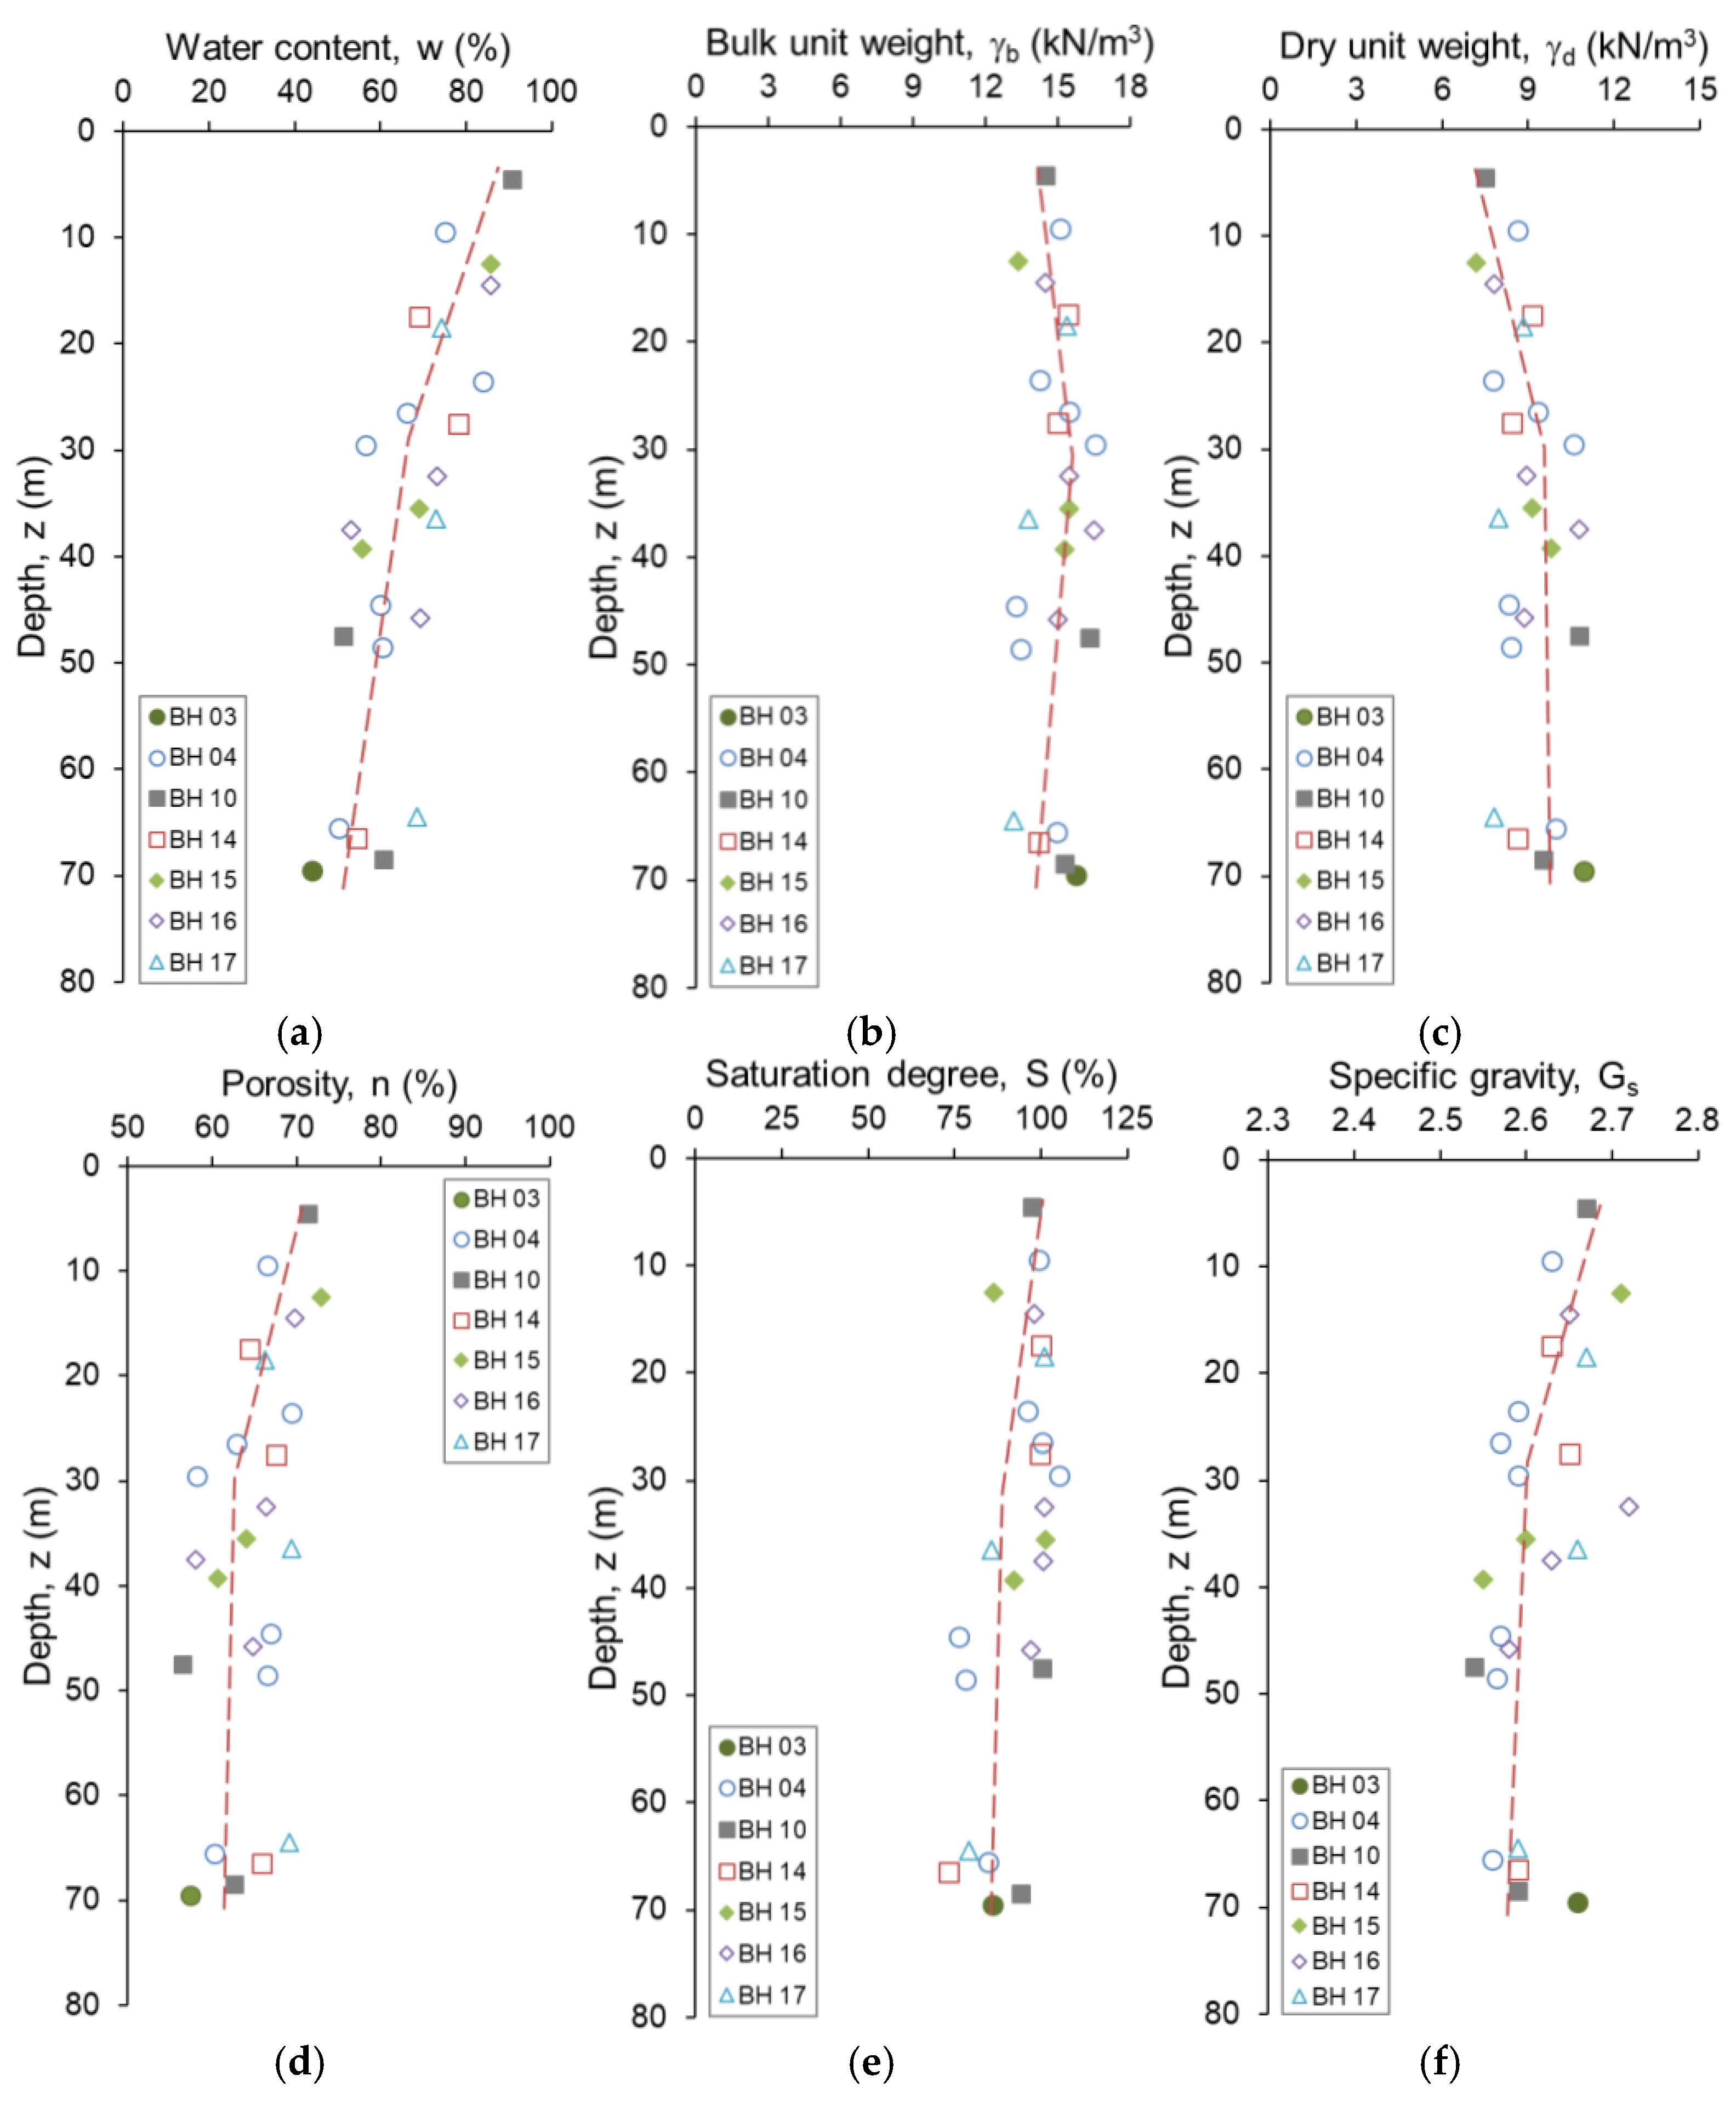
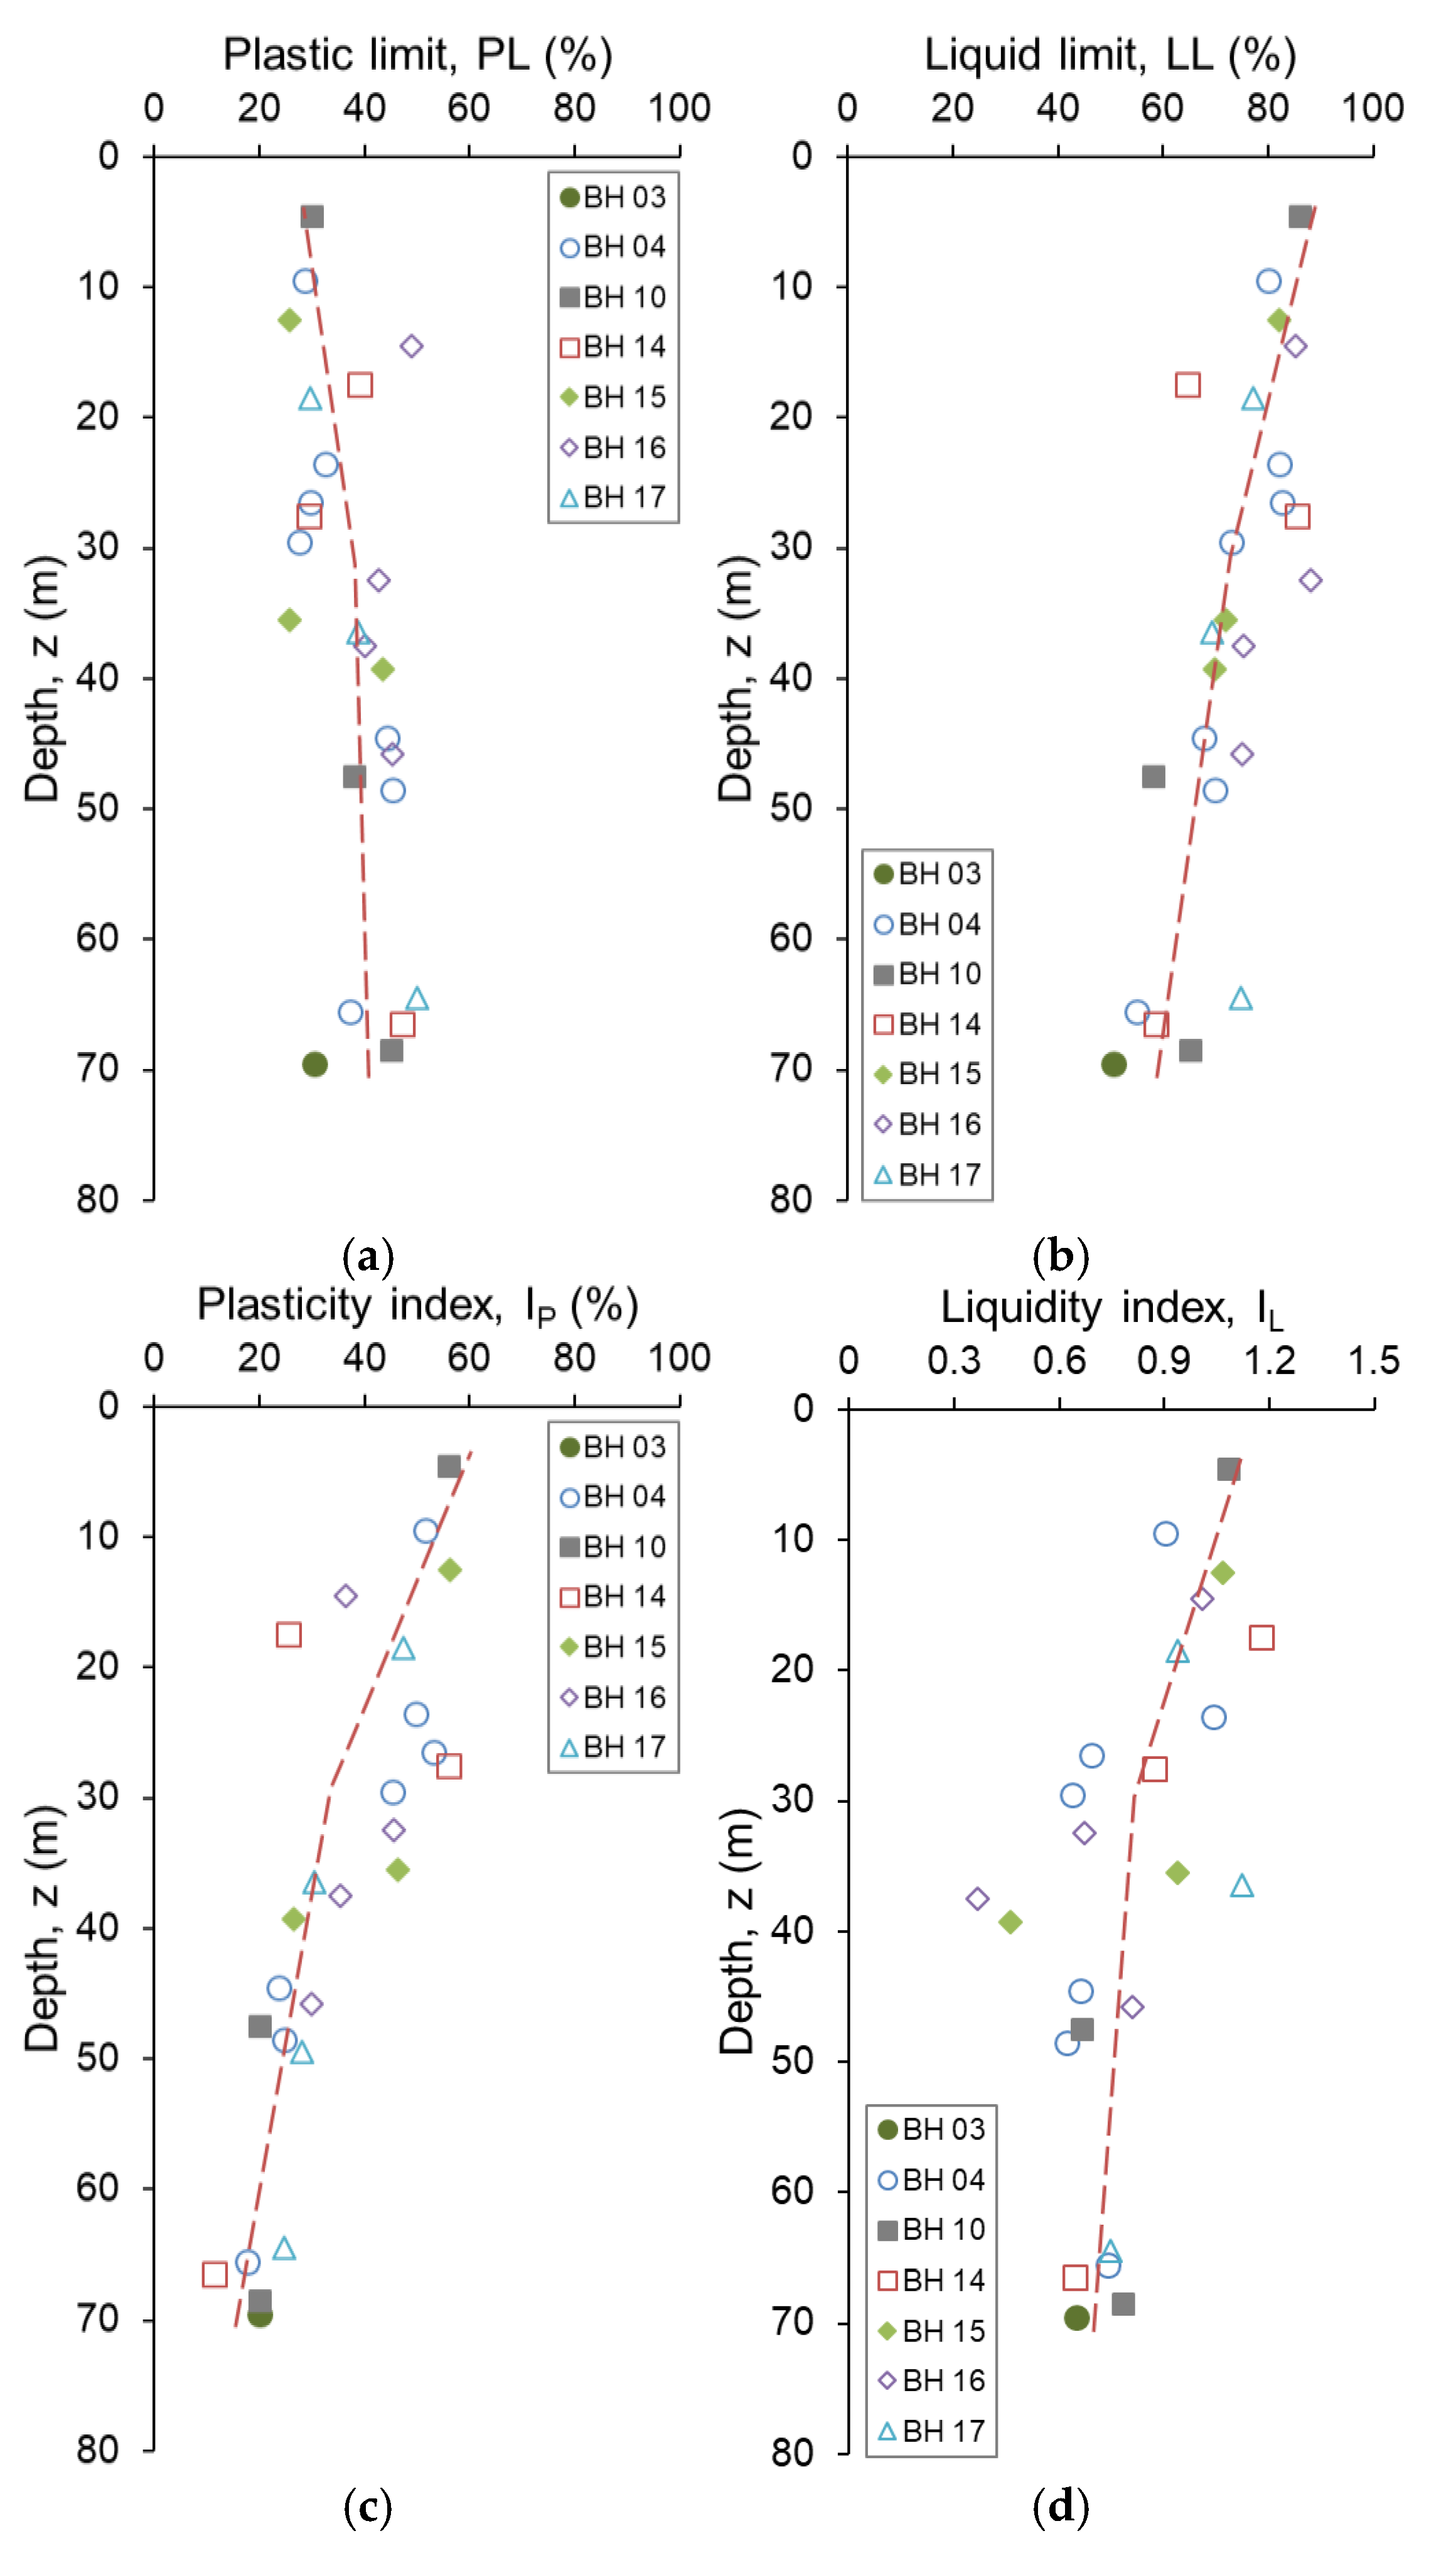
3.3. Index Properties

The soil index properties are plotted in Figure 7 and Figure 8, and the ranges of index properties for each material weathering degree are summarized in Table 1. The in situ water content (w) values range from 44 to 86% and approach the saturation degree (S) values, which range from 73 to 105%. The dry unit weight (γd) values range from 7.2 to 10.9 kN/m3, while the porosity (n) values range from 56 to 73%. The values of plastic limit (PL) and liquid limit (LL) range from 26 to 50% and from 51 to 88%, respectively. The plasticity index (IP) values range from 11 to 56%, while the liquidity index (IL) values range from 0.3 to 1.2. The specific gravity values of the soils range from 2.46 to 2.72. In general, the in situ water content, porosity, degree of saturation, liquid limit, plasticity index, and liquidity index values of the soils tend to increase with the increase in the rock weathering degree. Meanwhile, dry unit weight and plastic limit values of the soils tend to decrease with the increase in the rock weathering degree. The increase in the specific gravity values of the soils toward the ground surface are possibly caused by the increase in the magnetite and hematite minerals, as detected in the XRD analyses (Figure 8b).
Three out of 27 core samples analyzed for the particle size compositions contained approximately 55% sand-size and 45% fine-grained fractions and were classified as silty sand (SM) based on the Unified Soil Classification System (USCS). The remaining 24 core samples contained from 90 to 99% fine-grained fractions and were classified as high-plastic clay (CH) and high-plastic silt (MH) based on the Unified Soil Classification System (USCS). Figure 6c shows that the upper part of the tuff weathering profile (i.e., from 10 to 30 m depth) is dominated by soils classified as high-plastic clay (CH), while the middle and lower parts (i.e., from 30 to 70 m depth) are dominated by soils classified as high-plastic silt (MH). Wesley [41] defined a representative zone for the halloysite-rich soils to include the soils with the liquid limit (LL) and plasticity index (IP) values plotted below and above but parallel to the “A” line of the Casagrande plasticity chart. Such soils would be classified as high-plastic silt (MH) and high-plastic clay (CH) based on the USCS soil classification. The liquid limit (LL) and plasticity index (IP) values of halloysite-rich soils derived from in situ weathering of pyroclastic rocks in New Zealand compiled by Moon [12] largely confirm the representative zone for halloysite-rich soils defined by Wesley [41], particularly the zone below the “A” line of the Casagrande plasticity chart. In general, the formation of the high-plastic silt (MH) soils, related to the dominance of the halloysite, in the middle and lower parts of the tuff weathering profile in the present study also largely confirm the representative zone for the halloysite-rich soils defined by Wesley [41]. Due to limited data of the clay mineral type, however, the formation of the high-plastic clay (CH) soils in the upper part of the tuff weathering profile of the present study (Figure 6c) may only be related to increased formation of clay minerals as the weathering degree increases (Figure 6b).
Moon [12] compiled data of index properties of halloysite-rich soils derived from weathering of pyroclastic rocks published by authors from various countries. The data presented in Moon [12] and in this study are listed in Table 2 for easy comparison. In general, the index properties of the soils in the present study fall within the range of those in the previous studies. The in situ water content (w) and saturation degree (S) values of the soils in the present study are partly in the low side of those in the previous studies. While the weathering states of soils presented in the previous studies are not precisely known, the soils in the present study include the residual soils (grade VI), completely decomposed tuff (grade V), and highly decomposed tuff (grade IV). The relatively low in situ water content (w) and saturation degree (S) values of the soils in the present study are only observed for the highly decomposed tuff (grade IV) below the 40 m depth (Figure 7). The in situ water content (w) and saturation degree (S) values of the completely decomposed tuff (grade V) and residual soil (grade VI) in the present study are similar to those of the soils in previous studies. There might be some drying that occurred prior to the index testing. However, as demonstrated in the present study, the soil index properties vary with rock weathering degree. Lower in situ water content (w) and saturation degree (S) values, as compared to those of the previous studies, are expected for the soils at greater depths, as the pore volume decreases with increasing depth or with decreasing the rock weathering degree.
The halloysite-rich soils derived from in situ weathering of pyroclastic rocks typically have low dry unit weight but high water content, porosity, and plastic and liquid limits. The small-size halloysite minerals allow the soils to have high porosity that can contain large amounts of water. The small-size clay minerals also cause the soils to have small pore size and, therefore, allow the soils to create strong capillary forces, keeping the natural water content to close to saturation. As large amounts of water content can be contained and kept within the soil pores, the soils have high plastic and liquid limits.
Soils having high liquidity index values are commonly considered sensitive soils. Although such soils can be relatively strong, they can flow like a liquid once the structure breaks down [52]. In general, the liquidity index (IL) values of the soils in the present study are relatively high. The liquidity index (IL) values of the soils in the upper 20 m of the soil profile tend to be greater than one (Figure 8d). The soils may, therefore, exhibit high sensitivity when the structure is disturbed. Moon [12] explains that the high sensitivity of halloysite-rich soils is attributed to the open microstructure, high porosity and natural water content.

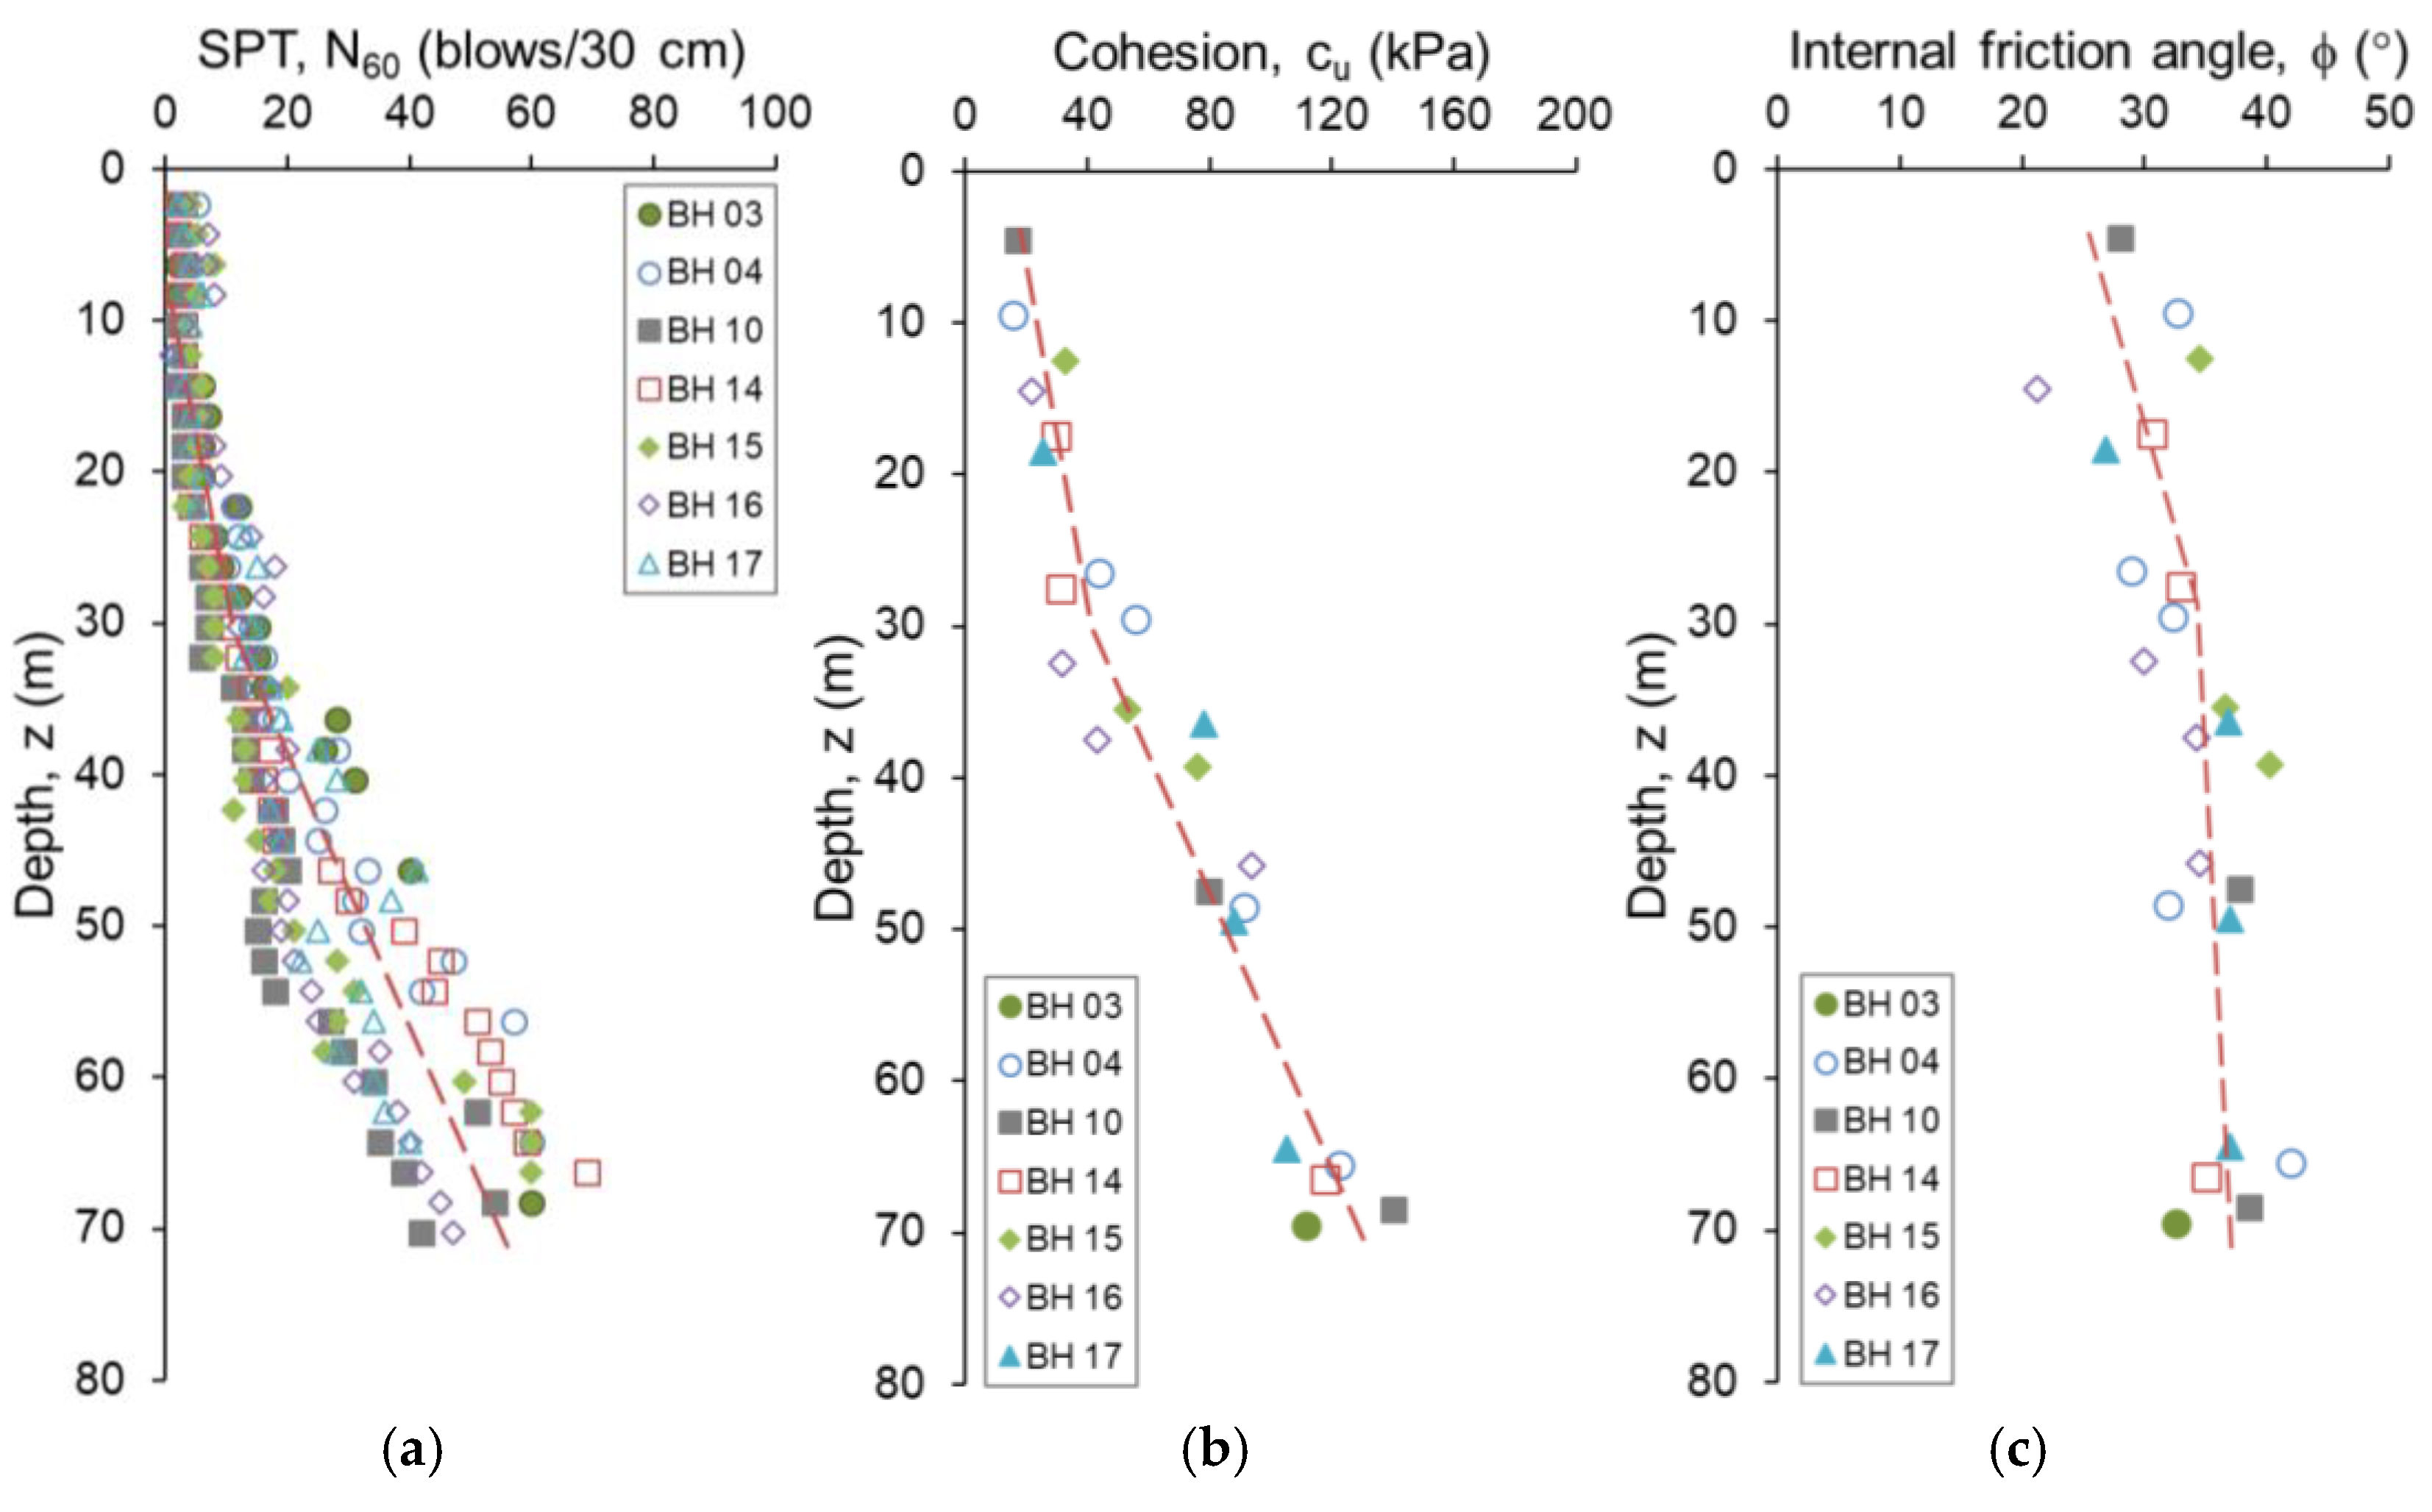
3.4. Penetration Resistance and Shear Strength

The ranges of penetration resistance and shear strength parameters for each material weathering degree are summarized in Table 1. Figure 9a shows that the SPT N60-values in the residual soil (grade VI) zone (i.e., from 0 to 10 m depth) range from 2 to 8. The SPT N60-values in the completely decomposed tuff (grade V) zone (i.e., from 10 to 30 m depth) range from 3 to 18, while those in the highly decomposed tuff (grade IV) zone (i.e., from 30 to 70 m depth) range from 7 to 69. In general, the SPT N60-values of the soils in the present study increase exponentially with depth. The increased penetration resistance of the soils derived from in situ rock weathering with depth is also reported in previous studies (e.g., [21,53]). Of particular note is the penetration resistance of the highly decomposed tuff at depths greater than 35 m, which shows wider scatter values. This is likely attributed to the spatial inhomogeneity in the tuff weathering state. The presence of corestones of less weathered rock, more intensely weathered rock, and relict discontinuities may distort the penetration resistance values.
Direct shear testing is commonly carried out to determine the shear strength of a soil. Despite its limitations (e.g., drainage condition cannot be controlled, pore water pressure cannot be measured, and failure surface is forced through a designated horizontal plane), the laboratory test is preferred mainly due to its simplicity and lower potential of sample disturbance during preparation as compared to the triaxial test (e.g., [5,54]). Based on the published shear strength data of halloysite-rich soils measured by various methods, Moon [12] concluded that the peak cohesion values of the undisturbed halloysite-rich soils were characteristically low, although the soil cohesion values reported by [48] varied from 0 to 70 kPa. Furthermore, the peak friction angle values typically ranged from 25 to 37°, although values as low as 2° and as high as 56° were reported by Jacquet [46] and Keam [47], respectively. Halloysite minerals most commonly have a tubular shape (e.g., [14]). The relatively high friction angle of the halloysite-rich soils, as compared to soils containing platy clay minerals, is attributed to the irregular morphology of the halloysite clay minerals and the aggregation [12].
The soil shear strength parameters are plotted in Figure 9b,c. The soil cohesion values tend to increase exponentially with depth, while the internal friction angle values tend to increase logarithmically with depth. The trend of increased cohesion following that of penetration resistance may suggest that the penetration resistance is greatly affected by the soil cohesion. It has been known that the penetration resistance of cohesive soils is affected by the undrained shear strength (e.g., [19]). The peak cohesion values of the soils range from 16 to 140 kPa, while the peak internal friction angle values range from 21 to 42°. The cohesion values of the soils down to the 38 m depth measured in this study are relatively low and within the range of values reported in the previous studies. However, at depths greater than 38 m, the cohesion values increase further and beyond the values reported in the previous studies. Although different testing methods may result in different soil shear strength values (e.g., [55]), the relatively higher cohesion values of the soils at depths greater than 38 m measured in the present study as compared to those of the previous studies may be attributed to the fact that the measured cohesion values in the present study include those of the intensely weathered rocks of the highly decomposed tuffs (grade IV), which are still defined as soils. On the other hand, the peak friction angle values of the soils down to the 70 m depth measured in the present study are within the range of those obtained from previous studies.
For sedimentary soils, the shear strength depends mainly on the particle size distribution and stress history or previous degree of compaction. However, the shear strength of soils derived from in situ rock weathering is influenced by the weathering degree (e.g., [5,56]). For residual soils, in which mineral bonds reduce significantly as the parent rock is completely decomposed and disintegrated, the cohesion values decrease, while friction angle values increase with depth as more fine grains are formed in the upper soil layers or more coarse grains are developed in the lower soil layers (e.g., [57]). For the soils in the present study, which consist of residual soils (grade VI) to completely decomposed rocks (grade VI), the shear strength increases with depth as the in situ mineral bonds increase with depth, approaching mineral bonds of the less weathered parent rocks. In other words, as the tuff weathering degree increases toward the ground surface, the mineral bonds progressively collapse, resulting in the lower soil shear strength. Irfan [40] details that cohesion in the highly and completely decomposed volcanic rocks is derived from a relict primary bonding between unaltered, partially altered, or completely altered minerals. As the rock weathering degree increases, the relict primary interparticle bonding gradually disappears. The cohesion in the transition soil grade and residual soils is, subsequently, dominantly derived from the weak secondary bonding due to cementation effects and the electrical attractive forces between clay minerals. The decrease in the friction angle values with the increase in the tuff weathering degree is likely attributed to the decrease in the frictional contact between grains as the relict primary interparticle bonding gradually disappears and the soils become loose. The changes in the soil dry density, porosity, clay content, and internal friction angle in the present study appear to be consistent with the change in the tuff weathering degree, as commonly observed for soils derived from in situ weathering of volcanic rocks (e.g., [53,56]).

3.5. Correlation between Plasticity Index and Shear Strength Parameters

Several equations have been proposed to estimate soil undrained shear strength from plasticity index based on the ratio of undrained shear strength to penetration resistance (Su/N) (Table 3). Unfortunately, such a relationship for soils derived from in situ weathering of tuff is poorly understood. Sivrikaya and Togrol [18] analyzed the relationships between the ratio of undrained shear strength to penetration resistance (Su/N) and the plasticity index (IP) of various types of fine-grained soils in Turkey. Although a poor coefficient of determination was obtained in Sivrikaya’s and Togrol’s statistical analysis (R2 = 0.38), the Su/N ratio was found to increase linearly with the increase in plasticity index (IP).
A similar trend to the relationship between cu/N and plasticity index (IP) was obtained for the soils derived from in situ weathering of tuff in the present study (Figure 10a). The cu/N ratios of the soils in the present study were in agreement with those of the high-plastic silt (MH) soils in Sivrikaya and Togrol [18] and Stroud [17] (Table 3), but they were lower than the Su/N ratios of the high-plastic clays (CH) in Sowers [58]. Based on the relationship between the cu/N ratio and plasticity index (IP) obtained from the present study (R2 = 0.36), the soil cohesion can be estimated using the following equation (Figure 10a):
cu = (0.44IP0.63) N60
Figure 10b shows that a better coefficient of determination (R2 = 0.70) is obtained when the soil cohesion is directly correlated with the plasticity index (IP) using the following relationship:
cu = 312.1 − 71.25ln IP
The relationship suggests that the soil cohesion decreases with the increase in the soil plasticity index (IP), as higher soil plasticity binds more water.
In addition to the undrained shear strength, the angle of internal friction has also been related to the plasticity index for fine-grained soils. The total angle of internal friction (ϕ) and plasticity index (IP) values of the soils in the present study are plotted in Figure 11. The effective angle of internal friction (ϕ′) and plasticity index (IP) values of the halloysite-rich soils reported by Arthurs [48] and Moon et al. [50] and the ϕ′-IP relationship for sedimentary soils established by Terzaghi et al. [59] are also presented in Figure 11 for comparison. It is shown that most of the internal friction angle and plasticity index values of the halloysite-rich soils are located on the high side of the relationship suggested by Terzaghi et al. [59]. This confirms the statement made by Terzaghi et al. [59] that the friction angle of clayey soils, which corresponds to random arrangement of clay particles, is mainly influenced by the clay mineral content and clay mineralogy.
Although the ϕ-IP data are scattered around the trend line, Figure 11 also shows that the angle of internal friction tends to decrease with the increase in the soil plasticity. A similar trend is also observed in the previous studies for the ϕ′-IP data of sedimentary soils (e.g., [11,59,60]). The correlation between the angle of internal friction and plasticity index values for the soils in the present study is best represented by the following relationship (R2 = 0.24):
ϕ = 51.3 − 5.15 ln IP
Establishing a correlation between plasticity index and shear strength parameters may not be a good method for soils derived from in situ rock weathering, as the soil properties vary with rock weathering degree. While relatively good correlation between the soil cohesion (cu) and plasticity index (IP) was established, poor correlation between the soil internal friction angle (ϕ) and plasticity index (IP) was obtained from this study. The scattered data of the plasticity index and shear strength parameters around the trend lines observed in the present study are also observed in previous studies. Such correlations, however, allow simple and quick estimation of soil shear strength parameters, particularly the cohesion, from the plasticity index. Preprocessing the data of SPT, shear strength parameters, and plasticity index by identifying anomalies and discounting outliers may result in better coefficients of determination and correlation, but it does not reflect the spatial inhomogeneity of the natural soils. Due to the widely scattered data and relatively poor coefficients of determination and correlation, care should be taken in estimating soil shear strength parameters by using the plasticity index. Detailed analyses of large differences between the ratio of cohesion to SPT and the friction angle under the same plasticity index require a larger dataset and further detailed studies and are beyond the scope of the present study.

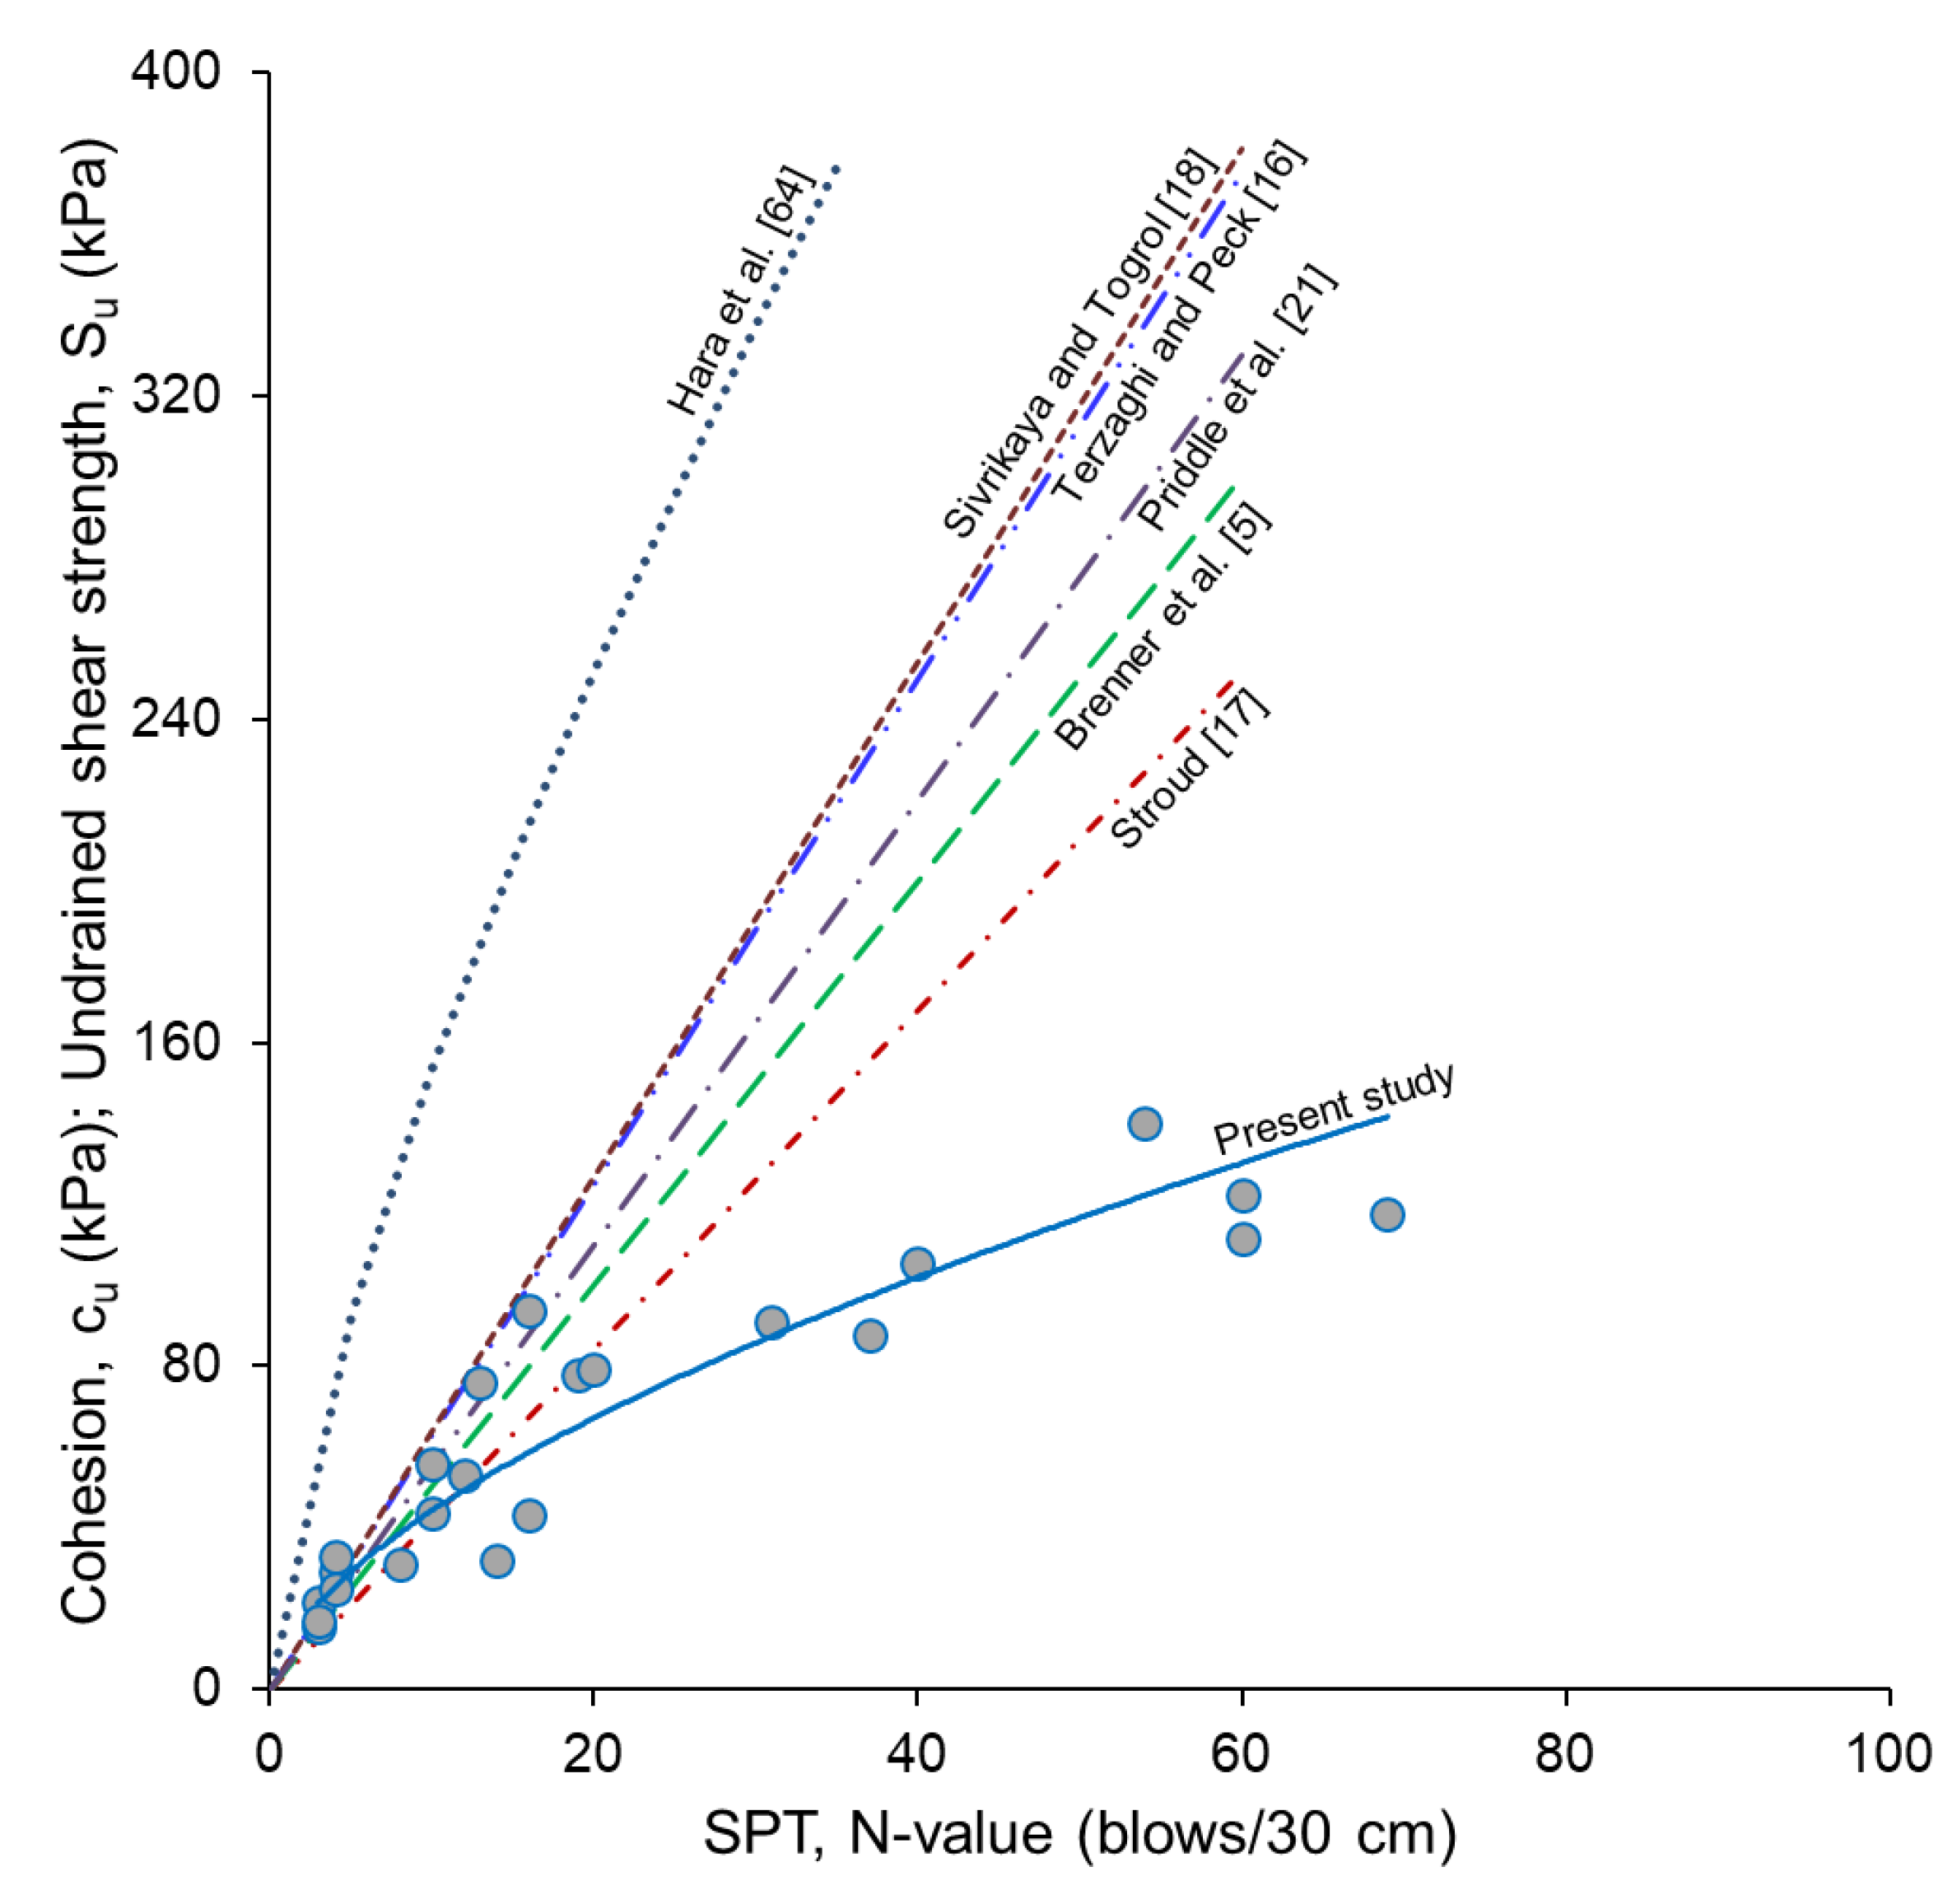
3.6. Correlation between Penetration Resistance and Shear Strength Parameters

Several authors (e.g., [19,55,61]) have suggested that the field-measured penetration resistance be corrected, particularly the energy and effective overburden pressure, to allow correlations between the soil penetration resistance and engineering properties. Unlike the mechanical properties of transported soils, which are affected by the stress history, those of soils derived from in situ rock weathering are independent of stress history [5]. While all researchers agree that energy correction is essential, there have been arguments about whether or not overburden correction is required for penetration resistance in fine-grained soils or soils derived from in situ rock weathering. Howat [53] suggested that penetration resistance of completely decomposed granite be fitted to the dry density and proposed an empirical equation for the overburden correction. Décourt [55], Clayton [19], Saran [62], McGregor and Duncan [63], and Look [20] are among others who suggested that overburden correction was not required for the SPT N-values in fine-grained soils. As the applicability of effective overburden correction is beyond the objective of the present study, the soil penetration resistance values from field measurement were only corrected for the energy.
Pair data of the soil penetration resistance and undrained cohesion in Figure 9 are plotted in Figure 12. As rock weathering degree changes gradually and the penetration resistance, cohesion, and friction angle values change nonlinearly with depth, nonlinear relationships between the penetration resistance and soil shear strength parameters, therefore, exist. The fitting curve describing the relationship between the penetration resistance and cohesion values of the soils in the present study with a good coefficient of determination (R2 = 0.88) is expressed as follows (Figure 12):
cu = 11N600.6
Numerous authors have proposed equations to correlate soil penetration resistance with undrained shear strength of fine-grained soils (e.g., [16,17,18,64]) and residual soils (e.g., [5,21]). As the relationship between soil penetration resistance (N60) and undrained cohesion (cu) is not available in the literature, the published relationships between soil penetration resistance (N or N60) and undrained shear strength (Su) for fine-grained, clay, and residual soils are listed in Table 4 and plotted in Figure 12 for comparison. While most authors proposed linear equations, Hara et al. [64] proposed a non-linear N-Su relationship for clay soils. Figure 12 shows that for soils with N60-values < 20, the pair data of penetration resistance and cohesion obtained from the present study mostly fall within the published relationships. However, for the N60-values > 20, the published relationships tend to overestimate the cohesion values of the soils in the present study. This confirms the previous findings that the halloysite-rich soils derived from in situ tuff weathering have relatively low cohesion values as compared to sedimentary soils or residual soils of high-plastic clay (CH).
Figure 6, Figure 7, Figure 8 and Figure 9 show that the rate of change in the clay content, index properties, N60-values, and shear strength parameters with depth start to differ approximately at the depth of 30 m. Down to the depth of 30 m, the tuff weathering produces soils dominated by the high-plastic clay (CH) soils, while from 30 to 70 m depth, the rock weathering produces soils dominated by the high-plastic silt (MH). When a regression line forced through the origin is drawn through the pair data of cohesion and N60-values down to the depth of 30 m (Figure 13), the following linear relationship (R2 = 0.64) is obtained:
cu = 5.18N60
Meanwhile, the regression line drawn through the pair data of cohesion and N60-values from 30 to 70 m depth gives the following linear relationship (R2 = 0.69):
cu = 1.25N60 + 46.6
The linear N60-cu relationship for the soils dominated by the high-plastic clay (CH) in the present study is close to the linear N-Su relationships for the clayey residual soils proposed by Brenner et al. [5] and Priddle et al. [21]. However, the N60-cu relationship from the present study is far different from the N60-Su relationships for sedimentary soils proposed by Stroud [17], Sivrikaya and Togrol [18,65], Terzaghi and Peck [16], and Hara et al. [64]. Therefore, estimation of cohesion values of the residual soils and completely decomposed tuff from penetration resistance using the published relationships for residual soils (i.e., cu = 5N to 5.5N) is considered reasonably accurate. Meanwhile, estimation of cohesion values of the highly decomposed tuff using Equation (6) is suggested. For practical purposes, however, Equation (4) is suggested to be used for estimation of cohesion values of soils derived from in situ tuff weathering, as the relationship covers a wider range of rock weathering degree.
Figure 14 shows the relationship between the penetration resistance and drained angle of internal friction values of the soils in the present study. The fitting curve describing this relationship is expressed as follows (R2 = 0.42):
ϕ = 2.92ln N60 + 25.9
Figure 9 also shows that the rate of change in the soil friction angle starts at approximately 30 m depth. Unlike the soil cohesion, the widespread data of the soil internal friction angles are, however, too large for meaningful statistical analyses. Plotting the penetration resistance to resistance to movement component apparently results in a relationship with a better coefficient of determination (R2 = 0.92), as follows:
σ tan ϕ = 238.6ln N60 − 243.1
This may suggest the strong dependence of the relationship between the soil penetration resistance and angle of internal friction on the overburden pressure.

4. Conclusions

The 70 m thick weathering profile of the Quaternary tuff in Central Java, Indonesia, consisted of the residual soil and completely to highly decomposed rocks. The in situ water content, porosity, degree of saturation, liquid limit, plasticity index, and liquidity index values of the soils increase with the increase in the rock weathering degree. Meanwhile, dry unit weight and plastic limit values of the soils decrease with the increase in the rock weathering degree. The soils are dominated by halloysite clay mineral and dominantly classified as high-plastic silt (MH). The soils are characterized by distinct soil properties, which are low dry unit weight and cohesion but high water content, porosity, plastic and liquid limits, and angle of internal friction. Fairly good correlations between the soil plasticity index and shear strength parameters are observed. As rock weathering degree changes gradually and the soil penetration resistance, cohesion, and friction angle values change nonlinearly with depth, non-linear relationships between the penetration resistance and shear strength parameters for soils derived from in situ weathering of tuff are proposed. Linear relationships between soil penetration resistance and shear strength parameters exist for particular rock weathering degrees.

Author Contributions

Conceptualization, I.G.B.I. and I.W.W.; methodology, I.G.B.I.; software, I.W.W.; validation, I.G.B.I. and I.W.W.; formal analysis, I.G.B.I.; investigation, I.G.B.I., D.T., M.A. and I.W.W.; resources, I.G.B.I.; data curation, I.W.W.; writing—original draft preparation, I.G.B.I.; writing—review and editing, I.G.B.I. and I.W.W.; visualization, I.W.W.; supervision, I.G.B.I. and I.W.W.; project administration, I.G.B.I.; funding acquisition, I.G.B.I. All authors have read and agreed to the published version of the manuscript.

Funding

This research was partly funded by PT Jasamarga Jogja Bawen (PT JJB).

Data Availability Statement

All data analyzed in this study are included in this published article.

Acknowledgments

The authors would like to thank PT Jasamarga Jogja Bawen (PT JJB) for the permission to conduct the research and publish parts of the borehole investigation data. The authors also wish to thank Hesti Handini of the Geological Engineering Department of UGM for reviewing the soil mineralogy. The assistance of Valentino Ilham Afandi of the Geological Engineering Department of UGM in conducting field mapping and laboratory testing is greatly appreciated. The authors would also like to thank the three anonymous reviewers and academic editor for the review of this manuscript.

Conflicts of Interest

The authors declare no conflicts of interest.

References

  1. Little, A. The engineering classification of residual tropical soils. In Proceedings of the 7th International Conference on Soil Mechanics and Foundation Engineering, Mexico City, Mexico, 15–18 October 1969; pp. 1–10. [Google Scholar]
  2. Tamado, D. Evaluasi Kondisi Geologi Teknik dan Analisis Kestabilan Zona Portal Terowongan Jalan Tol Yogyakarta-Bawen Seksi 5 Jalur Temanggung-Ambarawa. Evaluation of Engineering Geological Conditions and Stability Analysis of the Portal Zone of the Yogyakarta-Bawen Toll Road Tunnel Section 5 Temanggung-Ambarawa Line. Master’s Thesis, Universitas Gadjah Mada, Yogyakarta, Indonesia, 2024. [Google Scholar]
  3. Younger, J.S.; Cook, J.R. The impact of characteristics of Indonesian tropical soils on construction. In Proceedings of the XIII ICSMFE, New Delhi, India, 5–10 January 1994; pp. 1493–1496. [Google Scholar]
  4. Liu, R.; Chi, Y.; Xie, Y.; Kang, C.; Sun, L.; Wu, P.; Wei, Z. Characteristics and influencing factors of the granite weathering profile: A case study of a high latitude area in Northeastern China. Minerals 2024, 14, 27. [Google Scholar] [CrossRef]
  5. Brenner, R.; Garga, V.; Blight, G. Shear strength behaviour and the measurement of shear strength in residual soils. In Mechanics of Residual Soils, 2nd ed.; Blight, G., Leong, E., Eds.; CRC Press: Boca Raton, FL, USA, 2012. [Google Scholar]
  6. Yokota, S.; Iwamatsu, A. Weathering distribution in a steep slope of soft pyroclastic rocks as an indicator of slope instability. Eng. Geol. 2000, 55, 57–68. [Google Scholar] [CrossRef]
  7. Dosseto, A.; Buss, H.L.; Suresh, P.O. Rapid regolith formation over volcanic bedrock and implications for landscape evolution. Earth Planet. Sci. Lett. 2012, 337–338, 47–55. [Google Scholar] [CrossRef]
  8. Hack, H.R.G.K. Weathering, erosion and susceptibility to weathering. In Soft Rock Mechanics and Engineering, 1st ed.; Kanji, M., He, M., Ribeira E Sousa, L., Eds.; Springer Nature Switzerland AG: Cham, Switzerland, 2020; ISBN 9783030294779. [Google Scholar] [CrossRef]
  9. Sandeep, C.S.; Todisco, M.C.; Senetakis, K. Tangential contact behaviour of a weathered volcanic landslide material from Hong Kong. Soils Found. 2017, 57, 1096–1102. [Google Scholar] [CrossRef]
  10. Sandeep, C.S.; Todisco, M.C.; Nardelli, V.; Senetakis, K.; Coop, M.R.; Lourenco, S.D.N. A micromechanical experimental study of highly/completely decomposed tuff granules. Acta Geotech. 2018, 13, 1355–1367. [Google Scholar]
  11. Wesley, L.D. Shear strength properties of halloysite and allophane clays in Java, Indonesia. Géotechnique 1977, 27, 125–136. [Google Scholar] [CrossRef]
  12. Moon, V.G. Halloysite behaving badly: Geomechanics and slope behaviour of halloysite-rich soils. Clay Miner. 2016, 51, 517–528. [Google Scholar] [CrossRef]
  13. Kirk, P.A.; Campbell, S.D.G.; Fletcher, C.J.N.; Merriman, R.J. The significance of primary volcanic fabrics and clay distribution in landslides in Hongkong. J. Geol. Soc. 1997, 154, 1009–1019. [Google Scholar]
  14. Kameda, J. Mineralogical and physico-chemical properties of halloysite-bearing slip surface material from a landslide during the 2018 Eastern Iburi earthquake, Hokkaido. Prog. Earth Planet. Sci. 2021, 8, 37. [Google Scholar] [CrossRef]
  15. Kluger, M.O.; Moon, V.G.; Lowe, D.J.; Chigira, M. Role of halloysite in causing flow-like landslides: Examples from New Zealand and Japan. In Proceedings of the Japan Geoscience Union Meeting, Chiba, Japan, 22–27 May 2022. [Google Scholar]
  16. Terzaghi, K.; Peck, R.B. Soil Mechanics in Engineering Practice; John Wiley: New York, NY, USA, 1967; 729p. [Google Scholar]
  17. Stroud, M.A. The standard penetration test in insensitive clays and soft rock. In Proceedings of the 1st European Symposium on Penetration Testing, Stockholm, Sweden, 5–7 June 1974; Volume 2, pp. 367–375. [Google Scholar]
  18. Sivrikaya, O.; Toğrol, E. Determination of undrained strength of fine-grained soils by means of SPT and its application in Turkey. Eng. Geol. 2006, 86, 52–69. [Google Scholar] [CrossRef]
  19. Clayton, C.R.I. The Standard Penetration Test (SPT): Methods and use. Construction Industry Research and Information Association Report 143; CIRIA: London, UK, 1995; 143p. [Google Scholar]
  20. Look, B.G. Geotechnical basics—Common practices to avoid. In Proceedings of the 13th Australia New Zealand Conference on Geomechanics, Perth, Australia, 1–3 April 2019; Perth, Australia, 1–3 April 2019, Acosta-Martínez, H., Lehane, B., Eds.; Australian Geomechanics Society: Sydney, Australia, 2019; pp. 1247–1252. [Google Scholar]
  21. Priddle, J.; Lacey, D.; Look, B.; Gallage, C. Residual soil properties of South East Queensland. Aust. Geomech. J. 2013, 48, 67–76. [Google Scholar]
  22. PT Jasamarga Jogja Bawen (PT JJB). Detailed Engineering Design of Yogyakarta-Bawen Tunnel; Report No. 066/TUNNEL/JJB/DED/2022/REV0; PT Jasamarga Jogja Bawen (PT JJB): Yogyakarta, Indonesia, 2022. [Google Scholar]
  23. Geospatial Information Agency of Indonesia (BIG). Digital Elevation Model Nasional (DEMNAS) 1408-52_v1.0. 2019. Available online: https://tanahair.indonesia.go.id/demnas/#/ (accessed on 17 May 2024).
  24. ASTM International. ASTM Volume 04.08 Soil and Rock (I): D420–D5876. In Annual Book of ASTM Standards; ASTM International: West Conshohocken, PA, USA, 2021. [Google Scholar]
  25. Abrar, M. Karakteristik Geologi Teknik pada Lokasi Proyek Pembangunan Terowongan Yogyakarta-Bawen pada Jalan Tol Yogyakarta-Bawen Seksi 5 Jalur Temanggung-Ambarawa. Characteristics of Engineering Geology at the Yogyakarta-Bawen Tunnel Construction Project Site on the Yogyakarta-Bawen Toll Road Section 5 Temanggung-Ambarawa Line. Bachelor’s Thesis, Universitas Gadjah Mada, Yogyakarta, Indonesia, 2023. [Google Scholar]
  26. ASTM International. ASTM Volume 04.09 Soil and Rock (II): D5878–latest. In Annual Book of ASTM Standards; ASTM International: West Conshohocken, PA, USA, 2021. [Google Scholar]
  27. Thanden, R.E.; Sumadirdja, H.; Richards, P.W.; Sutisna, K.; Amin, T.C. Geological Map of the Magelang and Semarang Sheets, Java. Scale 1:100,000; Geological Research and Development Centre: Bandung, Indonesia, 1996. [Google Scholar]
  28. Dearman, W.R. Engineering Geological Mapping; Butterworth-Heinemann Ltd.: Oxford, UK, 1991. [Google Scholar]
  29. Hencher, S.R.; Martin, R.P. The description and classification of weathered rocks in Hong Kong for engineering purposes. In Proceedings of the 7th Southeast Asian Geotechnical Society, Hong Kong, China, 21 November 1982; pp. 125–142. [Google Scholar]
  30. GEO. Guide to Rock and Soil Descriptions (Geoguide 3); (Continuously Updated E-Version released on 29 August 2017); Geotechnical Engineering Office, Civil Engineering and Development Department, HKSAR Government: Hong Kong, China, 2017; p. 171. [Google Scholar]
  31. Supriyo, H.; Matsue, N.; Yoshinaga, N. Chemical and mineralogical properties of volcanic ash soils from Java. J. Soil Sci. Plant Nutr. 1992, 38, 443–457. [Google Scholar] [CrossRef]
  32. Duzgoren-Aydin, N.S.; Aydin, A.; Malpas, J. Distribution of clay minerals along a weathered pyroclastic profile, Hong Kong. Catena 2002, 50, 17–41. [Google Scholar] [CrossRef]
  33. Wada, K. Minerals in Soil Environments; Soil Science Society of America: Madison, WI, USA, 1977; pp. 603–638. [Google Scholar]
  34. Parfitt, R.L.; Russell, M.; Orbell, G.E. Weathering sequence of soils from volcanic ash involving allophane and halloysite, New Zealand. Geoderma 1983, 41, 223–241. [Google Scholar] [CrossRef]
  35. Wesley, L.D. Volcanic soils. In Geotechnical Engineering in Residual Soils; Wiley: Hoboken, NJ, USA, 2010. [Google Scholar]
  36. Kuznetsova, E.; Motenko, R. Weathering of volcanic ash in the cryogenic zone of Kamchatka, eastern Russia. Clay Miner. 2014, 49, 195–212. [Google Scholar] [CrossRef]
  37. Moon, V.G.; Mills, P.R.; Kluger, M.O.; Lowe, D.J.; Churchman, G.J.; de Lange, W.P.; Hepp, D.A.; Kreiter, S.; Mörz, T. Sensitive pyroclastic soils in the Bay of Plenty, New Zealand: Microstructure to failure mechanisms. In Proceedings of the 20th NZGS Geotechnical Symposium, Napier, New Zealand, 24–26 November 2017; Alexander, G.J., Chin, C.Y., Eds.; University of Waikato: Hamilton, New Zealand, 2017. [Google Scholar]
  38. Bailey, S.W. Halloysite—A critical assessment. In Proceedings of the 9th International Clay Conference, Strasbourg, France, 2 September 1989; Volume II: Surface chemistry. Structure and mixed layering of clays; Institut de Géologie—Université Louis-Pasteur: Strasbourg, France, 1990; pp. 89–98. [Google Scholar]
  39. Joussein, E.; Petit, S.; Churchman, J.; Theng, B.; Righi, D.; Delvaux, B. Halloysite clay minerals-a review. Clay Miner. 2005, 40, 383–426. [Google Scholar] [CrossRef]
  40. Irfan, T.Y. Characterization of weathered volcanic rocks in Hong Kong. Q. J. Eng. Geol. 1999, 32, 317–348. [Google Scholar] [CrossRef]
  41. Wesley, L.D. Some basic engineering properties of halloysite and allophane clays in Java, Indonesia. Géotechnique 1973, 23, 471–494. [Google Scholar] [CrossRef]
  42. Simon, A.B.; Bidló, G.; Liautaud, G. On the black cotton soils of North Cameroon. Eng. Geol. 1975, 9, 351–357. [Google Scholar] [CrossRef]
  43. Smalley, L.J.; Ross, C.W.; Whitton, J.S. Clays from New Zealand support the inactive particle theory of soil sensitivity. Nature 1980, 288, 576–577. [Google Scholar] [CrossRef]
  44. González de Vallejo, L.I.; Jimenez Salas, J.A.; Leguey Jimenez, S. Engineering Geology of the tropical volcanic soils of La Laguna, Tenerife. Eng. Geol. 1981, 17, 1–17. [Google Scholar] [CrossRef]
  45. Ishihara, K.; Hsu, H.-L. Considerations for landslides in natural slopes triggered by earthquakes. Proc. Jpn. Soc. Civ. Eng. 1986, 376, 1–16. [Google Scholar] [CrossRef] [PubMed]
  46. Jacquet, D. Sensitivity to remoulding of some volcanic ash soils in New Zealand. Eng. Geol. 1990, 28, 1–25. [Google Scholar] [CrossRef]
  47. Keam, M.J. Engineering Geology and Mass Movement on the Omokoroa Peninsula, Bay of Plenty, New Zealand. Master’s Thesis, University of Auckland, Auckland, New Zealand, 2008. [Google Scholar]
  48. Arthurs, J.M. The Nature of Sensitivity in Rhyolitic Pyroclastic Soils from New Zealand. Ph.D. Thesis, University of Auckland, Auckland, New Zealand, 2010. [Google Scholar]
  49. Moon, V.G.; Cunningham, M.J.; Wyatt, J.B.; Lowe, D.J.; Mörz, T.; Jorat, M.E. Landslides in sensitive soils, Tauranga, New Zealand. In Proceedings of the 19th NZGS Geotechnical Symposium, Queenstown, New Zealand, 21–22 November 2013; Chin, CY., Ed.; University of Waikato: Hamilton, New Zealand, 2013; pp. 537–544. [Google Scholar]
  50. Moon, V.G.; Lowe, D.J.; Cunningham, M.J.; Wyatt, J.B.; Churchman, G.J.; de Lange, W.P.; Mörz, T.; Kreiter, S.; Kluger, M.O.; Jorat, M.E. Sensitive pyroclastic- derived halloysitic soils in northern New Zealand: Interplay of microstructure, minerals, and geomechanics. In Volcanic Rocks and Soils, Proceedings of the International Workshop on Volcanic Rocks and Soils, Lacco Ameno, Ischia Island, Italy, 24–25 September 2016; Rotonda, T., Cecconi, M., Silvestri, F., Tommasi, P., Eds.; Taylor and Francis Group: London, UK, 2016; pp. 3–21. [Google Scholar]
  51. Wang, G.; Suemine, A.; Zhang, F.; Hata, Y.; Fukuoka, H.; Kamai, T. Some fluidized landslides triggered by the 2011 Tohoku Earthquake (Mw 9.0), Japan. Geomorphology 2014, 208, 11–21. [Google Scholar] [CrossRef]
  52. Holtz, R.D.; Kovacs, W.D.; Sheahan, T.C. An Introduction to Geotechnical Engineering, 3rd ed.; Pearson Education, Inc.: Upper Saddle River, NJ, USA, 2023. [Google Scholar]
  53. Howat, M.D. Completely weathered granite soil or rock? Q. J. Eng. Geol. 1985, 18, 199–206. [Google Scholar] [CrossRef]
  54. Huat, B.B.K.; Sew, G.S.; Ali, F.H. Tropical Residual Soils Engineering. In Proceedings of the Symposium on Tropical Residual Soils Engineering (Trse2004), University Putra Malaysia, Serdang, Selangor, Malaysia, 6–7 July 2004. [Google Scholar]
  55. Décourt, L. The standard penetration test -State-of-the-art. In Proceedings of the XII ICSMFE, Rio de Janeiro, Brazil, 13–18 August 1989; pp. 2405–2416. [Google Scholar]
  56. Wong, H.Y. Shear strength properties of Hong Kong soils for slope stability. HKIE Trans. 2020, 27, 48–54. [Google Scholar] [CrossRef]
  57. Rahardjo, H.; Aung, K.K.; Leong, E.C.; Rezaur, R.B. Characteristics of residual soils in Singapore as formed by weathering. Eng. Geol. 2004, 73, 157–169. [Google Scholar] [CrossRef]
  58. Sowers, G.F. Introductory Soil Mechanics and Foundations, 4th ed.; Macmillan: New York, NY, USA,, 1979. [Google Scholar]
  59. Terzaghi, K.; Peck, R.B.; Mesri, G. Soil Mechanics in Engineering Practice, 3rd ed.; Wiley: New York, NY, USA, 1996. [Google Scholar]
  60. Holtz, R.D.; Kovacs, W.D. An Introduction to Geotechnical Engineering; Prentice-Hall, Inc.: Hoboken, NJ, USA, 1981. [Google Scholar]
  61. Kulhawy, F.H.; Mayne, P.W. Manual on Estimating Soil Properties for Foundation Design; Report EL-6800 Research Project 1493-6; Electric Power Research Institute, Cornell University: Ithaca, NY, USA, 1990; 250p. [Google Scholar]
  62. Saran, S. Analysis and Design of Substructures; Balkema: Rotterdam, The Netherlands, 1996. [Google Scholar]
  63. McGregor, J.; Duncan, J.M. Performance and Use of the Standard Penetration Test in Geotechnical Engineering Practice; Report of CGPR; Virginia Polytechnic Institute and State University: Blacksburg, VA, USA, 1998. [Google Scholar]
  64. Hara, A.; Ohta, T.; Niwa, M.; Tanaka, S.; Banno, T. Shear modulus and shear strength of cohesive soils. Soils Found. 1974, 14, 1–12. [Google Scholar] [CrossRef]
  65. Sivrikaya, O.; Toğrol, E. Relations between SPT-N and qu. In Proceedings of the 5th International Congress on Advances in Civil Engineering, Istanbul, Turkey, 25–27 September 2002; pp. 943–952. [Google Scholar]
Figure 1. Location of the study area according to PT JJB [22]. The inset map and digital elevation model are from the Geospatial Information Agency of Indonesia [23].
Geosciences 14 00213 g001
Figure 2. Borehole locations and depths from PT JJB [22] are plotted on the engineering geological map and cross section developed in the present study. The material weathering grade in each borehole estimated from the present study is drawn. The base map is from the Geospatial Information Agency of Indonesia [23].
Geosciences 14 00213 g002
Figure 3. Typical outcrop of brown residual soil and yellowish brown completely and highly decomposed tuffs. RS: residual soil; CD: completely decomposed tuff; HD: highly decomposed tuff.
Geosciences 14 00213 g003
Figure 4. Typical core samples. (a,b) Residual soils at 2–3 m and 9–10 m depths; (c,d) completely decomposed tuffs at 14–15 m and 24–25 m depths; (e,f) Highly decomposed tuff at 69–70 m depth.
Geosciences 14 00213 g004
Figure 5. Photomicrographs of core samples classified as crystal tuffs in parallel polarized light (left) and crossed polarized light (right) [1]. (a) Completely decomposed tuff (17–18 m depth); (b) highly decomposed tuff (31–32 m depth); (c) highly decomposed tuff (67–68 m depth).
Geosciences 14 00213 g005
Figure 6. (a) Profile of clay mineral content identified from petrographic analyses; (b) profile of common minerals identified from XRD analyses (data points from PT JJB [22]); (c) profile of soil classification based on the USCS (data points are partly from Tamado [2]).
Geosciences 14 00213 g006
Figure 7. (a) Profile of water content; (b) profile of bulk unit weight; (c) profile of dry unit weight; (d) profile of porosity; (e) profile of saturation degree; (f) profile of specific gravity (data points are partly from Tamado [2]). Dashed line indicates general trend.
Geosciences 14 00213 g007
Figure 8. (a) Profile of plastic limit; (b) profile of liquid limit; (c) profile of plasticity index; (d) profile of liquidity index (data points are partly from Tamado [2]). Dashed line indicates general trend.
Geosciences 14 00213 g008
Figure 9. (a) Profile of soil penetration resistance (data points from [12]); (b,c) profiles of soil cohesion and angle of internal friction (data points are partly from Tamado [2]). Dashed line indicates general trend.
Geosciences 14 00213 g009
Figure 10. (a) Relationship between ratio of cohesion to SPT N-values and plasticity index; (b) relationship between cohesion and plasticity index.
Geosciences 14 00213 g010
Figure 11. Relationships between angle of internal friction and plasticity index.
Geosciences 14 00213 g011
Figure 12. Data points in Figure 9 are plotted to establish the N60-cu relationship. The published N-Su and N60-Su relationships for fine-grained, clay, and residual soils are plotted for comparison.
Geosciences 14 00213 g012
Figure 13. N60-cu relationships for the soils from 0 to 30 m depth and from 30 to 70 m depth.
Geosciences 14 00213 g013
Figure 14. Relationships between penetration resistance and angle of internal friction and resistance to movement.
Geosciences 14 00213 g014
Table 1. Characteristics of tuff weathering profile.
Depth (m)Material Weathering DegreeCore Description+ Index Properties* SPT N60+ Shear Strength
GswγbγdnSLLPLIPILcuϕ
0–10RS Typically brown to reddish brown in color, the upper 0.5 to 1 m layers are typically dark brown to yellowish gray due to humus content; parent rock-forming minerals were mostly altered to clay minerals, and parent rock texture is completely destroyed; easily crumbled by hand and finger pressure into constituent grains.2.63–2.6775–9114.5–15.17.5–8.666–7197–9980–8629–3051–560.9–1.12–616–1728–33
10–20CDIntensely weatheredTypically brown to yellowish brown in color, may be mottled; minerals are completely decomposed, but the rock texture is still recognizable using hand lenses and in thin sections; contain weathered coarse lithic fragments and less weathered specimens of yellowish white, highly decomposed tuff (grade IV) and light gray, moderately decomposed tuff (grade III). Plagioclase minerals are hardly recognizable by the naked eye but may be identified in a few thin sections; typically easily crumbled by hand and finger pressure and classified as soft soils to extremely weak rocks; mostly slake in water.2.57–2.7156–8613.3–16.67.2–10.658–7386–10565–8526–4925–560.6–1.24–922–5621–35
20–30Least weathered4–18
30–70HDIntensely weatheredMostly brown to brownish gray in color and mottled and often contain a significant proportion of lithic fragments and less weathered corestones of white to yellowish white, moderately decomposed (grade III) and light gray, slightly decomposed tuff (grade II); may be crumbled by hand and finger pressure and classified as very weak to weak rocks.2.46–2.7244–7313.2–16.57.8–10.956–6973–10851–8826–5011–460.3–1.17–6932–14030–42
Gs: specific gravity; w: in situ water content (%); γb: bulk unit weight (kN/m3); γd: dry unit weight (kN/m3); n: porosity (%); S: saturation degree (%); LL: liquid limit (%); PL: plastic limit (%); IP: plasticity index (%); IL: liquidity index; cu: undrained cohesion (kPa); ϕ: total angle of internal friction (°); * based on analyses of data points from PT JJB [22]; + based on analyses of data points from Tamado [2] and present study.
Table 2. Comparison of index properties of halloysite-rich soils derived from weathering of pyroclastic rocks compiled by Moon [12] and present study.
wγdnSPLLLIPILSource
(%)(kN/m3)(%)(%)(%)(%)(%)
31–51 10055–7570–11020–45 Wesley [11,41]
18–2934–7716–48 Simon et al. [42]
60–100 65–8015–30 Smalley et al. [43]
297142 González de Vallejo [44]
20–45 Ishihara and Hsu [45]
60–89 46–6768–9922–460.3–0.8Jacquet [46]
76–1067.8–9.559 39–4855–7210–331.0–2.1Keam [47]
54–1016.7–10.633–70 29–6642–9811–400.5–2.4Arthurs [48]
64–1096.7–10.161–7191–10935–4952–8915–441.1–2.2Moon et al. [49,50]
94–1604.7–6.5 Wang et al. [51]
44–867.2–10.956–7373–10526–5051–8811–560.3–1.2Present study
w: in situ water content; γd: dry unit weight; n: porosity; S: saturation degree; PL: plastic limit; LL: liquid limit; IP: plasticity index; IL: liquidity index.
Table 3. Comparison of Su/N and cu/N60 ratios.
ReferenceSu/Ncu/N60Soil type
Sowers [58]7.1–16.5 High-plastic clay (CH)
Stroud [17]≥ 6 IP < 20
4–5 35 < IP < 65
Sivrikaya and Togrol [18]2–17.5 Fine-grained soil
2.25–17.5 High-plastic clay (CH)
2–6.88 High-plastic silt (MH)
Present study 1.7–8.2Soils from in situ weathering of tuff
Table 4. Comparison of published N-Su and N60-Su relationships and N60-cu relationships proposed in the present study.
ReferenceRelationshipSoil type
Terzaghi and Peck [16]Su = 6.25NFine-grained soils
Hara et al. [64]Su = 29.125N0.72Fine-grained soils
Stroud [17]Su = 4.2NHigh-plastic clays (CH)
Sivrikaya and Togrol [65]Su = 6.82N60High-plastic clays (CH)
Sivrikaya and Togrol [18]Su = 7.8N60High-plastic clays (CH)
Brenner et al. [5]Su = 5NResidual soils
Priddle et al. [21]Su = 5.5NResidual soils
Present studycu = 11N600.6Soils from in situ weathering of tuff
cu = 5.18N60N60 < 20 (residual soils to completely decomposed tuff)
cu = 1.25N60 + 46.6N60 > 20 (highly decomposed tuff)
Disclaimer/Publisher’s Note: The statements, opinions and data contained in all publications are solely those of the individual author(s) and contributor(s) and not of MDPI and/or the editor(s). MDPI and/or the editor(s) disclaim responsibility for any injury to people or property resulting from any ideas, methods, instructions or products referred to in the content.

