Article

The Origins of the Hydrogen Sulphide (H2S) Gas in the Triassic Montney Formation, British Columbia, Canada

1
School of Science, Technology and Engineering, The University of the Sunshine Coast, Sippy Downs, QLD 4556, Australia
2
British Columbia Geological Survey, Victoria, BC V8T 4J1, Canada
3
Department of Earth, Ocean and Atmospheric Sciences, University of British Columbia, Vancouver, BC V6T 1Z4, Canada
*
Author to whom correspondence should be addressed.
Geosciences 2024, 14(8), 224; https://doi.org/10.3390/geosciences14080224
Submission received: 8 June 2024 / Revised: 11 August 2024 / Accepted: 13 August 2024 / Published: 21 August 2024
(This article belongs to the Section Geochemistry)

Abstract

:
The inexplicable distribution of souring wells (presence of H2S gas) of the unconventional Montney Formation hydrocarbon resource (British Columbia; BC) is investigated by analysing sulphur and oxygen isotopes, coupled with XRD mineralogy, scanning electron microscopy (SEM), and energy dispersive spectroscopy (EDX). The sulphur isotopic analysis indicates that the sulphur isotopic range for Triassic anhydrite (δ34S 8.9 to 20.98‰ VCDT) is the same as the H2S sulphur that is produced from the Montney Formation (δ34S 9.3 to 20.9‰ VCDT). The anhydrite in the Triassic rocks is the likely source of the sulphur in the H2S produced in the Montney Formation. The deeper Devonian sources are enriched in 34S and are not the likely source for sulphur (δ34S 17.1 and 34‰ VCDT). This is contradictory to studies on Montney Formation producers in Alberta, with heavier (34S-enriched) sulphur isotopic signatures in H2S gas of all souring Montney Formation producers. These studies conclude that deep-seated faults and fractures have provided conduits for sulphate and/or H2S gas to migrate from deeper sulphur sources in the Devonian strata. There are several wells that show a slightly heavier (34S-enriched) isotopic signature (δ34S 18 to 20‰ VCDT) within the Montney Formation H2S gas producing within close proximity to the deformation front. This variation may be due to such deep-seated faults that acted as a conduit for Devonian sulphur to migrate into the Montney Formation. Our geological model suggests the sulphate-rich fluids have migrated from the Charlie Lake Formation prior to hydrocarbon generation in the Montney Formation (BC). Sulphate has concentrated in discrete zones due to precipitation in conduits like fracture and fault systems. The model fits the observation of multi-well pads containing both sour- and sweet-producing wells indicating that the souring is occurring in very narrow and discrete zones with the Montney Formation (BC). Government agencies and operators in British Columbia should map the anhydrite-rich portions of the Charlie Lake Formation, together with the structural elements from three-dimensional seismic to reduce the risk of encountering unexpected souring.

1. Introduction

Hydrogen sulphide (H2S) gas is co-produced in some petroleum systems and is highly toxic, flammable, and corrosive. H2S gas is encountered in Canada, United States of America, the North Sea (Europe), and the Middle East [1]. H2S is an environmental and safety issue [2] and can also reduce the economic value of a well due to increased costs in upgrading evacuation infrastructure (i.e., sour service pipe) or the need to use chemicals (i.e., Triazine) to remove the H2S from the hydrocarbons.
The formation of H2S occurs due to several mechanisms. For example, H2S in petroleum systems can develop by (1) bacterial sulphate reduction {BSR; [3,4,5]}; (2) thermal sulphate reduction {TSR; [6]}; (3) sulphur-rich kerogen cracking [7]; and (4) sulphide oxidation and/or decomposition of surfactants used for well completions [8]. The process in point (4) is only a short-lived production of H2S compared to the other processes listed. Hydrogen sulphide is generated when sulphate present within the reservoir comes into contact with hydrocarbons and goes through a chemical reduction process that is catalysed by either microbial communities below 60–90 °C [3,5] or by abiotic thermochemical processes above 90 °C [6,9,10]. Thermochemical sulphate reduction (TSR) develops when petroleum reservoirs are at temperatures of 100–140 °C [6] and the required temperature to catalyse the TSR reaction can vary due to the gas diffusion rates, gas types present, catalysts involved, and wettability and permeability of the reservoir [6,9]. Aqueous sulphate ions are needed in the TSR process, which could include dissolved sulphates within the pore water from ancient seawater, evaporative brines, or the dissolution and migration of sulphate-rich minerals (i.e., anhydrite, gypsum). Reactive organic compounds are also needed to be within the reservoir, and this could include organic matter, crude oil, microbial methane, or thermogenic gas/condensate.
Researchers have used isotopic signatures of sulphur and oxygen to understand the sulphur sources of the H2S gas which involves analysing the H2S gas from the producing formation and the minerals of the formations that may be responsible for the generation [3,5,6,11,12,13,14,15,16,17,18,19,20]. The difference in the isotopic data (34S and 18O) is due to the changes in isotopic ratios of sulphur within seawater over geological time [21,22,23,24,25]. The study by [24] shows that the sulphur isotopic range for Triassic seawater is between δ34S 10 and 20‰ VCDT, and the oxygen isotopic signature is between δ18O 12 and 16‰ (SMOW), compared to a sulphur signature of 16–28‰ and an oxygen isotopic signature between 12 and 18‰ for Devonian seawater. This means that anhydrite formed during each of these geological periods will have specific sulphur and oxygen isotopic fingerprints, which will result in distinct TSR-generated H2S gas. For example, ref. [14] identified a Devonian evaporite as the source of the sulphur for the Triassic Montney Formation in Alberta using cross-plots of sulphur and oxygen isotopic ratios. This study concluded that sulphate or the H2S gas has migrated through deep-seated faults and soured the Montney Formation [14]. Researchers combine their isotopic results with textural analyses to provide insights into the sulphur-rich minerals formation which includes petrographic analyses (i.e., [14,18]) and SEM (i.e., [26]).
In the Western Canadian Sedimentary Basin (WCSB), a high portion of producing hydrocarbon wells is sour. In 2006, 33% of the 1.6 trillion cubic feet of total gas produced in Alberta was sour [27] and souring occurs in both conventional and unconventional petroleum systems. The presence of H2S gas in the Triassic Montney Formation, British Columbia (BC), can be inexplicable in its occurrence and this study has investigated the sources of sulphur that contribute to the formation of hydrogen sulphide to reduce the uncertainty regarding the encountering of hydrogen sulphide during drilling and production operations.

1.1. Hydrogen Sulphide Gas in the WCSB and the Triassic Montney Formation

The Triassic Montney Formation in western Canada is an unconventional to hybrid petroleum system that provides significant contributions to the Canadian energy portfolio. For example, the Montney Formation provided a significant proportion (67%) of the natural gas volumes of British Columbia (BC; [28]) and up to 34% of natural gas to the total Canadian gas production in 2017 [29]. One major issue facing upstream and midstream operators and regulators in developing the Triassic Montney Formation (BC) is the presence of trace to significant amounts of hydrogen sulphide (H2S) in the produced gas (Figure 1). The H2S distribution within the Montney Formation (BC) is highly variable. A significant portion of BC Montney producing wells are sweet gas (i.e., zero percent H2S; Figure 1); though more recently, operators have drilled sour Montney wells that can produce alongside sweet wells on the same multi-well pad (Figure 2) which can reduce its predictability. The concentration of H2S is much lower in British Columbia Montney producers (<1%) than is observed in Alberta Montney producers (>1%) which points to different processes at play (i.e., [14]).
The sulphur isotopic composition of H2S gas varies across the Western Canadian Sedimentary Basin (WCSB) because (1) it is either generated via the BSR or TSR pathway, or (2) the sulphate source is from different age seawater (i.e., Triassic versus Devonian; [24]). Laboratory experiments and modelling have shown the sulphur isotopic ratio for BSR-generated H2S gas is less positive than sulphur derived from TSR-generated H2S (−30‰; [5]). Ref. [30] found the Triassic Doig Formation anhydrite to be 26.3‰ while H2S gas generated by BSR (using this Doig Formation anhydrite) found in the overlying Triassic Halfway Formation reservoir has a sulphur isotopic signature of only 6.3‰. The change in isotopic signature is due to fractionation, as the lighter (34S-depleted) sulphur isotope is preferentially metabolised by microorganisms, as the slightly weaker bonds of lighter sulphur isotopes are easier to break [5]. There is no preferential use of different sulphur isotopes in TSR-generated H2S gas and the source of the sulphur will be in the same range of sulphur isotopic ratios. For example, ref. [30] observed the anhydrite of the Triassic Charlie Lake Formation to have a similar sulphur isotopic signature to the H2S found in the Montney Formation in the west central Alberta Basin, which indicates that the H2S was generated via TSR processes. An exception to this case is when the reservoir contains organic sulphur that can fractionate during TSR (i.e., [31]).
The complex distribution of H2S in Canadian Triassic rocks was first identified by [11]. Ref. [11] observed, when examining formation water chemistry from drill stem test (DST) data, higher dissolved sulphate ion concentrations in areas that are overlain by anhydrite-rich Charlie Lake Formation. This observation indicates that there is fluid communication between the Triassic Doig, Halfway, and Montney formations (Figure 3) and they can act as a single unit [11]. Anhydrite, the likely sulphur source in TSR souring in the WCSB, can be readily found in Triassic, Mississippian, and Devonian rocks within the WCSB. Primary depositional anhydrite is observed in the Triassic Charlie Lake and Doig formations [30,32,33,34] as well as in the Mississippian Debolt, Banff, and Shunda formations (i.e., [35]). Only secondary anhydrite in the form of pore, vug, and fracture fill has been observed in the Montney Formation [14,36,37] as well as in the Halfway Formation and the sandstone of the Doig Formation [38,39]. The Charlie Lake Formation can contain thick layers of evaporitic anhydrite [32,34]. The Doig Formation is also a potential source of sulphate in the form of anhydrite associated with phosphatic nodules [30,33] as well as pore cements in the Doig sandstone [39]. Ref. [33] suggests the dissolved sulphate has moved from the Charlie Lake into the Montney Formation in areas where the Doig/Halfway subcrop is absent and there is direct contact between the Charlie Lake and Montney formations towards the eastern part of the WCSB. It is further suggested that sulphate ions migrate along an unconformity surface in the geographical centre of Montney Formation [40] via fluid migration [33]. Sulphate recycling via solution and redeposition as secondary cements has also been observed in the Halfway Formation, and the origins of the sulphate were interpreted to be from the overlying Charlie Lake Formation [38].
Figure 1. Location map for the four wells (blue stars) that were analysed to determine the sources of sulphur and the origins of the hydrogen sulphide in British Columbia. In addition, the sulphur isotopic analyses from other studies have been included in this report with a total of 218 mineral and organic matter samples analysed (see Table A1). The Well Authorization number for the four wells are also shown on the map. The green squares represent towns, the small black lines are horizontal wells, and small black circles are vertical wells that are Montney (sweet) producers in British Columbia. The red circles represent Montney sour producers. The pink box is the location of the well pads shown in Figure 2 and the green star is the location of stratigraphy and log response shown in Figure 4.
Geosciences 14 00224 g001
Figure 2. An example of the inexplicable distribution of sweet- (no H2S present) and sour- (H2S present) producing wells in the Triassic Montney Formation in British Columbia. Sour wells occur in all three informal Montney members (lower, middle and upper) and a sour well can be producing only hundreds of metres away from a sweet well. Our model incorporates this observation seen within the producing fields of British Columbia. The location of this group of wells is shown in Figure 1 as a pink box. The log signatures of the upper, middle, and lower Montney can be seen in Figure 4.
Geosciences 14 00224 g002
Figure 3. The Triassic stratigraphy of British Columbia that includes the Halfway, Doig, and Montney formations, which unconformably overlie the Permian Belloy Formation. The Montney Formation corresponds to the Lower Triassic section and is part of the Daiber Group, along with the overlying Doig Formation (modified after [41,42,43,44]; eustatic levels after [45]).
Geosciences 14 00224 g003
Figure 4. Stratigraphy and log response (gamma, bulk density, and resistivity) of the Halfway, Doig, Montney, and Belloy formations in well 200/C-078-C-094-H-05/00 (see Figure 1 for location). The Montney Formation is informally subdivided into the upper, middle, and lower Montney formations based on the sequence stratigraphic model of [46]. Abbreviation: TVD, total vertical depth.
Geosciences 14 00224 g004
The Montney Formation contains varying amounts of anhydrite [14,36,37], which is more common and concentrated in Alberta than in British Columbia [14]. Ref. [14] suggests that this is the reason the Montney Formation has higher H2S concentration in Alberta than in British Columbia. In Alberta, ref. [36] observed anhydrite cements within the coquinas of the Montney Formation, as well as a mineral replacement of fish fossils. Anhydrite is observed as either fine crystalline anhydrite cements in British Columbia or as coarse crystalline, vug, and fracture fill cements in Alberta [14]. Geochemical analyses by [14] suggest the anhydrite within the Montney Formation in western Alberta is sourced from the deeper Devonian rocks via deep-seated faults/structures; however, no interpretation was given for the anhydrite within the Montney Formation in British Columbia. The exact mechanism(s) for souring of the Montney Formation, particularly in British Columbia, is/are still not well understood.

1.2. Geological Background

The Montney Formation (Figure 3 and Figure 4) is considered to have been deposited along a passive continental margin and consists of a westward thickening, siliciclastic, prograding wedge [36,41,47,48,49,50,51]. More recently, a tectonically influenced model for the deposition during the Middle Triassic [42], and fore-arc basin configuration starting during the Early Triassic and persisting through the Middle Triassic [52,53] have been proposed.
The Montney Formation is part of three transgressive–regressive (T-R) cycles that deposited the Triassic strata in northeastern British Columbia [43,47]. The depositional setting for the Montney Formation is described as an open shelf marine environment [47]. Palaeogeographic reconstruction for Triassic sedimentation suggests a palaeoshoreline that prograded during sea level regressions to just east of the Fort St. John and the Alberta/BC border [54]. During this time, shallow shelf muds covered the eastern part of the basin with deeper marine muds deposited to the west. The Montney Formation was deposited within an inner to distal shelf setting which varied from tempestites in the distal shelf to mudstones and deltaic/shoreline sandstones at the eastern margin [47].
The Montney Formation unconformably overlies Carboniferous or Permian strata and consists of variable amounts of interbedded mudstone, siltstone, and sandstone [50]. Strata of the Montney Formation developed during the first of three major T-R cycles. Within British Columbia, ref. [55] subdivided the Montney Formation into the lower siltstone–sandstone and the upper mudstone members based on lithostratigraphy. Members are separated by a basin-wide unconformity that developed due to tectonic uplift of the basin margin [49]. The mudstone member is absent within Alberta and progressively becomes thicker (up to 159 m) towards the foothills of British Columbia to the west [49]. North of the study area (Figure 1), ref. [56] subdivided the Montney Formation into two T-R couplets which correlate with the siltstone–sandstone and mudstone members of [55]. The upper Montney mudstone member is more organic-rich and radioactive than the lower Montney siltstone–sandstone member [55]. More recently, the Montney Formation has been subdivided based on sequence stratigraphic analyses and consists of upper, middle, and lower units ([46]; Figure 4). These subdivisions more or less correlate with the siltstone–sandstone and mudstone members by [55]. This study has used the subdivisions of [46] to identify any stratigraphic differences in H2S presence and concentration.
Diagenetic processes are important influences on reservoir quality of the Montney Formation. Dolomite, ankerite, calcite, quartz, and anhydrite are common cements within the Montney Formation in west-central Alberta [37]. Structural features located within the study area consist of asymmetrical pull-apart grabens with failed arms, shallow fault systems that developed during the Laramide thrusting and deeper basement faults that follow the basement terranes [57,58,59]. Graben faults within the Peace River Embayment were active during the Triassic, which affected the deposition of the Montney and Doig formations. It has been argued that structural lineaments exert some control on the location of sweet spots in the conventional and unconventional Montney Formation plays, through the formation of localized thickened sections and migration pathways [59].

2. Materials and Methods

2.1. XRD Mineralogical Composition

A total of 59 drill cuttings samples were evaluated for mineralogical composition using X-ray diffraction (XRD) analyses (Table 1). Crushed samples (<250 µm) were mixed with ethanol, hand-ground with a mortar and pestle, and then smear-mounted on glass slides. A normal-focus cobalt X-ray tube was used on a Diffraktometer D5000 (Siemens, Munich, Germany) at 40 kV and 40 mA. The mineral composition was quantified [60] by Rietveld analysis [61] using the Bruker AXS Topas® V3.0 software.

2.2. Anhydrite, Pyrite, and Organic Matter Separation

Anhydrite was chemically separated from a total of 37 samples from four wells (see Figure 1 for location) and included the Charlie Lake, Halfway, Doig, Montney, Belloy, and Muskeg formations. The bulk drill-cutting samples were crushed to a particle size finer than 60 mesh sieve, and chemical separation of anhydrite was performed by adding 5% (mass) of sodium carbonate (Na2CO3) solution to dissolve anhydrite/gypsum from the samples. The mixture was acidified by adding HCl until the pH dropped below 4.0, filtered, and then 10% (mass) of barium dichloride dihydrate (BaCl2·2H20) was added to precipitate barite (BaSO4). The barite precipitate contains the original sulphur and oxygen (as SO4) from the anhydrite.
To test if sulphur could be sourced from organic matter or pyrite, a selection of Montney Formation samples was processed to concentrate kerogen (n = 5) and pyrite (n = 3). Silicates are removed from the samples by concentrated hydrofluoric acid (HF) within a fume hood. The mixture is filtered, and the solid residue is treated with HCl (conc.) to remove carbonates. This is repeated until no reaction occurs. The residual solid contains both kerogen and pyrite as these components do not react with HF or HCl. The kerogen and pyrite are physically separated in heavy liquids with densities of 1.2 g/cc and 3.5 g/cc, respectively. Kerogen is collected as a float within the 1.2 g/cm3 heavy liquid and the pyrite is concentrated in the sink portion of the 3.5 g/cm3 heavy liquid. As kerogen and pyrite can be finely associated, the pyrite concentration was treated with concentrated hydrogen peroxide, until no reaction was present, to remove any finely intermingled kerogen.

2.3. Isotopic Sulphur Analysis—Solids

Once the barite is dried, the concentrates were sent to the Jan Veizer Stable Isotope Laboratory at the University of Ottawa, Ontario, Canada. The sulphur and oxygen isotopic ratios that were measured are the average ratios for all anhydrite present in the formation. The 34S/32S and 18O/16O ratios were measured on the generated SO2 and CO gases, respectively, using Thermo Finnigan DeltaPlus XP Isotope ratio mass spectrometer (IRMS). Results are reported in per mil (‰) relative to the international standard Vienna-Canyon Diablo Troilite (‰V-CDT) for δ34S and Vienna Standard Mean Ocean Water (‰V-SMOW) for δ18O. The analytical precision is reported to be +/− 0.3 per mil for the IRMS. An additional 181 samples were used from a variety of studies (see Table A1). The kerogen and pyrite concentrates were then sent to Jan Veizer Stable Isotope Laboratory at the University of Ottawa for sulphur isotopic analyses. Note, no oxygen isotopes were measured for the kerogen or pyrite samples as the sulphur is not in the form of sulphate like in the anhydrite concentrates.

2.4. Isotopic Sulphur Analysis—H2S Gas

The H2S sampling for this study was performed by Stratum Reservoir, LLC (Calgary, AB, Canada) at the request of operators, and sent to Stratum Reservoir’s Isotech Laboratory in Champaign, IL, USA. This is a specialised procedure due to the toxic nature of the H2S gas that can only be performed by this company or by the University of Calgary. A total of 120 sulphur isotopic samples from H2S gas in the Montney Formation were used in this study, which includes the 42 samples from this study (see Table 2).

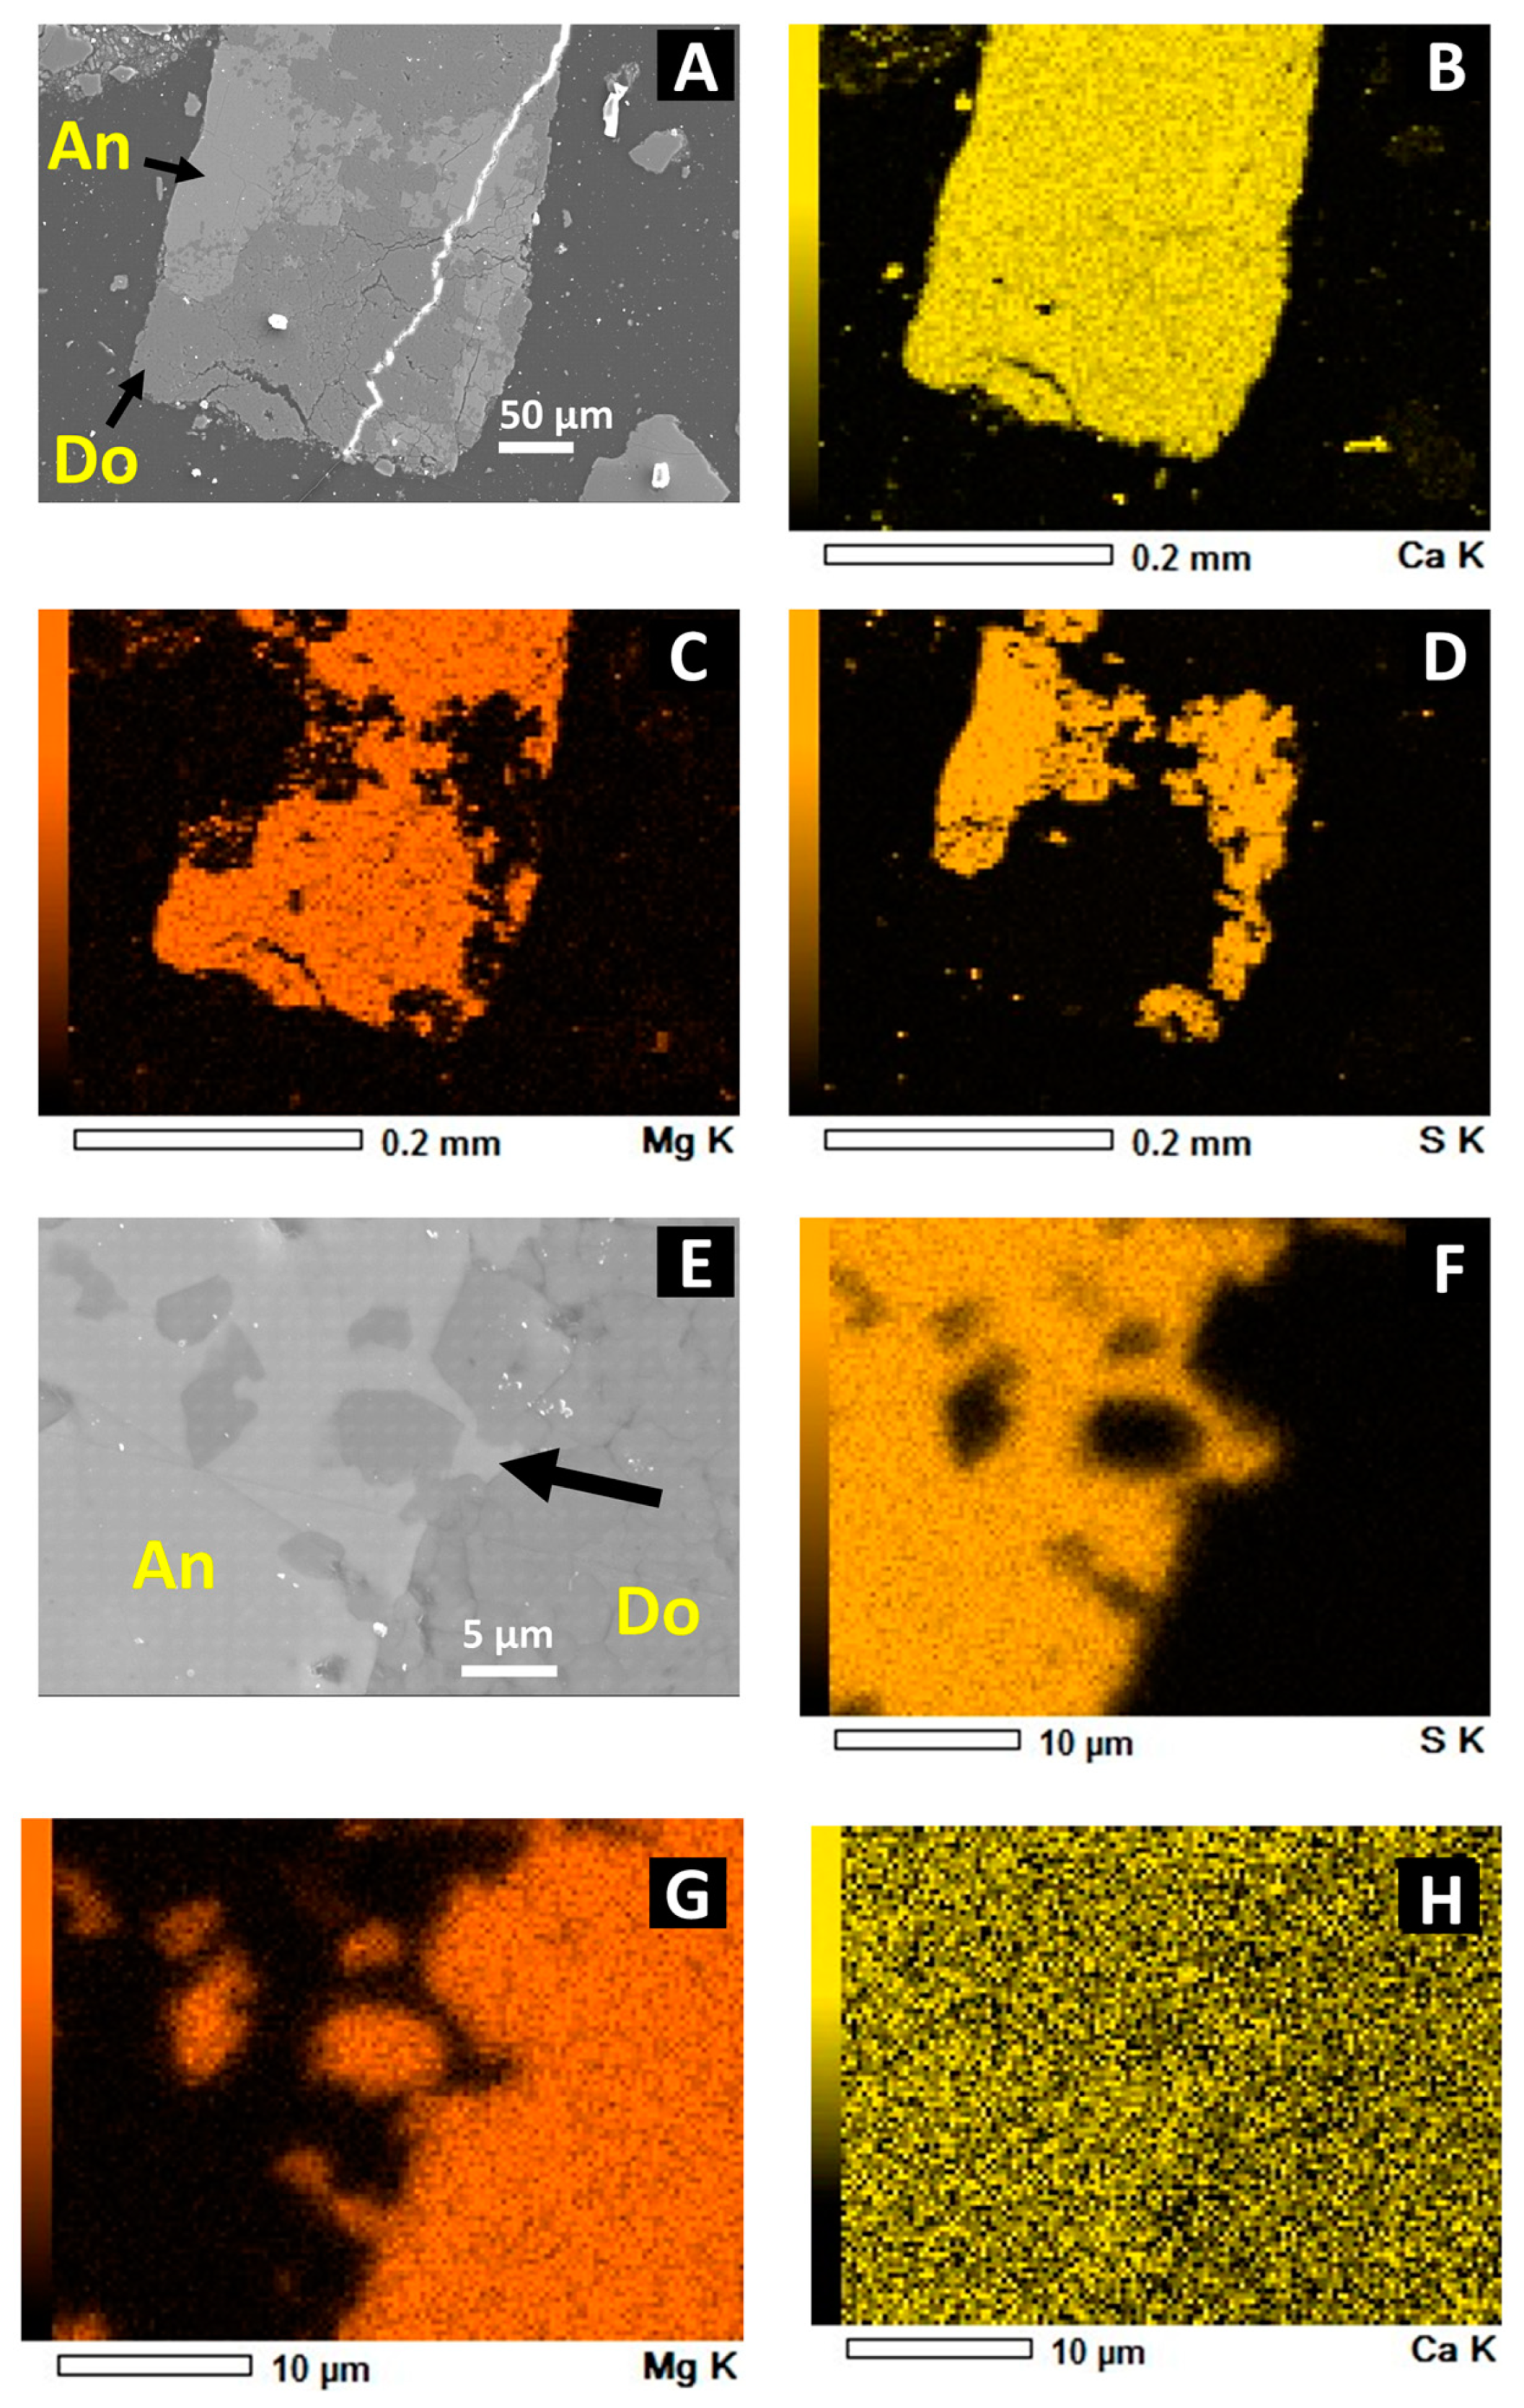
2.5. Scanning Electron Microscopy

A total of 29 drill cutting samples were analysed from Well Authorization numbers 30,876, 3944, 8183, and 29,453 (Figure 1). These samples are a sub-sample of the anhydrite mineral separation samples (prior to separation). Twenty-nine (29) thick sections were cut and polished to a thickness of 30 μm. Back-scattered electron microscopy (BSEM) was performed on selected samples. BSEM analysis and photomicrographs were acquired using a scanning electron microscope (SEM) with an accelerating voltage of 20 keV and at a working distance between 10 and 11 mm. Elemental identification was obtained using an energy-dispersive spectrometer (EDX), which allowed identification of the chemical composition of mineral phases by their X-ray spectra using Bruker Espirits V1.9 software with an accelerating voltage of 20 keV.

3. Results

The cross-plot of sulphur and oxygen isotopic ratios for anhydrite minerals from both Triassic and Devonian samples are shown in Figure 5. Sulphur isotopic ratios of anhydrite for Triassic rocks range between 8.9 and 20.98‰ (Table A1). The sulphur isotopic values for anhydrite measured in Devonian rocks range between 17.1 and 34‰ for all studies (Table A1 and Figure 5).
The dashed boxes in Figure 5 illustrate the sulphur isotopic ranges for H2S gas for the Montney Formation (red dashed box, n = 120), the H2S gas for Devonian rocks (blue dashed, shaded box) and kerogen (grey dashed box; n = 6), as these molecules do not have oxygen attached, or in the case of kerogen, the oxygen values are not relevant as the oxygen may not have formed with the sulphur. Pyrite results (n = 3) for the sulphur ratio range between 2.9 and 49.9‰ which covers the entire range of the cross-plot and therefore no dashed box is added. The sulphur isotopic data for H2S gas for all formations, including the upper, middle, and lower Montney Formation, are shown in Table 2. Sulphur ranges between 9.3 and 17.4‰ (Figure 5) with one outlier of 20.9‰ for the Montney Formation. The spatial distribution of Triassic Montney sulphur isotopic results for H2S gas are shown for both British Columbia and Alberta (Figure 6). There are no significant stratigraphic differences observed in the data when comparing the sulphur isotopic ratios range for H2S gas, between the upper, middle, and lower Montney Formation (Figure 7) and there is no regional trend across the play area (Figure 6). Sulphur isotopic data range between 14.0 and 26.0‰ for H2S gas in Devonian-aged formations (Figure 5; [13,19]). There are no stratigraphic differences observed within the Devonian samples.
XRD analyses show that the Triassic Charlie Lake Formation contains the highest proportions of anhydrite (Table 1). The Halfway, Doig, Montney, and Belloy formations also contain anhydrite but at much lower concentrations than the Charlie Lake Formation.
SEM and EDX analyses of the Charlie Lake and Montney formations are shown in Figure 8, Figure 9 and Figure 10. The anhydrite concentration in the Montney Formation is less than 2% by weight. The anhydrite in the Montney Formation is observed by SEM as a massive texture, as a diagenetic cement filling around fine-grained dolomite, or as part of a fracture fill with a dolomite and anhydrite phase (Figure 8). The anhydrite does not show detrital or evaporitic textures, which is observed within the Charlie Lake Formation (Figure 9). No massive anhydrite was observed in Charlie Lake Formation samples but were observed as a diagenetic cement between dolomite grains. As these samples are drill cuttings collected during drilling operations, there is a possibility that the anhydrite observed in the Montney Formation may be due to cave-in from the overlying Charlie Lake Formation; this is unlikely however, since there was no massive anhydrite associated with the fine-grained dolomite observed in the Charlie Lake Formation, which is observed in the Montney Formation. SEM-EDX analysis of the Doig Formation indicates the nodules that are present are enriched in apatite and anhydrite (Figure 10) and the anhydrite does exist as primary depositional texture in the Doig Formation as observed by [30,33].

4. Discussion

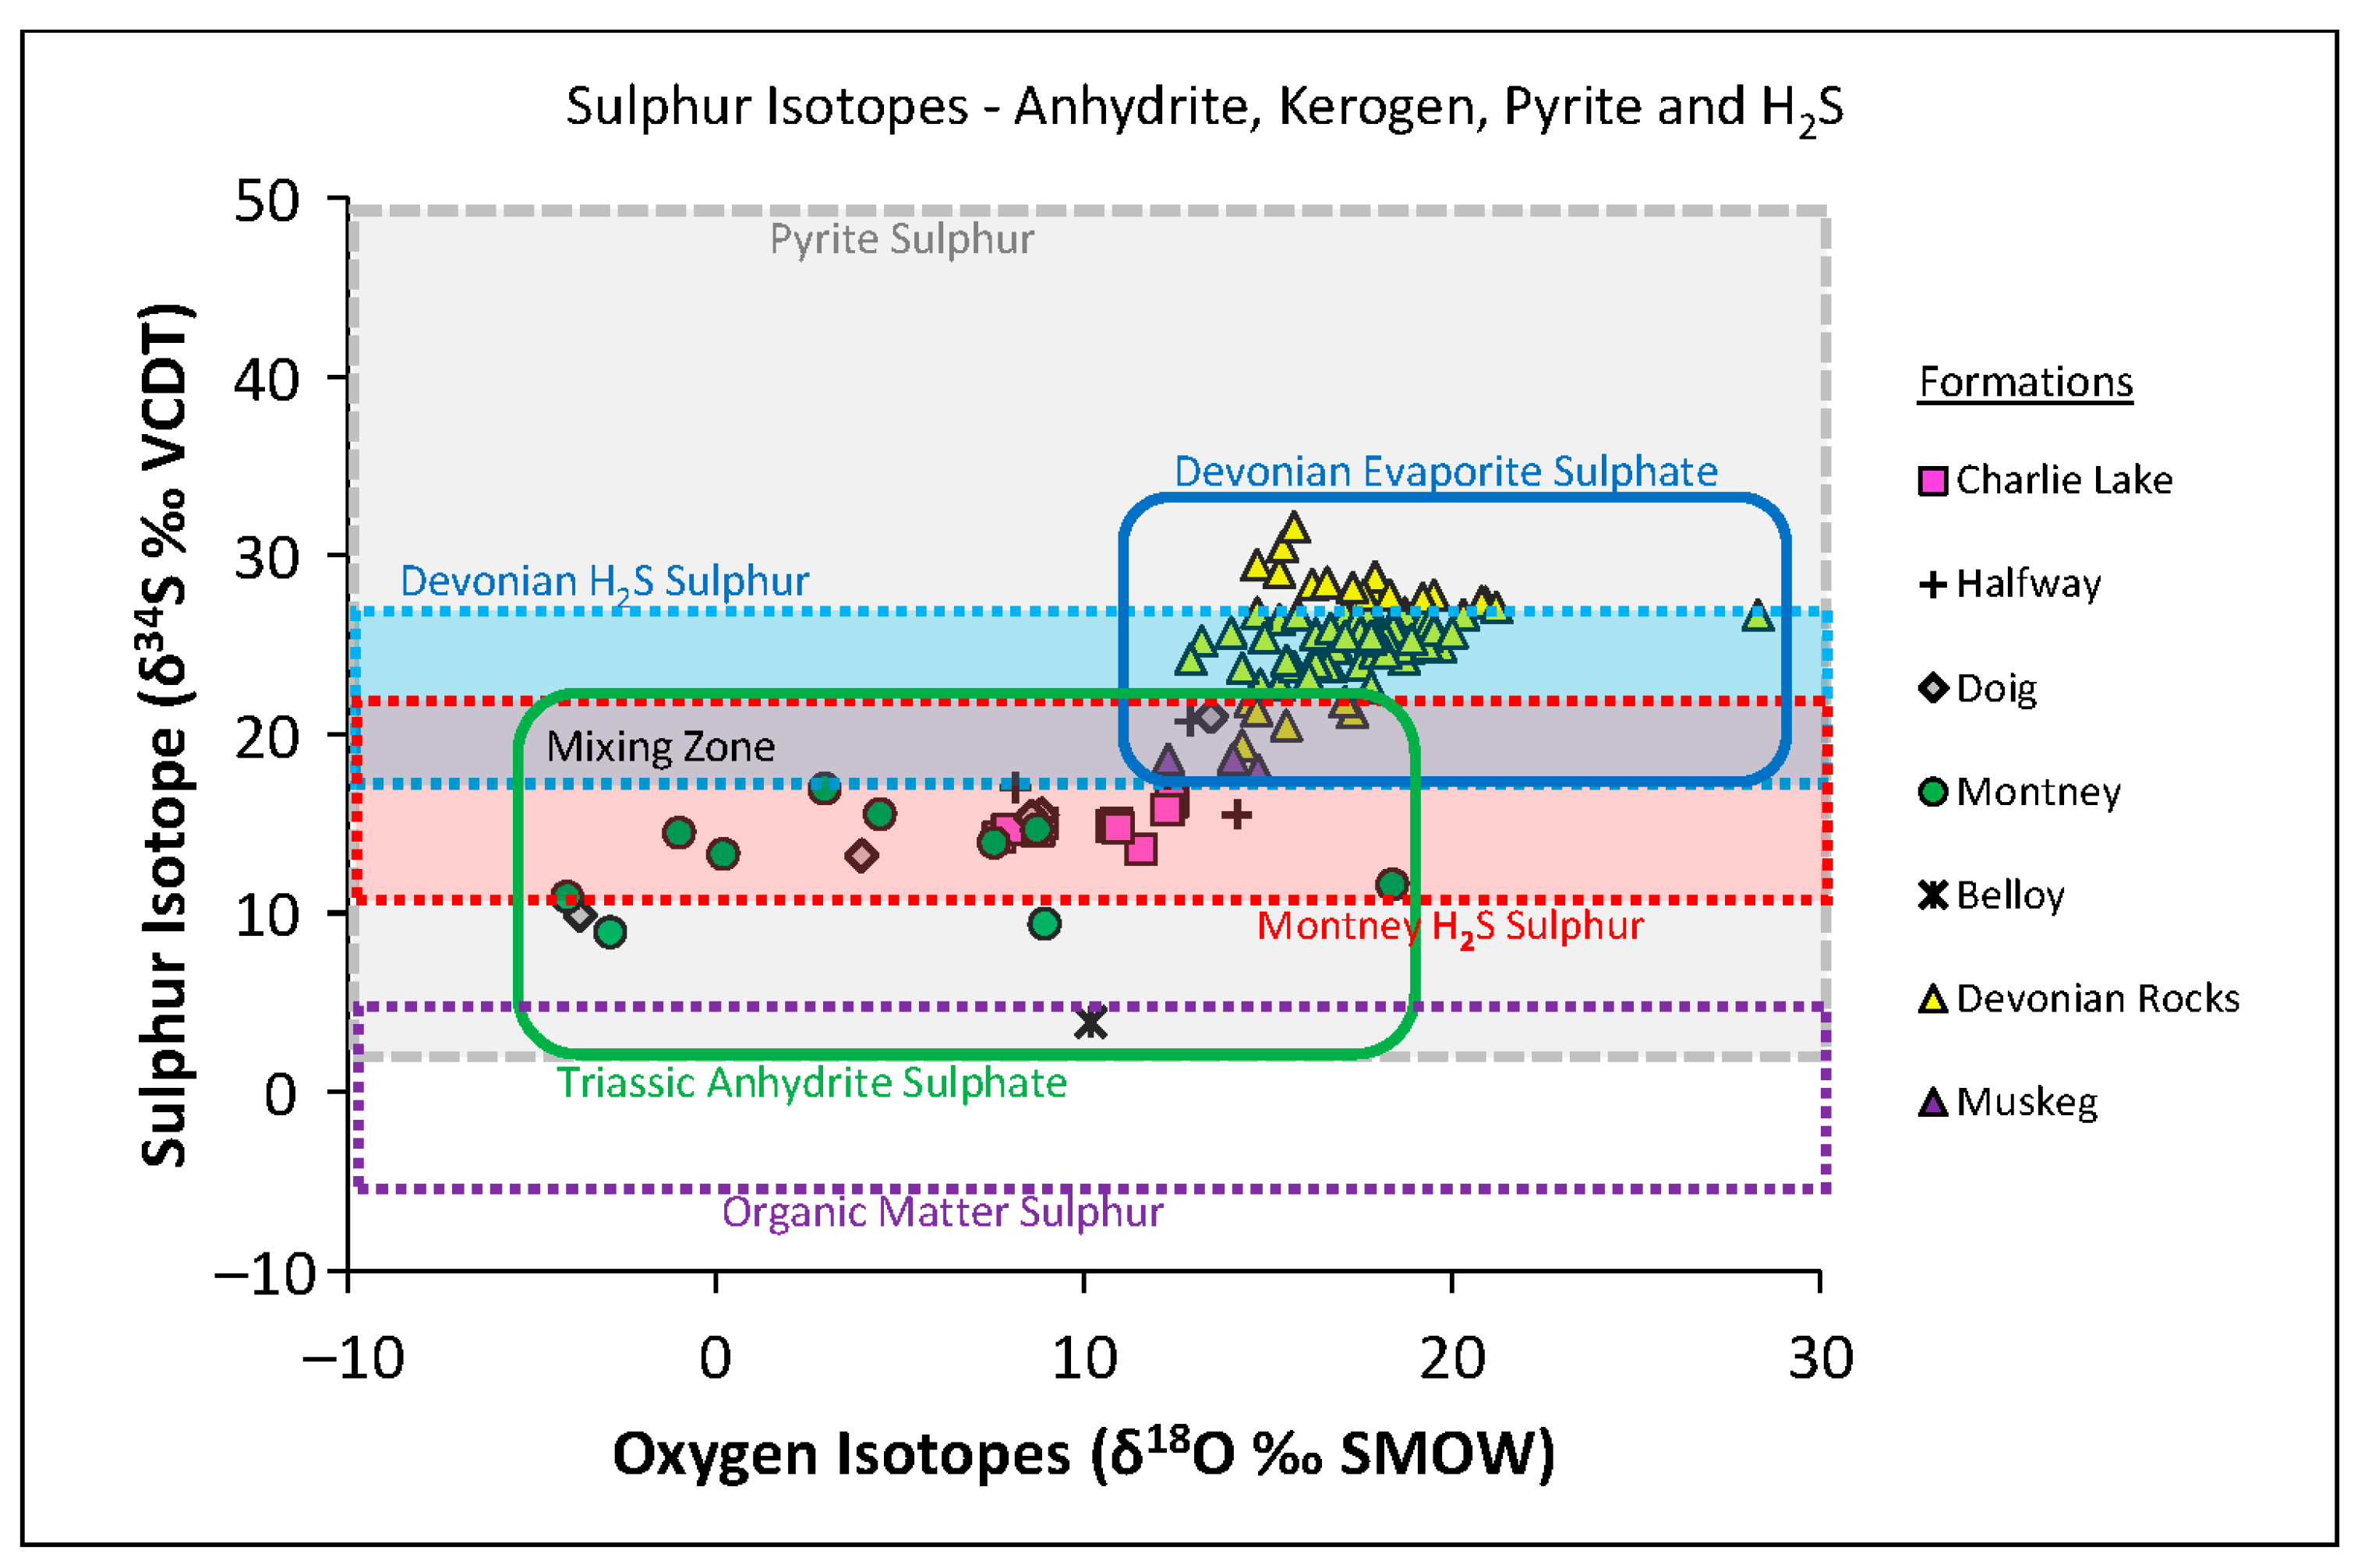
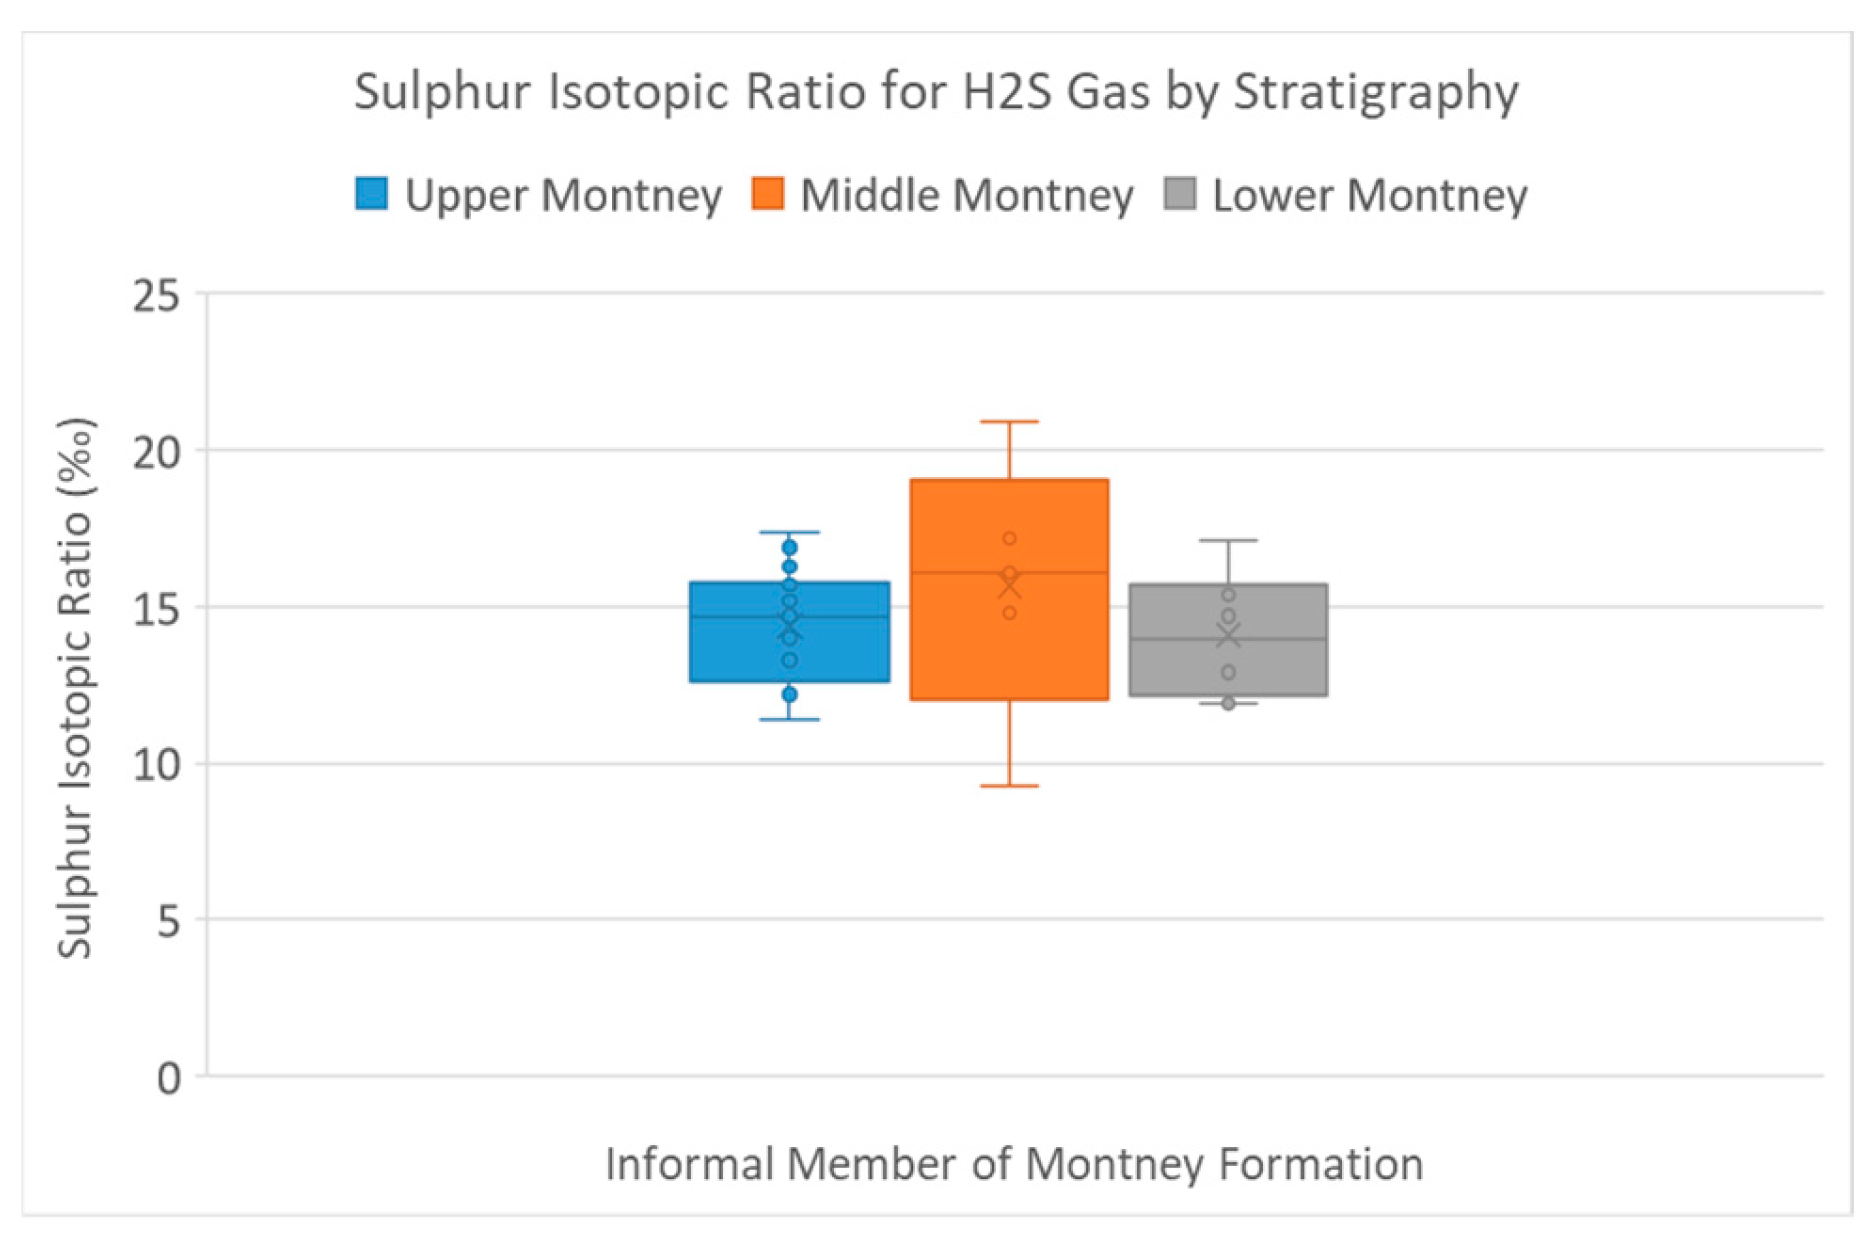
4.1. Isotopic Analyses

The isotopic signatures of the H2S gas in the Montney Formation in British Columbia range between 9.3 and 17.4‰. There is no statistically significant difference in the isotopic ranges between the upper, middle, and lower Montney members (Figure 7) which is contrary to anecdotal evidence provided by some Montney operators. This H2S isotopic range is similar to the sulphur isotopic ratios for Triassic anhydrite, which range between 8.9 and 20.98‰ (Figure 5). The sulphur isotopic ratio for anhydrite in Devonian rocks ranges between 17.1 and 34‰, and when plotted with oxygen isotopic ratio shows a distinct signature from that of anhydrite in Triassic rocks (Figure 5). There is a natural division or separation of sulphur/oxygen isotopic data that occurs between Triassic and Devonian anhydrite minerals due to the difference in sulphur and oxygen ratios in the seawater at the time of anhydrite formation [24]. This difference is also seen within the data from this study and published data from the WCSB (Figure 5), with the Triassic anhydrite (squares, crosses, circles, asterisk, and diamonds within green box) being isotopically lighter (34S-depleted) than Devonian anhydrite (yellow and purple triangles in blue box).

4.2. TSR versus BSR Processes

The sulphur isotopic ratio of the H2S from the Montney Formation is more similar to the sulphur ratios in the Triassic anhydrite than in Devonian rocks, which indicates the Triassic rocks, such as the Charlie Lake Formation, are the more likely sources of sulphur, and not the Devonian rocks as seen in the Montney Formation in Alberta. The isotopic ratio for sulphur is also too enriched in δ34S to have been generated by BSR. The sulphur ratio is generally much lighter (up to 30‰ less) in BSR-generated H2S gas than in TSR processes [5]. The basin modelling by [58] indicates the Montney Formation has been buried to a depth up to 8500 m and the reservoir is more likely to have developed TSR-generated H2S gas as the Montney Formation entered the oil window, while co-generating hydrocarbons and H2S gas when the reservoir temperatures were well above 70–80 °C. Most bacterial sulphate reduction reactions cease above 60 °C [5].
Sulphur isotopic data from the H2S gas in Mississippian- and Devonian-aged reservoirs of Burnt Timber and Crossfield East gas fields, Alberta, range between 18 and 25.9‰ [19]. This is similar to the sulphur isotopic ratio for Devonian anhydrite and indicates that Devonian TSR-generated H2S gas is generated by Devonian sulphur sourced from anhydrite. The majority of the sulphur isotopic data from the H2S of the Montney producers shows a signature that is too light (34S depleted) to be sourced from the deeper Devonian sour pools. However, data from this study have shown that there are few data points for isotopically lighter (34S-depleted) Devonian samples (purple circles; Muskeg Formation; Figure 5), as well as two isotopically heavier Triassic samples (Halfway and Doig samples; Figure 5), which results in a transitional zone between the two data sets (i.e., 18–21‰). Similarly, there is an overlap between H2S gas sulphur isotope data from the Triassic (red-dashed box) and the Devonian (blue-dashed box) within the same isotopic range for sulphur at 18–21‰ (Figure 5). Sour wells that have H2S gas sulphur isotope values in the 18–20‰ may represent either (1) the original Devonian or Triassic sulphur (anhydrite) sources that are in the transitional zone, or (2) a mixture of H2S gas sourced from the Triassic and Devonian sour reservoirs. In the data set analysed, this is the exception and not the rule.
The broad range for the isotopic ratios for the pyritic sulphur (2.9‰ to 49.9‰) indicates that the pyrite may have been microbially derived during the deposition of the Montney Formation siltstone (i.e., [63]), as part of the TSR process (i.e., [64]) or may be due to the microbial sulfate reduction (i.e., 2.9‰) process [65]. The large range of the sulphur isotopic ratio in the syndepositional, microbially derived pyrite is governed by local to regional factors [66] and would require a study of its own using SEM and in situ laser ablation techniques. However, in the context of this study, the pyrite was measured to identify if there is a narrow range of values and if it could be the source of the H2S gas through oxidation processes where oxygen is brought into the reservoir like hydraulic stimulation. The results indicate the broad range of isotopic ratio values cannot be used to determine if the sulphur is the source of the H2S gas. Furthermore, a continuous supply of dissolved oxygen within frack water or from meteoric groundwater would be needed, as the reservoir is under reducing conditions, in order to oxidize pyrite and generate sulphate ions for H2S formation. Most frack water only provides a limited supply of oxygen during hydraulic-fracturing operations and this would only result in an initial H2S spike that would then rapidly decline. Most wells in the Montney Formation that do sour do not show a rapid decline in H2S concentration (i.e., Figure 5, [67]). It is also unlikely that oxygenated groundwater would be present at the current reservoir depths of the producing Montney wells in BC. In this study, the Montney Formation contains none to very low concentrations (<1 ppm) of organic sulphur that is associated with the kerogen. The trace amount of organic sulphur in the Montney Formation kerogen would be available in insufficient volumes to provide continuous H2S gas production. The sulphur ratios for the organic sulphur from kerogen indicate lighter isotopic signatures (−6 to 6‰) compared to the sulphur ratios of the anhydrite and H2S gas. The difference between the Montney H2S gas sulphur and the kerogen sulphur indicates that the organic sulphur is also not the source of the H2S gas (Figure 5).
Overall, the cross-plot of sulphur and oxygen isotopes for the anhydrite minerals shows distinct signatures for Triassic- and Devonian-source anhydrite sulphur (Figure 5), and this distinction is also evident in the sulphur isotopic signature of the H2S from Triassic and Devonian sour reservoirs. The strong overlap of Triassic H2S sulphur isotopes with Triassic anhydrite sulphur ratio (i.e., 9.0–20.0‰) is strong evidence that the sulphur is being sourced from Triassic evaporites (i.e., anhydrite; 8.9 and 20.98‰), which is derived from the isotopically lighter (34S-depleted) Triassic seawater and not purely from a Devonian evaporite source. A H2S sulphur signature below 17–18‰ for Montney Formation sour wells indicates the H2S is being sourced from a Triassic formation and not a Devonian formation. Sour Montney Formation wells that have sulphur signatures in the 18–21‰ range are potentially from a mixture of Triassic and Devonian H2S gas or from the lighter isotopically Devonian Muskeg Formation. There is no evidence that sulphur isotopic ratios will fractionate during sulphate or H2S migration which would result in a lighter sulphur isotopic signature. There is no mechanism in place that would cause the sulphur ratio to change during migration in the Montney play area (i.e., BSR, molecular sieve processes). The range of sulphur ratios measured in the H2S gas from Montney Formation and Devonian-aged sour wells suggest that the H2S gas has not fractionated and represents the sulphur signature of the anhydrite sulphur source. This has also been seen in other studies on H2S generation in WCSB (i.e., [13,19]).

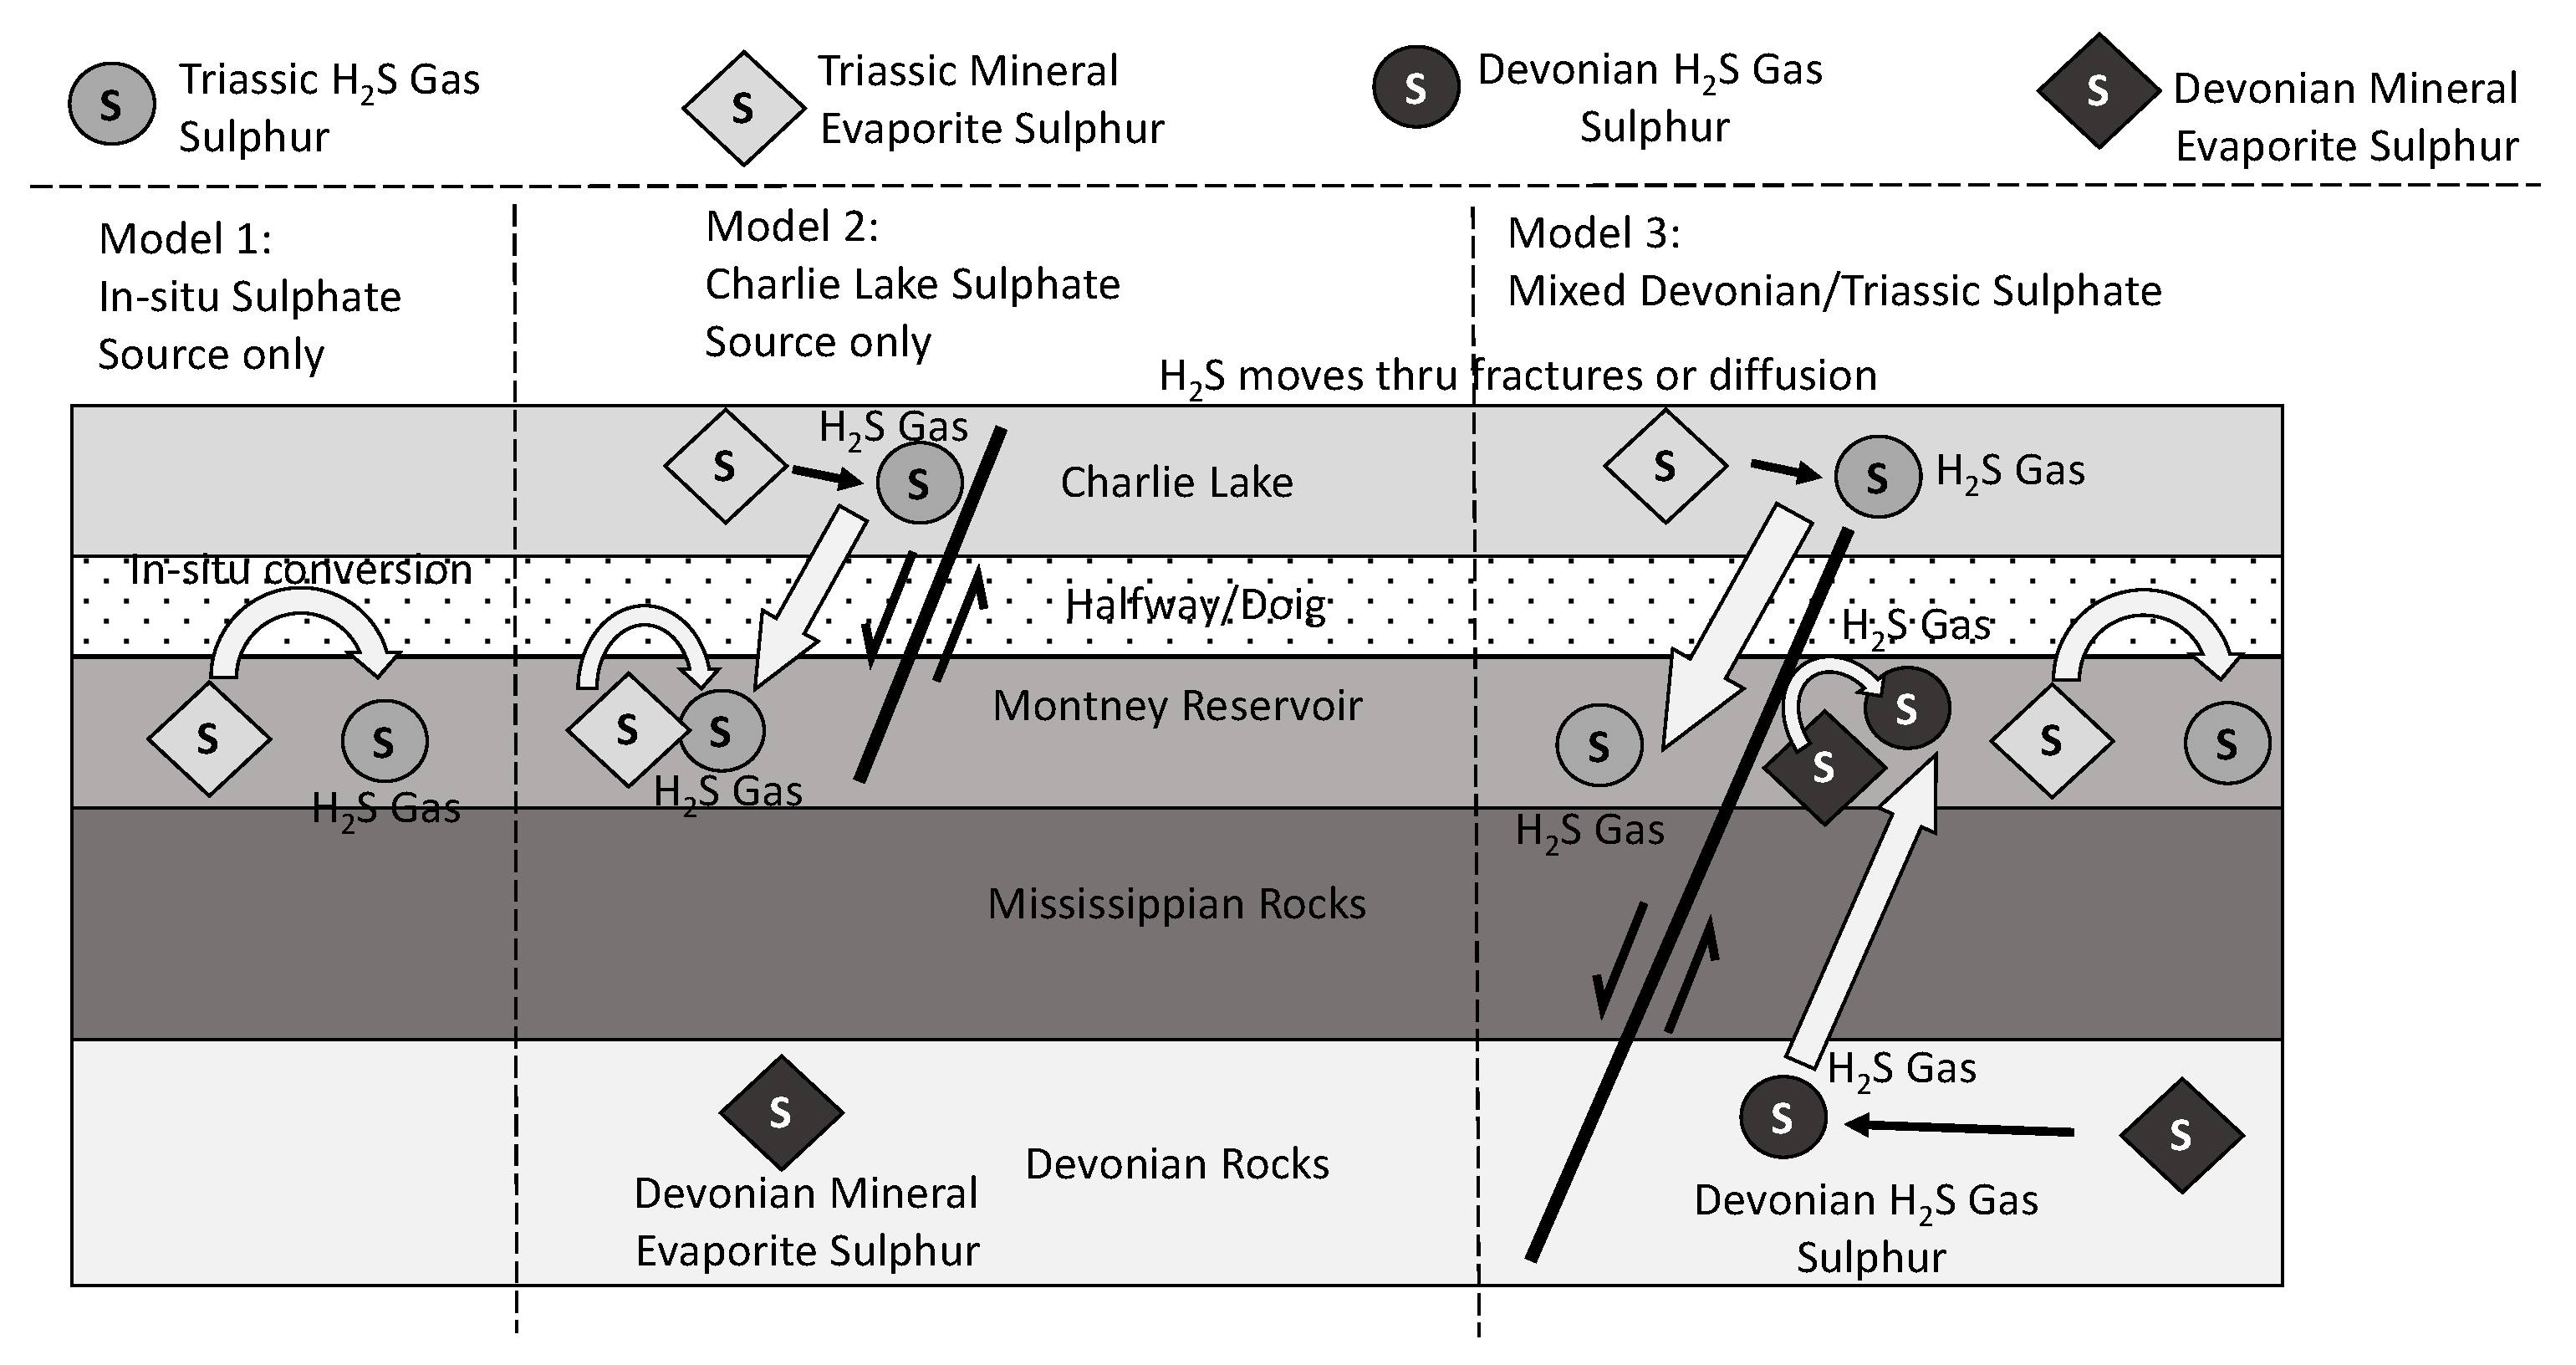
4.3. H2S Gas Generation Model

A H2S gas generation model has been developed from the isotopic, XRD, and SEM-EDX data (Figure 11). Model 1 represents an in situ conversion, which would be the conversion of anhydrite that is derived from the Montney Formation (i.e., syn-depositional anhydrite). This model is plausible as the Montney Formation does contain small amounts of anhydrite (<5%); however, the presence of H2S would be more evenly distributed across multi-well pads and we would not observe localised changes between sour and sweet lateral wells on the same pad as the syn-depositional anhydrite would be more laterally continuous. This is also true for any secondary migration of H2S from a downdip source; the H2S would be laterally continuous across multi-well pads and this is not the case in BC. Figure 2 clearly shows localised changes in sour and sweet wells on single multi-well pads. Model 2 is structurally controlled through faults and fractures, with anhydrite or sulphate ions derived from sulphate minerals within the Charlie Lake Formation migrating into the Montney Formation through local fracture/fault systems via circulating groundwater flow (i.e., prior to hydrocarbon charging and overpressuring). The H2S gas would form as hydrocarbons generated within the Montney Formation react with the migrated sulphate ions. A similar model has been shown for the migration of sulphate ions from the Charlie Lake and into the Halfway Formation [38], and between the Charlie Lake and Montney formations within the Fort St. John Graben structures [30]. SEM and EDX analyses have shown that the anhydrite texture is massive in the Montney Formation (Figure 8). The texture appears to be part of fracture fill cement (secondary texture) and did not form from sediment transportation or evaporative processes (primary textures). As this analysis is performed on drill cuttings, this observation may be due to contamination of the drill cuttings from the Charlie Lake Formation above; however, the texture seen in the anhydrite in the Montney Formation (secondary texture) is not the same as the anhydrite in the Charlie Lake Formation (primary, evaporite textures; Figure 9). The anhydrite that is found within the Montney Formation is being sourced from another formation through solution and redeposition as a cement from a sulphate-rich solution prior to hydrocarbon generation. Hydrogen sulphide gas then is generated locally at the anhydrite-cemented fractures, as it reacts with the hydrocarbons being generated in the Montney Formation. This would explain the localised souring of horizontal wells adjacent to sweet horizontal wells on the same multi-well pad (Figure 2) and aligns with the H2S generation Model 2 in Figure 11. The sulphur and oxygen isotopic data suggest the anhydrite in the Montney Formation is from a Triassic source and most likely from the Charlie Lake Formation, or potentially from the Doig Formation, which contains anhydrite within the phosphatic nodules. The isotopic signature of the H2S gas that is produced from the Montney Formation is also of similar ratio to the Triassic anhydrite, and it appears, in most cases, the Triassic anhydrite is the source of the sulphur and generation of H2S gas. Model 3 is a mixing of sulphur ions from Triassic and Devonian sources, and structural controls would need to include a deeper connection with Devonian sources. This results in a heavier (34S-enriched) sulphur isotopic signature in the H2S compared to Model 2. Only sour Montney Formation producing wells that contain sulphur isotopic ratios above 17‰ for H2S may have been derived from a mixture of isotopically heavier H2S gas from Devonian rocks with the isotopically lighter (34S-depleted) Triassic H2S gas. [14] show evidence that dissolved sulphate ions have migrated from the Devonian into the Montney Formation within Alberta and deposited as anhydrite in fractures and vugs, but similar evidence is not observed in this study for the Montney Formation in British Columbia.

4.4. Future Work

Future work should include determining the sulphate concentration and distribution within the Triassic rocks and mapping this distribution with structural features identified by 2-D and 3-D seismic data. Risk modelling would then show areas where sulphate is most likely controlled by structural lineaments, faults, and fractures that connect the Montney reservoir with the overlying Triassic sulphate sources in the Doig and Charlie Lake formations. Only when the Montney Formation contains sulphate ions/minerals and has been buried to adequate depths/temperatures (i.e., 100–120 °C) will the producing well in the Montney Formation sour due to TSR processes.

5. Conclusions

Isotopic analyses of sulphate-rich minerals and H2S gas in both Devonian and Triassic rocks coupled with XRD and SEM-EDX analyses provides strong evidence of a Triassic rock source for the H2S in the Triassic Montney Formation in BC. The geological model, that best fits the observations of mixed sour and sweet wells on multi-well pads, textural features, and isotopic ratios is Model 2 where the structural features connect the overlying Triassic sulphate-rich rocks with the Triassic Montney Formation (BC). This is contrary to the interpretation made on the Montney Formation in Alberta where the source of the H2S is from deeper Devonian sources. Future research should include mapping structural features to validate the geological model presented in this study. The workflow used in this study can be adopted in any field that is showing unexpected souring to identify the source of the H2S gas and reduce operational risks.

Author Contributions

Conceptualization, M.B. and G.C.; methodology, G.C.; formal analysis, A.B. and A.S.; investigation, G.C.; resources, M.B.; data curation, P.L.S.; writing—original draft preparation, G.C.; writing—review and editing, M.B., P.L.S., A.B., and A.S.; supervision, M.B.; project administration, M.B.; funding acquisition, M.B. All authors have read and agreed to the published version of the manuscript.

Funding

This research was funded by Natural Sciences and Engineering Research Council of Canada (NSERC), grant number 533228-2018 and Geoscience BC, Project ID 2017-014..

Data Availability Statement

The data supporting reported results can be found within this manuscript.

Conflicts of Interest

The authors declare no conflicts of interest.

Appendix

Table A1. Sulphur and oxygen isotopic data for minerals and organic matter from this study. * are repeat of same sample. OM is organic matter.
FormationAgeSample IDWell LicenceLocationδ34S (VCDT)δ18O (SMOW)Sulphur Source
Charlie LakeTriassicPBN-130,876WCSB14.27.69anhydrite
Charlie LakeTriassicPBN-230,876WCSB14.68.75anhydrite
Charlie LakeTriassicPBN-330,876WCSB14.77.94anhydrite
Charlie LakeTriassicPBN-430,876WCSB158.86anhydrite
Charlie LakeTriassic29,453-129,453WCSB16.2212.38anhydrite
Charlie LakeTriassic29,453-229,453WCSB13.5911.55anhydrite
Charlie LakeTriassic3944-13944WCSB14.8410.78anhydrite
Charlie LakeTriassic3944-229,453WCSB15.0210.88anhydrite
Charlie LakeTriassic3944-329,453WCSB15.7712.26anhydrite
Charlie LakeTriassic8183-18183WCSB14.7710.91anhydrite
HalfwayTriassicPBN-530,876WCSB178.14anhydrite
HalfwayTriassic29,453-329,453WCSB15.5114.16anhydrite
HalfwayTriassic3944-429,453WCSB20.7312.88anhydrite
Doig SiltTriassicPBN-630,876WCSB13.23.96anhydrite
Doig SiltTriassic29,453-429,453WCSB15.58.85anhydrite
Doig SiltTriassic3944-529,453WCSB20.9813.45anhydrite
Doig ShaleTriassicPBN-730,876WCSB9.9−3.69anhydrite
Doig ShaleTriassic29,453-529,453WCSB15.418.56anhydrite
Montney (upper)Triassic32,908-132,908WCSB9.42-anhydrite
Montney (upper)Triassic26,668-126,668WCSB8.92−2.87anhydrite
Montney (upper)Triassic3944-63944WCSB13.947.56anhydrite
Montney (upper)TriassicPBN-1030,876WCSB14.5−1.00anhydrite
Montney (upper)Triassic29,483-629,453WCSB14.78.73anhydrite
Montney (upper)TriassicPBN-1130,876WCSB13.5-anhydrite
Montney (upper)TriassicPBN-12A30,876WCSB15.5-anhydrite
Montney (middle)Triassic29,453-729,453WCSB15.554.46anhydrite
Montney (middle)Triassic3944-73944WCSB16.962.95anhydrite
Montney (lower)TriassicPBN-1330,876WCSB13.30.2anhydrite
Montney (lower)Triassic29,453-829,453WCSB11.5918.37anhydrite
Montney (lower)Triassic3944-83944WCSB10.92−4.04anhydrite
BelloyPermian3944-93944WCSB3.9110.19anhydrite
MuskegDevonian8183-28183WCSB18.612.29anhydrite
MuskegDevonian8183-38183WCSB18.6214.05anhydrite
MuskegDevonian8183-48183WCSB18.0214.72anhydrite
MuskegDevonian8183-2 *8183WCSB18.6-anhydrite
MuskegDevonian8183-3 *8183WCSB18.7-anhydrite
MuskegDevonian8183-4 *8183WCSB17.7-anhydrite
Montney (upper)Triassic32,908-232,908WCSB−4.685.26OM
Montney (upper)Triassic32,908-332,908WCSB1.812.2OM
Montney (upper)Triassic26,668-226,668WCSB−6.9220.28OM
Montney (upper)TriassicPBN9-130,876WCSB−3.67.3OM
Montney (upper)TriassicPBN9-230,876WCSB6.3917.82OM
Montney (upper)TriassicPBN9-330,876WCSB49.9-pyrite
Montney (upper)Triassic32,908-432,908WCSB2.9-pyrite
Montney (upper)Triassic26,668-426,668WCSB21.64-pyrite

References

  1. Guidotti, T.L. Hydrogen Sulphide. Occup. Med. 1996, 46, 367–371. [Google Scholar] [CrossRef]
  2. Burgers, W.; Northrop, P.; Kheshgi, H.; Valencia, J. Worldwide development potential for sour gas. Energy Procedia 2011, 4, 2178–2184. [Google Scholar] [CrossRef]
  3. Machel, H.G. Some aspects of diagenetic sulphate-hydrocarbon redox reactions. In Diagenesis of Sedimentary Sequences; Geological Society Special Publication No. 36; Marshall, J.D., Ed.; The Geological Society: Oxford, UK, 1987; pp. 15–28. [Google Scholar] [CrossRef]
  4. Hagar, H.; Foroozesh, J.; Kumar, S.; Zivar, D.; Banan, N.; Dzulkarnain, I. Microbial H2S generation in hydrocarbon reservoirs: Analysis of mechanisms and recent remediation technologies. J. Nat. Gas Sci. Eng. 2022, 106, 104729. [Google Scholar] [CrossRef]
  5. Hubbard, C.G.; Cheng, Y.; Engelbrekston, A.; Druhan, J.L.; Li, L.; Ajo-Franklin, J.B.; Coates, J.D.; Conrad, M.E. Isotopic insights into microbial sulfur cycling in oil reservoirs. Front. Microbiol. 2014, 5, 480. [Google Scholar] [CrossRef]
  6. Machel, H.G. Bacterial and thermochemical sulfate reduction in diagenetic settings—Old and new insights. Sediment. Geol. 2001, 140, 143–175. [Google Scholar] [CrossRef]
  7. Nelson, B.; Eglinton, T.; Seewald, J.; Vairavamurthy, M.; Miknis, F. Transformations in organic sulfur speciation during maturation of Monterey shale: Constraints from laboratory experiments. In Geochemical Transformations of Sedimentary Sulfur; Murthy, A., Vairavamurthy, M., Schoonen, A.A., Eglinton, T.I., Luther, G.W., III, Manowitz, B., Eds.; American Chemical Society: Washington, DC, USA, 1995; Volume 612. [Google Scholar] [CrossRef]
  8. Pirzadeh, P.; Lesage, K.; Marriott, R. Hydraulic Fracturing Additives and the Delayed Onset of Hydrogen Sulfide in Shale Gas. Energy Fuels 2014, 28, 4993–5001. [Google Scholar] [CrossRef]
  9. Orr, W.L. Changes in sulfur content and isotopic ratios of sulfur during petroleum maturation—Study of the Big Horn Basin Paleozoic oils. Am. Assoc. Pet. Geol. Bull. 1974, 50, 2295–2318. [Google Scholar] [CrossRef]
  10. Goldstein, T.; Aizenshtat, Z. Thermochemical sulfate reduction a review. J. Therm. Anal. 1994, 42, 241–290. [Google Scholar] [CrossRef]
  11. Kirste, D.; Desrocher, S.; Spence, B.; Hoyne, B.; Tsang, B.; Hutcheon, I. Fluid flow, water chemistry, gas chemistry and diagenesis in the subsurface Triassic in Alberta and British Columbia. Bull. Can. Pet. Geol. 1997, 45, 742–764. [Google Scholar] [CrossRef]
  12. Krouse, H. Sulfur isotope studies and their role in petroleum exploration. J. Geochem. Explor. 1977, 7, 189–211. [Google Scholar] [CrossRef]
  13. Krouse, H.; Viau, C.; Eliuk, L.; Ueda, A.; Halas, S. Chemical and isotopic evidence of thermochemical sulphate reduction by light hydrocarbon gases in deep carbonate reservoirs. Nature 1988, 333, 415–419. [Google Scholar] [CrossRef]
  14. Liseroudi, M.; Ardakani, O.; Sanei, H.; Pedersen, P.; Stern, R.; Wood, J. Origin of sulfate-rich fluids in the Early Triassic Montney Formation, Western Canadian Sedimentary Basin. Mar. Pet. Geol. 2020, 114, 104236. [Google Scholar] [CrossRef]
  15. Machel, H.G. Facies and Diagenesis of the Upper Devonian Nisku Formation in the Subsurface of Central Alberta. Ph.D. Thesis, Dept of Geological Sciences, McGill University, Montreal, QC, Canada, 1985. Available online: https://escholarship.mcgill.ca/concern/theses/rn301203s (accessed on 15 May 2024).
  16. Simpson, G. Sulfate Reduction and Fluid Chemistry of the Devonian Leduc and Nisku Formations in South-Central Alberta. Ph.D. Thesis, Department of Geology and Geophysics, The University of Calgary, Calgary, AB, Canada, 1999. Available online: https://prism.ucalgary.ca (accessed on 15 May 2024).
  17. Whittaker, S.; Mountjoy, E. Diagenesis of an Upper Devonian Carbonate-Evaporite Sequence: Birdbear Formation, Southern Interior Plains, Canada. J. Sediment. Res. 1996, 66, 965–975. [Google Scholar] [CrossRef]
  18. Worden, R.; Smalley, S.; Cross, M. The Influence of Rock Fabric and Mineralogy on Thermochemical Sulfate Reduction: Khuff Formation, Abu Dhabi. J. Sediment. Res. 2000, 70, 1210–1221. [Google Scholar] [CrossRef]
  19. Yang, C.; Hutcheon, I.; Krouse, H. Fluid inclusion and stable isotopic studies of thermochemical sulphate reduction from Burnt Timber and Crossfield East gas fields in Alberta, Canada. Bull. Can. Pet. Geol. 2001, 49, 149–164. [Google Scholar] [CrossRef]
  20. Zhu, G.; Zhang, S.; Liang, Y.; Dai, J. Isotopic evidence of TSR origin for natural gas bearing high H2S contents within the Feixianguan Formation of the northeastern Sichuan Basin, southwestern China. Sci. China Ser. D Earth Sci. 2005, 48, 1960–1971. [Google Scholar] [CrossRef]
  21. Boschetti, T.; Cortecci, G.; Toscani, L.; Iacumin, P. Sulfur and oxygen isotope compositions of Upper Triassic sulfates from northern Apennines (Italy): Paleogeographic and hydrogeochemical implications. Geol. Acta 2011, 9, 129–147. [Google Scholar] [CrossRef]
  22. Claypool, G.; Holser, W.; Kaplan, I.; Sakai, H.; Zak, I. The age of sulphur and oxygen isotopes in Marine Sulphate and their Mutual Interpretation. Chem. Geol. 1980, 28, 199–260. [Google Scholar] [CrossRef]
  23. Kampschulte, A.; Strauss, H. The sulfur isotopic evolution of Phanerozoic seawater based on the analysis of structurally substituted sulfate in carbonates. Chem. Geol. 2004, 204, 255–286. [Google Scholar] [CrossRef]
  24. Newton, R.; Bottrell, S. Stable isotopes of carbon and sulphur as indicators of environmental change: Past and present. J. Geol. Soc. 2007, 164, 691–708. [Google Scholar] [CrossRef]
  25. Veizer, J.; Ala, D.; Azmy, K.; Bruckschen, P.; Buhl, D.; Bruhn, F.; Carden, G.; Diener, A.; Ebneth, S.; Godderis, Y.; et al. 87Sr/86Sr, δ13C and δ18O evolution of Phanerozoic seawater. Chem. Geol. 1999, 161, 59–88. [Google Scholar] [CrossRef]
  26. Morad, D.; Nader, F.; Morad, C.; Rossi, C.; Gasparrini, M. Limited thermochemical sulfate reduction in hot, anhydritic, sour gas carbonate reservoirs: The Upper Jurassic Arab Formation, United Arab Emirates. Mar. Pet. Geol. 2019, 106, 30–41. [Google Scholar] [CrossRef]
  27. Energy Utility Board, Alberta. EUB Completes Groundwork for Future of Sour Gas Development in Alberta Public Safety and Sour Gas Committee Helps Alberta Maintain World’s Tightest Sour Gas Rules; EUB: Calgary, AB, Canada, 2007; Available online: https://www.alberta.ca/ (accessed on 16 April 2024).
  28. NRCan. British Columbia’s Shale and Tight Resources. Online Natural Resources, Canadian Government Website. 2017. Available online: https://natural-resources.canada.ca/energy/energy-sources-distribution/natural-gas/shale-tight-resources-canada/british-columbias-shale-and-tight-resources/17692 (accessed on 28 January 2024).
  29. NEB (National Energy Board). Canada’s Energy Future 2018; Supplement: Natural gas production; National Energy Board: Calgary, AB, Canada, 2018; 12p. [Google Scholar]
  30. Desrocher, S.; Hutcheon, I.; Kirste, D.; Henderson, C.M. Constraints on the generation of H2S and CO2 in the subsurface Triassic, Alberta Basin, Canada. Chem. Geol. 2004, 204, 237–254. [Google Scholar] [CrossRef]
  31. Meshoulam, A.; Ellis, G.S.; Ahmad, W.S.; Deev, A.; Sessions, A.L.; Tang, Y.; Adkins, J.F.; Liu, J.; Gilhooly, W.P., III; Aizenshtat, Z.; et al. Study of thermochemical sulfate reduction mechanism using compound specific sulphur isotope studies. Geochem. Cosmochim. Acta 2016, 188, 73–92. [Google Scholar] [CrossRef]
  32. Hunt, A.; Ratcliffe, J. Triassic stratigraphy, Peace River Area, Alberta and British Columbia, Canada. AAPG Bull. 1959, 43, 563–589. [Google Scholar] [CrossRef]
  33. Desrocher, S. Isotopic and Compositional Characterization of Natural Gases in the Lower and Middle Triassic Montney, Halfway, and Doig Formations, Alberta Basin. Master’s Thesis, University of Calgary, Calgary, AB, Canada, 1997; 218p. [Google Scholar]
  34. Zonneveld, J.-P.; Carrelli, G.; Riediger, C. Sedimentology of the Upper Triassic Charlie Lake, Baldonnel and Pardonet Formations from Outcrop Exposures in the Southern Trutch Region, Northeastern British Columbia. Bull. Can. Pet. Geol. 2004, 52, 343–375. [Google Scholar] [CrossRef]
  35. White, T.; Al-Aasm, I. Hydrothermal dolomitization of the Mississippian Upper Debolt Formation, Sikanni gas field, northeastern British Columbia, Canada. Bull. Can. Pet. Geol. 1997, 45, 297–316. [Google Scholar] [CrossRef]
  36. Davies, G. The Triassic of the Western Canada Sedimentary Basin: Tectonic and stratigraphic framework, paleogeography, paleoclimate and biota. Bull. Can. Pet. Geol. 1997, 45, 434–460. [Google Scholar] [CrossRef]
  37. Davies, G.R.; Moslow, T.F.; Sherwin, M.D. The Lower Triassic Montney Formation, west-central Alberta. Bull. Can. Pet. Geol. 1997, 45, 474–505. [Google Scholar] [CrossRef]
  38. Sharma, G. Paragenetic evolution in Peejay Field, British Columbia, Canada. Miner. Depos. 1969, 4, 346–354. [Google Scholar] [CrossRef]
  39. Harris, R.G. Sedimentology and Reservoir Characteristics of Triassic Doig Sand Bodies at West Stoddart and Cache Creek in Northeastern British Columbia. Master’s Thesis, University of British Columbia, Vancouver, BC, Canada, 2000; 205p. [Google Scholar]
  40. Markhasin, B. Sedimentology and Stratigraphy of the Lower Triassic Montney Formation, Subsurface of Northwestern Alberta. Master’s Thesis, University of Calgary, Calgary, AB, Canada, 1997; 153p. [Google Scholar] [CrossRef]
  41. Furlong, C.M.; Gingras, M.K.; Moslow, T.F.; Zonneveld, J.-P. The Sunset Prairie Formation: Designation of a new Middle Triassic formation between the Lower Triassic Montney Formation and Middle Triassic Doig Formation in the Western Canada Sedimentary Basin, northeast British Columbia. Bull. Can. Pet. Geol. 2018, 66, 193–214. [Google Scholar] [CrossRef]
  42. Golding, M.L.; Orchard, M.J.; Zonneveld, J.-P.; Wilson, N.S.F. Determining the age and depositional model of the Doig phosphate zone in northeastern British Columbia using conodont biostratigraphy. Bull. Can. Pet. Geol. 2015, 63, 143–170. [Google Scholar] [CrossRef]
  43. Gibson, D.W.; Barclay, J.E. Middle Absaroka Sequence—The Triassic stable craton. In Western Canada Sedimentary Basin—A Case History; Ricketts, B.D., Ed.; Canadian Society of Petroleum Geologists: Calgary, AB, Canada, 1989; pp. 219–232. [Google Scholar]
  44. Embry, A.F.; Gibson, D.W. T-R sequence analysis of the Triassic succession of the Western Canada Sedimentary Basin. In Proceedings of the Oil and Gas Forum ’95—Energy from Sediments, Calgary, AB, Canada, 28–29 March 1995; Geological Survey of Canada: Calgary, AB, Canada, 1995; pp. 25–32. [Google Scholar]
  45. Hardenbol, J.; Thierry, J.; Farley, M.B.; Jacquin, T.; de Graciansky, P.-C.; Vail, P.R. Mesozoic and Cenozoic sequence chronostratigraphic framework of European basins. In Mesozoic and Cenozoic Sequence Stratigraphy of European Basins; De Graciansky, P.-C., Hardenbol, J., Jacquin, T., Vail, P.R., Eds.; SEPM Special Publication 60; Society for Sedimentary Geology: Tulsa, OK, USA, 1999. [Google Scholar] [CrossRef]
  46. Davies, G.R.; Watson, N.; Moslow, T.F.; MacEachern, J.A. Regional subdivisions, sequences, correlations and facies relationships of the lower Triassic Montney Formation, west-central Alberta to northeastern British Columbia, Canada—With emphasis on role of paleostructure. Bull. Can. Pet. Geol. 2018, 66, 23–92. [Google Scholar]
  47. Edwards, D.E.; Barclay, J.E.; Gibson, D.W.; Kvill, G.E.; Halton, E. Triassic strata of the Western Canada Sedimentary Basin. In Geological Atlas of the Western Canada Sedimentary Basin; Mossop, G.D., Shetsen, I., Eds.; Canadian Society of Petroleum Geologists and the Alberta Research Council: Calgary, AB, Canada, 1994; pp. 259–275. [Google Scholar]
  48. Walsh, W.; Adams, C.; Kerr, B.; Korol, J. Regional “Shale Gas” Potential of the Triassic Doig and Montney Formations, Northeastern British Columbia: Petroleum Geology Open File 2006-02; British Columbia Ministry of Energy Mines and Petroleum Resources: Victoria, BC, Canada, 2006; 19p. [Google Scholar]
  49. Dixon, J. Triassic stratigraphy in the subsurface of the plains area of Dawson Creek (94A) and Charlie Lake (94A) map areas, northeast British Columbia. Bull. Geol. Surv. Can. 2009, 595, 78. [Google Scholar] [CrossRef]
  50. Chalmers, G.R.L.; Bustin, R.M. Geological evaluation of Halfway-Doig-Montney hybrid gas shale-tight gas reservoir, northeastern British Columbia. Mar. Pet. Geol. 2012, 38, 53–72. [Google Scholar] [CrossRef]
  51. Gonzalez, P.; Furlong, C.; Gingras, M.; Payter, T.; Zonneveld, J.P. Depositional framework and trace fossil assemblages of the Lower Triassic Montney Formation, northeastern British Columbia, Western Canada Sedimentary Basin. Mar. Pet. Geol. 2022, 143, 105822. [Google Scholar] [CrossRef]
  52. Rohais, S.; Crombez, V.; Euzen, T.; Baudin, F. The Lower and Middle Triassic of Western Canada: Passive margin, back-arc or fore-arc geodynamic setting? In Proceedings of the Geoconvention 2016: Optimizing Resources, Calgary, AB, Canada, 7–11 March 2016. [Google Scholar]
  53. Silva, P.L.; Bustin, R.M. Basin-wide unconventional potential of the Doig Formation, Triassic of the Western Canada Sedimentary Basin. Mar. Pet. Geol. 2023, 155, 106394. [Google Scholar] [CrossRef]
  54. Kent, D.M. Paleogeographic evolution of the cratonic platform-Cambrian to Triassic. In Geological Atlas of the Western Canada Sedimentary Basin; Mossop, G.D., Shetsen, I., Eds.; Canadian Society of Petroleum Geologists and the Alberta Research Council: Calgary, AB, Canada, 1994; pp. 69–86. [Google Scholar]
  55. Dixon, J. Regional lithostratigraphic units in the Triassic Montney Formation of western Canada. Bull. Can. Pet. Geol. 2000, 48, 80–83. [Google Scholar] [CrossRef]
  56. Utting, J.; MacNaughton, R.B.; Zonneveld, J.-P.; Fallas, K.M. Palynostratigraphy, lithostratigraphy and thermal maturity of the Lower Triassic Toad and Grayling, and Montney formations of western Canada, and comparisons with coeval rocks of the Sverdrup basin, Nunavut. Bull. Can. Pet. Geol. 2005, 53, 5–24. [Google Scholar] [CrossRef]
  57. Berger, Z.; Boast, M.; Mushayandebvu, M. The contribution of integrated HRAM studies to exploration and exploitation of unconventional plays in North America. Part 1: The Peace River Arch. Reservoir 2008, 35, 42–47. [Google Scholar]
  58. Chalmers, G.R.L.; Lacerda Silva, P.; Bustin, A.A.; Sanlorenzo, A.; Bustin, R.M. Geology and Geochemistry of the Hydrocarbon Compositional Changes in the Triassic Montney Formation, Western Canada. Energies 2022, 15, 8677. [Google Scholar] [CrossRef]
  59. Berger, Z.; Boast, M.; Mushayandebvu, M. The contribution of integrated HRAM studies to exploration and exploitation of unconventional plays in North America. Part 2: Basement structures control on the development of the Peace River Arch’s Montney/Doig resource plays. Reservoir 2009, 36, 40–45. [Google Scholar]
  60. Munson, E.O.; Chalmers, G.R.L.; Bustin, R.M.; Li, K. Utilizing smear mounts for X-ray diffraction as a fully quantitative approach in rapidly characterizing the mineralogy of shale gas reservoirs. J. Unconv. Oil Gas Resour. 2016, 14, 22–31. [Google Scholar] [CrossRef]
  61. Rietveld, H.M. Line profiles of neutron powder-diffraction peaks for structure refinement. Acta Crystallogr. 1967, 22, 151–152. [Google Scholar] [CrossRef]
  62. Warren, J. Interpreting evaporite textures. In Evaporites: A Geological Compendium; Warren, J., Ed.; Springer: Cham, Switzerland, 2016; 1813p. [Google Scholar] [CrossRef]
  63. Decraene, M.; Marin-Carbonne, J.; Thomazo, C.; Brayard, A.; Bouvier, A.; Bomou, B.; Adatte, T.; Olivier, N. Pyrite iron isotope compositions track local sedimentation conditions through the Smithian-Spathian transition (Early Triassic, Utah, USA). Palaeogeog. Palaeoclim. Palaeoecol. 2023, 617, 111507. [Google Scholar] [CrossRef]
  64. Cui, H.; Kitajima, K.; Spicuzza, M.; Fournelle, J.; Denny, A.; Ishida, A.; Zhang, F.; Valley, J. Questioning the biogenicity of Neoproterozoic superheavy pyrite by SIMS. Am. Mineral. 2018, 103, 1362–1400. [Google Scholar] [CrossRef]
  65. Luo, K.; Zhou, J.; Ju, Y. A shift from BSR to TSR caused the formation of the Chipu Pb-Zn deposit, South China. Ore Geol. Rev. 2022, 144, 104845. [Google Scholar] [CrossRef]
  66. Pasquier, V.; Fike, D.A.; Halevy, I. Sedimentary pyrite sulfur isotopes track the local dynamics of the Peruvian oxygen minimum zone. Nat. Commun. 2012, 12, 4403. [Google Scholar] [CrossRef]
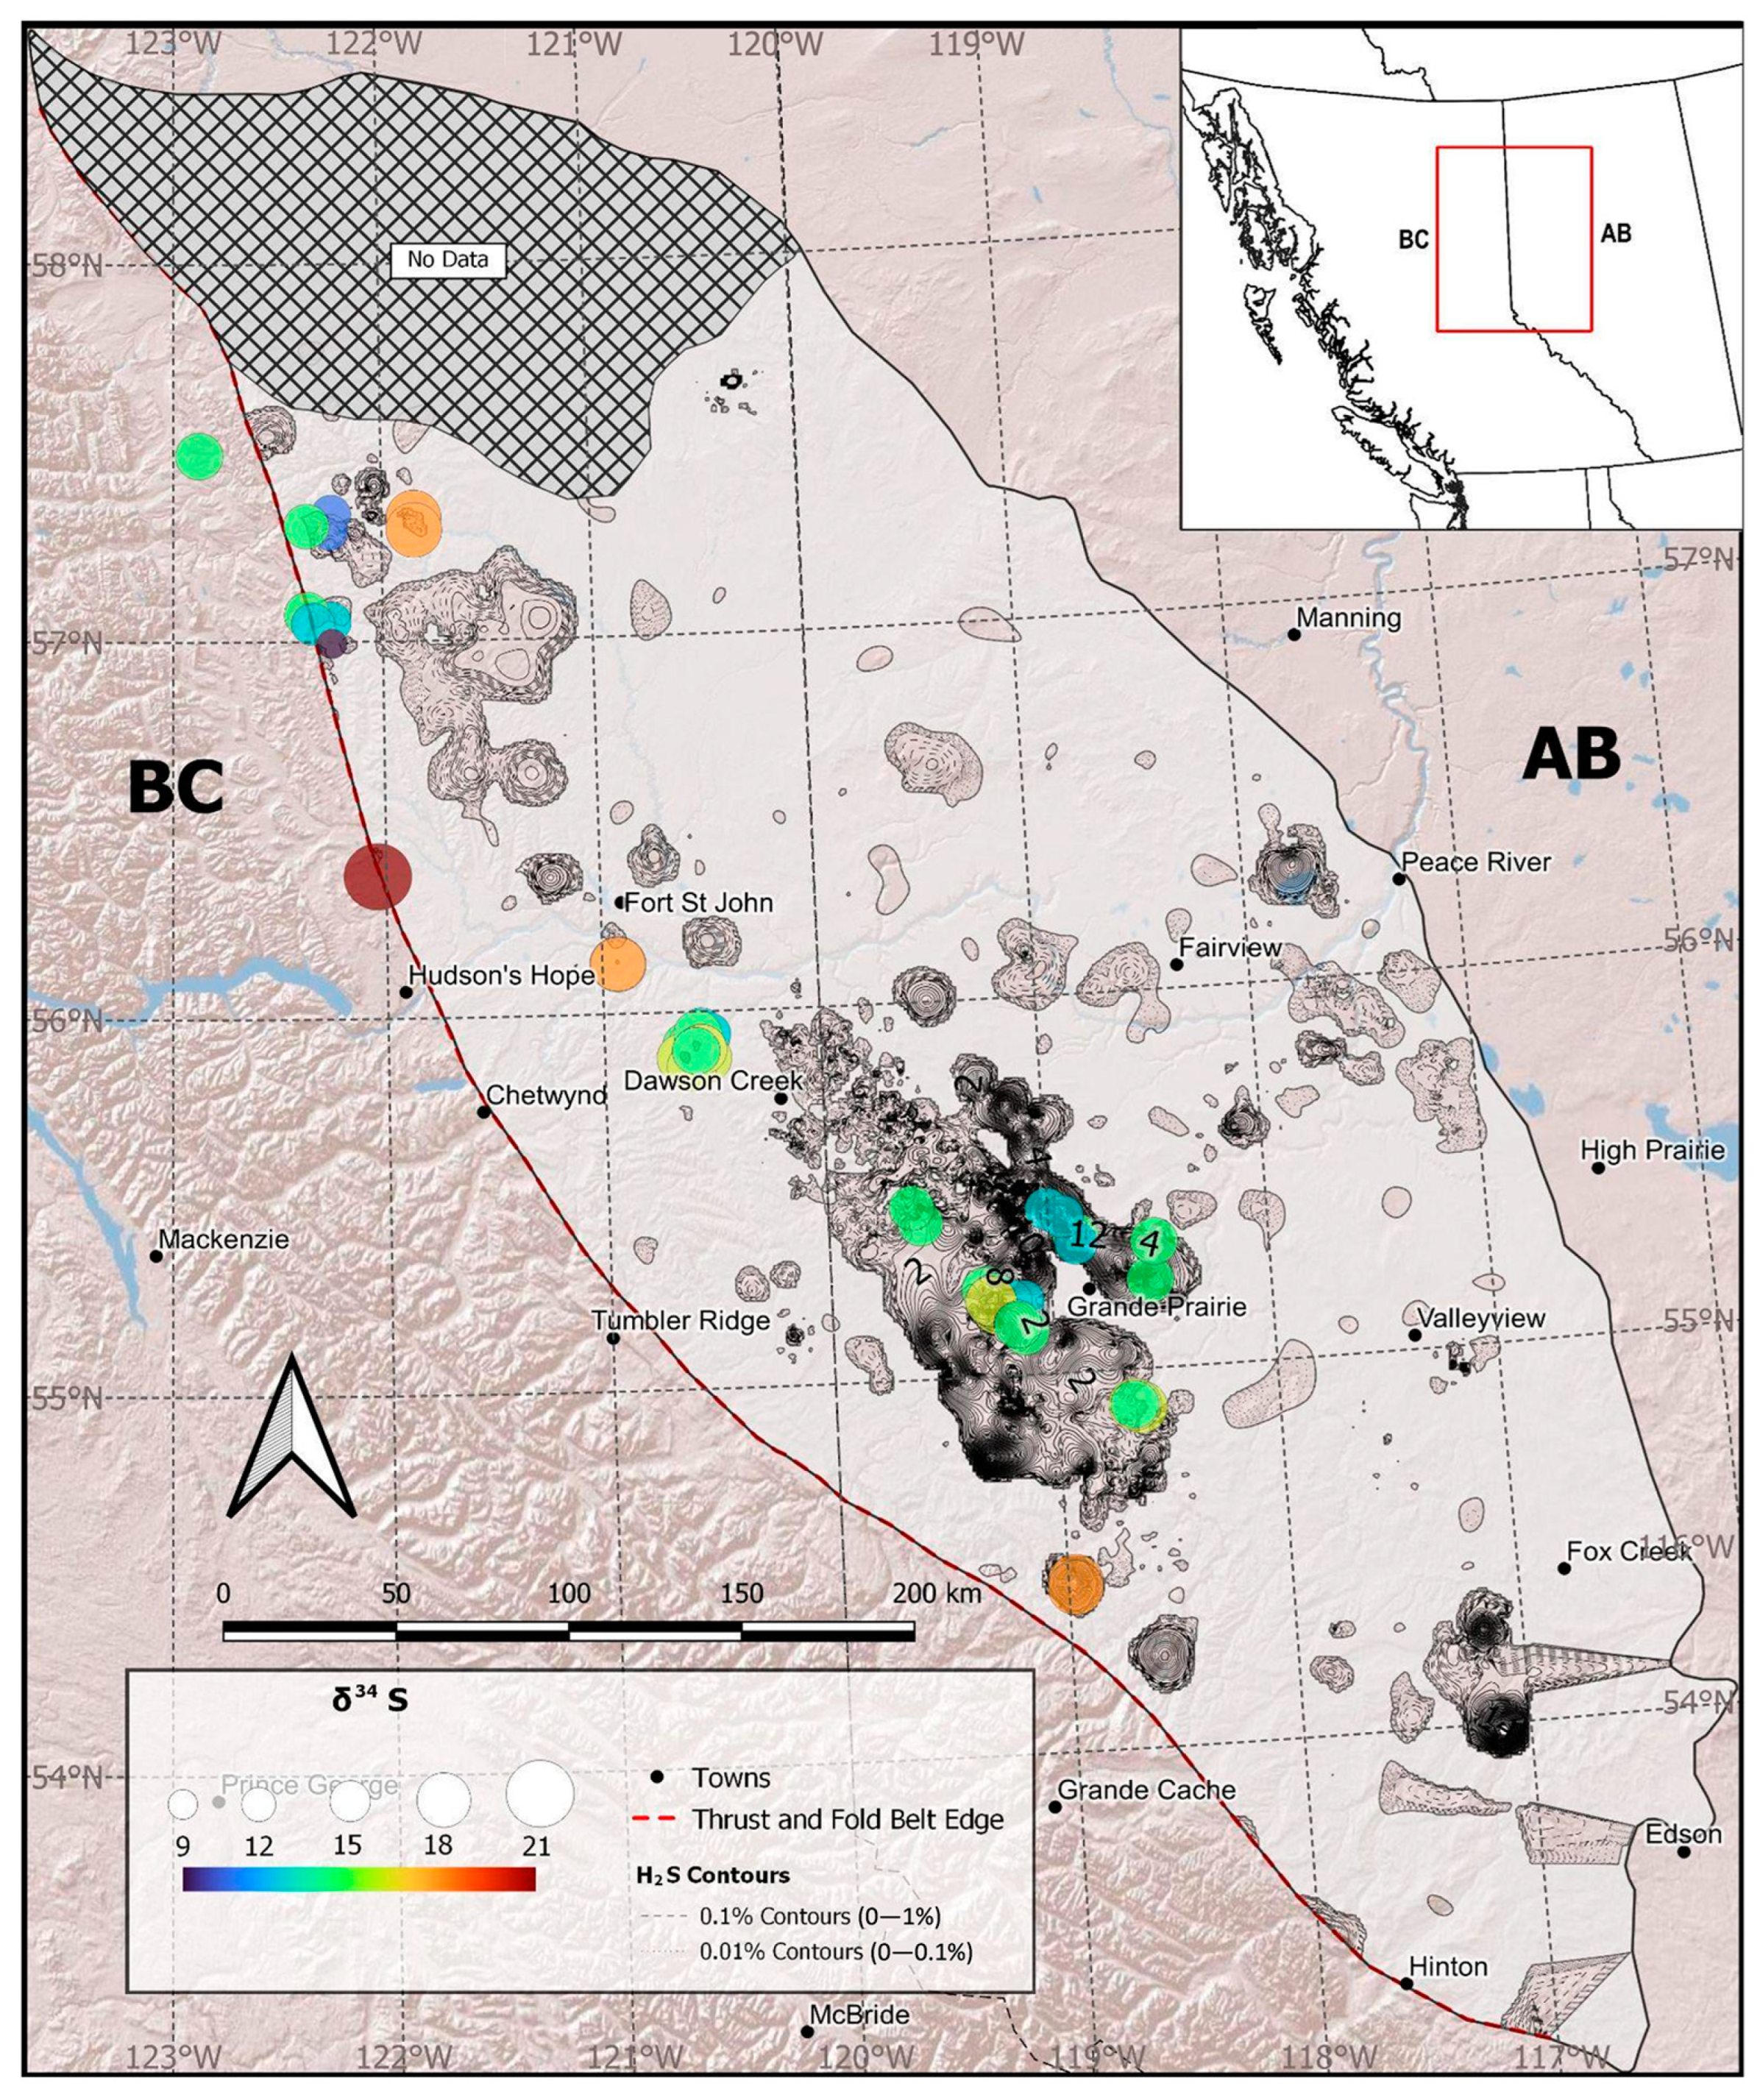
  67. Chalmers, G.R.L.; Bustin, R.M.; Bustin, A.A. Stratigraphic and lateral distribution of hydrogen sulphide within the Triassic Montney Formation, northern regional play area, northeastern British Columbia and northwestern Alberta. In Geoscience BC Summary of Activities 2018: Energy and Water; Report 2019-2; Geoscience BC: Vancouver, BC, Canada, 2019; pp. 43–46. Available online: https://www.geosciencebc.com/summary-of-activities-2018-energy-and-water/ (accessed on 15 May 2024).
Figure 5. Cross-plot of sulphur and oxygen isotopes from anhydrite, pyrite, kerogen, and H2S gas from both Triassic and Devonian sources. Point data are the oxygen and sulphur isotopic data for anhydrite minerals for both Triassic and Devonian samples. The Triassic rocks include the Charlie Lake, Halfway, Doig, Montney, and Belloy formations. Triassic-sourced sulphur from anhydrite minerals all plot within the green box and are 34S-depleted compared to the Devonian-sourced sulphur (34S-enriched) from anhydrite (blue box). Samples from the Devonian Muskeg Formation in this study (purple triangles) have the isotopically lightest (34S-depleted) Devonian sulphur/oxygen anhydrite, and with the two samples from the Doig (grey diamonds) and Halfway (cross symbol) formations, they have created a transitional zone between the two data sets (i.e., 18–20‰). Yellow points are from published data for the Devonian sulphate minerals (Table A1). Concentrated pyrite samples (n = 3) have been separated from Montney Formation and are plotted as a grey dashed box and grey shaded. Concentrated kerogen samples (n = 5) are from the Montney Formation and are represented by the purple dashed box as the oxygen data are not necessarily associated with the organic sulphur and therefore not included in the plot. The isotopic sulphur data from the H2S gas are also represented by dashed boxes (red = Montney H2S gas; blue = Devonian H2S gas) as the H2S gas has no oxygen data associated with the sulphur (Table 2). Montney H2S gas is isotopically lighter (34S-depleted) compared to Devonian H2S gas and each data set divided by geological age reflects a similar isotopic range as the anhydrite mineral from their respective geological period. These results indicate the sulphur of the Montney H2S is most likely sourced from Triassic anhydrite or from a mixture of Triassic and Devonian anhydrite sources if 34S-enriched (i.e., δ34S is 14–21‰ V-CDT). Isotopic data for sulphate data are a combination of this study and from [15,22,23]. Isotopic data for organic matter and pyrite are from this study (see Table A1). Isotopic data for H2S gas are derived from this study and [11,14].
Geosciences 14 00224 g005
Figure 6. Distribution of sulphur isotopic ratios (‰) in the Montney Formation on the base map of H2S concentration (%) distribution. Due to the H2S concentrations spanning orders of magnitude, the long-dashed contour intervals are at 1% with short-dashed contour intervals at 0.1%. The sulphur isotopic ratio for H2S gas in the Montney Formation shows no trends across the study area and has less 34S -enriched ratios (9 to 21‰) compared to the range of sulphur ratios from Devonian reservoirs (i.e., 14.0 and 26.0‰). There are also more wells across a larger geographic area that are sour in Alberta than in British Columbia.
Geosciences 14 00224 g006
Figure 7. The sulphur isotopic ratio range for the H2S gas subdivided into the upper, middle, and lower Montney Formation from this study (n = 60). The box-and-whisker plot indicates that there is no significant difference between the isotopic signatures of these informal units. See Table 2 for details on samples.
Geosciences 14 00224 g007
Figure 8. Scanning electron microscope (SEM) images and energy dispersive X-ray spectroscopic (EDX) mapping showing the textural relationship between dolomite (Do) and anhydrite (An) within the upper Montney Formation. Well Authorization #30876 EDX maps show the concentration of magnesium (Mg; (C,G)) and calcium (Ca; (B)) in the dolomite minerals (Do; (A)) and the concentration of sulphur (S; (D,F)) and calcium (Ca; (H)) in the anhydrite minerals. The textural relationship shows the replacement of dolomite by anhydrite as either a fracture fill or diagenetic cement, infilling around dolomite grains (black arrow; (E)).
Geosciences 14 00224 g008
Figure 9. Mineralogical textures in the overlying Charlie Lake Formation. The Charlie Lake Formation shows both detrital anhydrite grains (An; (A)) and evaporitic textures (An; (E)). The detrital anhydrite grains are also associated with quartz grains (Qz; (A)). The anhydrite is determined by the high calcium (Ca; B,F) and high sulphur (D,H) contents. The evaporitic texture seen in (E) is similar to the nodular texture seen in evaporites (i.e., [62]); dolomite anhydrite associations are interpreted as evaporites in the Charlie Lake Formation [32]. Very large dolomite grains also form in the evaporitic environment (E). The dolomite contains high magnesium (Mg; C,G) and calcium (Ca; B,F) contents. Well Authorization #30876.
Geosciences 14 00224 g009
Figure 10. The Doig Formation that overlays the Montney Formation shows phosphatic nodules that are also rich in anhydrite (An), as illustrated by the high sulphur concentrations. The nodules are concentrated in calcium (Ca; (C,G)), sulphur (S; B,F), and phosphate (P; D,H)and are found associated with dolomite grains (Do in (A,E)). Anhydrite-rich phosphatic nodules have also been observed in the Doig Formation by [33]. This detrital texture for the anhydrite shows that the sulphate would need to be dissolved from the nodules and then migrated and deposited in the Montney Formation as a cement in fractures.
Geosciences 14 00224 g010
Figure 11. H2S formation models for sour Montney Formation wells in BC. A total of 218 sulphur sub-samples from mineral and organic matter samples and 120 sulphur subsamples from H2S gas were isotopically analysed. Diamond symbols represent the sulphur in the mineral form, prior to being converted to sulphate ions and used in the formation of H2S gas when in contact with hydrocarbons. Circle symbols represent the sulphur once converted to H2S gas. Model 1 represents an in situ conversion which would be the conversion of syn-depositional anhydrite that is derived from the Montney Formation. This model is plausible as the Montney Formation does contain small amounts of anhydrite (<5%). However, the H2S distribution would be more consistent and the localised changes between sour and sweet lateral wells on the same pad (i.e., Figure 2) would not likely be observed. Model 2 is structurally controlled, with anhydrite or sulphate ions derived from sulphate minerals with the Triassic Charlie Lake Formation migrating through local fracture/fault systems into the Montney Formation (prior to hydrocarbon charging and overpressuring). H2S gas is generated once hydrocarbons are generated in the Montney Formation and the hydrocarbons react with the sulphate ions via the TSR pathway. A similar model has been shown for the migration of sulphate ions from the Charlie Lake and into the Halfway Formation [38]. Model 3 is a mixing of sulphur ions from Triassic and Devonian sources and structural controls would need to include a deeper connection via structural features with the Devonian source. This results in a more 34S-enriched isotopic signature in the H2S compared to Model 2. Ref. [14] shows evidence that dissolved sulphate ions have migrated from the Devonian into the Montney Formation within the Alberta Montney play area.
Geosciences 14 00224 g011
Table 1. Mineralogy from X-ray diffraction and Rietveld analyses for four of the wells, Well Authorisation numbers 30,876, 3944, 8183, and 29,453 (see Figure 1 for locations). Mont. is an abbreviation for Montney Formation, Mon HZ is Montney Formation horizontal well sampled, HFY is Halfway Formation, C.L. is Charlie Lake Formation, S.P. is Slave Point Formation. * Illite/Muscovite 1M; Fluorapatite.
Sample IDWell Licence NumberFormationDepth (m)AnhydriteGypsumPyriteQuartzDolomiteCalciteIllite/Muscovite * 1MChloriteApatite (Fluor-) AlbiteMicroclineOrthoclase
PBN-130,876 C.L.139242.60.309.136.51.72.5001.506
PBN-230,876 C.L.143019.90.1011.550.83.83001.309.6
PBN-330,876 C.L.146721.70014.639.73.75.62.405.86.60
PBN-430,876 C.L.154218.60013.139.69.66.62.202.87.50
PBN-530,876 HFY15970.40.10.865.518.63.71.6001.280
PBN-630,876 Doig16420.401.231.520.329.81.4071.670
PBN-730,876 Doig17220.701.521.522.4189.20.25.93.7170
PBN-830,876 Doig17570.302.419.719.233.23.607.31.412.90
PBN-930,876 Mont.17700.901.733.917.314.93.202.53.74.717.2
PBN-1030,876 Mont.1790102.226.720.16.74.500.325.431
PBN-1130,876 Mont.18150.901.827.818.83.25.91.102.35.932.2
PBN-1230,876 Mont.18570.602.430.918.36.46.41.802.15.326
PBN-1330,876 Mont.19720.602.625.815.86.86.8301.8729.9
PBN-1430,876 Belloy20730.61.70.59.482.43.300.500.51.10
CL 55703944C.L.169817.61.6011.439.90.319.42.307.700
CL 56203944C.L.1713221.808.2450.616.31.204.900
CL 56503944C.L.172216.91.8015.235.54.618.91.705.400
CL 60103944C.L.18325.91.3018.941.87.518.31.704.700
HF 62803944HFY19140.70044.618.822.510.1003.400
HF 64003944HFY19163.30044.729.42.711.70.207.900
Doig 65703944Doig19513.72.6040.121021.601.39.700
UM 68703944Mont.2094101.730.515.77.723.91.80.81700
UM 71803944Mont.21891.901.33324.47.716.701.31400
MM76703944Mont.23381.501.236.618.25.616.37.41.31200
LM 79303944Mont.24170.402.730.310.73.738.15.608.700
Bell 18753944Belloy2451001.548.69.832.532.50.103.300
DEB 81803944Debolt24930004.4095.40000.200
DEB 81103944Debolt24720002.7097.20000.100
CL 14258183C.L.14255.60019.137.1029.36.402.600
Cl 14808183C.L.14801.20045.316.26.618.40.701200
HY 15308183HFY15300.30057.1171.314.50.80900
Doig 15858183Doig15850.701.324.822.415.323.2048.300
UM 16758183Mont.16750.702.124.318.922.122.4106.200
MM 17808183Mont.17501.3022916.214.6234.207.600
LM 18278183Mont.18270.202.733.114.34.233.38.403.800
BEL 18758183Belloy18750.402.827.59.12.8365.421400
DEB 19158183Debolt19150.4002.23.777.815.60.100.200
DEB 21308183Debolt21300.1005.14.47218.2000.200
DEB 22708183Debolt227000012.65.556.523.80.500.500
DEB 26908183Debolt26900.2006.64.673.712.22.300.500
DEB 28558183Debolt28550.20017.87.236.425.611.61.2000
DEB 29358183Debolt29350.20023.8512.43621.501.100
DEB 81838183Debolt30550.301.614.38.90.340.929.404.200
SP 33028183S.P.3302001.410.454.417.815.10.500.400
SP 33428183S.P.3342000.616.241.614.326.10.600.700
SP 33268183S.P.33260.30016.950.934.826.601500
SP 34008183S.P.34000.100.5310.469.315.90.600.300
CL 159029,453 C.L.15906.40010.734.322.721.80.903.200
CL 180529,453 C.L.18059.80012.939.15.628.61.10300
HF 188029,453 HFY1880100.756.310.96.124.10.200.800
Doig 188829,453 Doig18883.100.634.812.111.721.70.86.48.900
Doig 194029,453 Doig1940301.216.614.325.624.31.54.5900
UM 200429,453 Mont.20041.301.232.122.58.9280.205.800
MM 214029,453 Mont.21402.901.528.922.25.629.20.408.300
LM 225029,453 Mont.22501.601.229.115.96.5318.206.500
LM 233029,453 Mon Hz23301.100.823.720.95.733.77.406.800
Table 2. Sulphur Isotopic Ratio for Hydrogen Sulphide Gas in the Montney Formation of the WCSB.
UWIDδ34S (VCDT)LatitudeLongitudeSample Depth (m; TVD)Formation or Zone
100/01-29-082-19W6/0217.456.13250−120.9296901794.5Montney (Upper)
100/01-29-082-19W6/0216.956.13250−120.9296901794.5Montney (Upper)
200/a-064-h 094-b-08/0012.456.38534−122.0421202127.6Montney (Upper)
200/a-064-h 094-b-08/0012.556.38534−122.0421202127.6Montney (Upper)
203/d-010-G 094-G-08/0012.257.33831−122.2425101707.8Montney (Upper)
202/c-050-B 094-G-08/0011.457.29098−122.2501801777.5Montney (Upper)
202/c-070-B 094-G-01/0012.657.05420−122.2481201827.6Montney (Upper)
200/c-089-C 094-G-01/0014.157.07321−122.3607501942.7Montney (Upper)
200/c-057-C 094-G-01/0013.357.04778−122.3339101919.1Montney (Upper)
202/b-100-K 094-G-07/0014.757.49365−122.8752101858.0Montney (Upper)
202/c-069-C 094-G-08/0014.057.30685−122.3617101794.8Montney (Upper)
100/14-05-080-17W6/0014.755.91107−120.6236902183.0Montney (Upper)
105/16-04-080-17W6/0015.855.91047−120.5899202167.5Montney (Upper)
102/04-15-072-09W6/0014.455.23079−119.3052302598.6Montney (Upper)
100/16-34-071-08W6/0012.355.19846−119.1308202442.8Montney (Upper)
100/16-34-071-08W6/0012.655.19846−119.1308202442.8Montney (Upper)
102/16-25-071-09W6/0015.855.18300−119.2369102507.7Montney (Upper)
100/02-15-072-09W6/0014.855.23162−119.2947402644.5Montney (Upper)
100/12-25-071-09W6/0015.755.17811−119.2521302570.8Montney (Upper)
102/04-15-072-09W6/0014.455.23079−119.3052302622.1Montney (Upper)
100/16-34-071-08W6/0012.355.19846−119.1308202442.8Montney (Upper)
102/16-34-071-08W6/0012.655.19846−119.1308202442.8Montney (Upper)
102/16-25-071-09W6/0015.855.18300−119.2369102507.7Montney (Upper)
100/08-03-071-08W6/0014.855.11631−119.1314202473.6Montney (Upper)
100/05-24-068-05W6/0214.954.89891−118.6301402353.9Montney (Upper)
100/05-24-068-05W6/0215.254.89891−118.6301402353.9Montney (Upper)
100/05-24-068-05W6/0216.354.89891−118.6301402353.9Montney (Upper)
202/a-091-D 094-H-05/0016.757.32852−121.8460401469.4Montney (Upper)
202/a-091-D 094-H-05/0016.957.32852−121.8460401469.4Montney (Upper)
200/a-054-H 094-B-08/00 20.956.37771−122.0415602336.0Montney (Middle)
200/d-100-J 094-B-16/009.356.99588−122.2444102042.5Montney (Middle)
100/08-03-071-08W6/0014.855.11631−119.1314202473.6Montney (Middle)
200/b-056-C 094-H-05/0016.157.29443−121.8450101555.4Montney (Middle)
200/b-056-C 094-H-05/0017.257.29443−121.8450101555.4Montney (Middle)
100/06-15-063-07W6/0217.154.44887−118.9715603807.1Montney (Lower)
100/13-23-080-17W6/0213.255.95472−120.5531502261.1Montney (Lower)
100/16-11-080-17W6/0014.755.92461−120.5348202324.9Montney (Lower)
100/10-30-079-17W6/0015.455.87857−120.6470202523.5Montney (Lower)
104/16-09-080-17W6/0011.955.92495−120.5898302357.4Montney (Lower)
102/09-26-079-17W6/0015.855.87733−120.5350802417.0Montney (Lower)
106/09-10-080-17W6/0011.955.92219−120.5340802314.6Montney (Lower)
100/07-30-079-17W6/0012.955.87510−120.6008202528.1Montney (Lower)
Disclaimer/Publisher’s Note: The statements, opinions and data contained in all publications are solely those of the individual author(s) and contributor(s) and not of MDPI and/or the editor(s). MDPI and/or the editor(s) disclaim responsibility for any injury to people or property resulting from any ideas, methods, instructions or products referred to in the content.

